Posts

Daily Shelter Census — New York City (DHS Daily Report)

November 17, 2025
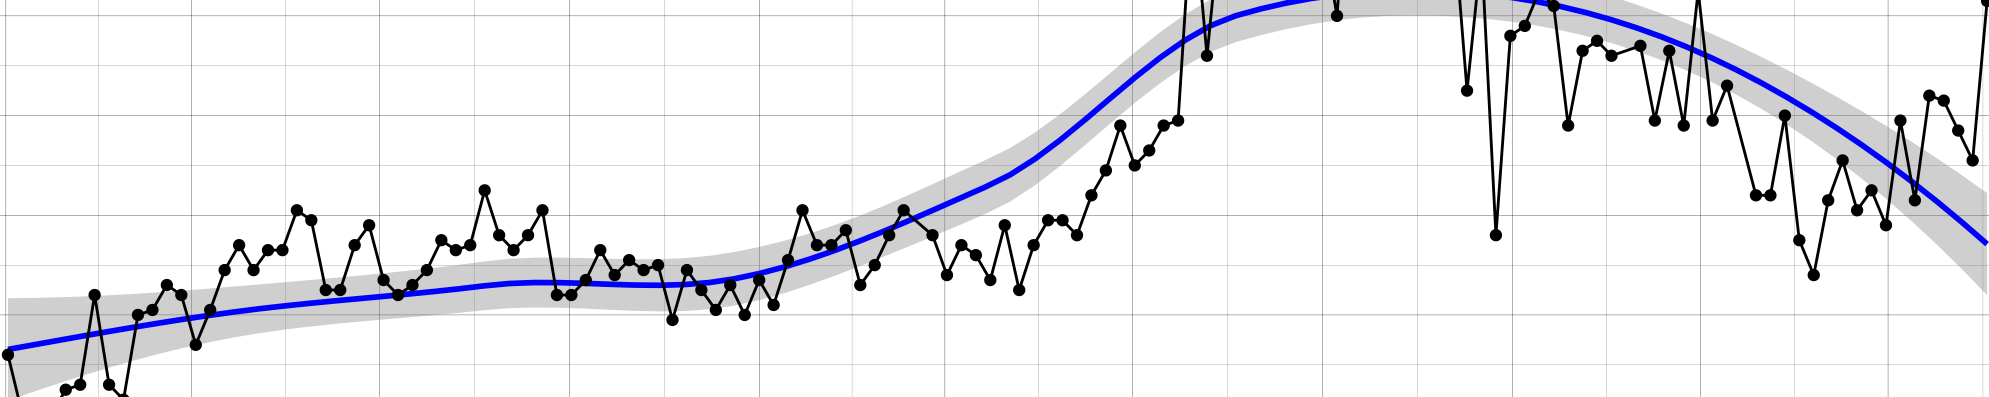
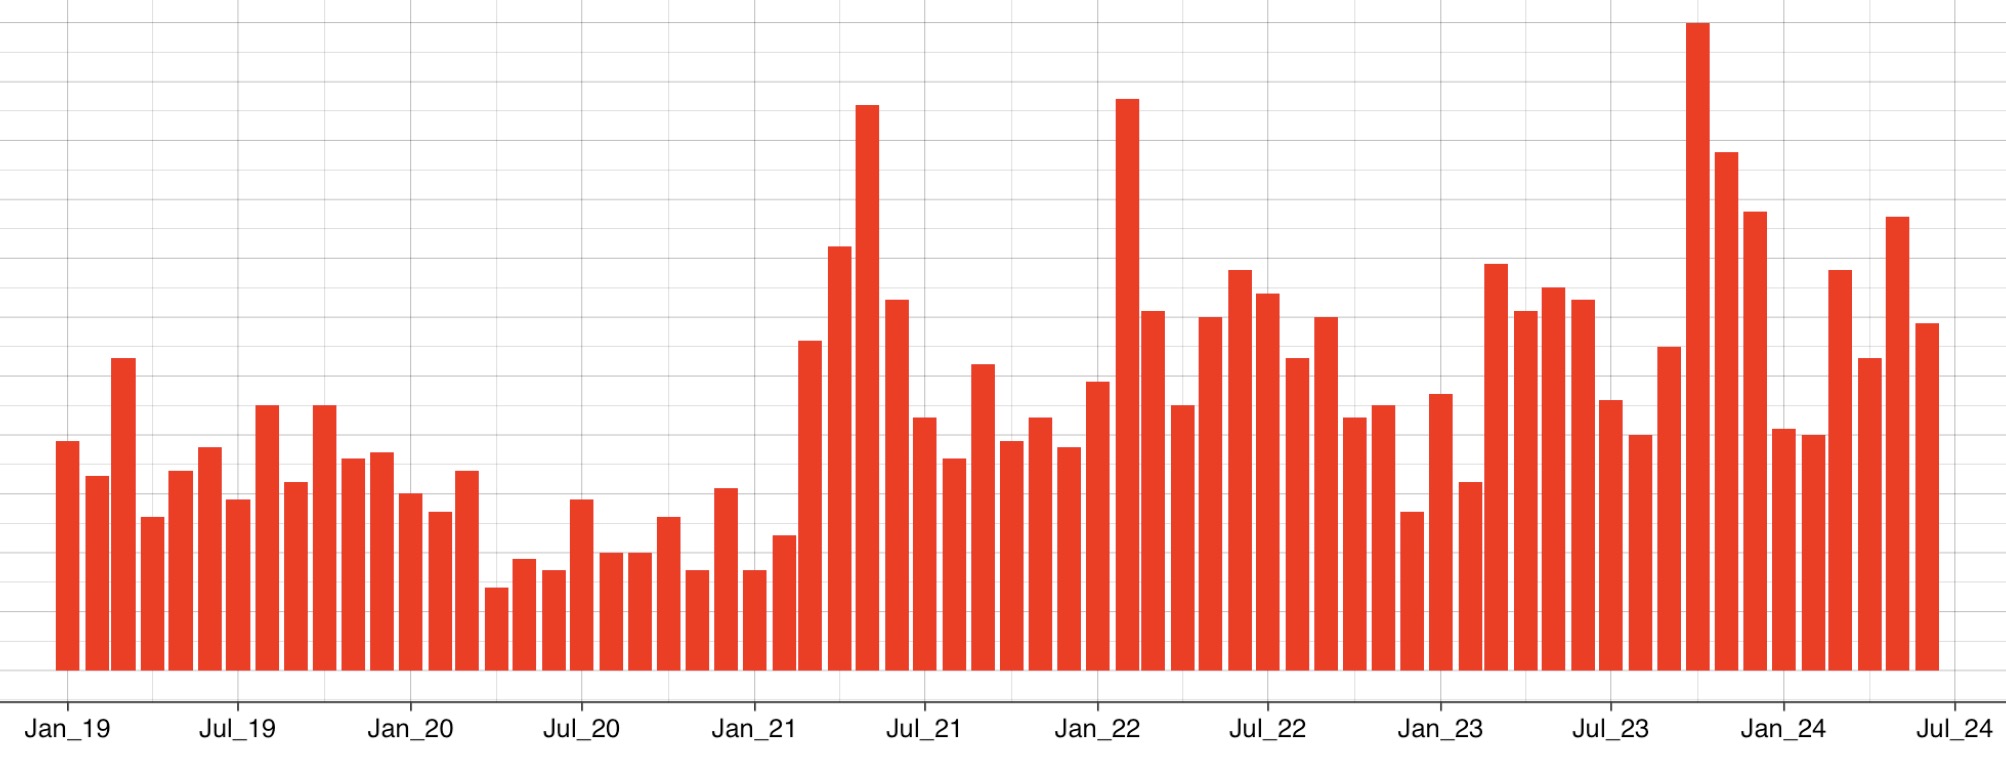
homelessness New York City shelter census time series public health DHS

A concise analysis of daily counts of people and families in New York City's Department of Homeless Services (DHS) shelter system. This page summarizes trends, weekly patterns, and recent changes using daily shelter census data and highlights implications for public health practice.

Read more →


Spatial Distribution of Hospital Beds in New York State

November 17, 2025
New York State Hospitals Health Care Delivery GIS Preparedness

Explore an interactive map showcasing the spatial distribution of certified hospital beds across New York State. This map visualizes the number of beds available for various service lines, such as Medical/Surgical, Intensive Care, Neonatal Care, and more. Users can zoom, pan, and hover for detailed …

Read more →


Basketball Season Tracking Analysis

November 17, 2025
Basketball Sports Data Visualization

Discover my in-depth NBA season analysis with dynamic visualizations and data tables. This page features animations of cumulative wins, trend graphs, scatter plots of points scored vs. points allowed, and bar graphs of point differentials. Regularly updated during basketball season, it offers a thor…

Read more →


New York City 311 Service Request Data Dashboard

November 17, 2025
New York City Social Determinants Housing GIS Dashboard

Explore the New York City 311 Service Request Data Dashboard, an interactive GIS tool that visualizes social determinants of health using 311 service requests across NYC. Developed by Isaac H. Michaels, DrPH, the dashboard provides spatial analysis of complaint types, dynamic frequency updates, and …

Read more →


New York Flu Watch: Real-Time Tracking and Analysis of Influenza Data

November 17, 2025
New York State New York City Influenza Communicable Diseases Epidemiology Data Visualization

Explore the New York Flu Watch, a comprehensive real-time tracker for influenza data across New York State and New York City. Updated routinely, this tool offers detailed insights into laboratory-confirmed cases, emergency department visits, hospitalizations, and flu vaccination coverage. Developed …

Read more →


New York State Food Establishment Inspection Maps

November 15, 2025
New York State Food Safety Environmental Health Public Health GIS

Explore detailed data on food service inspections across New York State, including New York City. This page features interactive maps and tables displaying inspection results, violations, and compliance statuses for food establishments. Users can filter data by location and inspection outcome to ass…

Read more →


New York State Health Facility Maps

November 8, 2025
New York State Health Care Delivery Hospitals GIS

Explore an interactive map of healthcare facilities across New York State. Updated routinely, this tool provides detailed information on various facility types including hospitals, hospices, and diagnostic centers. Users can zoom, pan, and select specific facility types to visualize their locations,…

Read more →


Hate Crimes in New York State

November 7, 2025
New York State Hate Crimes Violence Data Visualization

Explore comprehensive visualizations and trends on hate crimes across New York State and New York City. This page features maps, heat maps, and trend graphs detailing the distribution of hate crimes by bias motive, crime type, and county. Analyze monthly and yearly patterns, discover regional variat…

Read more →


New York State Budget Analysis

November 4, 2025
New York State State Budget Fiscal Analysis Public Spending

Explore a detailed analysis of New York State’s budget, highlighting revenues, disbursements, and key financial trends. This comprehensive overview, updated annually, delves into the fiscal dynamics of the Empire State, including breakdowns by agency, function, and fund. Access the data to gain insi…

Read more →


Baseball Season Tracking Analysis

November 2, 2025
Baseball Sports Data Visualization

Explore my detailed MLB season insights through interactive visualizations and data tables. I’ve included animations of cumulative wins, trend graphs, scatter plots of runs scored vs. runs allowed, and bar graphs of run differentials. Updated daily during baseball season, this page provides a compre…

Read more →


Birth Counts and Fertility Rates in New York State

October 28, 2025
New York State Births Fertility Rates Maternal and Child Health Demographic Analysis

Explore trends in births and fertility rates in New York State with data from 1995 to 2023. This page provides detailed visualizations and analysis, including annual birth counts and fertility rates, using data from the CDC WONDER database. Discover key insights into demographic shifts and understan…

Read more →


Shooting Incidents in New York City

October 27, 2025
New York City Gun Violence Epidemiology GIS

Explore comprehensive data on shooting incidents in New York City from 2006 to the present. This updated analysis, including citywide maps, trends, and demographic insights, reveals patterns of gun violence across boroughs and neighborhoods. Discover how fluctuations in incident rates, disparities i…

Read more →


Notifiable Disease Incidence in New York State

October 27, 2025
New York State Communicable Diseases Epidemiology Data Visualization

Explore comprehensive data on communicable disease incidence in New York State, featuring weekly updates and detailed analyses. This page presents visualizations including heat maps, bar graphs, and longitudinal trend graphs, derived from CDC data. Discover insights into disease patterns and trends,…

Read more →


All-Cause Mortality in New York State

October 27, 2025
New York State New York City Mortality Epidemiology

Explore comprehensive data on all-cause mortality in New York State, covering trends from 1999 to the present. This detailed analysis includes insights into mortality rates across different age groups and jurisdictions, using both annual and weekly data from CDC WONDER and data.cdc.gov. Understand k…

Read more →


EMS Calls in New York City: Trends and Patterns

October 23, 2025
New York City EMS Health Care Delivery Epidemiology

Explore trends and patterns in EMS calls across New York City with data-driven insights by Isaac H. Michaels, DrPH. This comprehensive analysis, based on FDNY data from 2020 to the present, examines daily call volumes, response times, and the most common emergency types. Discover how borough-specifi…

Read more →


Birth Defect Trends in New York State

October 17, 2025
New York State Birth Defects Maternal and Child Health Epidemiology

Explore detailed analyses of birth defect trends in New York State on this page. Featuring data from the New York State Birth Defects Registry, it includes cross-sectional and trend graphs that provide insights into birth defect prevalence by disease, year, and sex. The page offers a user-friendly i…

Read more →


Risk-Adjusted Potentially Preventable Readmission Rates in New York Hospitals

October 10, 2025
potentially preventable readmissions hospitals New York State risk-adjusted rates time trends

An analysis of risk-adjusted potentially preventable readmission (PPR) rates among hospitals in New York State from 2009 through the most recent year available. This page summarizes statewide trends, hospital- and county-level variation, and key statistics to support health system planning and quali…

Read more →


Volume of Reported Patient Discharges by Health Care Facilities in New York State

September 20, 2025
New York State Hospitals Health Care Delivery

Welcome Data Overview How to Use These Data Why Are These Data Important? What Do These Data Show? What Do These Data Not Show? Implications for Public Health Practice Statewide Summary Facility Summaries Technical Notes Published: May 1, 2020 Updated: September 20, 2025 at 11:22AM Welcome Welcom…

Read more →


New Policy Brief Explores Democratization of Health Data in New York

March 11, 2025
New York State Health Data Transparency Policy Analysis Data Visualization

Announcing the release of a new white paper exploring the democratization of health data analysis in New York. Co-authored by Adrienne Anderson, Sally Dreslin, Paul Francis, and Isaac Michaels, the paper examines approaches to improving access to and visualization of health data to support public he…

Read more →


Study Examines Implementation of Obstetric Sepsis Bundle Across Academic Hospital System

November 20, 2024
Hospitals Sepsis Maternal and Child Health Quality Improvement

A new article published in Seminars in Perinatology describes the implementation of an obstetric sepsis bundle across a large academic hospital system and its positive impact on maternal health outcomes. The study, authored by Lejdisa Stanaj, Dena Goffman, Brianne Genow, Lynne Meccariello, Julie Ewi…

Read more →


Using Three-Dimensional Mapping to Visualize Five Years of Shooting Incidents in New York City

August 20, 2024
New York City Gun Violence GIS Epidemiology 3D Mapping

The map depicts the spatial distribution of shooting incidents in New York City from 2019 to 2023. A three-dimensional elevation model is used to represent incident density, with areas of higher incident counts extruded vertically from the map surface. The color scale is a continuous gradient from d…

Read more →


New York Racing Horse Death Report

November 17, 2025
New York State Animal Welfare Equine Fatality Analysis

This report utilizes data from the New York State Gaming Commission to analyze equine fatalities at race tracks, uncovering trends and patterns to enhance horse safety and welfare. Despite limitations like potential underreporting and data quality issues, the report offers critical insights into the…

Read more →


New York COVID-19 Data Tracking Report

November 7, 2025
New York State COVID-19 Communicable Diseases Epidemiology GIS

Explore the comprehensive COVID-19 Data Tracking Report for New York State, offering up-to-date insights into confirmed cases, diagnostic tests, hospitalizations, deaths, and vaccination trends. This detailed resource provides valuable data by county, demographic breakdowns, and public health implic…

Read more →


Influenza Vaccination Among New York Healthcare Workers

September 19, 2025
New York State Influenza Immunization Health Care Delivery Hospitals Patient Safety

Hospitals Nursing Homes Hospice Diagnostic and Treatment Centers Adult Day Health Care Programs Home Health Agencies Licensed Home Care Service Agencies Published: June 18, 2020 Updated: September 19, 2025 at 02:04AM Hospitals Graph Prepared by: Isaac H. Michaels, DrPH Data Source: Health Data …

Read more →


Medicaid Enrollment in New York State

September 19, 2025
New York State Medicaid Health Care Delivery

Trend Graphs Statewide Enrollment by Month Gender Age Group Race Regions Medicaid Managed Care / Fee For Service Dual Eligibility Aid Category Plan Type Heatmaps Age Group vs. Gender Race vs. Age Group Race vs. Gender Dual Eligibility vs. Gender Dual Eligibility vs. Race Dual Eligibility vs. Medi…

Read more →


New York Climate Change Report

May 2, 2025
New York State environment energy climate

Explore the latest insights from my New York Climate Change Report. This comprehensive analysis, drawing on open data from greenhouse gas emissions to electric generation and gasoline prices, provides a detailed overview of energy trends and climate patterns in New York State. Discover how data from…

Read more →


United States COVID-19 Data Tracking Report

November 17, 2025
United States COVID-19 Communicable Diseases Epidemiology GIS

Published: March 25, 2020 Updated: November 17, 2025 at 09:33PM Welcome Welcome to this web page, which presents analyses of data on COVID-19 in the United States. I believe that data are an essential component of any public health response. The data on this page are obtained from the data.cdc.gov o…

Read more →


Provisional Data on Opioid Overdoses in New York

October 19, 2025
New York State Opioids Overdose Epidemiology Data Visualization

Explore the provisional data on opioid overdoses in New York State. This page offers detailed visualizations and analyses of overdose deaths, hospitalizations, emergency department visits, and naloxone administrations. Learn about state and county-level trends, and access vital information on how to…

Read more →


New York Hospital Bed Capacity

September 19, 2025
New York State New York City Hospitals Preparedness Health Care Delivery

Introduction Hospital bed capacity Implications for public health practice Conclusion Adult Beds Statewide New York State, by County New York City, by Hospital Pediatric Beds Statewide New York State, by County New York City, by Hospital Published: November 24, 2022 Updated: September 19, 202…

Read more →


COVID-19 Predictions for New York State

September 19, 2025
New York State COVID-19 Predictive Modeling Machine Learning Epidemiology

Welcome Data Overview How to Use These Data Why are These Data Important? What do These Data Show? What do These Data Not Show? Implications for Public Health Practice Death Predictions Predictions Model Specifications Evaluation Predicted vs. Observed Variable Importance Plot Published: Febr…

Read more →


County Health Rankings Factor vs Outcome Ranks

September 19, 2025
United States Community Health Social Determinants Epidemiology Data Visualization

Explore a comprehensive analysis of county-level health factors versus health outcomes rankings from 2010 to 2023 This page provides detailed graphs and scatter plots for each U.S. state, visualizing trends and correlations between health factors and outcomes as reported by the County Health Ranking…

Read more →


Baseball Bivariate Analyses

September 19, 2025
Baseball Sabermetrics Sports Data Visualization

On-Base Plus Slugging Percentage Age vs. OPS Height vs. OPS Weight vs. OPS Salary vs. OPS Earned Run Average Age vs. ERA Height vs. ERA Weight vs. ERA Salary vs. ERA Team Winning Percentage, Homeruns, and ERA Winning Percentage vs. Homeruns Winning Percentage vs. ERA Homeruns vs. ERA Team Winn…

Read more →


Hospital Charges for Medicaid Patients vs. Commercially-Insured Patients, by Procedure (New York State, 2017)

September 19, 2025
New York State Medicaid Hospitals Cost Analysis Variation

Albany Allegany Bronx Broome Cattaraugus Cayuga Chautauqua Chemung Chenango Clinton Columbia Cortland Delaware Dutchess Erie Essex Franklin Fulton Genesee Herkimer Jefferson Kings Lewis Livingston Madison Monroe Montgomery Nassau New York Niagara Oneida Onondaga Ontario Orange Orleans Oswego Otsego …

Read more →


Universal Background Checks and Firearm Mortality in States

September 2, 2024
gun violence epidemiology data visualization policy

Published: August 8, 2019 Updated: September 02, 2024 at 03:43PM Graph Prepared By: Isaac H. Michaels, MPH Death Data Source: CDC WONDER State Policy Data Source: www.statefirearmlaws.org

Read more →


Hospital-Acquired Infections In New York State

February 18, 2024
health care New York State variation Hospitals patient safety

Statewide By Hospital CLABSI Surgical Ward CLABSI Neonatal ICU Level 2/3 SSI Colon CLABSI Neurosurgical ICU CLABSI Pediatric ICU CLABSI Step Down Unit CDI Hospital Onset SSI CABG chest site SSI Hip CLABSI Coronary ICU CLABSI Pediatric Ward SSI Hysterectomy CLABSI Medical Ward CDI Possibly-My-Hospit…

Read more →


United States Weekly Death by Select Causes (2014 to Present)

November 14, 2023
data visualization epidemiology United States Public Health

Published: September 17, 2022 Updated: November 14, 2023 at 06:57PM Note: This page is no longer being updated, because CDC (as of September 27, 2023) is no longer updating the Weekly Provisional Counts of Deaths by State and Select Causes, 2020-2023 dataset on data.cdc.gov. Overview Welcome to my …

Read more →


New York Weekly Death by Select Causes (2014 to Present)

November 14, 2023
data visualization epidemiology New York State Public Health

Published: February 1, 2020 Updated: November 14, 2023 at 06:54PM Note: This page is no longer being updated, because CDC (as of September 27, 2023) is no longer updating the Weekly Provisional Counts of Deaths by State and Select Causes, 2020-2023 dataset on data.cdc.gov. Overview Welcome to my da…

Read more →


Analysis of Immunization Levels Among Schools in New York State

September 1, 2023
epidemiology data visualization immunization New York State vaccine

Overview Complete Vaccination By Antigen Diphtheria Hepatitis B Measles Mumps Polio Rubella Varicella Technical Notes Dataset Description Data Methodology Limitations of Use Published: September 11, 2022 Updated: September 01, 2023 at 04:43PM Overview Welcome to my data analysis of immunizati…

Read more →


DrPH student Isaac Michaels discusses the ongoing challenges of the COVID-19 pandemic

April 24, 2023
COVID-19 Vaccinations Health Equity Public Health Practice Air Quality

Discover my thoughts on the ongoing challenges of the COVID-19 pandemic in a recent interview with the University at Albany. I discuss my advocacy for an air quality census in New York schools and reflect on how the pandemic has influenced my professional goals. I highlight the ongoing public health…

Read more →


Prioritizing Student Health: My Published Op-Ed on Indoor Air Quality in NY Schools

February 3, 2023
New York State Air Quality Schools Environmental Health Communicable Diseases

Read my op-ed, 'The Need for an Air Quality Census in New York State Schools,' published in the Bronx Times. This piece highlights the critical need for an air quality census in New York schools to improve indoor environments amid ongoing risks of airborne diseases like COVID-19. I advocate for cond…

Read more →


Taking Action for Cleaner Indoor Air: My Published Letter on Air Filtration in NYPL Branches

January 13, 2023
New York City Air Quality Built Environment Influenza Communicable Diseases

I am proud to announce that my letter addressing the important issue of indoor air quality in New York Public Library branches was published on 1/13/2023 in The Riverdale Press. In this letter, I highlight the dangers of poor indoor air quality, particularly during the ongoing COVID-19 pandemic, and…

Read more →


New York State's public health workforce suffering from long-term staffing shortages, study finds

October 20, 2022
New York State Public Health Workforce Infrastructure Public Health Practice

Uncover the persistent staffing shortages affecting New York State's public health workforce. A recent study published in the International Journal of Environmental Research and Public Health by Isaac Michaels and colleagues reveals a decline in full-time staff and rising vacancy rates across local …

Read more →


Research Team Uncovers Disparities in Internet Access and COVID-19 Vaccination in New York City

August 26, 2021
New York City COVID-19 Immunization GIS Social Determinants

Discover how disparities in internet access are linked to lower COVID-19 vaccination rates in New York City. A new study by Isaac Michaels and colleagues, published in Preventing Chronic Disease, reveals that communities with limited internet access, particularly in the Bronx and Brooklyn, face sign…

Read more →


New Publication Outlines Methods for Generating Subcounty Health Data

April 17, 2020
Epidemiology Small-Area Data Community Health Health Disparities

Explore a new publication in the Journal of Public Health Management and Practice that details innovative methods for generating subcounty health data. The article highlights the need for granular data to identify health disparities within counties, offering recommendations and lessons from a multis…

Read more →


New GIS Method for Visualizing Cancer Mortality Trends in the US Published in Preventing Chronic Disease

March 26, 2020
United States Cancer Mortality GIS Data Visualization

Explore a novel technique for visualizing 50 years of cancer mortality trends across the U.S. through synchronized map and graph animations. Published in the CDC journal Preventing Chronic Disease, this innovative GIS method helps health officials target prevention efforts more effectively. Discover…

Read more →


Health Care Charge Comparisons

December 29, 2019
health care variation cost analysis care delivery New York State

Graph Prepared By: Isaac H. Michaels, MPH Death Source: Health Data NY Data Visualization Inspired By: Sanger-Katz M. In the U.S., an Angioplasty Costs $32,000. Elsewhere? Maybe $6,400. New York Times. December 27, 2019. https://www.nytimes.com/2019/12/27/upshot/expensive-health-care-world-compari…

Read more →


Killer Bee Word Discovery App

September 17, 2019
Games Puzzles Words Spelling

Discover winning solutions to the NYTimes Spelling Bee with the Killer Bee Word Discovery App by Isaac H. Michaels, MPH. This app analyzes combinations of letters from the daily puzzle to generate valid English words, now enhanced with Webster's Unabridged Dictionary for even more word options.

Read more →


Data Visualization: Physical Inactivity and Heart Disease Mortality among Texas Counties

September 1, 2019
Texas Chronic Disease Physical Activity Heart Disease Data Visualization

Description: Data visualization by Isaac H. Michaels, MPH showing county-level data on physical inactivity and heart disease mortality in Texas. Distributions are presented geographically (maps), univariately (histograms), and bivariately (scatter plot). The county-level association between physical…

Read more →


New York City Leading Causes of Death

April 7, 2019
New York City Mortality Leading Causes of Death

Graph Prepared By: Isaac H. Michaels, MPH Data Source: CDC WONDER

Read more →


New interactive web application visualizes health determinants using open data on NYC 311 requests

February 18, 2019
New York City Social Determinants GIS Dashboard

A new interactive web application developed by Isaac H. Michaels, MPH, visualizes health determinants using NYC 311 service request data. Presented at the 2019 New York State Population Health Summit, this tool enables users to analyze and map social and environmental factors influencing public heal…

Read more →


Food Distress Linked to Smoking in Racially and Ethnically Diverse Adults

August 24, 2017
New York State Chronic Disease Food Environment Smoking Health Disparities

Explore the link between food distress and smoking among racially and ethnically diverse adults in Schenectady, NY. This study, published in the CDC journal Preventing Chronic Disease, reveals that limited access to healthy food is significantly associated with higher smoking rates, highlighting cri…

Read more →


Tobacco Availability and Advertising Decrease in Albany, NY Food Stores

May 12, 2016
Albany Tobacco Control Food Environment Environmental Health Chronic Disease

A study in the CDC journal Preventing Chronic Disease reveals a significant decline in tobacco availability and advertising in Albany, NY food stores over 12 years, though 74.5% still sold tobacco in 2015. Efforts by local tobacco control, pharmacy industry regulations, and increased retailer fees c…

Read more →


Study Examines the Impact of Food Shopping Venues and Neighborhood Food Environment on BMI in Urban Adults

April 16, 2016
Food Environment Chronic Disease Community Health BMI Health Disparities

This study explores how food shopping venues and neighborhood food environments influence BMI among urban Guyanese, Black, and White adults in the US. Findings suggest that supermarkets, ethnic markets, and food co-ops have varying impacts on BMI across different racial and ethnic groups, highlighti…

Read more →


New Study Finds Travel Distance Poses Barrier to Participation in Diabetes Intervention Programs for Guyanese Immigrants at Faith-Based Organizations

May 8, 2014
Schenectady Diabetes Chronic Disease GIS Social Determinants

A new study in the journal The Diabetes Educator reveals that travel distance is a significant barrier for Guyanese immigrants to participation in diabetes intervention programs at faith-based organizations in Schenectady, New York. The research highlights the importance of location in ensuring acce…

Read more →


Spatial Access to Diabetes Intervention for Guyanese Immigrants in Schenectady, New York

April 25, 2014
Schenectady Diabetes Chronic Disease Health Care Delivery GIS

Explore the spatial access of Guyanese immigrants in Schenectady, New York, to faith-based diabetes interventions. This award-winning poster, presented at the 23rd University at Albany School of Public Health Student Poster Day, examines whether travel distance affects participation in diabetes prog…

Read more →


Use Cases for Social Impact Bonds in Schenectady, New York

January 10, 2014
Schenectady Health Reform Social Impact Bonds Prevention Community Health

Explore the potential of Social Impact Bonds (SIBs) to improve public health in Schenectady, NY. This white paper outlines four innovative use cases for SIBs to reduce asthma, falls among seniors, type 2 diabetes, and smoking, while generating savings for the community. Discover how SIBs can align i…

Read more →