Published: December 30, 2023
Updated: May 15, 2026 at 11:24PM
Welcome
Welcome to my personal data science website, where I focus on epidemiology and public health. On this page, I present data analyses on birth defect prevalence in New York State. The data presented here are derived from the New York State Birth Defects Registry (BDR), offering a comprehensive look at the occurrence of major birth defects among children born from 1992 to the latest available year.
Data Overview
The dataset encompasses information from the entire state of New York, including New York City, and is diligently updated yearly. The Birth Defect Prevalence page incorporates a variety of visualizations to enhance the understanding of the data, including a cross-sectional bar graph illustrating prevalence by disease for the latest year, a cross-sectional dot graph showcasing prevalence by disease and sex for the same period, a set of trend graphs displaying prevalence by disease over the years, and another set of trend graphs exploring prevalence by disease, year, and sex.
How to Use These Data
Navigating through this Birth Defect Prevalence page is designed to be user-friendly. The cross-sectional graphs offer a snapshot of the latest data, while the trend graphs allow for longitudinal analysis of birth defect prevalence. You can interact with these graphs to explore specific diseases, time periods, and gender-specific trends.
Why are these data important?
Understanding birth defect prevalence is crucial for public health planning and intervention. These data can help identify patterns, assess risk factors, and guide resource allocation for the well-being of mothers and children. By delving into the intricacies of birth defect occurrences, this page aims to contribute to informed decision-making in public health.
What do these data show?
The prevalence graphs provide a visual representation of the distribution of selected major birth defects. Cross-sectional analyses highlight the latest trends, while trend graphs reveal how these trends have evolved over the years. This overview supports a nuanced understanding of the health landscape in New York State.
What do these data not show?
It’s important to note that these data do not delve into the causation of birth defects. While the trends are indicative of prevalence, further research is needed to establish causal relationships and identify specific risk factors. Additionally, the dataset does not include information on children born to non-residents.
Implications for Public Health Practice
The insights derived from these data can inform public health practices in several ways. Identifying areas with higher prevalence rates can guide targeted interventions and resource allocation. Moreover, recognizing gender-specific trends can aid in tailoring healthcare strategies to meet the diverse needs of the population.
This page aims to contribute to the ongoing dialogue surrounding public health in New York State. By regularly updating these analyses, I hope to provide a valuable resource for researchers, policymakers, and the public interested in understanding and improving maternal and child health. Your engagement with this data is essential in shaping a healthier future for our communities.
Executive Summary1
Date: May 15, 2026 Subject: Annual Briefing: New York State Birth Defects Registry Data for 2020
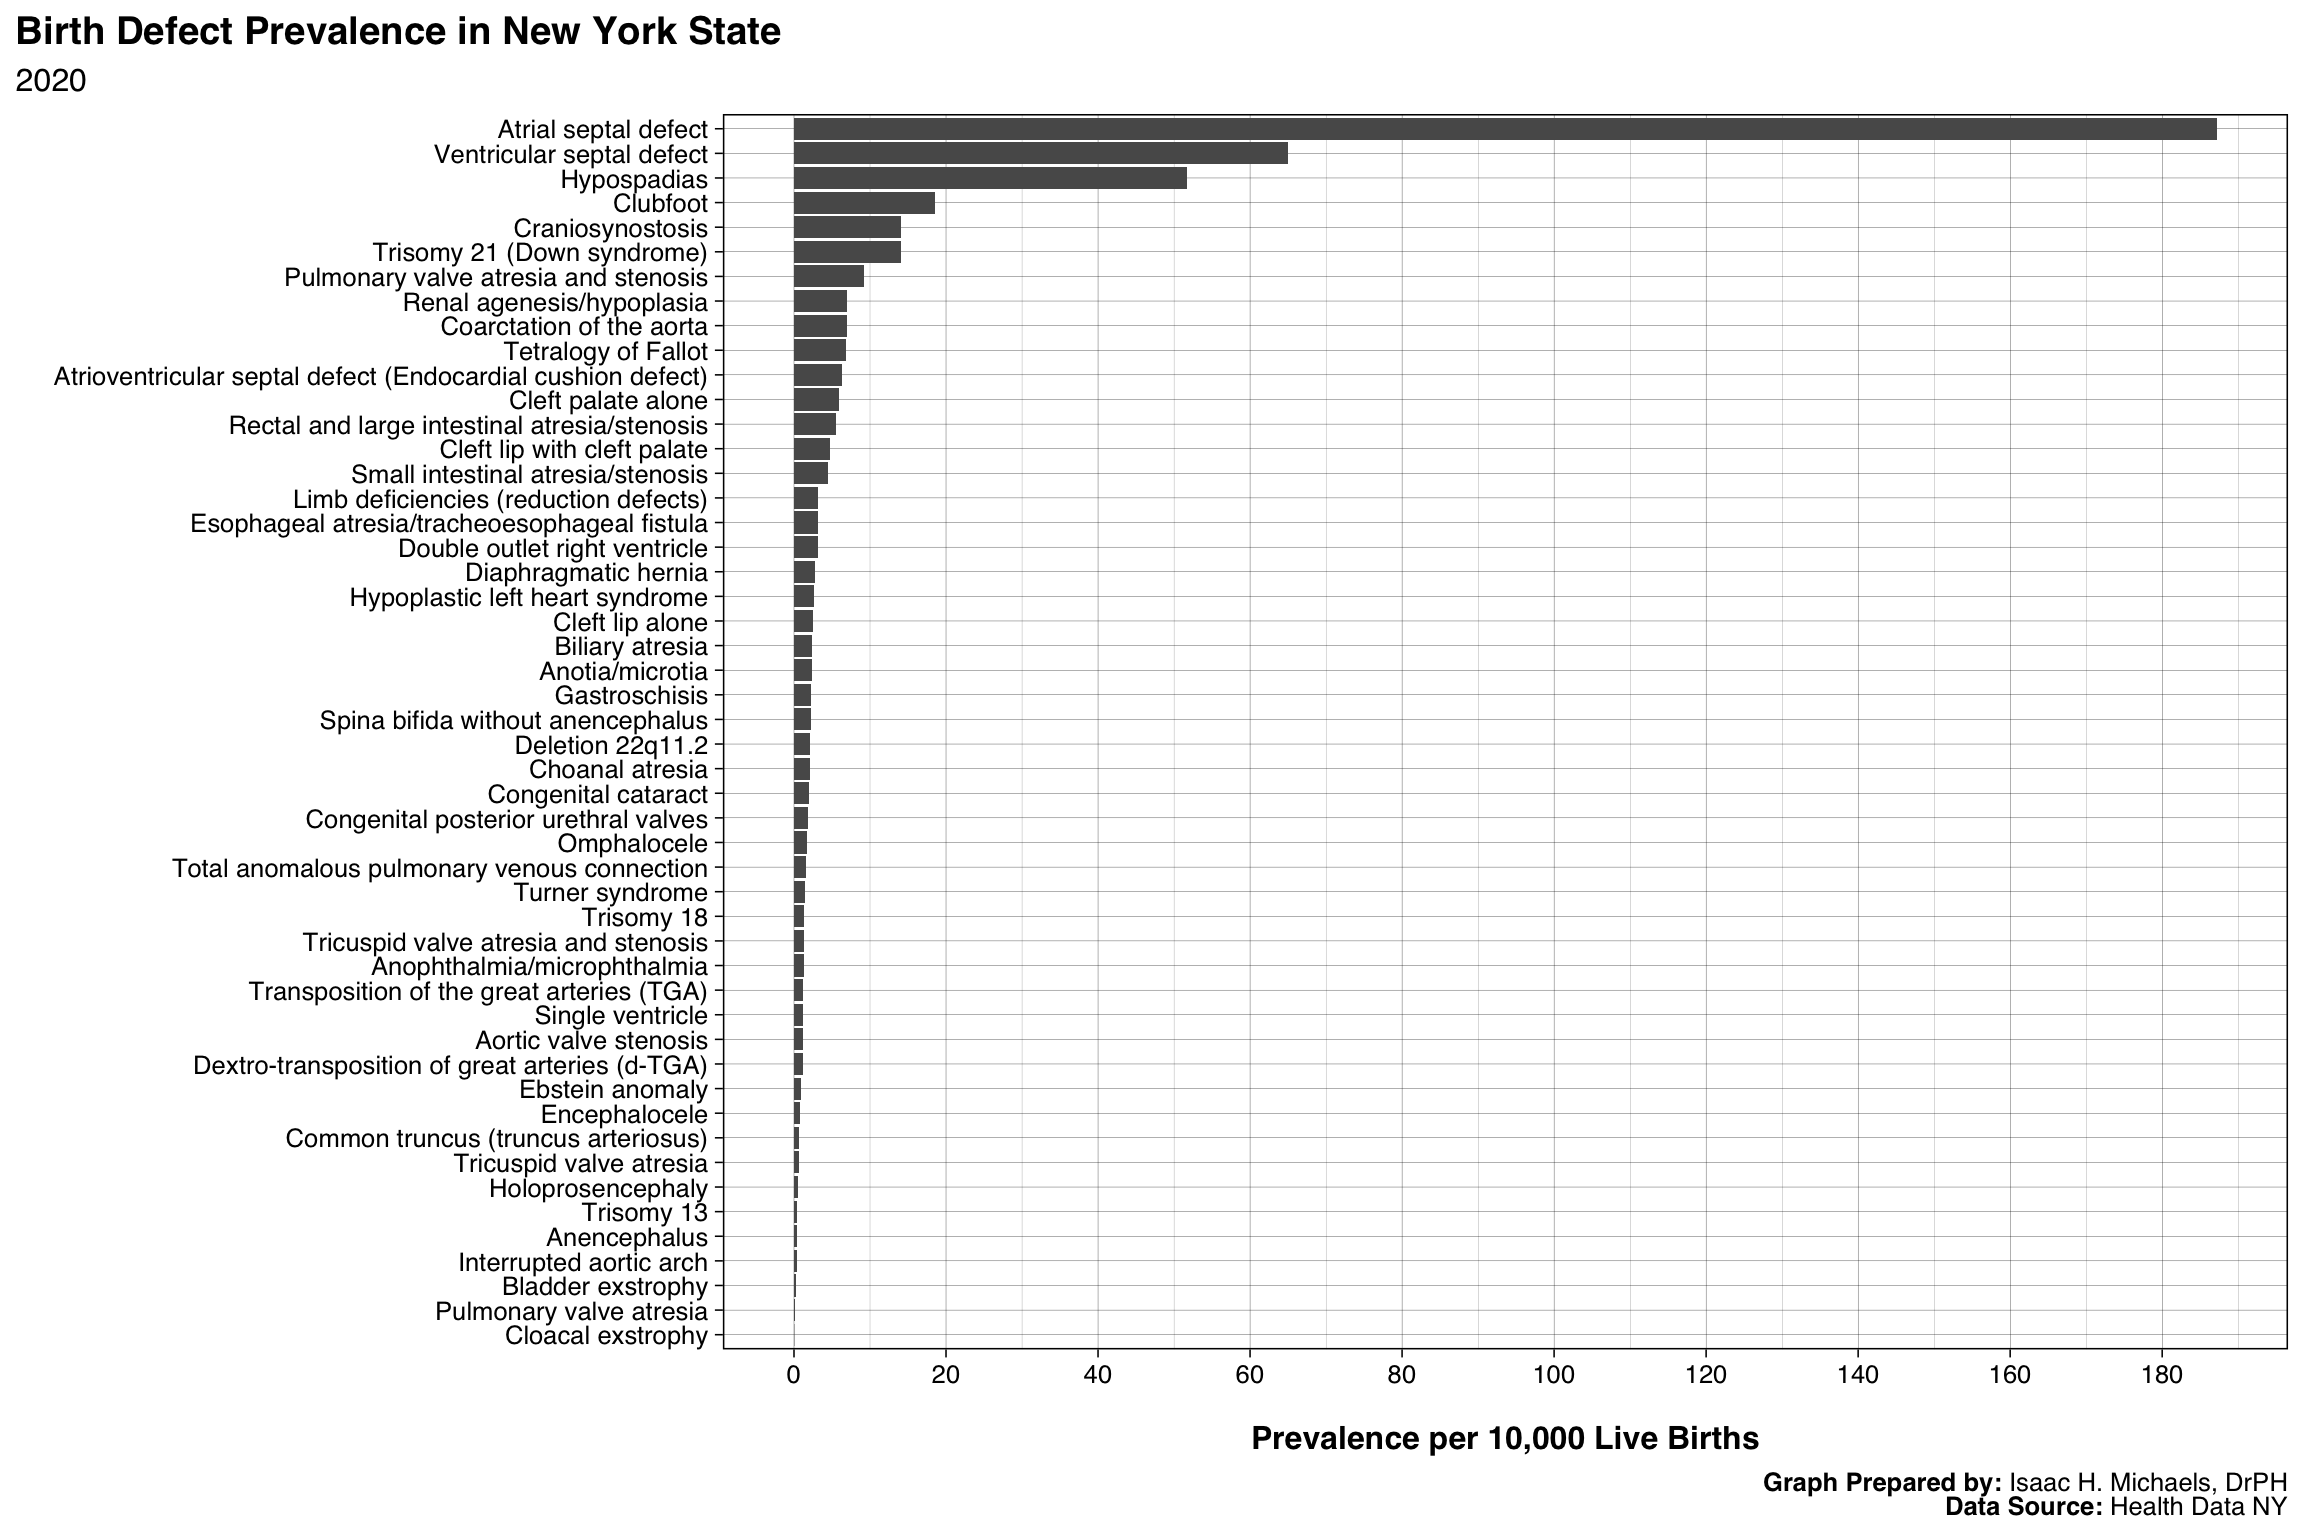
This briefing summarizes the 2020 data from the New York State Birth Defects Registry, contextualized by recent trends. Based on 207,590 live births statewide in 2020, the three most frequently reported birth defects were Atrial Septal Defect (approximately 75 cases per week), Ventricular Septal Defect (approximately 26 cases per week), and Hypospadias (approximately 21 cases per week). The consistent ranking of these conditions reflects their relatively high prevalence and established surveillance practices. Overall registry data from 2020 show prevalence rates for most birth defects that are consistent with historical patterns, though two notable trends warrant attention.
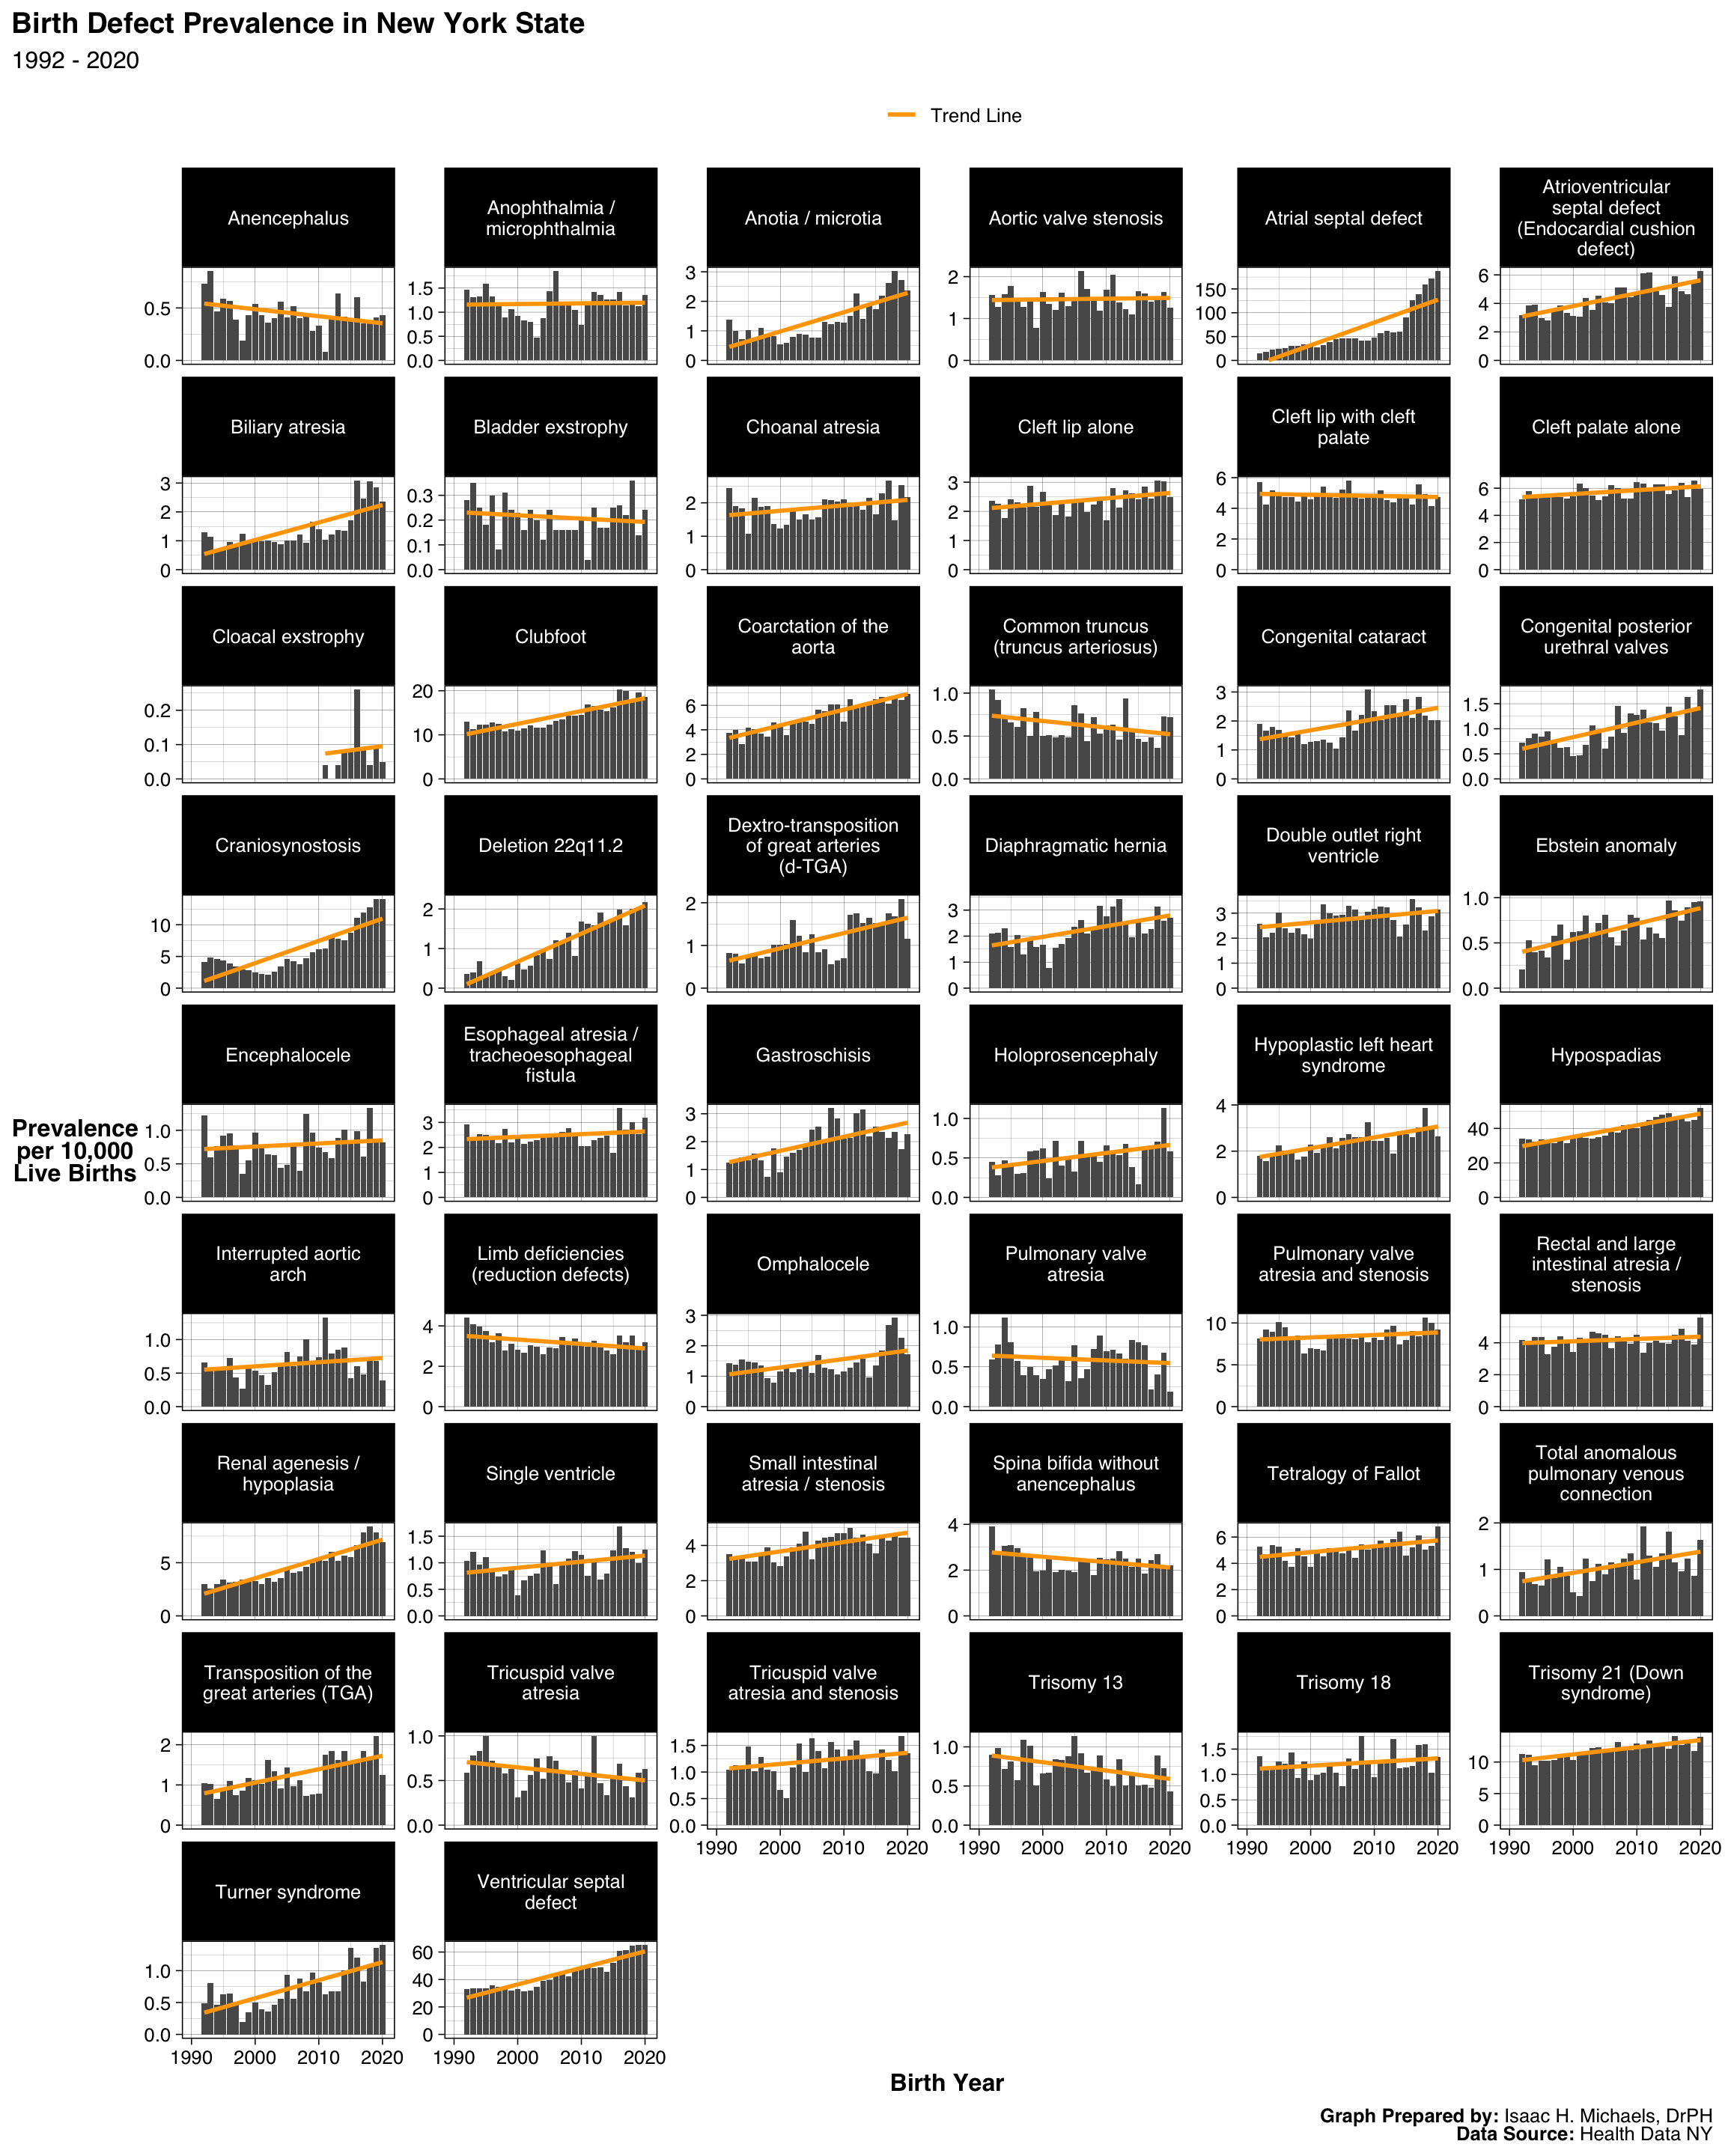
The most prominent long-term pattern is the continued, decades-long rise in the reported prevalence of certain congenital heart defects. For example, the statewide rate for Atrial Septal Defect climbed to 187.2 per 10,000 live births (approximately 3,886 cases) in 2020, an increase of 9% from the 2019 rate of 171.9. This substantial upward trend is observed nationally and likely reflects advances in diagnostic ascertainment, such as the routine use of postnatal echocardiography, and evolving reporting criteria rather than a true rise in incidence. Enhanced detection capabilities allow for the identification of less severe defects that may have gone undiagnosed in previous decades, a factor that is critical for interpreting these data accurately.
A second notable pattern is the substantial single-year increase in rectal and large intestinal atresia/stenosis. The statewide rate for this condition rose from 3.90 per 10,000 births in 2019 to 5.59 in 2020, a 43% increase. In absolute terms, this represents a climb from approximately 86 cases in 2019 to 116 cases in 2020. This change is noteworthy, but because it is based on a relatively small number of cases, it could indicate a reporting artifact, random annual variation, or an emerging signal. Continued surveillance is necessary to determine if this increase represents the beginning of a sustained trend.
Cross-Sectional Data
Overall
This bar chart displays the prevalence of major birth defects per 10,000 live births in New York State for the most recently available year of data. Each condition is shown separately, with higher-prevalence conditions appearing toward the top of the graph. This cross-sectional view offers a snapshot of the distribution of birth defects at a single point in time, allowing comparison across conditions within the same year.
Graphs Prepared By: Isaac H. Michaels, DrPH
Data Source: Health Data NY
By Sex
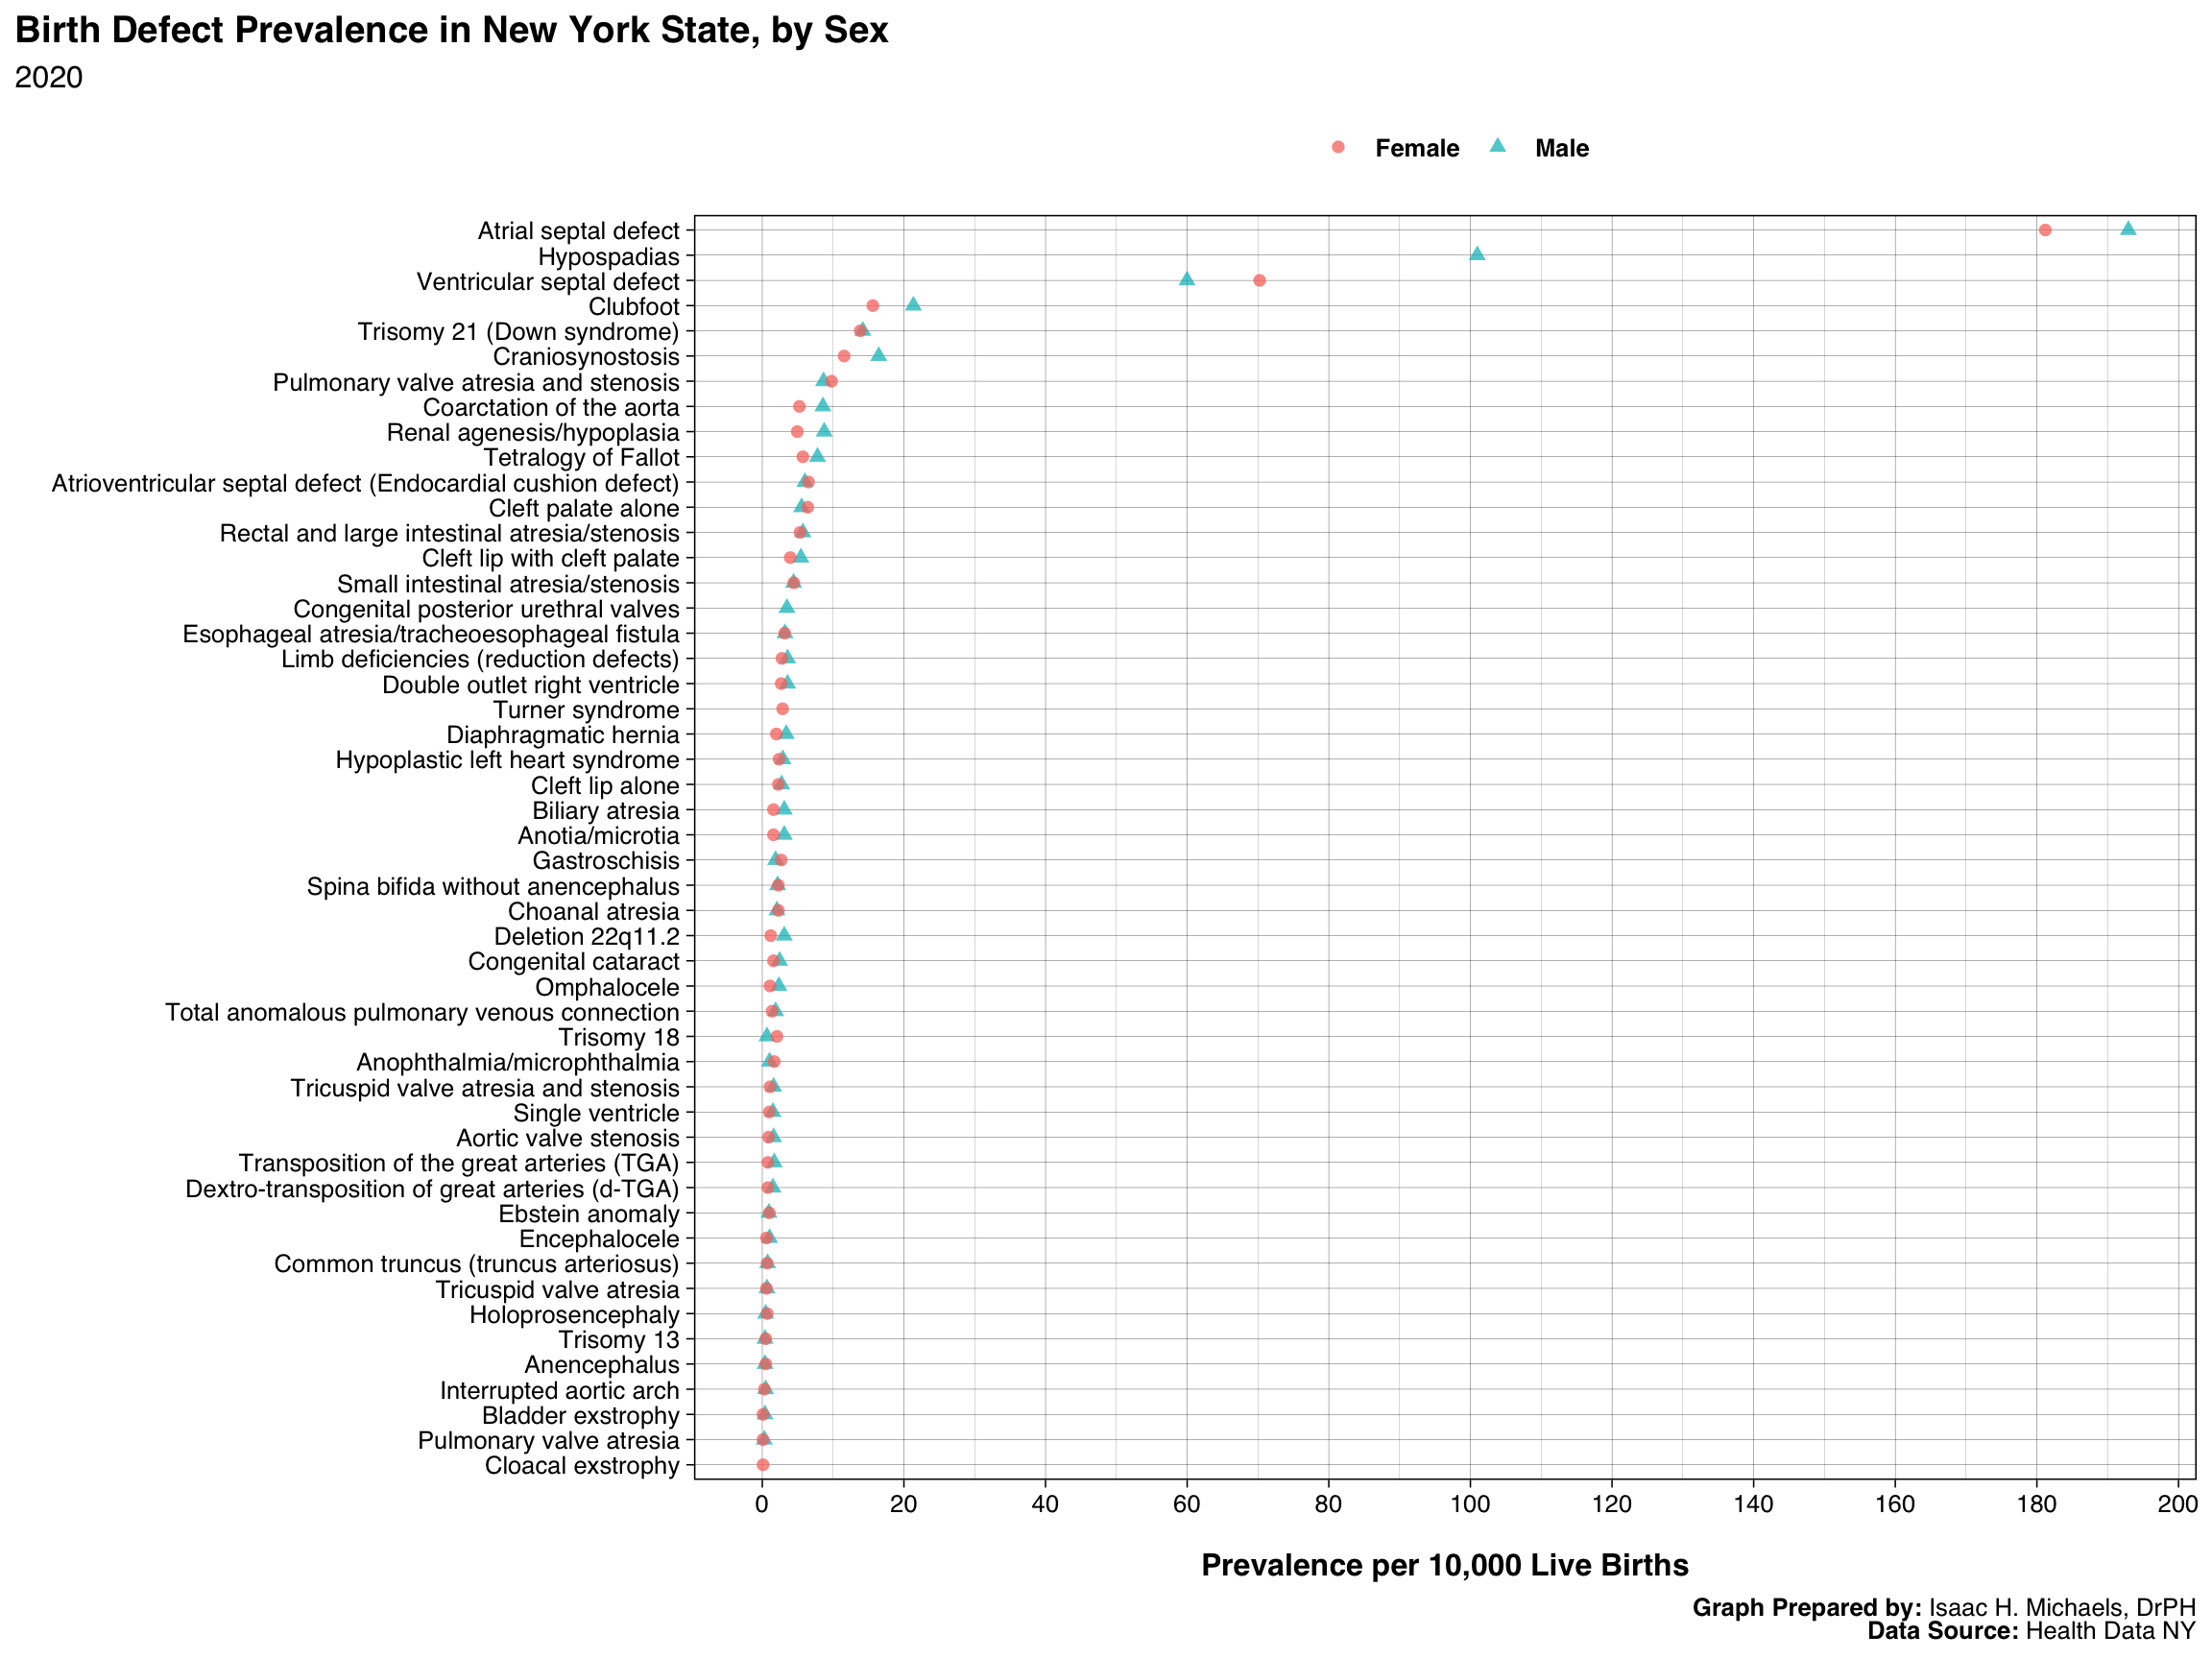
This dot plot presents the same data as the prior graph but distinguishes prevalence by sex. Each condition is represented by two points, one for males and one for females, enabling direct comparison of sex-specific differences. This view highlights conditions with relatively similar prevalence across sexes as well as those with more pronounced differences.
Graphs Prepared By: Isaac H. Michaels, DrPH
Data Source: Health Data NY
Trend Data
Overall
This set of panels shows annual prevalence trends for each major birth defect from 1992 through the most recent year. Bars represent yearly prevalence per 10,000 live births, while the orange line provides a fitted trend across the full time period. The facets allow for side-by-side comparison of how prevalence patterns have evolved across different conditions, with each panel scaled independently to make within-condition changes more visible.
Graphs Prepared By: Isaac H. Michaels, DrPH
Data Source: Health Data NY
By Sex
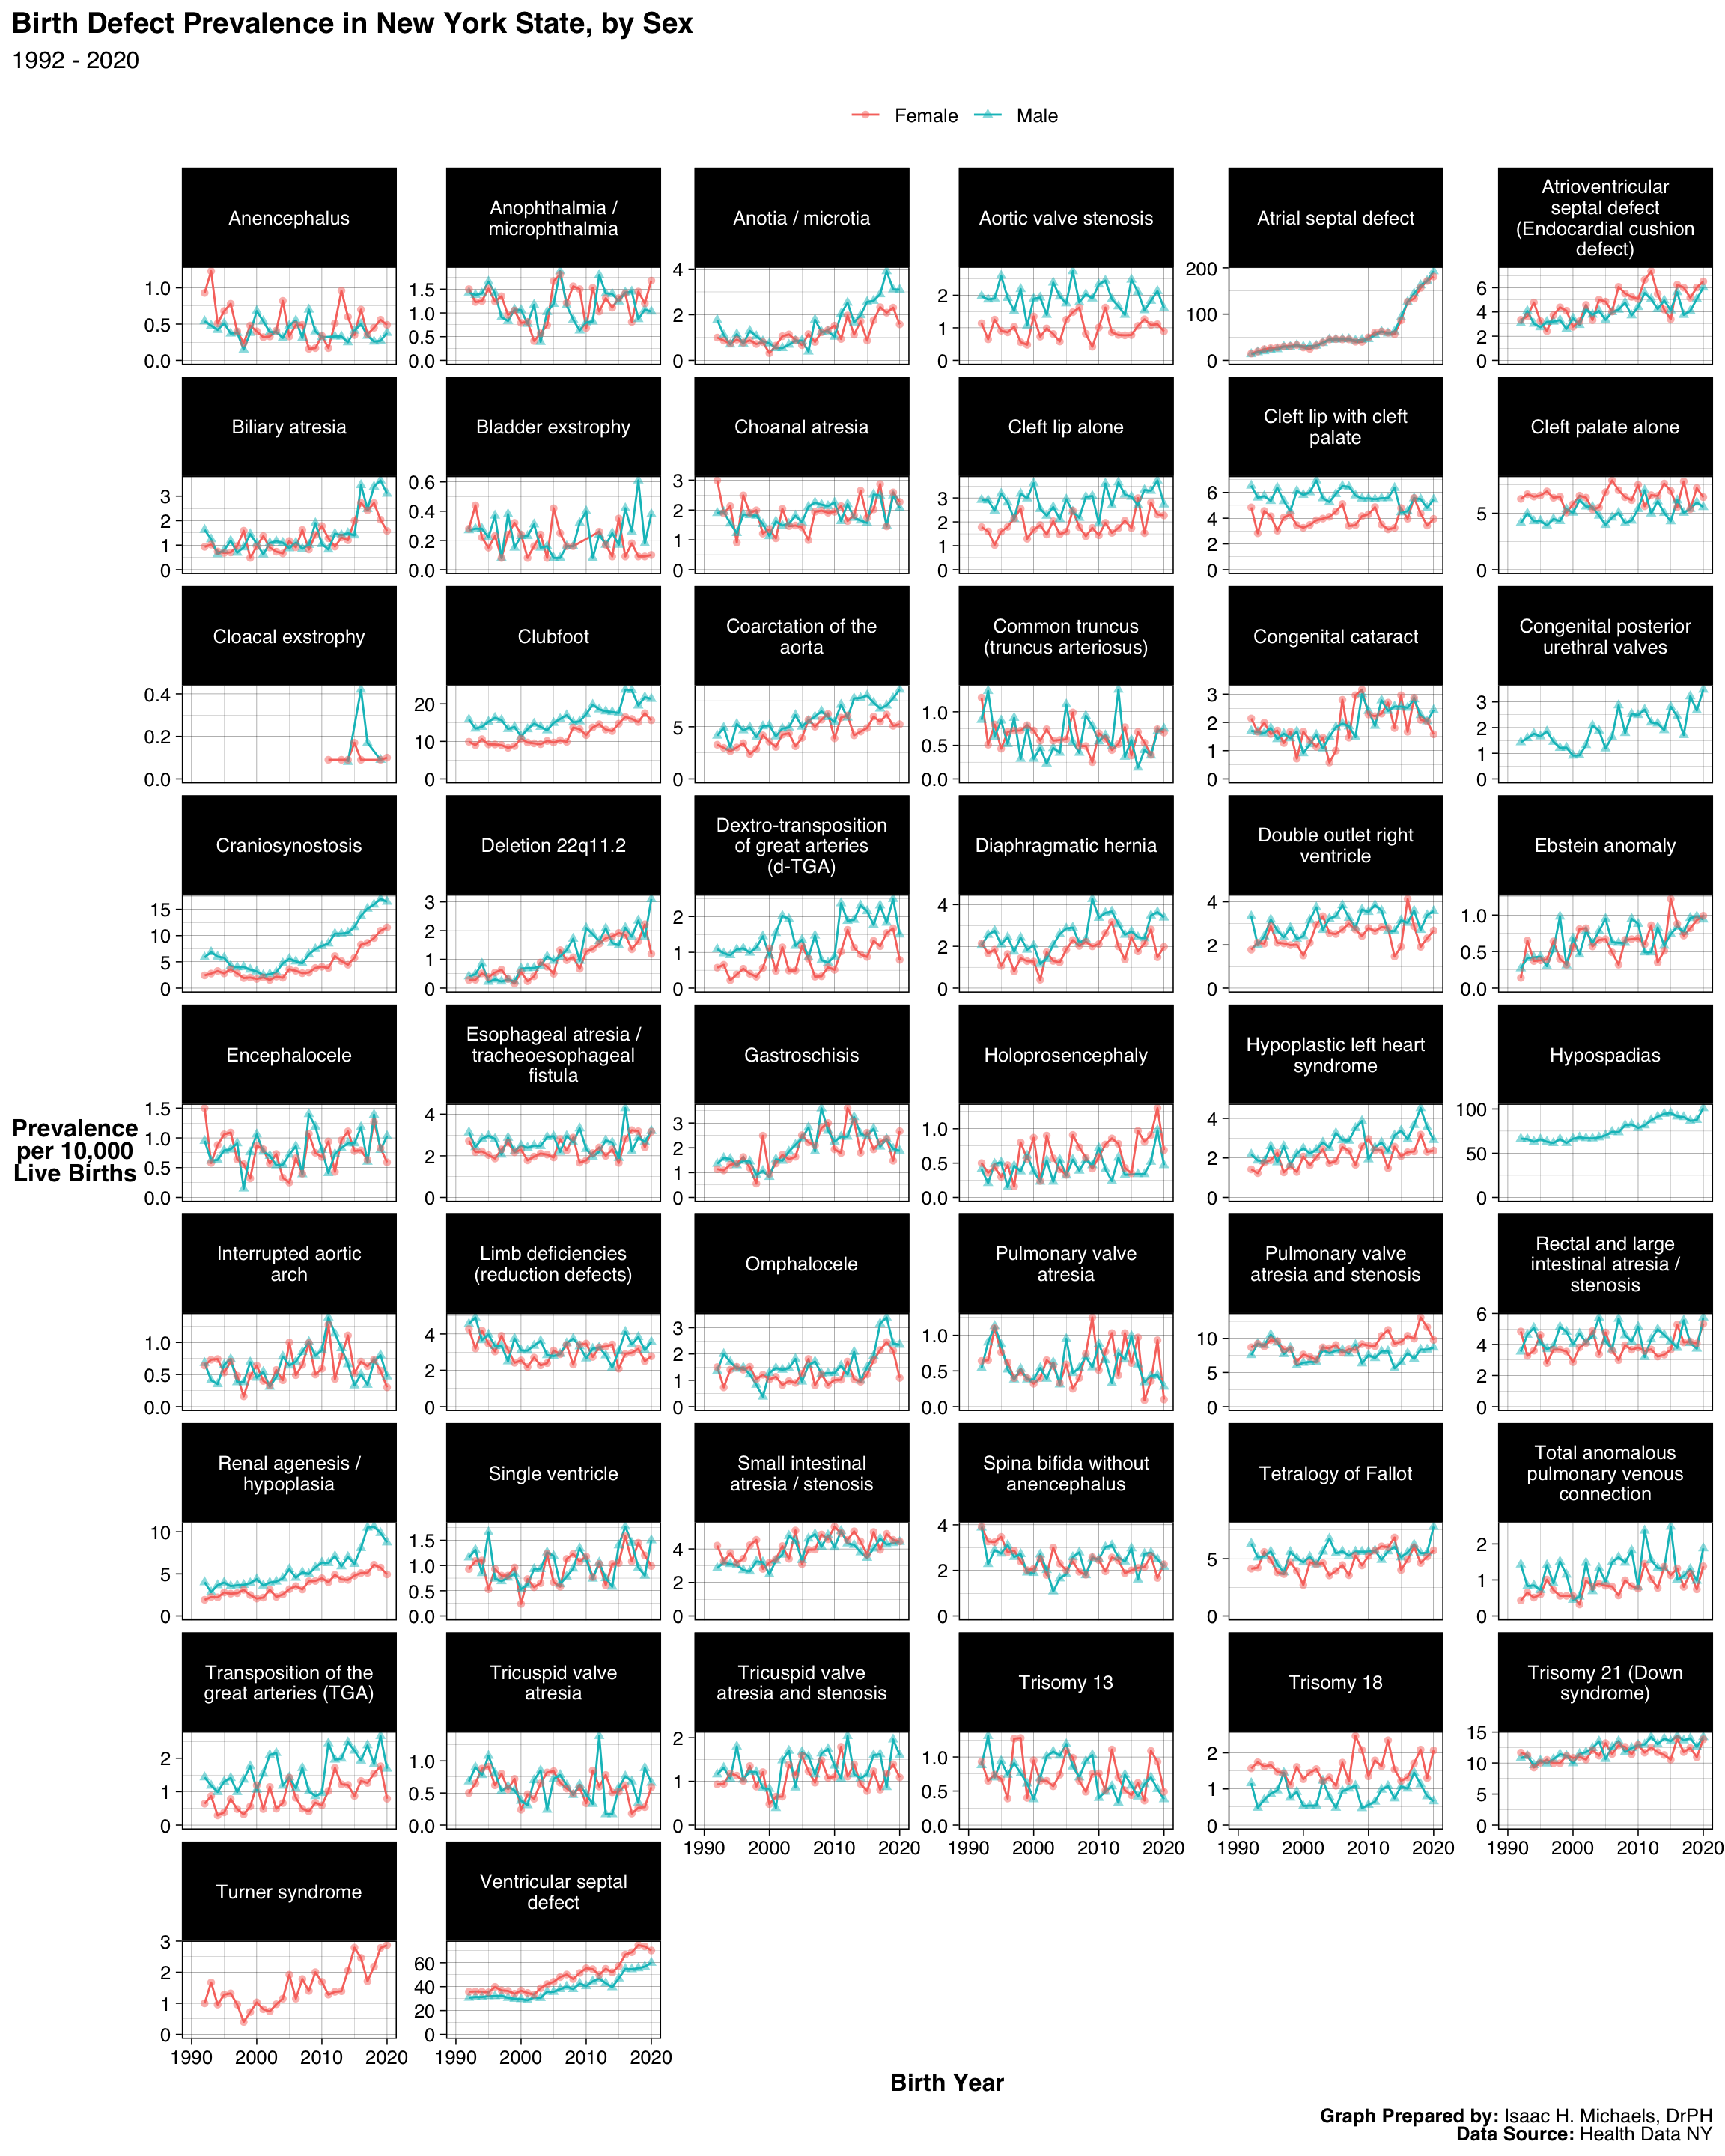
This set of line graphs extends the analysis in the prior graph by adding sex-specific data. For each condition, prevalence trends are plotted separately for males and females, allowing examination of whether patterns over time differ by sex. The use of separate panels makes it possible to see long-term shifts in prevalence while also assessing the extent of sex-specific variation for each condition.
Graphs Prepared By: Isaac H. Michaels, DrPH
Data Source: Health Data NY
This executive summary was generated by an AI summarizer agent and reviewed by an editor agent. I review any summaries flagged for revision.↩︎

