By Isaac H. Michaels, MPH
Published: August 19, 2024
Updated: September 19, 2025 at 12:57AM
Suggested citation: Michaels I. 3D visualization of shooting incidents in New York City, 2023. Published August 20, 2024. https://isaacmichaels.netlify.app/post/2024-08-20-3d-visualization-of-shooting-incidents-in-new-york-city-2023/
Map Prepared By: Isaac H. Michaels, MPH
Data Source: NYC Open Data
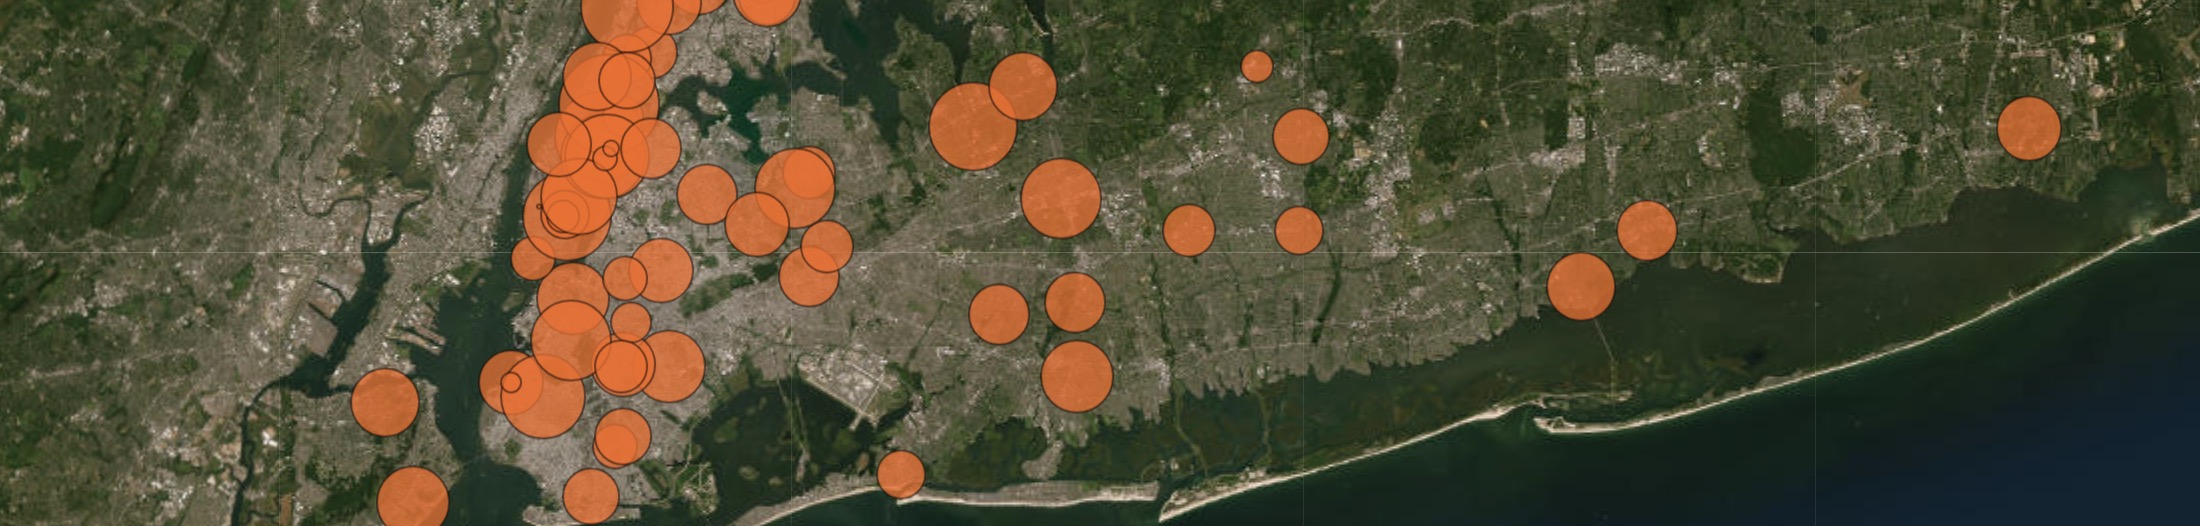
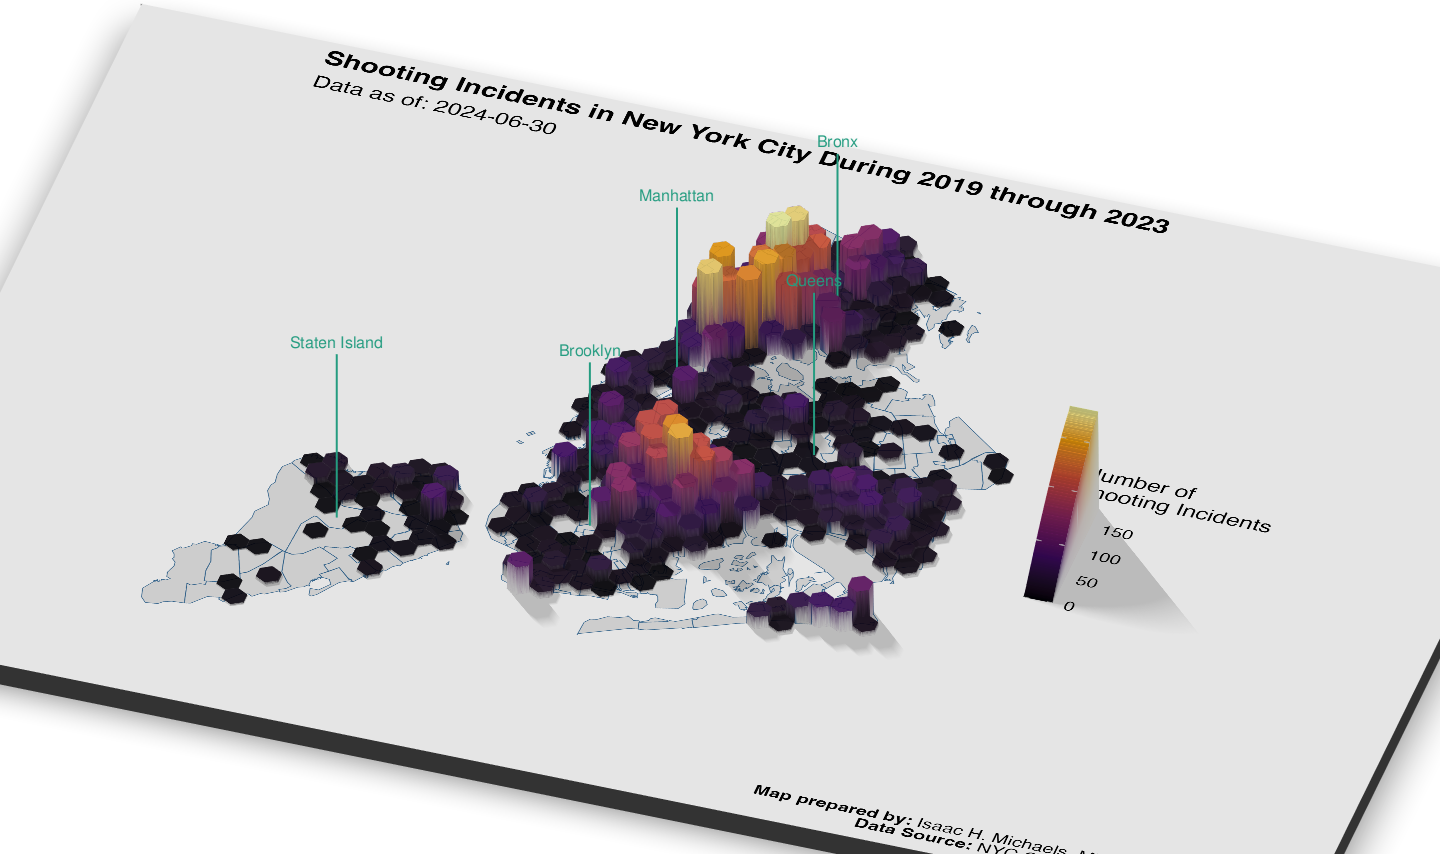
This three-dimensional map animation visualizes shooting incidents in New York City from 2019 through 2023. It highlights the spatial distributions and densities of shootings across neighborhoods, using data from the New York Police Department via NYC Open Data. Created with R using the tidyverse, scales, sf, rayshader, and viridis packages, the map provides an intuitive view of the geographic data and can aid in identifying areas for targeted public health interventions.
Purpose and Background
The purpose of this project is to introduce to the public health community an advancement of animated mapping for visualizing public health data. It builds on an earlier example of animated mapping, in two dimensions, which demonstrated that animated maps can be useful for visualizing certain patterns in public health data that are difficult to convey via static representation.1 The present example applies mapping in three dimensions to visualize the spatial distribution of shooting incidents in New York City from 2019 to 2023.
Gun violence remains a significant public health concern in the United States, with substantial impacts on morbidity,2 mortality,3 and community well-being.4 In urban areas such as New York City, the spatial distribution of shooting incidents is often uneven, with certain neighborhoods disproportionately affected.5 Understanding the spatial patterns of these incidents is crucial for implementing effective prevention strategies and deploying resources where they are most needed.
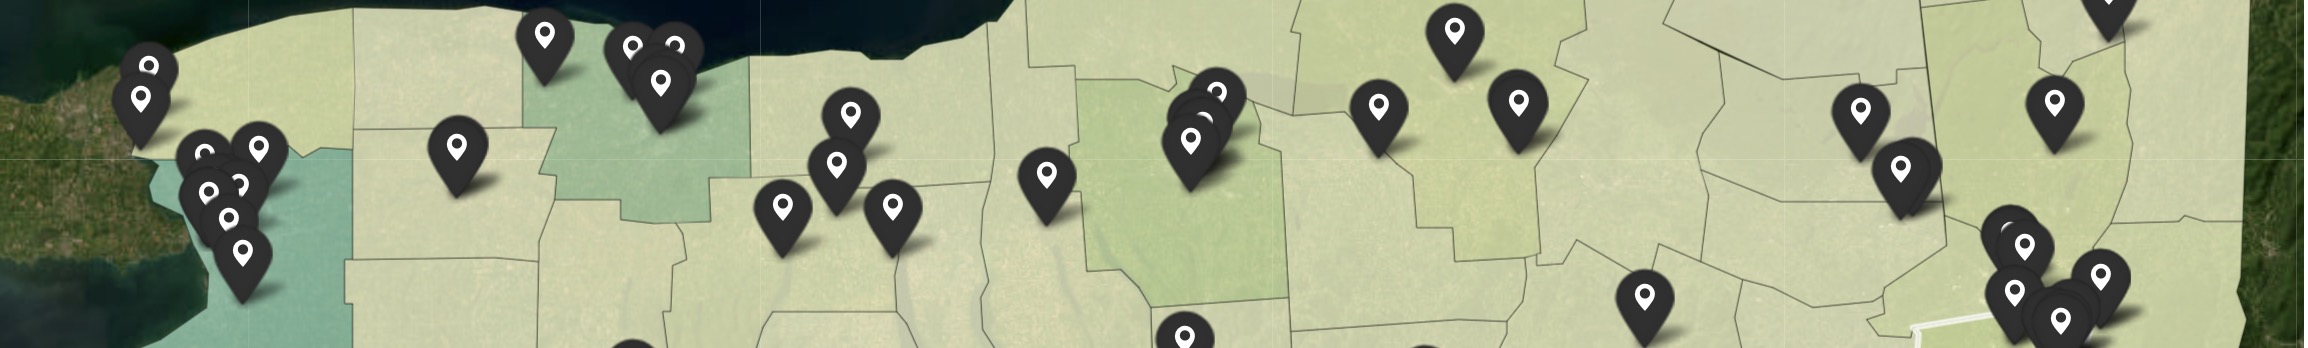
Geographic Information Systems (GIS) provide powerful tools for visualizing and analyzing spatial distributions among public health data, including gun violence. Subsequent advancements in animation for mapping incorporate two additional elements: timeseries animation in two-dimensional mapping as illustrated previously,1 and cross-sectional spatial animation in three-dimensional mapping as illustrated here. Animation is especially useful for three-dimensional mapping because structures in the background that are obstructed by opaque structures in the foreground in static maps are revealed in animated maps by revolving a camera path around the space.
Data and Methods
Data on shooting incidents in New York City were obtained from NYC Open Data.6 These data were collected by the New York Police Department, and include the geographic coordinates and attributes of shooting incidents. However, they do not include neighborhood tabulation areas (‘neighborhoods’). Every documented shooting incident since 2006 is recorded in this dataset, and the dataset is updated quarterly. The coordinates provided in the dataset were used to geolocate each shooting incident. A shapefile of New York City’s neighborhoods was obtained from NYC Open Data.7
The data that were used to generate this map also were used to develop a table of the total number of shooting incidents in each neighborhood, by year and overall. To create the map, these data were processed using R version 4.3.2 (R Foundation for Statistical Computing)8, with the analysis relying on several key packages: tidyverse9 for data manipulation, sf10 for handling spatial data, rayshader11 for generating the three-dimensional map, as well as scales12 and viridis13 for color scaling. To create the table, the incidents were converted into a spatial object based on their coordinates, spatially joined with neighborhood-level polygons to identify the neighborhood in which each incident occurred, and then aggregated to calculate the total number of incidents in each neighborhood.
Highlights
The resulting map illustrates clearly, engagingly, and accessibly that the spatial distribution of shooting incidents in New York City from 2019 to 2023 exhibited significant concentrations above background in specific neighborhoods, particularly in the Bronx and Brooklyn. For example, Mott Haven-Port Morris emerged as the neighborhood with the highest number of incidents in the Bronx, totaling 157 over the five-year period. Similarly, Crown Heights North in Brooklyn experienced 303 incidents, the highest of any neighborhood across the city.
Map Prepared By: Isaac H. Michaels, MPH
Data Source: NYC Open Data
The table indicated consistent hotspots for violence, with neighborhoods such as East Concourse-Concourse Village, East Tremont, and Mount Hope in the Bronx, as well as Brownsville and East New York in Brooklyn, consistently experiencing high levels of gun violence each year. In Manhattan, Central Harlem North-Polo Grounds and East Harlem North were among the most affected areas. The detailed geographic visualization of shooting incidents offers critical insights for law enforcement and public health officials seeking to address and reduce gun violence in New York City.
Action
The importance of these findings derives from their potential to guide targeted interventions and resource allocation. By using the map to visualize spatial patterns and the table to convey trends in these incidents, strategies can be more effectively developed and implemented to mitigate future occurrences, especially in high-risk areas. The map generated from this analysis of shooting incidents in New York City can serve as a powerful tool for informing decision making and shaping interventions to prevent gun violence.
Providing a clear visualization of the geographic distribution of these incidents can guide law enforcement agencies and public health officials in allocating resources more effectively to prioritize the most affected neighborhoods. Maps like the one highlighted here can help foster partnerships among community organizations, local governments, and public health entities. Quantifying shooting incidence likewise can help stakeholders to collaborate on targeted initiatives, such as violence interruption programs, community outreach, and youth engagement activities designed to reduce the incidence of gun violence. Improving the accessibility of this information can empower communities to advocate for evidence-based policies, and thereby support preventive measures in their neighborhoods. More generally, public health practitioners are encouraged to include static and animated three-dimensional mapping among the methods they consider using for visualizing public health data, as such mapping offers unique advantages toward revealing complex spatial patterns and engaging audiences.
| Shooting Incidents in New York City (2019 - 2023) | |||||||
| By Neighborhood and Year | |||||||
| Neighborhood Tabulation Area | 2020 | 2021 | 2022 | 2023 | 2024 | Total | |
|---|---|---|---|---|---|---|---|
| Bronx | |||||||
| Allerton-Pelham Gardens | 1 | 13 | 11 | 6 | 1 | 32 | |
| Bedford Park-Fordham North | 16 | 20 | 16 | 21 | 18 | 91 | |
| Belmont | 12 | 24 | 21 | 11 | 2 | 70 | |
| Bronxdale | 19 | 7 | 16 | 8 | 1 | 51 | |
| Claremont-Bathgate | 12 | 53 | 24 | 16 | 12 | 117 | |
| Co-op City | 5 | 8 | 2 | 4 | 2 | 21 | |
| Crotona Park East | 17 | 17 | 16 | 17 | 4 | 71 | |
| East Concourse-Concourse Village | 35 | 36 | 29 | 27 | 16 | 143 | |
| East Tremont | 40 | 35 | 33 | 29 | 7 | 144 | |
| Eastchester-Edenwald-Baychester | 15 | 17 | 10 | 8 | 3 | 53 | |
| Fordham South | 18 | 19 | 19 | 8 | 18 | 82 | |
| Highbridge | 11 | 22 | 14 | 15 | 4 | 66 | |
| Hunts Point | 17 | 27 | 12 | 8 | 9 | 73 | |
| Kingsbridge Heights | 15 | 6 | 11 | 5 | 6 | 43 | |
| Longwood | 14 | 22 | 17 | 16 | 3 | 72 | |
| Melrose South-Mott Haven North | 26 | 31 | 25 | 18 | 14 | 114 | |
| Morrisania-Melrose | 30 | 24 | 17 | 14 | 7 | 92 | |
| Mott Haven-Port Morris | 35 | 46 | 40 | 20 | 7 | 148 | |
| Mount Hope | 25 | 37 | 41 | 35 | 25 | 163 | |
| North Riverdale-Fieldston-Riverdale | 2 | 0 | 1 | 0 | 0 | 3 | |
| Norwood | 4 | 22 | 12 | 5 | 0 | 43 | |
| Parkchester | 1 | 7 | 2 | 1 | 0 | 11 | |
| Pelham Bay-Country Club-City Island | 1 | 2 | 0 | 4 | 0 | 7 | |
| Pelham Parkway | 2 | 4 | 4 | 3 | 0 | 13 | |
| Schuylerville-Throgs Neck-Edgewater Park | 2 | 8 | 4 | 2 | 4 | 20 | |
| Soundview-Bruckner | 5 | 10 | 5 | 11 | 4 | 35 | |
| Soundview-Castle Hill-Clason Point-Harding Park | 14 | 23 | 15 | 17 | 4 | 73 | |
| Spuyten Duyvil-Kingsbridge | 1 | 3 | 2 | 1 | 0 | 7 | |
| University Heights-Morris Heights | 16 | 17 | 12 | 24 | 2 | 71 | |
| Van Cortlandt Village | 4 | 8 | 2 | 5 | 2 | 21 | |
| West Concourse | 13 | 37 | 22 | 10 | 17 | 99 | |
| West Farms-Bronx River | 15 | 16 | 8 | 6 | 6 | 51 | |
| Westchester-Unionport | 5 | 3 | 13 | 3 | 0 | 24 | |
| Williamsbridge-Olinville | 26 | 40 | 24 | 27 | 11 | 128 | |
| Woodlawn-Wakefield | 16 | 14 | 14 | 15 | 4 | 63 | |
| park-cemetery-etc-Bronx | 11 | 18 | 13 | 2 | 0 | 44 | |
| Van Nest-Morris Park-Westchester Square | 0 | 3 | 4 | 4 | 3 | 14 | |
| Incident coordinates not recorded | 0 | 0 | 0 | 13 | 5 | 18 | |
| Borough Total | 501 | 699 | 531 | 439 | 221 | 2,391 | |
| Brooklyn | |||||||
| Bay Ridge | 1 | 1 | 4 | 3 | 0 | 9 | |
| Bedford | 38 | 29 | 19 | 14 | 4 | 104 | |
| Bensonhurst East | 3 | 0 | 2 | 2 | 0 | 7 | |
| Bensonhurst West | 1 | 4 | 3 | 1 | 0 | 9 | |
| Borough Park | 1 | 0 | 1 | 1 | 0 | 3 | |
| Brownsville | 95 | 60 | 63 | 36 | 23 | 277 | |
| Bushwick North | 6 | 31 | 7 | 9 | 1 | 54 | |
| Bushwick South | 23 | 20 | 19 | 17 | 4 | 83 | |
| Canarsie | 41 | 32 | 23 | 13 | 10 | 119 | |
| Carroll Gardens-Columbia Street-Red Hook | 12 | 15 | 6 | 7 | 1 | 41 | |
| Clinton Hill | 7 | 13 | 3 | 2 | 2 | 27 | |
| Crown Heights North | 82 | 63 | 57 | 35 | 14 | 251 | |
| Crown Heights South | 15 | 13 | 12 | 11 | 1 | 52 | |
| Cypress Hills-City Line | 25 | 17 | 22 | 12 | 5 | 81 | |
| DUMBO-Vinegar Hill-Downtown Brooklyn-Boerum Hill | 19 | 10 | 13 | 10 | 5 | 57 | |
| Dyker Heights | 2 | 0 | 0 | 0 | 0 | 2 | |
| East Flatbush-Farragut | 22 | 23 | 14 | 18 | 8 | 85 | |
| East New York | 89 | 54 | 56 | 36 | 17 | 252 | |
| East New York (Pennsylvania Ave) | 28 | 24 | 10 | 19 | 9 | 90 | |
| East Williamsburg | 8 | 12 | 1 | 2 | 3 | 26 | |
| Erasmus | 17 | 5 | 11 | 6 | 0 | 39 | |
| Flatbush | 40 | 15 | 10 | 15 | 4 | 84 | |
| Flatlands | 15 | 16 | 12 | 9 | 1 | 53 | |
| Fort Greene | 17 | 10 | 11 | 12 | 3 | 53 | |
| Georgetown-Marine Park-Bergen Beach-Mill Basin | 2 | 0 | 2 | 2 | 0 | 6 | |
| Gravesend | 1 | 2 | 7 | 0 | 1 | 11 | |
| Greenpoint | 2 | 2 | 9 | 0 | 0 | 13 | |
| Homecrest | 1 | 1 | 3 | 0 | 0 | 5 | |
| North Side-South Side | 7 | 4 | 3 | 2 | 0 | 16 | |
| Ocean Hill | 24 | 31 | 22 | 13 | 11 | 101 | |
| Park Slope-Gowanus | 5 | 2 | 5 | 2 | 3 | 17 | |
| Prospect Heights | 9 | 2 | 2 | 3 | 3 | 19 | |
| Prospect Lefferts Gardens-Wingate | 25 | 20 | 14 | 4 | 3 | 66 | |
| Rugby-Remsen Village | 31 | 23 | 29 | 20 | 8 | 111 | |
| Seagate-Coney Island | 16 | 11 | 23 | 10 | 0 | 60 | |
| Sheepshead Bay-Gerritsen Beach-Manhattan Beach | 5 | 2 | 15 | 3 | 0 | 25 | |
| Starrett City | 5 | 0 | 2 | 0 | 0 | 7 | |
| Stuyvesant Heights | 61 | 41 | 36 | 27 | 15 | 180 | |
| Sunset Park East | 5 | 6 | 1 | 7 | 2 | 21 | |
| Sunset Park West | 9 | 1 | 7 | 7 | 1 | 25 | |
| Williamsburg | 1 | 1 | 1 | 1 | 0 | 4 | |
| park-cemetery-etc-Brooklyn | 3 | 3 | 1 | 1 | 0 | 8 | |
| Brighton Beach | 0 | 6 | 0 | 1 | 1 | 8 | |
| Kensington-Ocean Parkway | 0 | 1 | 3 | 1 | 0 | 5 | |
| Midwood | 0 | 3 | 0 | 3 | 1 | 7 | |
| West Brighton | 0 | 2 | 1 | 0 | 0 | 3 | |
| Incident coordinates not recorded | 0 | 0 | 4 | 11 | 7 | 22 | |
| Brooklyn Heights-Cobble Hill | 0 | 0 | 0 | 1 | 0 | 1 | |
| Madison | 0 | 0 | 0 | 1 | 0 | 1 | |
| Bath Beach | 0 | 0 | 0 | 0 | 1 | 1 | |
| Borough Total | 819 | 631 | 569 | 410 | 172 | 2,601 | |
| Manhattan | |||||||
| Battery Park City-Lower Manhattan | 3 | 0 | 0 | 0 | 1 | 4 | |
| Central Harlem North-Polo Grounds | 45 | 67 | 61 | 31 | 12 | 216 | |
| Central Harlem South | 24 | 33 | 24 | 8 | 8 | 97 | |
| Chinatown | 3 | 4 | 12 | 11 | 0 | 30 | |
| Clinton | 4 | 4 | 7 | 4 | 3 | 22 | |
| East Harlem North | 29 | 38 | 54 | 30 | 13 | 164 | |
| East Harlem South | 33 | 31 | 23 | 13 | 3 | 103 | |
| East Village | 2 | 1 | 2 | 2 | 2 | 9 | |
| Hamilton Heights | 11 | 7 | 16 | 3 | 3 | 40 | |
| Hudson Yards-Chelsea-Flatiron-Union Square | 9 | 5 | 19 | 3 | 3 | 39 | |
| Lincoln Square | 6 | 3 | 5 | 3 | 2 | 19 | |
| Lower East Side | 14 | 13 | 13 | 10 | 4 | 54 | |
| Manhattanville | 12 | 13 | 8 | 5 | 4 | 42 | |
| Marble Hill-Inwood | 29 | 42 | 16 | 10 | 14 | 111 | |
| Midtown-Midtown South | 1 | 14 | 3 | 4 | 5 | 27 | |
| Morningside Heights | 6 | 8 | 2 | 3 | 5 | 24 | |
| Murray Hill-Kips Bay | 7 | 3 | 1 | 1 | 0 | 12 | |
| SoHo-TriBeCa-Civic Center-Little Italy | 1 | 0 | 7 | 1 | 3 | 12 | |
| Turtle Bay-East Midtown | 1 | 0 | 3 | 0 | 0 | 4 | |
| Upper West Side | 10 | 11 | 5 | 8 | 1 | 35 | |
| Washington Heights North | 8 | 13 | 10 | 10 | 4 | 45 | |
| Washington Heights South | 13 | 19 | 10 | 15 | 2 | 59 | |
| West Village | 1 | 4 | 1 | 0 | 0 | 6 | |
| Yorkville | 2 | 2 | 1 | 2 | 1 | 8 | |
| park-cemetery-etc-Manhattan | 1 | 4 | 4 | 1 | 0 | 10 | |
| Gramercy | 0 | 1 | 0 | 0 | 0 | 1 | |
| Lenox Hill-Roosevelt Island | 0 | 1 | 0 | 3 | 0 | 4 | |
| Upper East Side-Carnegie Hill | 0 | 4 | 1 | 0 | 1 | 6 | |
| Incident coordinates not recorded | 0 | 0 | 4 | 12 | 2 | 18 | |
| Borough Total | 275 | 345 | 312 | 193 | 96 | 1,221 | |
| Queens | |||||||
| Airport | 2 | 0 | 0 | 0 | 0 | 2 | |
| Astoria | 8 | 10 | 4 | 10 | 1 | 33 | |
| Baisley Park | 15 | 12 | 14 | 14 | 2 | 57 | |
| Bellerose | 1 | 0 | 0 | 0 | 1 | 2 | |
| Briarwood-Jamaica Hills | 4 | 3 | 2 | 0 | 3 | 12 | |
| Cambria Heights | 1 | 1 | 7 | 2 | 0 | 11 | |
| College Point | 3 | 0 | 1 | 1 | 0 | 5 | |
| Corona | 6 | 3 | 2 | 3 | 0 | 14 | |
| East Elmhurst | 11 | 4 | 1 | 3 | 0 | 19 | |
| East Flushing | 1 | 2 | 1 | 0 | 0 | 4 | |
| Elmhurst | 8 | 4 | 4 | 5 | 0 | 21 | |
| Far Rockaway-Bayswater | 32 | 14 | 17 | 8 | 4 | 75 | |
| Flushing | 1 | 6 | 4 | 4 | 0 | 15 | |
| Glen Oaks-Floral Park-New Hyde Park | 1 | 0 | 0 | 0 | 0 | 1 | |
| Hammels-Arverne-Edgemere | 37 | 26 | 20 | 10 | 7 | 100 | |
| Hollis | 8 | 9 | 5 | 4 | 0 | 26 | |
| Hunters Point-Sunnyside-West Maspeth | 6 | 7 | 4 | 5 | 3 | 25 | |
| Jackson Heights | 3 | 5 | 11 | 1 | 1 | 21 | |
| Jamaica | 16 | 18 | 18 | 8 | 4 | 64 | |
| Jamaica Estates-Holliswood | 2 | 2 | 1 | 0 | 0 | 5 | |
| Kew Gardens | 1 | 2 | 0 | 0 | 0 | 3 | |
| Kew Gardens Hills | 1 | 0 | 3 | 2 | 1 | 7 | |
| Laurelton | 10 | 10 | 6 | 1 | 1 | 28 | |
| Lindenwood-Howard Beach | 1 | 2 | 0 | 0 | 0 | 3 | |
| Maspeth | 2 | 1 | 2 | 2 | 0 | 7 | |
| Murray Hill | 1 | 1 | 1 | 0 | 0 | 3 | |
| North Corona | 4 | 11 | 4 | 2 | 0 | 21 | |
| Oakland Gardens | 1 | 0 | 0 | 1 | 0 | 2 | |
| Old Astoria | 6 | 4 | 4 | 7 | 2 | 23 | |
| Ozone Park | 2 | 6 | 5 | 0 | 0 | 13 | |
| Pomonok-Flushing Heights-Hillcrest | 1 | 5 | 4 | 2 | 2 | 14 | |
| Queens Village | 10 | 13 | 5 | 3 | 2 | 33 | |
| Queensboro Hill | 1 | 0 | 0 | 1 | 0 | 2 | |
| Queensbridge-Ravenswood-Long Island City | 12 | 10 | 6 | 4 | 1 | 33 | |
| Ridgewood | 5 | 0 | 10 | 1 | 1 | 17 | |
| Rosedale | 2 | 5 | 5 | 0 | 2 | 14 | |
| South Jamaica | 31 | 15 | 11 | 3 | 7 | 67 | |
| South Ozone Park | 4 | 13 | 12 | 9 | 2 | 40 | |
| Springfield Gardens North | 4 | 10 | 5 | 0 | 3 | 22 | |
| Springfield Gardens South-Brookville | 8 | 7 | 7 | 3 | 0 | 25 | |
| St. Albans | 19 | 21 | 7 | 13 | 3 | 63 | |
| Steinway | 1 | 7 | 4 | 4 | 0 | 16 | |
| Whitestone | 1 | 0 | 0 | 1 | 0 | 2 | |
| Woodhaven | 5 | 8 | 6 | 2 | 0 | 21 | |
| Woodside | 2 | 5 | 2 | 3 | 1 | 13 | |
| park-cemetery-etc-Queens | 2 | 2 | 6 | 1 | 0 | 11 | |
| Auburndale | 0 | 2 | 0 | 0 | 0 | 2 | |
| Elmhurst-Maspeth | 0 | 2 | 0 | 7 | 0 | 9 | |
| Forest Hills | 0 | 1 | 3 | 0 | 0 | 4 | |
| Glendale | 0 | 2 | 1 | 2 | 0 | 5 | |
| Middle Village | 0 | 1 | 0 | 2 | 0 | 3 | |
| Richmond Hill | 0 | 4 | 19 | 15 | 16 | 54 | |
| Bayside-Bayside Hills | 0 | 0 | 2 | 0 | 0 | 2 | |
| Fresh Meadows-Utopia | 0 | 0 | 6 | 0 | 1 | 7 | |
| Incident coordinates not recorded | 0 | 0 | 2 | 6 | 2 | 10 | |
| Breezy Point-Belle Harbor-Rockaway Park-Broad Channel | 0 | 0 | 0 | 2 | 1 | 3 | |
| Borough Total | 303 | 296 | 264 | 177 | 74 | 1,114 | |
| Staten Island | |||||||
| Grasmere-Arrochar-Ft. Wadsworth | 3 | 0 | 0 | 1 | 0 | 4 | |
| Grymes Hill-Clifton-Fox Hills | 10 | 4 | 7 | 3 | 0 | 24 | |
| Mariner's Harbor-Arlington-Port Ivory-Graniteville | 16 | 3 | 5 | 1 | 1 | 26 | |
| New Brighton-Silver Lake | 1 | 2 | 4 | 2 | 1 | 10 | |
| New Springville-Bloomfield-Travis | 2 | 2 | 0 | 0 | 0 | 4 | |
| Old Town-Dongan Hills-South Beach | 1 | 1 | 0 | 1 | 0 | 3 | |
| Port Richmond | 4 | 1 | 3 | 0 | 0 | 8 | |
| Stapleton-Rosebank | 3 | 12 | 5 | 6 | 1 | 27 | |
| West New Brighton-New Brighton-St. George | 10 | 12 | 12 | 7 | 3 | 44 | |
| Arden Heights | 0 | 1 | 0 | 0 | 0 | 1 | |
| Charleston-Richmond Valley-Tottenville | 0 | 1 | 0 | 0 | 0 | 1 | |
| New Dorp-Midland Beach | 0 | 1 | 0 | 0 | 0 | 1 | |
| Annadale-Huguenot-Prince's Bay-Eltingville | 0 | 0 | 3 | 2 | 0 | 5 | |
| Todt Hill-Emerson Hill-Heartland Village-Lighthouse Hill | 0 | 0 | 1 | 0 | 0 | 1 | |
| Westerleigh | 0 | 0 | 0 | 1 | 1 | 2 | |
| Incident coordinates not recorded | 0 | 0 | 0 | 7 | 0 | 7 | |
| Borough Total | 50 | 40 | 40 | 31 | 7 | 168 | |
| Citywide Total | 1,948 | 2,011 | 1,716 | 1,250 | 570 | 7,495 | |
| Data Source: NYC Open Data (data as of June 30, 2024). | |||||||
| Note: Neighborhood tabulation areas were identified by performing a spatial join of the shooting-incident coordinates against the neighborhood tabulation area shapefile. As a result, 23 (0.3%) of the incidents were identified as having occurred in different boroughs than the ones indicated in the shooting-incidents dataset. | |||||||
Table Prepared By: Isaac H. Michaels, MPH
Data Source: NYC Open Data