New York City


Hate Crimes in New York State

Hate Crimes in New York State

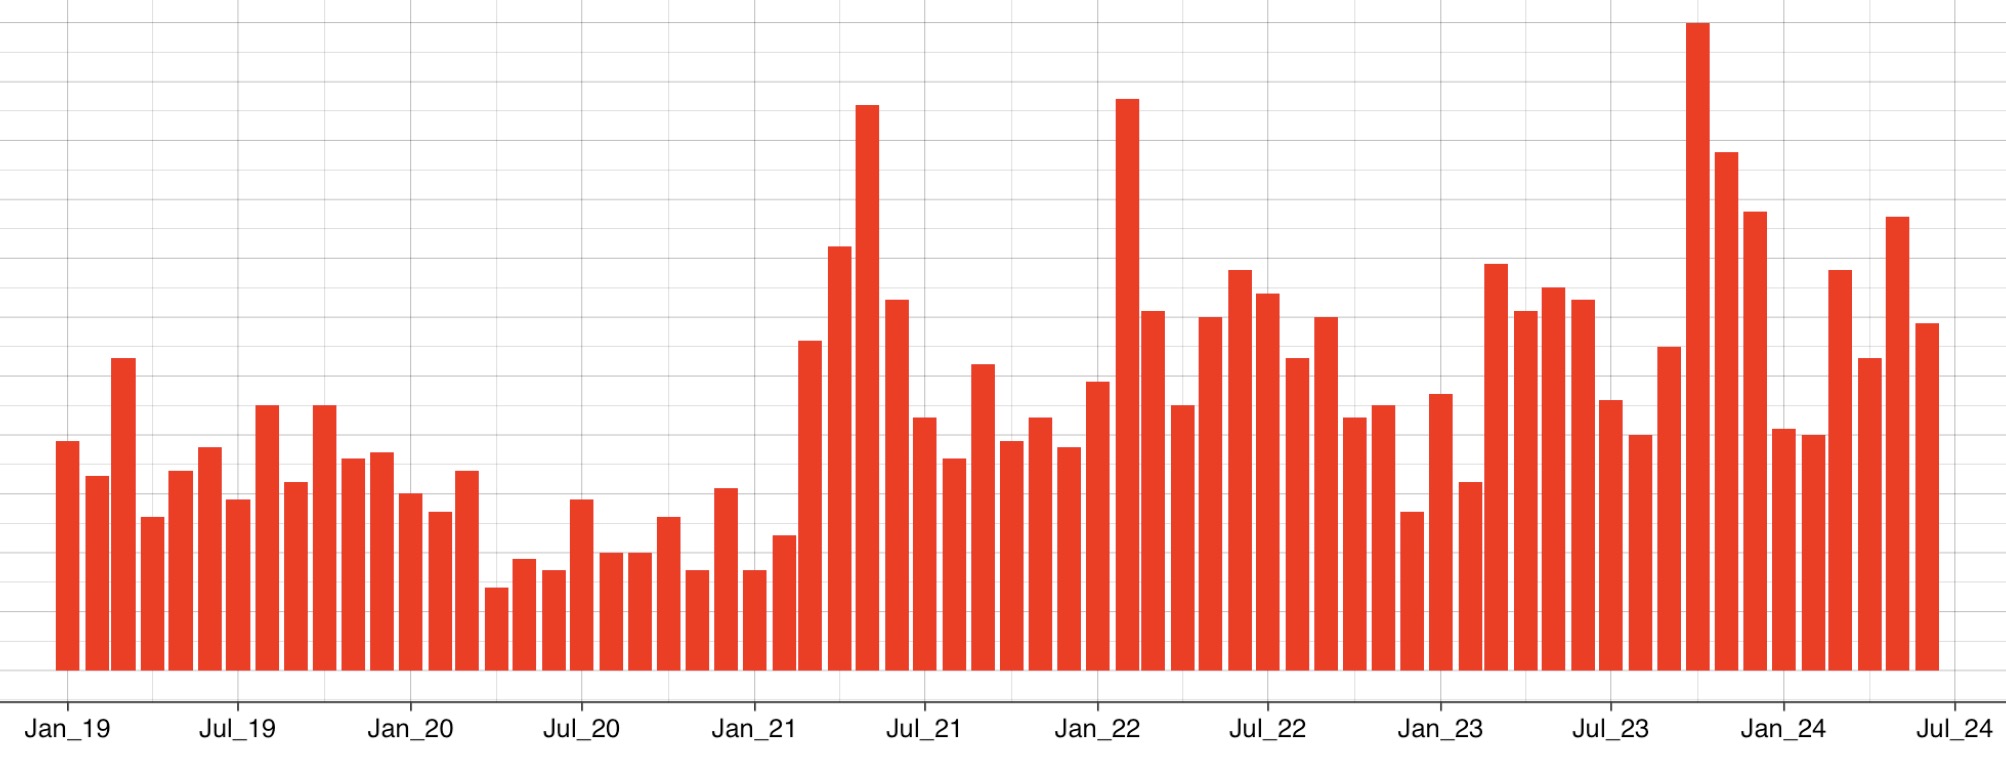
Explore comprehensive visualizations and trends on hate crimes across New York State and New York City. This page features maps, heat maps, and trend graphs detailing the distribution of hate crimes by bias motive, crime type, and county. Analyze monthly and yearly patterns, discover regional variations, and gain insights to inform policy and practice. The data, sourced from Open Data NY and NYC Open Data, supports targeted interventions and resource allocation to combat hate crimes effectively.
hate crimes violence bias New York State New York City


Using Three-Dimensional Mapping to Visualize Five Years of Shooting Incidents in New York City

Using Three-Dimensional Mapping to Visualize Five Years of Shooting Incidents in New York City

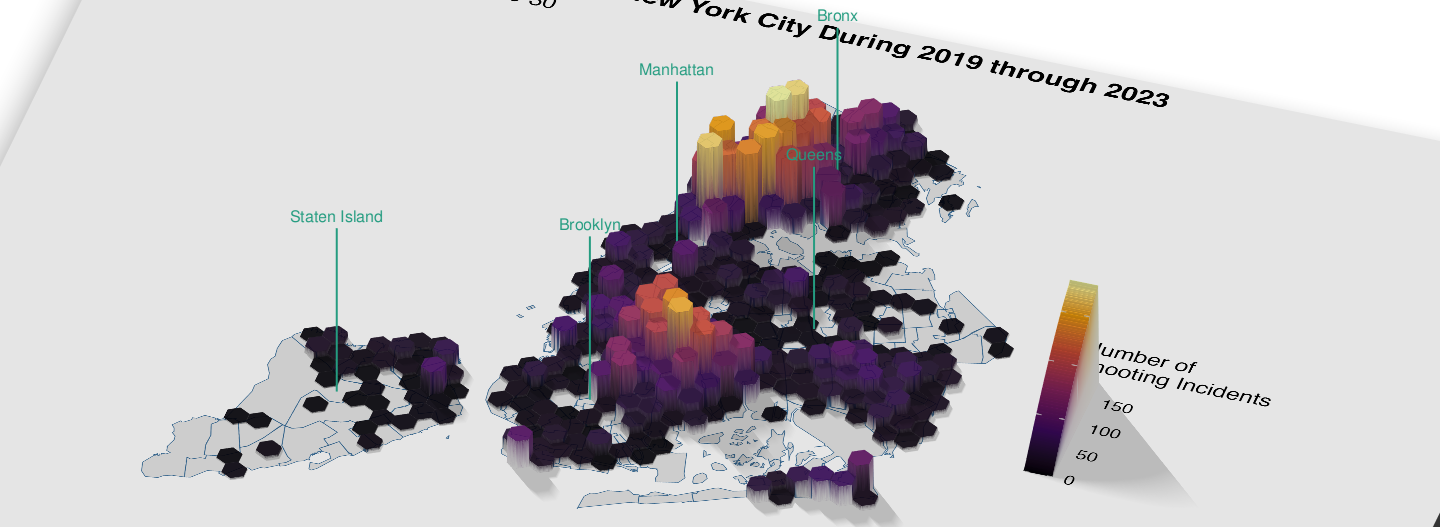
The map depicts the spatial distribution of shooting incidents in New York City from 2019 to 2023. A three-dimensional elevation model is used to represent incident density, with areas of higher incident counts extruded vertically from the map surface. The color scale is a continuous gradient from dark purple to light yellow, with lighter colors representing higher frequencies of shootings. Neighborhoods with the highest concentration of incidents, such as in parts of Brooklyn and the Bronx, are visually elevated and shaded lightest. The map provides a sweeping, 360-degree view of the city’s spatial distribution of shooting incidents.
Gun Violence New York City Three-dimensional mapping Public Health GIS epidemiology


All-Cause Mortality in New York State

All-Cause Mortality in New York State

Explore comprehensive data on all-cause mortality in New York State, covering trends from 1999 to the present. This detailed analysis includes insights into mortality rates across different age groups and jurisdictions, using both annual and weekly data from CDC WONDER and data.cdc.gov. Understand key patterns, identify significant changes, and discover implications for public health practice and targeted interventions.
mortality New York State New York City All-Cause Mortality CDC WONDER Data


Research Team Uncovers Disparities in Internet Access and COVID-19 Vaccination in New York City

Research Team Uncovers Disparities in Internet Access and COVID-19 Vaccination in New York City

Discover how disparities in internet access are linked to lower COVID-19 vaccination rates in New York City. A new study by Isaac Michaels and colleagues, published in Preventing Chronic Disease, reveals that communities with limited internet access, particularly in the Bronx and Brooklyn, face significant barriers to vaccination. The research underscores the need for public health strategies that address digital inequities to protect vulnerable populations.
COVID-19 epidemiology New York City GIS Public Health Social Determinants immunization