Published: November 24, 2022
Updated: July 22, 2024 at 01:08PM
Note: This page is no longer being updated, because HHS (as of May 3, 2024) is no longer updating the COVID-19 Reported Patient Impact and Hospital Capacity by State Timeseries (RAW) dataset on healthdata.gov.
Introduction
Welcome to this page on hospital bed capacity in New York State. On this page, you will find trend graphs that display the occupancy rates of adult and pediatric beds in hospitals across the state. The x-axes of the graphs reflect the data collection periods, the y-axes show the occupancy rate (expressed as a percentage), and the color scales of the points indicate the bed capacity for the respective hospital(s). The graphs displayed overall, disaggregated by county, and -for New York City- disaggregated further by individual hospital.
Hospital bed capacity
The trend graphs on this page provide valuable insights into the current state of hospital bed capacity in New York State. The occupancy rates shown are based on the number of beds occupied in each hospital, while the size of the points reflects the total bed capacity at each location. By examining the trend graphs, you can gain a sense of how capacity varies over time and across different areas of the state.
Implications for public health practice
Understanding hospital bed capacity is critical for public health practice, as it helps to inform decisions about resource allocation and patient care. When bed occupancy rates are high, it may be necessary to consider measures such as transferring patients to other hospitals or increasing capacity through the use of overflow beds or temporary facilities. On the other hand, when occupancy rates are low, it may be possible to redirect resources to other areas of need or to implement cost-saving measures. By tracking hospital bed capacity over time, public health practitioners can stay informed about the state of the healthcare system and respond appropriately to changes in demand.
Conclusion
I hope that this page provides a useful overview of hospital bed capacity in New York State. By examining the trend graphs and considering the implications for public health practice, we can gain a deeper understanding of the state of the healthcare system and how it is affected by changes in patient demand and other factors.
Adult Beds
Statewide
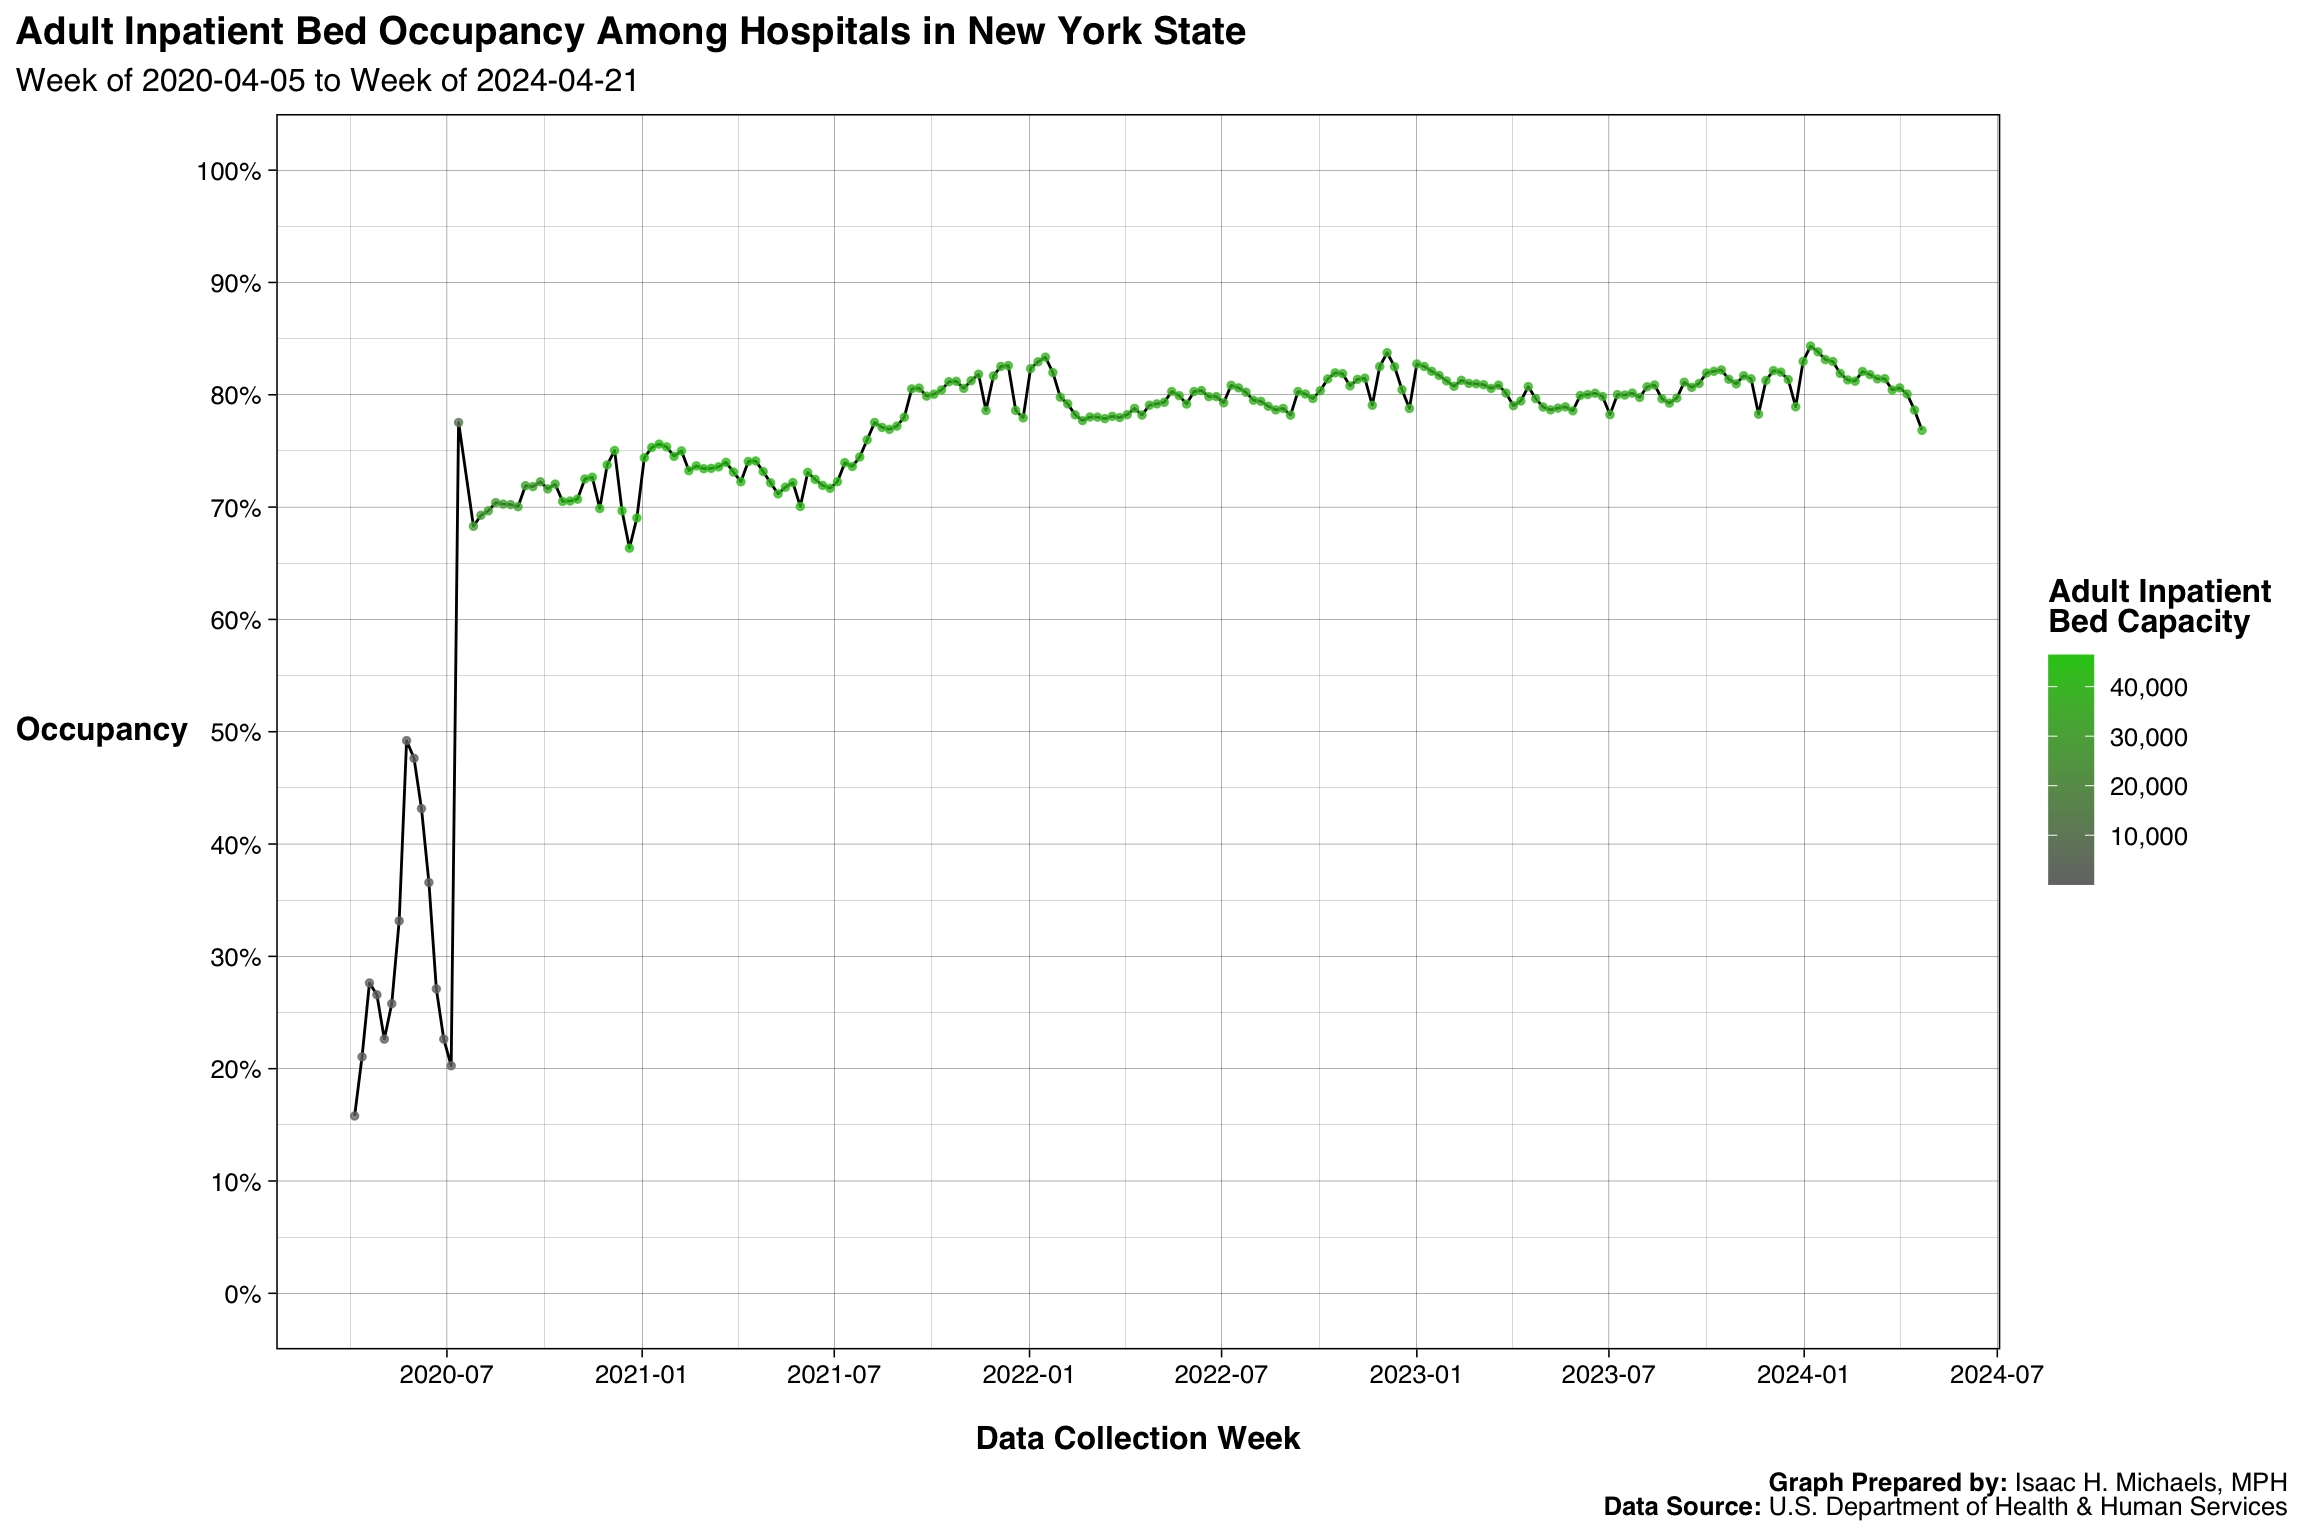 Graph Prepared By: Isaac H. Michaels, MPH
Death Data Source: U.S. Department of Health & Human Services
New York State, by County
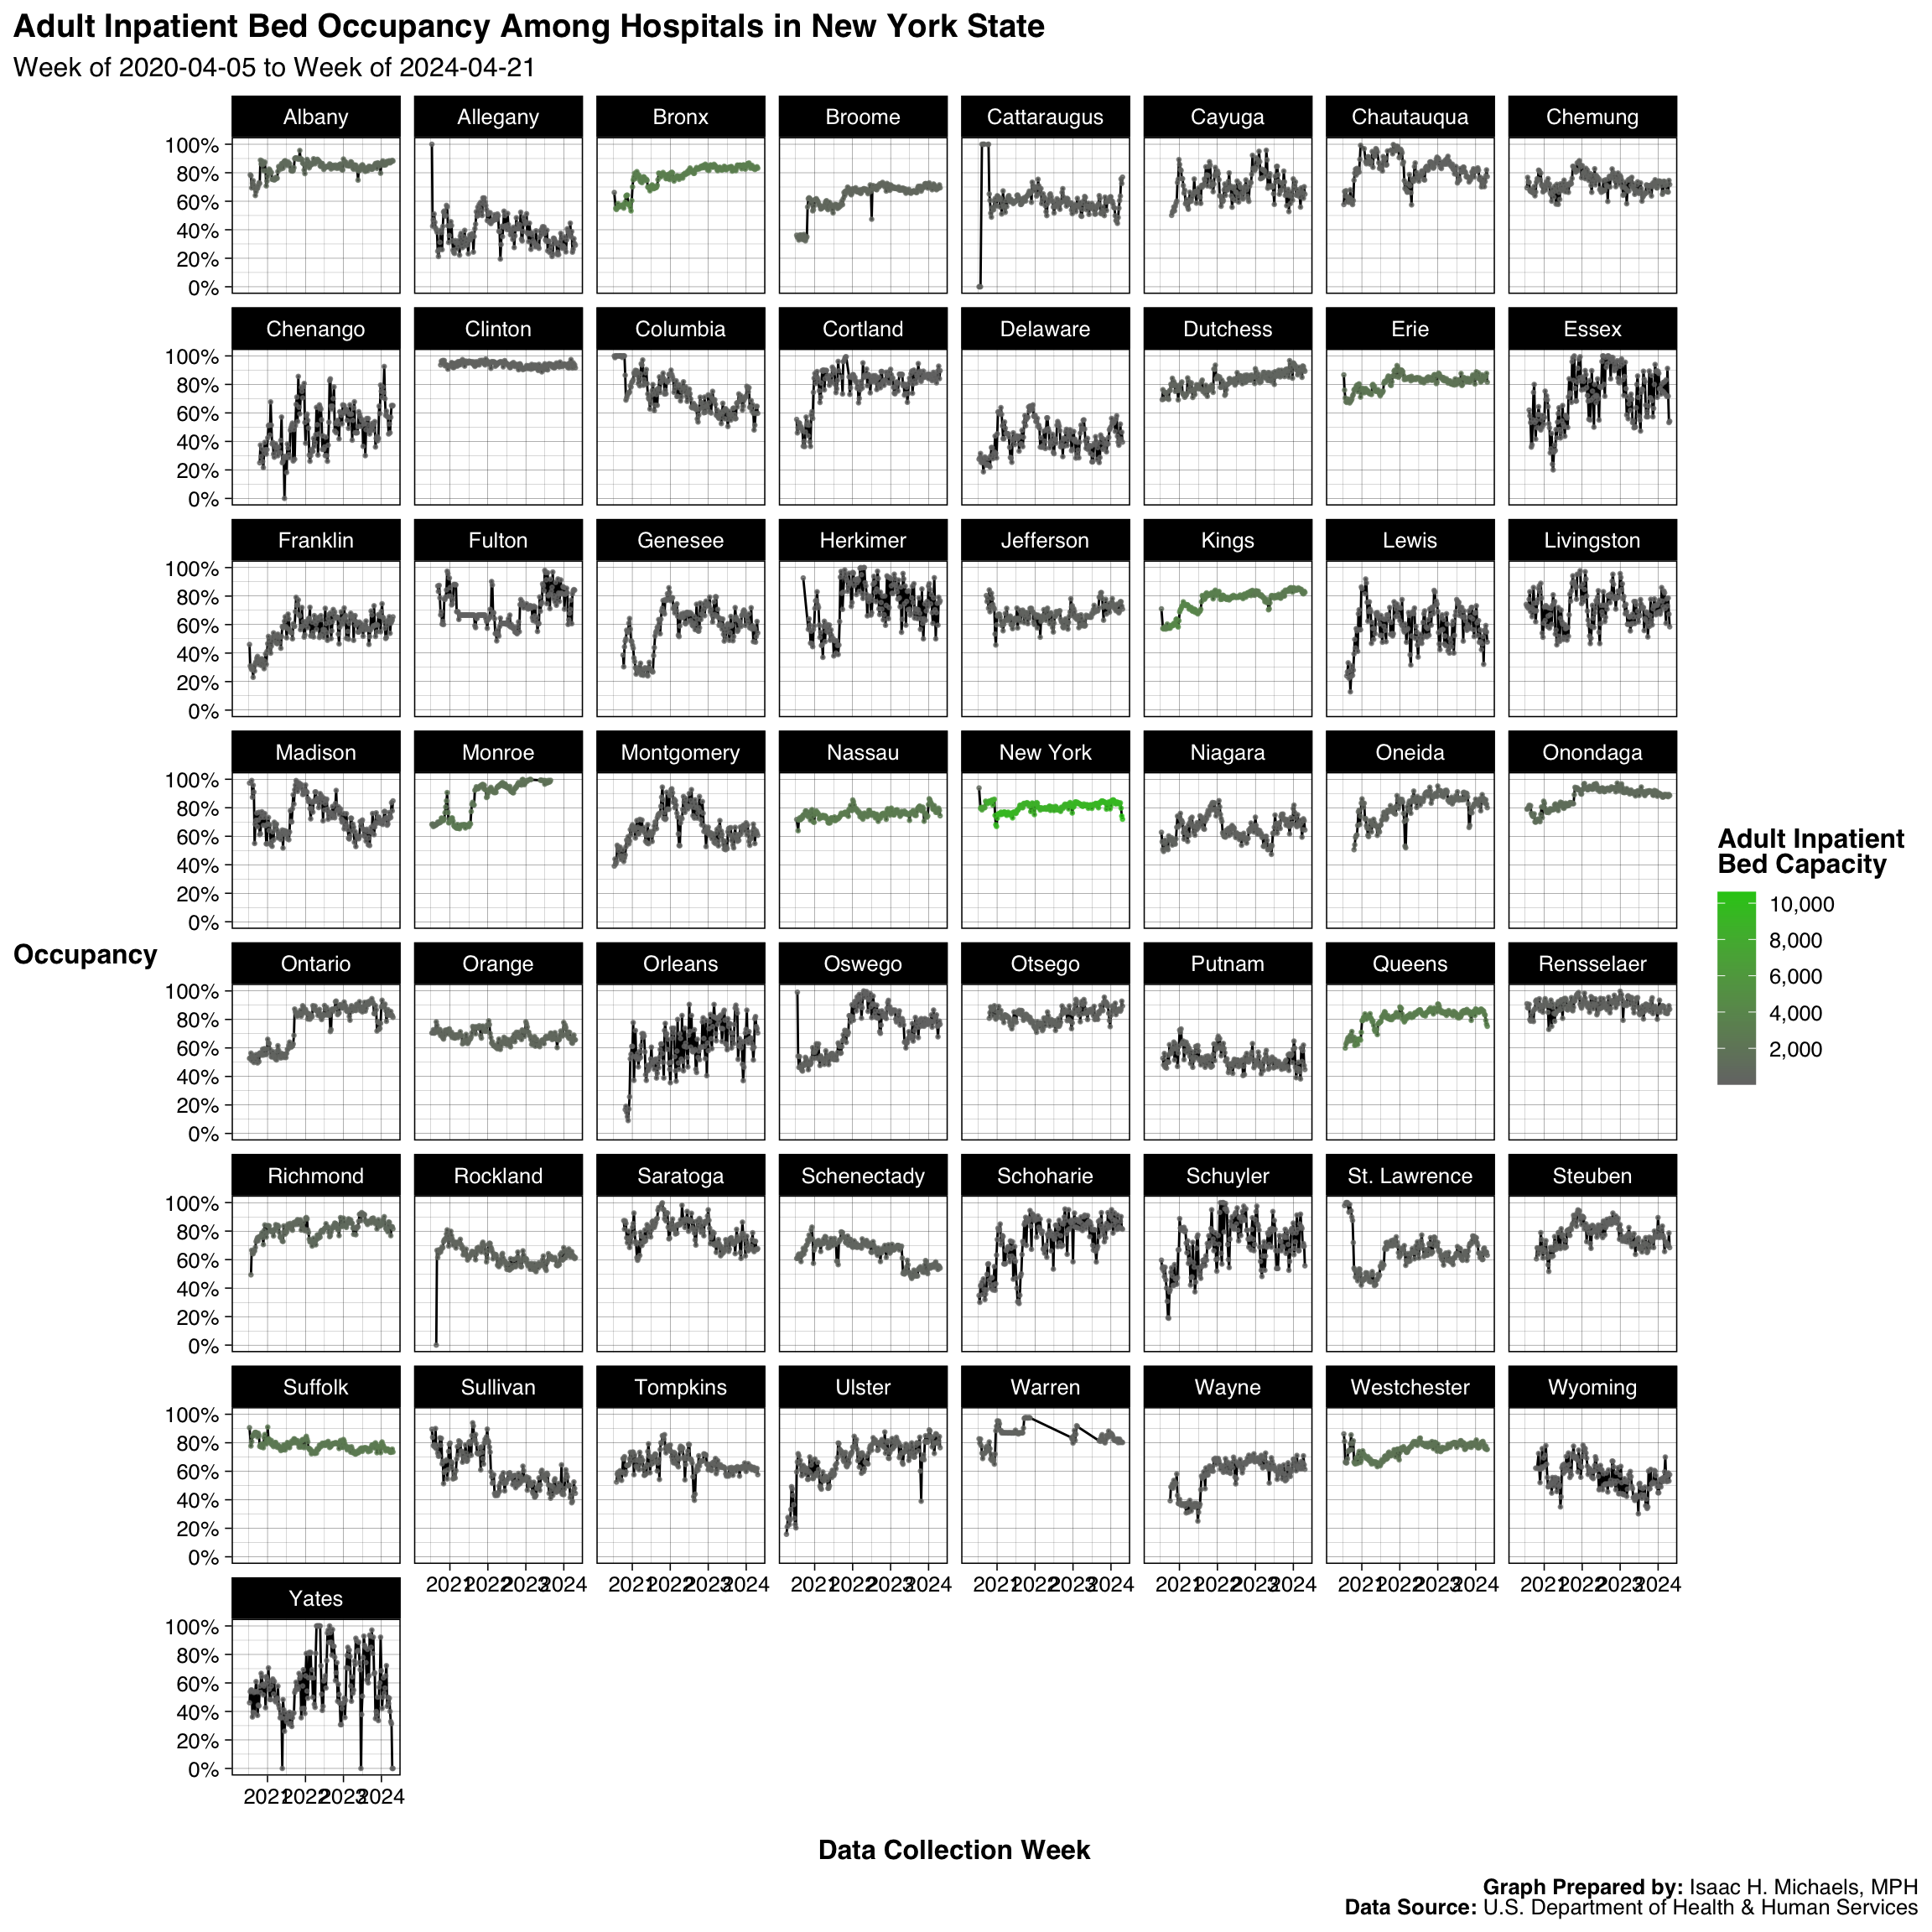 Graph Prepared By: Isaac H. Michaels, MPH
Death Data Source: U.S. Department of Health & Human Services
New York City, by Hospital
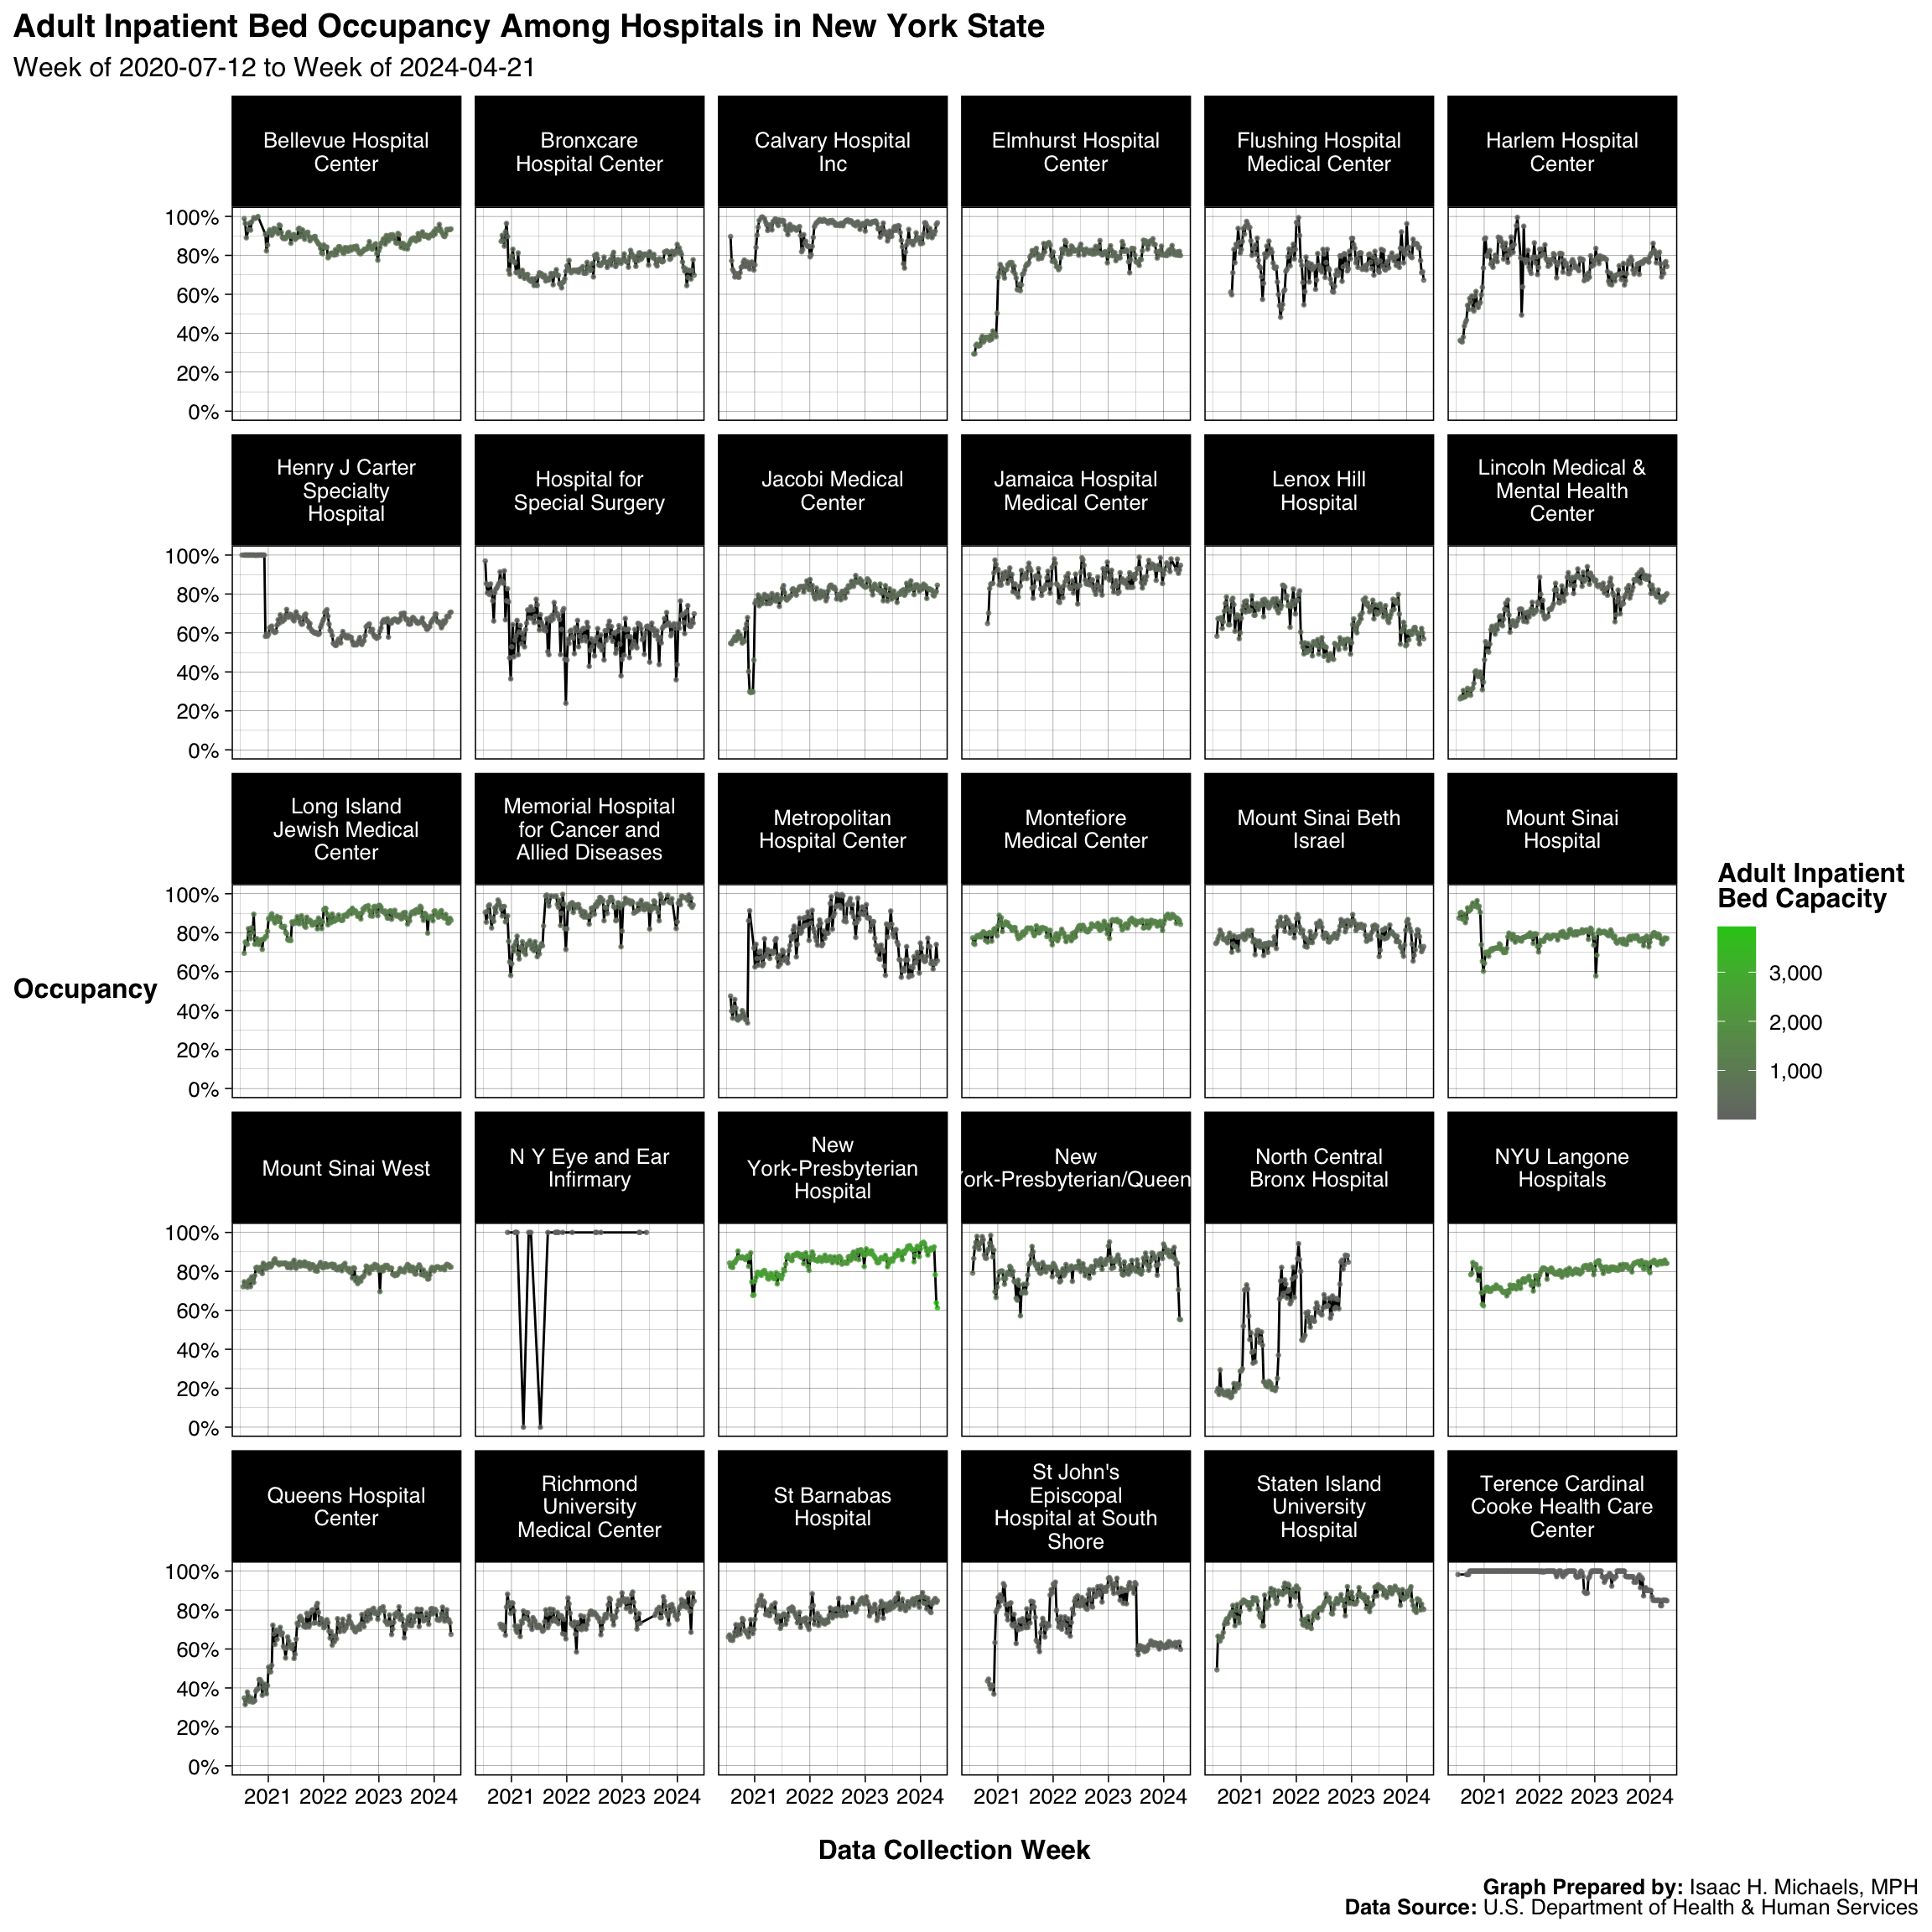 Graph Prepared By: Isaac H. Michaels, MPH
Death Data Source: U.S. Department of Health & Human Services
Pediatric Beds
Statewide
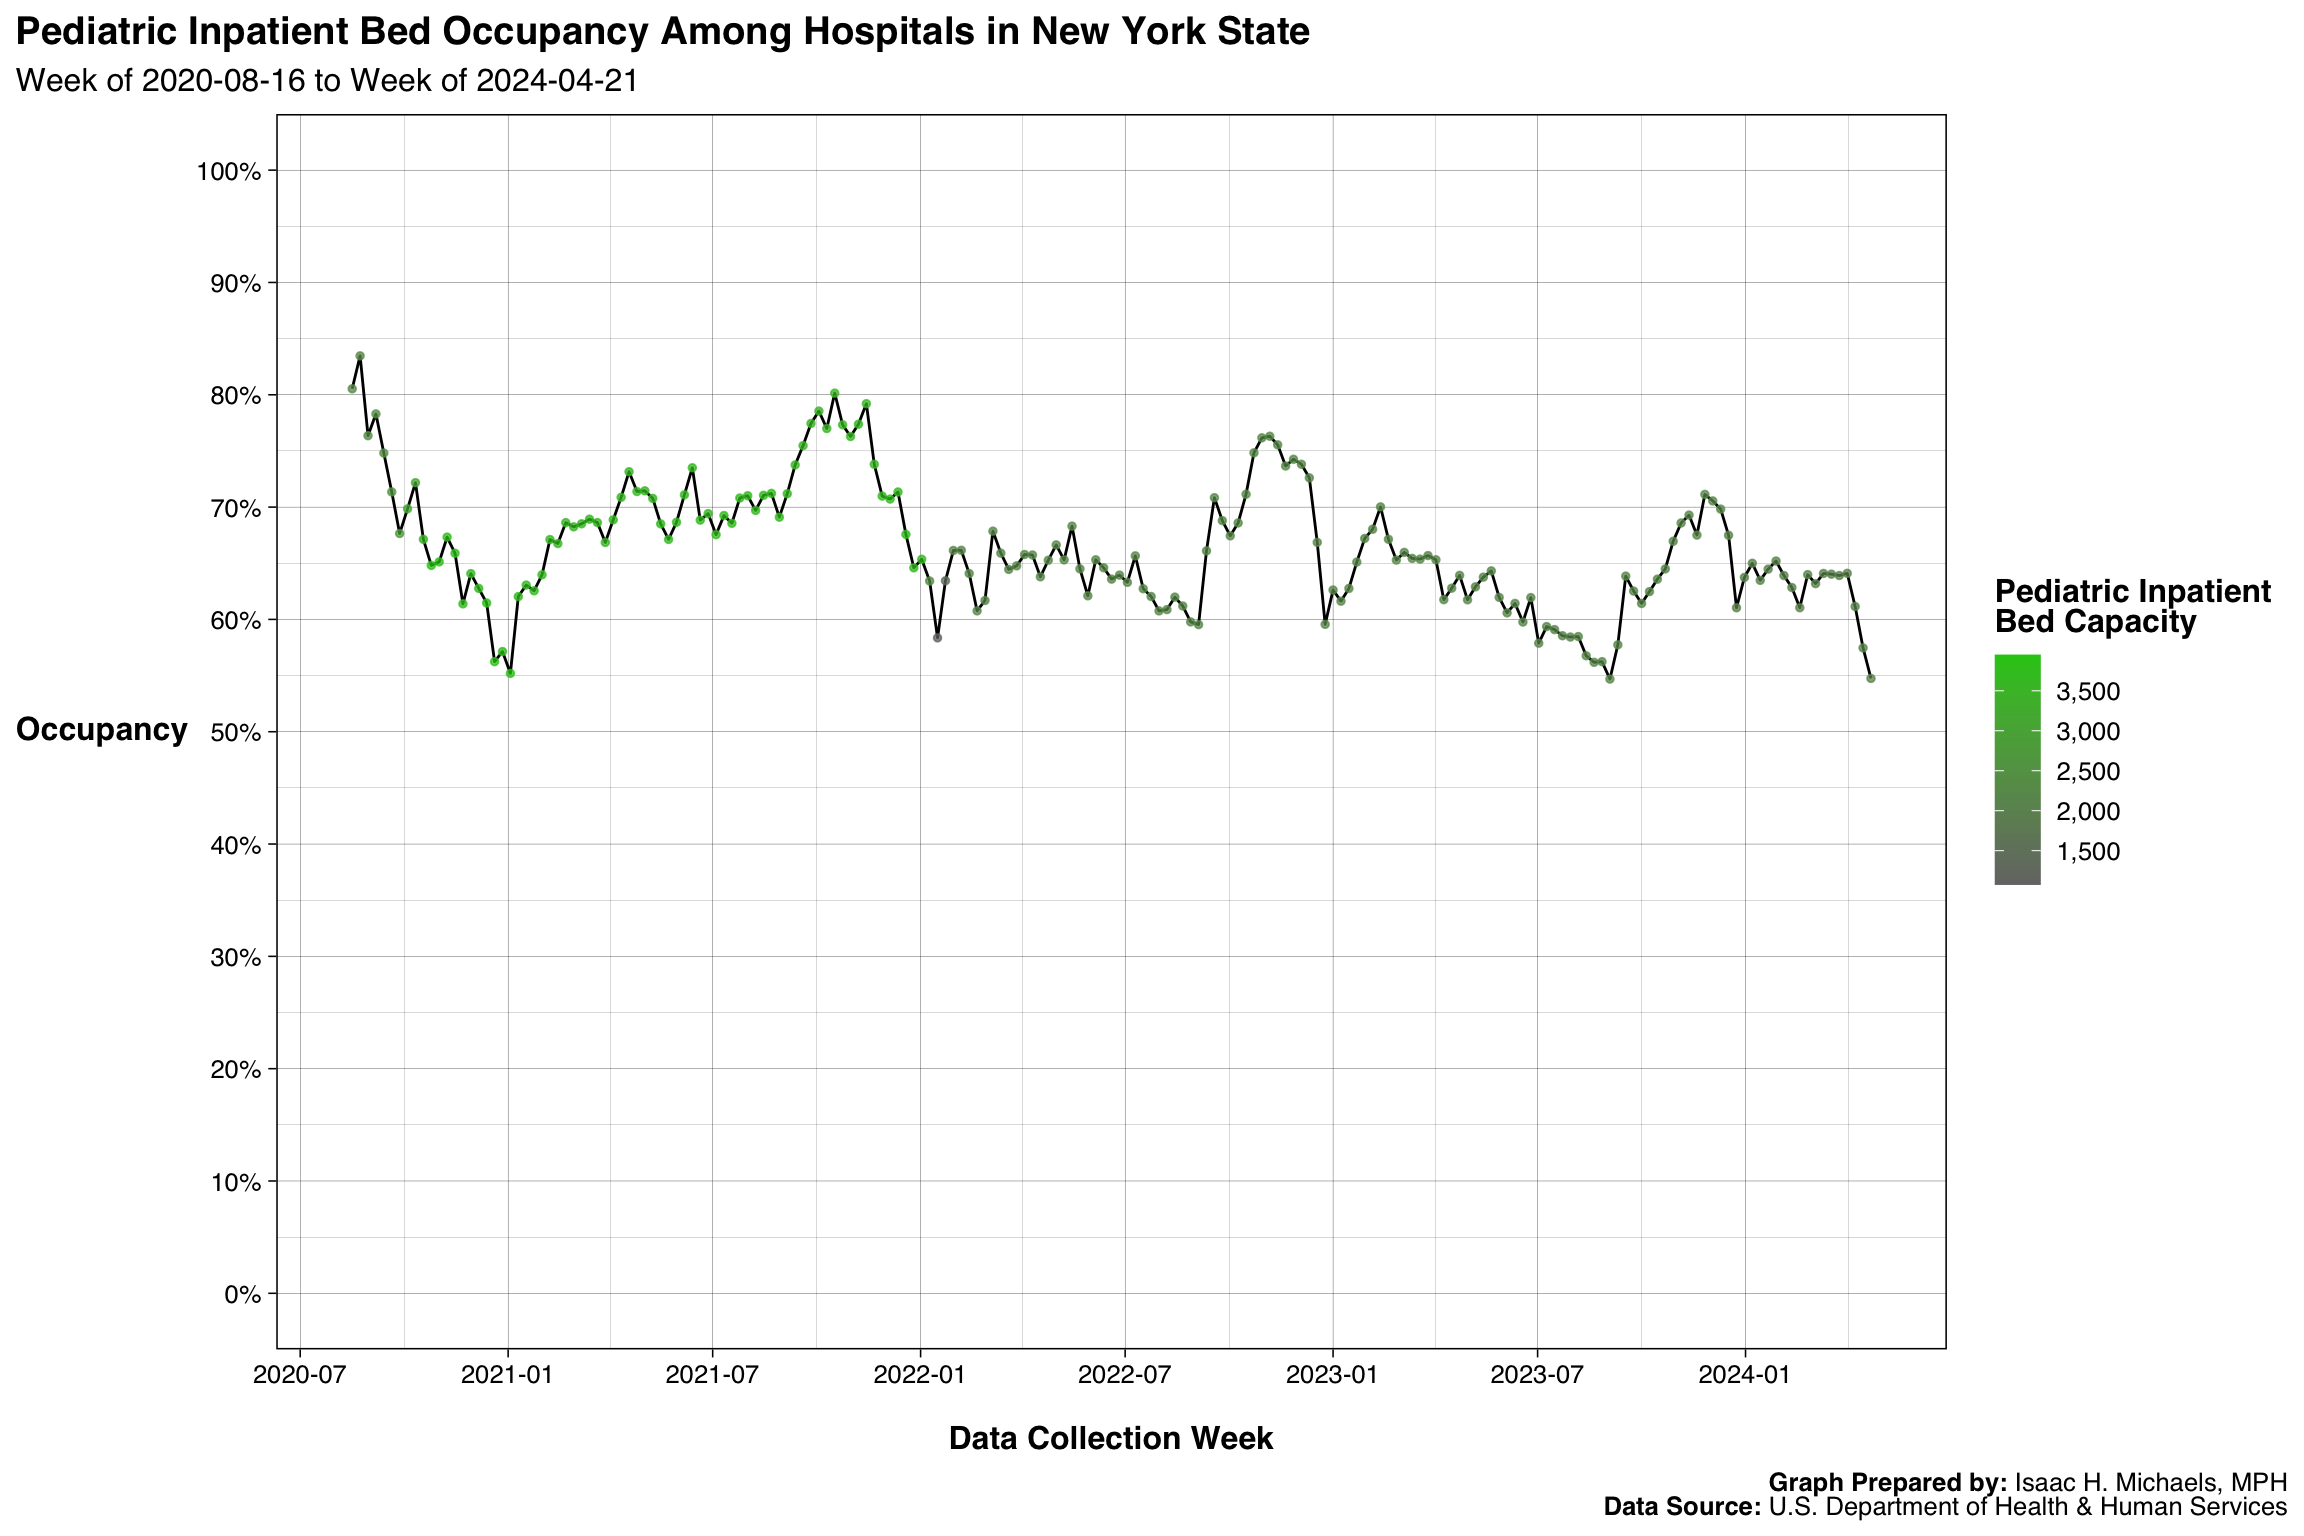 Graph Prepared By: Isaac H. Michaels, MPH
Death Data Source: U.S. Department of Health & Human Services
New York State, by County
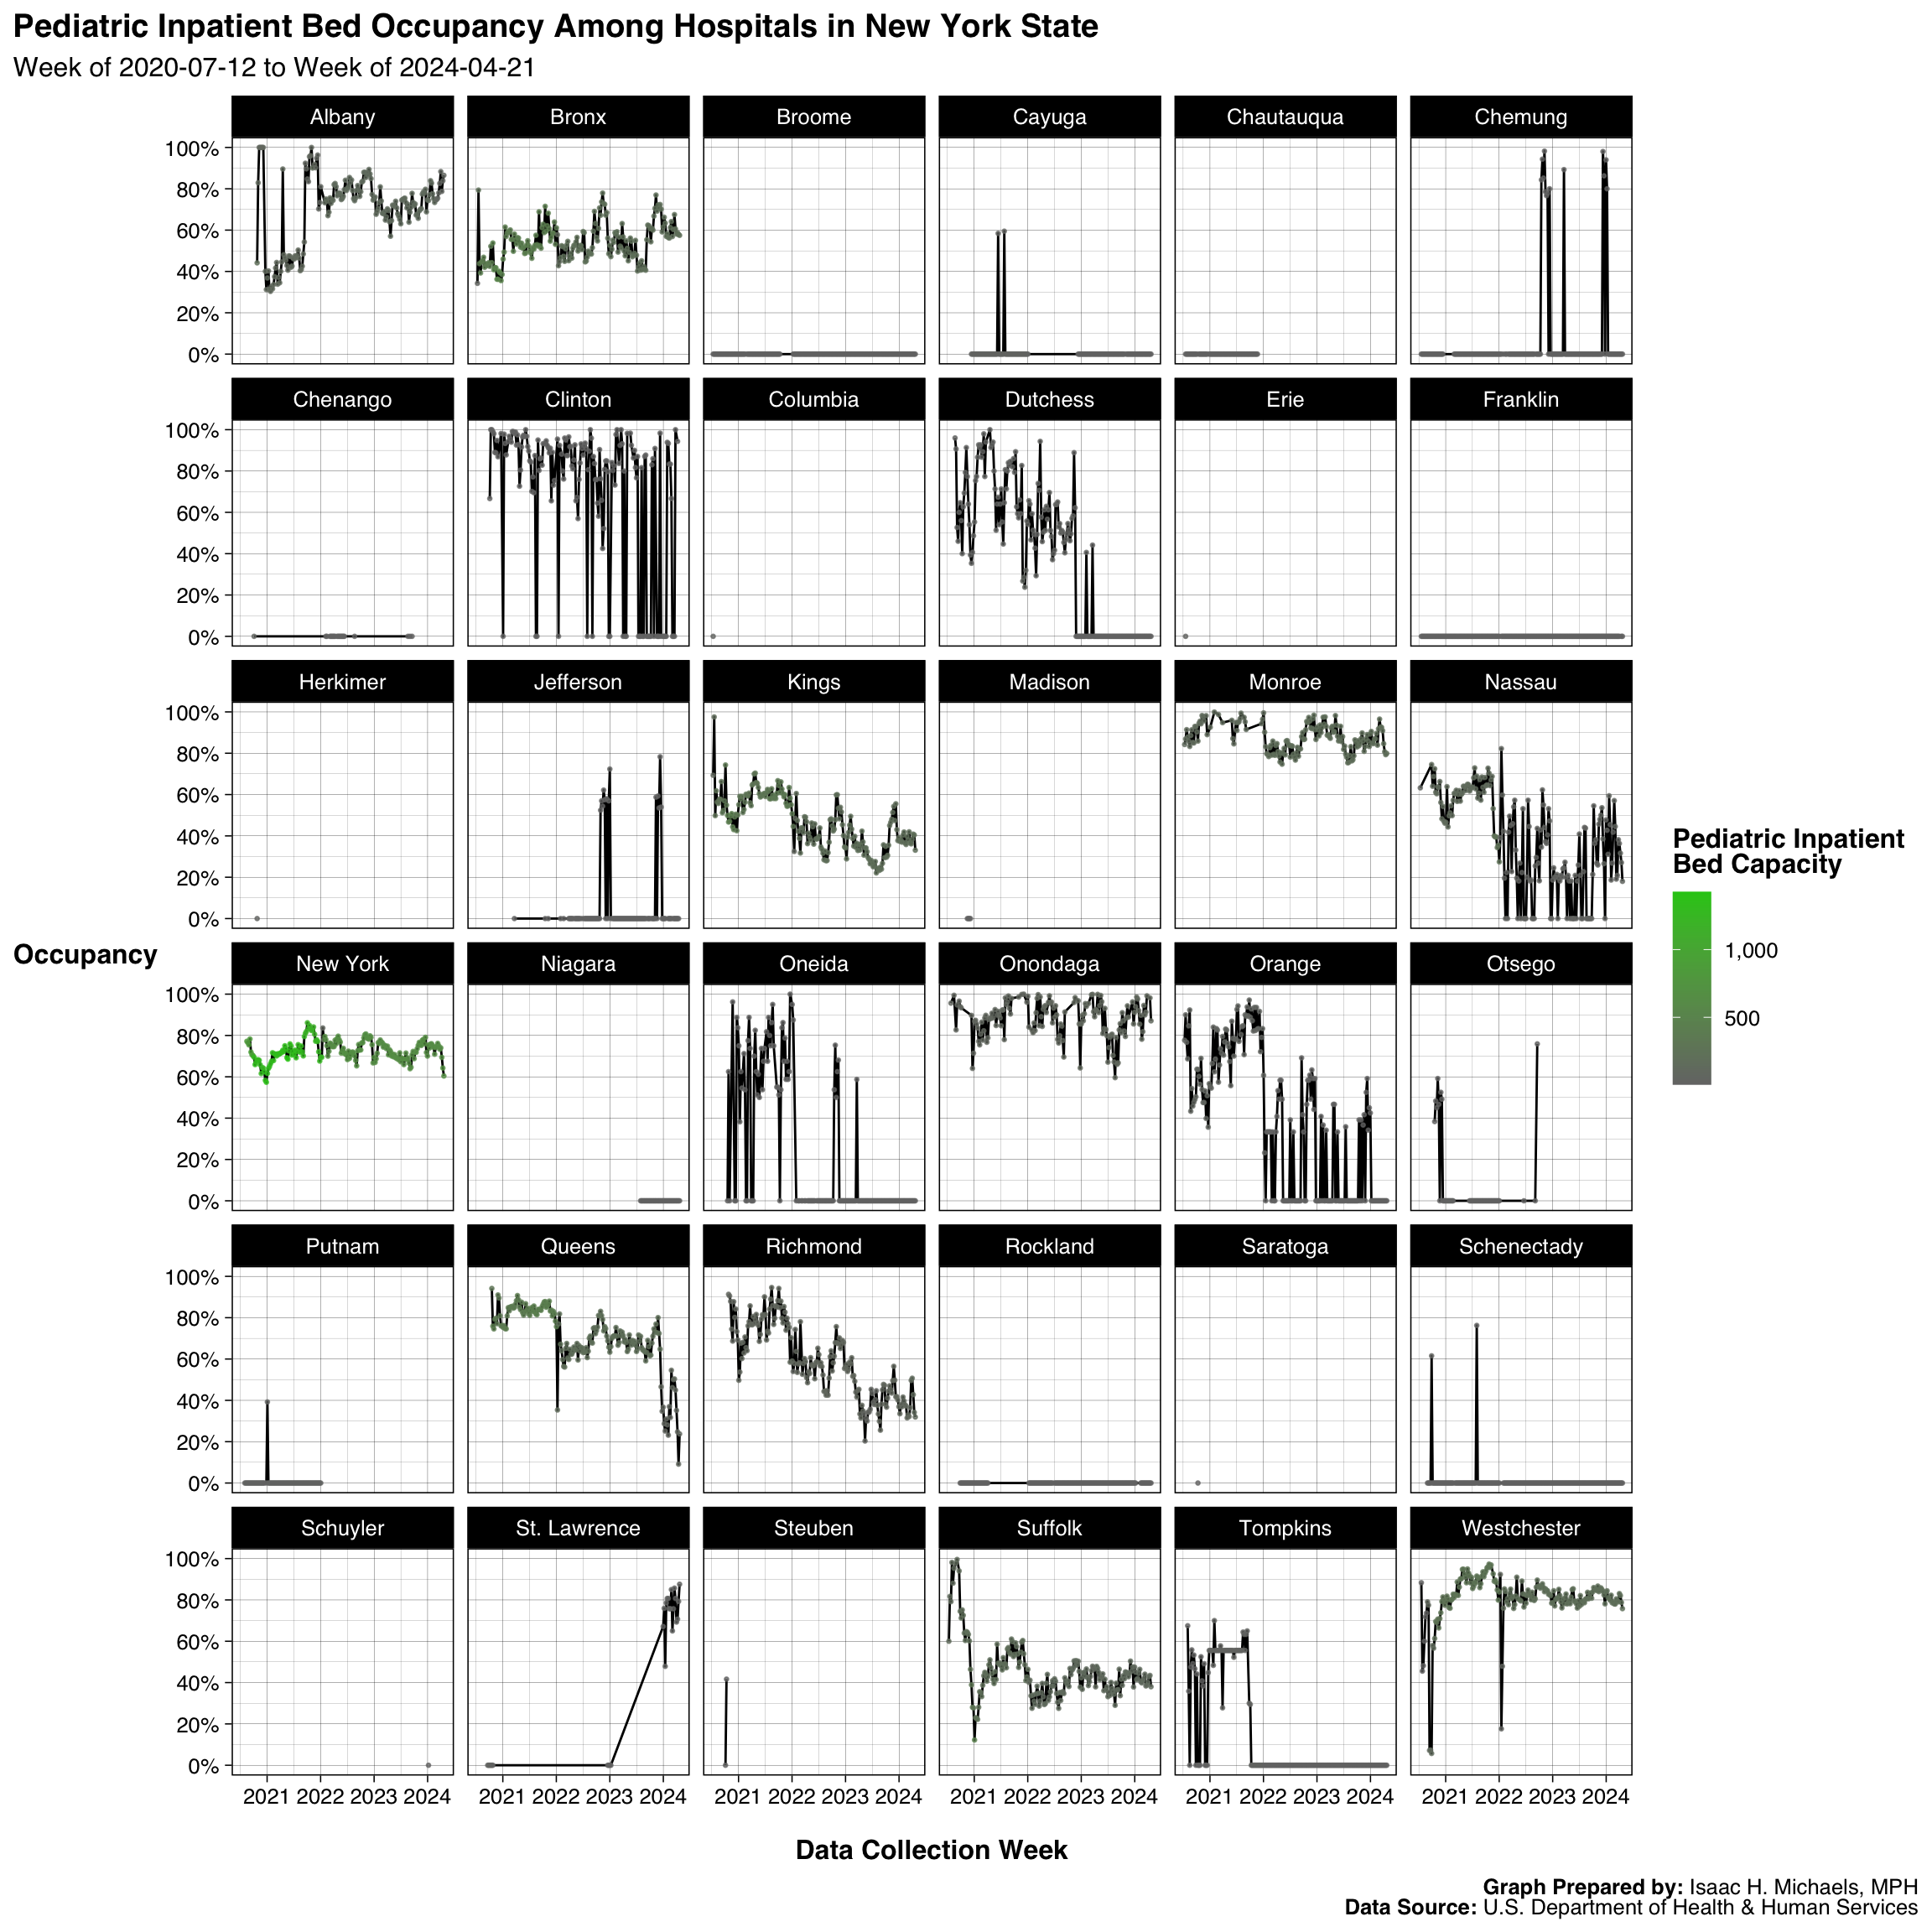 Graph Prepared By: Isaac H. Michaels, MPH
Death Data Source: U.S. Department of Health & Human Services
New York City, by Hospital
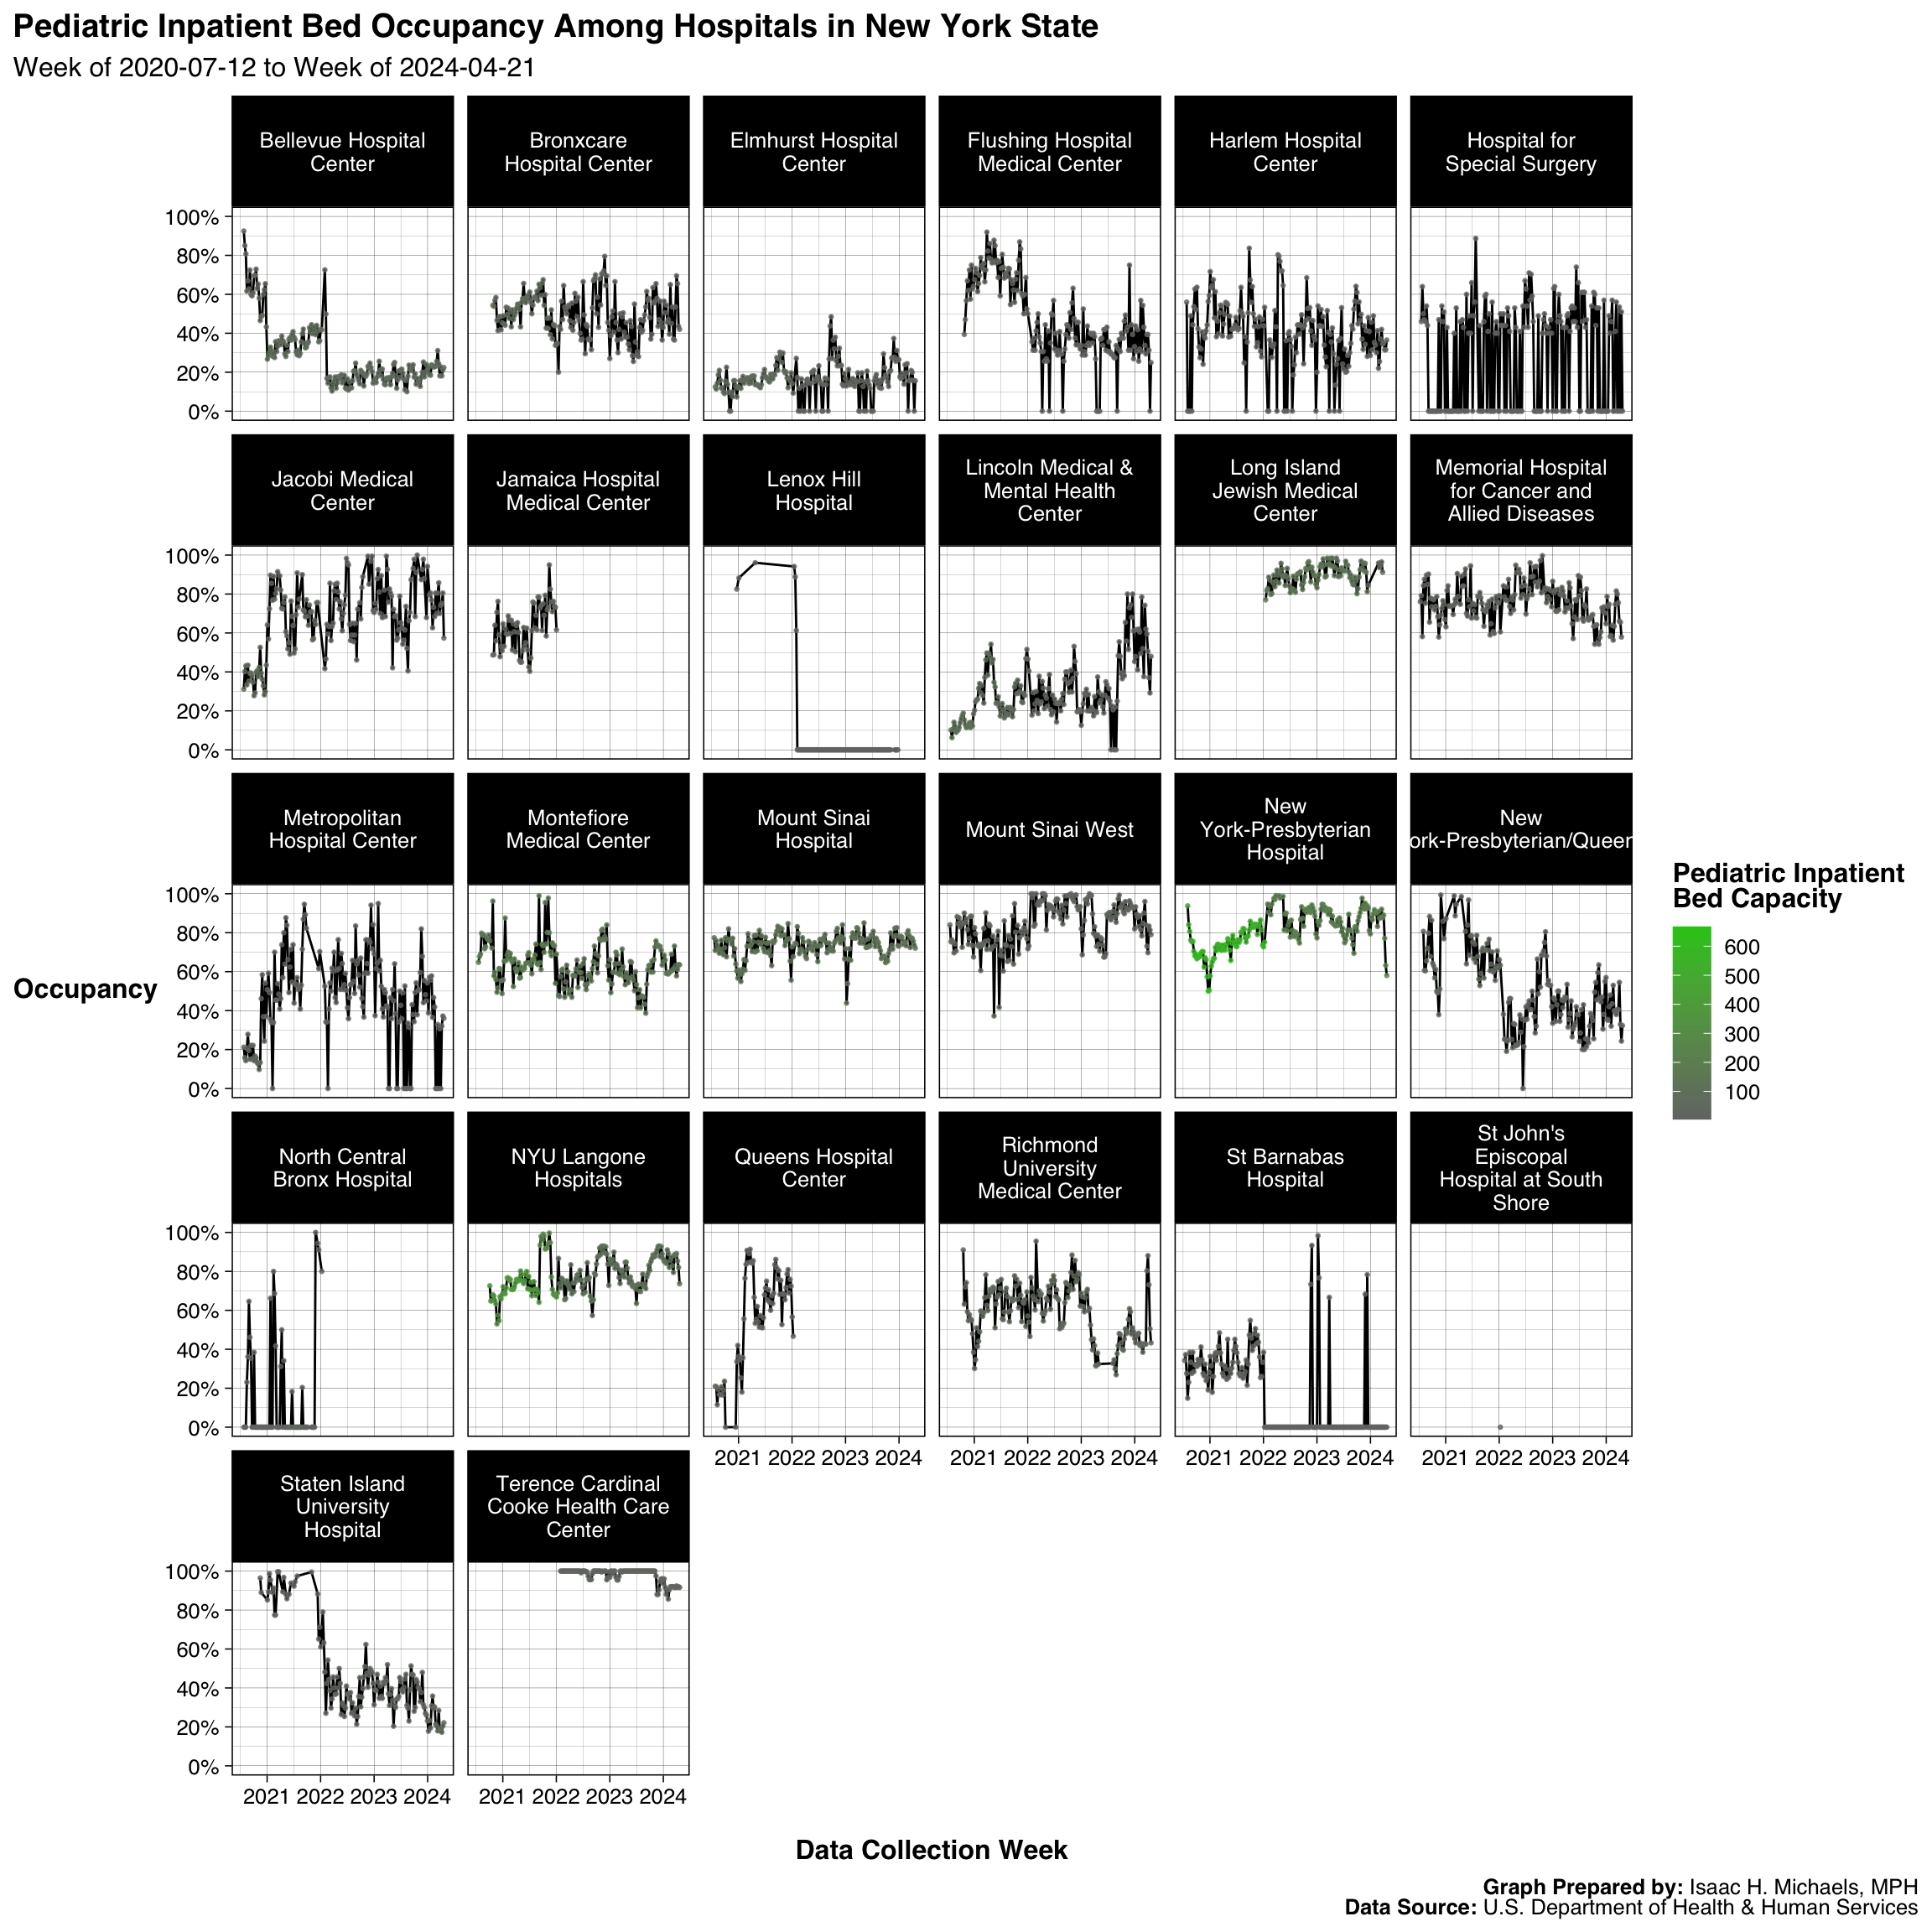 Graph Prepared By: Isaac H. Michaels, MPH
Death Data Source: U.S. Department of Health & Human Services