- Welcome
- Data Overview
- How to Use These Data
- Why Are These Data Important?
- What Do These Data Show?
- What Do These Data Not Show?
- Implications for Public Health Practice
- Heat Map
- Cumulative Cases
- Longitudinal Trends
- Chlamydia trachomatis infection
- Gonorrhea
- Campylobacteriosis
- Shigellosis
- Salmonellosis (excluding Salmonella Typhi infection and Salmonella Paratyphi infection)
- Giardiasis
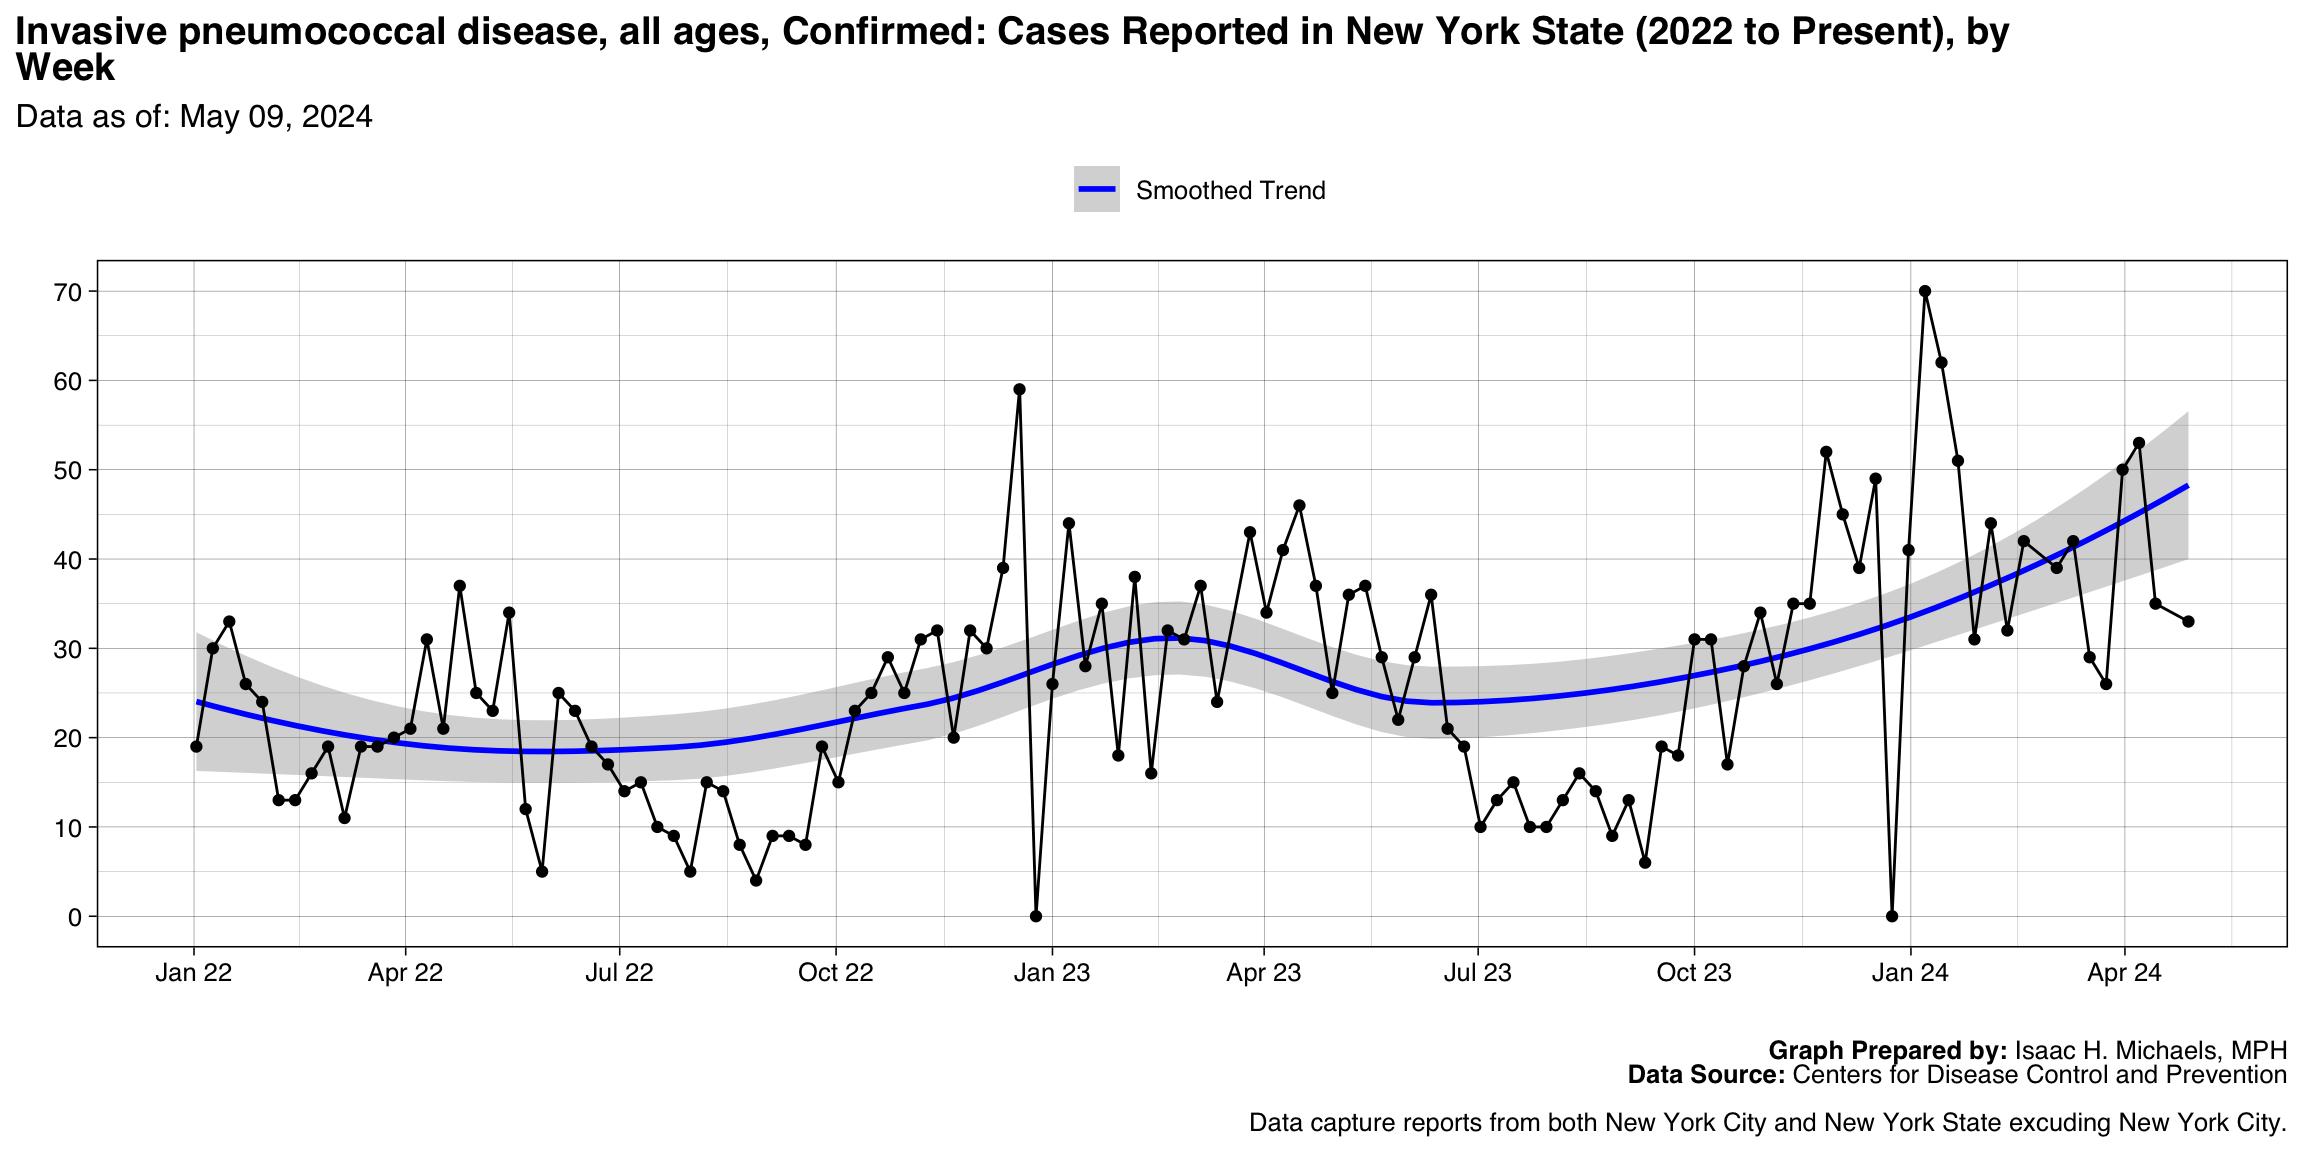
- Invasive pneumococcal disease, all ages, Confirmed
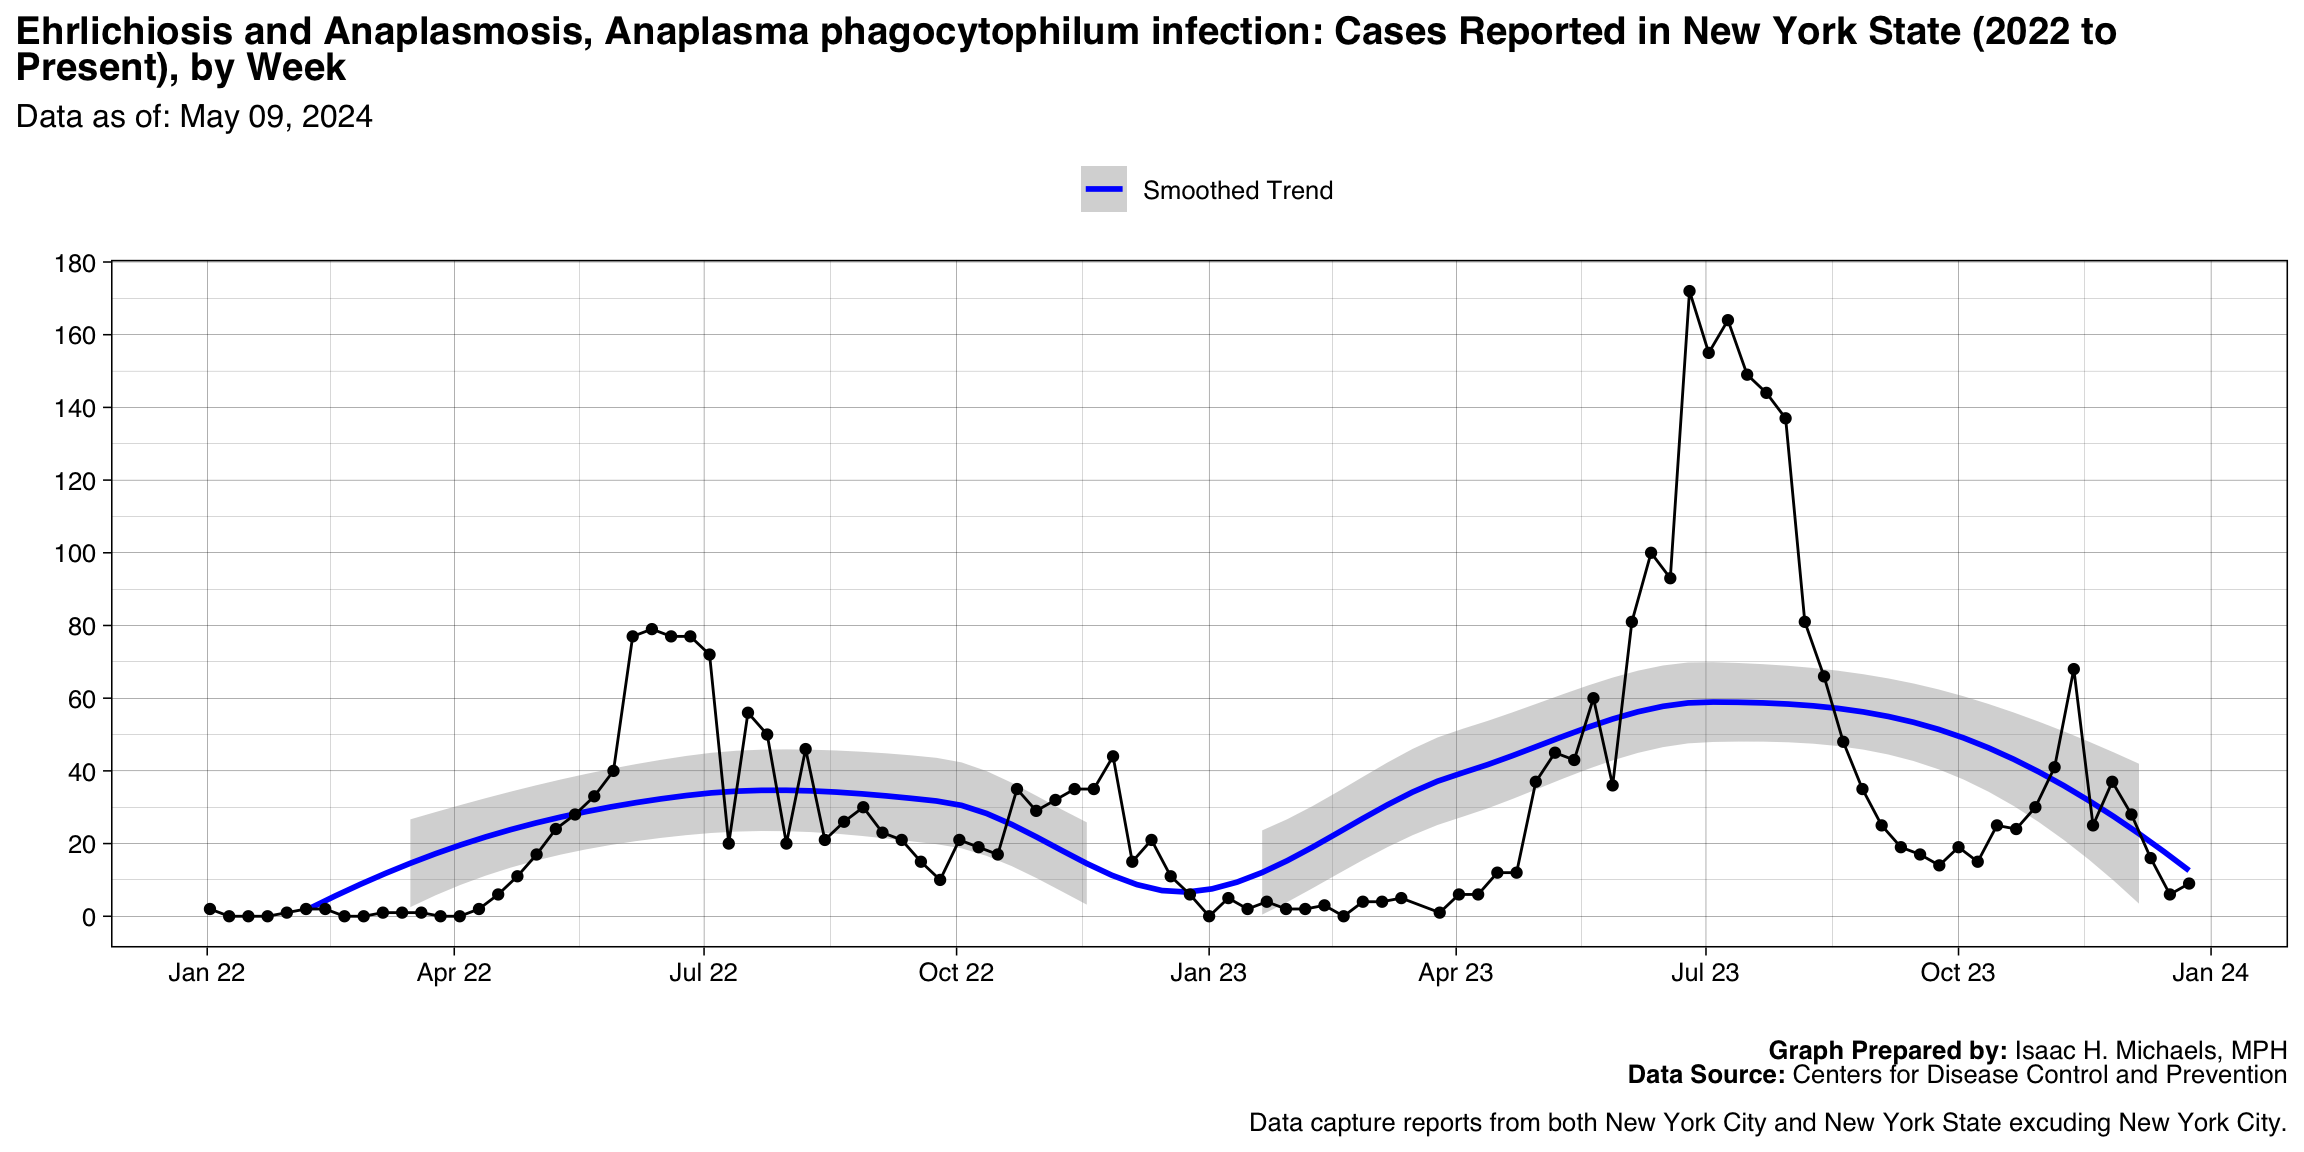
- Ehrlichiosis and Anaplasmosis, Anaplasma phagocytophilum infection
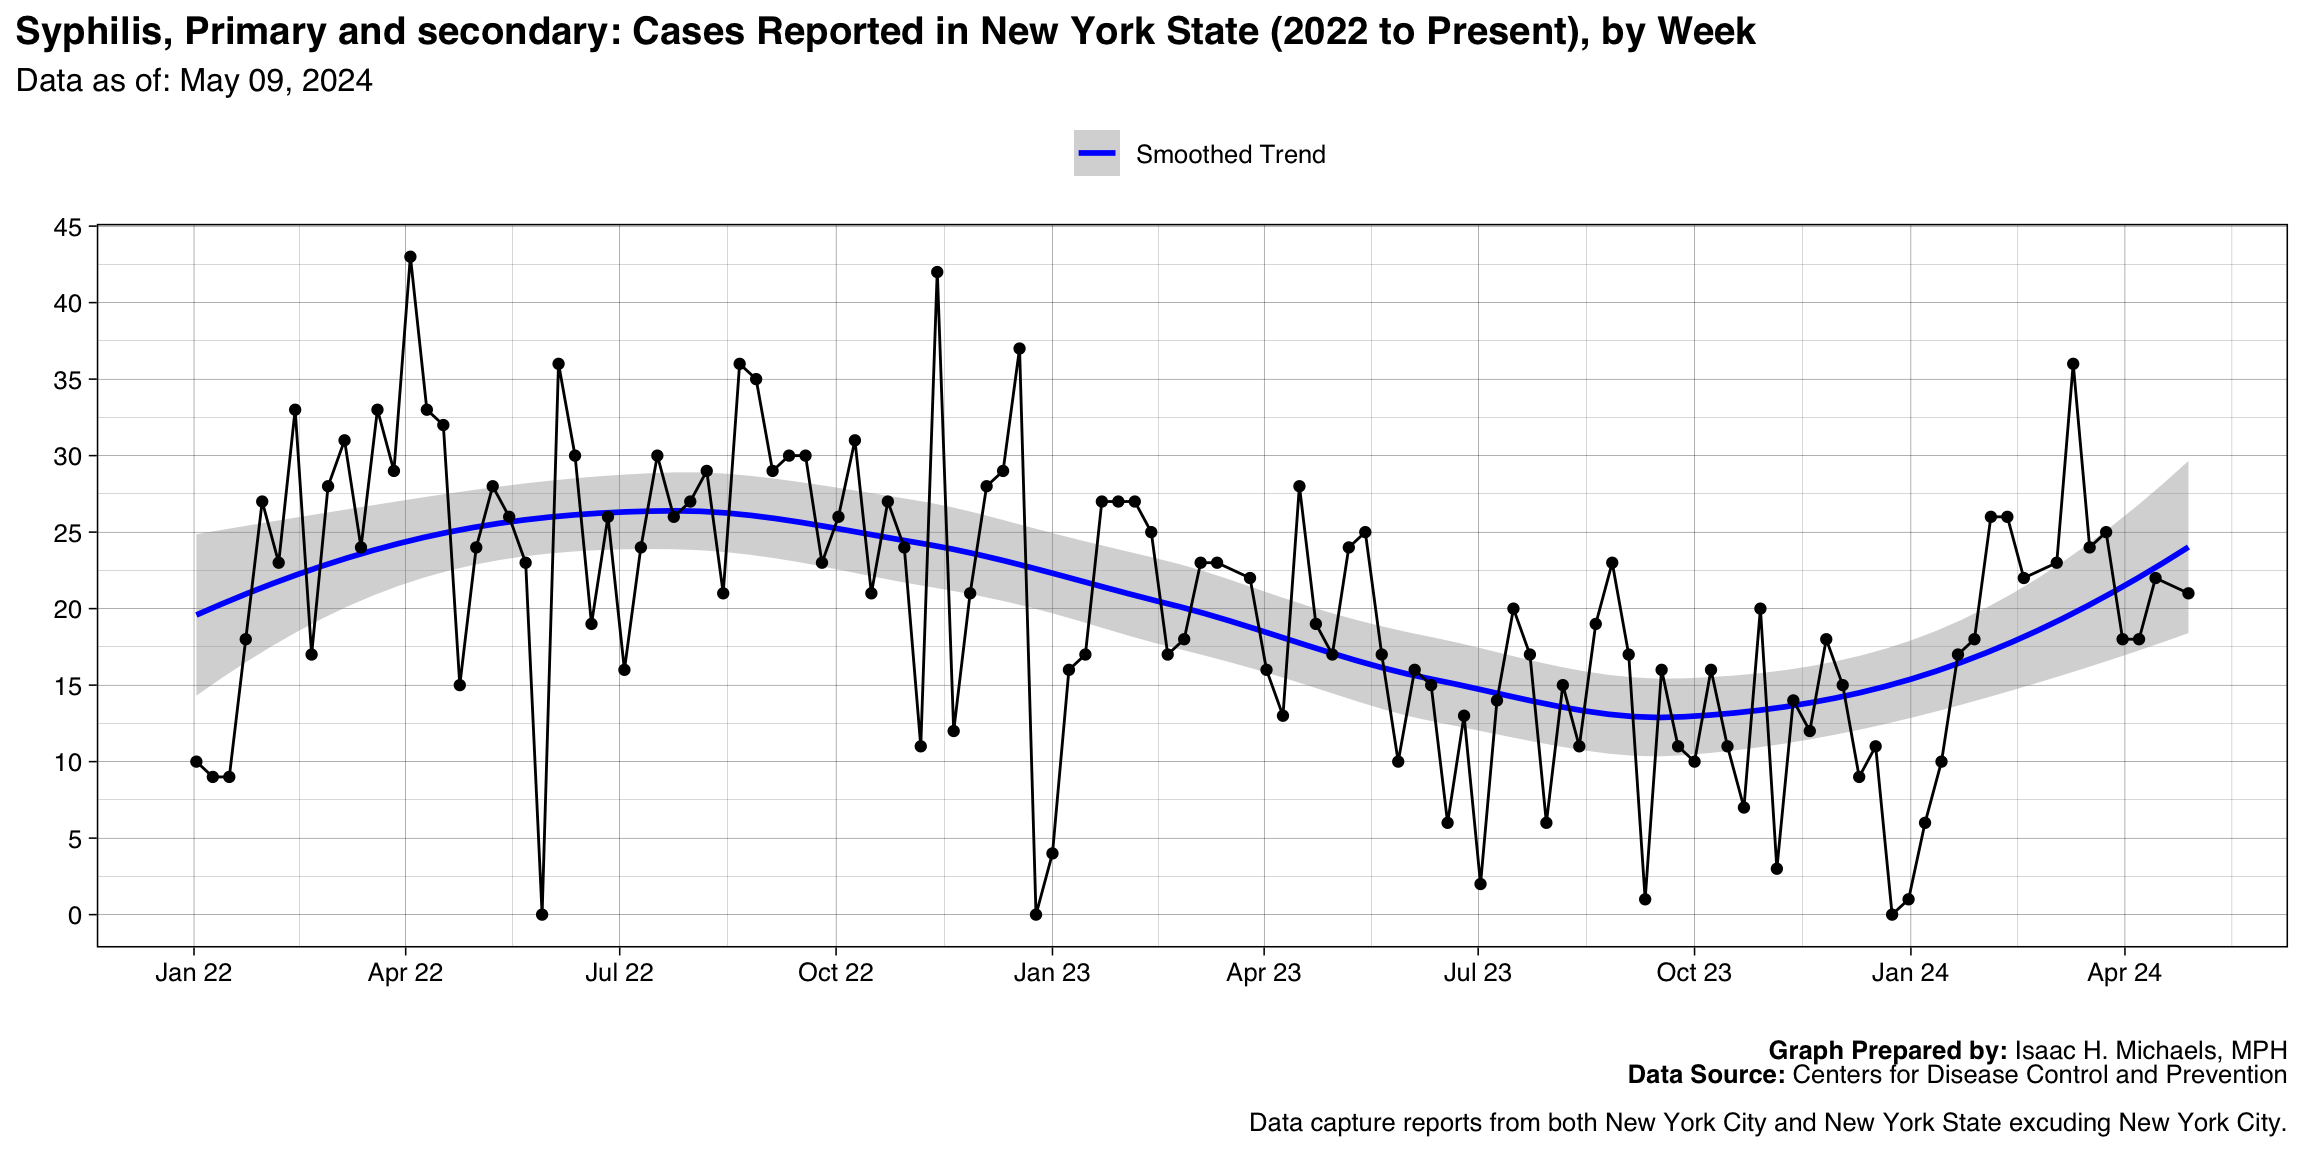
- Syphilis, Primary and secondary
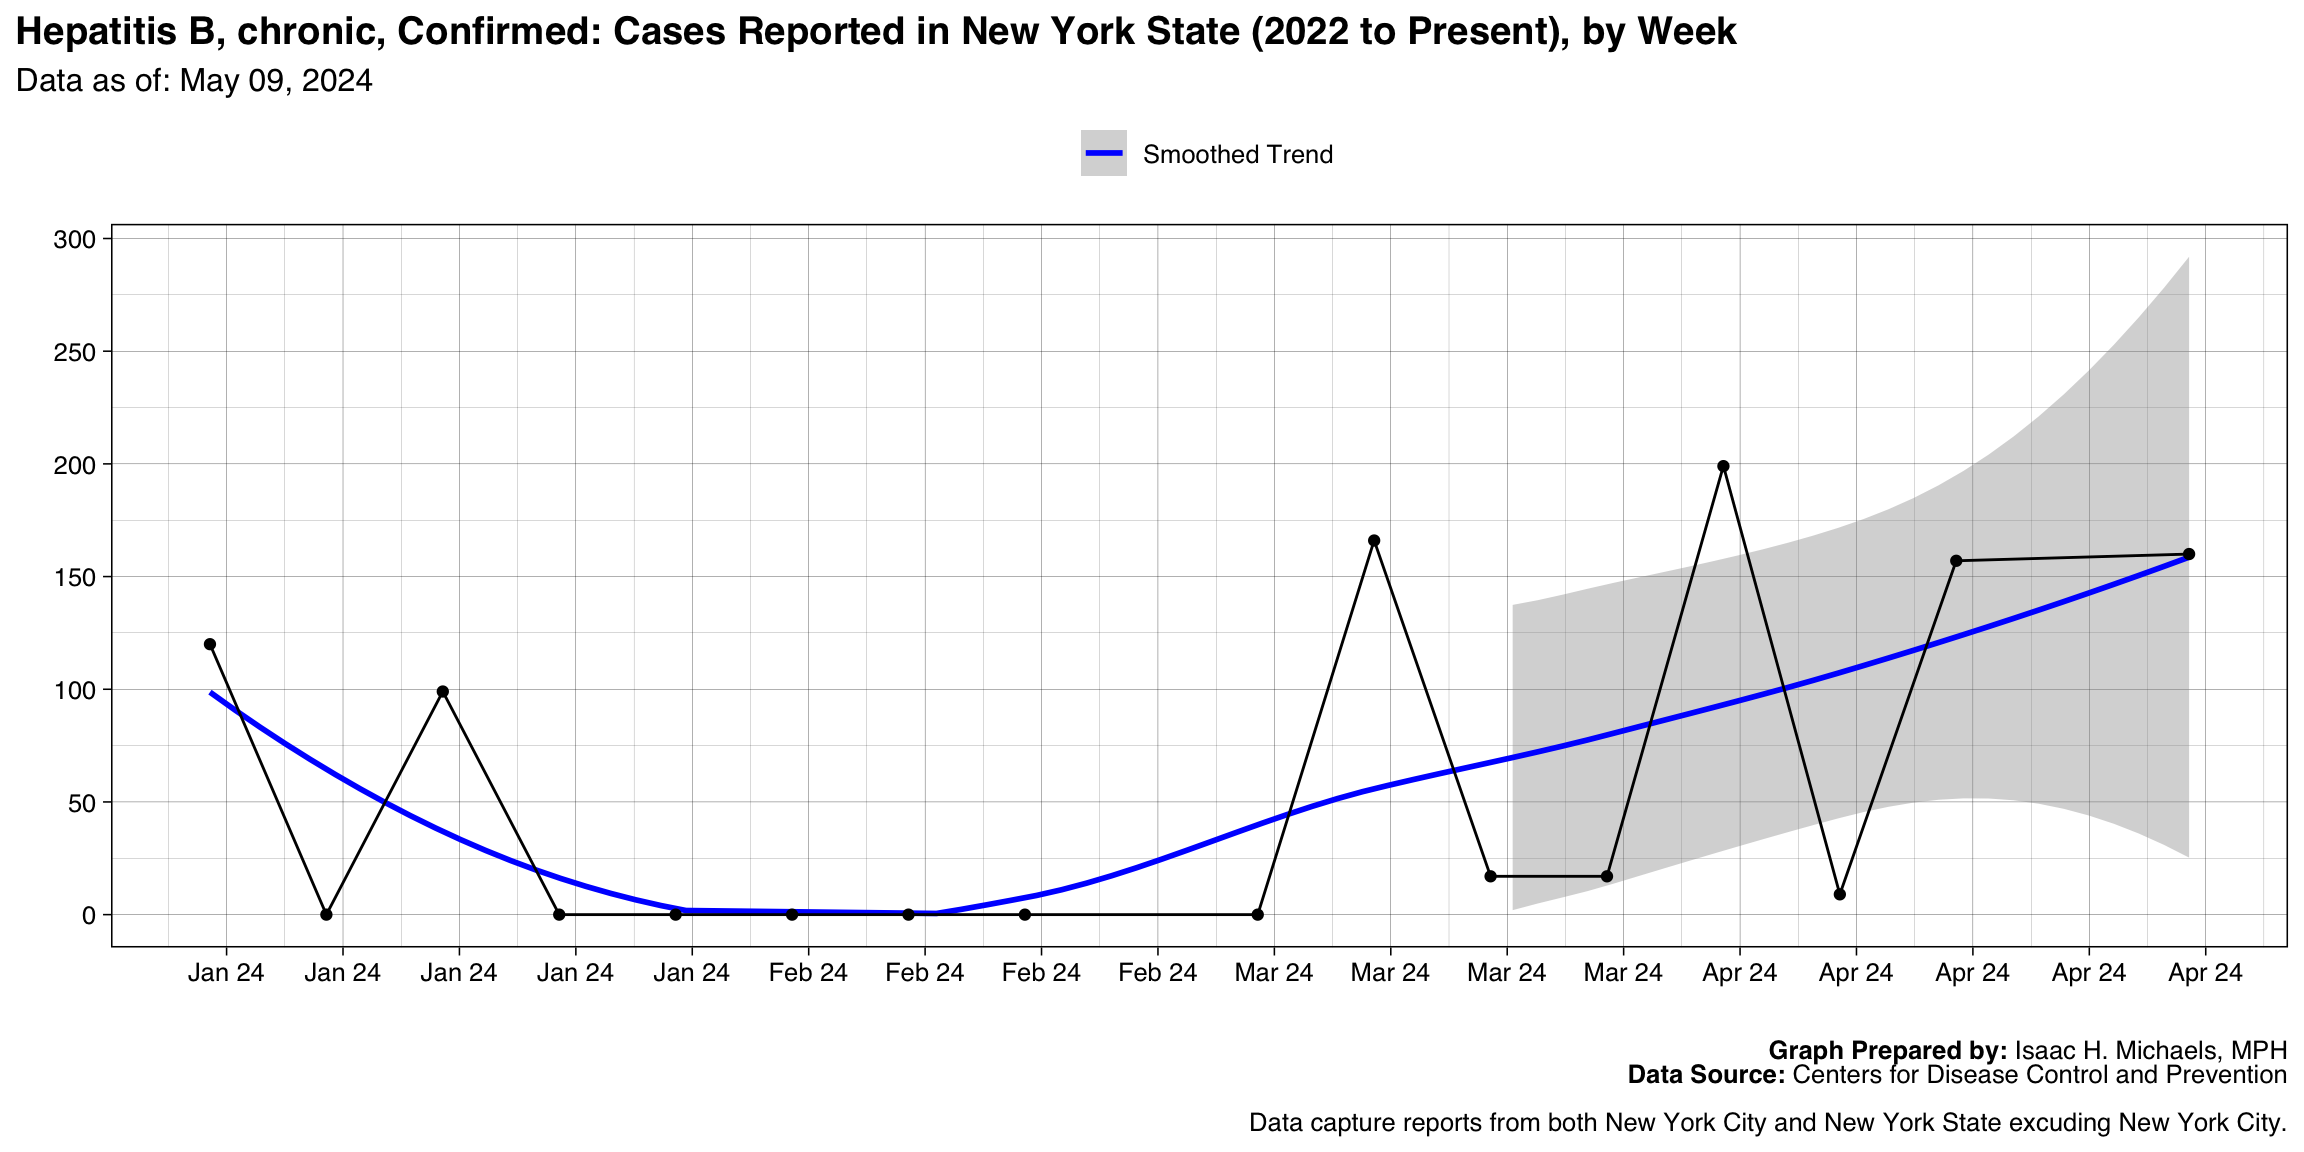
- Hepatitis B, chronic, Confirmed
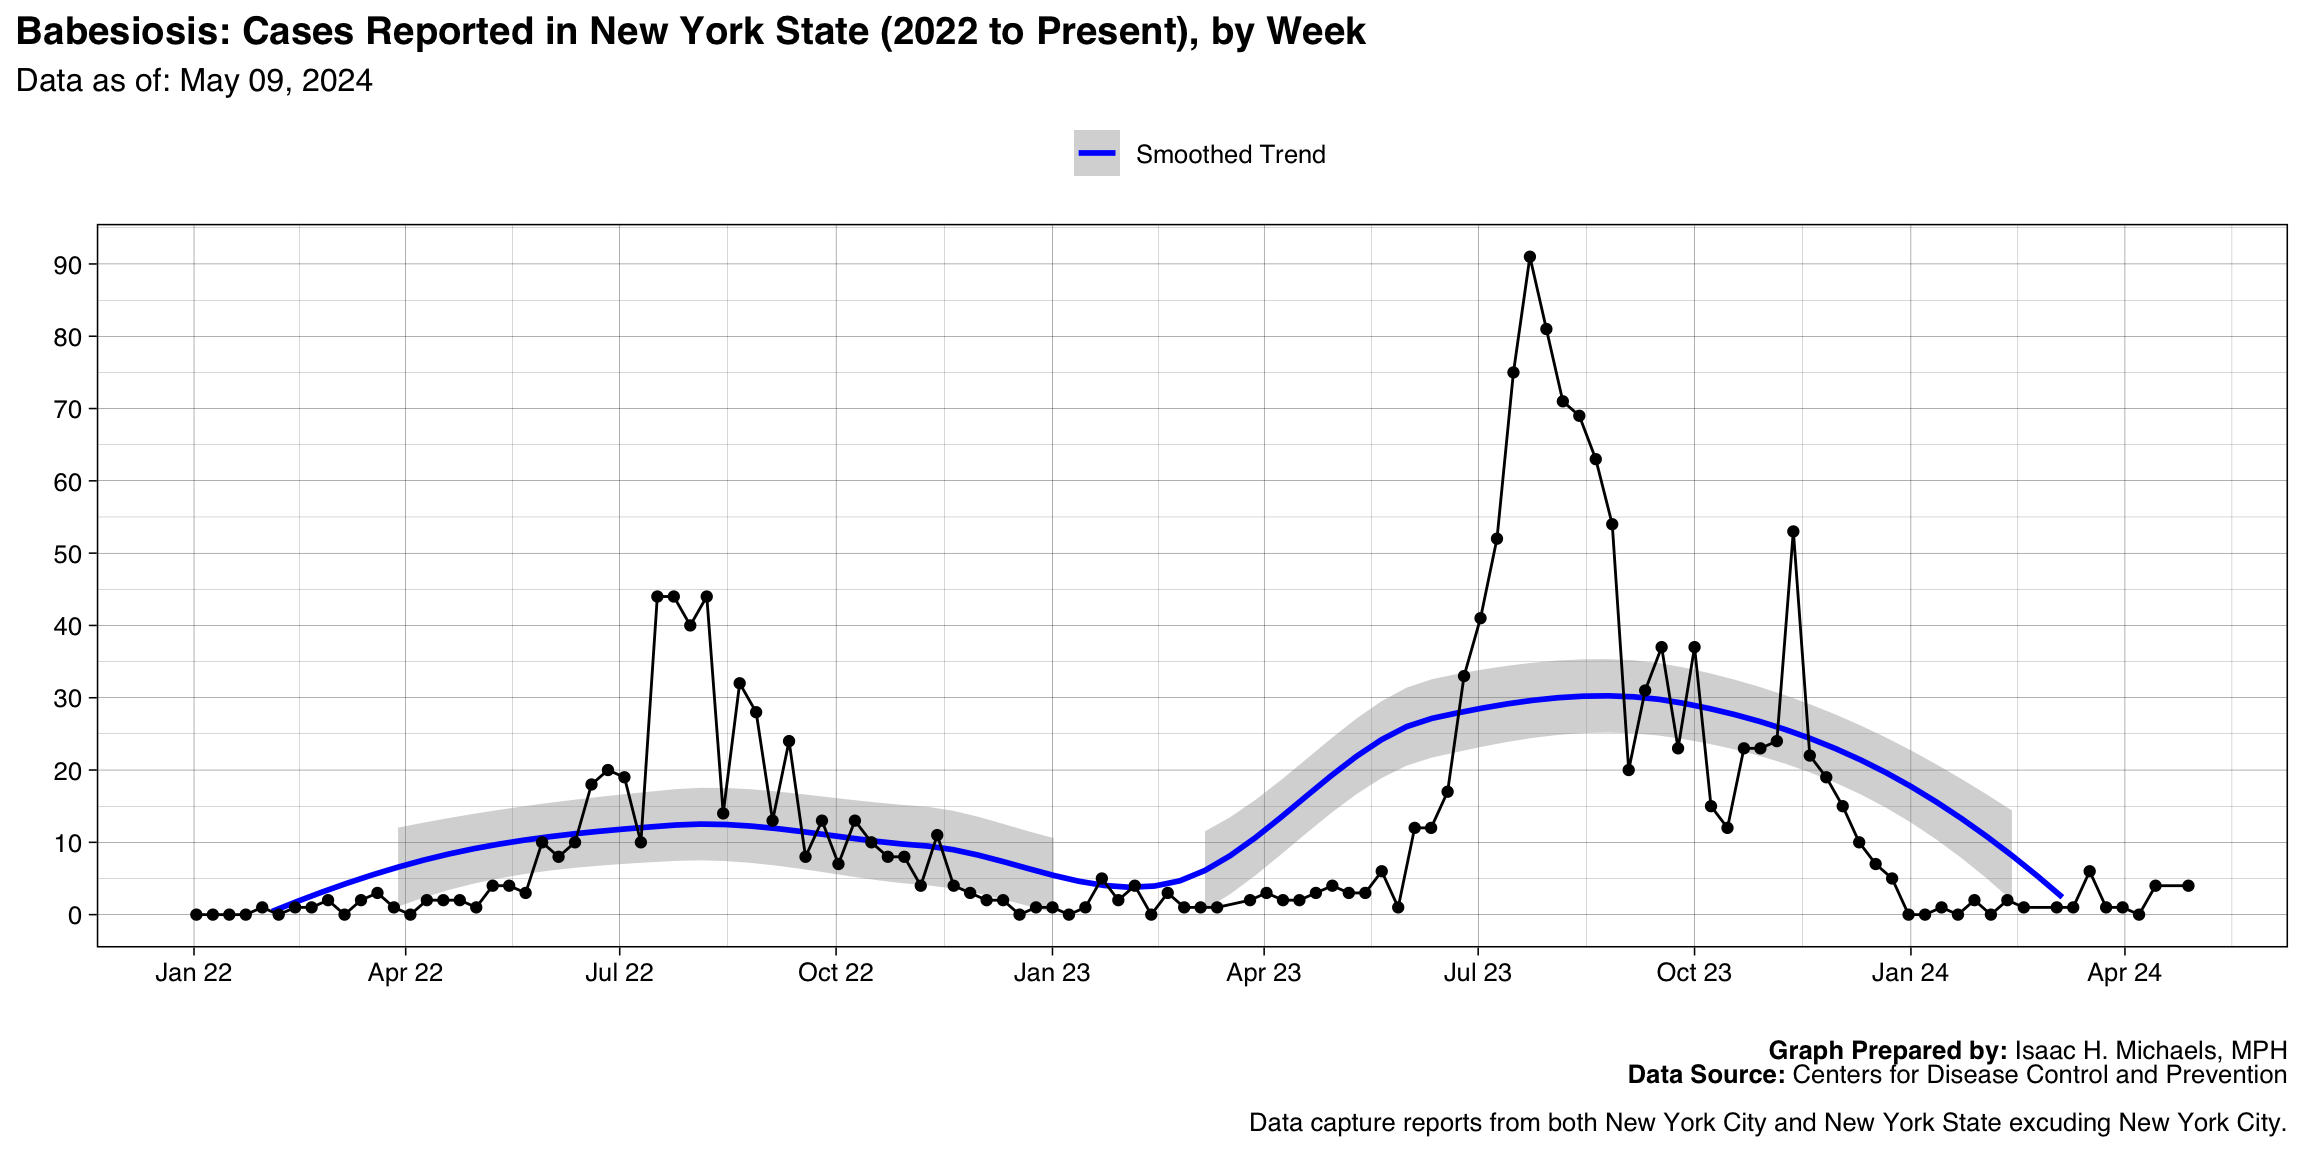
- Babesiosis
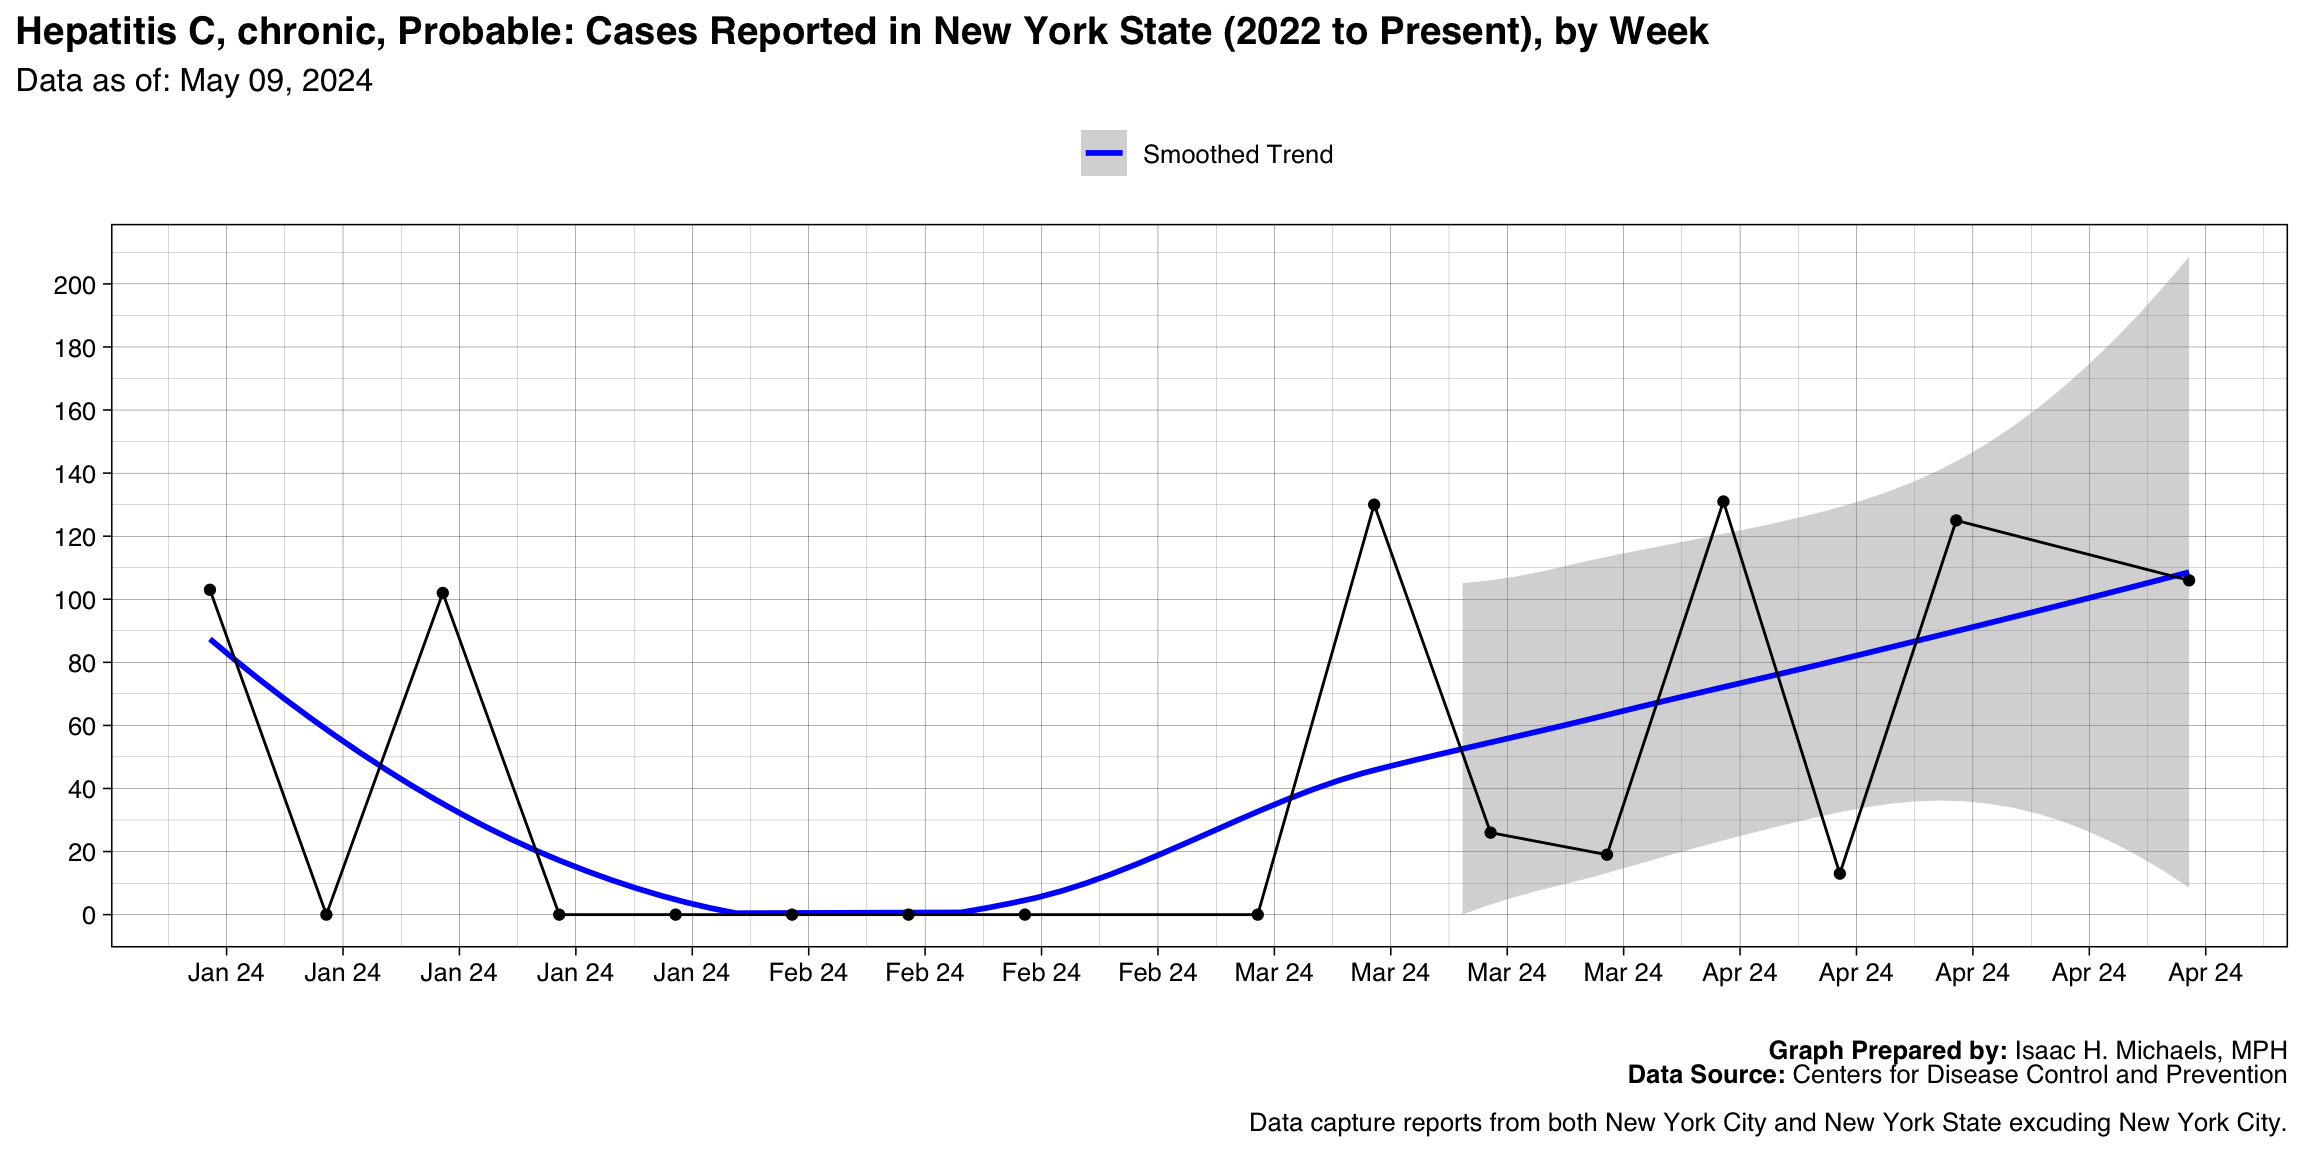
- Hepatitis C, chronic, Probable
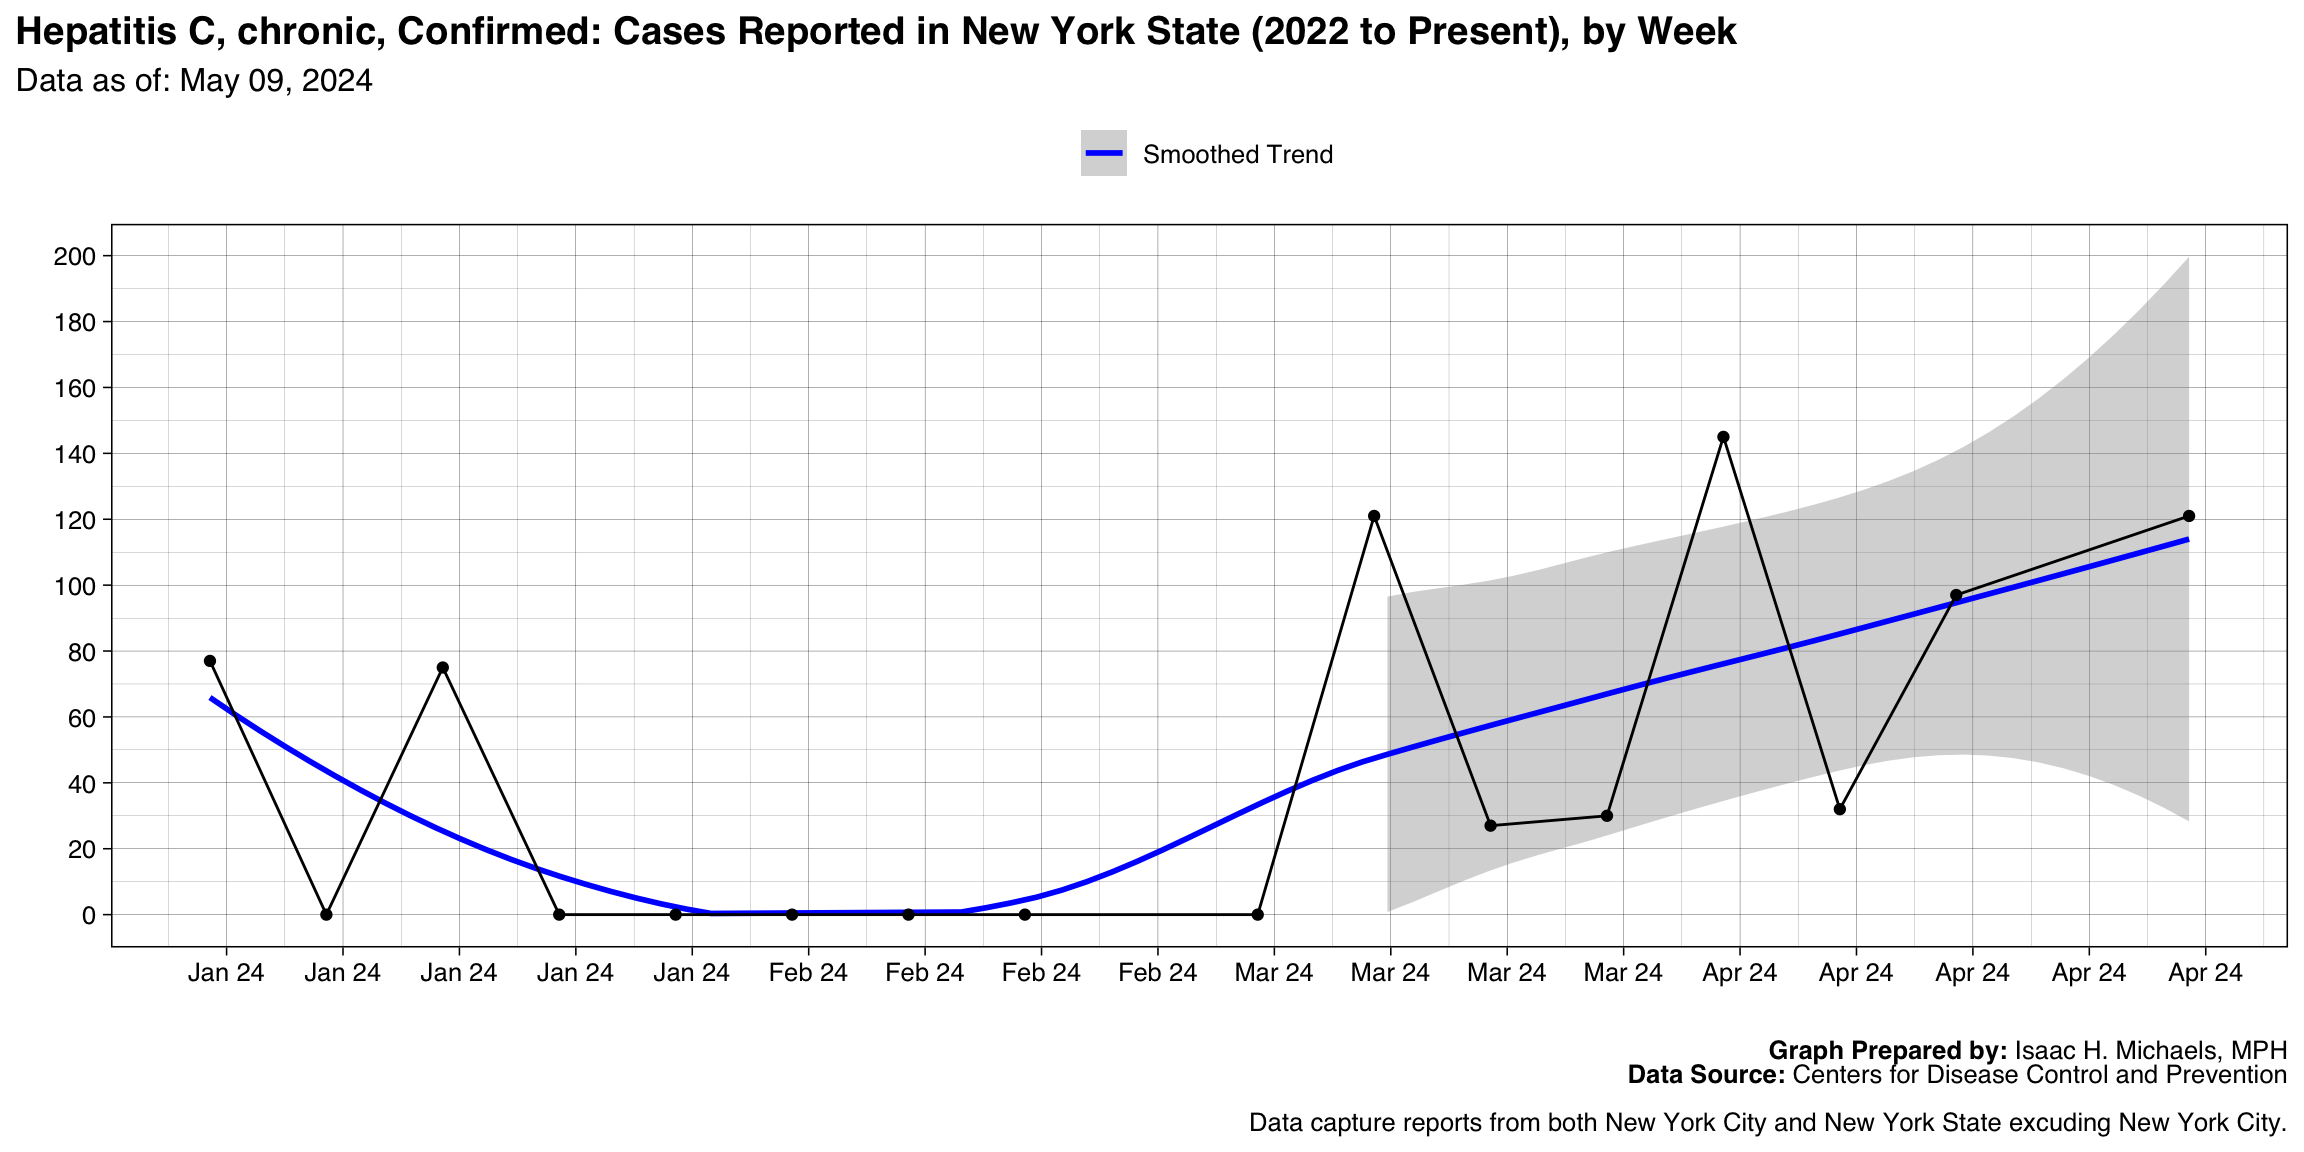
- Hepatitis C, chronic, Confirmed
- Pertussis
- Shiga toxin-producing Escherichia coli (STEC)
- Tuberculosis
- Legionellosis
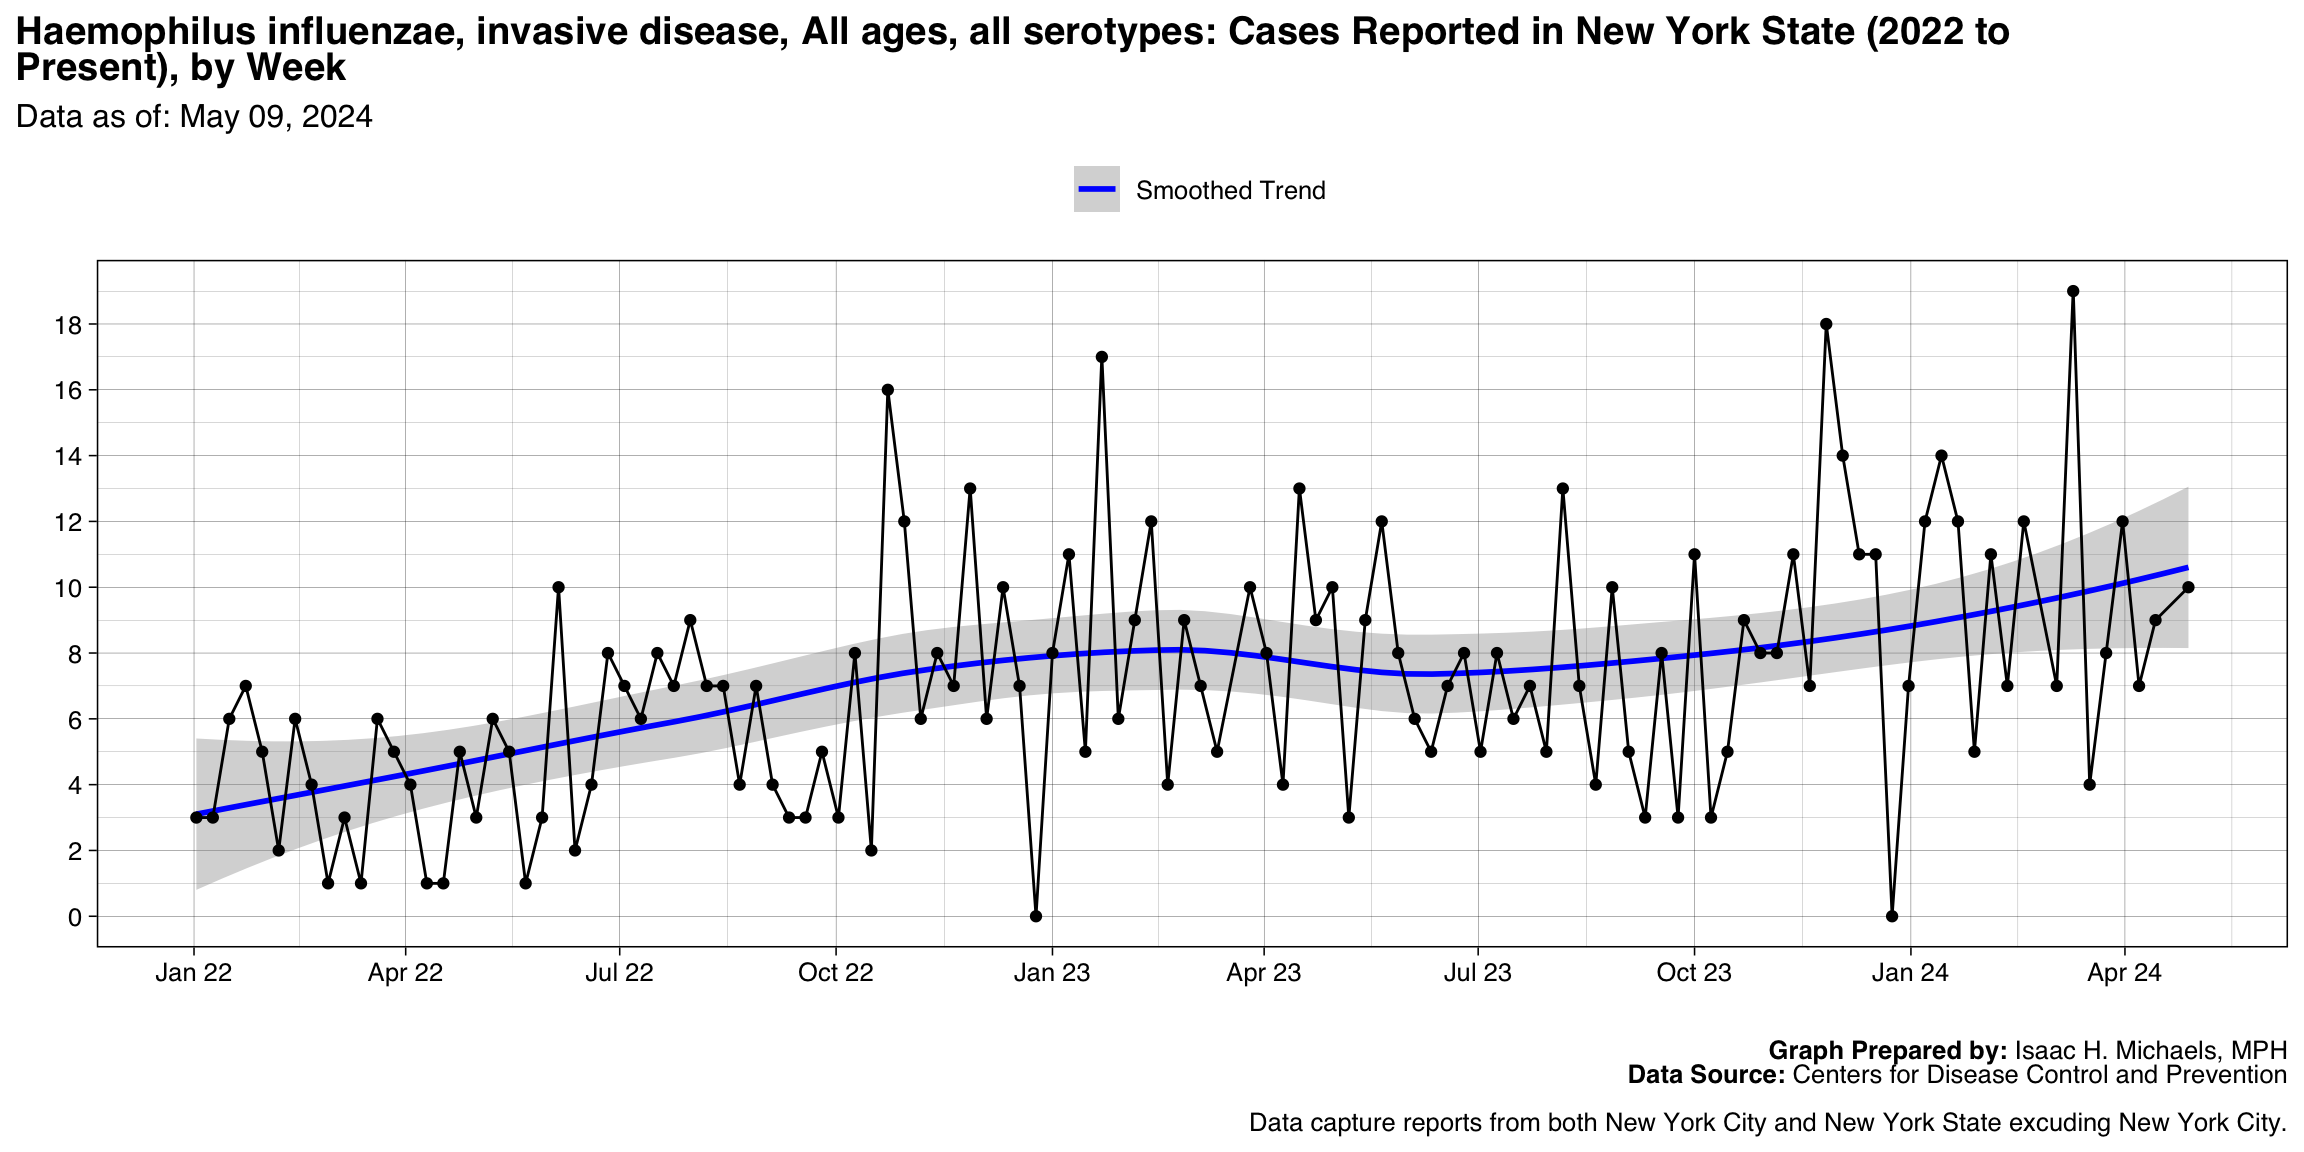
- Haemophilus influenzae, invasive disease, All ages, all serotypes
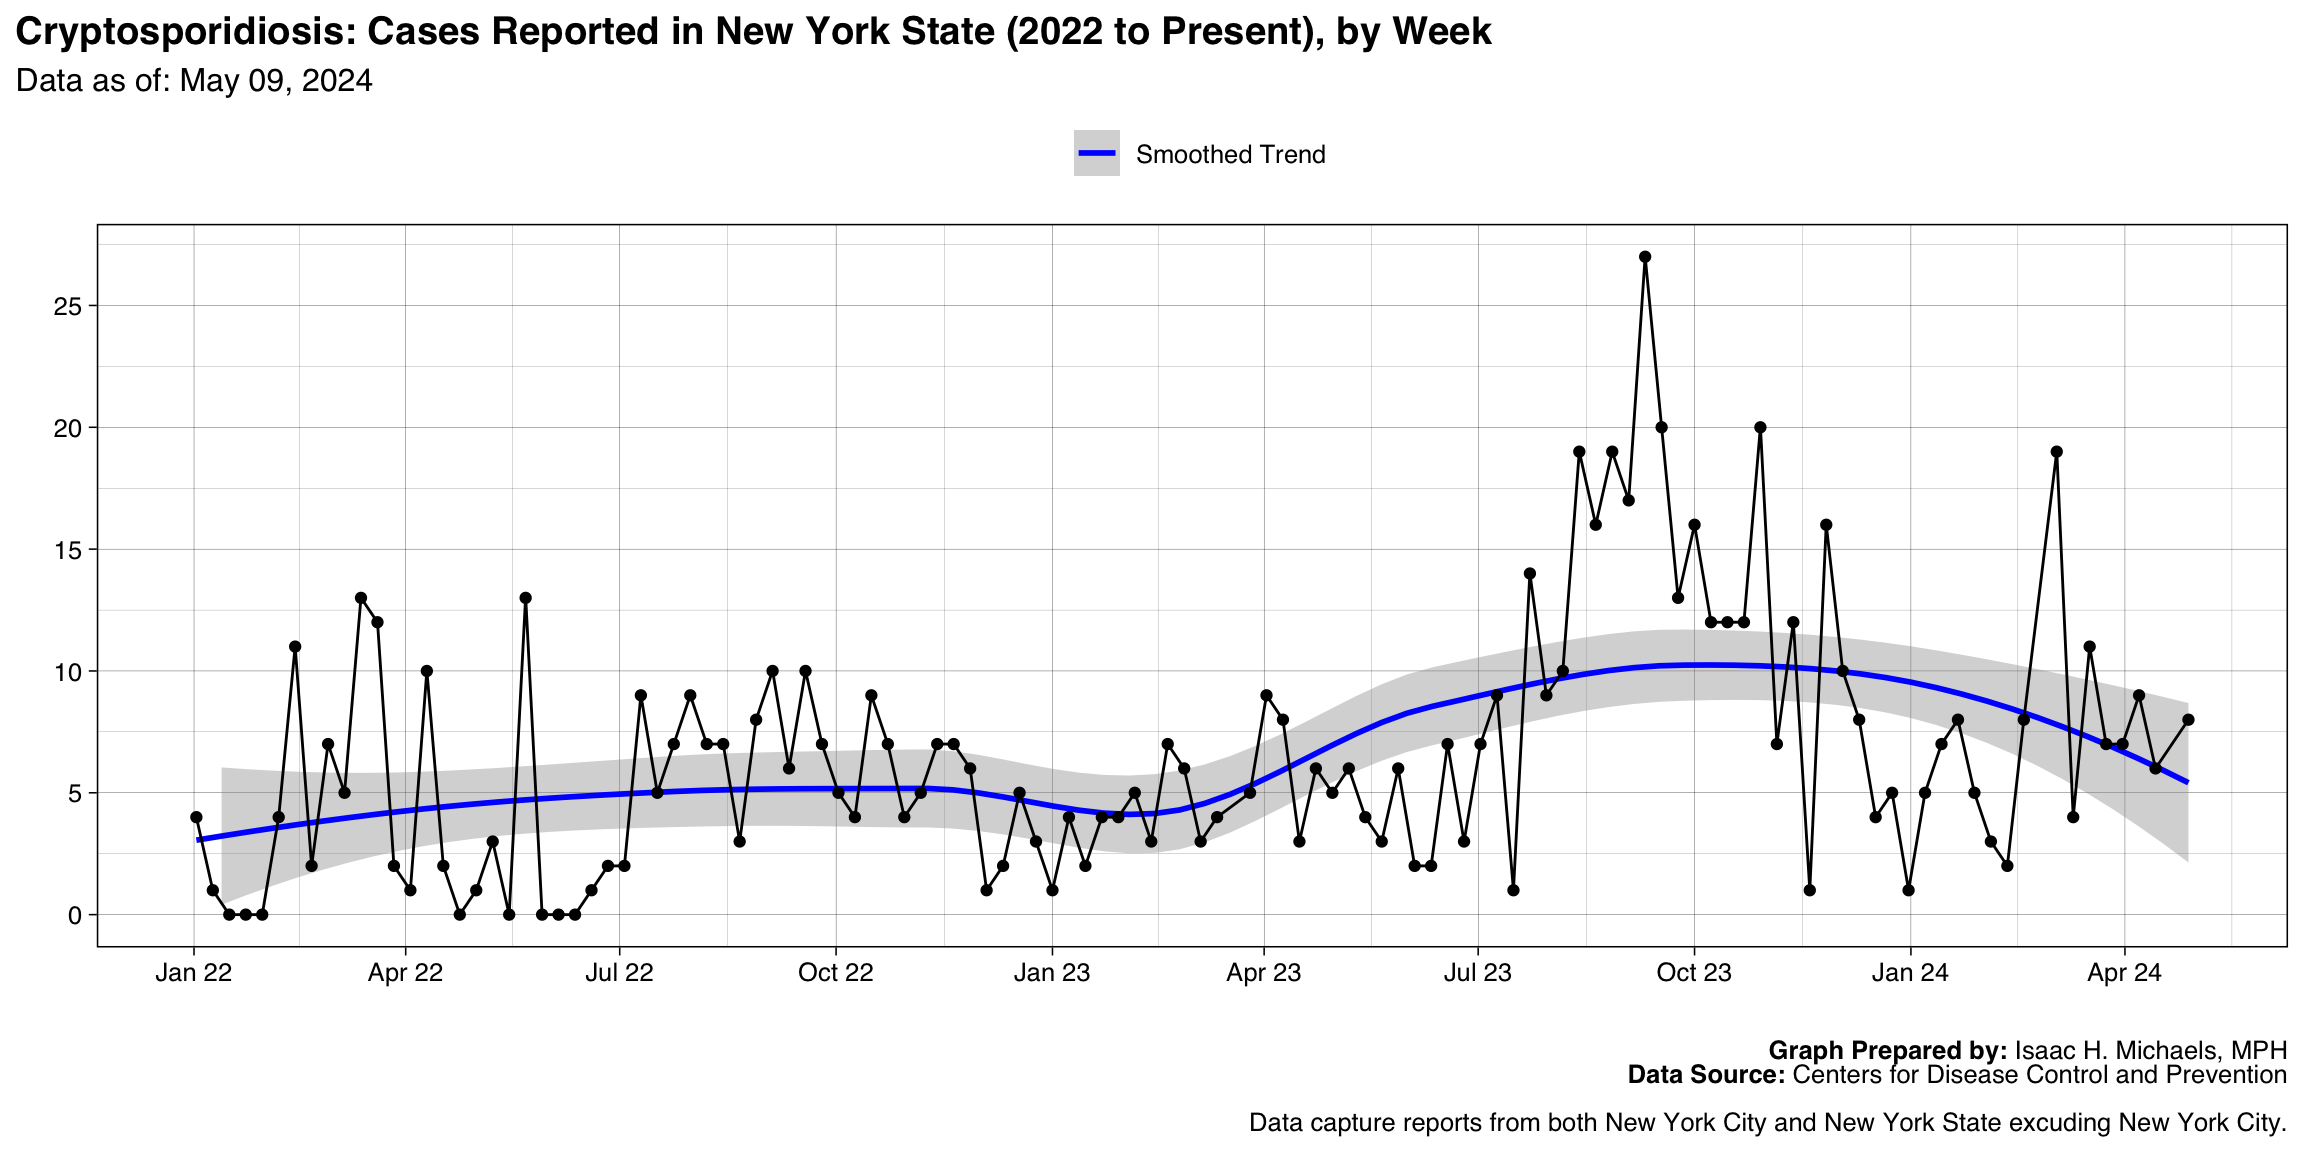
- Cryptosporidiosis
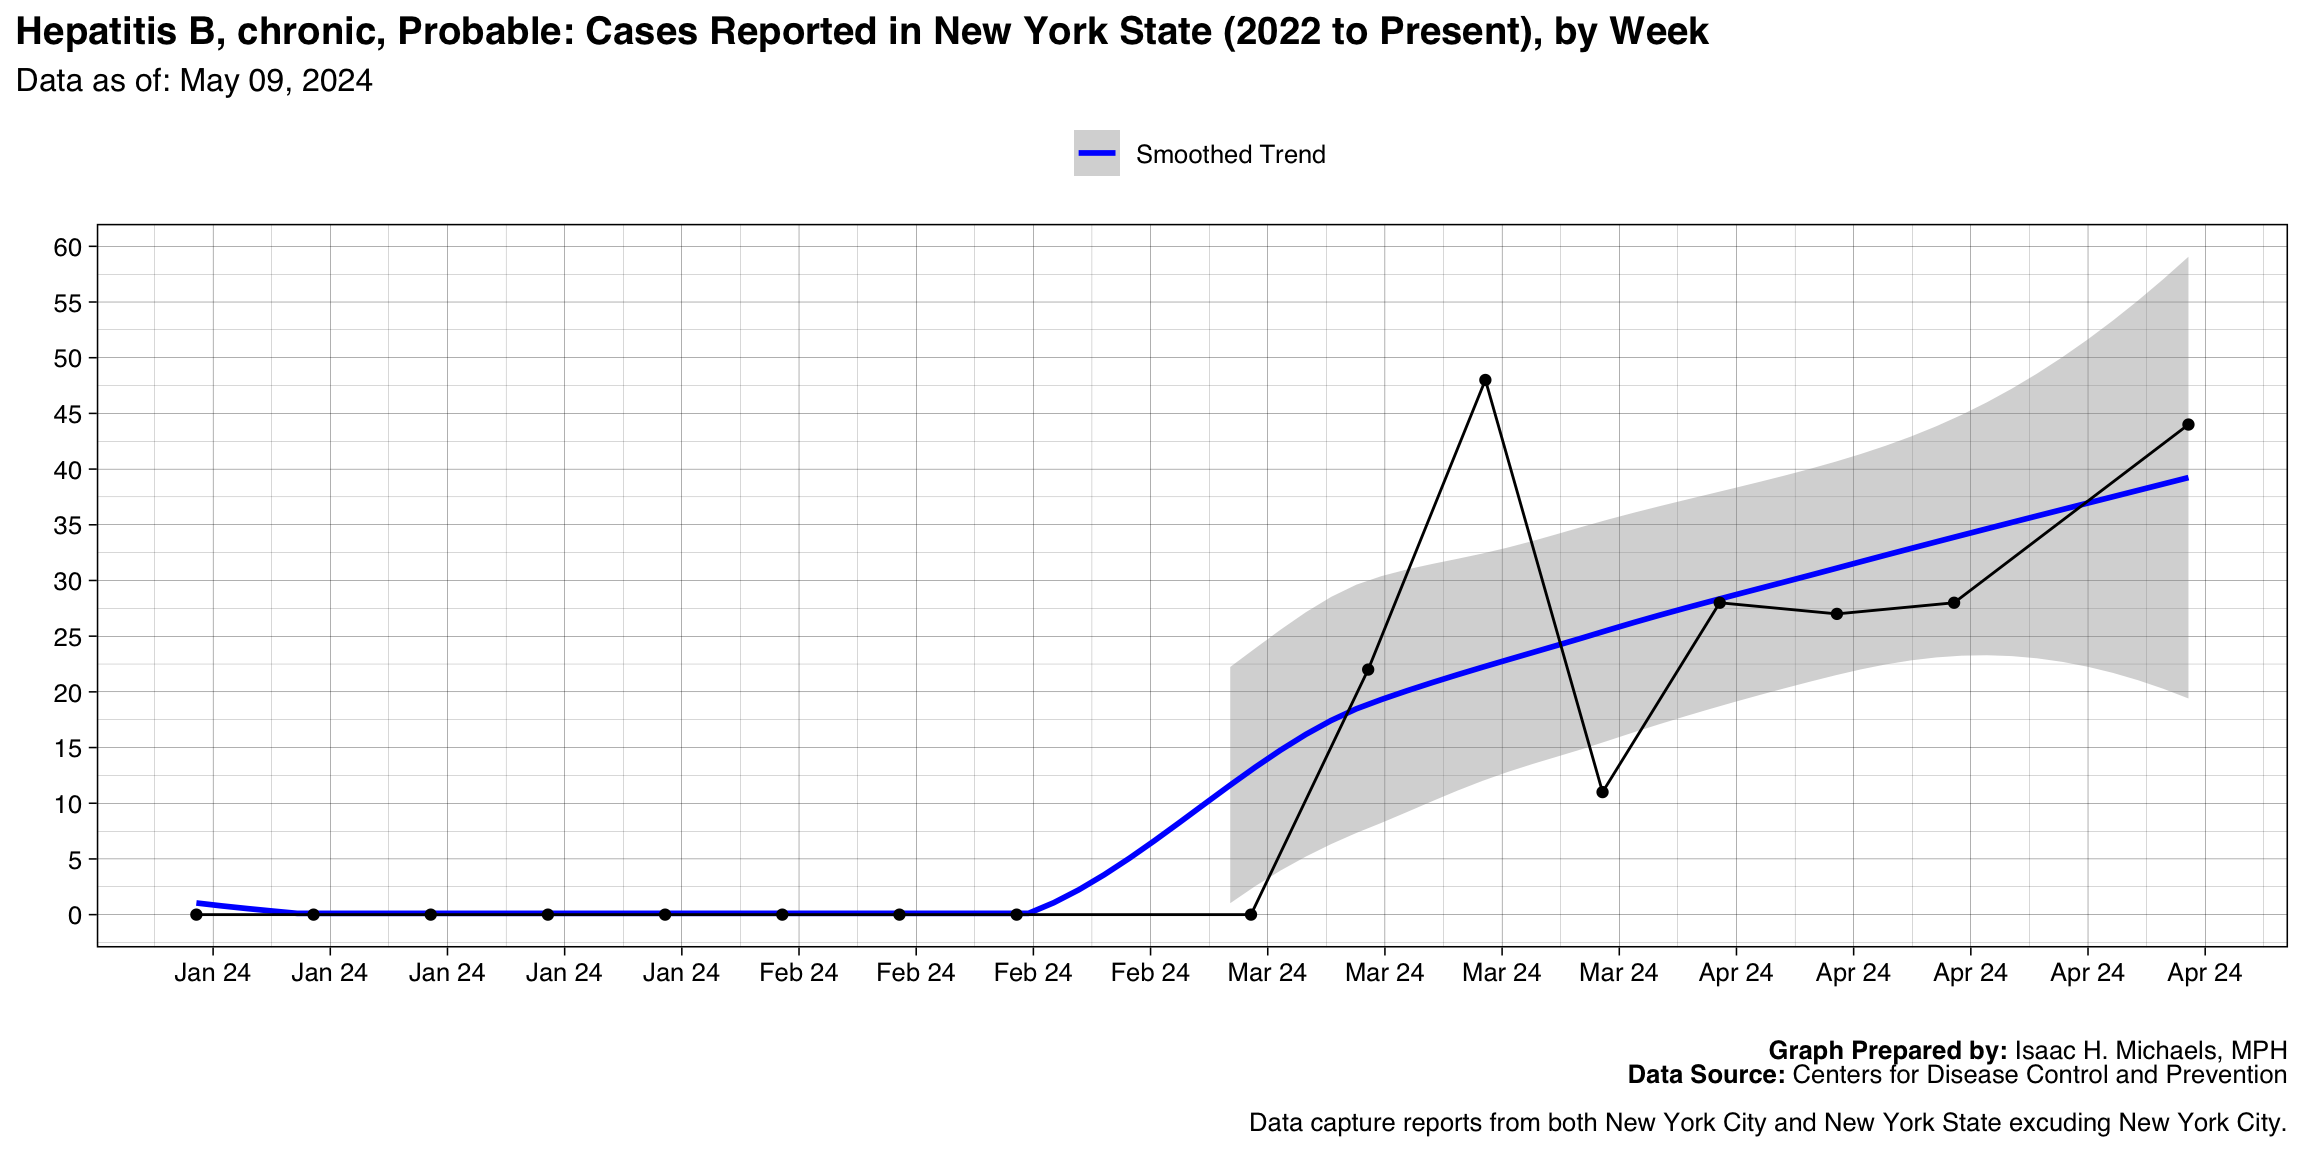
- Hepatitis B, chronic, Probable
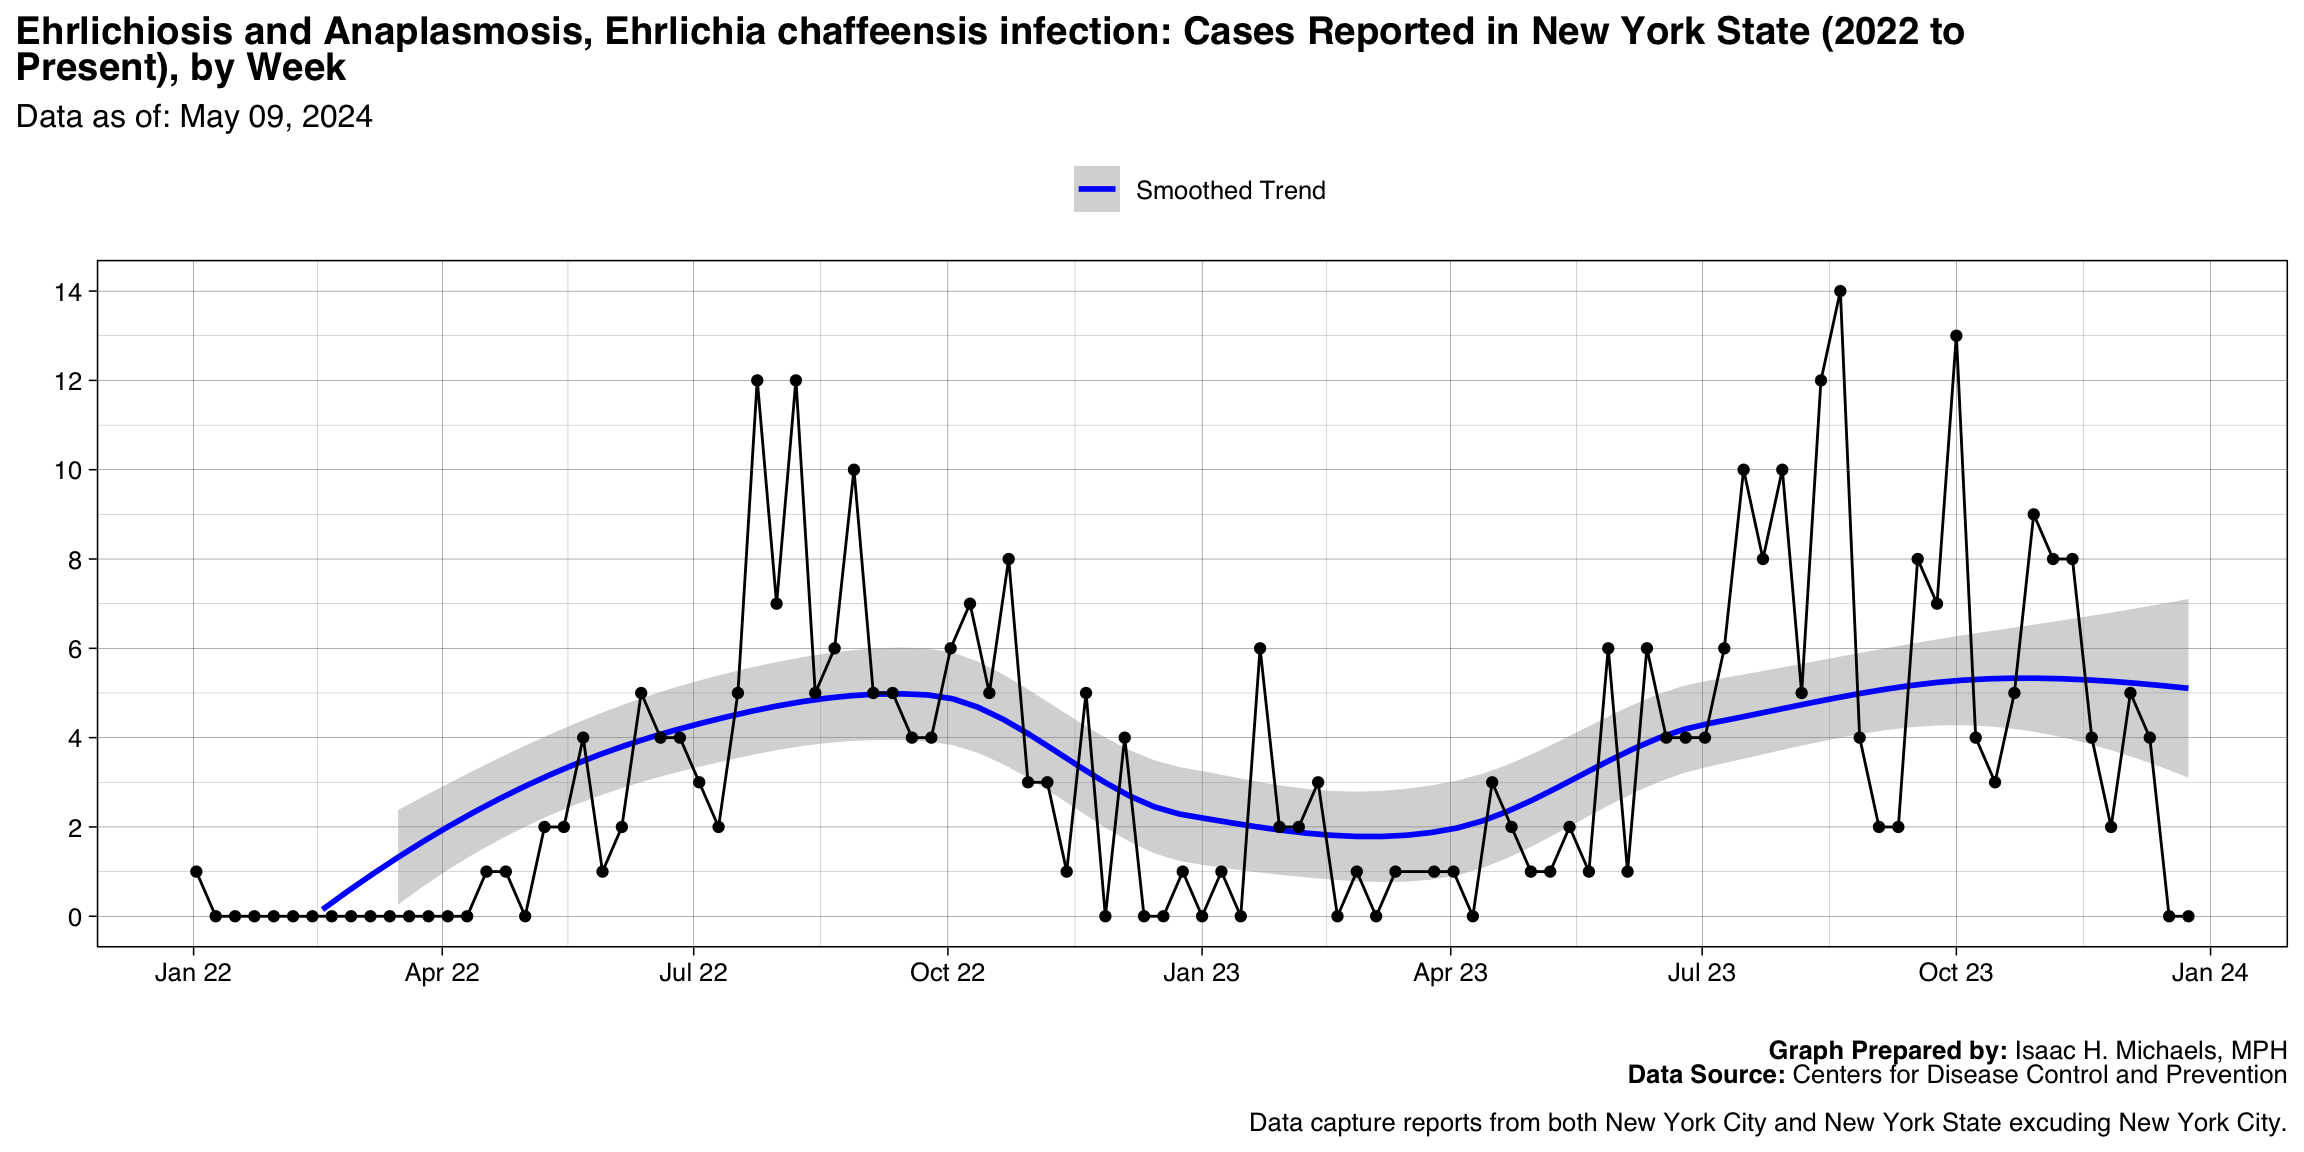
- Ehrlichiosis and Anaplasmosis, Ehrlichia chaffeensis infection
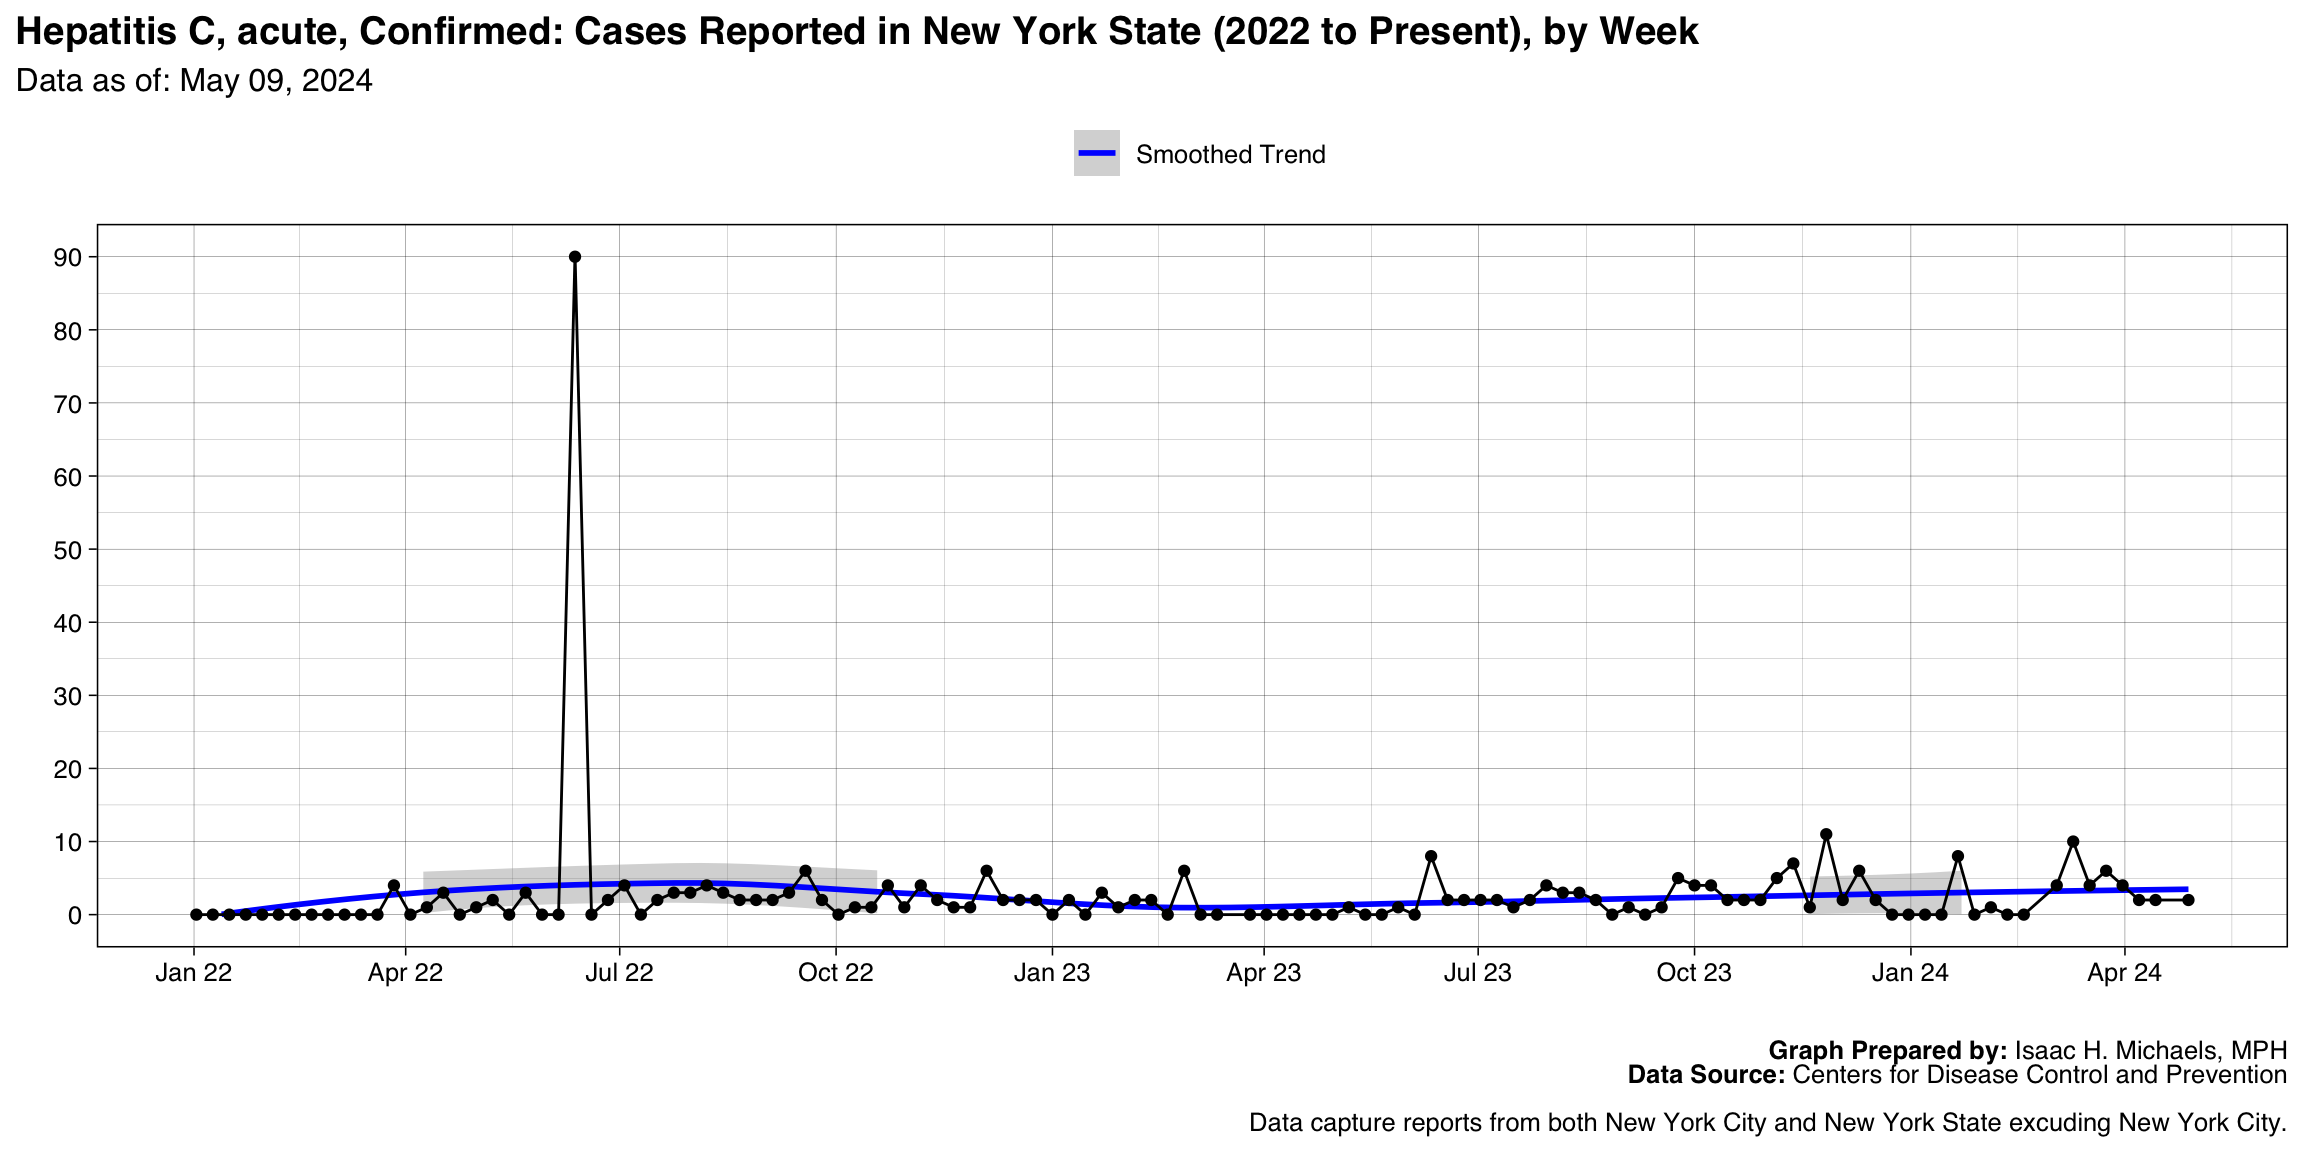
- Hepatitis C, acute, Confirmed
- Invasive pneumococcal disease, all ages, Probable
- Cyclosporiasis
- Malaria
- Rabies, Animal
- Listeriosis, Confirmed
- Vibriosis (any species of the family Vibrionaceae, other than toxigenic Vibrio cholerae O1 or O139), Probable
- Hepatitis, A, acute
- Invasive pneumococcal disease, age <5 years, Confirmed
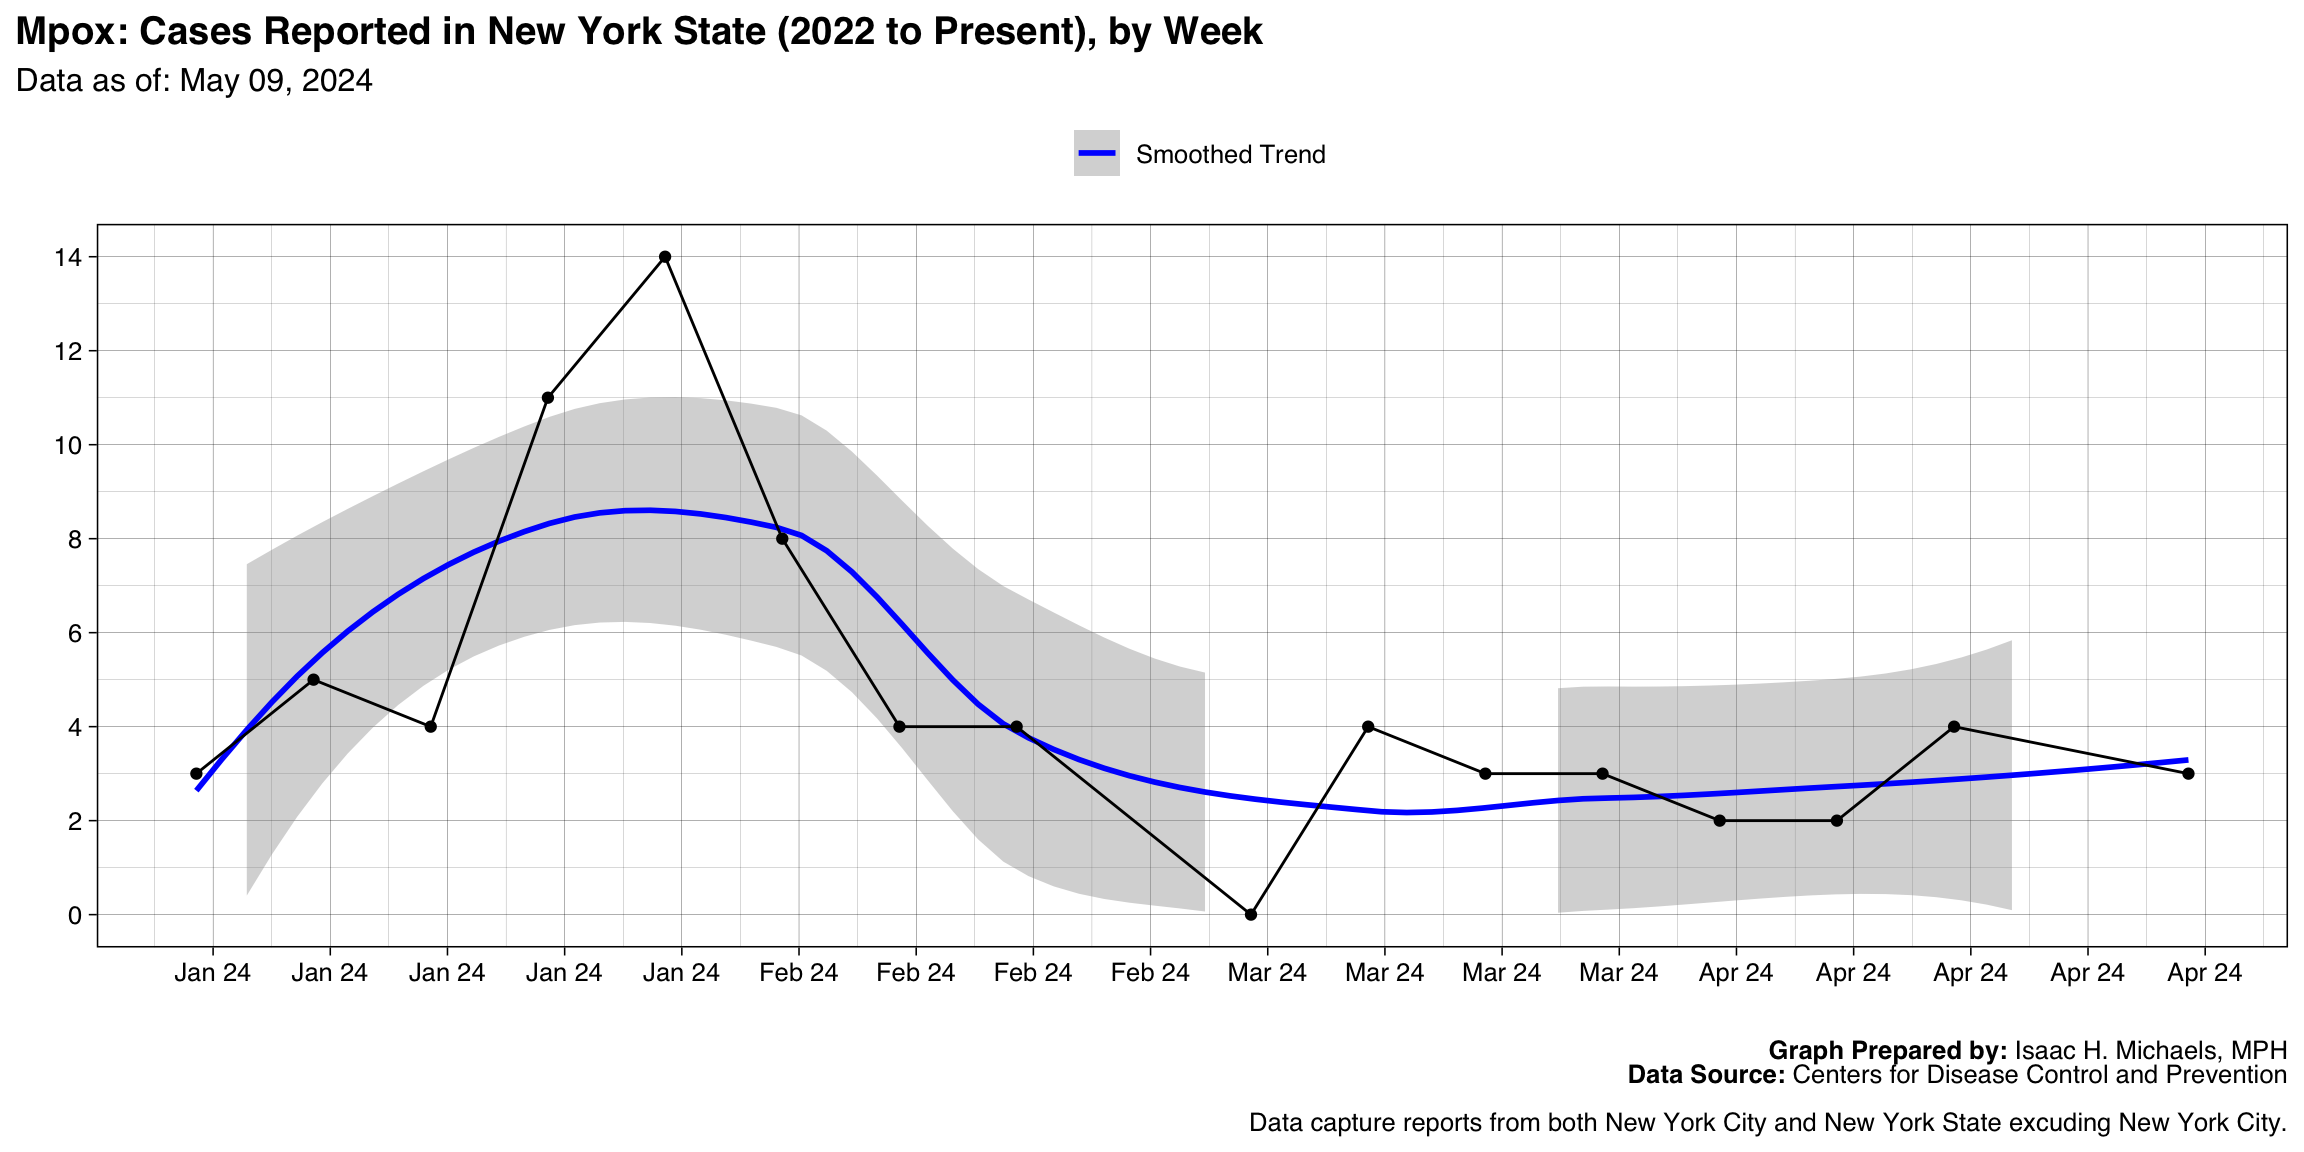
- Mpox
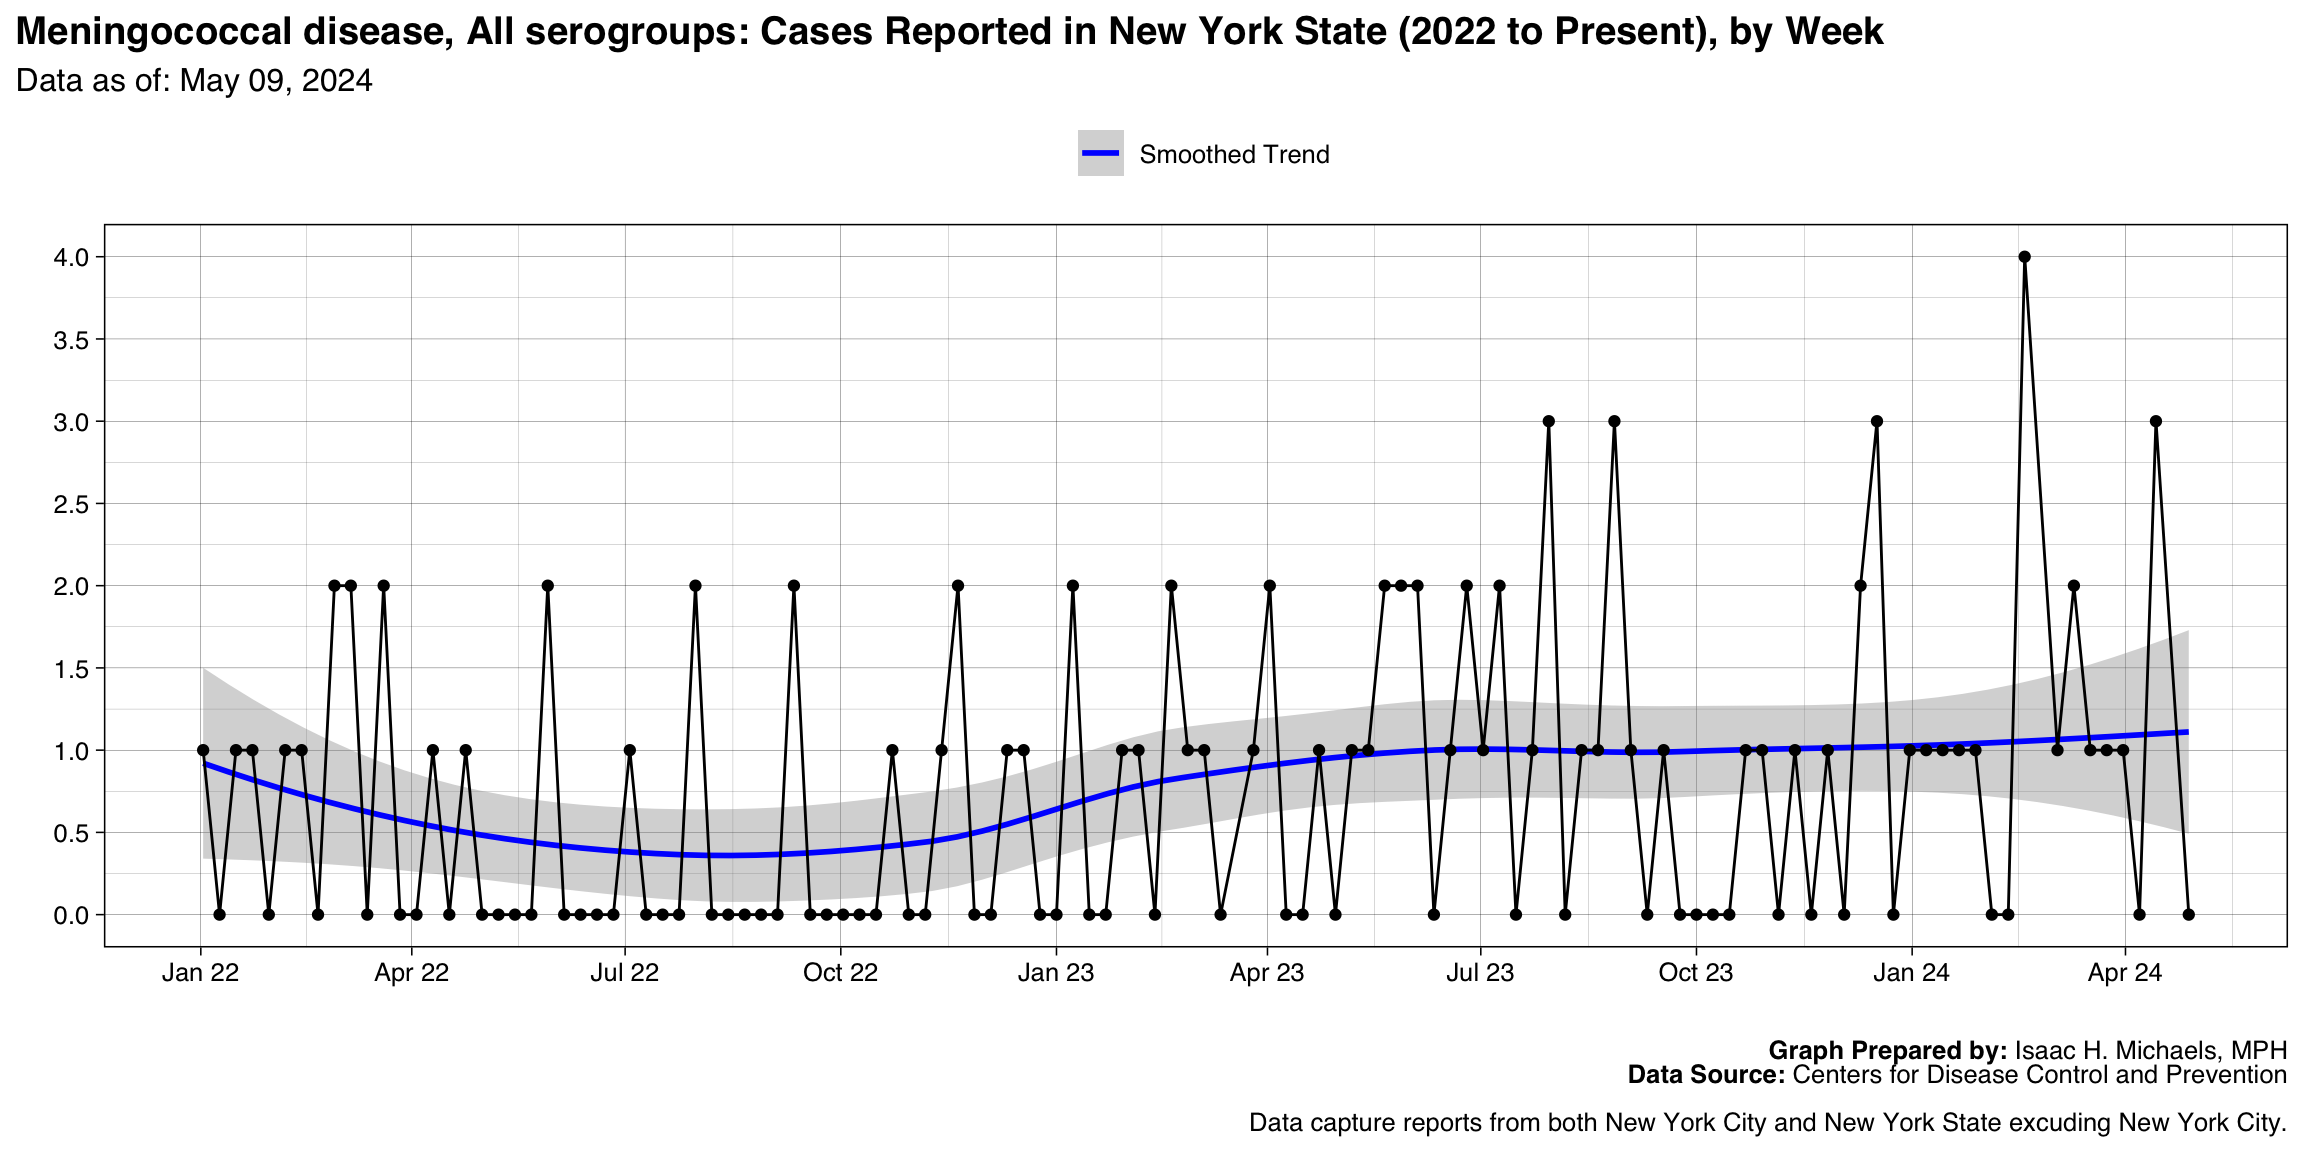
- Meningococcal disease, All serogroups
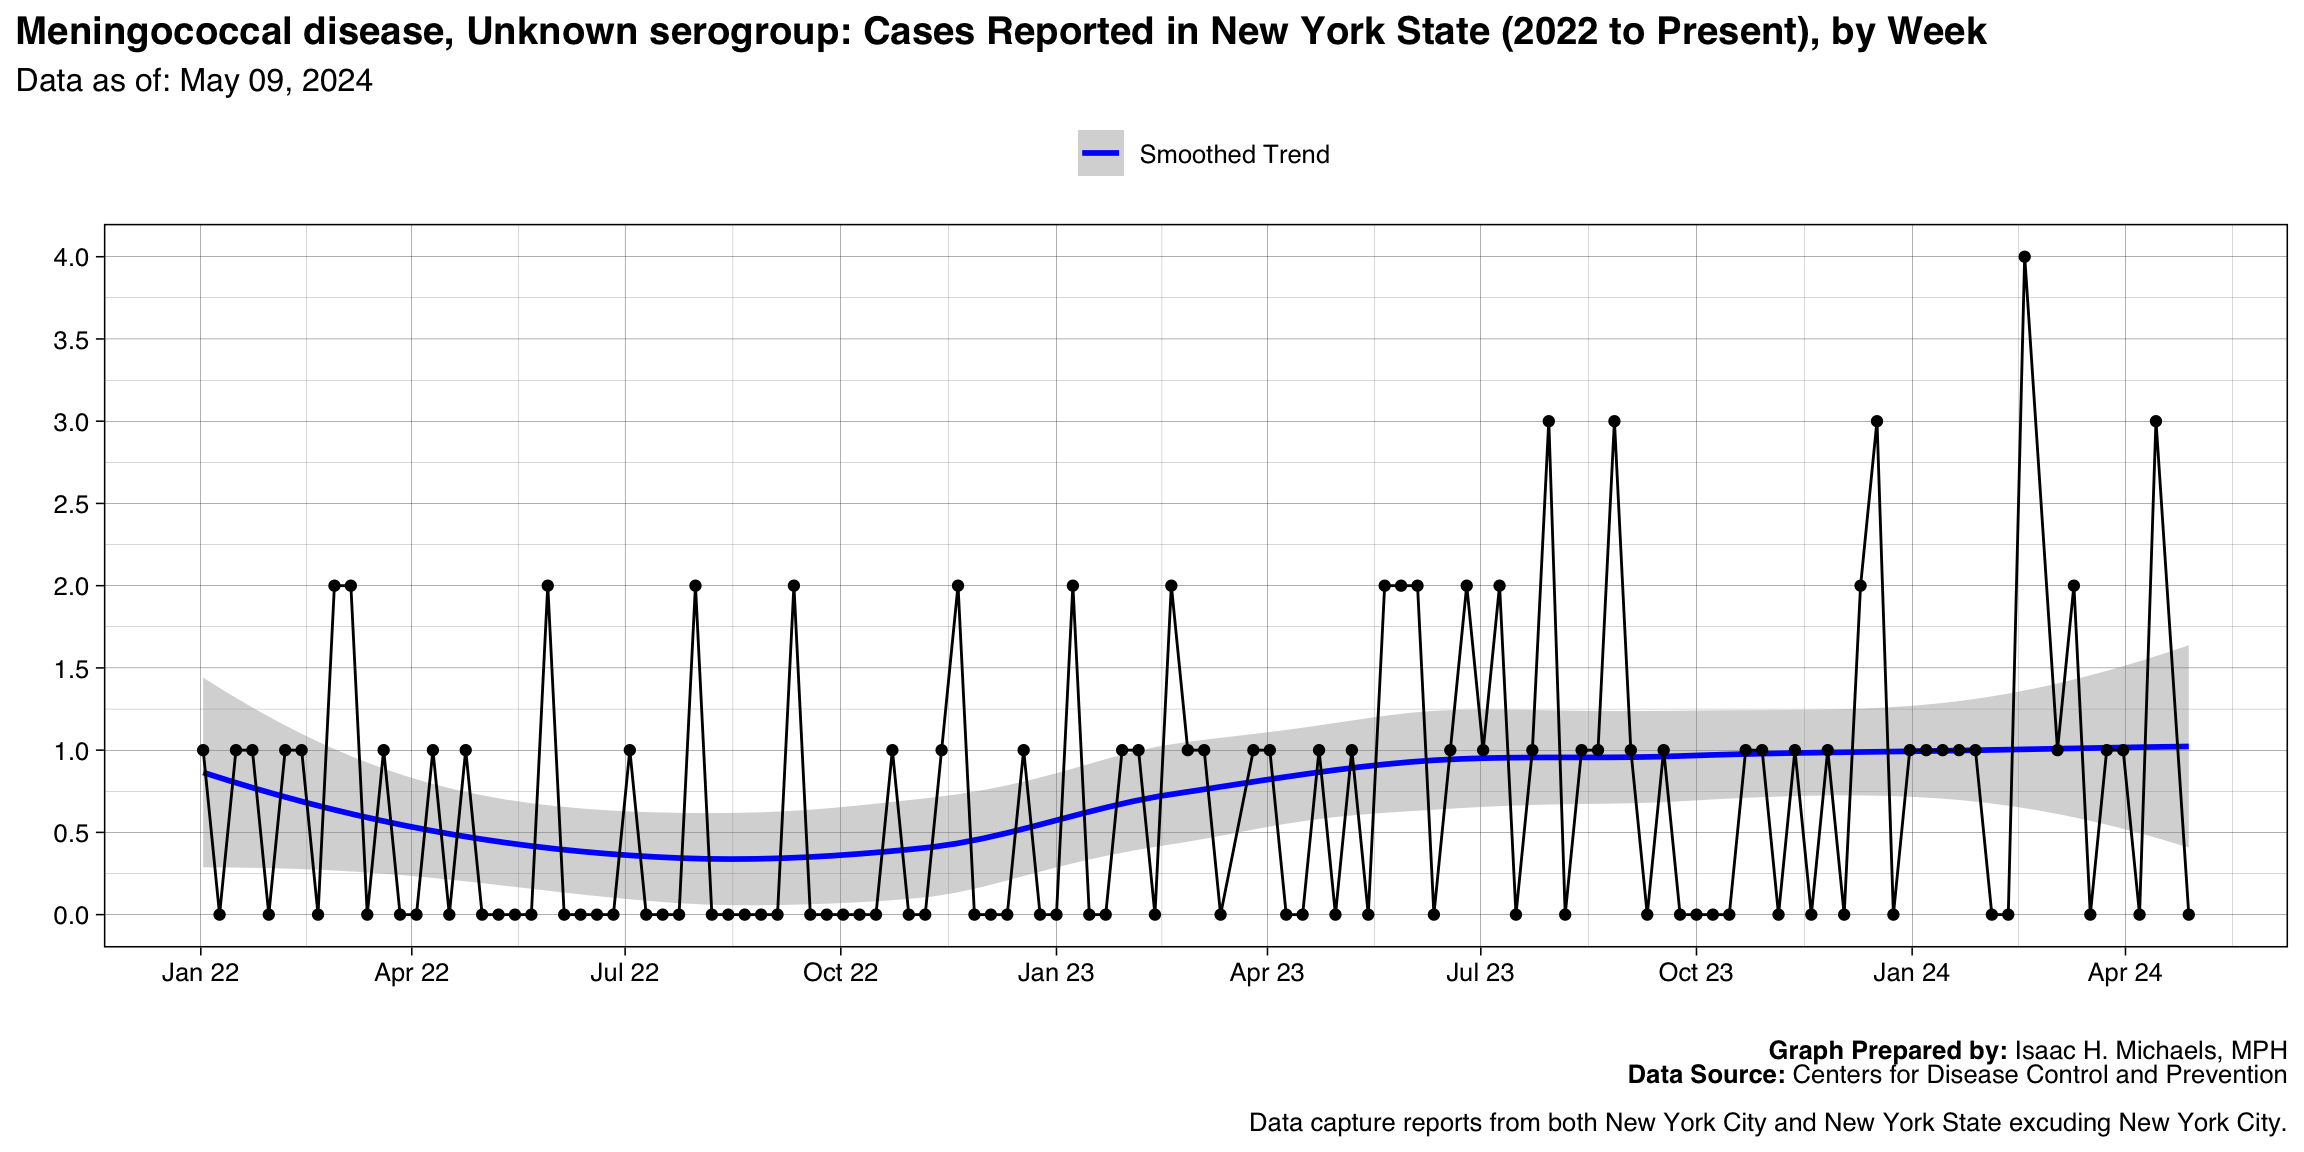
- Meningococcal disease, Unknown serogroup
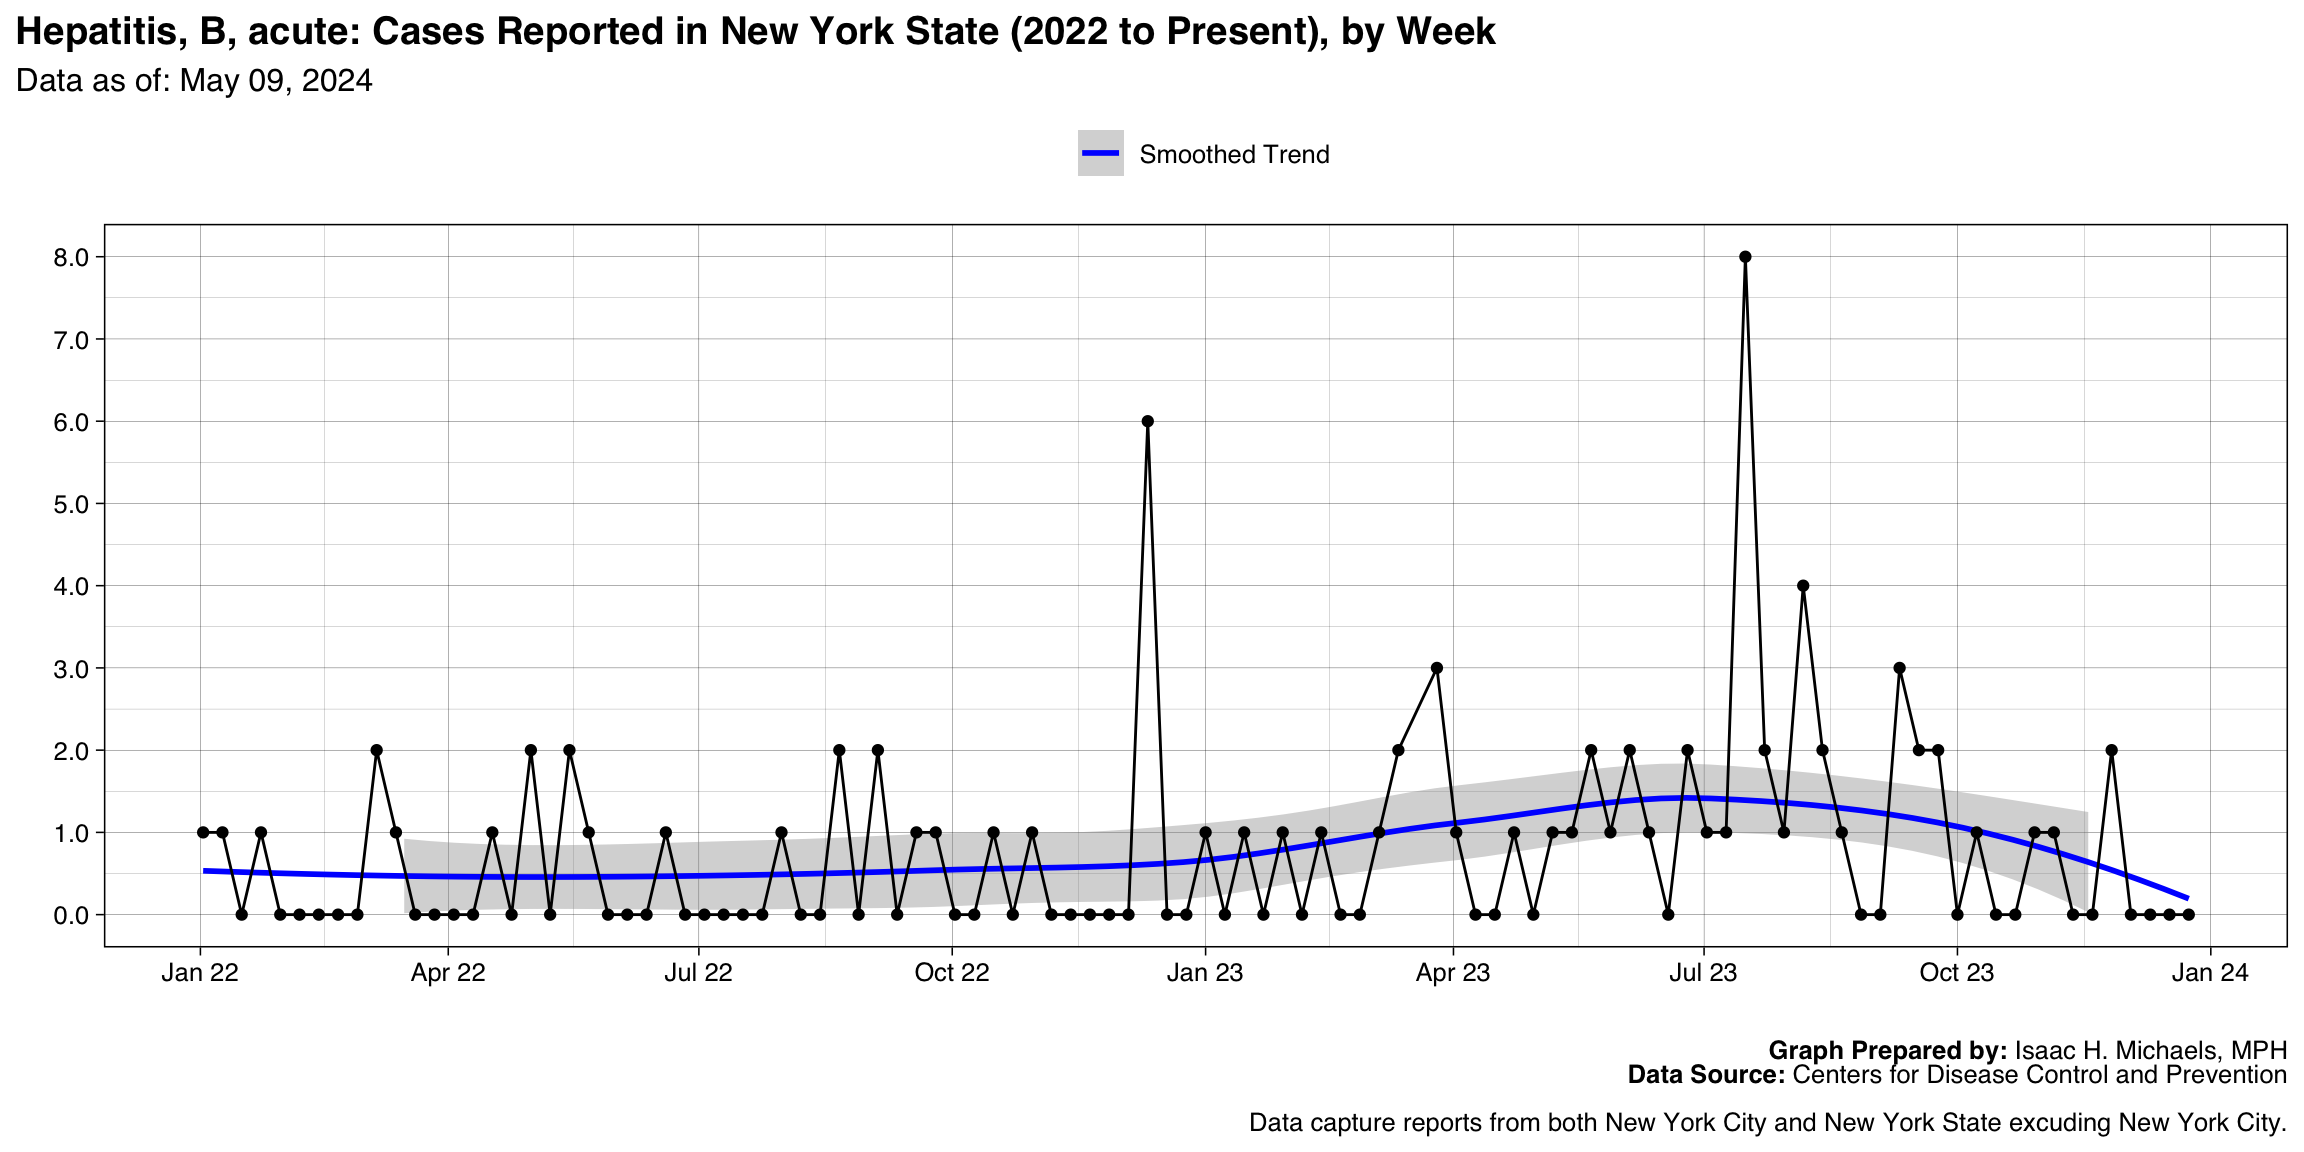
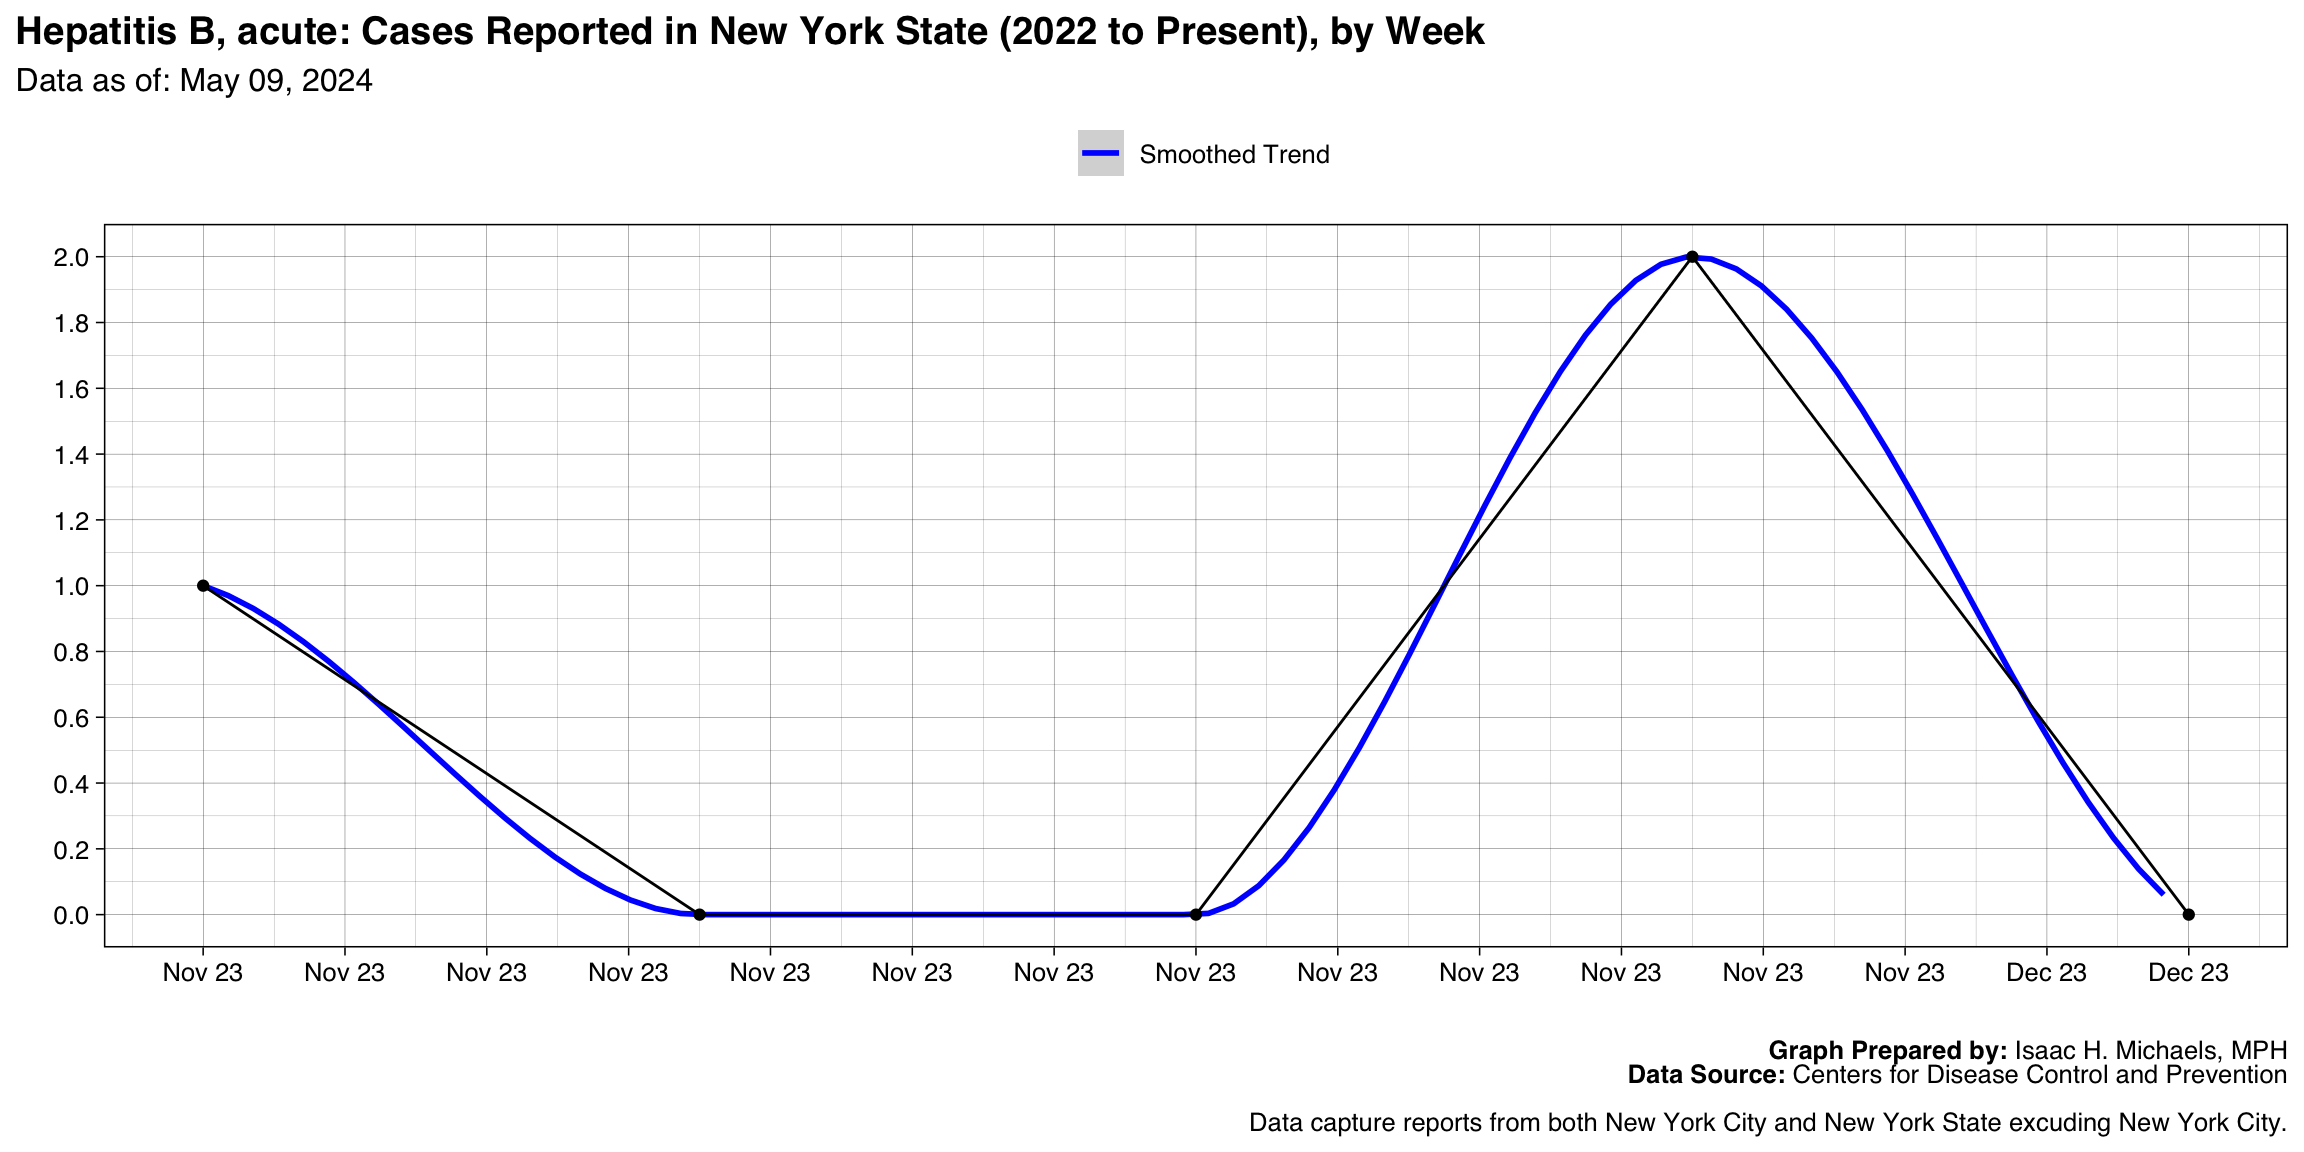
- Hepatitis, B, acute
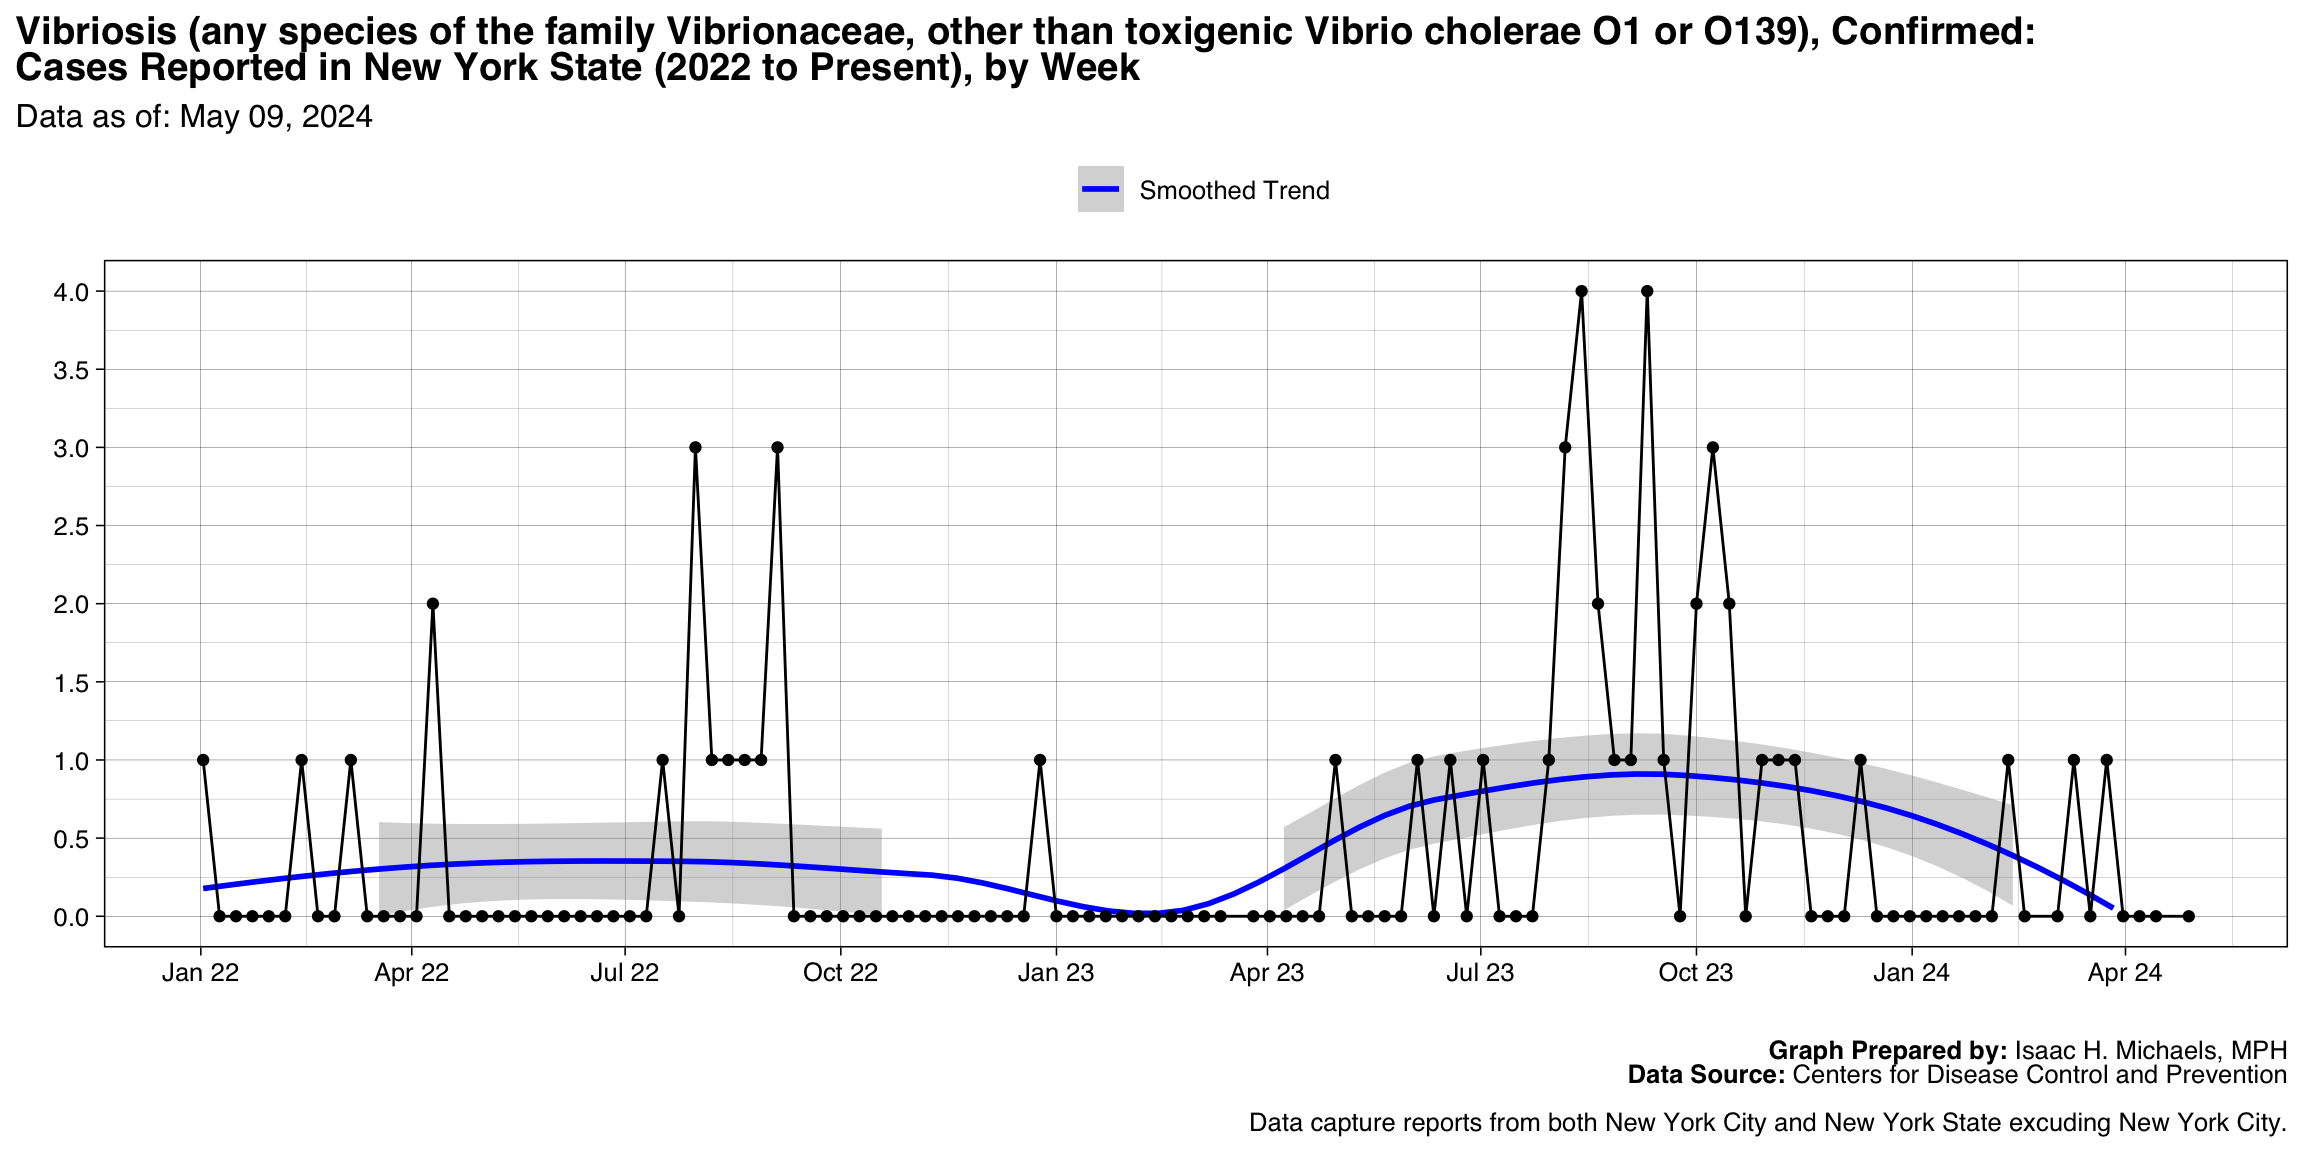
- Vibriosis (any species of the family Vibrionaceae, other than toxigenic Vibrio cholerae O1 or O139), Confirmed
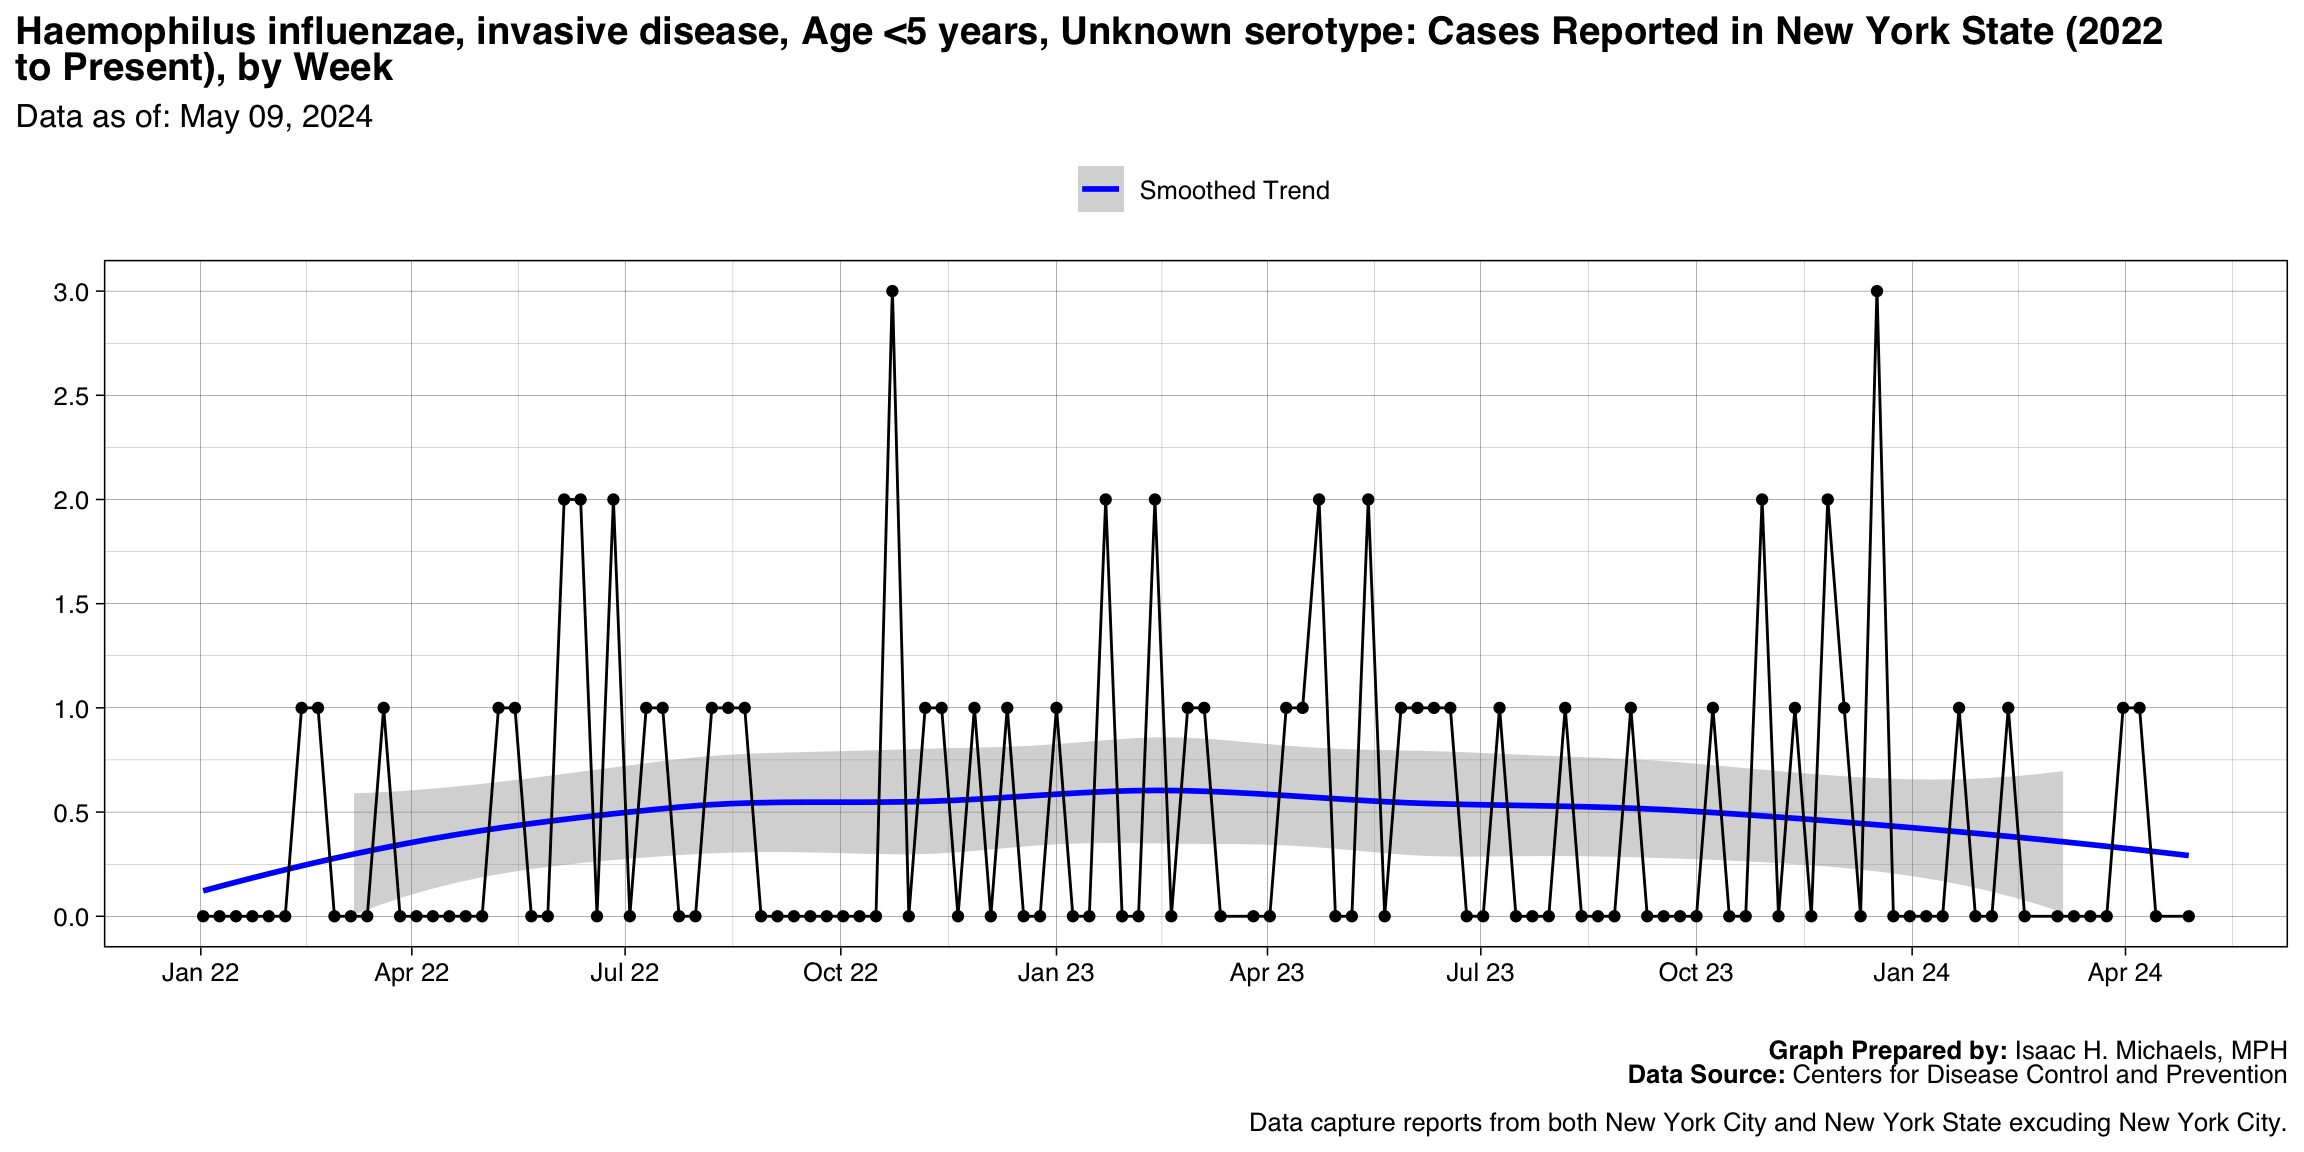
- Haemophilus influenzae, invasive disease, Age <5 years, Unknown serotype
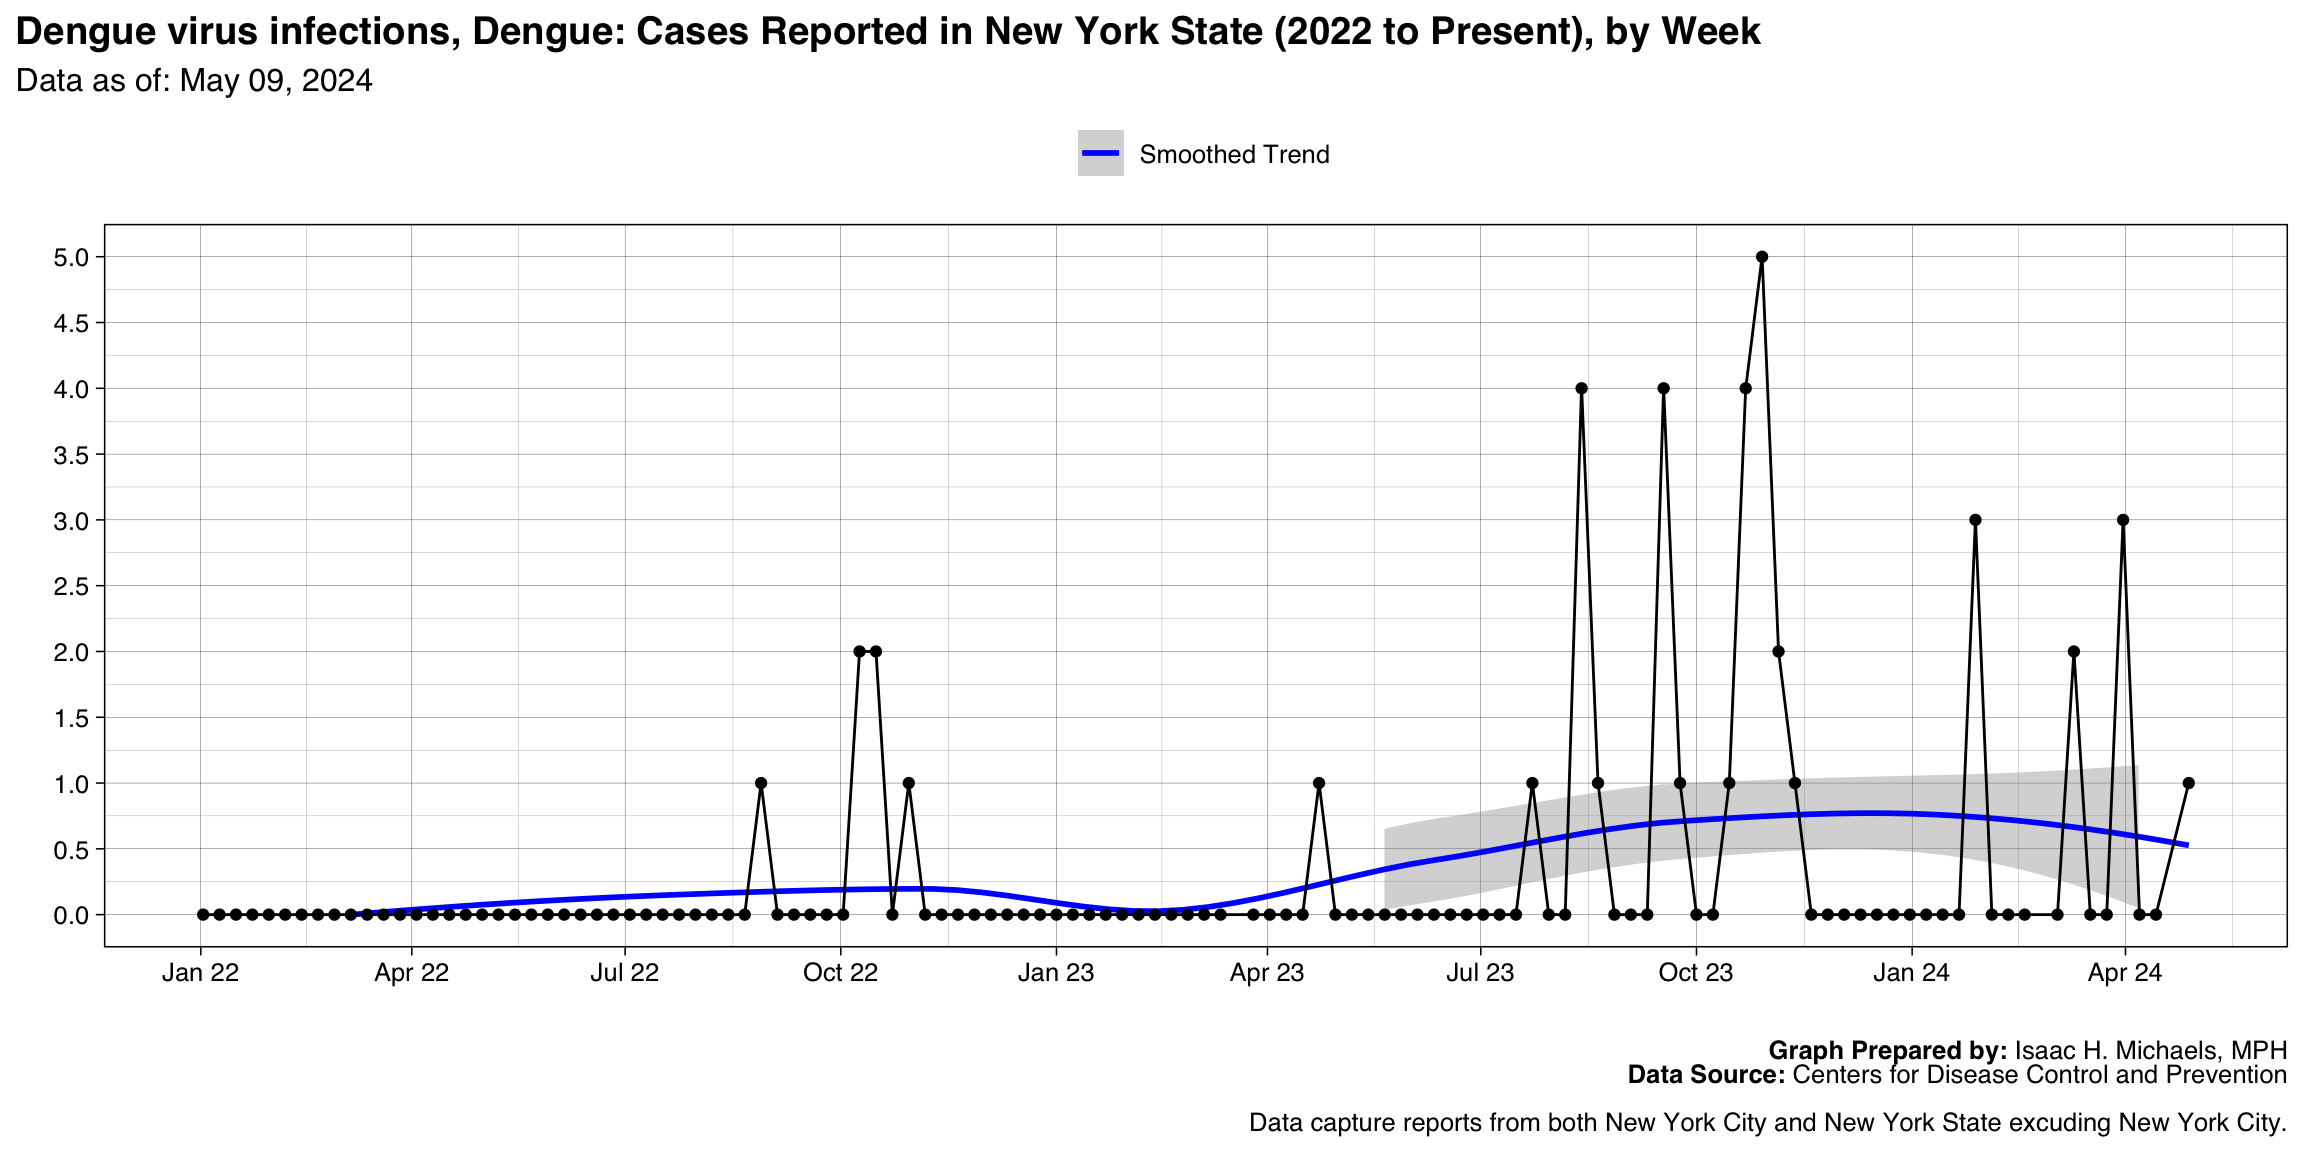
- Dengue virus infections, Dengue
- Hepatitis A, Confirmed
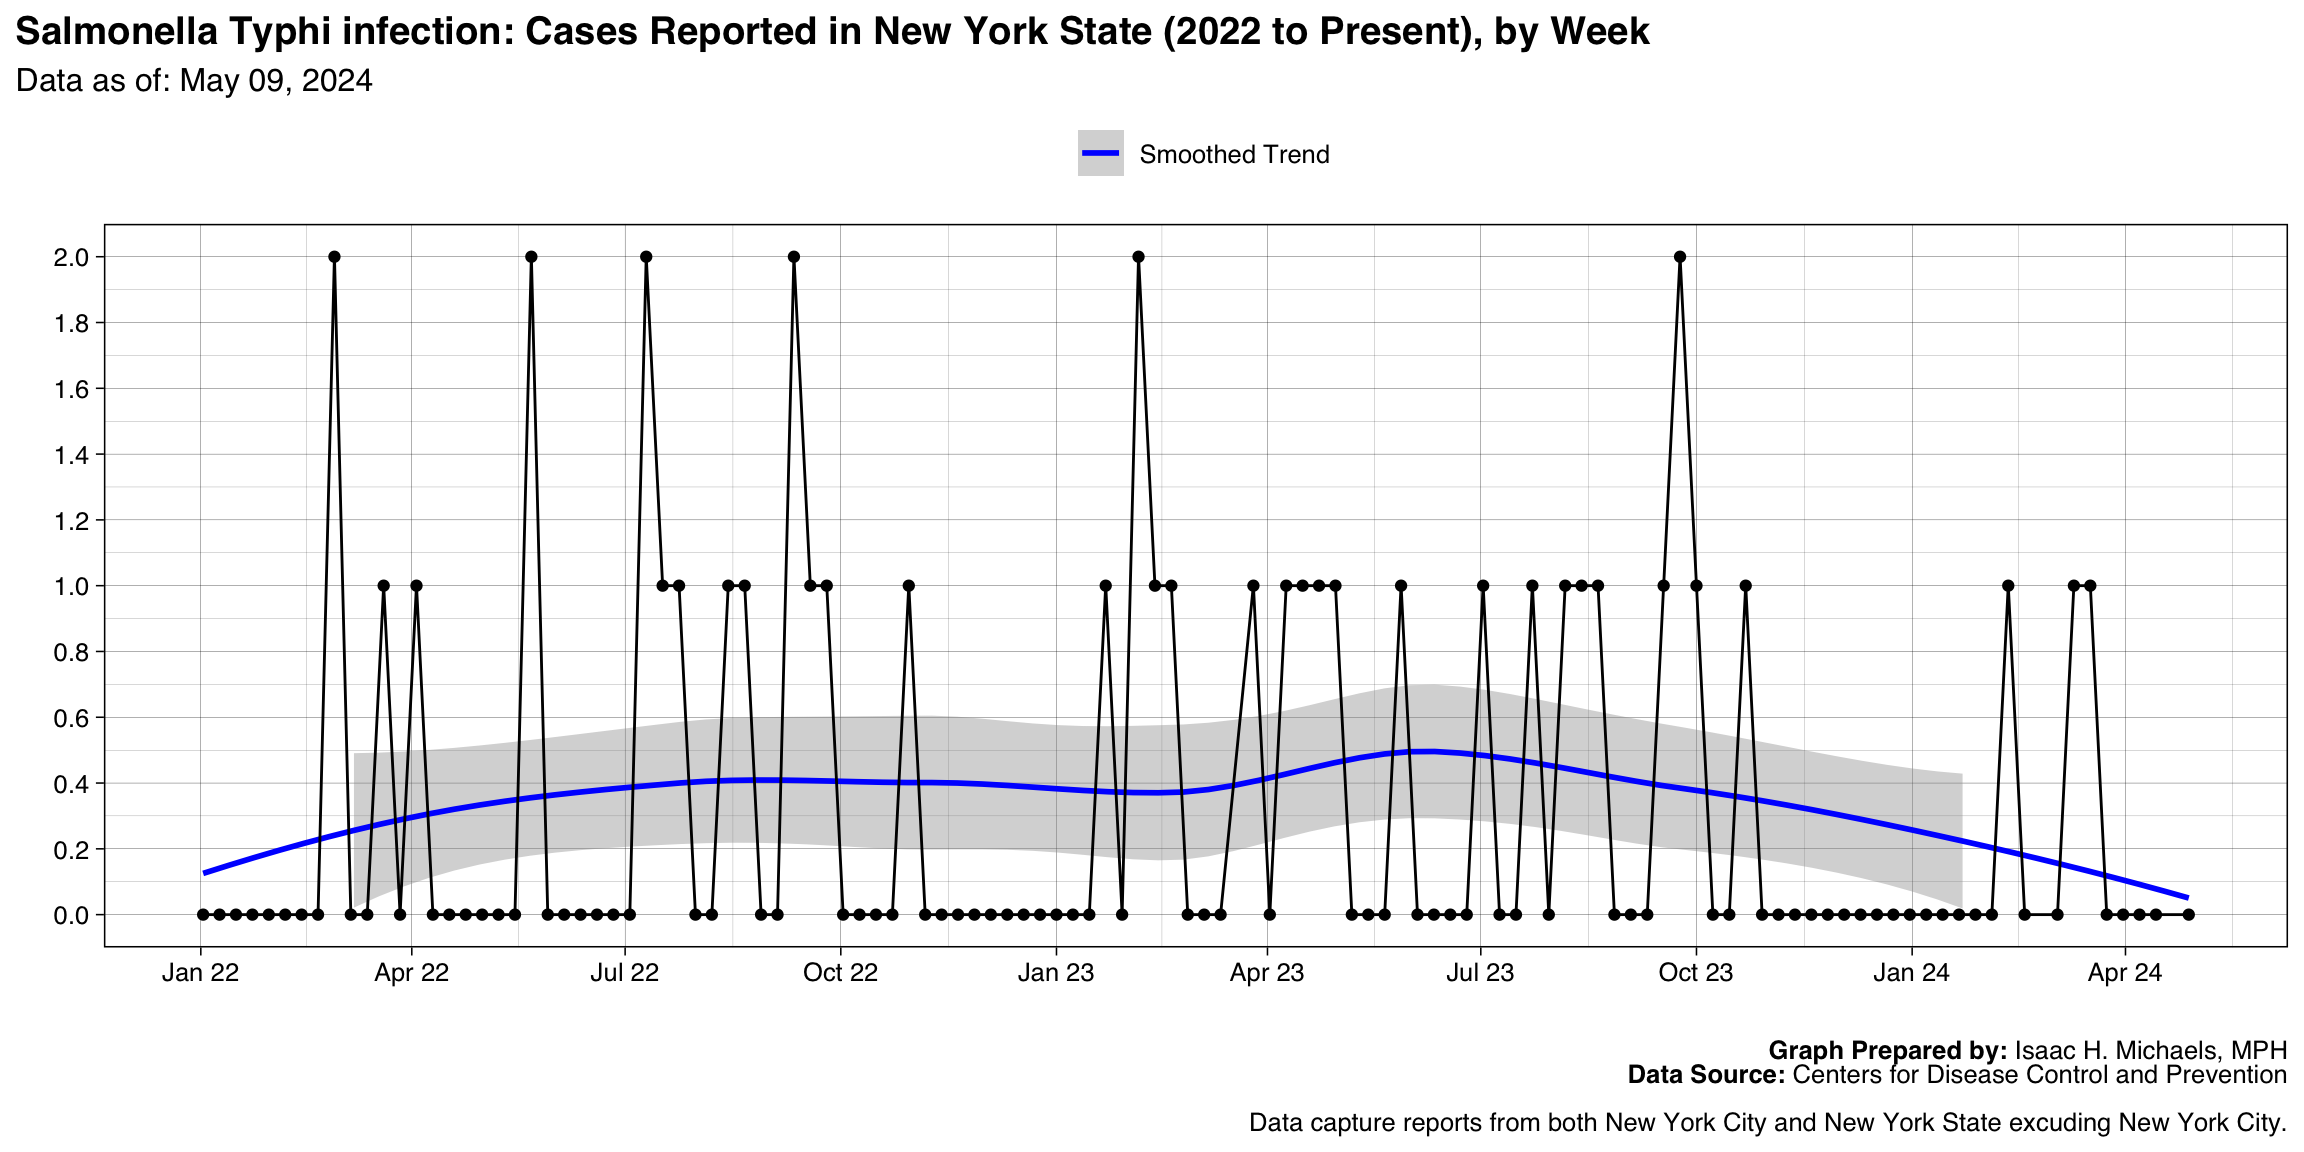
- Salmonella Typhi infection
- Streptococcal toxic shock syndrome
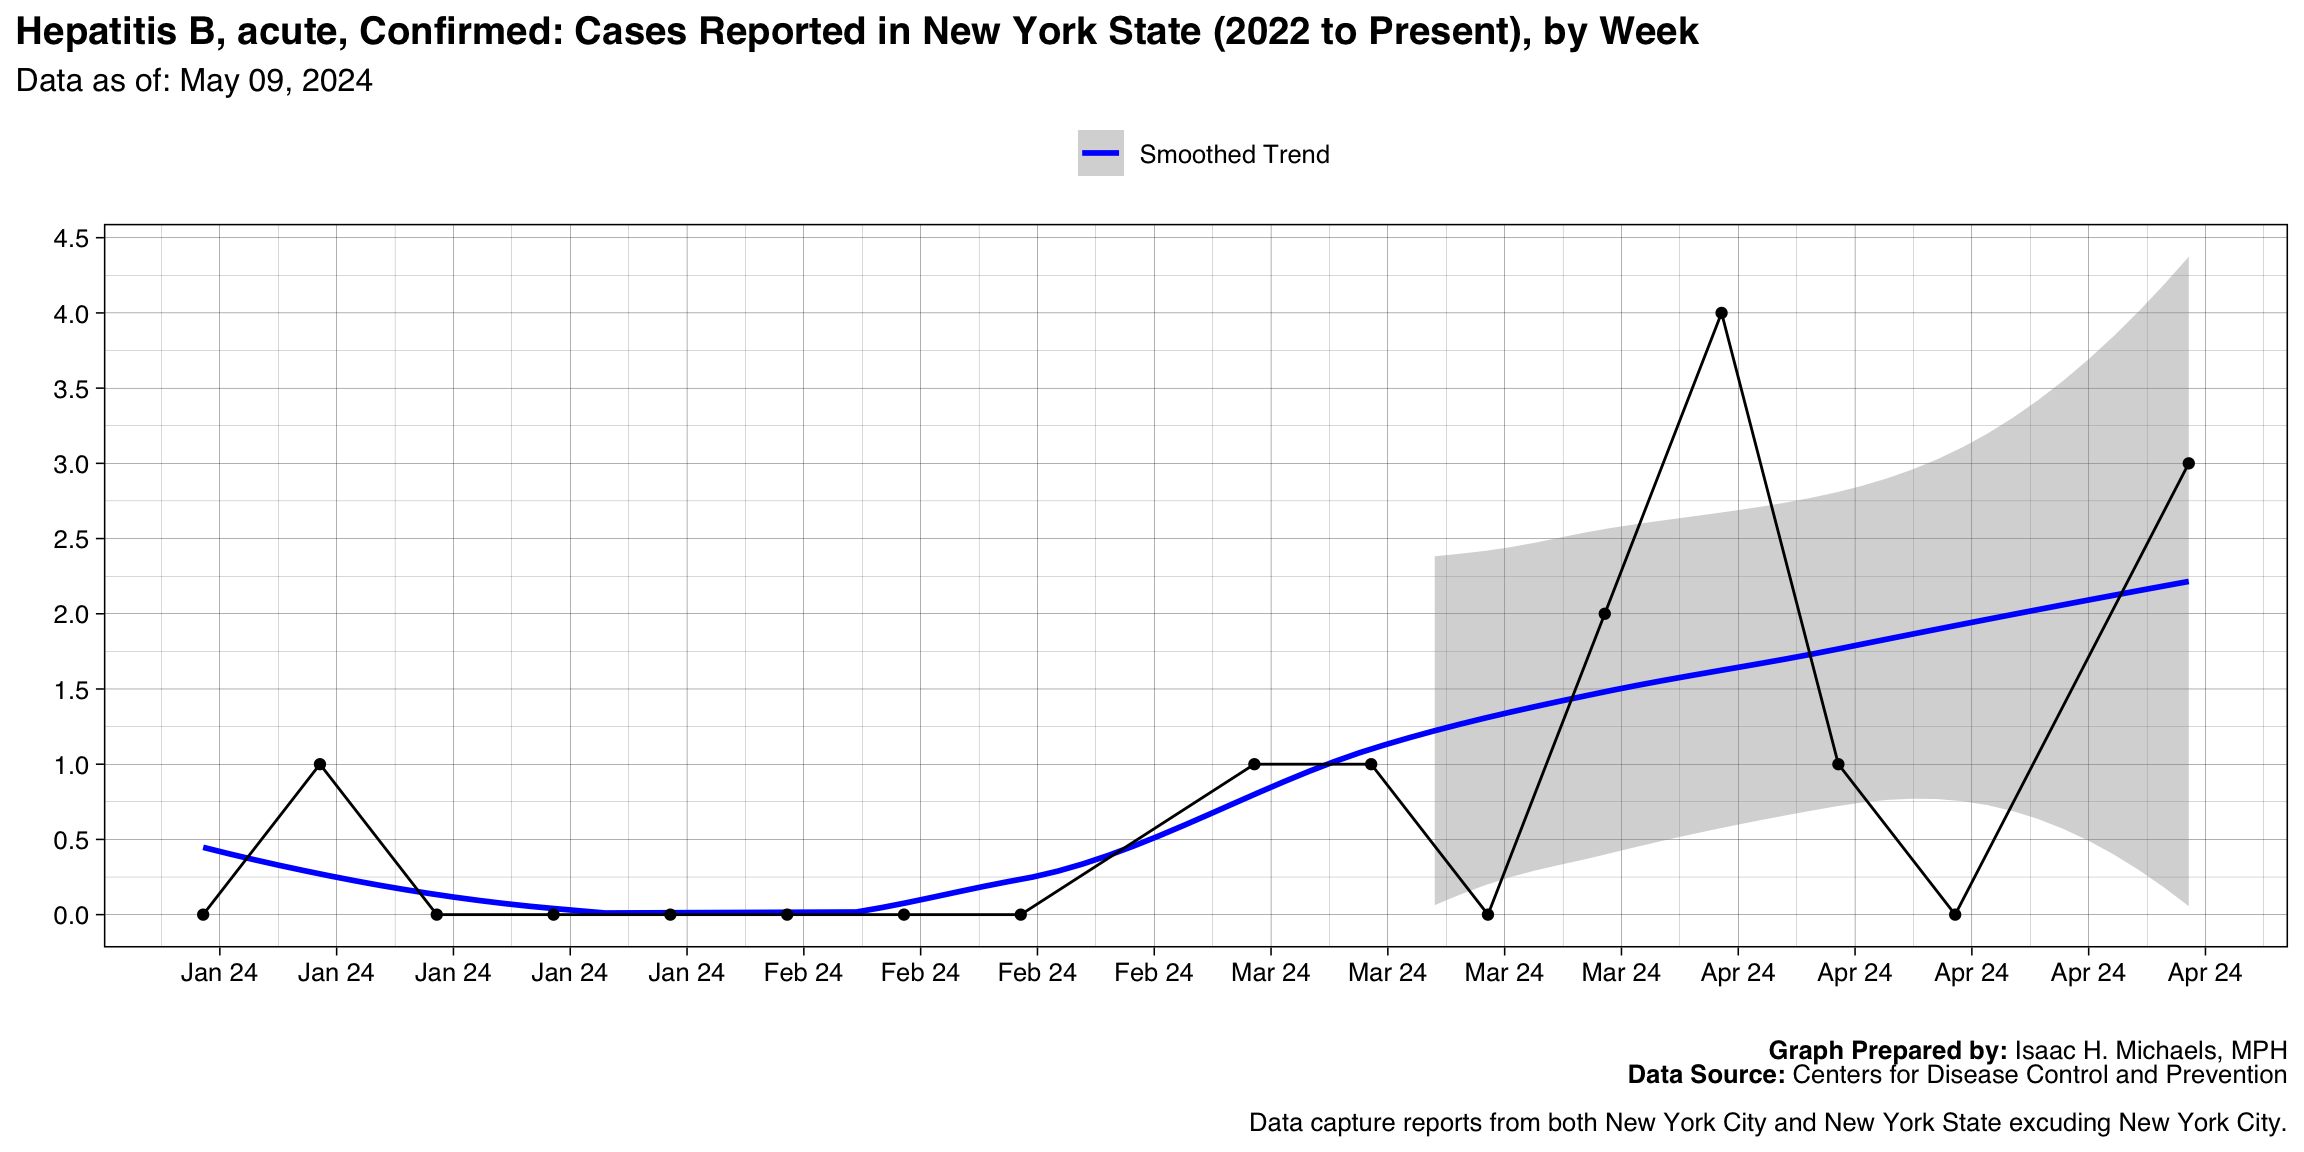
- Hepatitis B, acute, Confirmed
- Hepatitis C, acute, Probable
- Mumps
- Listeriosis, Probable
- Arboviral diseases, West Nile virus disease
- Vancomycin-intermediate Staphylococcus aureus
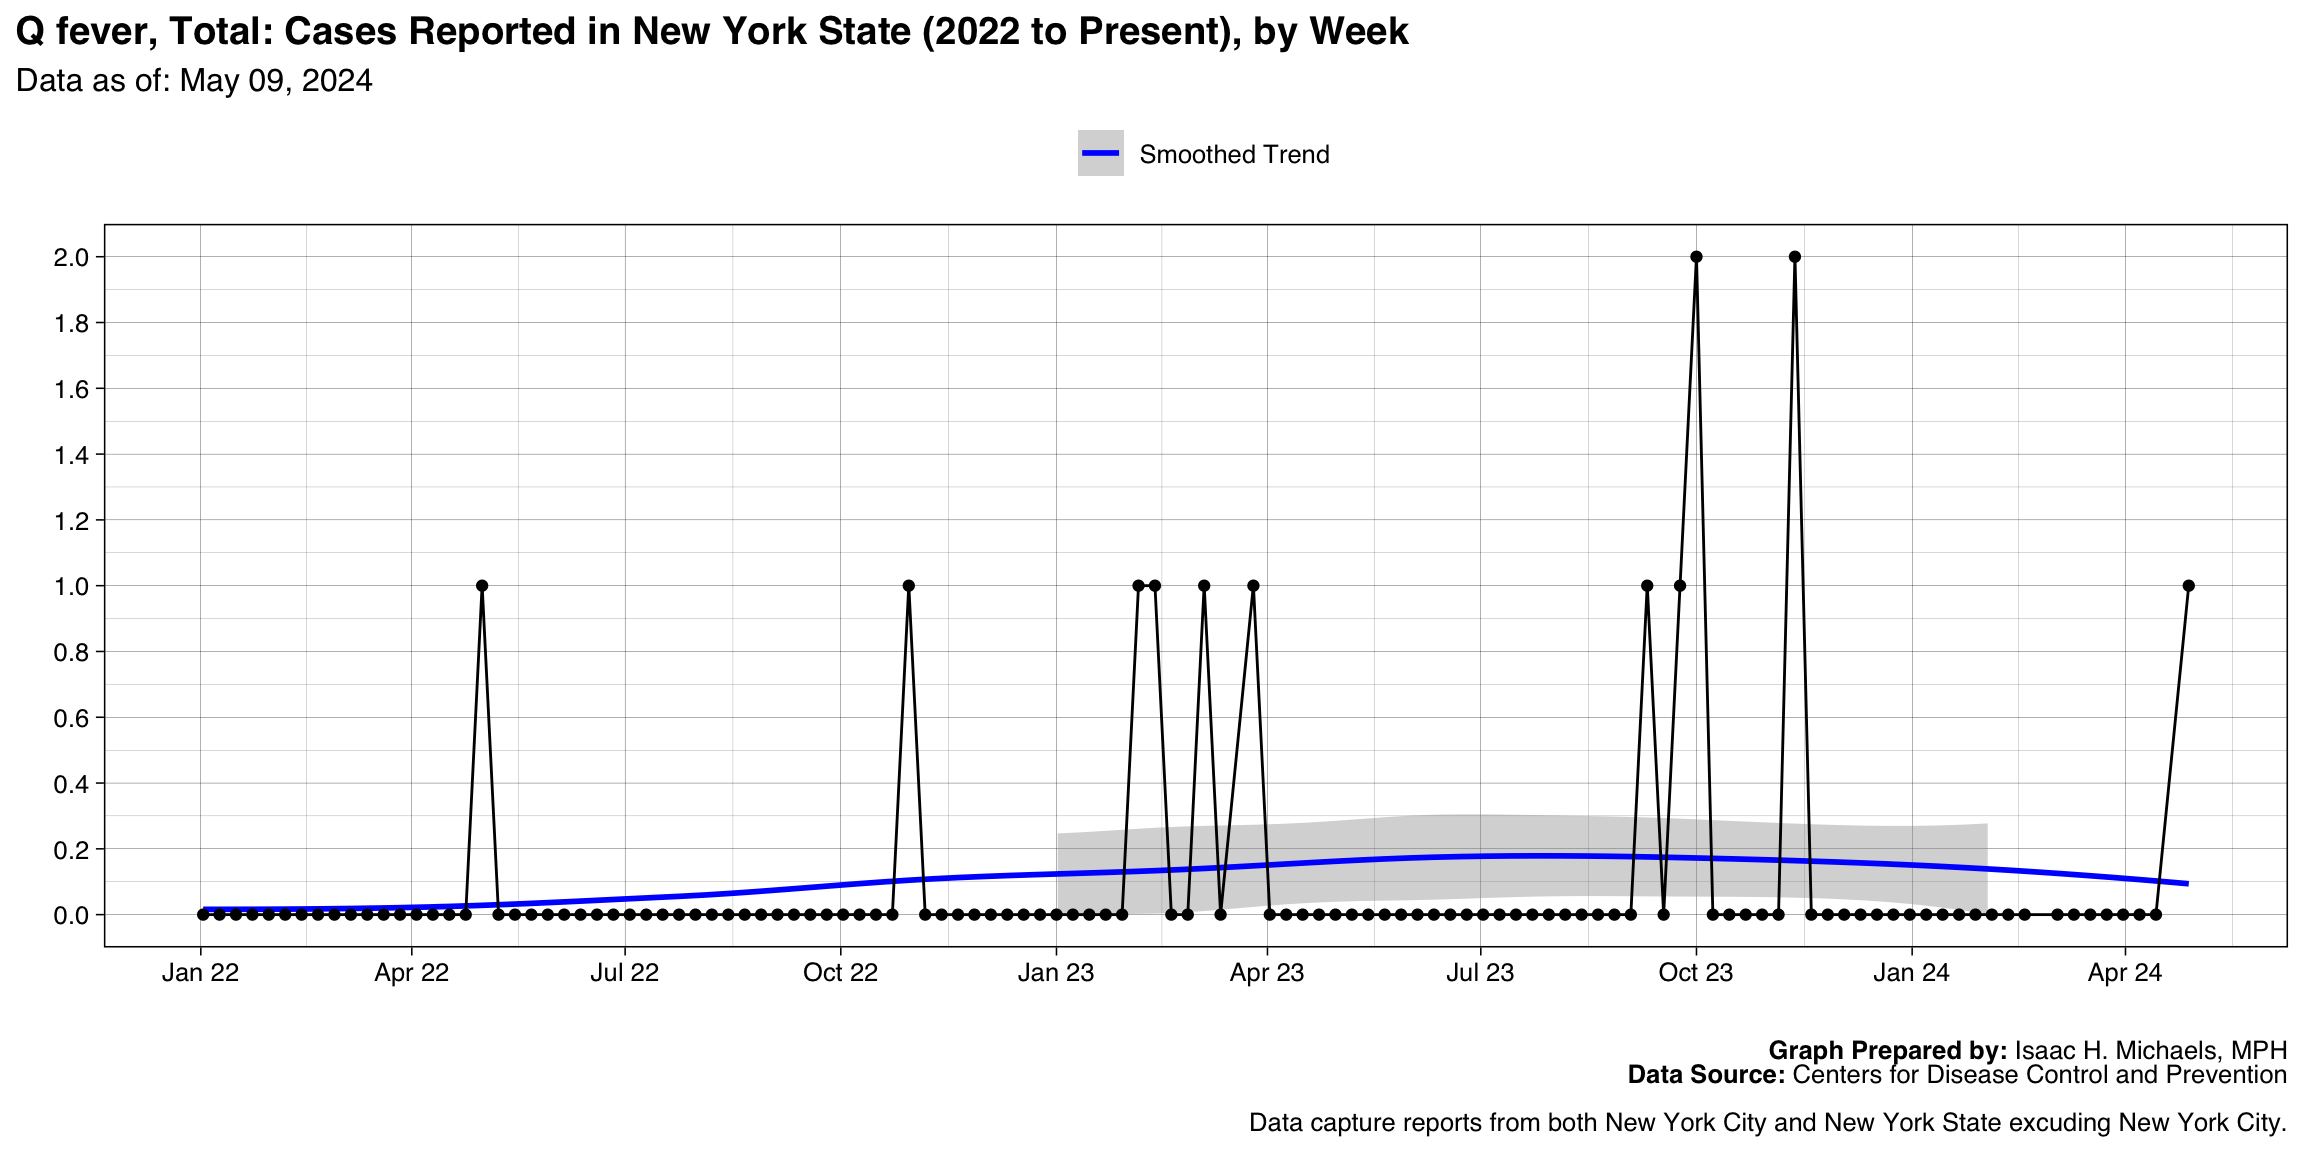
- Q fever, Total
- Ehrlichiosis and Anaplasmosis, Undetermined ehrlichiosis/anaplasmosis
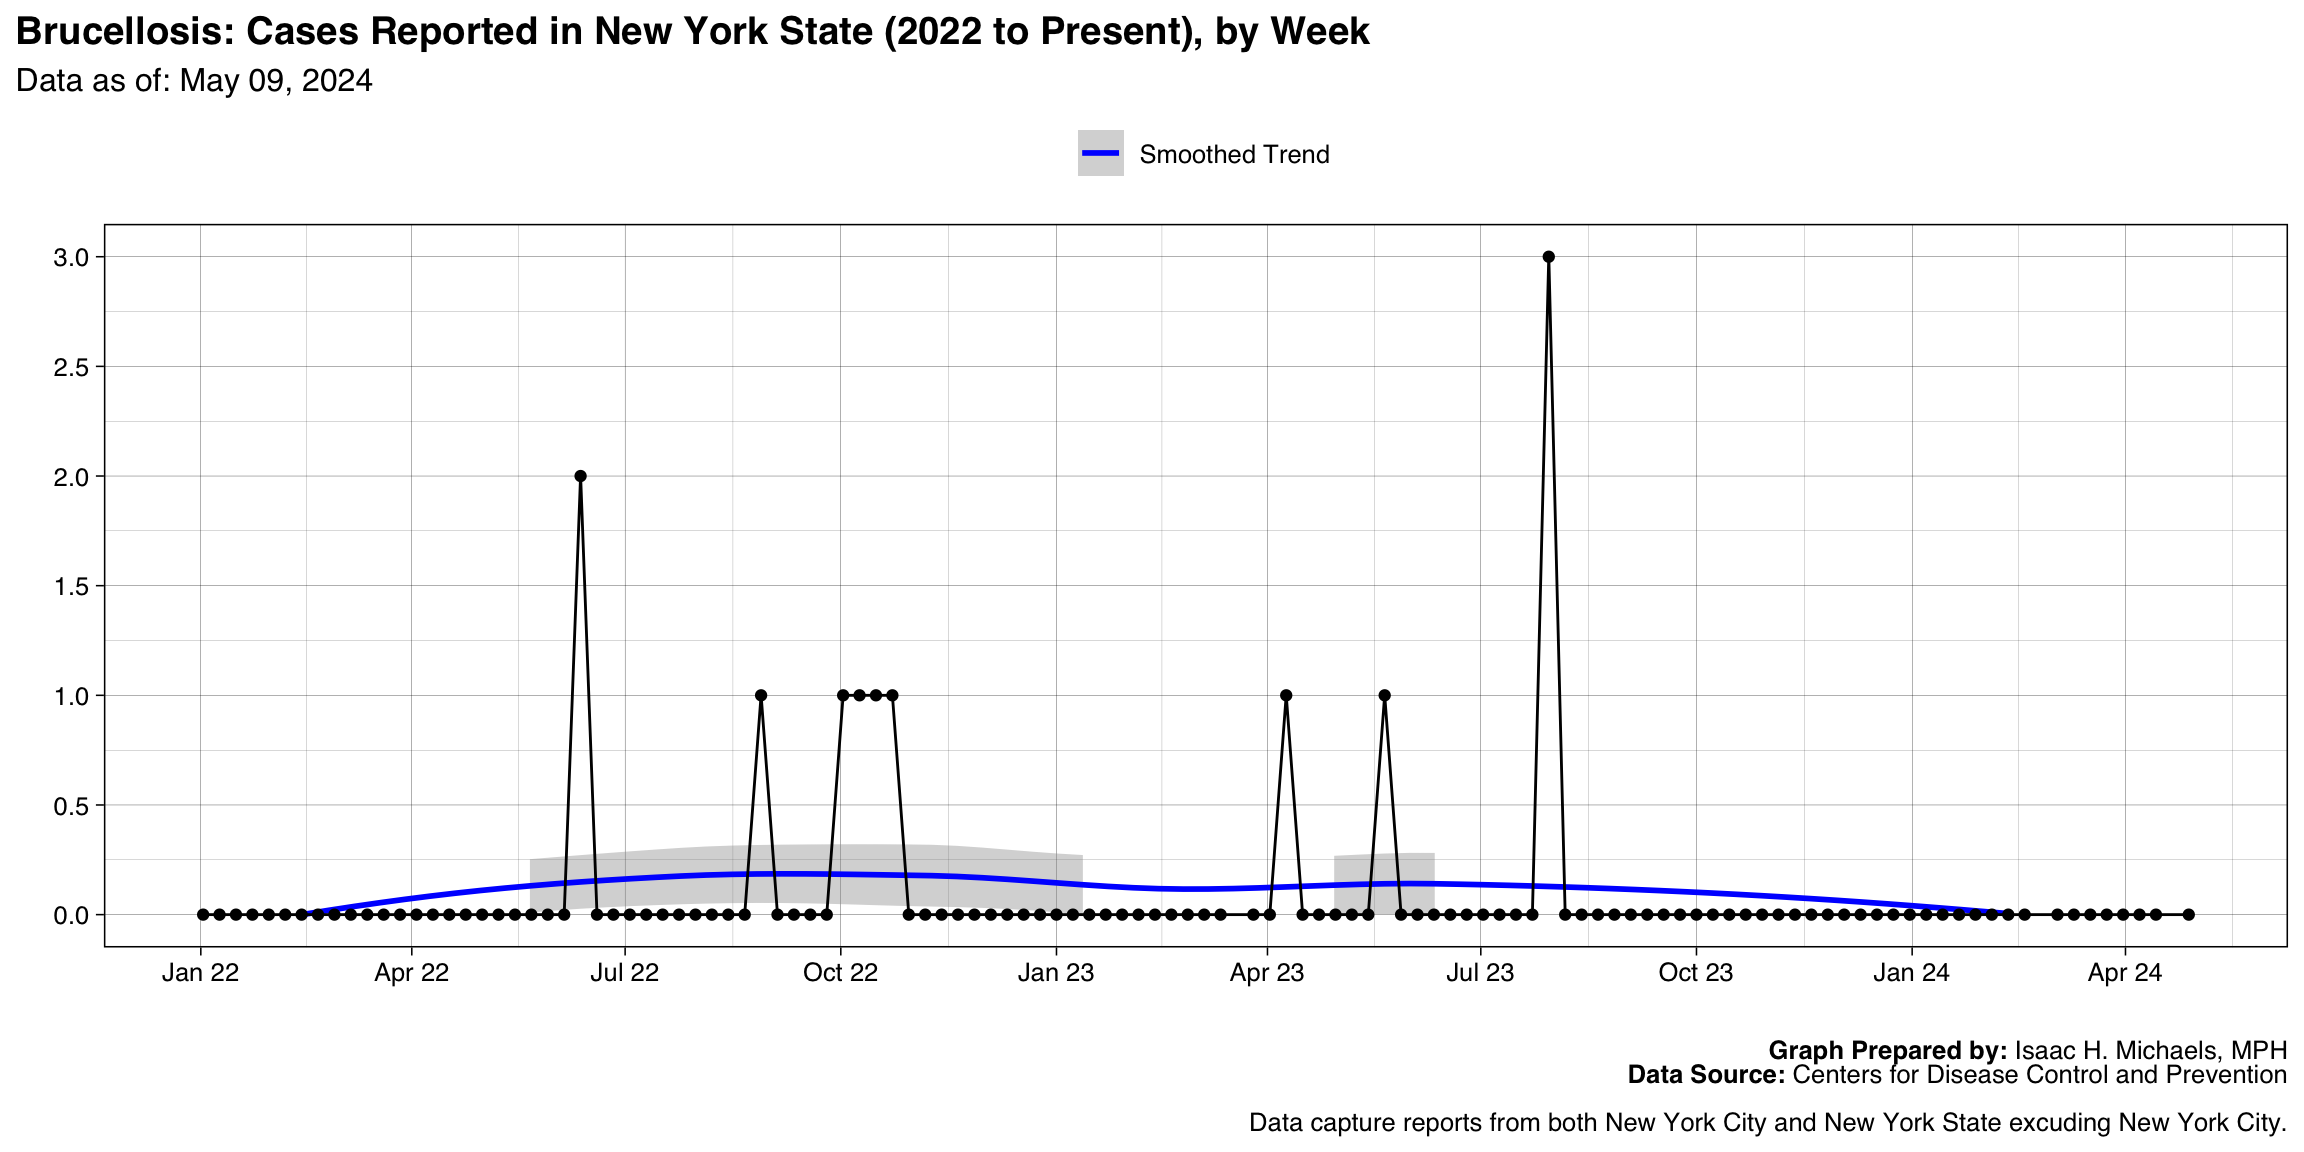
- Brucellosis
- Salmonella Paratyphi infection
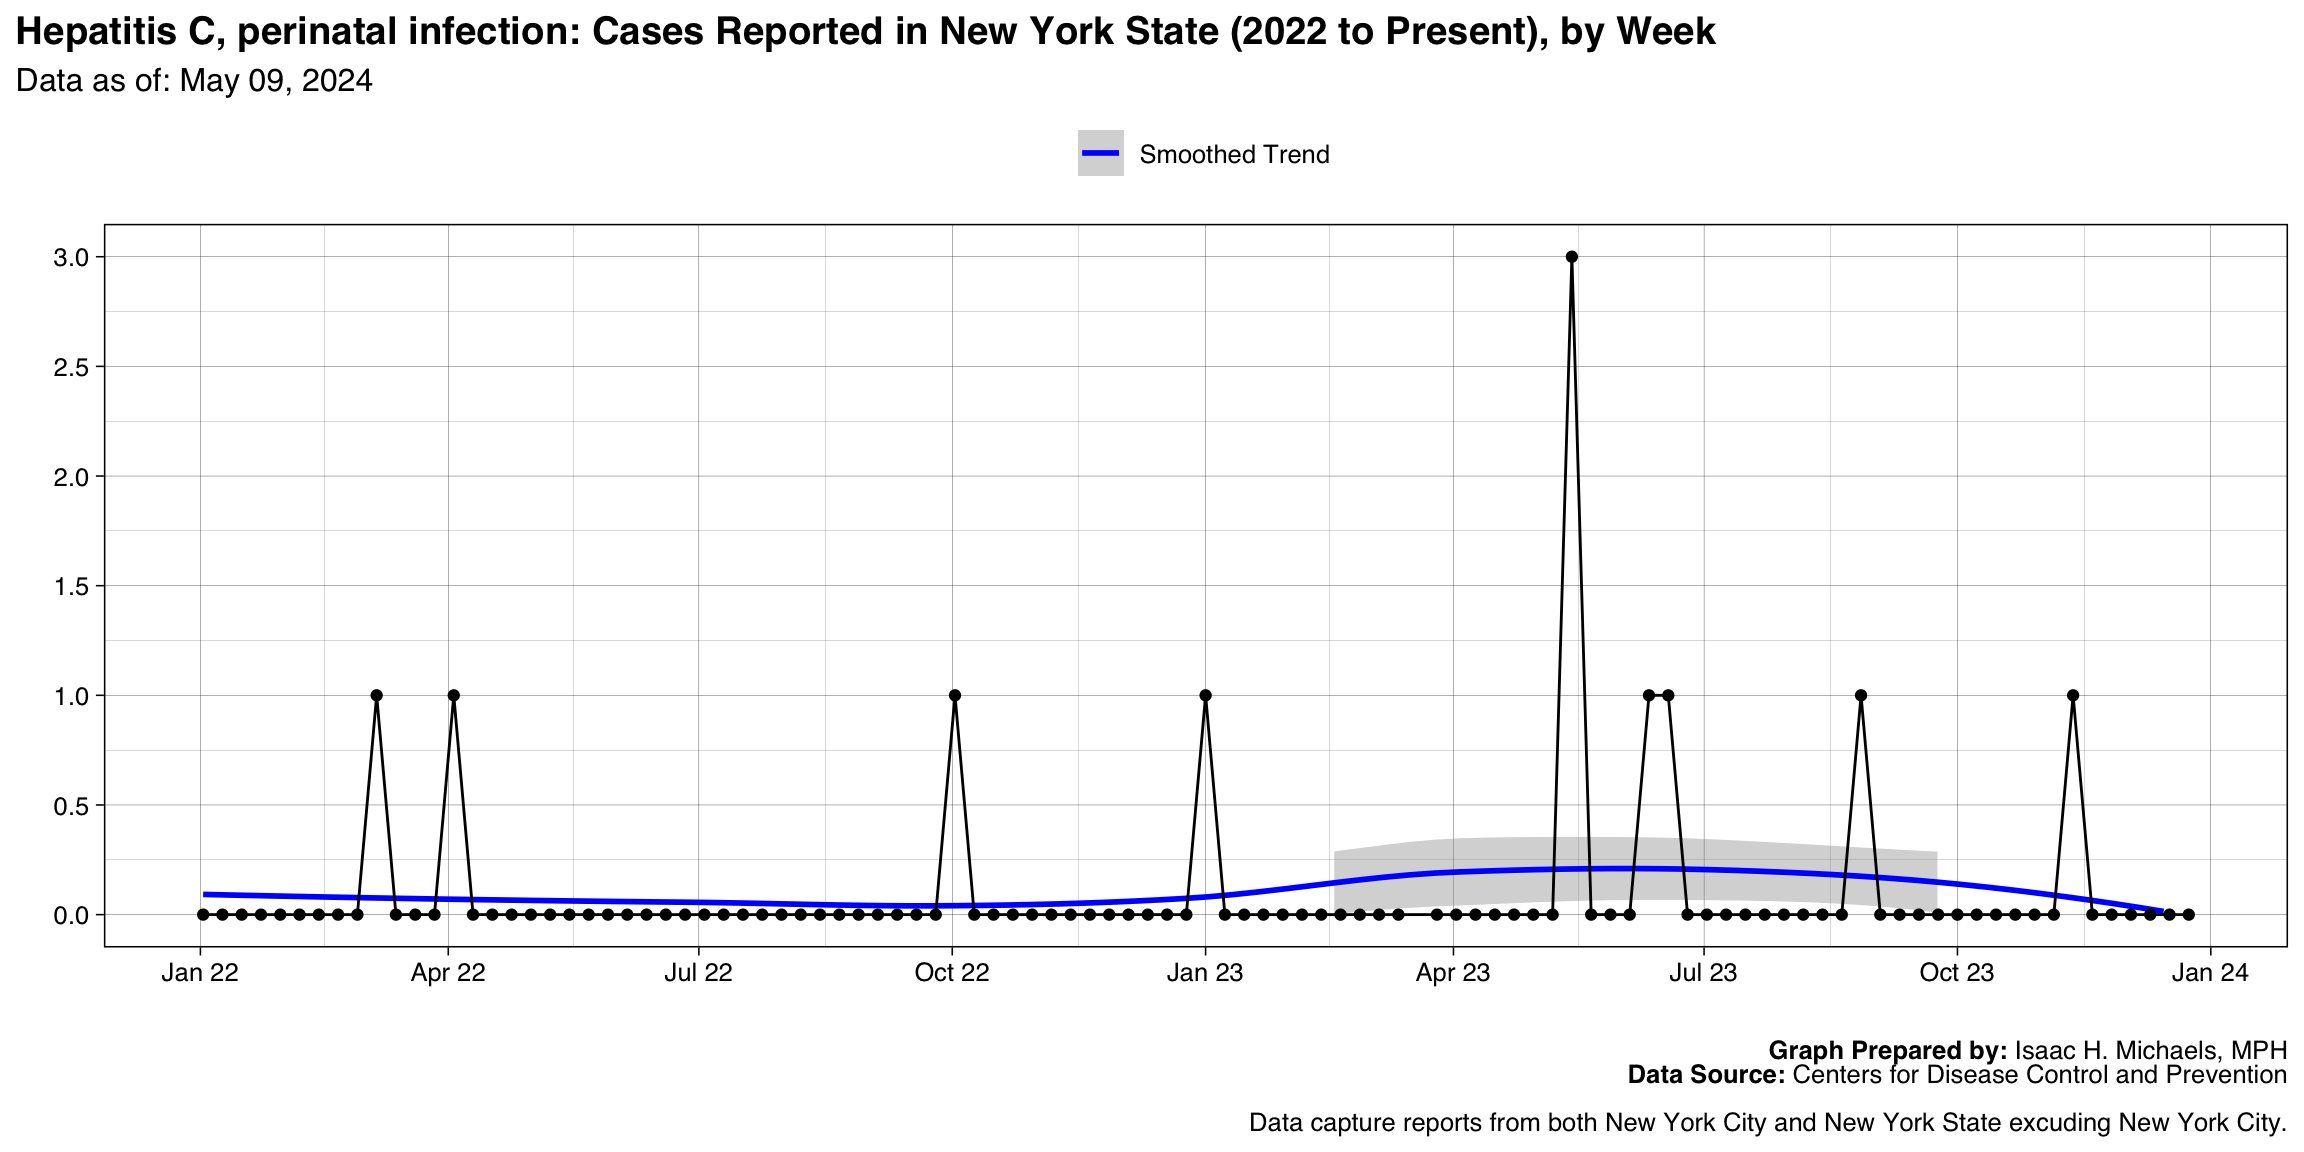
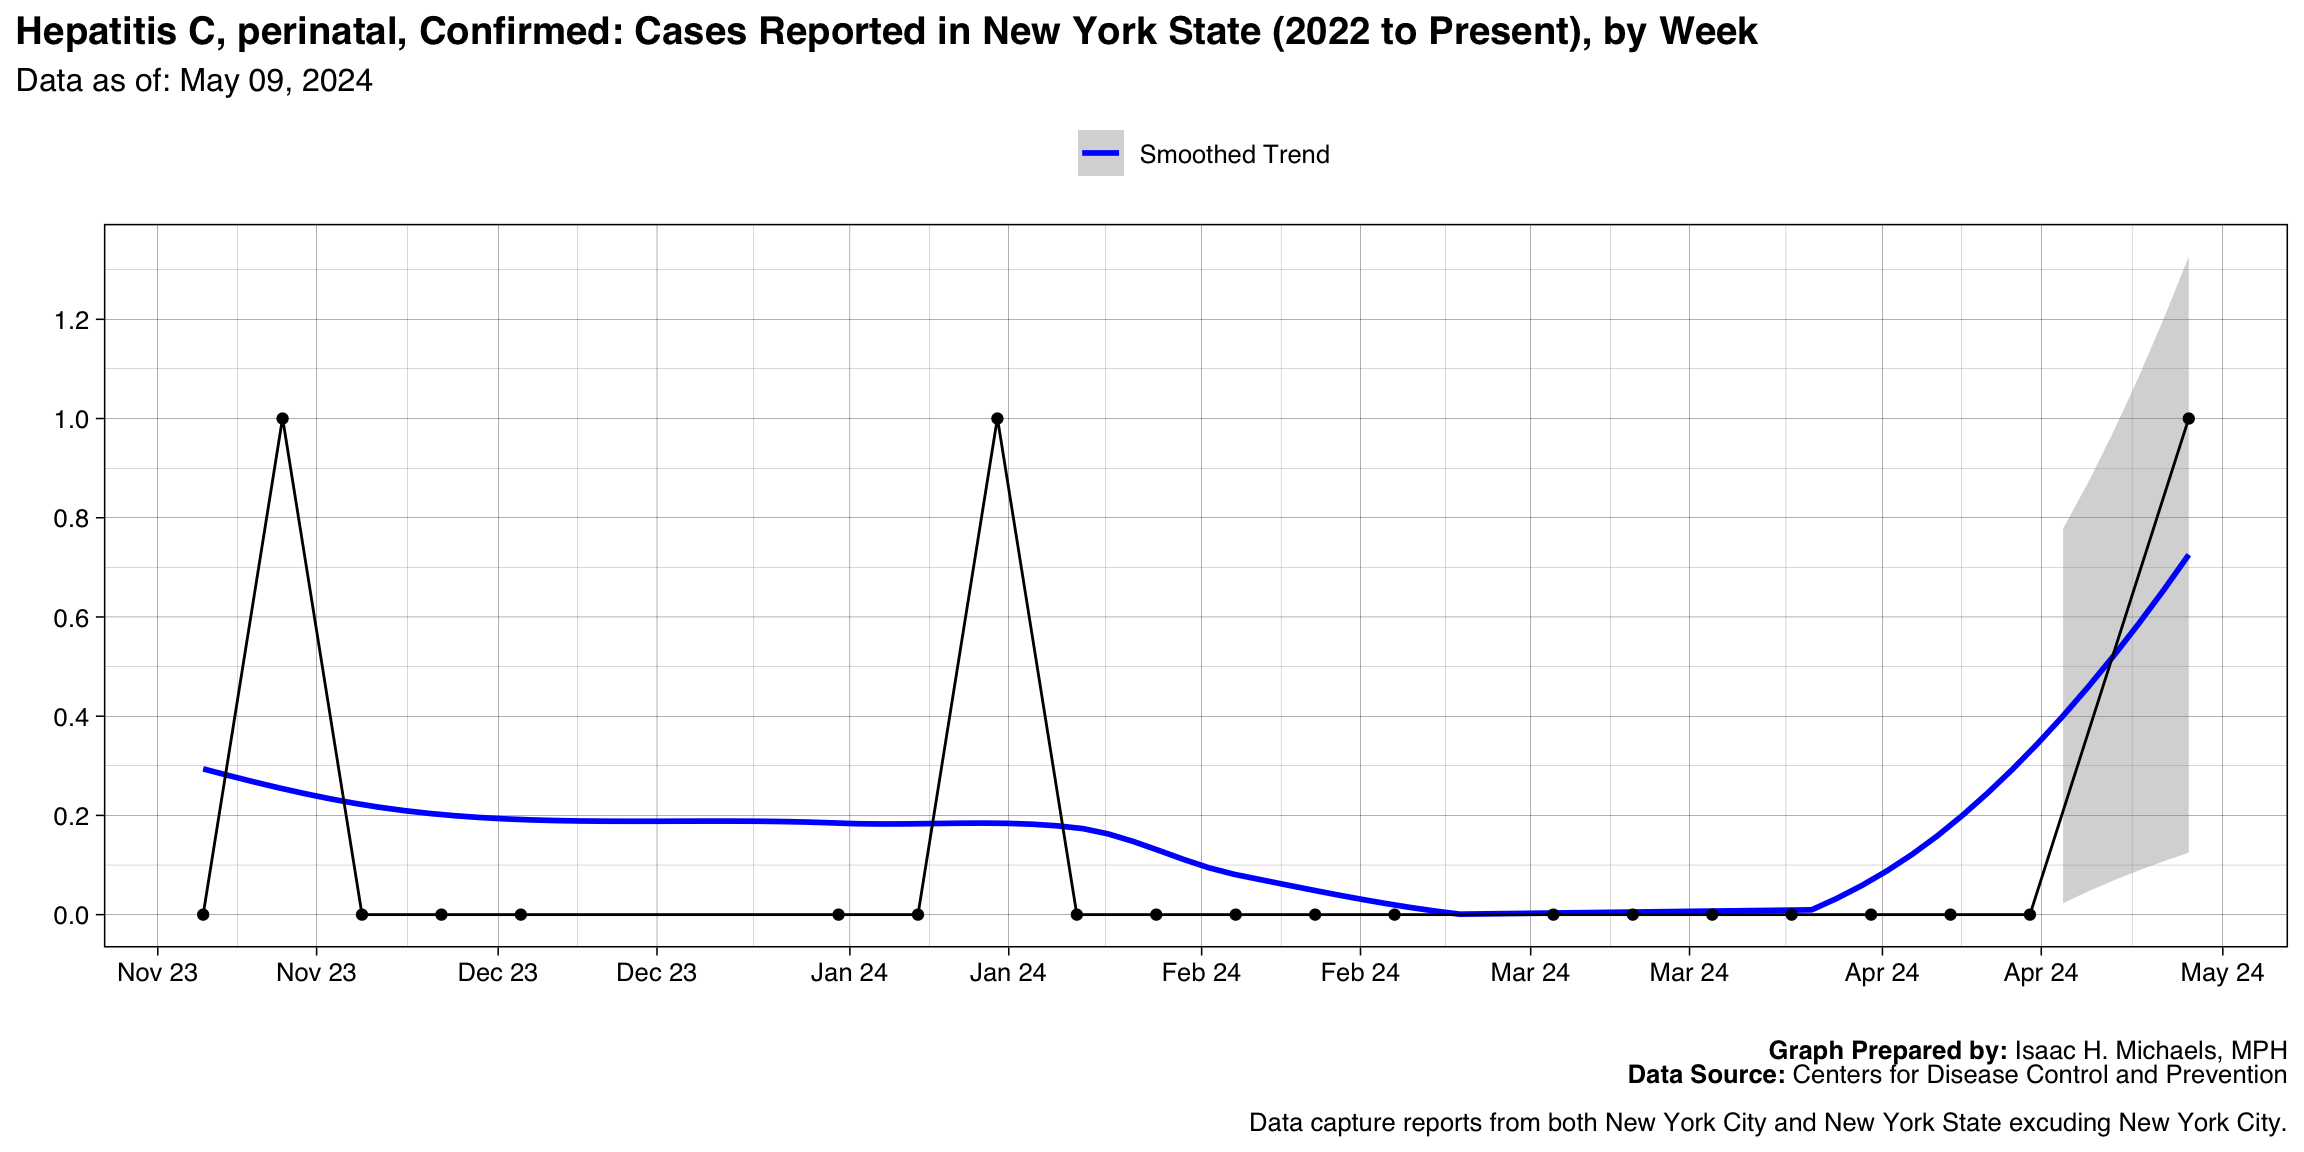
- Hepatitis C, perinatal infection
- Influenza-associated pediatric mortality
- Q fever, Acute
- Invasive pneumococcal disease, age <5 years, Probable
- Toxic shock syndrome (other than Streptococcal)
- Arboviral diseases, Chikungunya virus disease
- Tularemia
- Haemophilus influenzae, invasive disease, Age <5 years, Nontypeable
- Hepatitis B, acute, Probable
- Q fever, Chronic
- Haemophilus influenzae, invasive disease, Age <5 years, Non-b serotype
- Haemophilus influenzae, invasive disease, Age <5 years, Serotype b
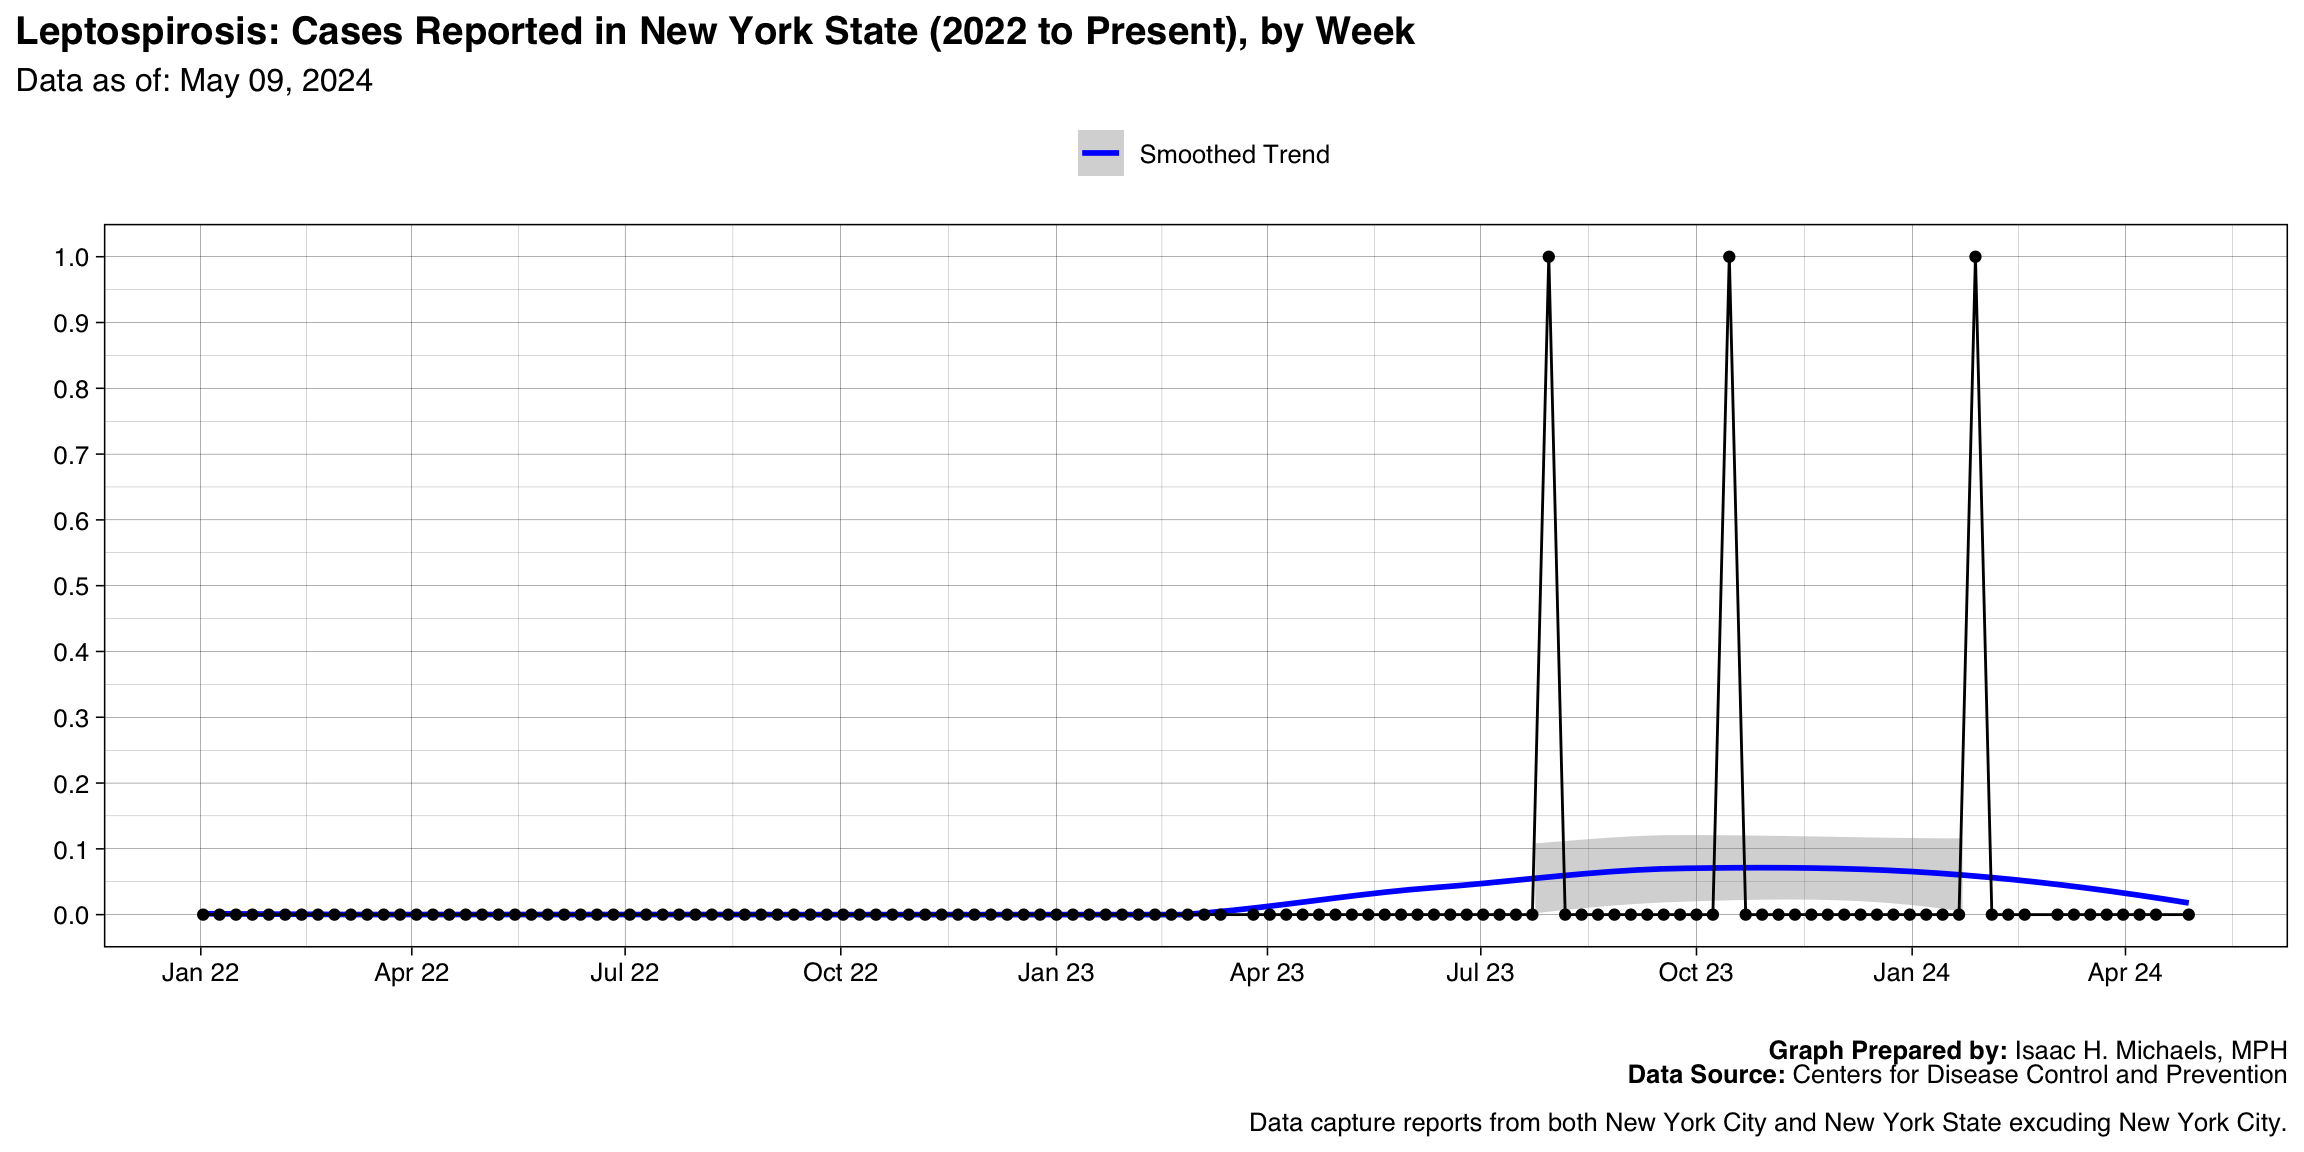
- Leptospirosis
- Ehrlichiosis and Anaplasmosis, Ehrlichia ewingii infection
- Hansen’s disease
- Hepatitis B, acute
- Hepatitis C, perinatal, Confirmed
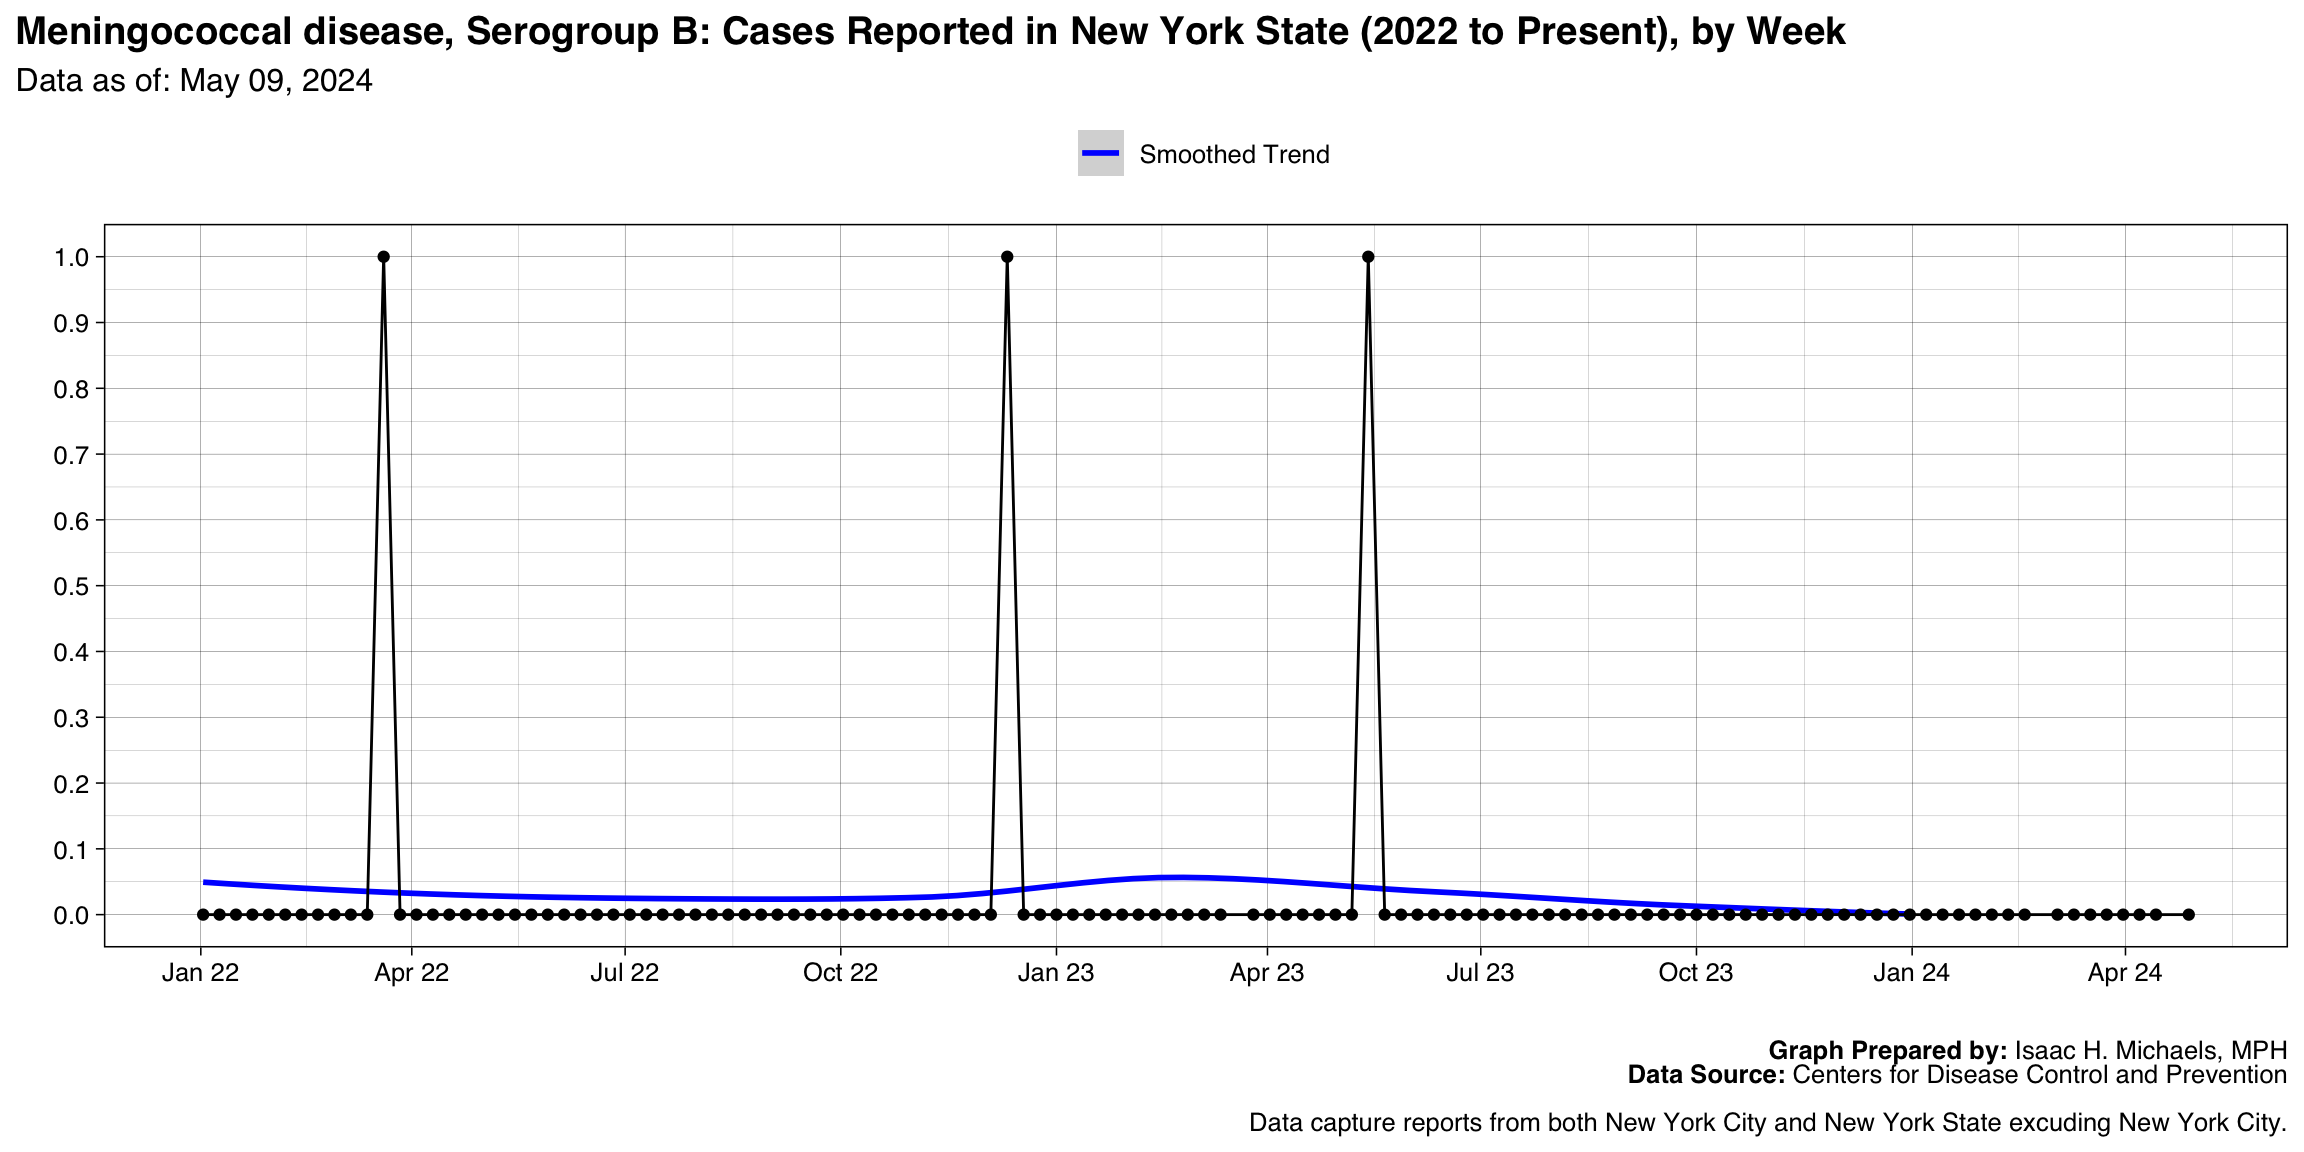
- Meningococcal disease, Serogroup B
- Botulism, Infant
- Hemolytic uremic syndrome post-diarrheal
- Meningococcal disease, Serogroups ACWY
- Arboviral diseases, Powassan virus disease
- Botulism, Other (wound & unspecified)
- Chancroid
- Hepatitis B, perinatal infection
- Measles, Imported
- Rubella
- Tetanus
Published: June 13, 2023
Updated: July 25, 2024 at 04:29PM
Welcome
Welcome to my personal data science website, where I focus on epidemiology and public health. On this page, I present data analyses on communicable disease incidence in New York State. The data used in these analyses are obtained from the Centers for Disease Control and Prevention (CDC) through the data.CDC.gov open data platform. The latest data are provisional and subject to updates.
I updated this page on a weekly basis.
Data Overview
The data presented on this page are weekly cases of selected infectious national notifiable diseases in the United States, including New York State. These cases are reported to the National Notifiable Diseases Surveillance System (NNDSS). The NNDSS data reported by the 50 states, New York City, the District of Columbia, and the U.S. territories are collated and published weekly as numbered tables by the CDC.
It’s important to note that the case counts listed in the tables are provisional and may change as additional information becomes available. State health departments report cases to the CDC for weekly publication, and ongoing revisions and delayed reporting can impact the numbers listed in later weeks. For a comprehensive understanding of interpreting these data, please refer to the Guide to Interpreting Provisional and Finalized NNDSS Data.
How to Use These Data
The data are visualized in different formats on this page, including: a heat map, a bar graph, and longitudinal trend graphs.
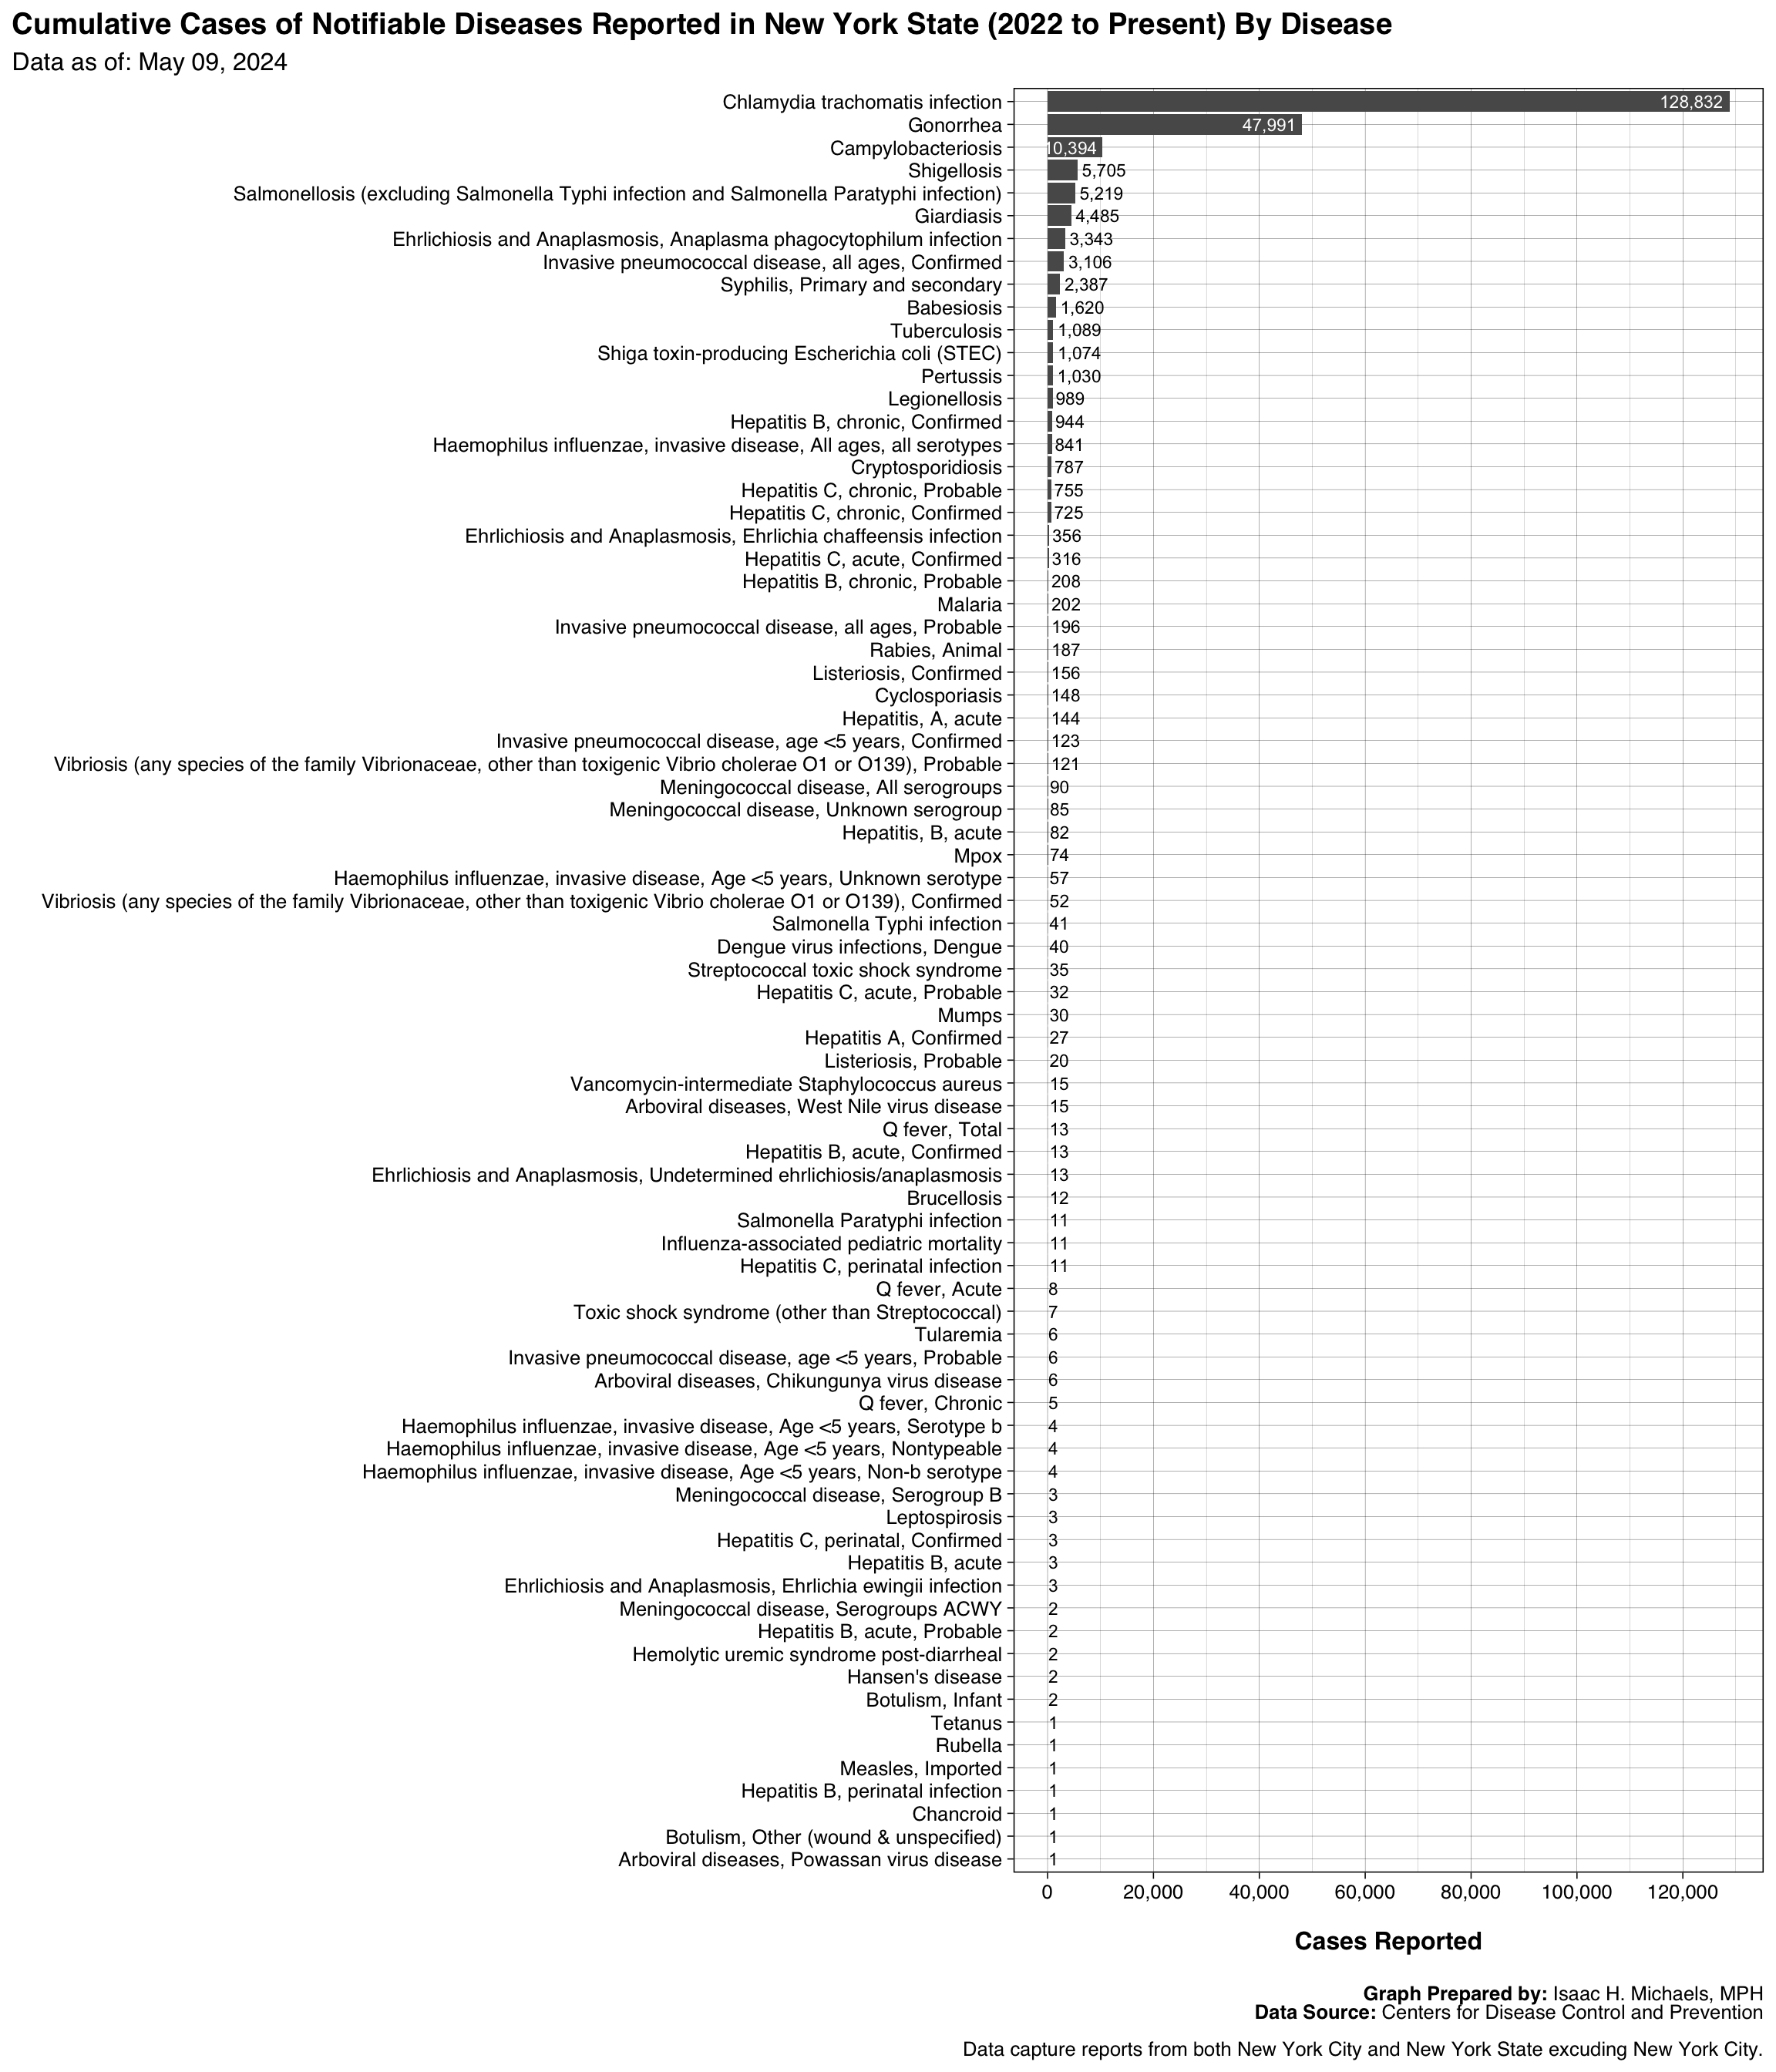
The bar graph shows the cumulative number of cases of each disease that were reported to the CDC. This graph illustrates disease burden and allows for comparisons between different diseases.
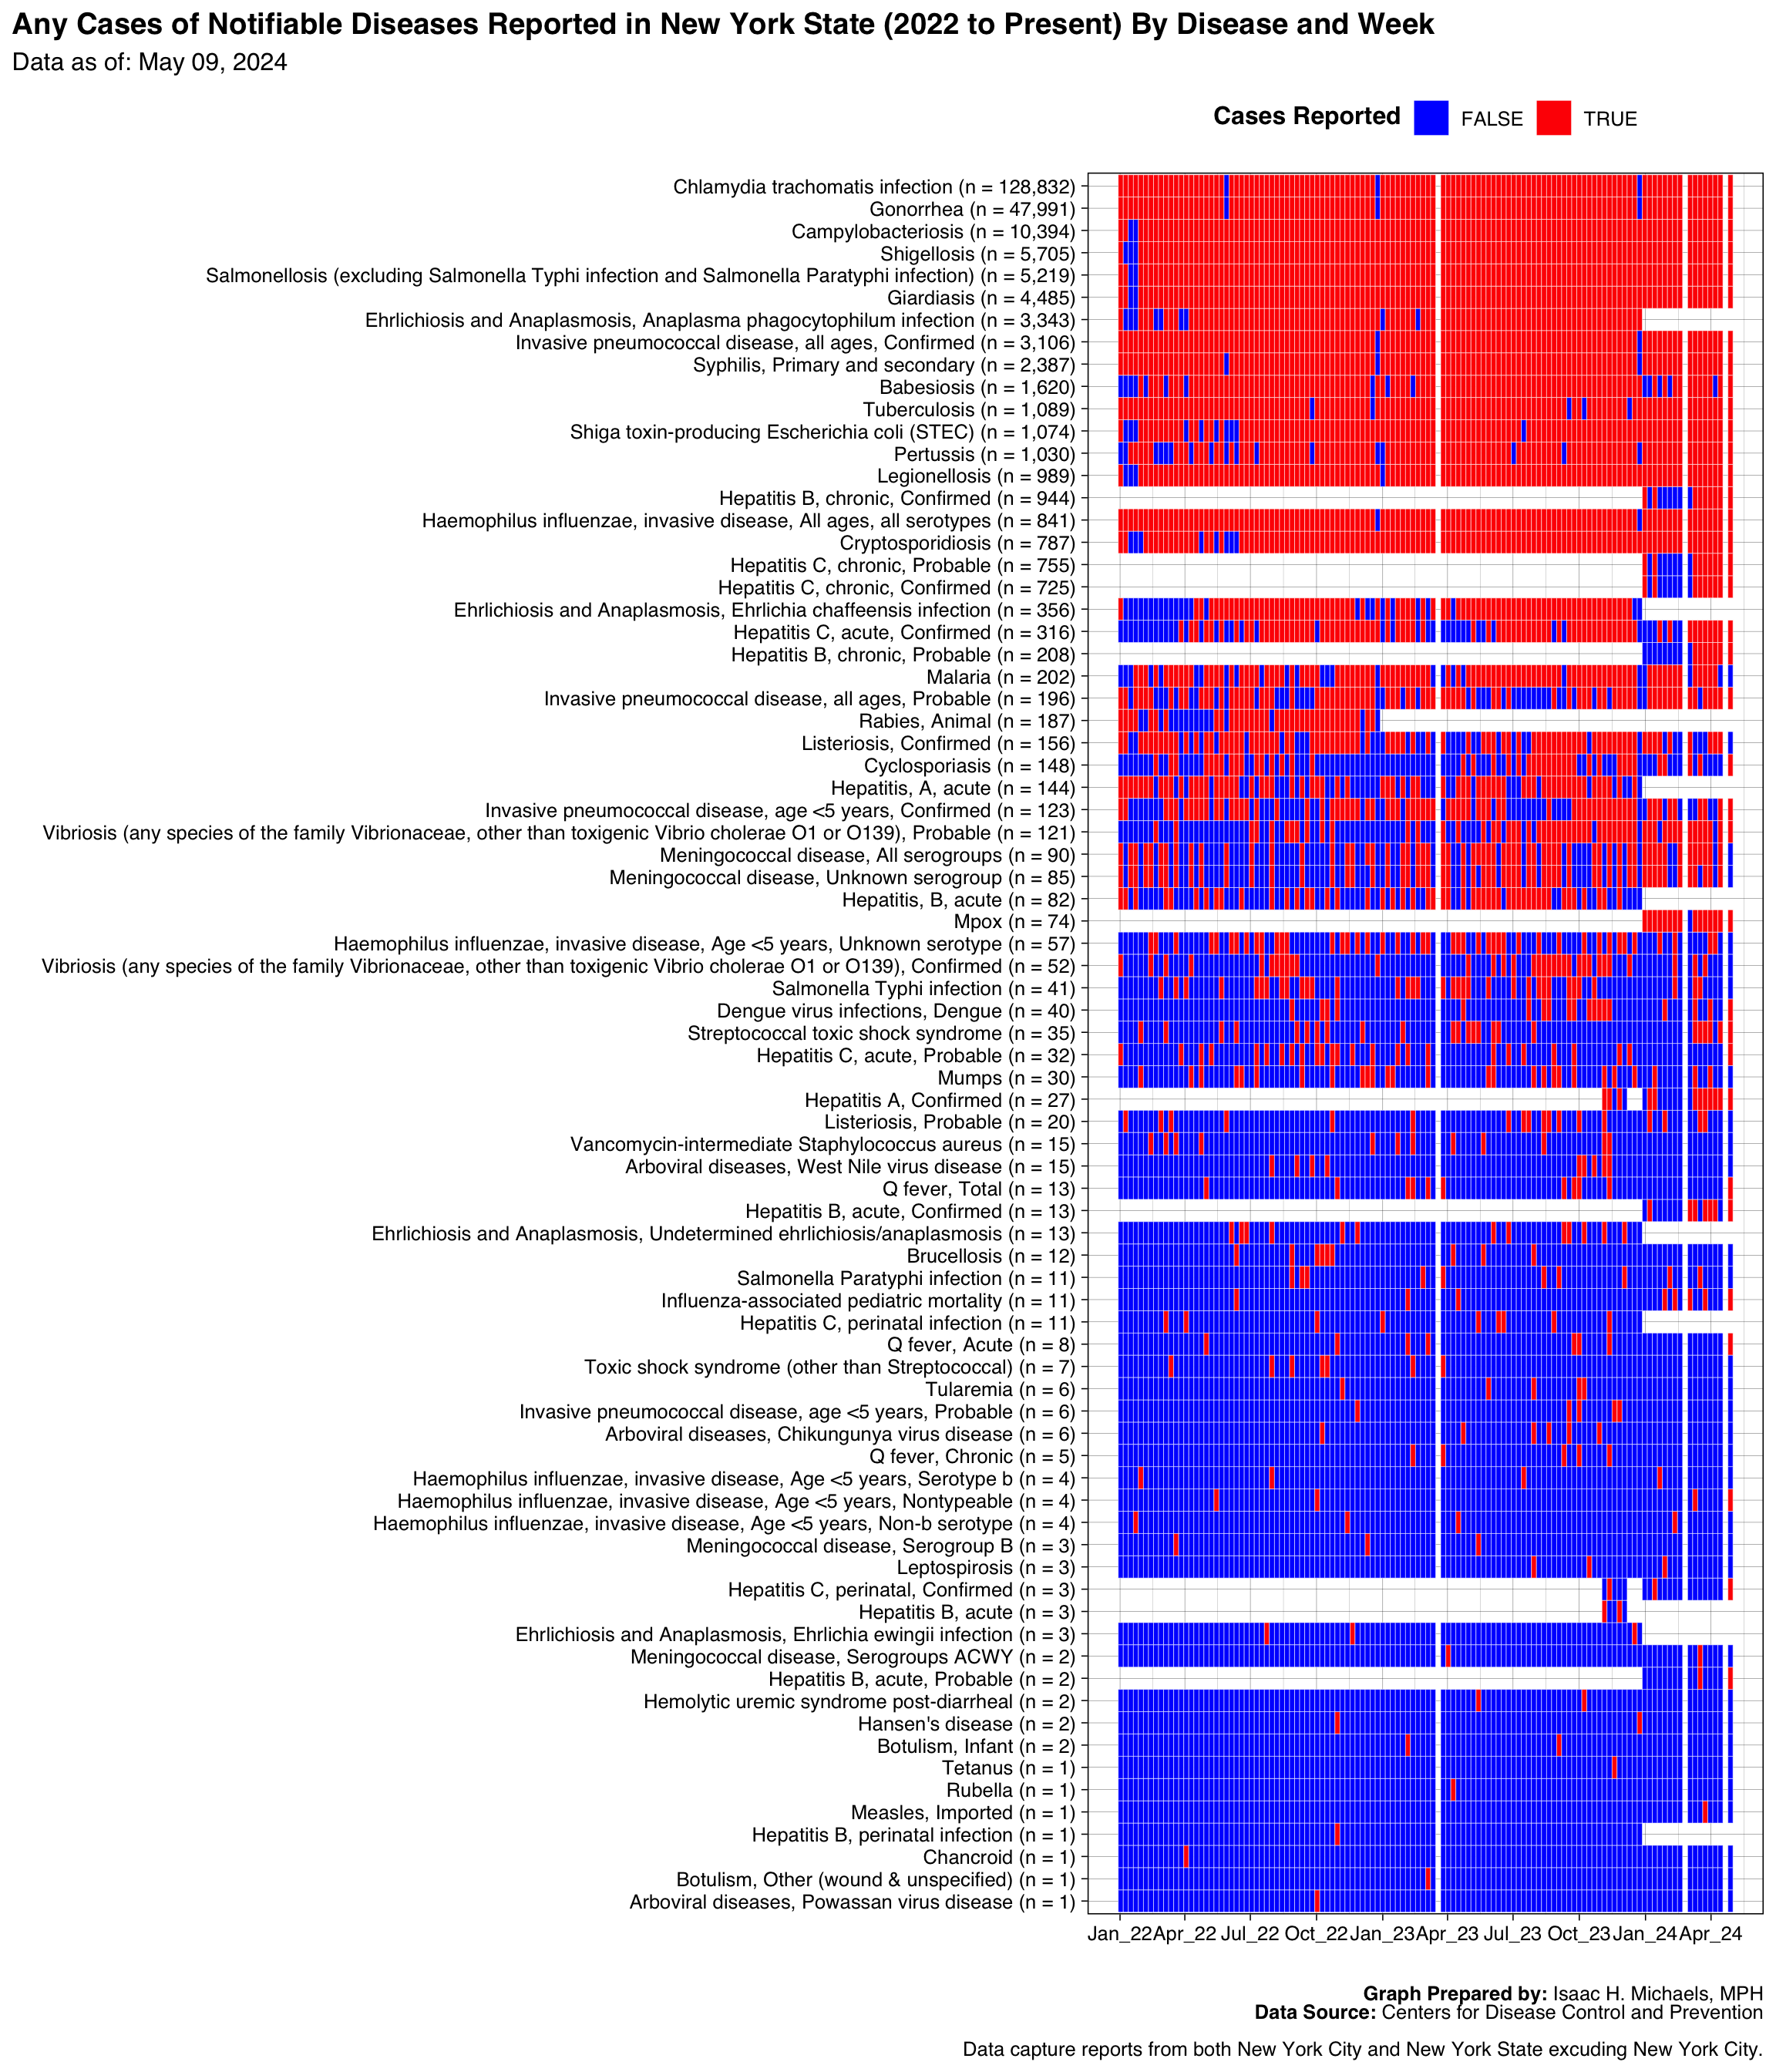
The heatmap, on the other hand, displays the weeks during which any case of a specific disease was reported to the CDC. The heatmap uses red color to indicate the weeks with any reported cases and blue color to indicate the weeks with no reported cases. The y-axis of the heatmap represents the different diseases, while the x-axis represents the weeks. This visualization helps identify the presence or absence of reported cases for each disease over time.
The longitudinal trend graphs, displayed as line graphs, show the incidence of each disease over time. Each disease is represented by a separate line on the graph, allowing you to observe changes in disease occurrence and identify any seasonal patterns or long-term trends.
Why Are These Data Important?
These data play a crucial role in monitoring and understanding communicable diseases in New York State. By tracking the incidence of notifiable diseases, public health officials can identify outbreaks, assess the impact of interventions, and allocate resources effectively. These data inform public health policies and interventions aimed at preventing and controlling the spread of infectious diseases.
What Do These Data Show?
The longitudinal trend graphs provide a visual representation of disease incidence over time for each specific communicable disease. The line on each respective graph represents a different disease, allowing you to see the fluctuations and trends in disease occurrence. By analyzing these graphs, you can gain insights into the seasonality, patterns, and changes in disease incidence over time.
The heatmap, with its red and blue colors, allows you to identify the weeks when any cases of a specific disease were reported (red) and when no cases were reported (blue). By observing the heatmap, you can visualize the temporal distribution of disease occurrence and identify any clusters or periods of increased or decreased disease activity.
What Do These Data Not Show?
While these data provide valuable information on the incidence of notifiable diseases, it’s important to note their limitations. The data only include cases that are reported to the CDC and may not capture the complete picture of disease incidence in New York State. Some cases may go unreported or may not meet the criteria for being included in the notifiable diseases list.
Additionally, the data are provisional and subject to updates. As more information becomes available and reporting is finalized, the case counts may change. Therefore, it’s crucial to interpret these data with caution and consider them as a snapshot of disease incidence at a specific point in time.
Implications for Public Health Practice
These data have significant implications for public health practice in New York State. By analyzing the trends and patterns in disease incidence, public health professionals can identify priority areas for intervention, allocate resources effectively, and develop targeted strategies to prevent and control communicable diseases. The insights gained from these data can inform decision-making, guide surveillance efforts, and contribute to evidence-based public health policies.
Thank you for visiting my website and exploring the data analyses on communicable disease incidence in New York State. I hope these insights contribute to your understanding of the public health landscape and support efforts to improve population health.
Heat Map
 Graphs Prepared By: Isaac H. Michaels, MPH
Data Source: U.S. Centers for Disease Control and Prevention
Cumulative Cases
 Graphs Prepared By: Isaac H. Michaels, MPH
Data Source: U.S. Centers for Disease Control and Prevention
| Disease | Cumulative Cases |
|---|---|
| Chlamydia trachomatis infection | 139118 |
| Gonorrhea | 51513 |
| Campylobacteriosis | 12431 |
| Shigellosis | 6192 |
| Salmonellosis (excluding Salmonella Typhi infection and Salmonella Paratyphi infection) | 6161 |
| Giardiasis | 4999 |
| Invasive pneumococcal disease, all ages, Confirmed | 3398 |
| Ehrlichiosis and Anaplasmosis, Anaplasma phagocytophilum infection | 3343 |
| Syphilis, Primary and secondary | 2559 |
| Hepatitis B, chronic, Confirmed | 1836 |
| Babesiosis | 1833 |
| Hepatitis C, chronic, Probable | 1629 |
| Hepatitis C, chronic, Confirmed | 1486 |
| Pertussis | 1413 |
| Shiga toxin-producing Escherichia coli (STEC) | 1294 |
| Tuberculosis | 1208 |
| Legionellosis | 1103 |
| Haemophilus influenzae, invasive disease, All ages, all serotypes | 932 |
| Cryptosporidiosis | 904 |
| Hepatitis B, chronic, Probable | 517 |
| Ehrlichiosis and Anaplasmosis, Ehrlichia chaffeensis infection | 356 |
| Hepatitis C, acute, Confirmed | 346 |
| Invasive pneumococcal disease, all ages, Probable | 239 |
| Cyclosporiasis | 234 |
| Malaria | 218 |
| Rabies, Animal | 187 |
| Listeriosis, Confirmed | 185 |
| Vibriosis (any species of the family Vibrionaceae, other than toxigenic Vibrio cholerae O1 or O139), Probable | 158 |
| Hepatitis, A, acute | 144 |
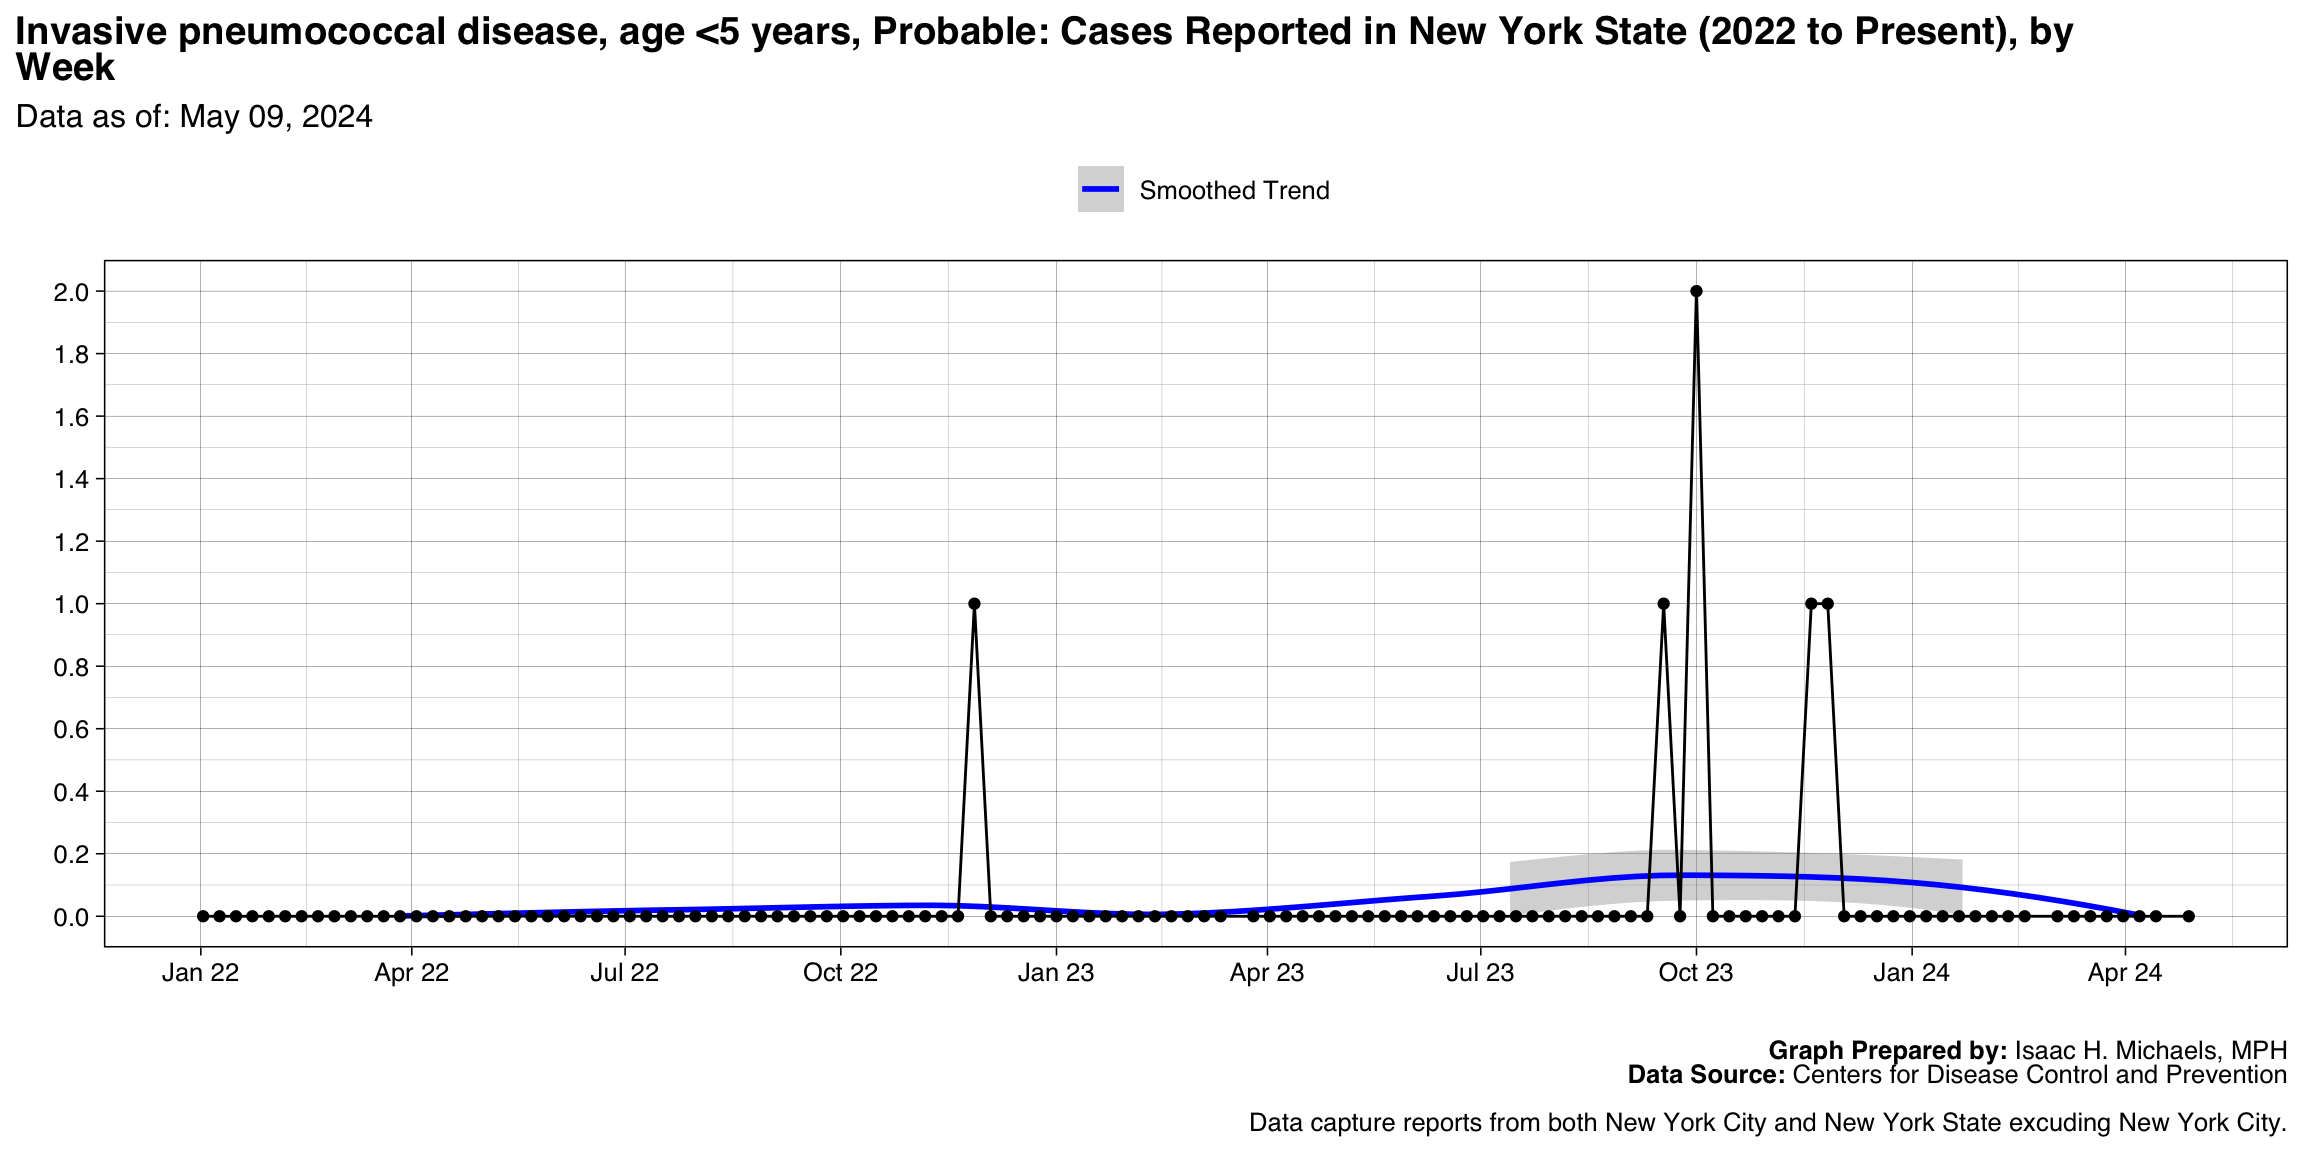
| Invasive pneumococcal disease, age <5 years, Confirmed | 129 |
| Mpox | 120 |
| Meningococcal disease, All serogroups | 99 |
| Meningococcal disease, Unknown serogroup | 94 |
| Hepatitis, B, acute | 82 |
| Vibriosis (any species of the family Vibrionaceae, other than toxigenic Vibrio cholerae O1 or O139), Confirmed | 69 |
| Haemophilus influenzae, invasive disease, Age <5 years, Unknown serotype | 62 |
| Dengue virus infections, Dengue | 52 |
| Hepatitis A, Confirmed | 46 |
| Salmonella Typhi infection | 44 |
| Streptococcal toxic shock syndrome | 39 |
| Hepatitis B, acute, Confirmed | 38 |
| Hepatitis C, acute, Probable | 38 |
| Mumps | 33 |
| Listeriosis, Probable | 26 |
| Arboviral diseases, West Nile virus disease | 15 |
| Vancomycin-intermediate Staphylococcus aureus | 15 |
| Q fever, Total | 14 |
| Ehrlichiosis and Anaplasmosis, Undetermined ehrlichiosis/anaplasmosis | 13 |
| Brucellosis | 12 |
| Salmonella Paratyphi infection | 12 |
| Hepatitis C, perinatal infection | 11 |
| Influenza-associated pediatric mortality | 11 |
| Q fever, Acute | 9 |
| Invasive pneumococcal disease, age <5 years, Probable | 7 |
| Toxic shock syndrome (other than Streptococcal) | 7 |
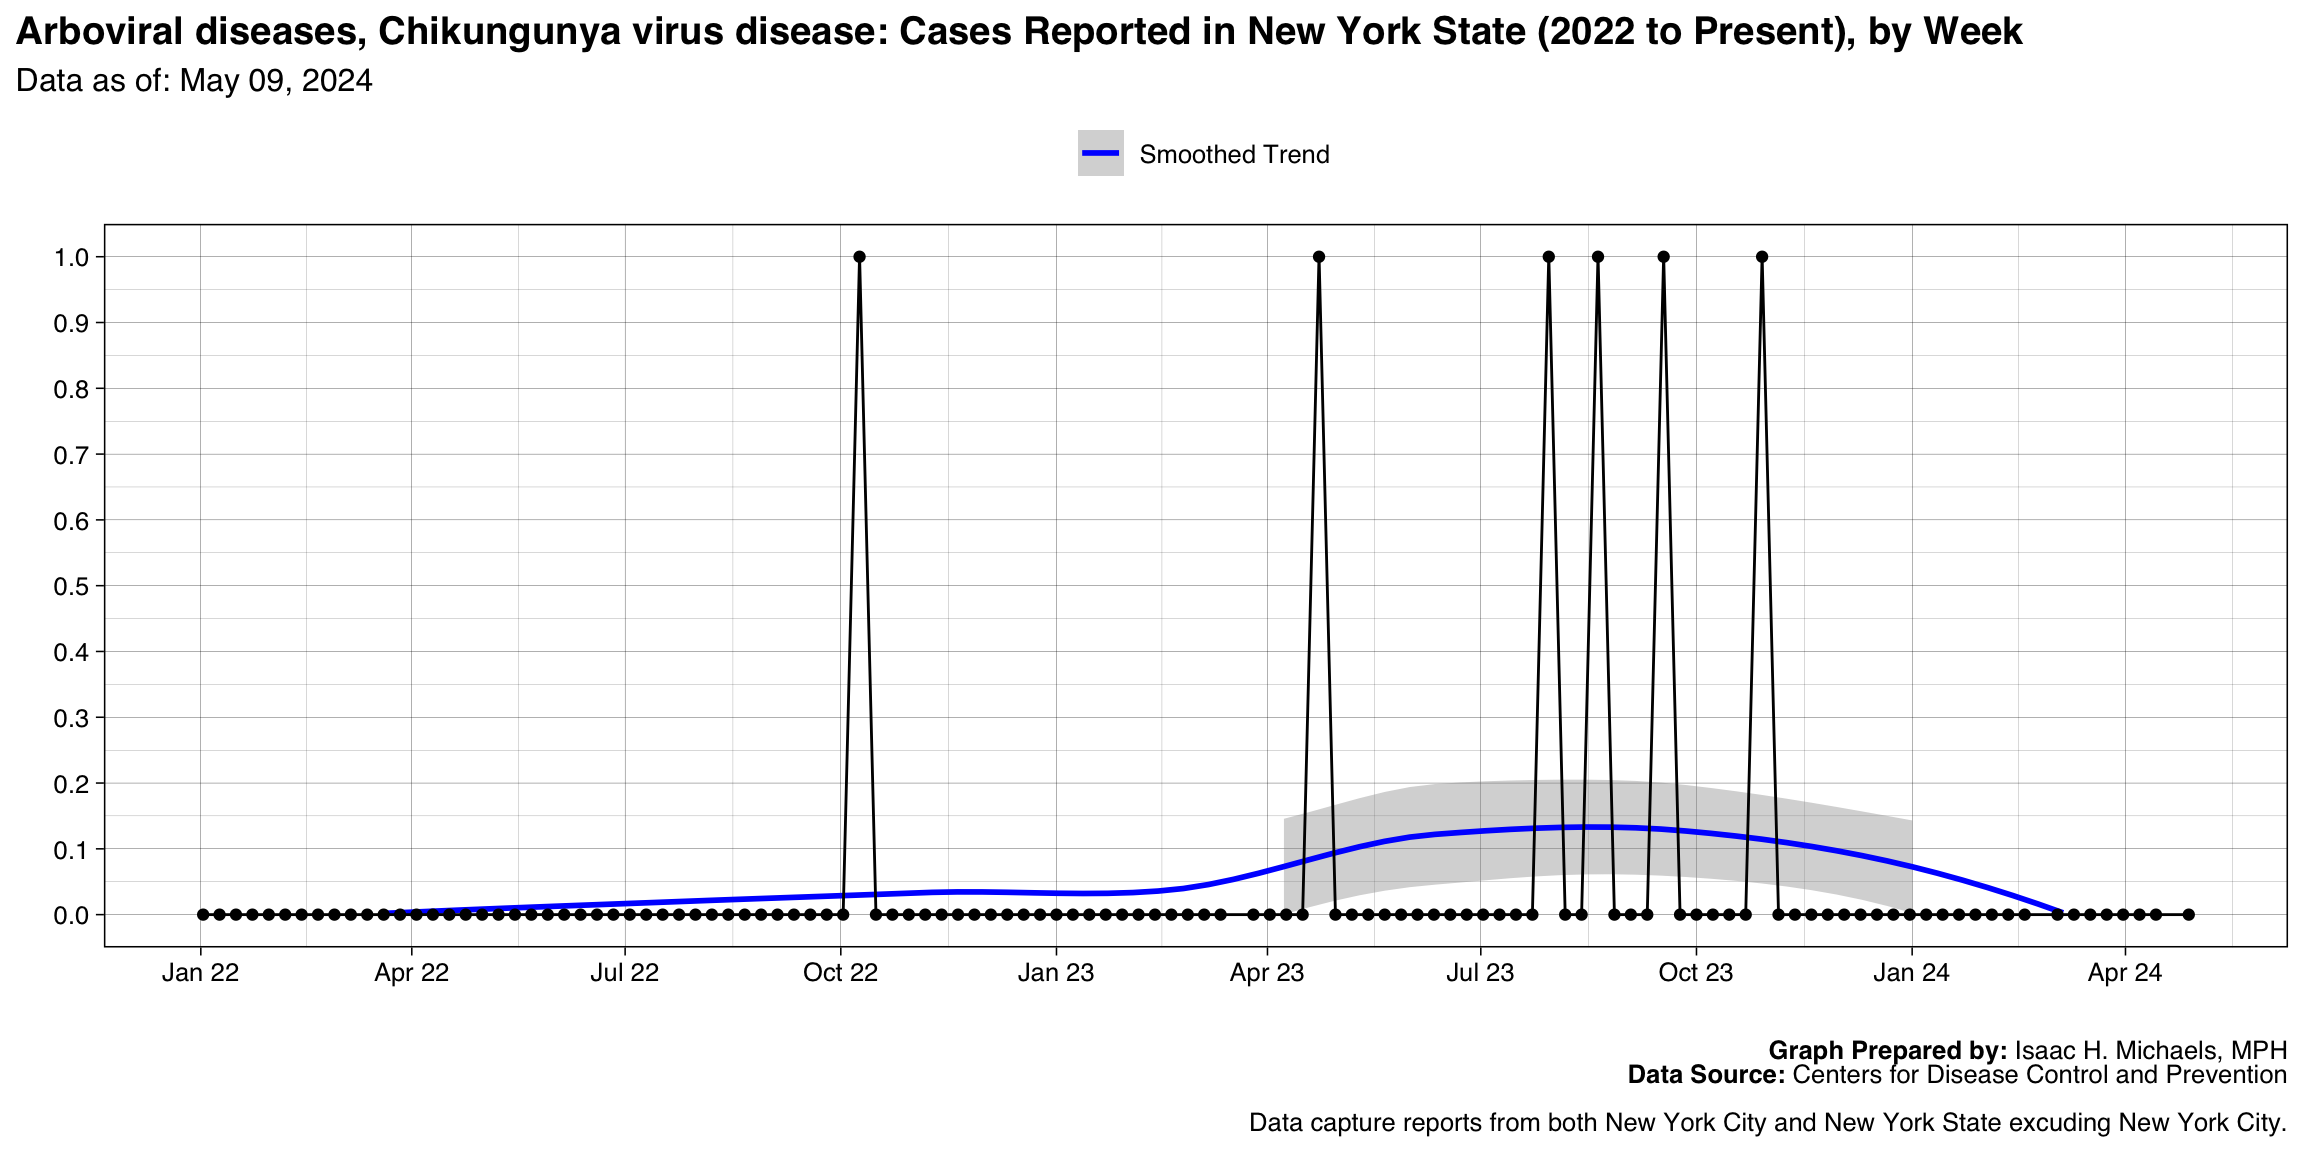
| Arboviral diseases, Chikungunya virus disease | 6 |
| Tularemia | 6 |
| Haemophilus influenzae, invasive disease, Age <5 years, Nontypeable | 5 |
| Hepatitis B, acute, Probable | 5 |
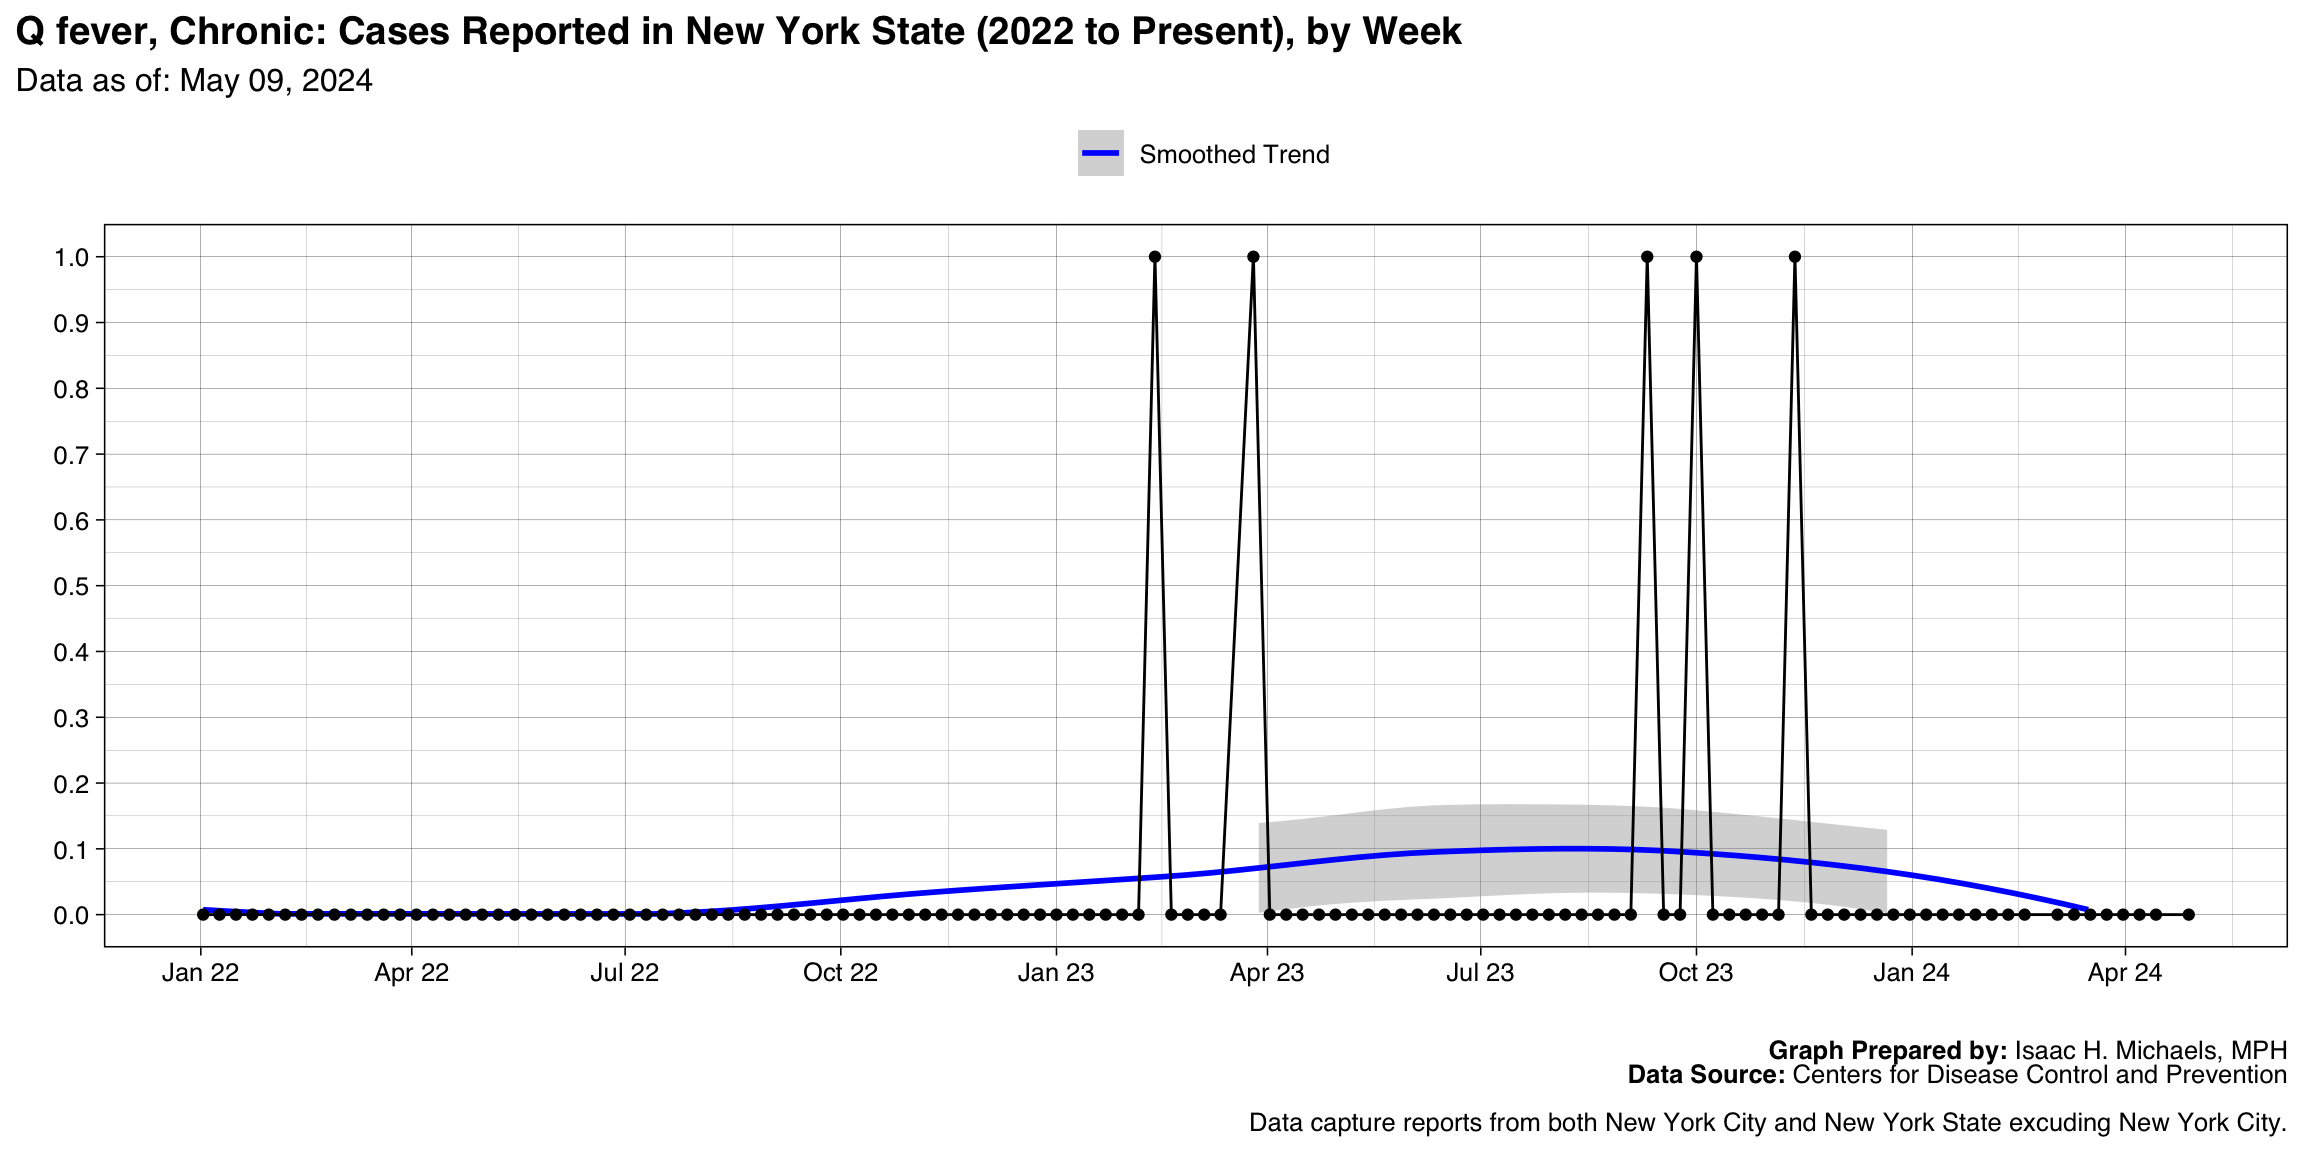
| Q fever, Chronic | 5 |
| Haemophilus influenzae, invasive disease, Age <5 years, Non-b serotype | 4 |
| Haemophilus influenzae, invasive disease, Age <5 years, Serotype b | 4 |
| Leptospirosis | 4 |
| Ehrlichiosis and Anaplasmosis, Ehrlichia ewingii infection | 3 |
| Hansen’s disease | 3 |
| Hepatitis B, acute | 3 |
| Hepatitis C, perinatal, Confirmed | 3 |
| Meningococcal disease, Serogroup B | 3 |
| Botulism, Infant | 2 |
| Hemolytic uremic syndrome post-diarrheal | 2 |
| Meningococcal disease, Serogroups ACWY | 2 |
| Arboviral diseases, Powassan virus disease | 1 |
| Botulism, Other (wound & unspecified) | 1 |
| Chancroid | 1 |
| Hepatitis B, perinatal infection | 1 |
| Measles, Imported | 1 |
| Rubella | 1 |
| Tetanus | 1 |
| Anthrax | 0 |
| Arboviral diseases, Eastern equine encephalitis virus disease | 0 |
| Arboviral diseases, Jamestown Canyon virus disease | 0 |
| Arboviral diseases, La Crosse virus disease | 0 |
| Arboviral diseases, St. Louis encephalitis virus disease | 0 |
| Arboviral diseases, Western equine encephalitis virus disease | 0 |
| Botulism, Foodborne | 0 |
| Candida auris, clinical | 0 |
| Candida auris, screening | 0 |
| Carbapenemase-Producing Organisms (CPO), Total | 0 |
| Carbapenemase-producing carbapenem-resistant Enterobacteriaceae | 0 |
| Cholera | 0 |
| Coccidioidomycosis | 0 |
| Coccidioidomycosis, Confirmed | 0 |
| Coccidioidomycosis, Probable | 0 |
| Coccidioidomycosis, total | 0 |
| Cronobacter invasive infection, infants, Confirmed | 0 |
| Cronobacter invasive infection, infants, Probable | 0 |
| Dengue virus infections, Dengue-like illness | 0 |
| Dengue virus infections, Severe dengue | 0 |
| Hantavirus infection, non-hantavirus pulmonary syndrome | 0 |
| Hantavirus pulmonary syndrome | 0 |
| Hepatitis B, perinatal, Confirmed | 0 |
| Measles, Indigenous | 0 |
| Melioidosis | 0 |
| Meningococcal disease, Other serogroups | 0 |
| Novel Influenza A virus infections | 0 |
| Plague | 0 |
| Poliomyelitis, paralytic | 0 |
| Poliovirus infection, nonparalytic | 0 |
| Psittacosis | 0 |
| Rabies, Human | 0 |
| Rubella, congenital syndrome | 0 |
| Severe acute respiratory syndrome-associated coronavirus disease | 0 |
| Smallpox | 0 |
| Syphilis, Congenital | 0 |
| Trichinellosis | 0 |
| Vancomycin-resistant Staphylococcus aureus | 0 |
| Varicella disease | 0 |
| Varicella morbidity | 0 |
| Viral hemorrhagic fevers, Chapare virus | 0 |
| Viral hemorrhagic fevers, Crimean-Congo hemorrhagic fever virus | 0 |
| Viral hemorrhagic fevers, Ebola virus | 0 |
| Viral hemorrhagic fevers, Guanarito virus | 0 |
| Viral hemorrhagic fevers, Junin virus | 0 |
| Viral hemorrhagic fevers, Lassa virus | 0 |
| Viral hemorrhagic fevers, Lujo virus | 0 |
| Viral hemorrhagic fevers, Machupo virus | 0 |
| Viral hemorrhagic fevers, Marburg virus | 0 |
| Viral hemorrhagic fevers, Sabia virus | 0 |
| Yellow fever | 0 |
| Zika virus disease, non-congenital | 0 |
Table Prepared By:__ Isaac H. Michaels, MPH
Data Source: U.S. Centers for Disease Control and Prevention
Longitudinal Trends
Chlamydia trachomatis infection
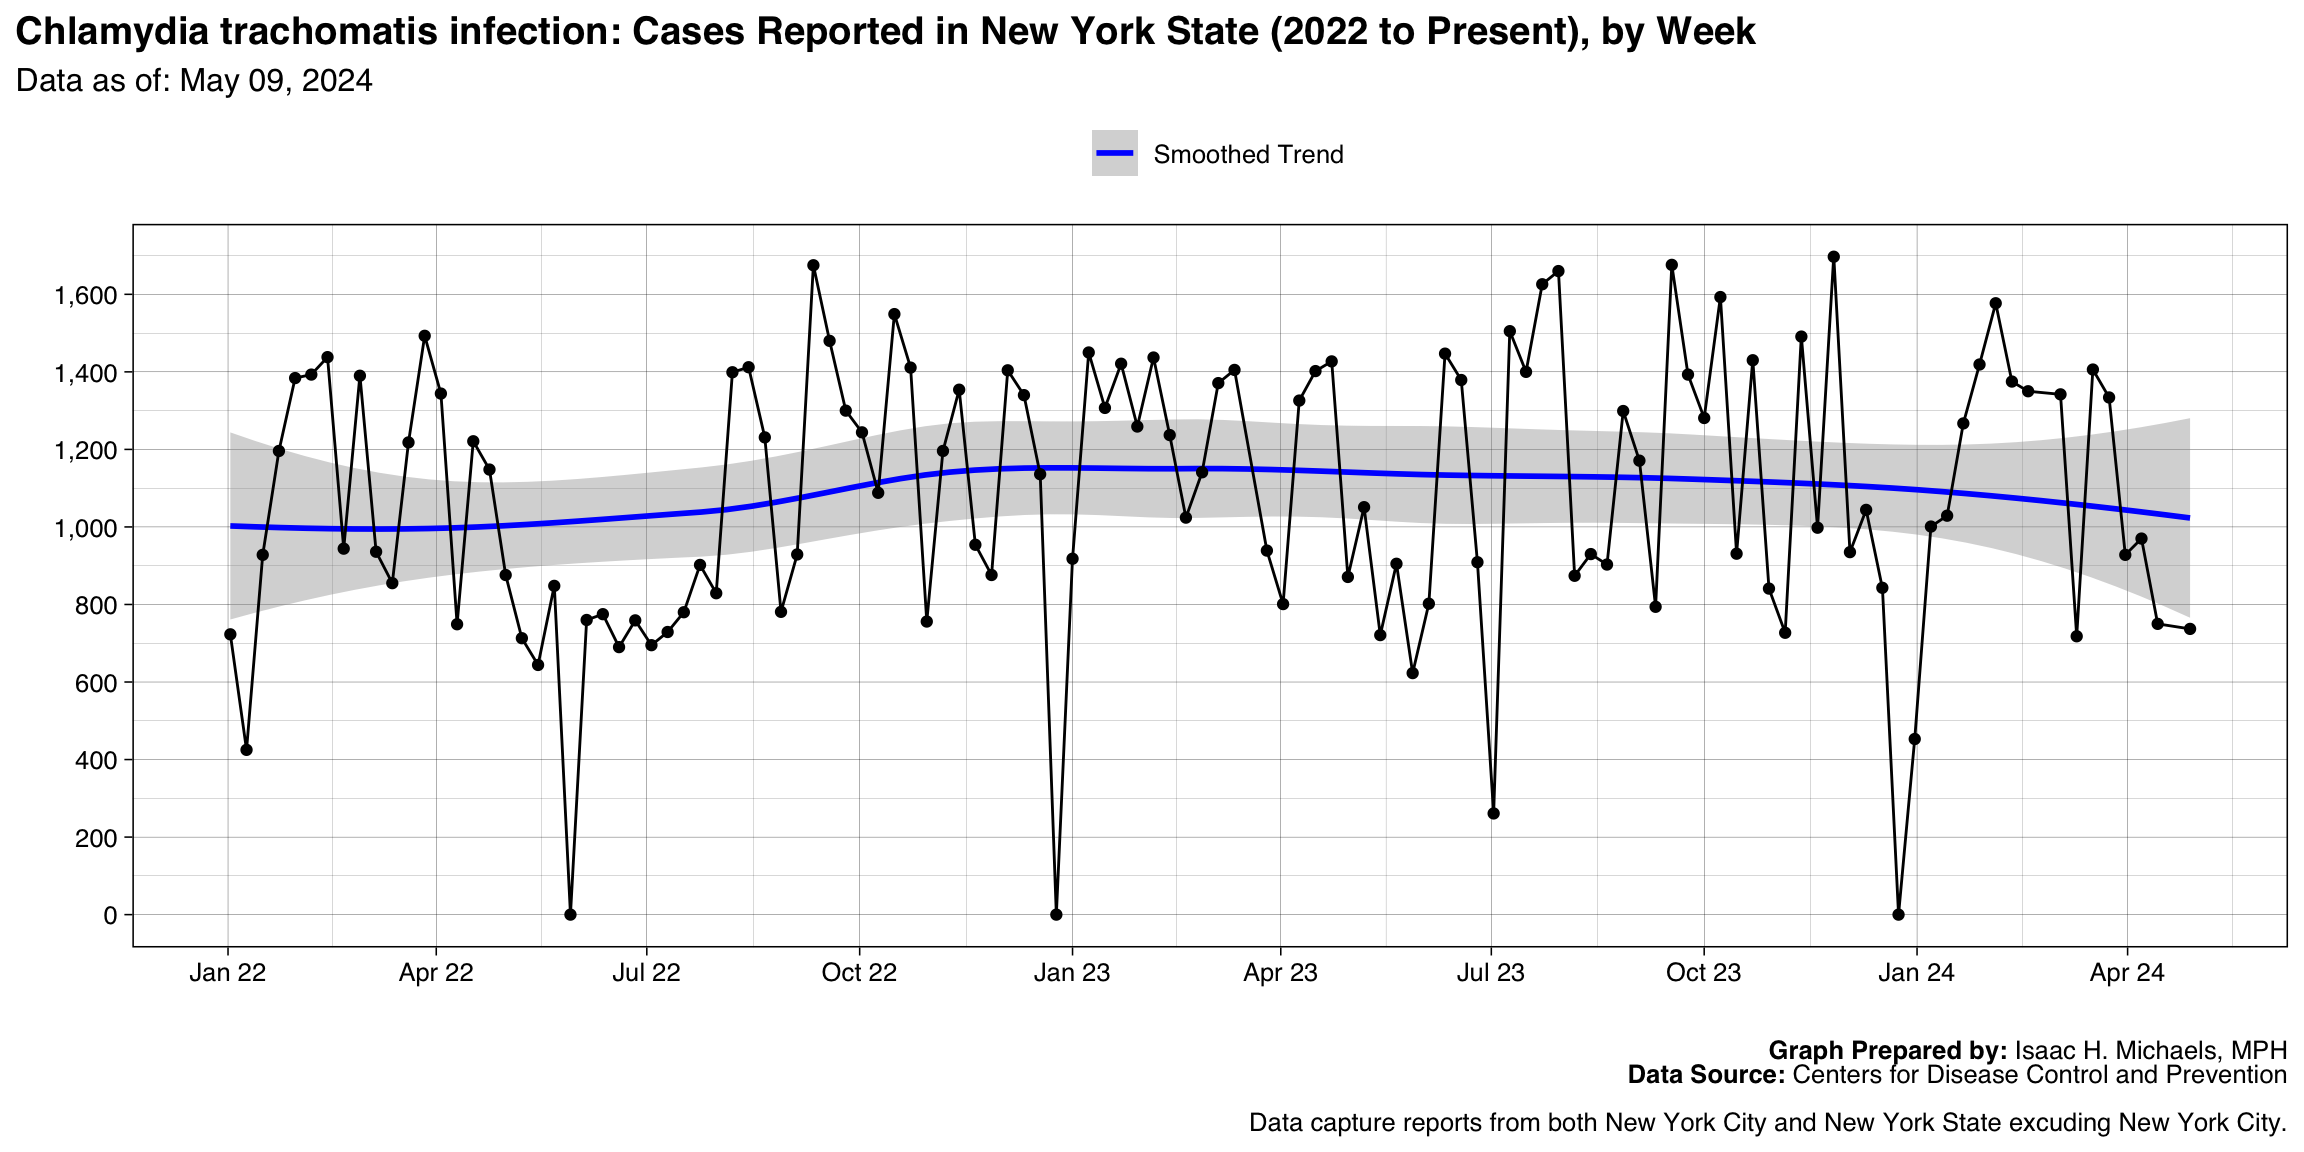
Graph Prepared By: Isaac H. Michaels, MPH
Death Data Source: U.S. Centers for Disease Control and Prevention
Gonorrhea
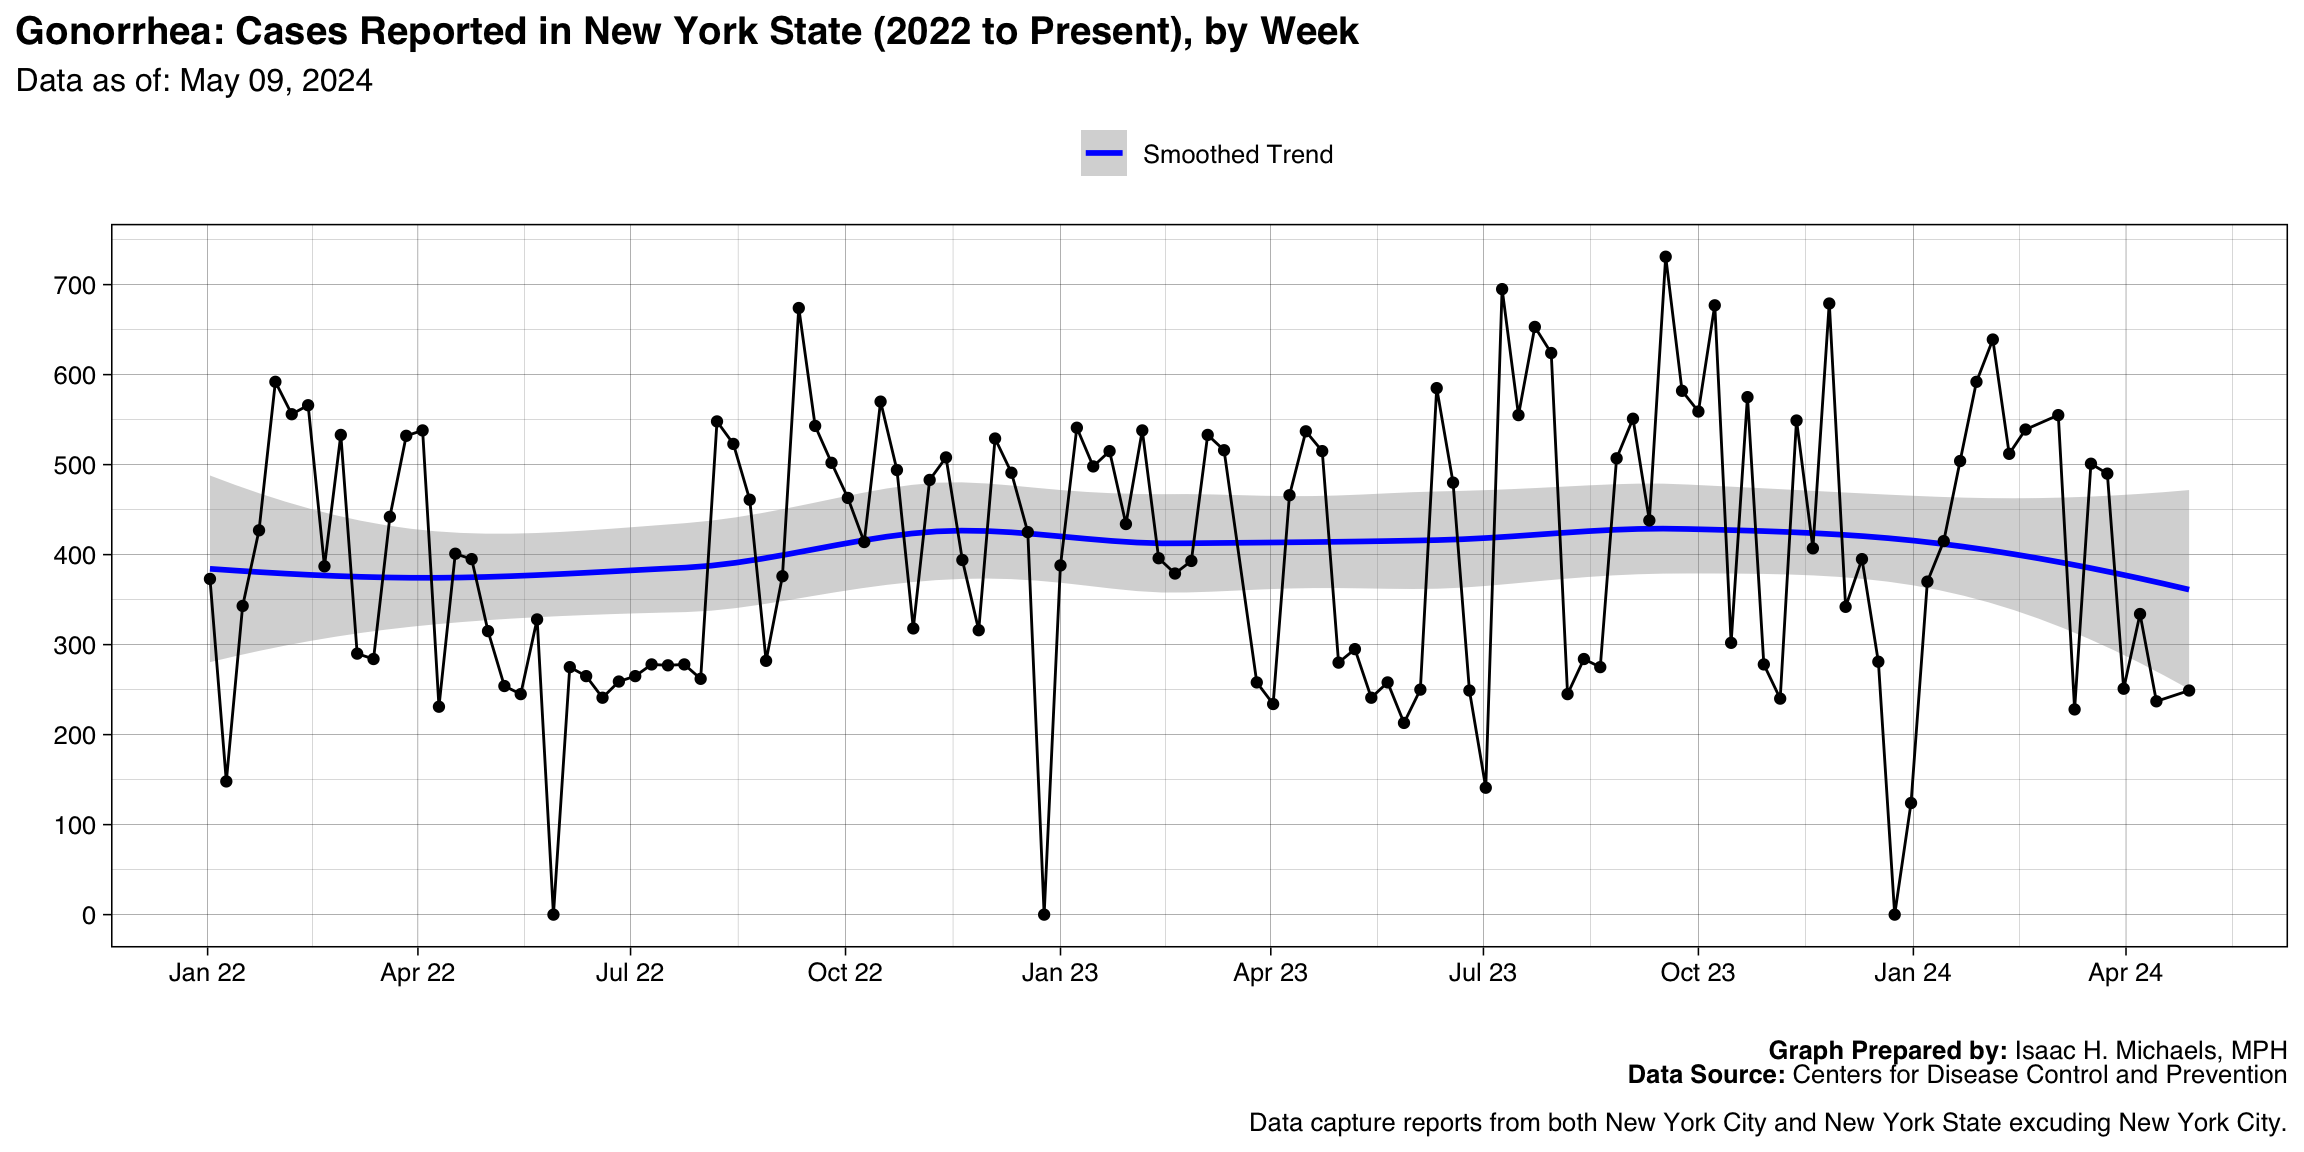
Graph Prepared By: Isaac H. Michaels, MPH
Death Data Source: U.S. Centers for Disease Control and Prevention
Campylobacteriosis
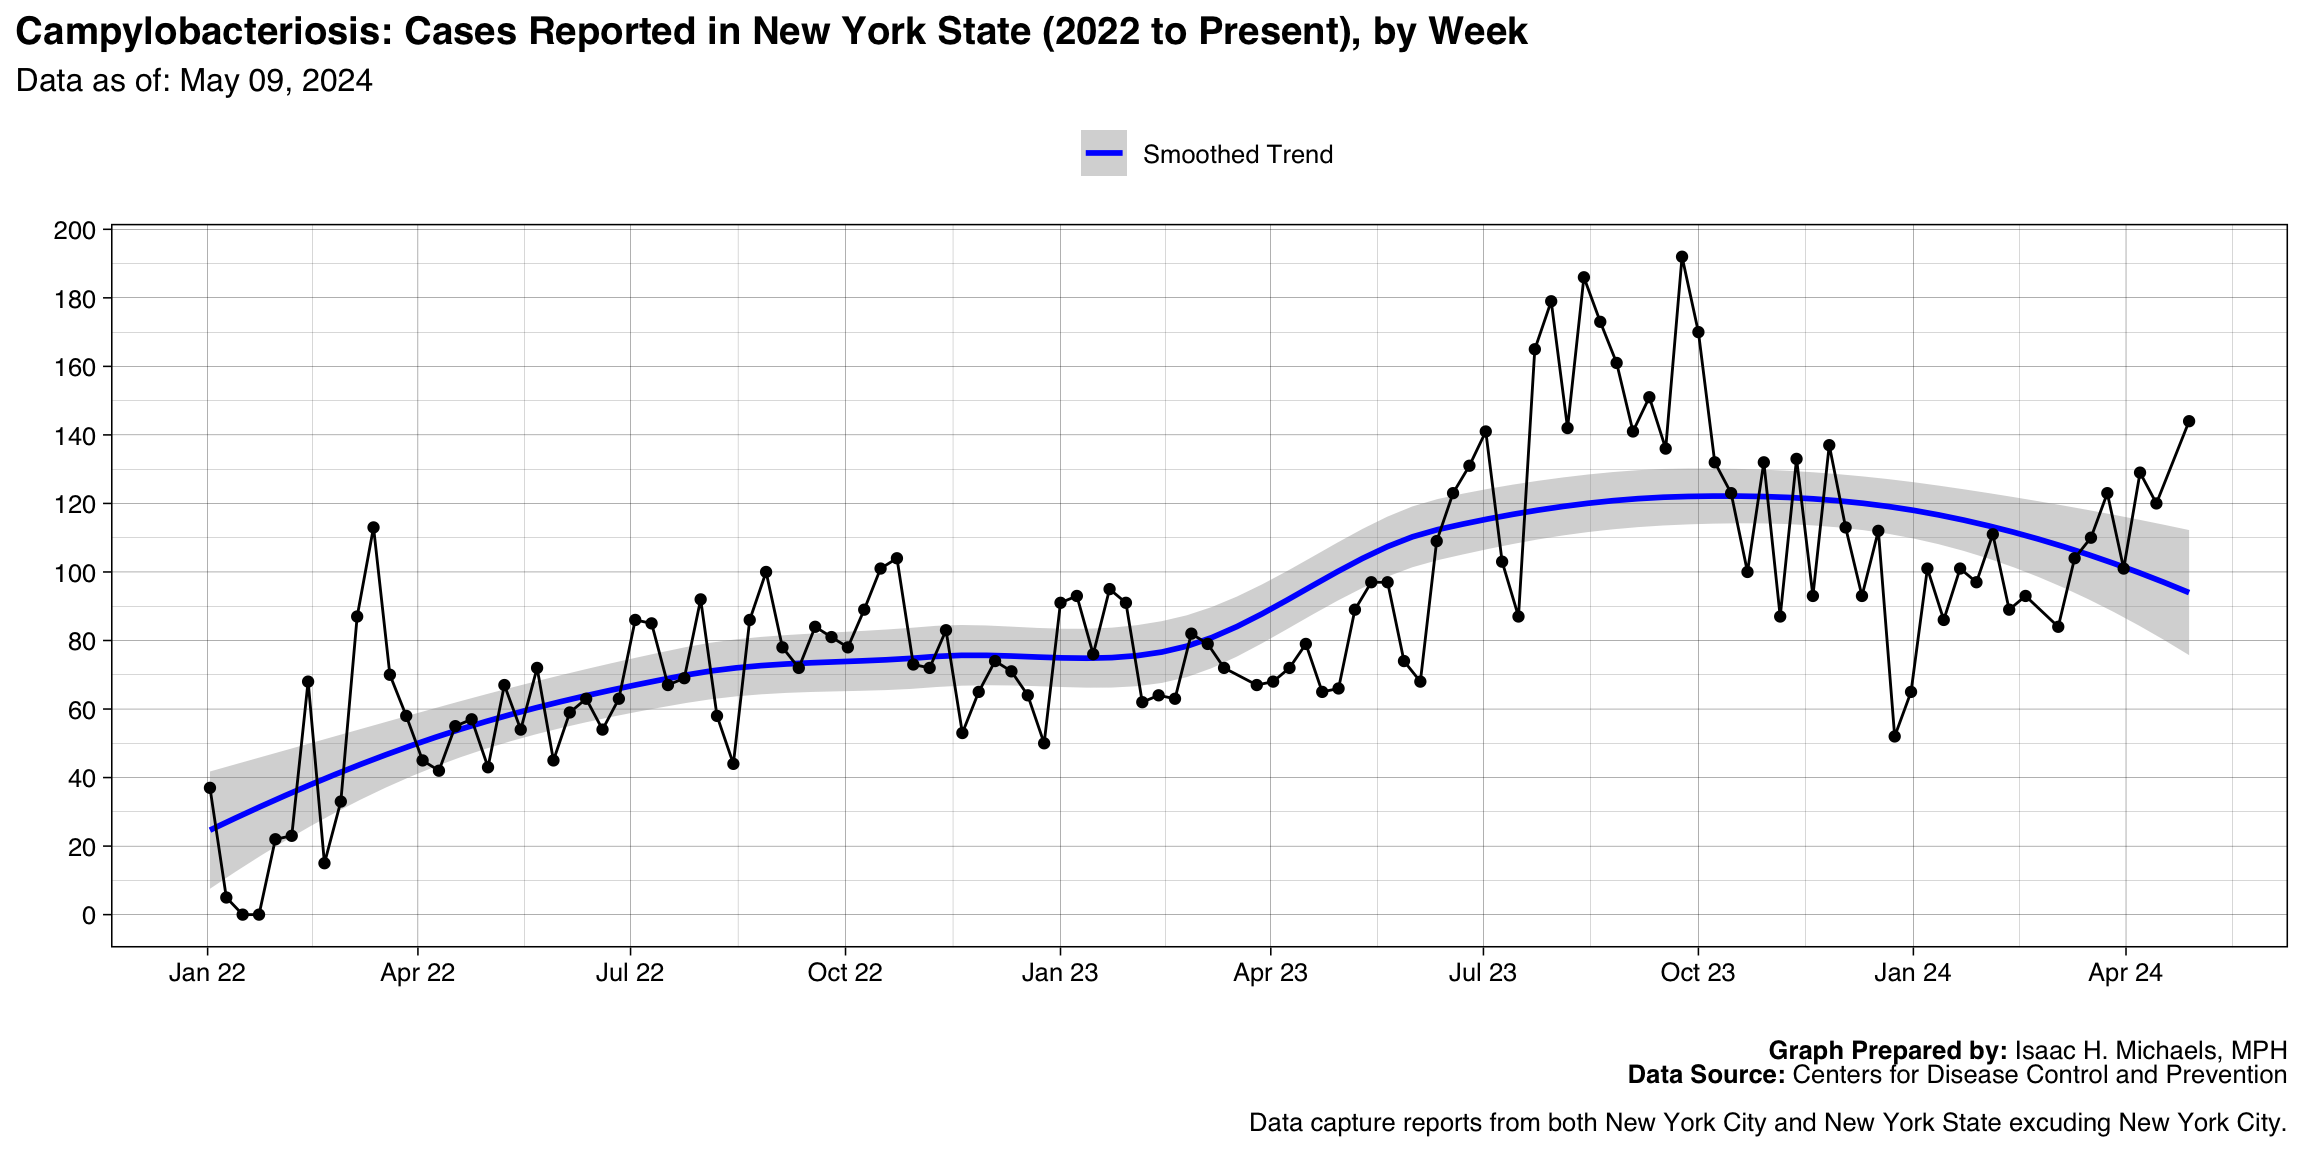
Graph Prepared By: Isaac H. Michaels, MPH
Death Data Source: U.S. Centers for Disease Control and Prevention
Shigellosis
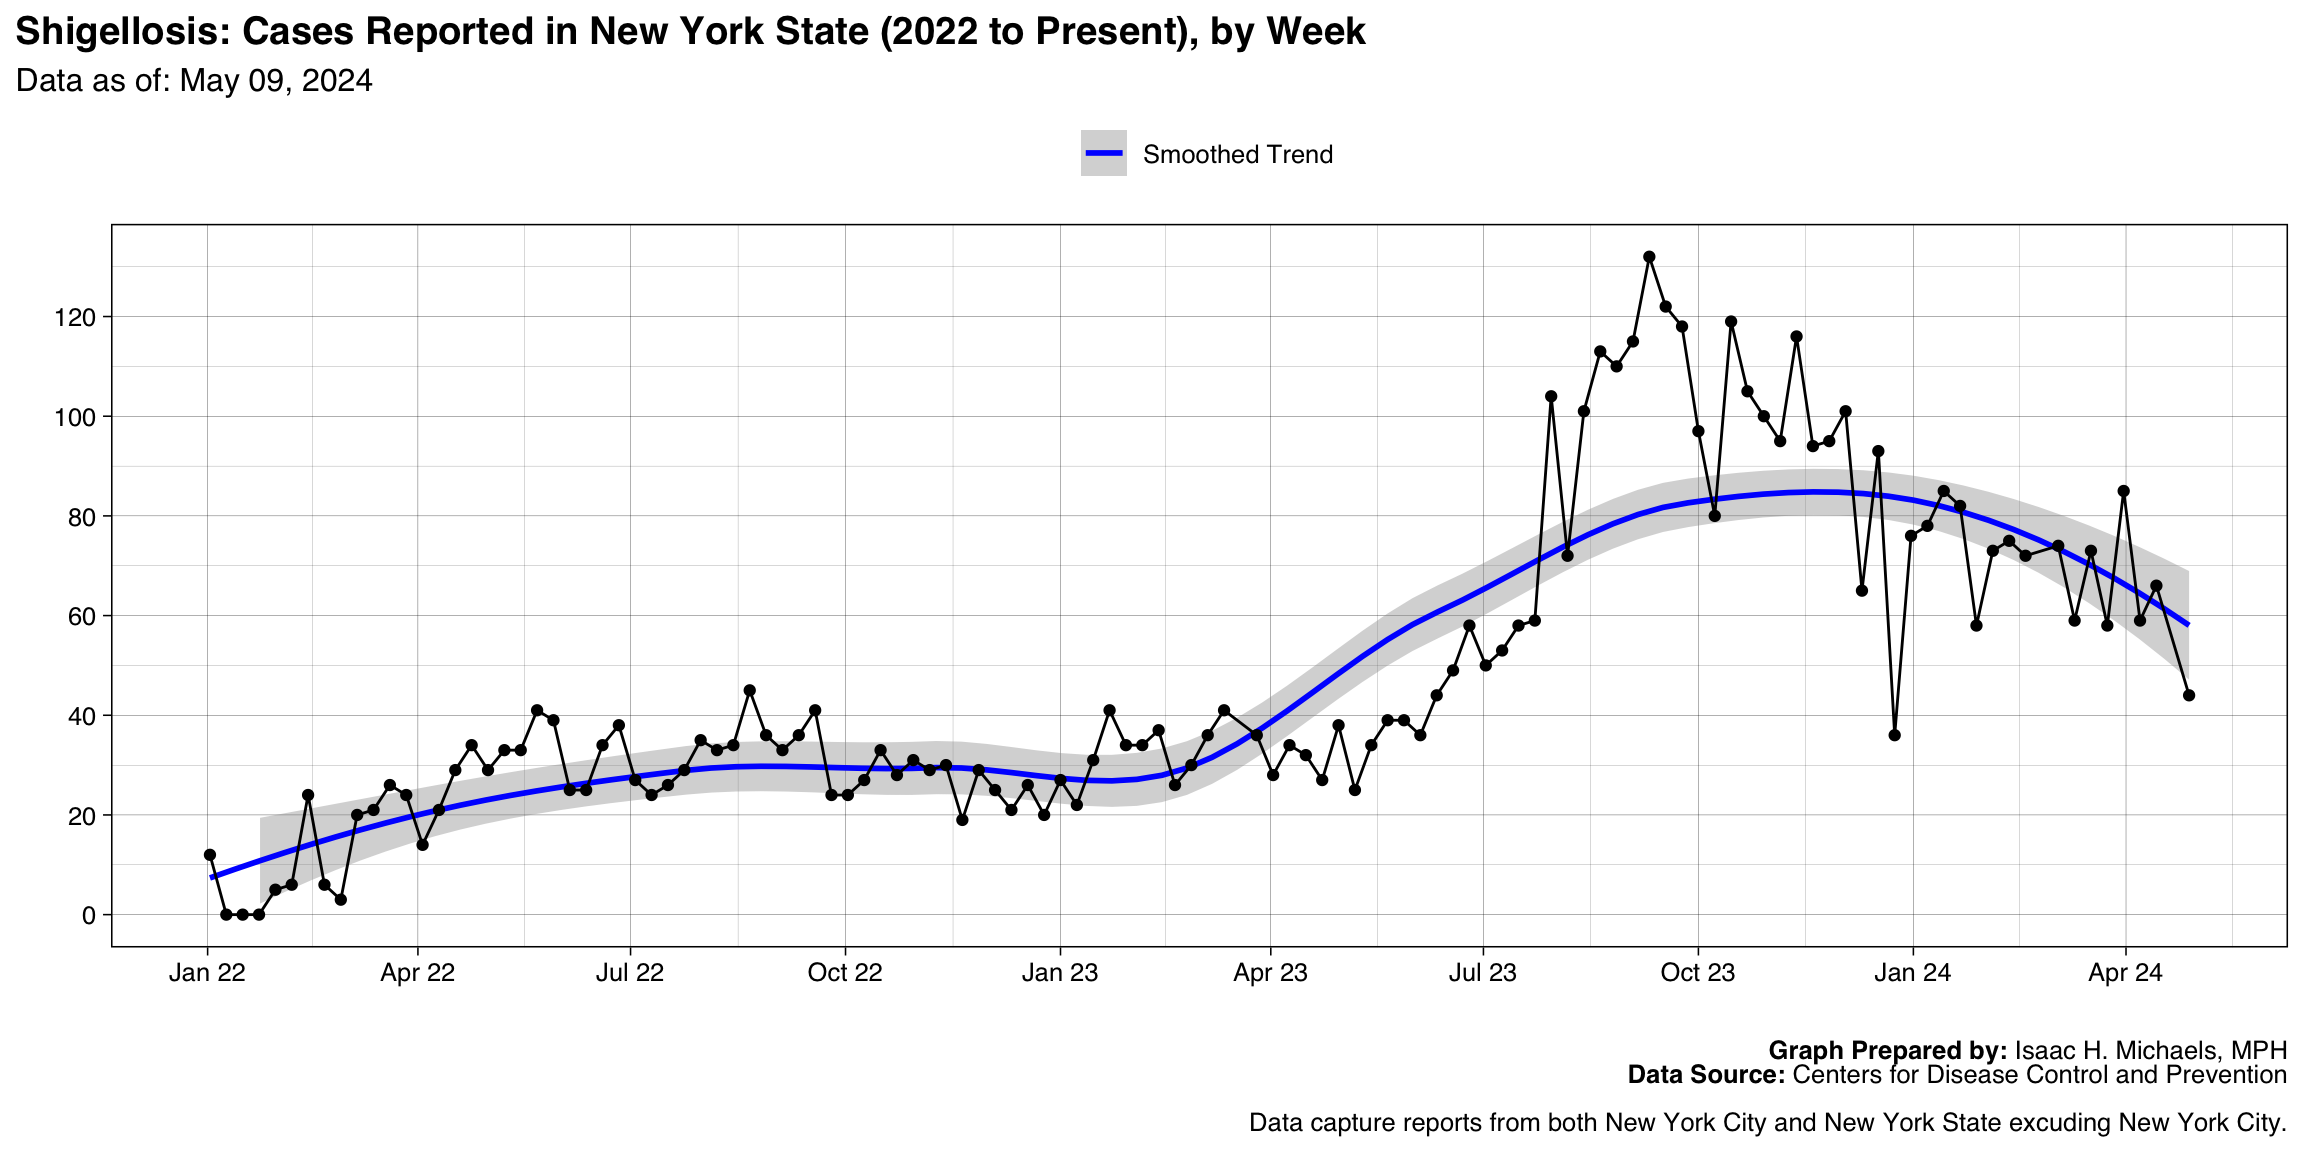
Graph Prepared By: Isaac H. Michaels, MPH
Death Data Source: U.S. Centers for Disease Control and Prevention
Salmonellosis (excluding Salmonella Typhi infection and Salmonella Paratyphi infection)
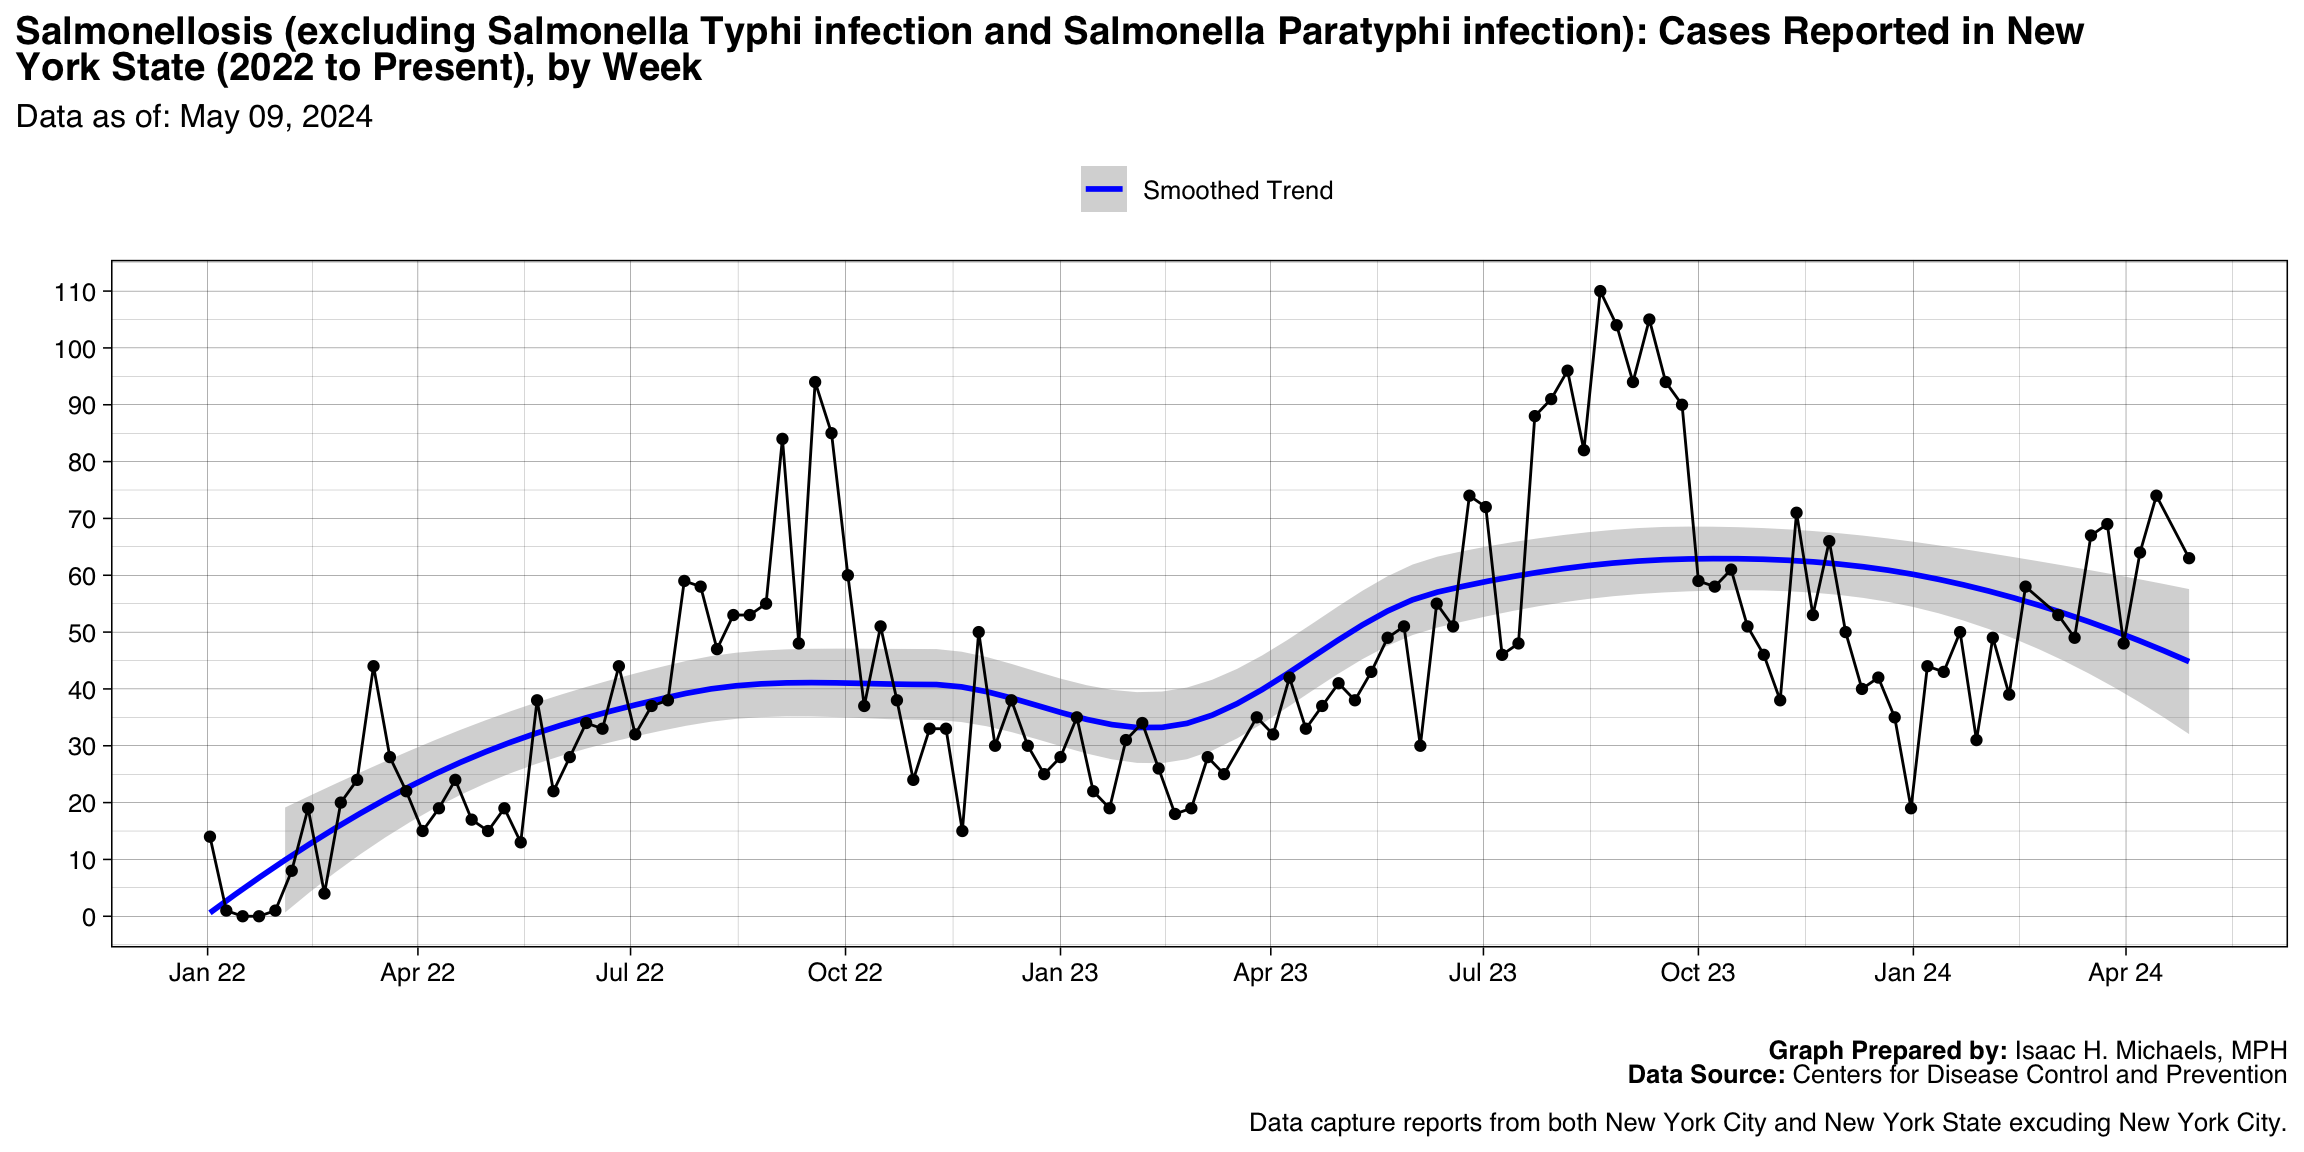
Graph Prepared By: Isaac H. Michaels, MPH
Death Data Source: U.S. Centers for Disease Control and Prevention
Giardiasis
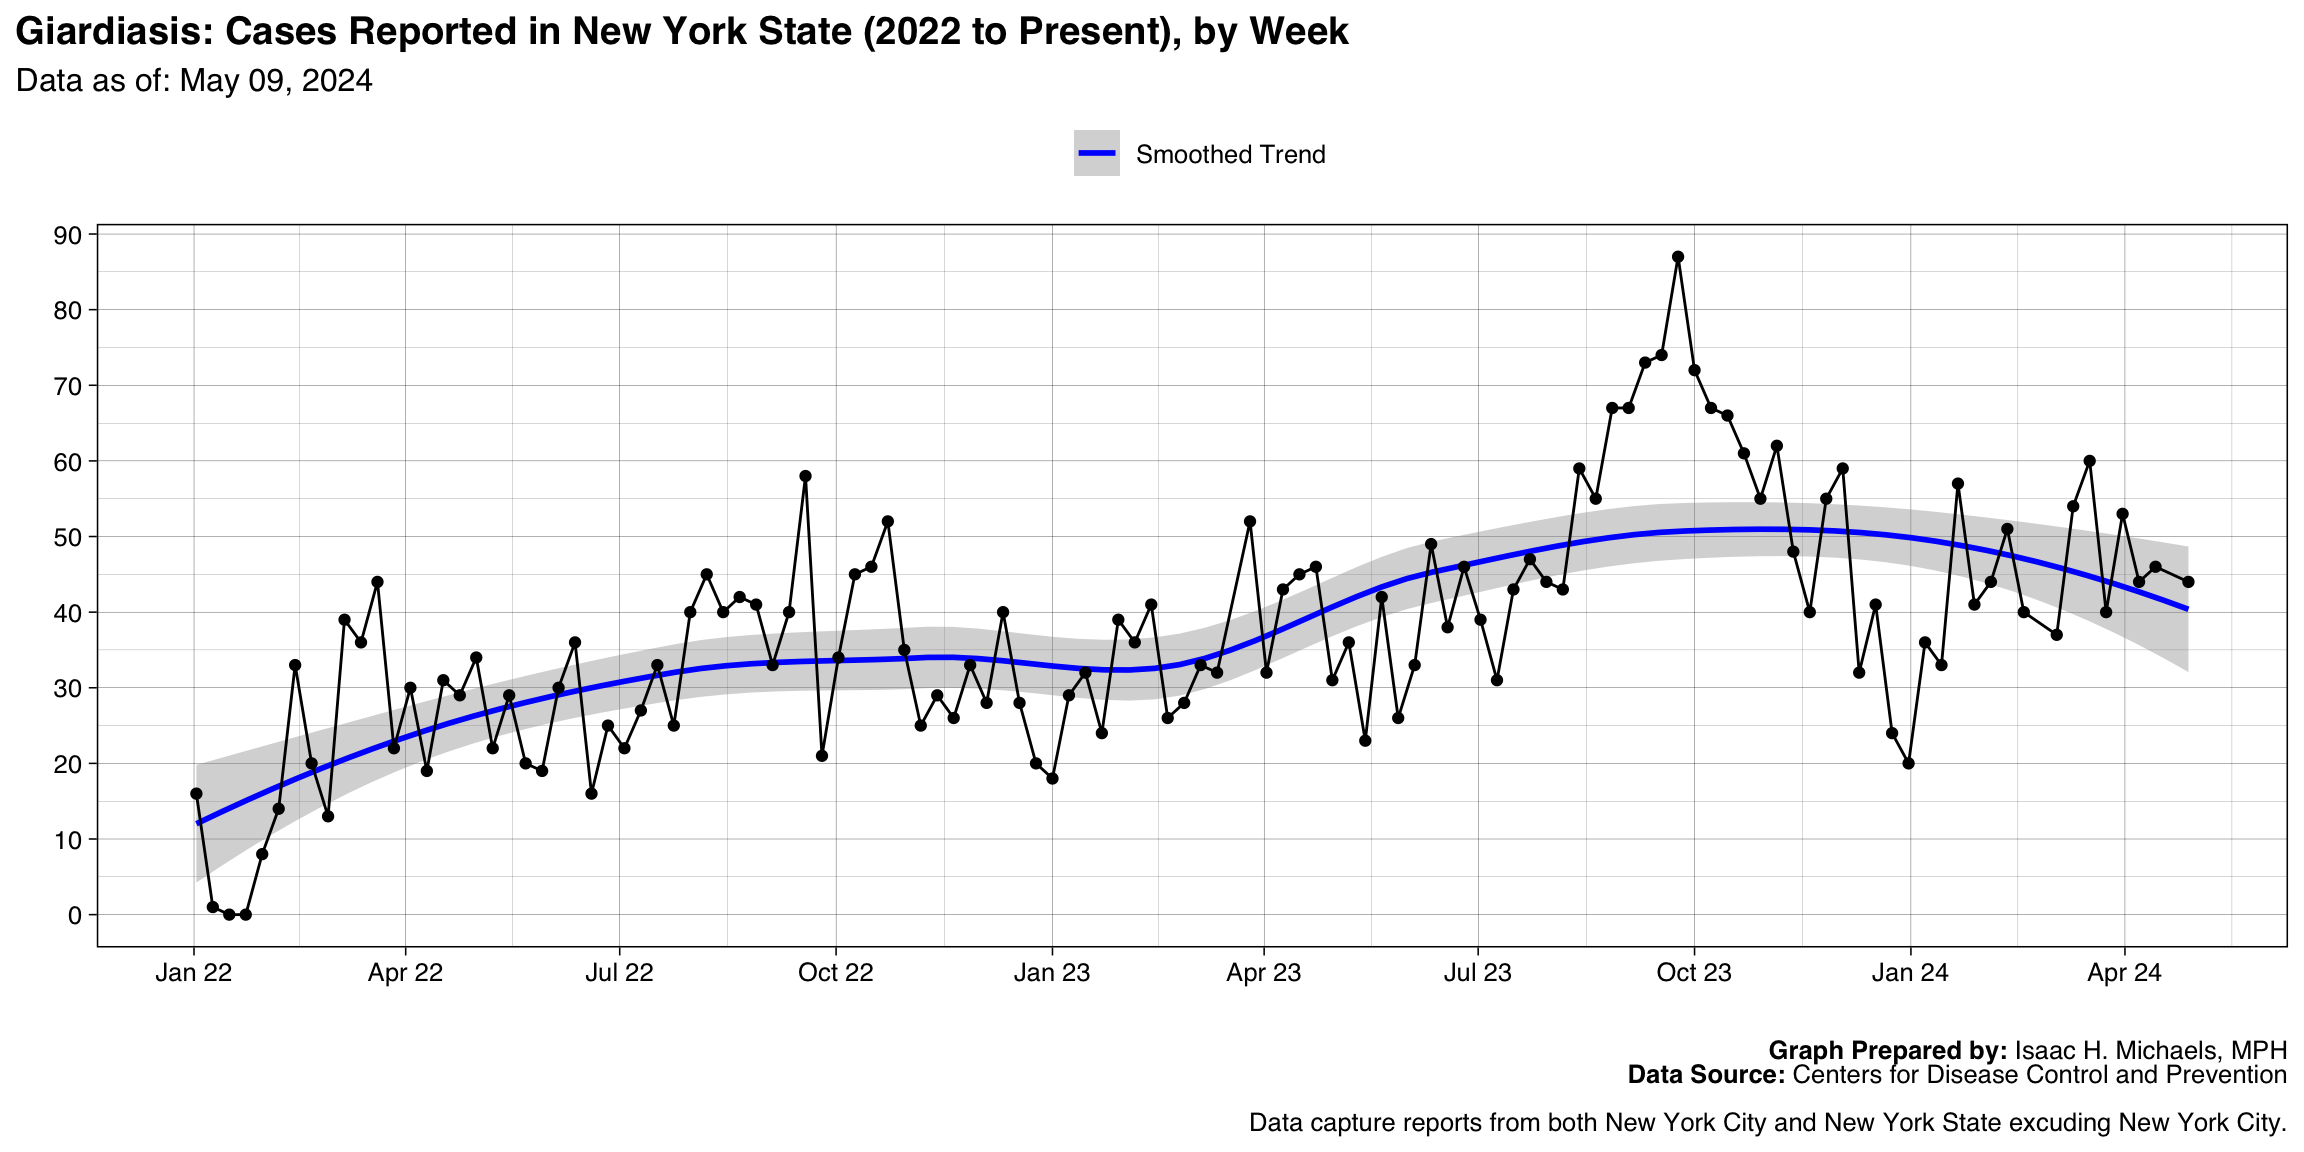
Graph Prepared By: Isaac H. Michaels, MPH
Death Data Source: U.S. Centers for Disease Control and Prevention
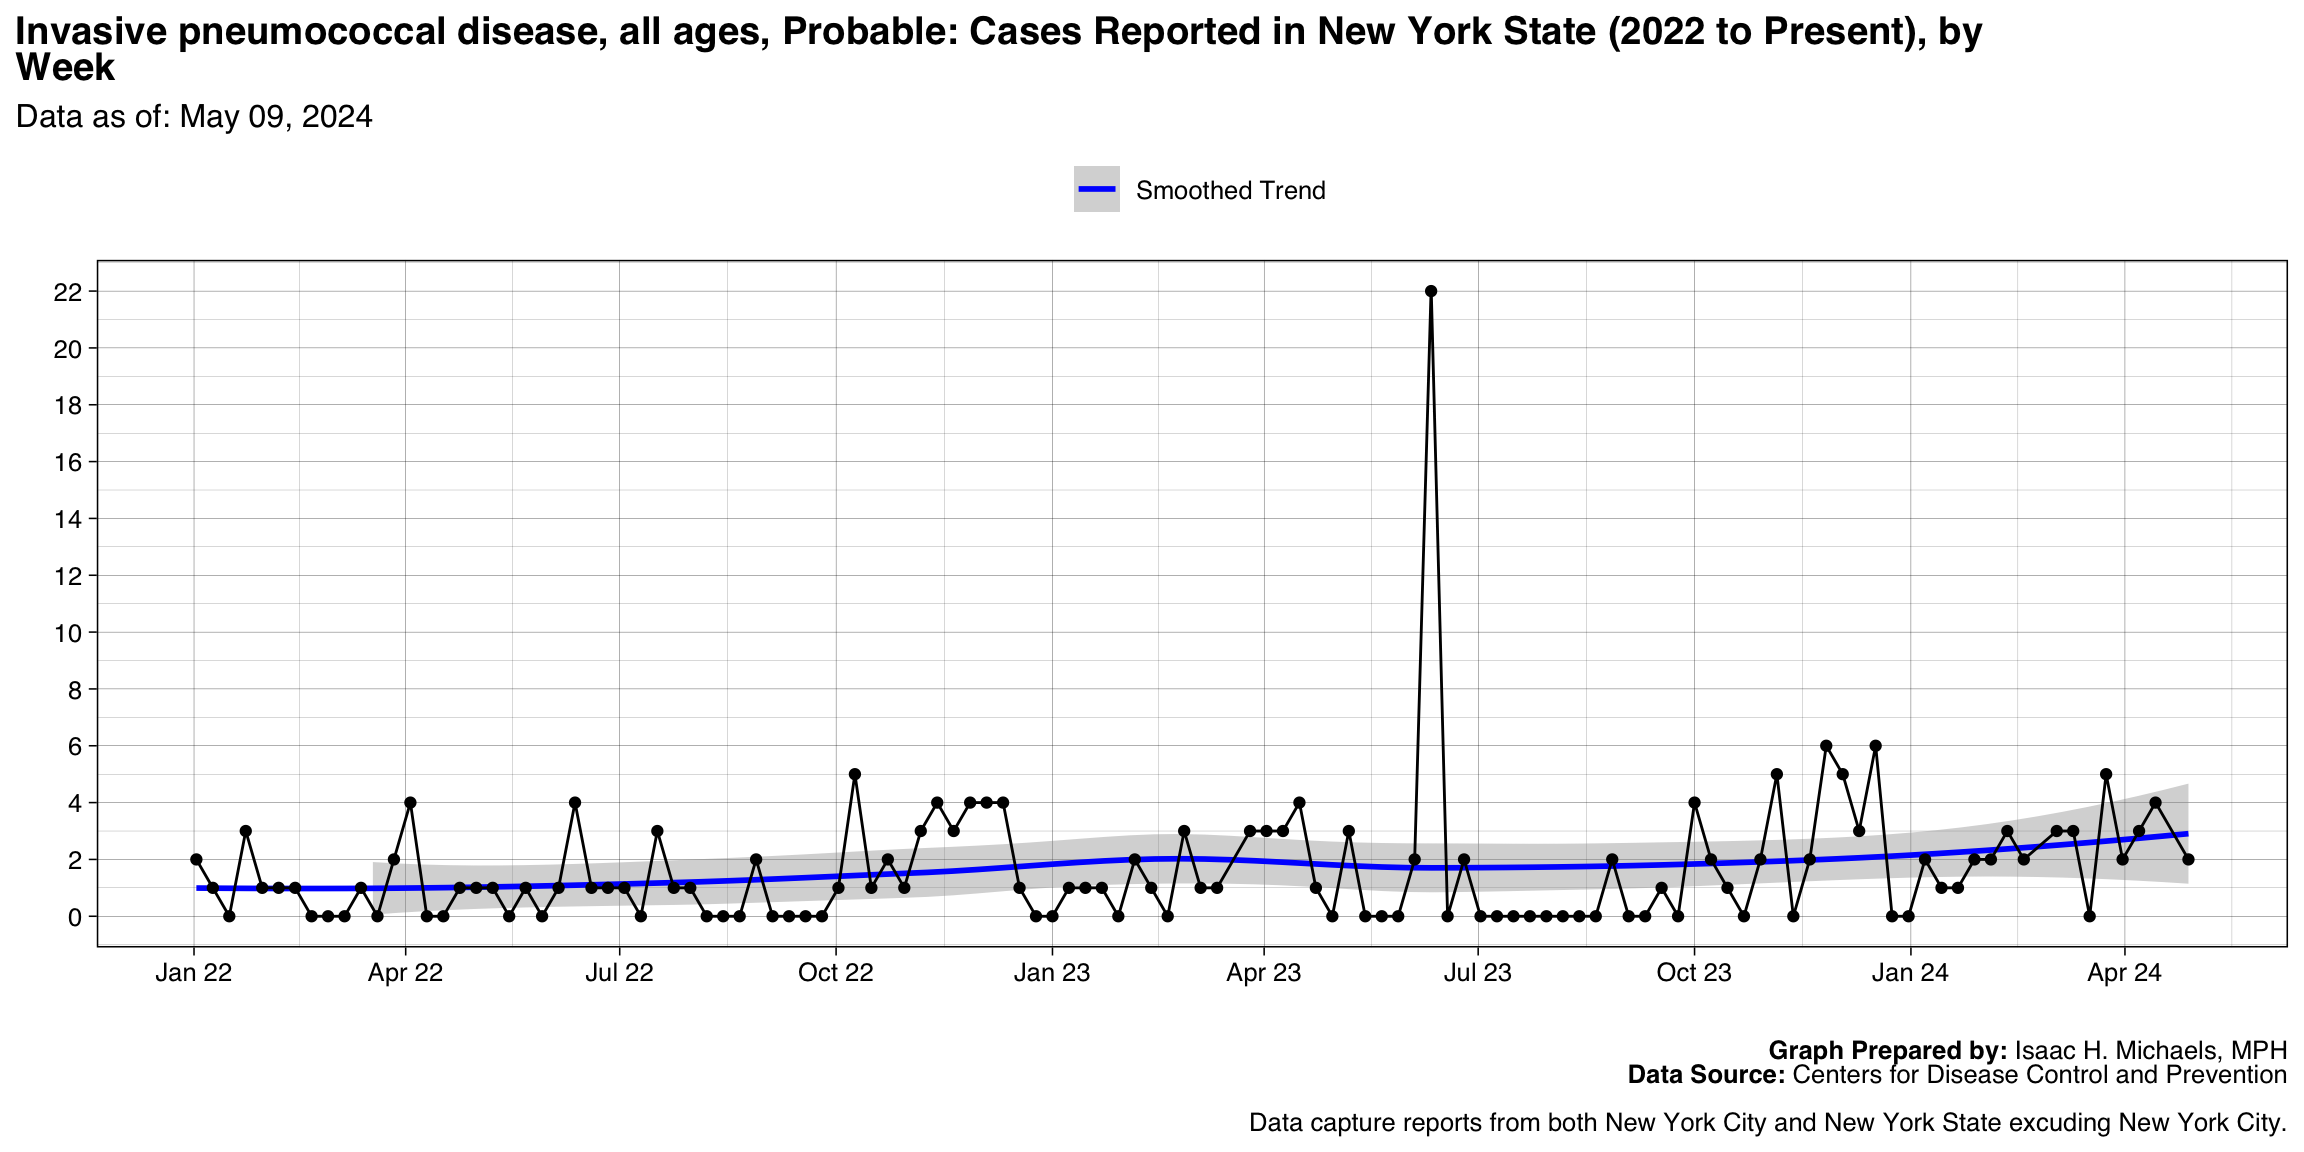
Invasive pneumococcal disease, all ages, Confirmed
Graph Prepared By: Isaac H. Michaels, MPH
Death Data Source: U.S. Centers for Disease Control and Prevention
Ehrlichiosis and Anaplasmosis, Anaplasma phagocytophilum infection
Graph Prepared By: Isaac H. Michaels, MPH
Death Data Source: U.S. Centers for Disease Control and Prevention
Syphilis, Primary and secondary
Graph Prepared By: Isaac H. Michaels, MPH
Death Data Source: U.S. Centers for Disease Control and Prevention
Hepatitis B, chronic, Confirmed
Graph Prepared By: Isaac H. Michaels, MPH
Death Data Source: U.S. Centers for Disease Control and Prevention
Babesiosis
Graph Prepared By: Isaac H. Michaels, MPH
Death Data Source: U.S. Centers for Disease Control and Prevention
Hepatitis C, chronic, Probable
Graph Prepared By: Isaac H. Michaels, MPH
Death Data Source: U.S. Centers for Disease Control and Prevention
Hepatitis C, chronic, Confirmed
Graph Prepared By: Isaac H. Michaels, MPH
Death Data Source: U.S. Centers for Disease Control and Prevention
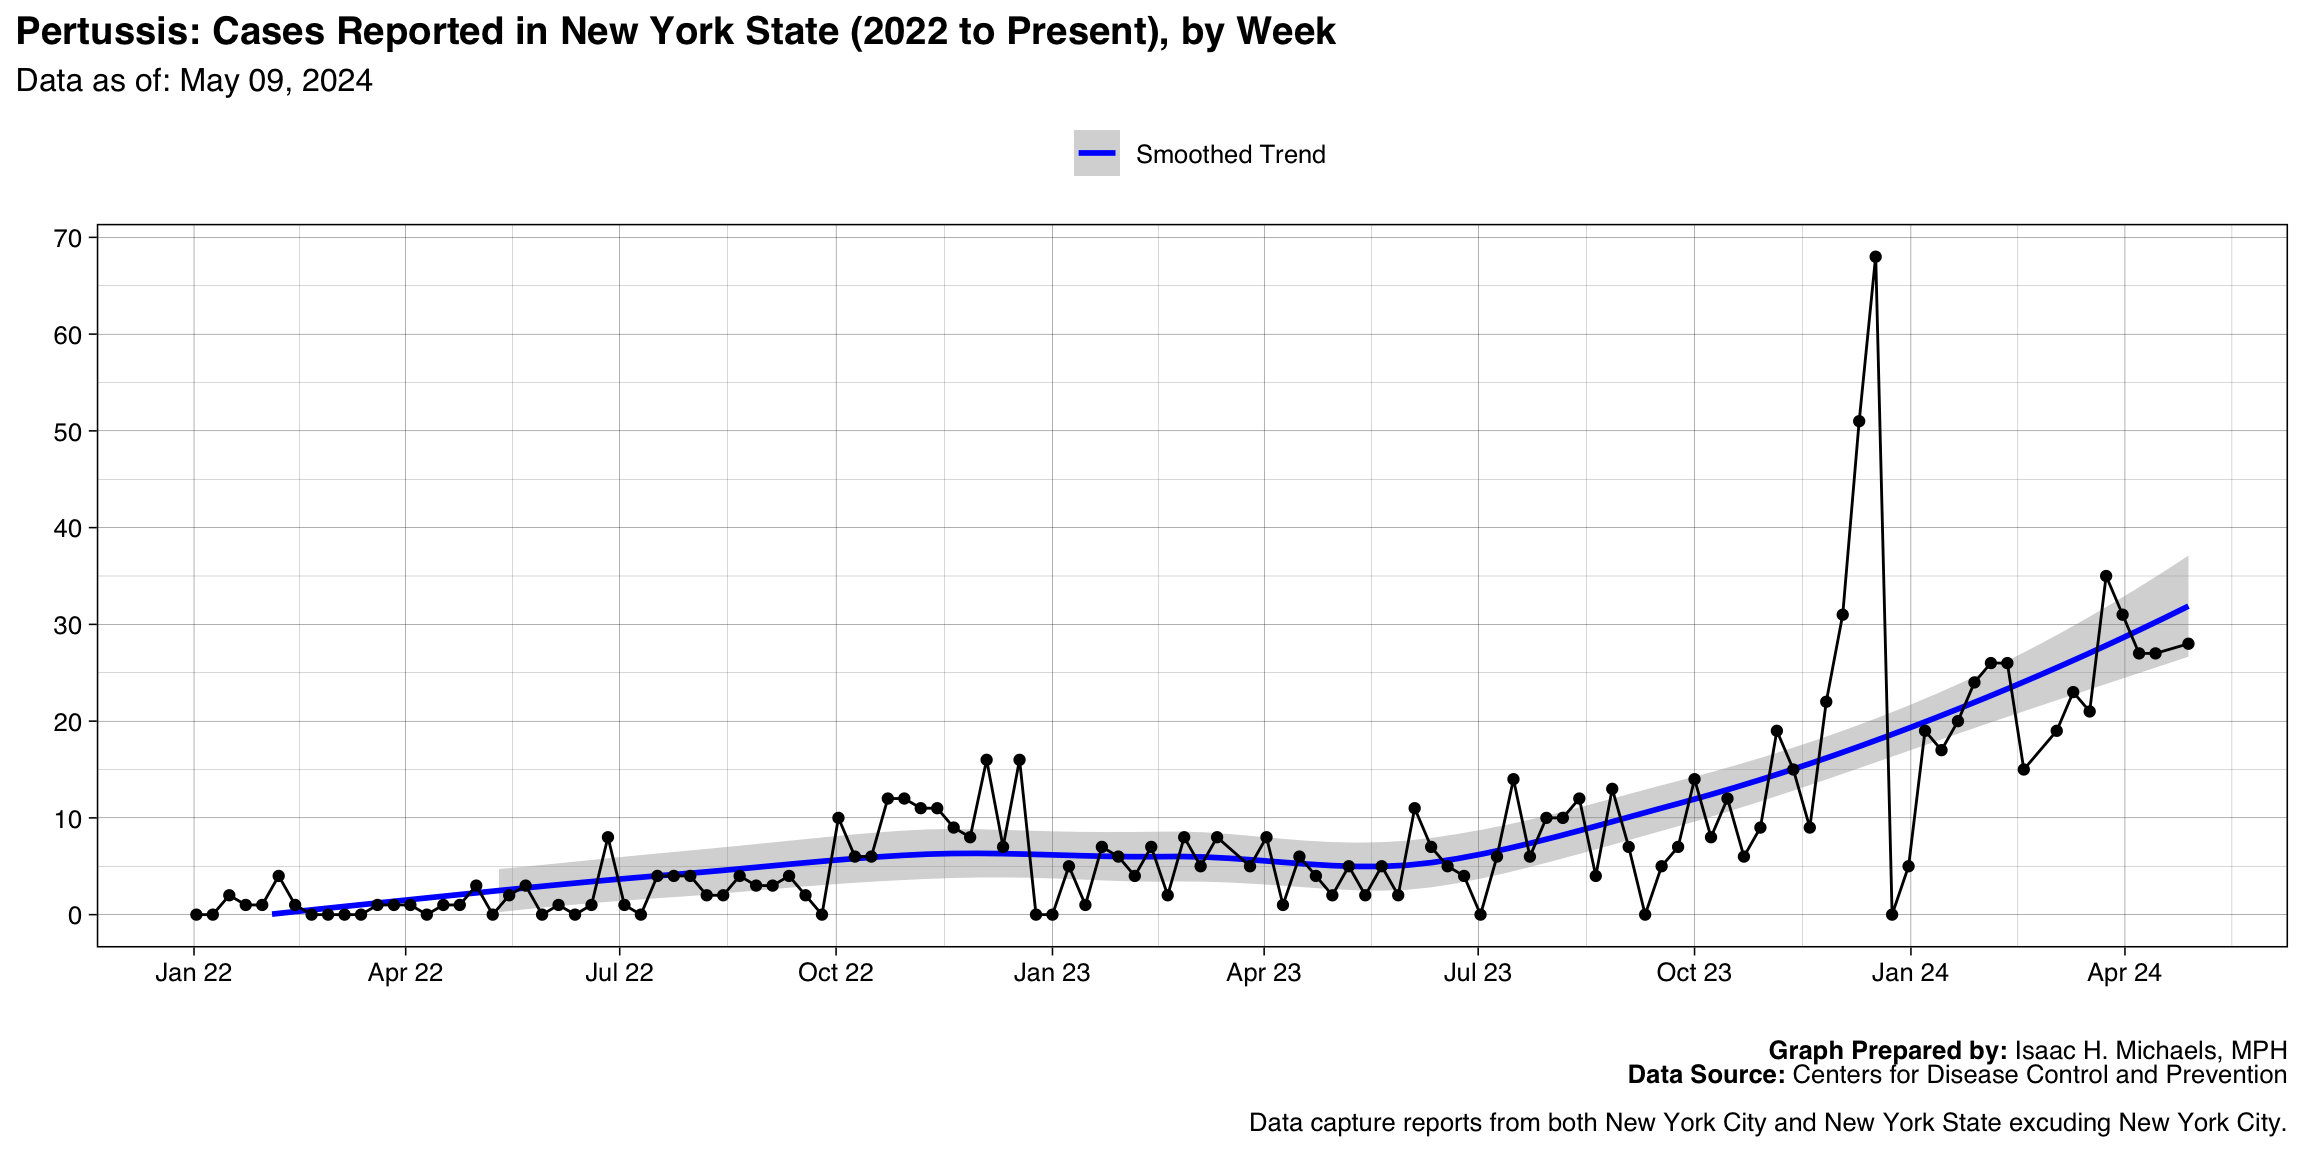
Pertussis
Graph Prepared By: Isaac H. Michaels, MPH
Death Data Source: U.S. Centers for Disease Control and Prevention
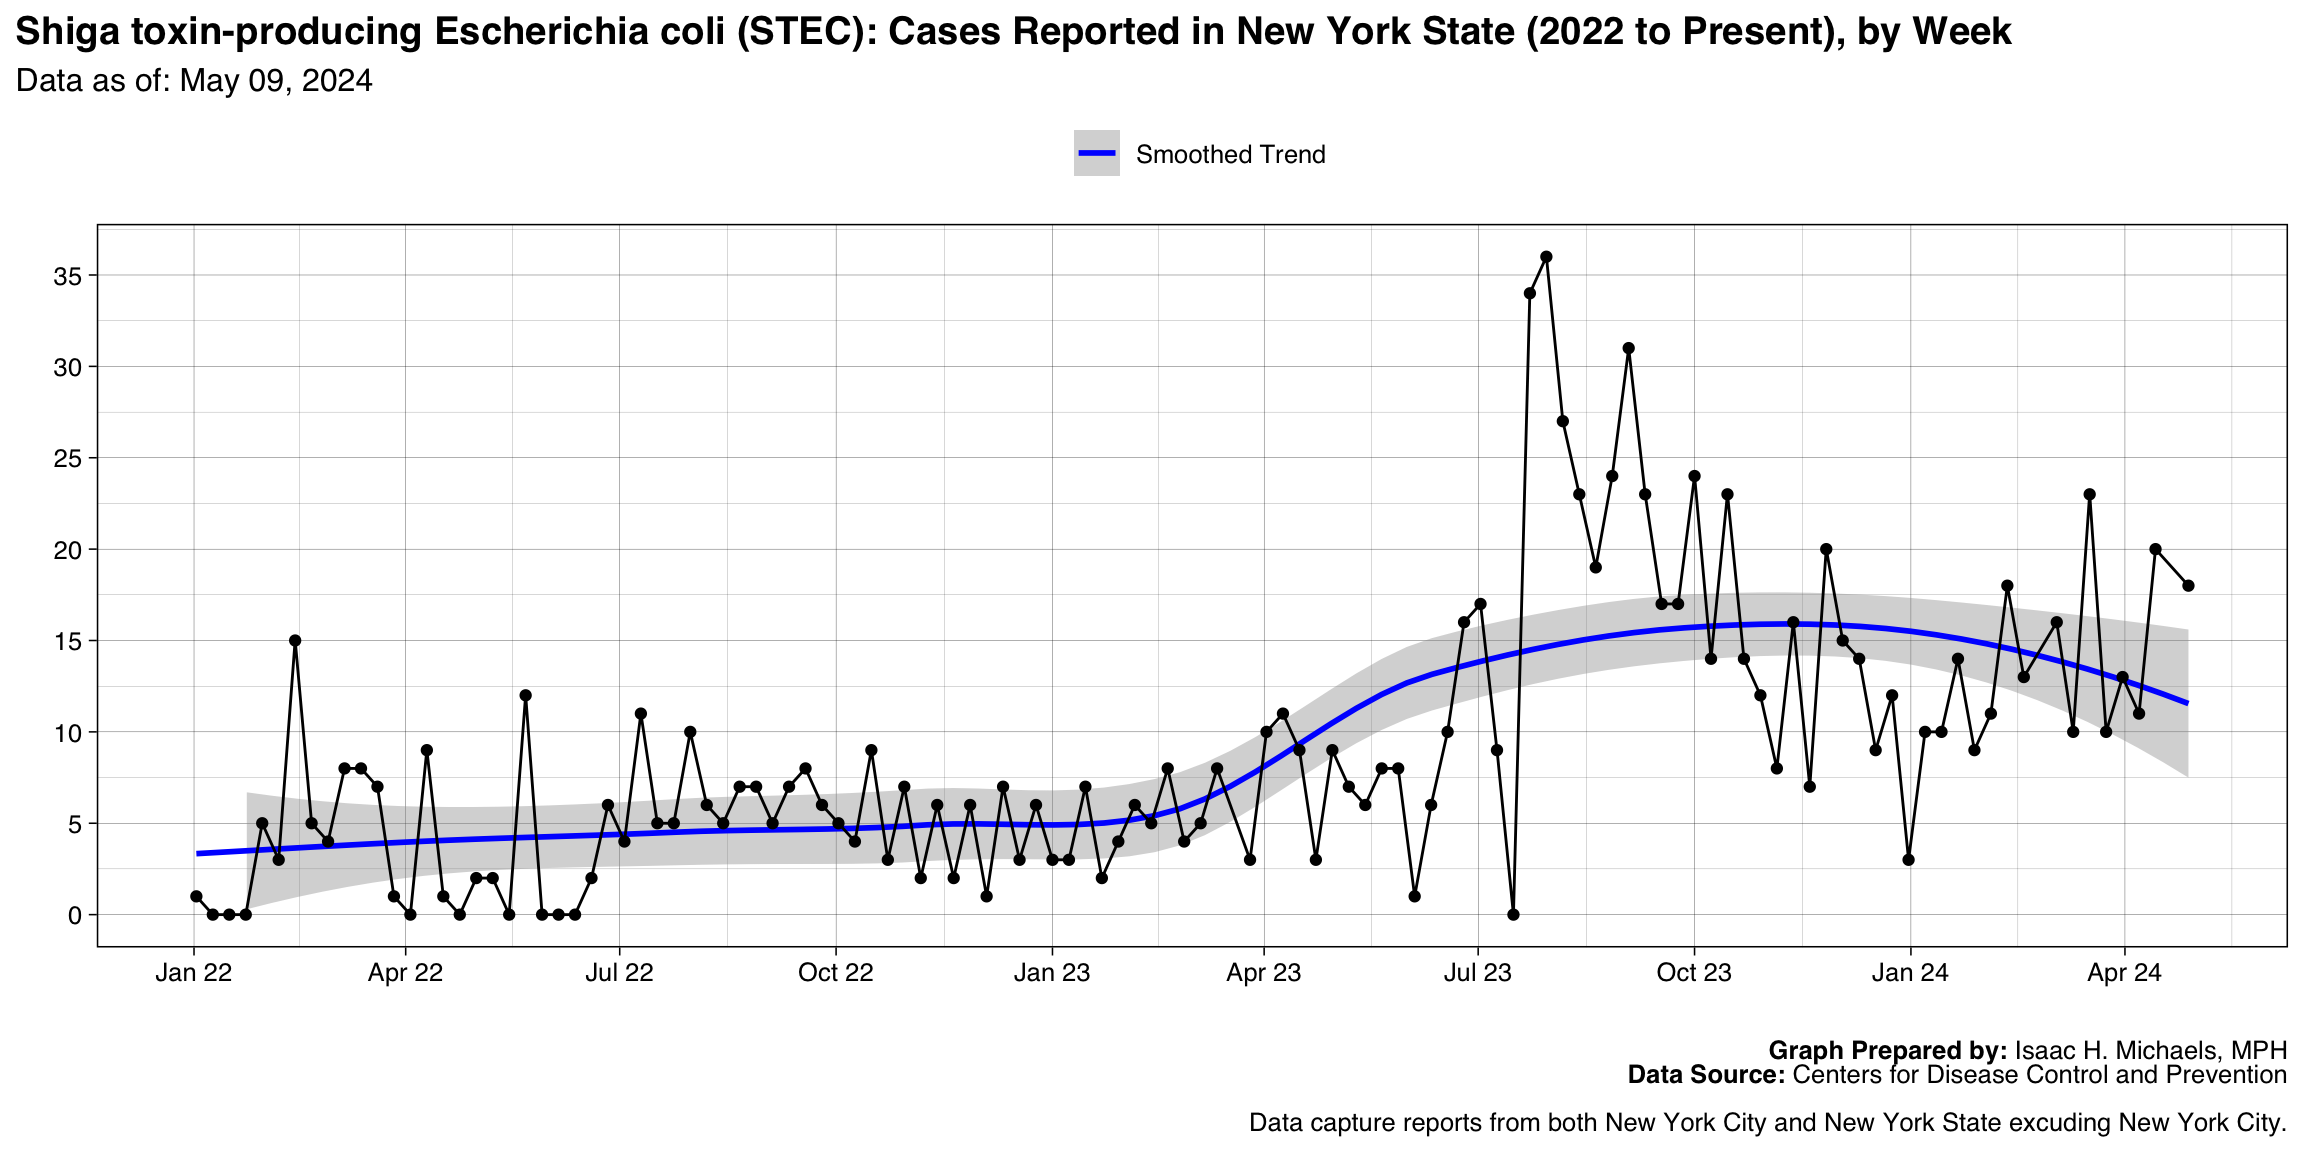
Shiga toxin-producing Escherichia coli (STEC)
Graph Prepared By: Isaac H. Michaels, MPH
Death Data Source: U.S. Centers for Disease Control and Prevention
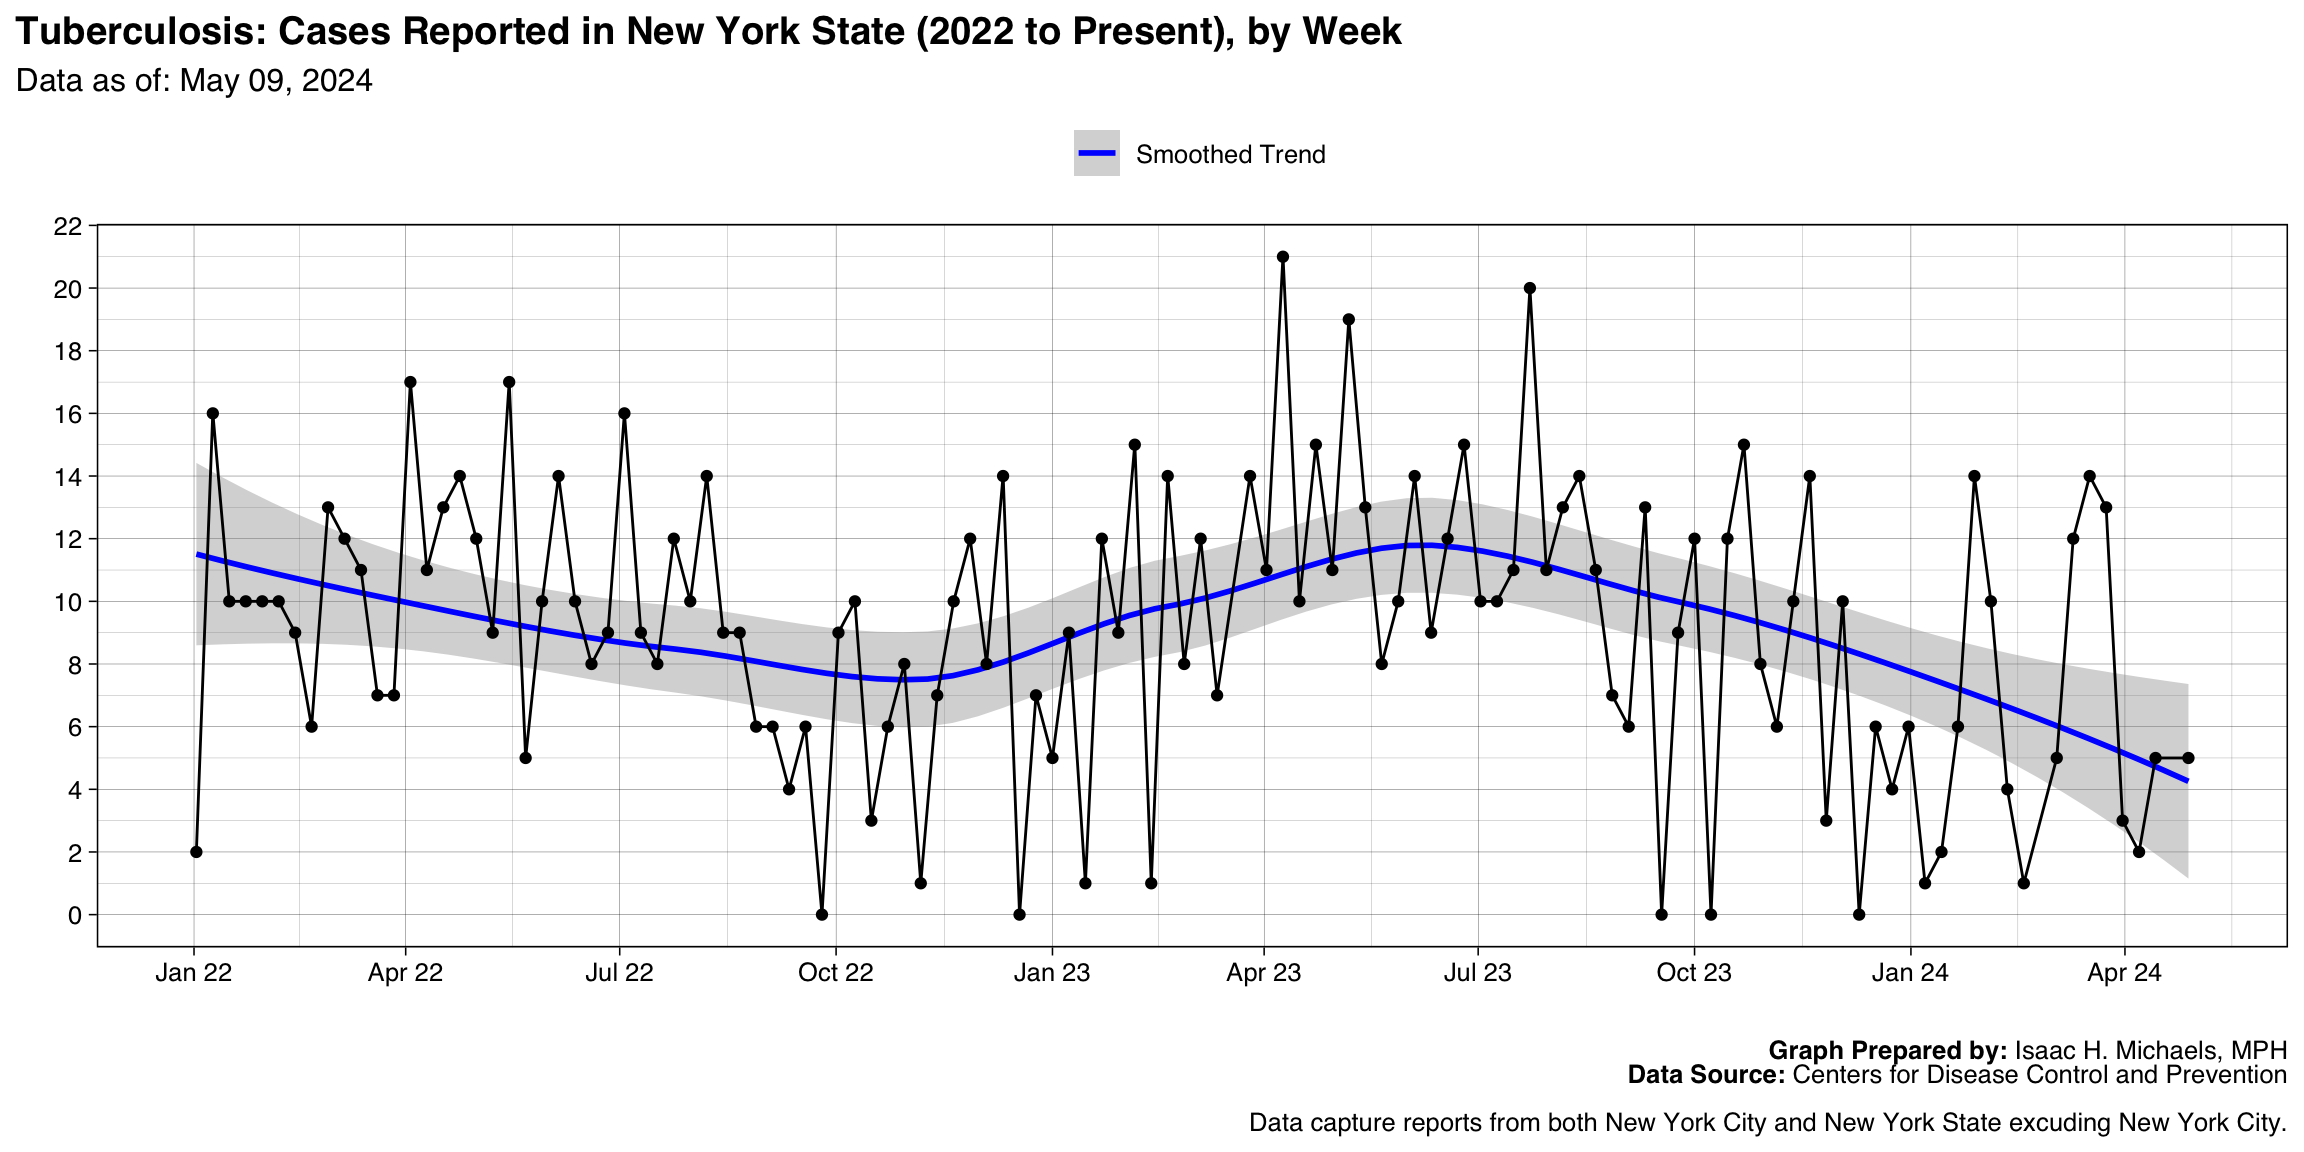
Tuberculosis
Graph Prepared By: Isaac H. Michaels, MPH
Death Data Source: U.S. Centers for Disease Control and Prevention
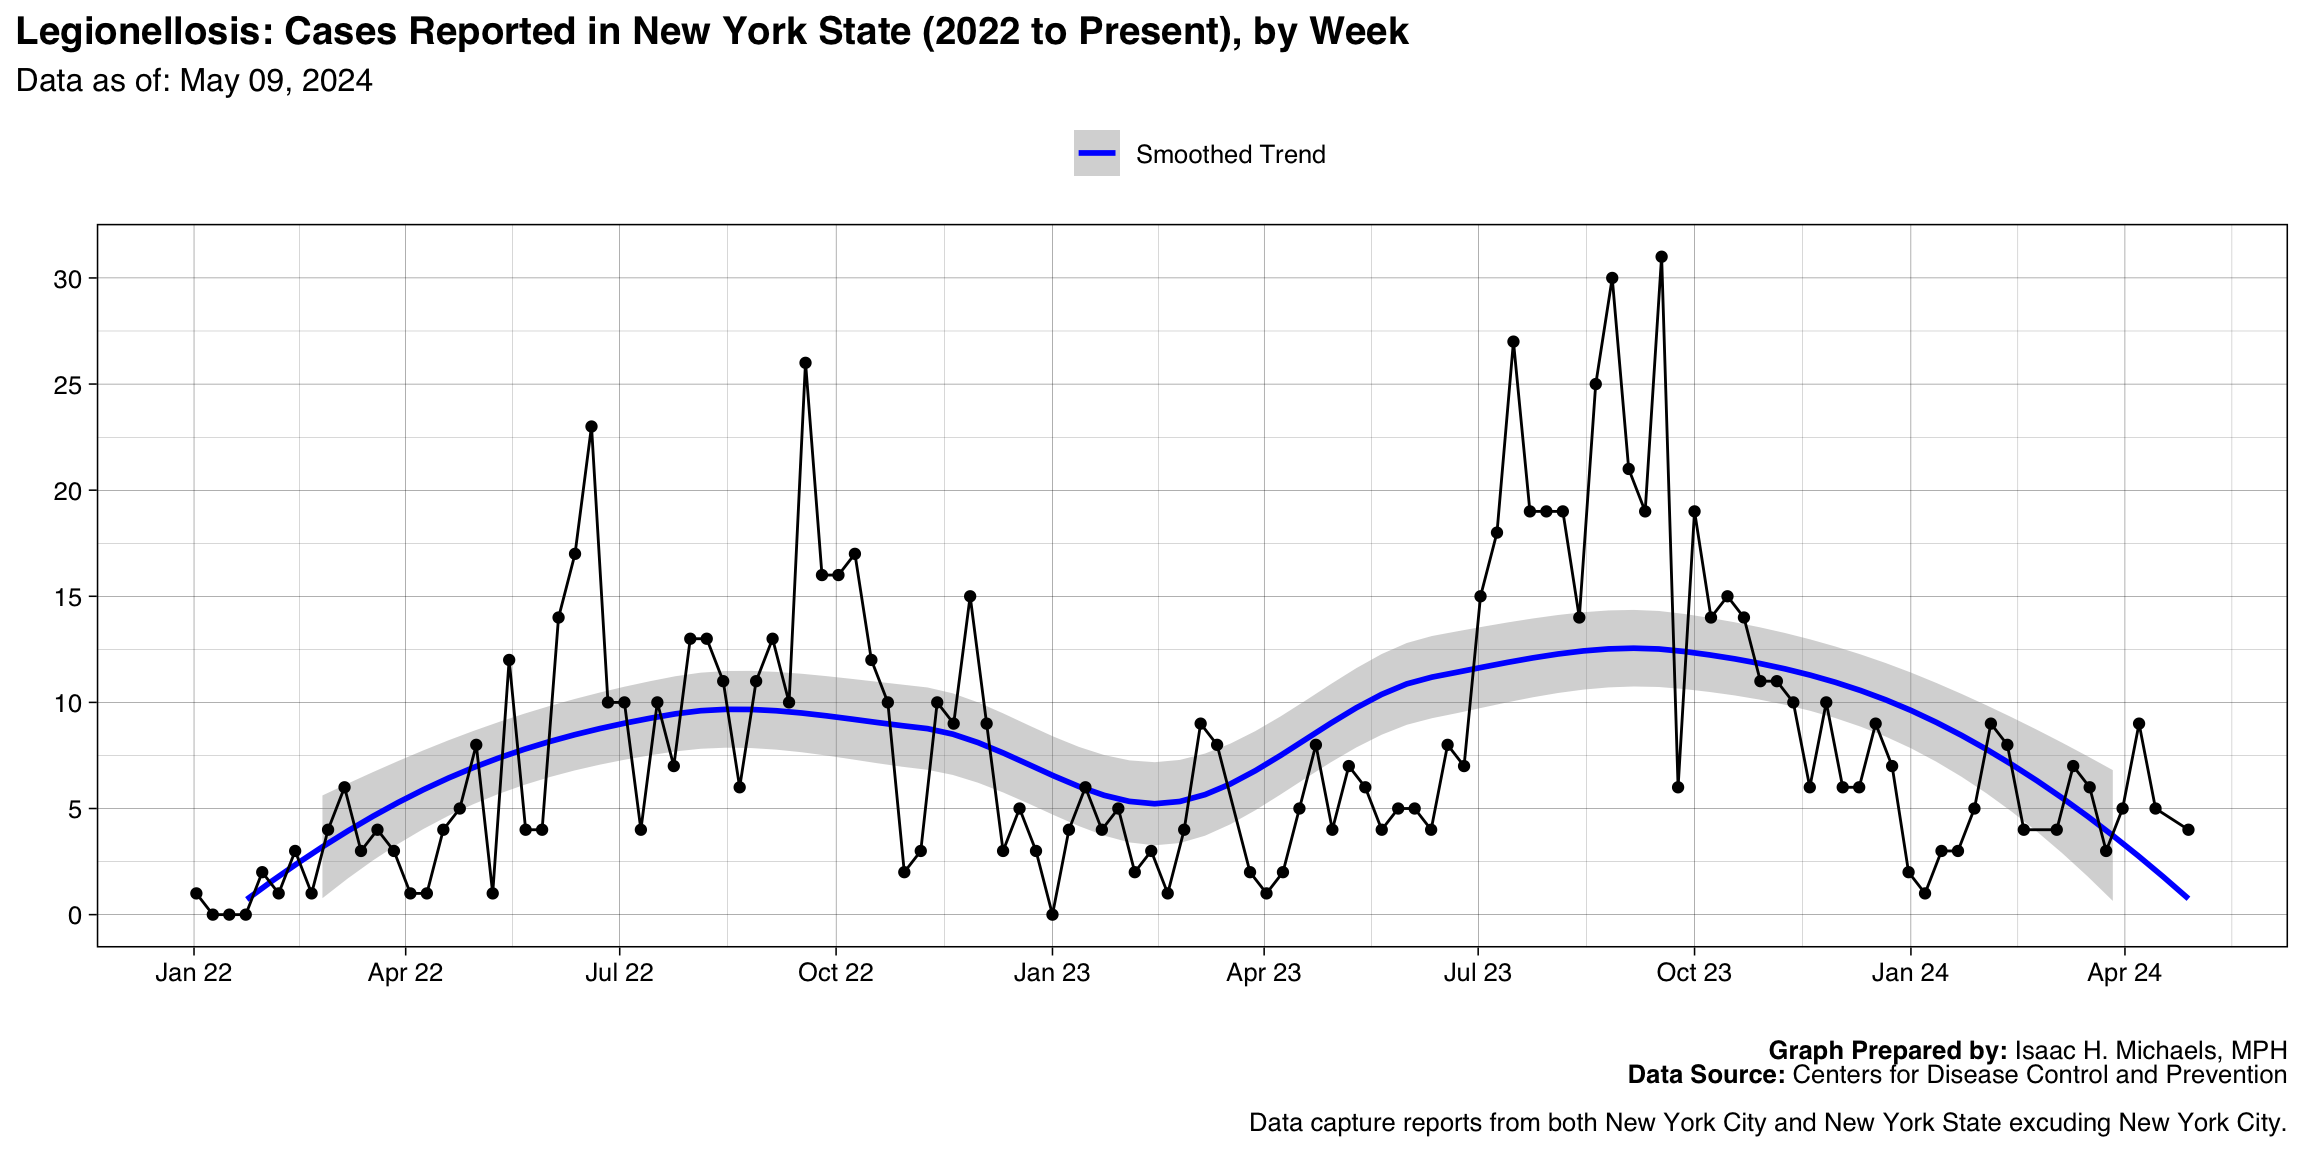
Legionellosis
Graph Prepared By: Isaac H. Michaels, MPH
Death Data Source: U.S. Centers for Disease Control and Prevention
Haemophilus influenzae, invasive disease, All ages, all serotypes
Graph Prepared By: Isaac H. Michaels, MPH
Death Data Source: U.S. Centers for Disease Control and Prevention
Cryptosporidiosis
Graph Prepared By: Isaac H. Michaels, MPH
Death Data Source: U.S. Centers for Disease Control and Prevention
Hepatitis B, chronic, Probable
Graph Prepared By: Isaac H. Michaels, MPH
Death Data Source: U.S. Centers for Disease Control and Prevention
Ehrlichiosis and Anaplasmosis, Ehrlichia chaffeensis infection
Graph Prepared By: Isaac H. Michaels, MPH
Death Data Source: U.S. Centers for Disease Control and Prevention
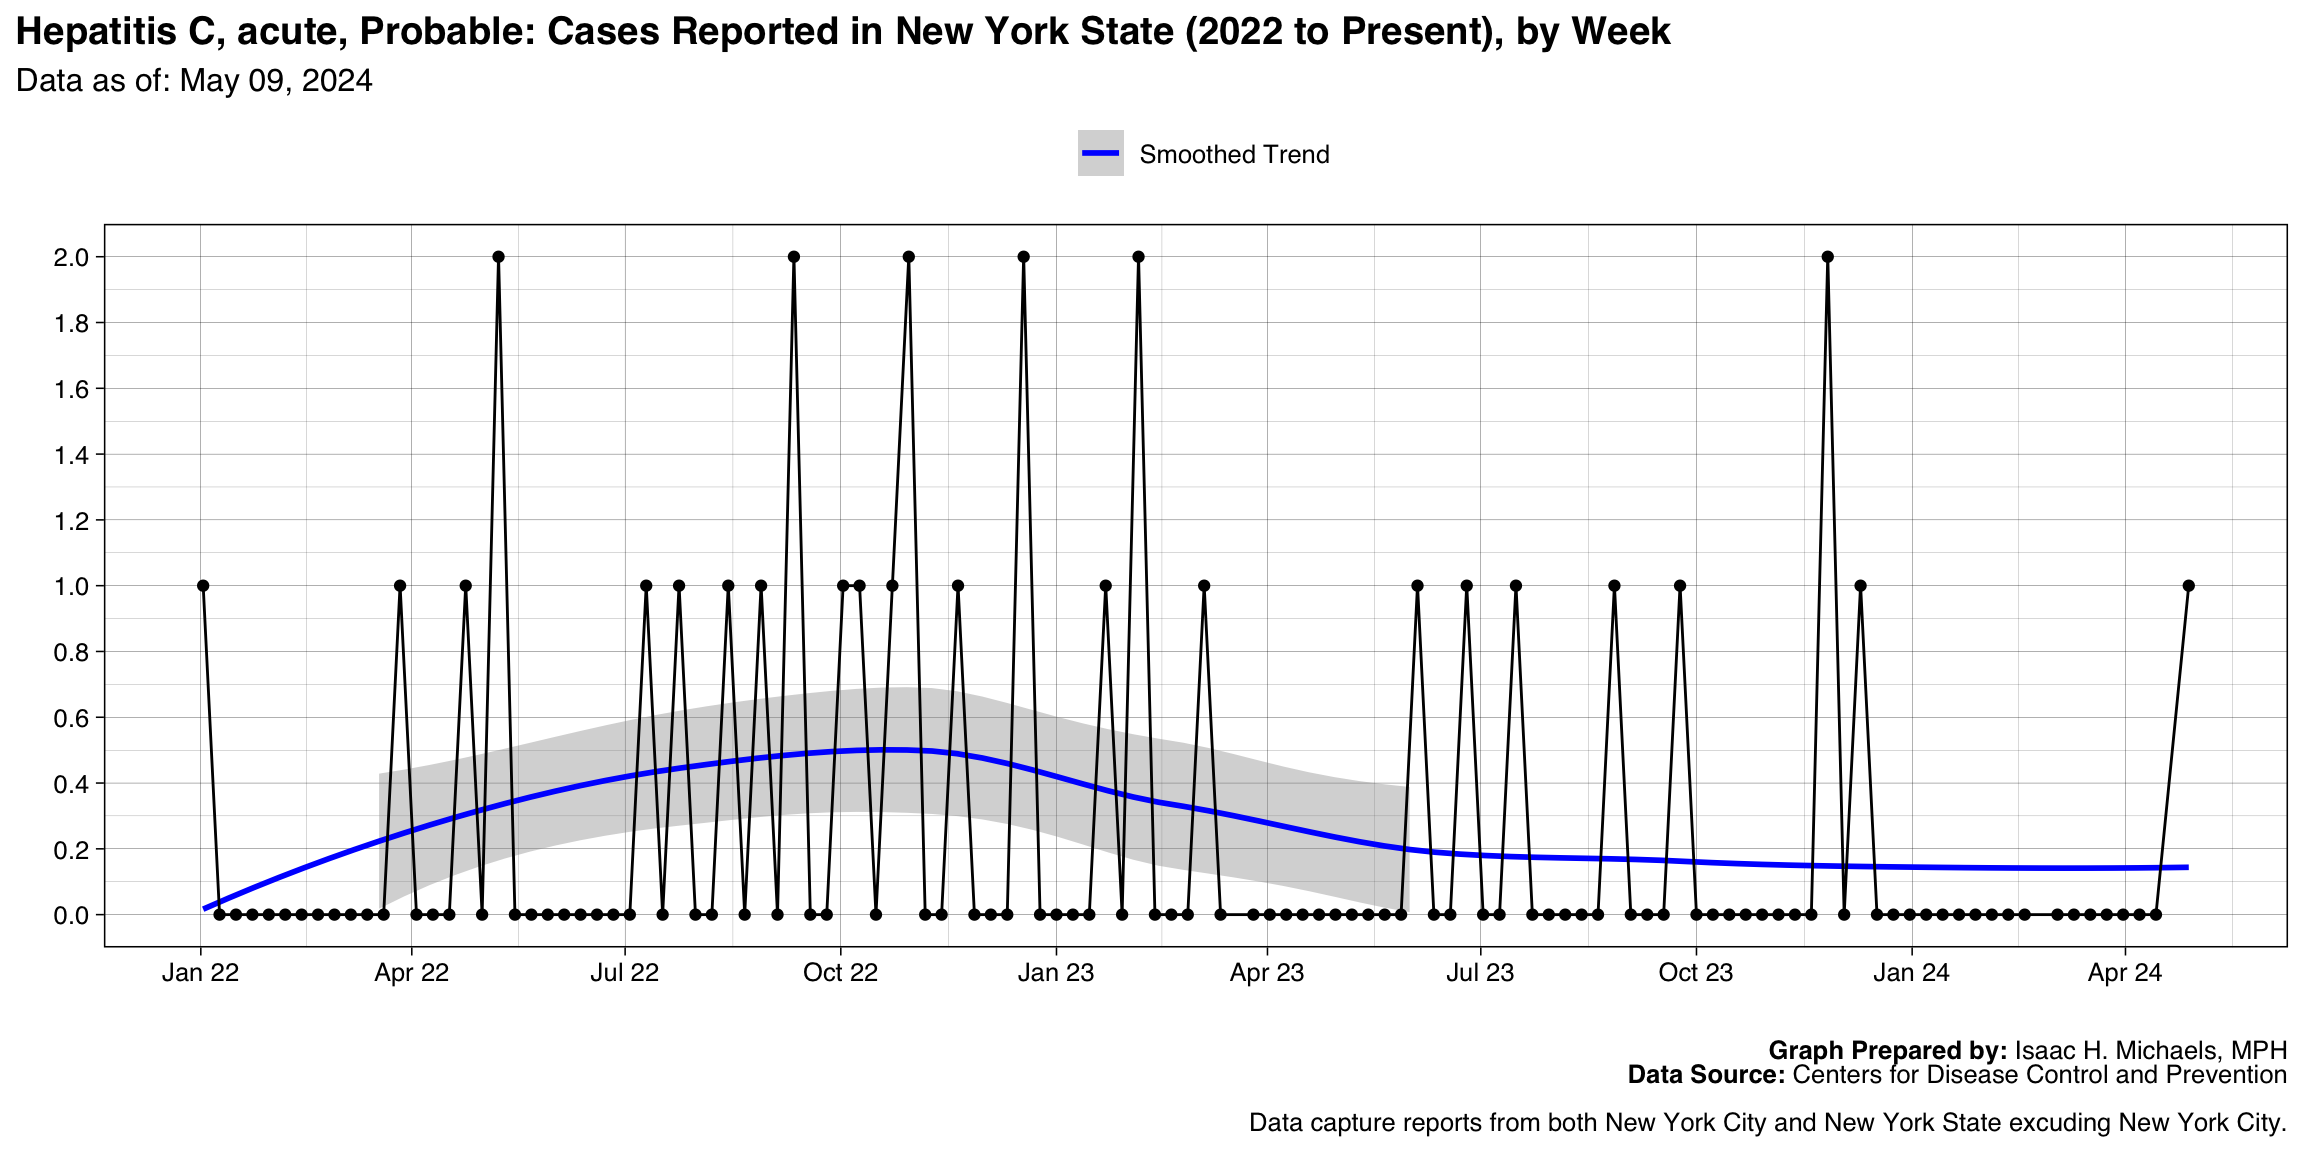
Hepatitis C, acute, Confirmed
Graph Prepared By: Isaac H. Michaels, MPH
Death Data Source: U.S. Centers for Disease Control and Prevention
Invasive pneumococcal disease, all ages, Probable
Graph Prepared By: Isaac H. Michaels, MPH
Death Data Source: U.S. Centers for Disease Control and Prevention
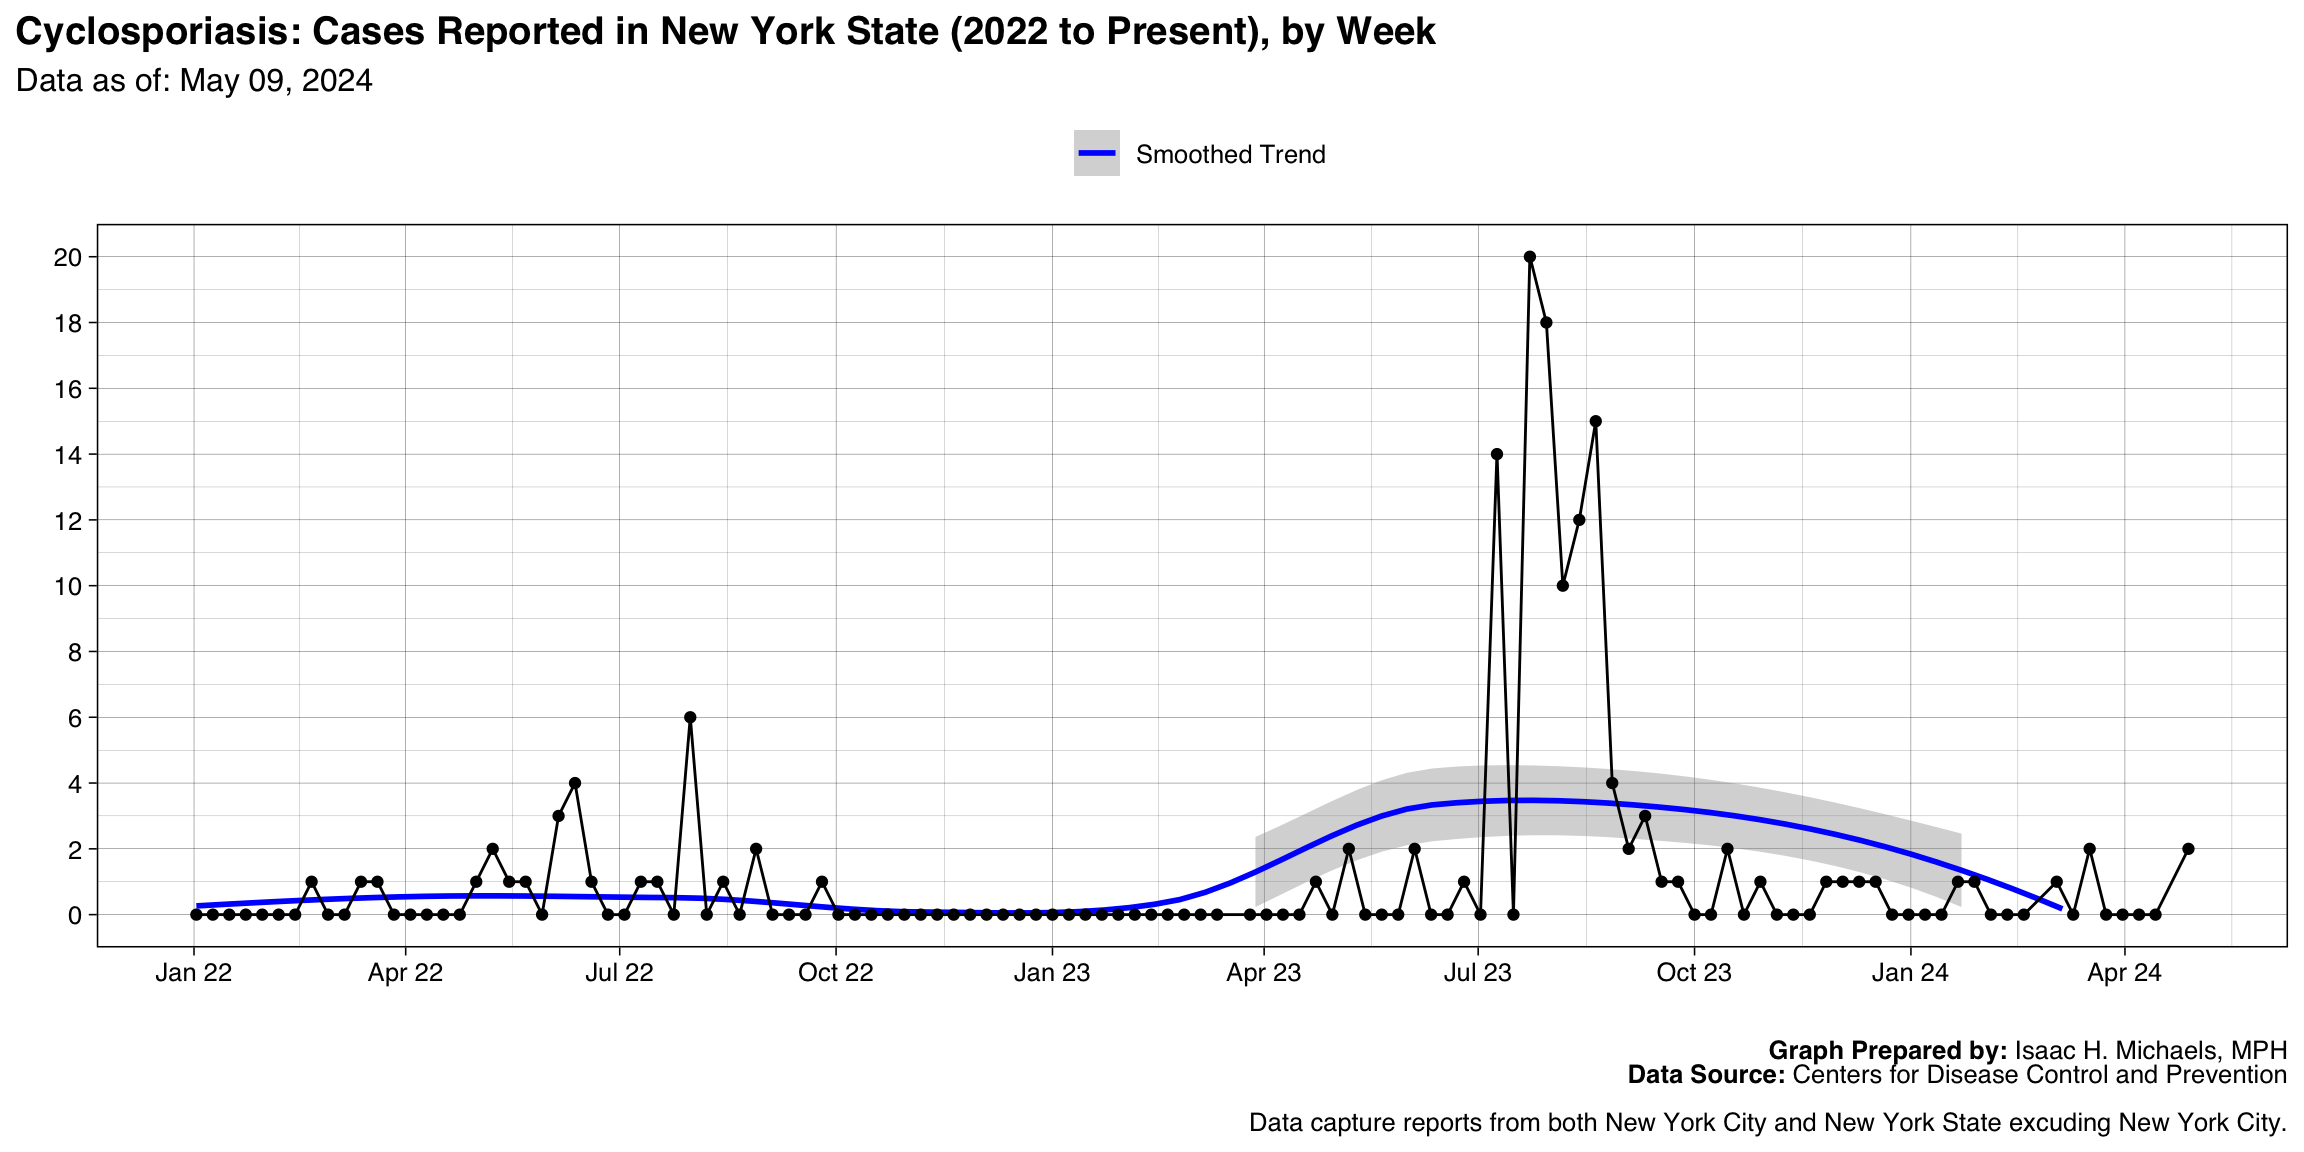
Cyclosporiasis
Graph Prepared By: Isaac H. Michaels, MPH
Death Data Source: U.S. Centers for Disease Control and Prevention
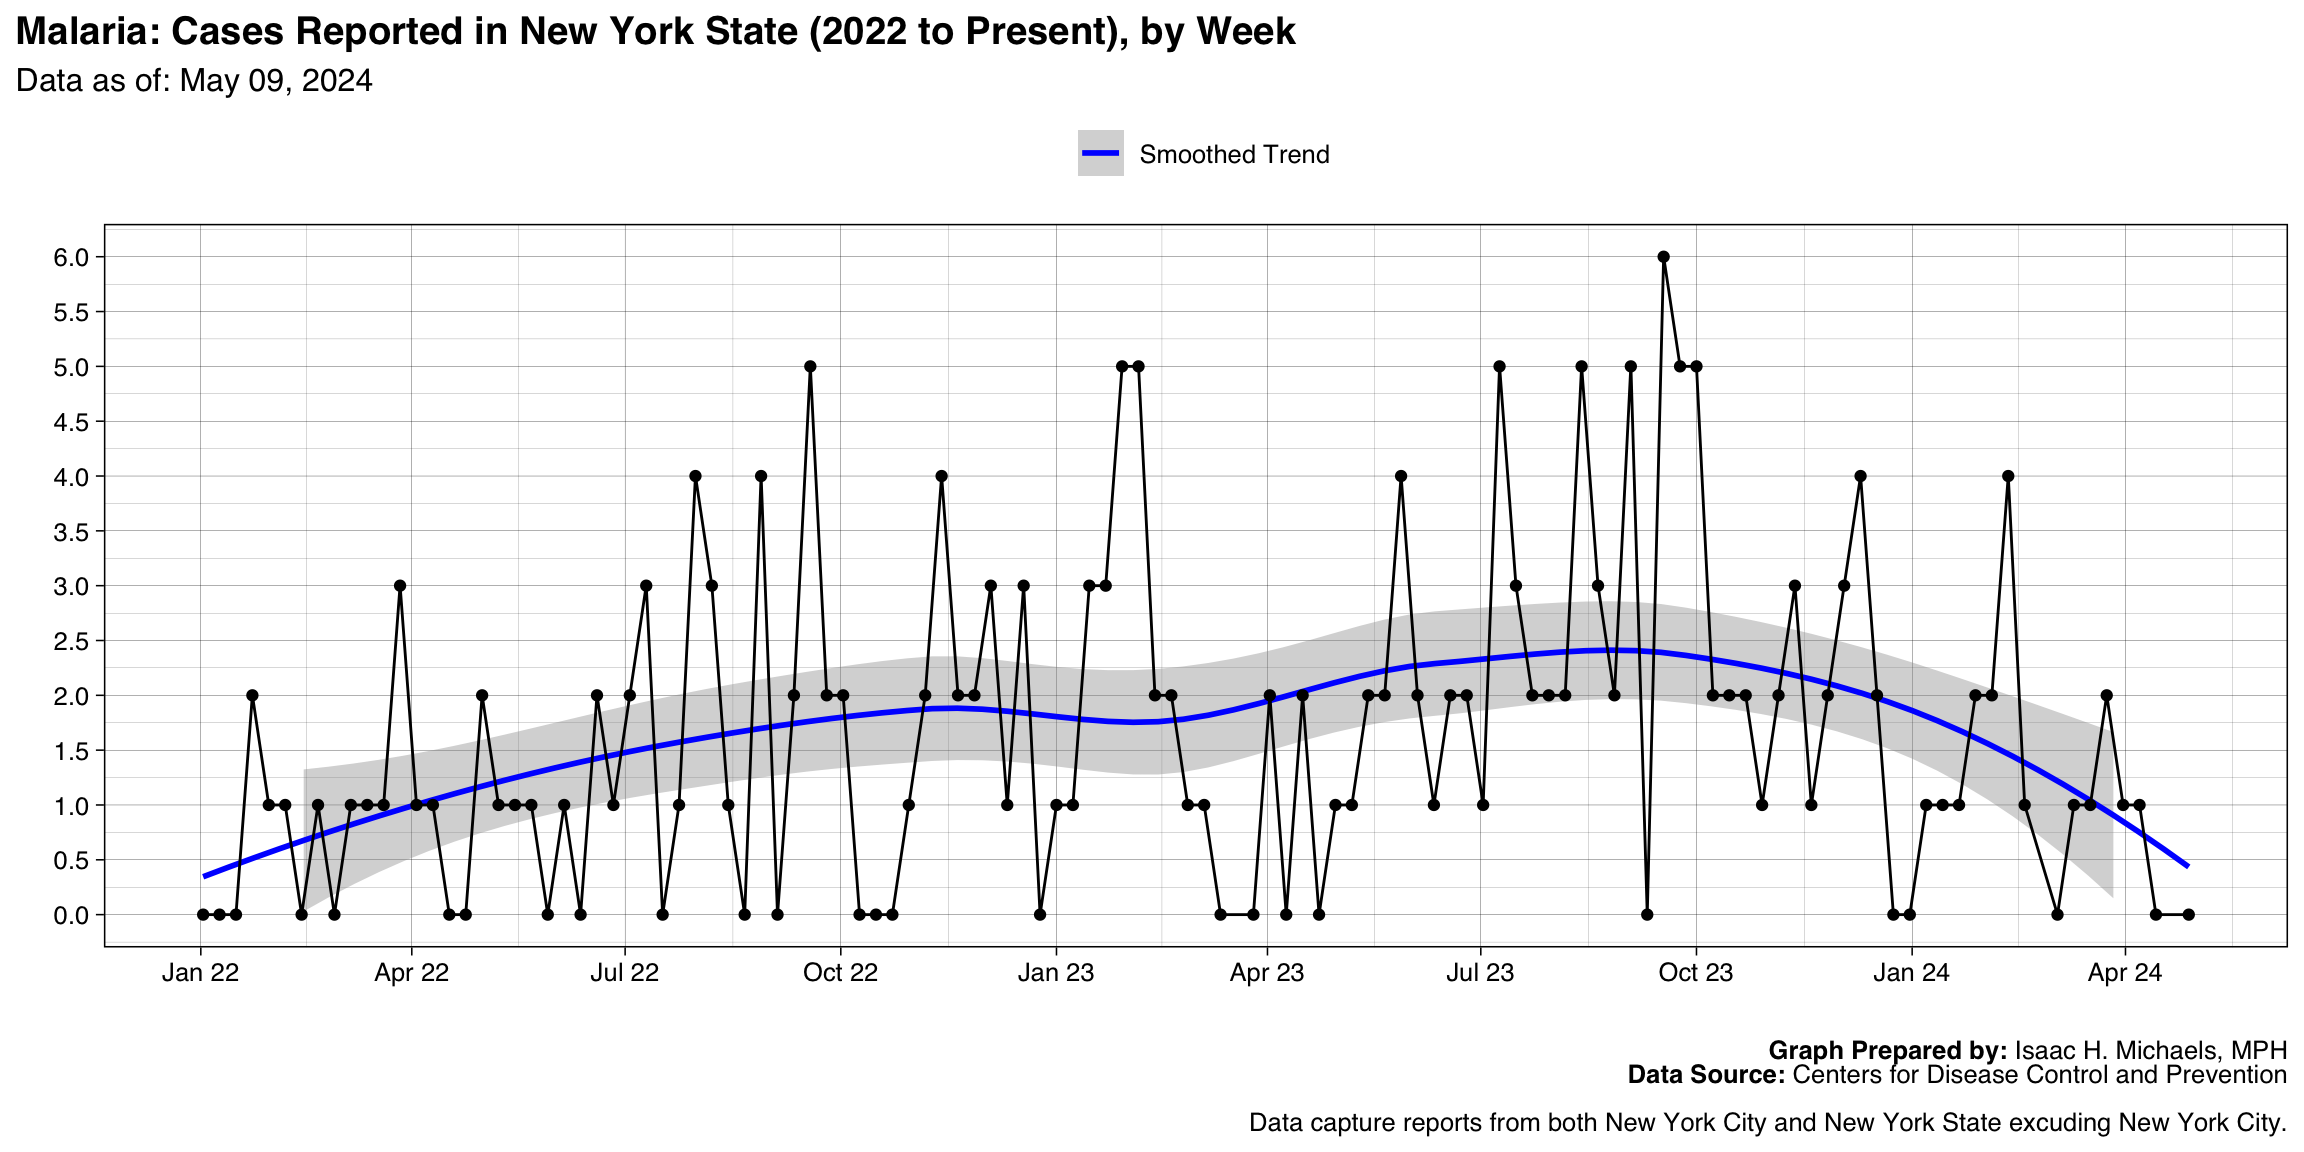
Malaria
Graph Prepared By: Isaac H. Michaels, MPH
Death Data Source: U.S. Centers for Disease Control and Prevention
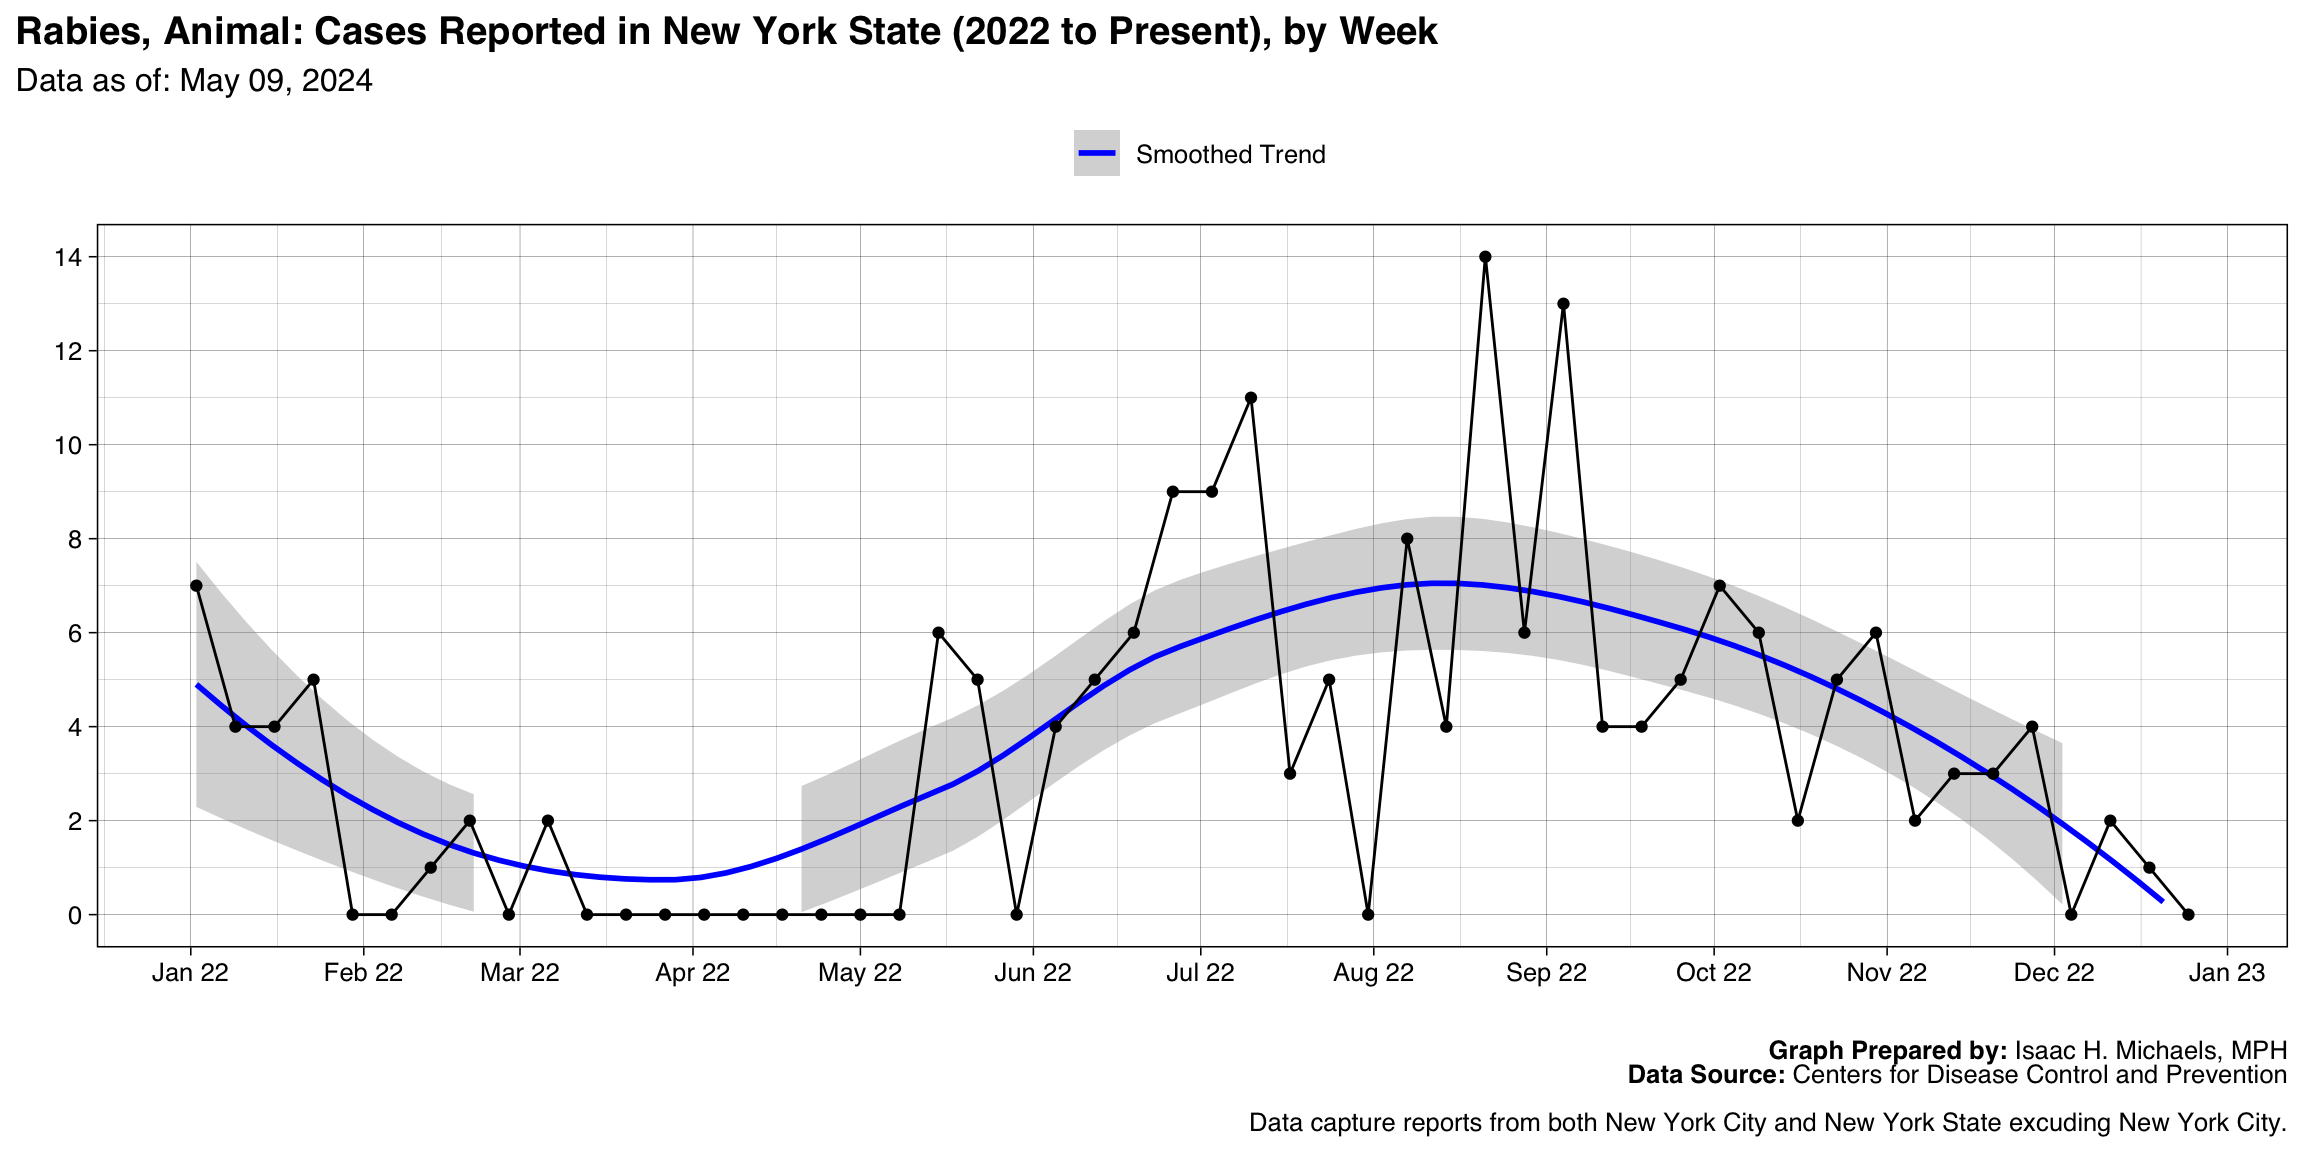
Rabies, Animal
Graph Prepared By: Isaac H. Michaels, MPH
Death Data Source: U.S. Centers for Disease Control and Prevention
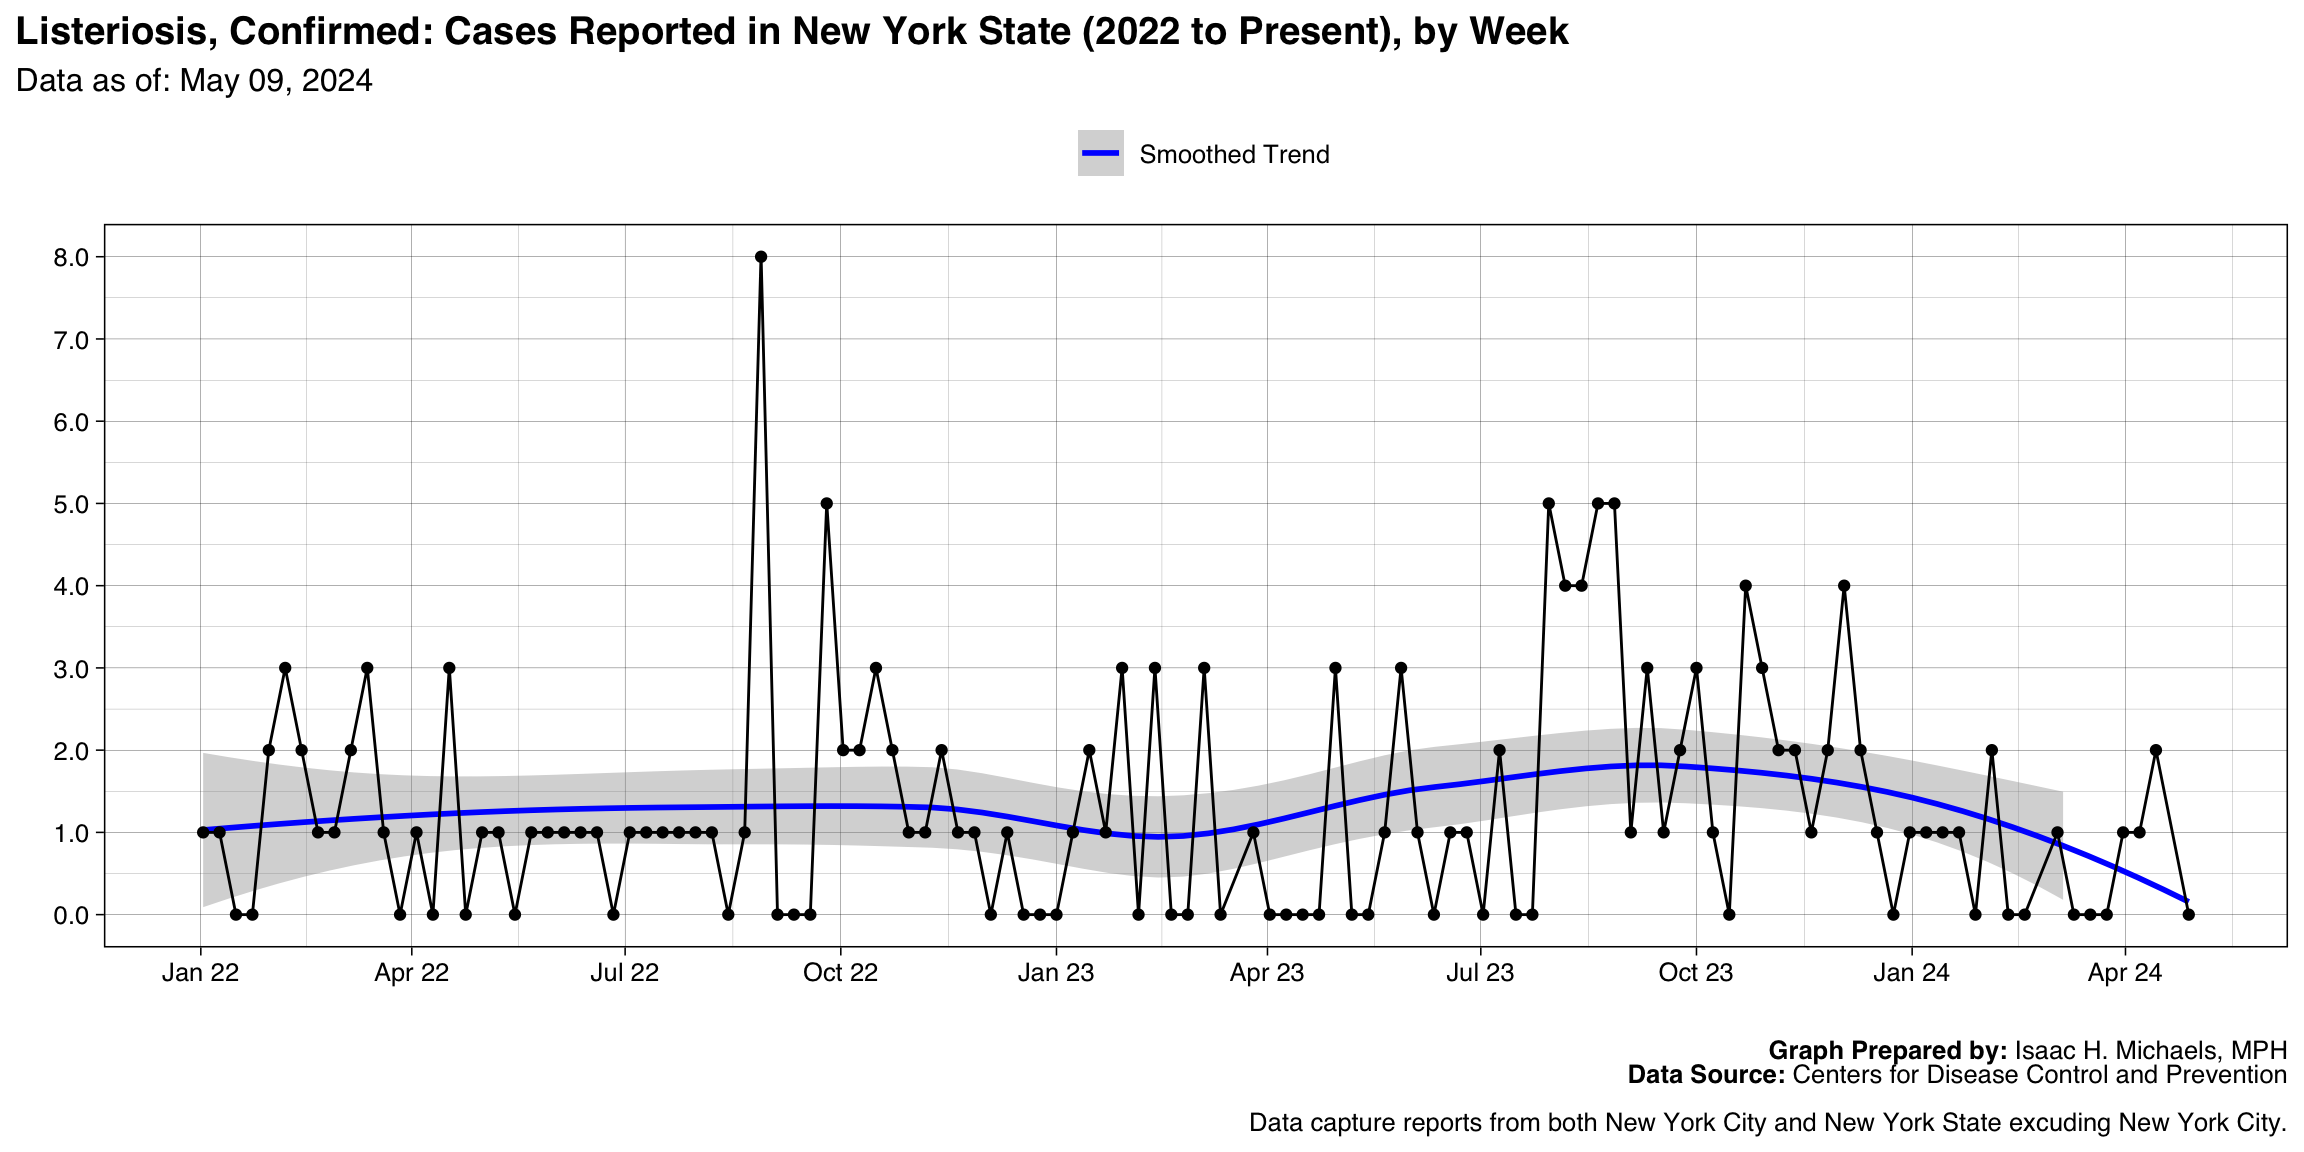
Listeriosis, Confirmed
Graph Prepared By: Isaac H. Michaels, MPH
Death Data Source: U.S. Centers for Disease Control and Prevention
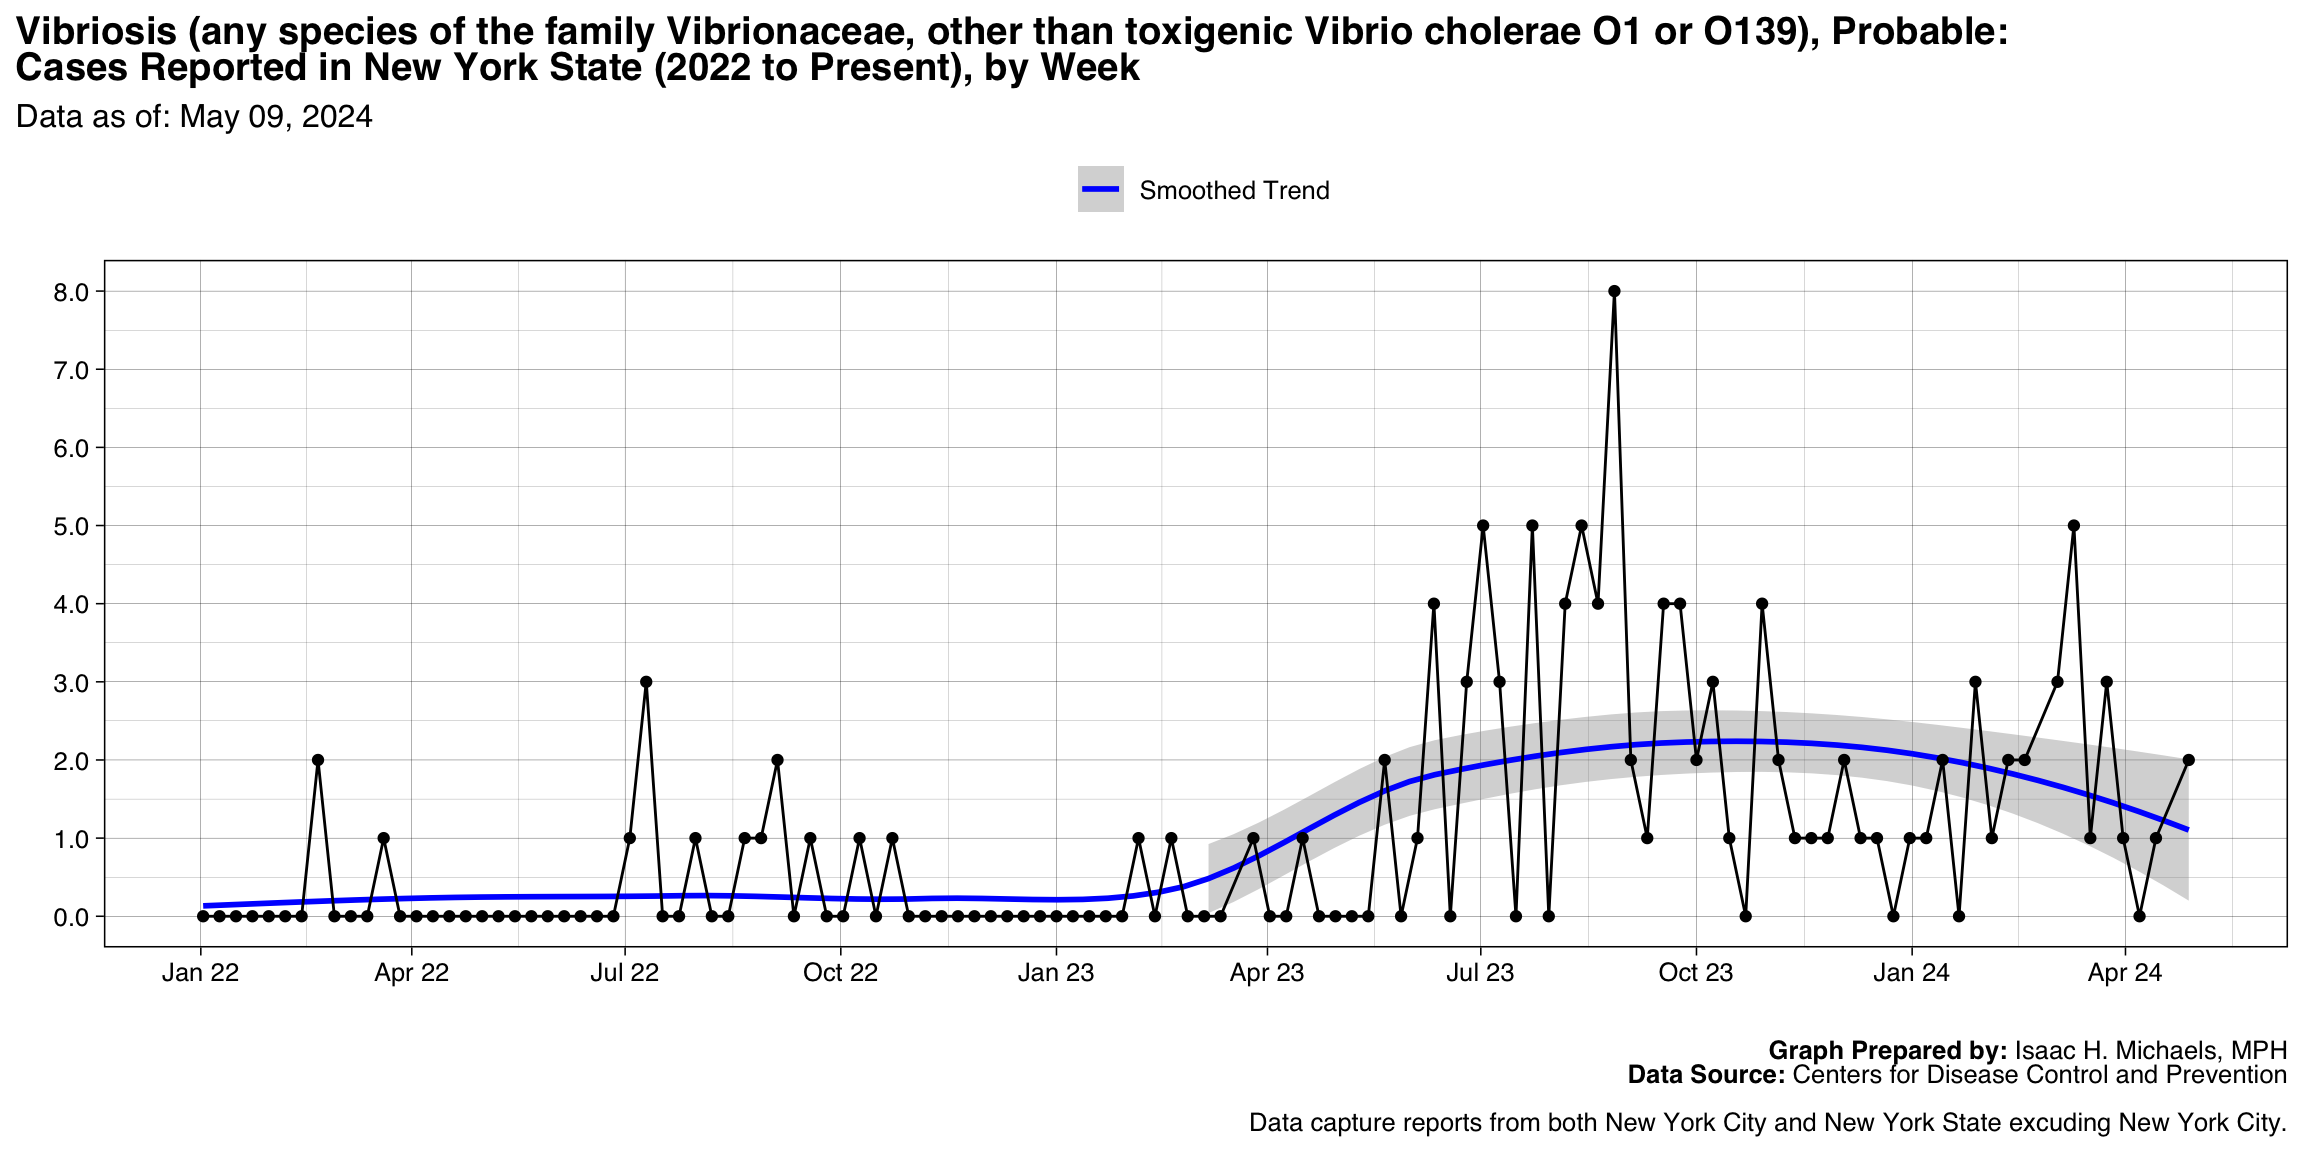
Vibriosis (any species of the family Vibrionaceae, other than toxigenic Vibrio cholerae O1 or O139), Probable
Graph Prepared By: Isaac H. Michaels, MPH
Death Data Source: U.S. Centers for Disease Control and Prevention
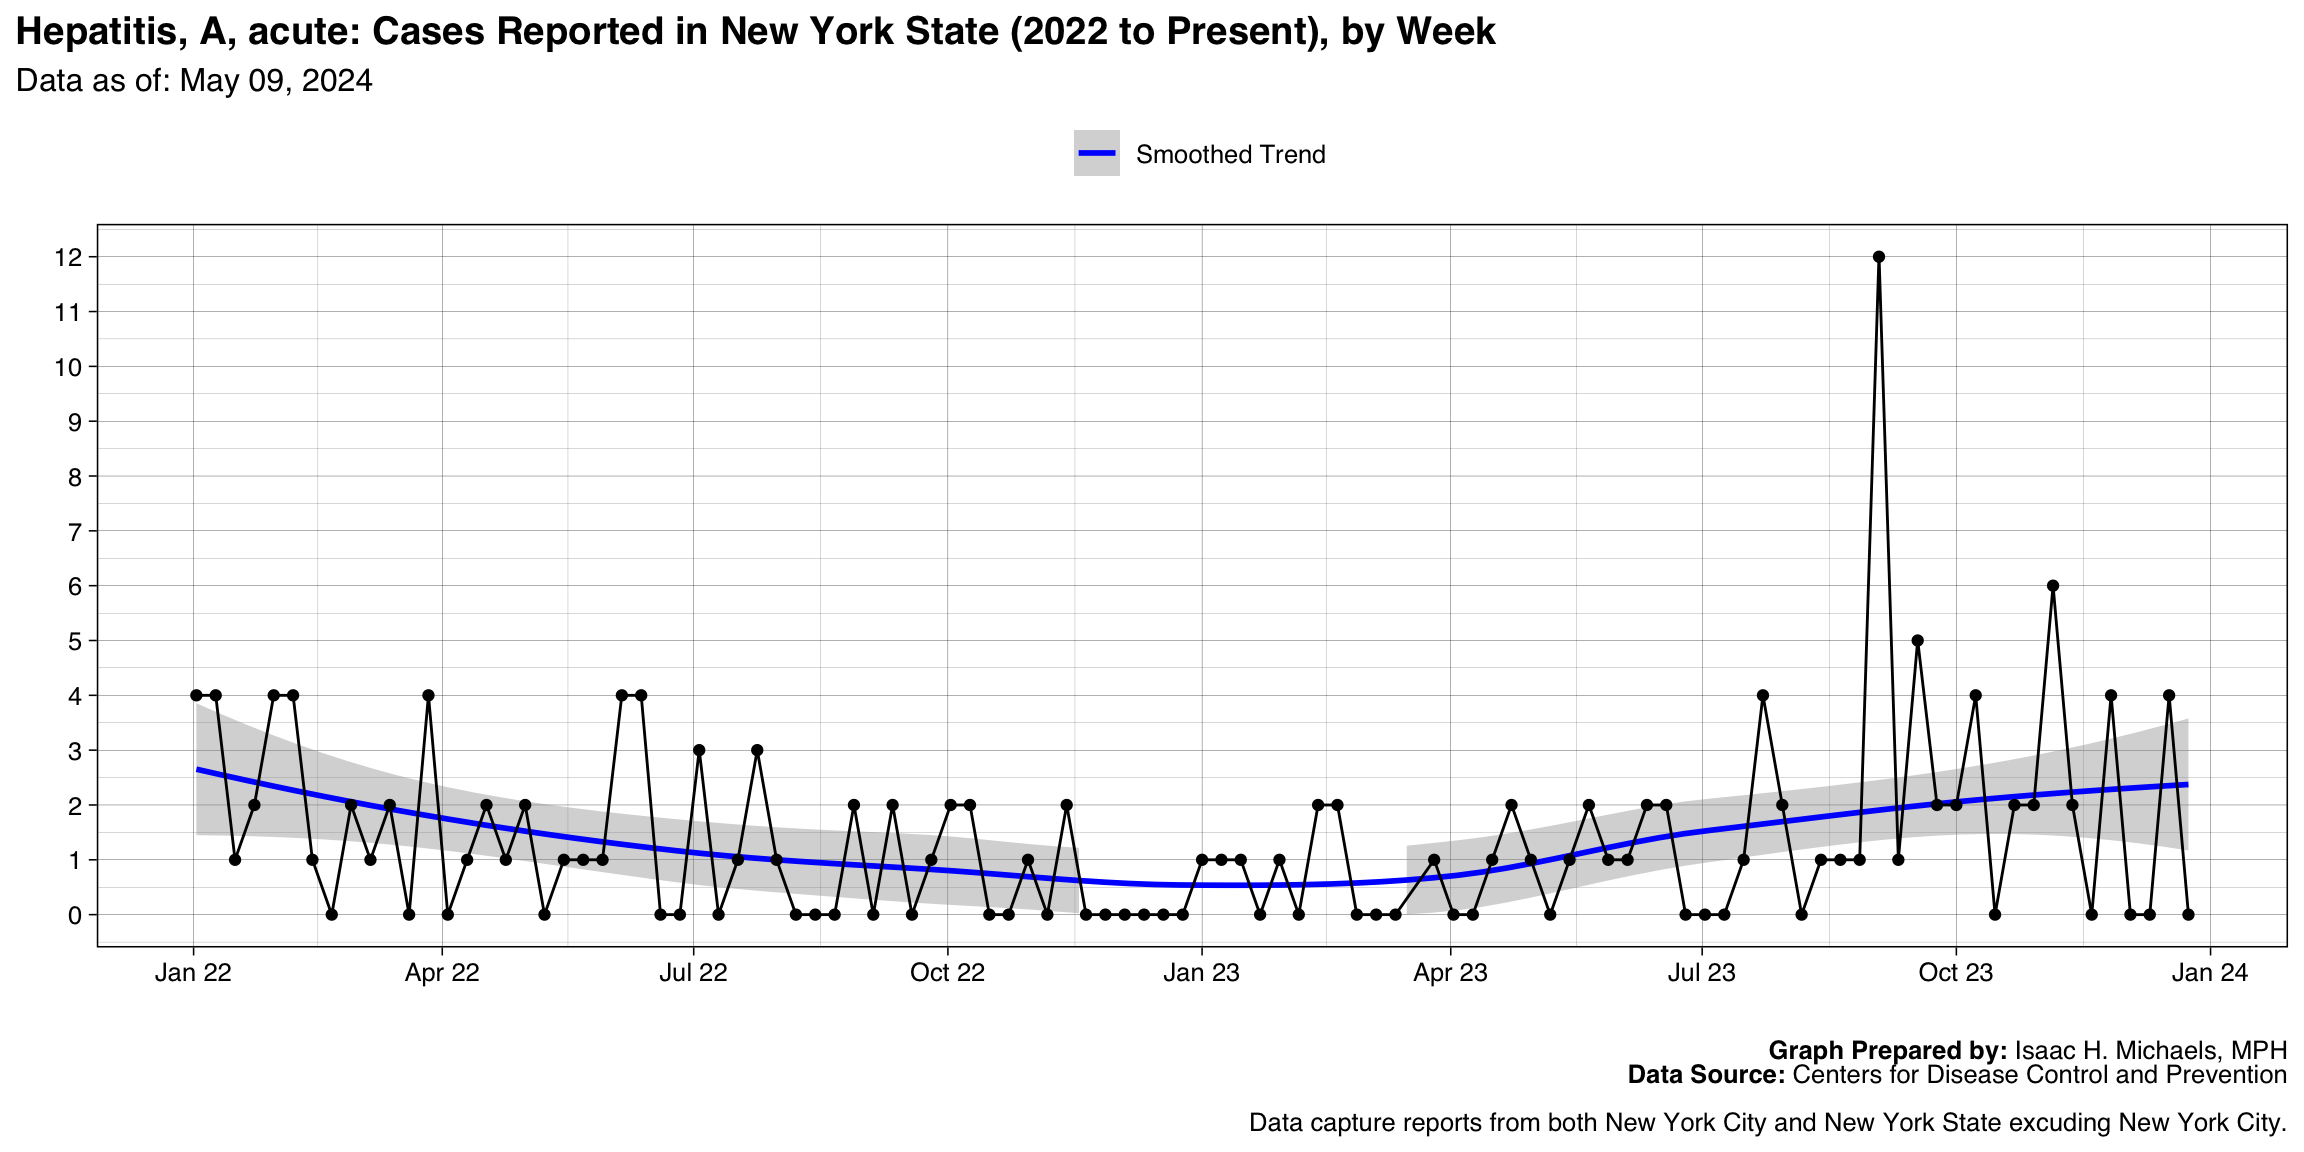
Hepatitis, A, acute
Graph Prepared By: Isaac H. Michaels, MPH
Death Data Source: U.S. Centers for Disease Control and Prevention
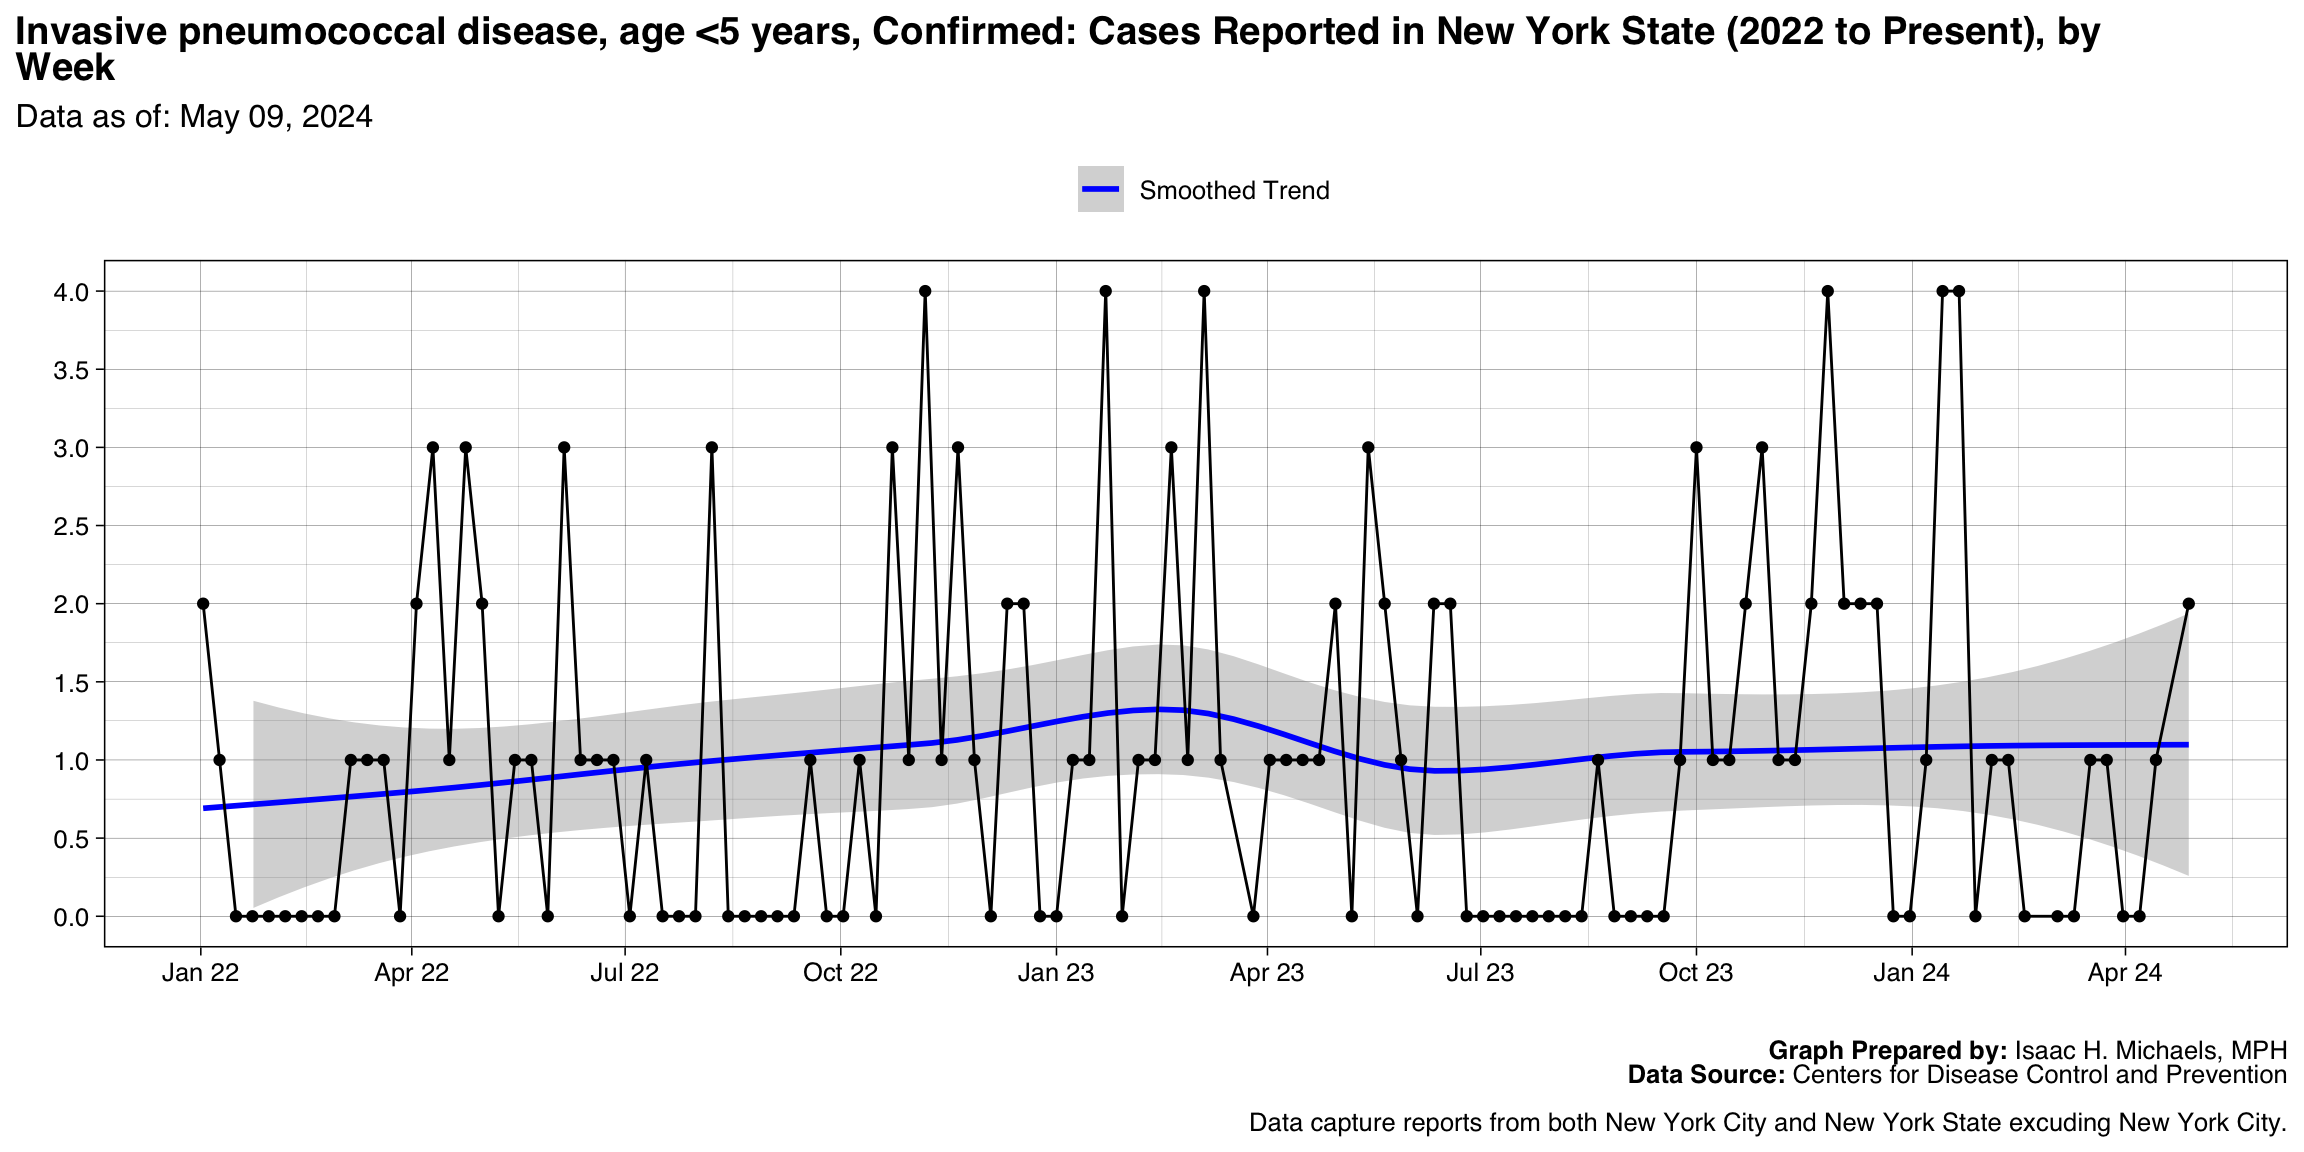
Invasive pneumococcal disease, age <5 years, Confirmed
Graph Prepared By: Isaac H. Michaels, MPH
Death Data Source: U.S. Centers for Disease Control and Prevention
Mpox
Graph Prepared By: Isaac H. Michaels, MPH
Death Data Source: U.S. Centers for Disease Control and Prevention
Meningococcal disease, All serogroups
Graph Prepared By: Isaac H. Michaels, MPH
Death Data Source: U.S. Centers for Disease Control and Prevention
Meningococcal disease, Unknown serogroup
Graph Prepared By: Isaac H. Michaels, MPH
Death Data Source: U.S. Centers for Disease Control and Prevention
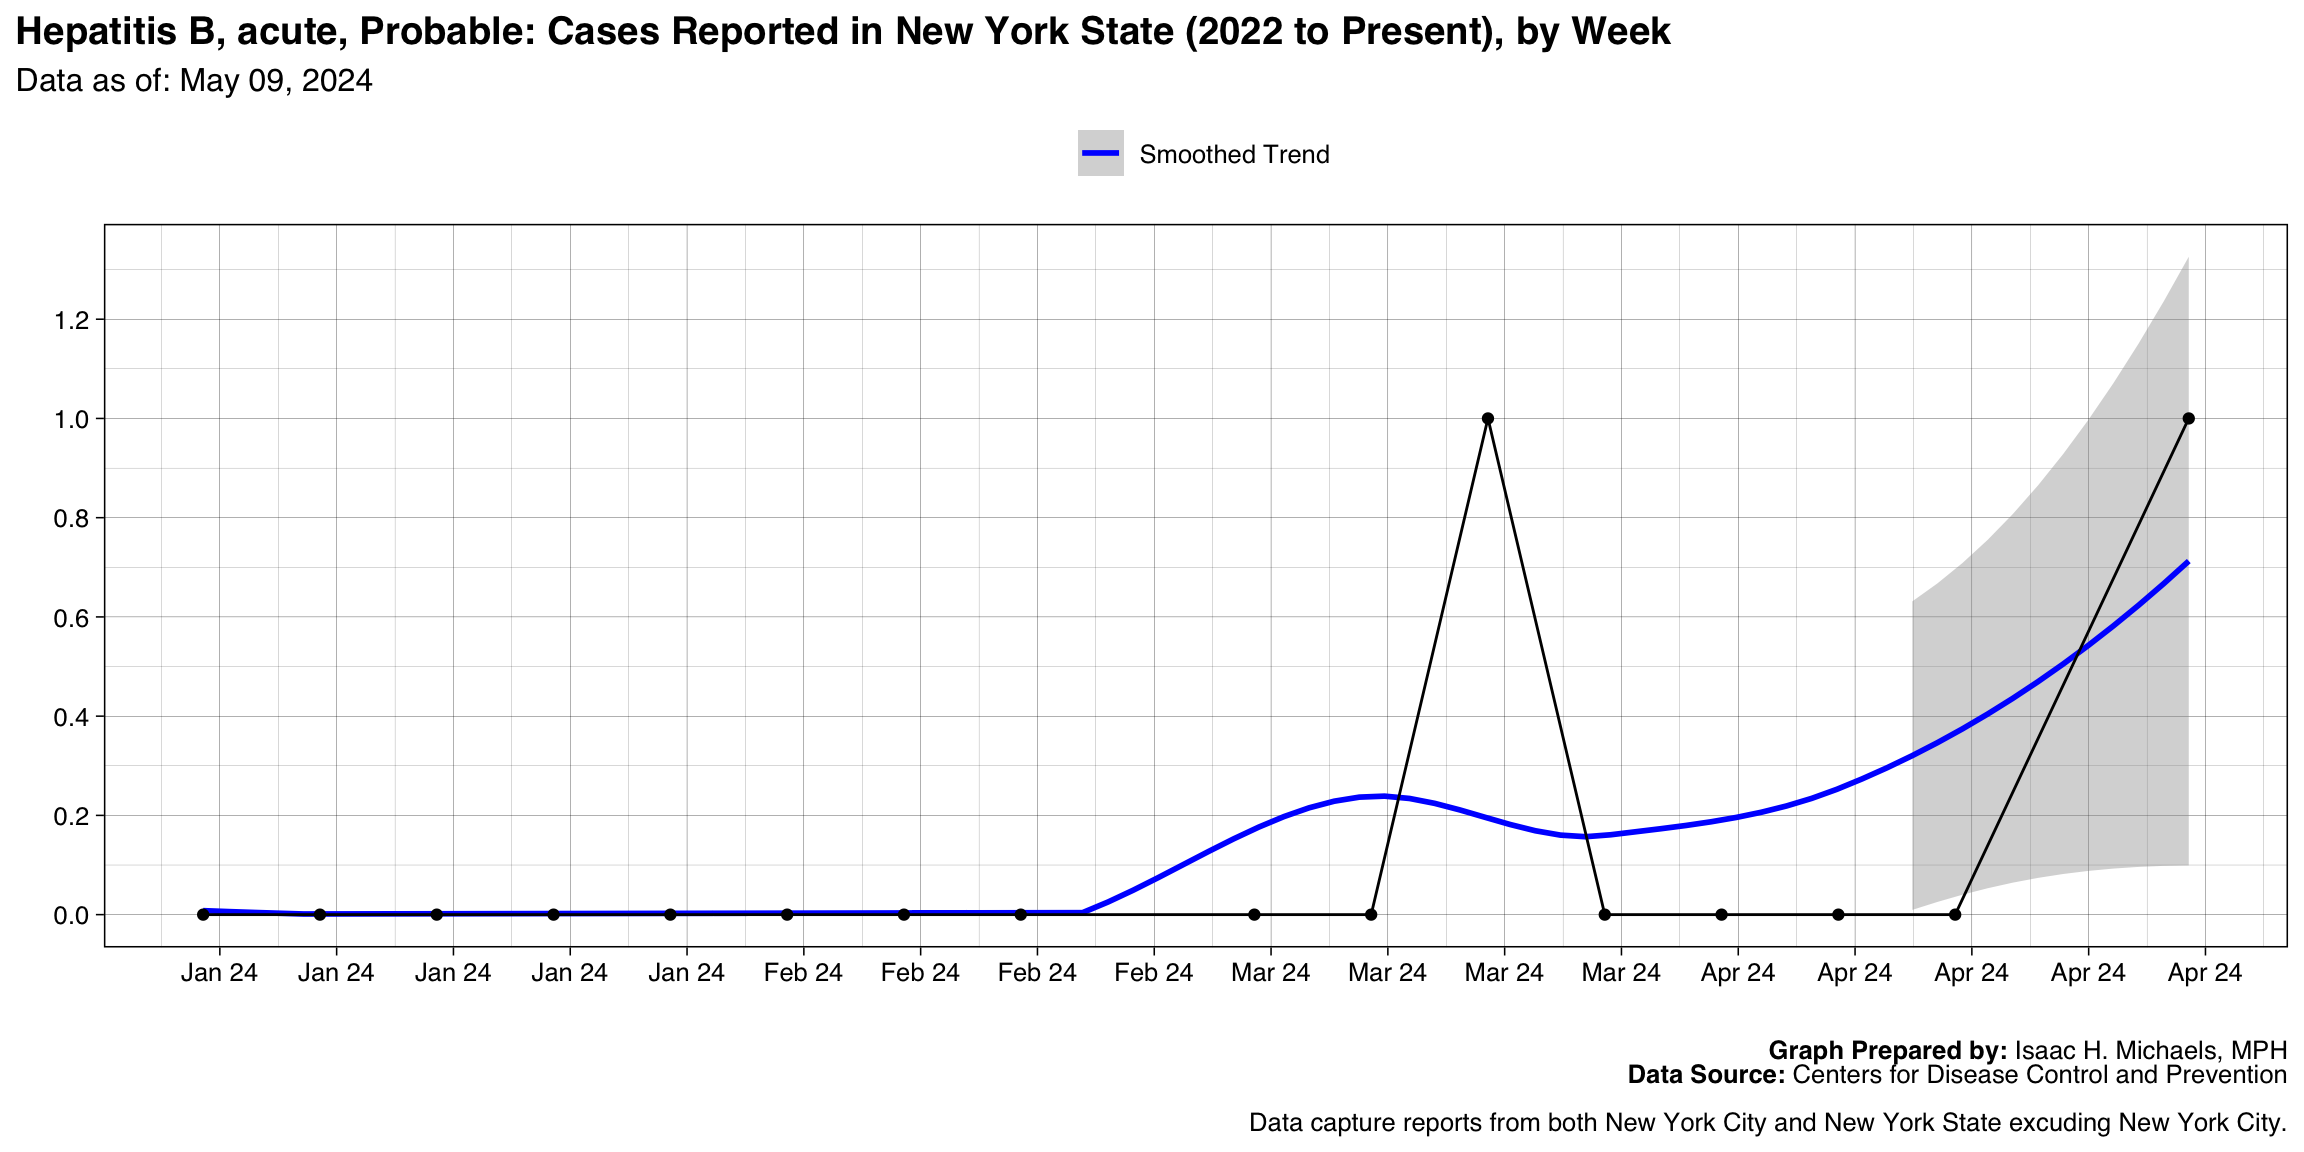
Hepatitis, B, acute
Graph Prepared By: Isaac H. Michaels, MPH
Death Data Source: U.S. Centers for Disease Control and Prevention
Vibriosis (any species of the family Vibrionaceae, other than toxigenic Vibrio cholerae O1 or O139), Confirmed
Graph Prepared By: Isaac H. Michaels, MPH
Death Data Source: U.S. Centers for Disease Control and Prevention
Haemophilus influenzae, invasive disease, Age <5 years, Unknown serotype
Graph Prepared By: Isaac H. Michaels, MPH
Death Data Source: U.S. Centers for Disease Control and Prevention
Dengue virus infections, Dengue
Graph Prepared By: Isaac H. Michaels, MPH
Death Data Source: U.S. Centers for Disease Control and Prevention
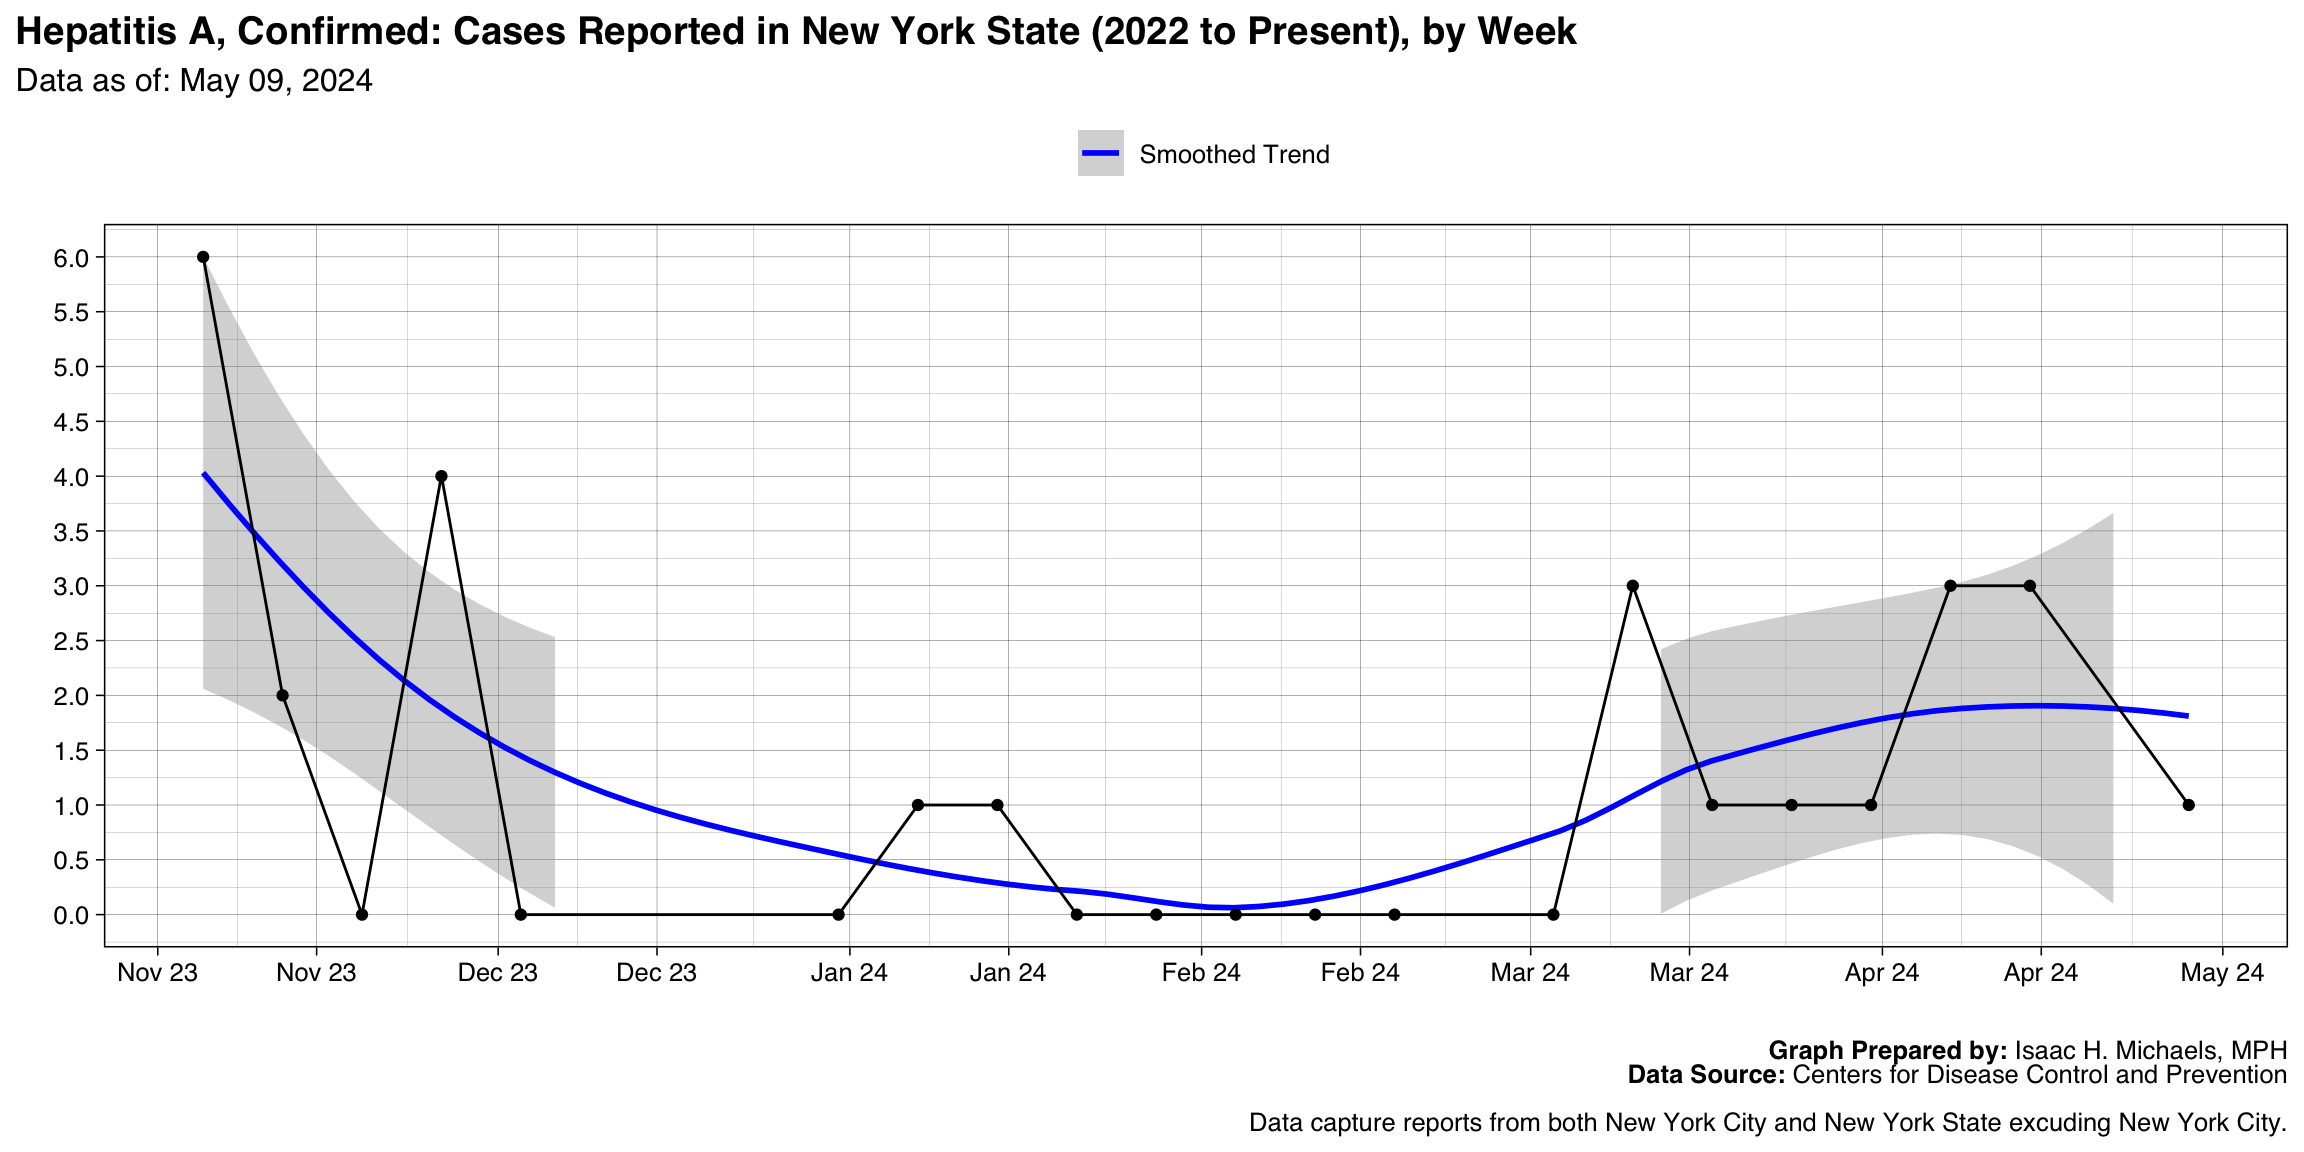
Hepatitis A, Confirmed
Graph Prepared By: Isaac H. Michaels, MPH
Death Data Source: U.S. Centers for Disease Control and Prevention
Salmonella Typhi infection
Graph Prepared By: Isaac H. Michaels, MPH
Death Data Source: U.S. Centers for Disease Control and Prevention
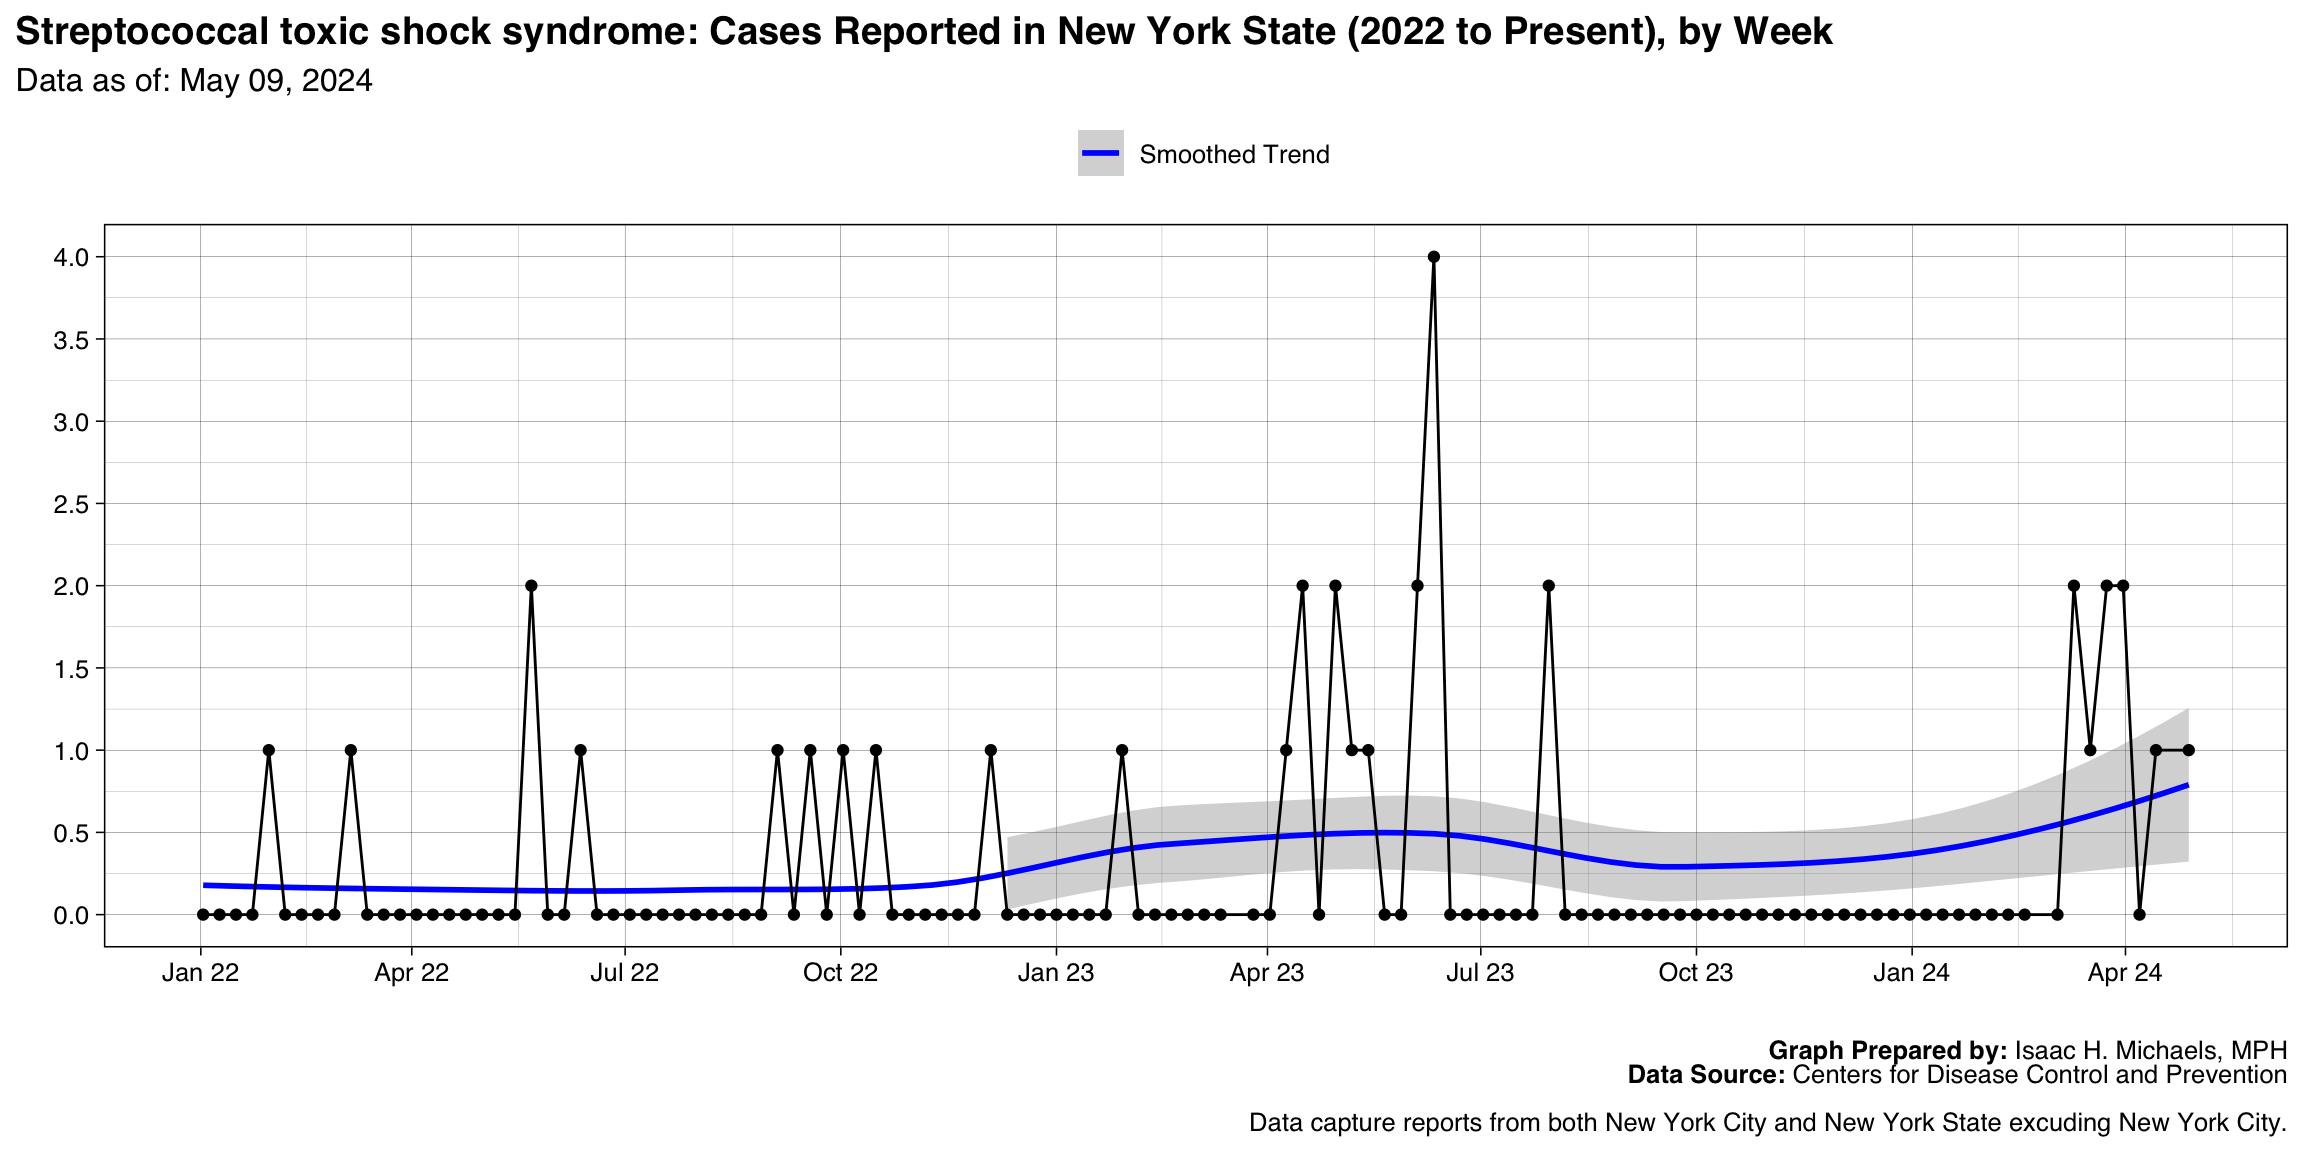
Streptococcal toxic shock syndrome
Graph Prepared By: Isaac H. Michaels, MPH
Death Data Source: U.S. Centers for Disease Control and Prevention
Hepatitis B, acute, Confirmed
Graph Prepared By: Isaac H. Michaels, MPH
Death Data Source: U.S. Centers for Disease Control and Prevention
Hepatitis C, acute, Probable
Graph Prepared By: Isaac H. Michaels, MPH
Death Data Source: U.S. Centers for Disease Control and Prevention
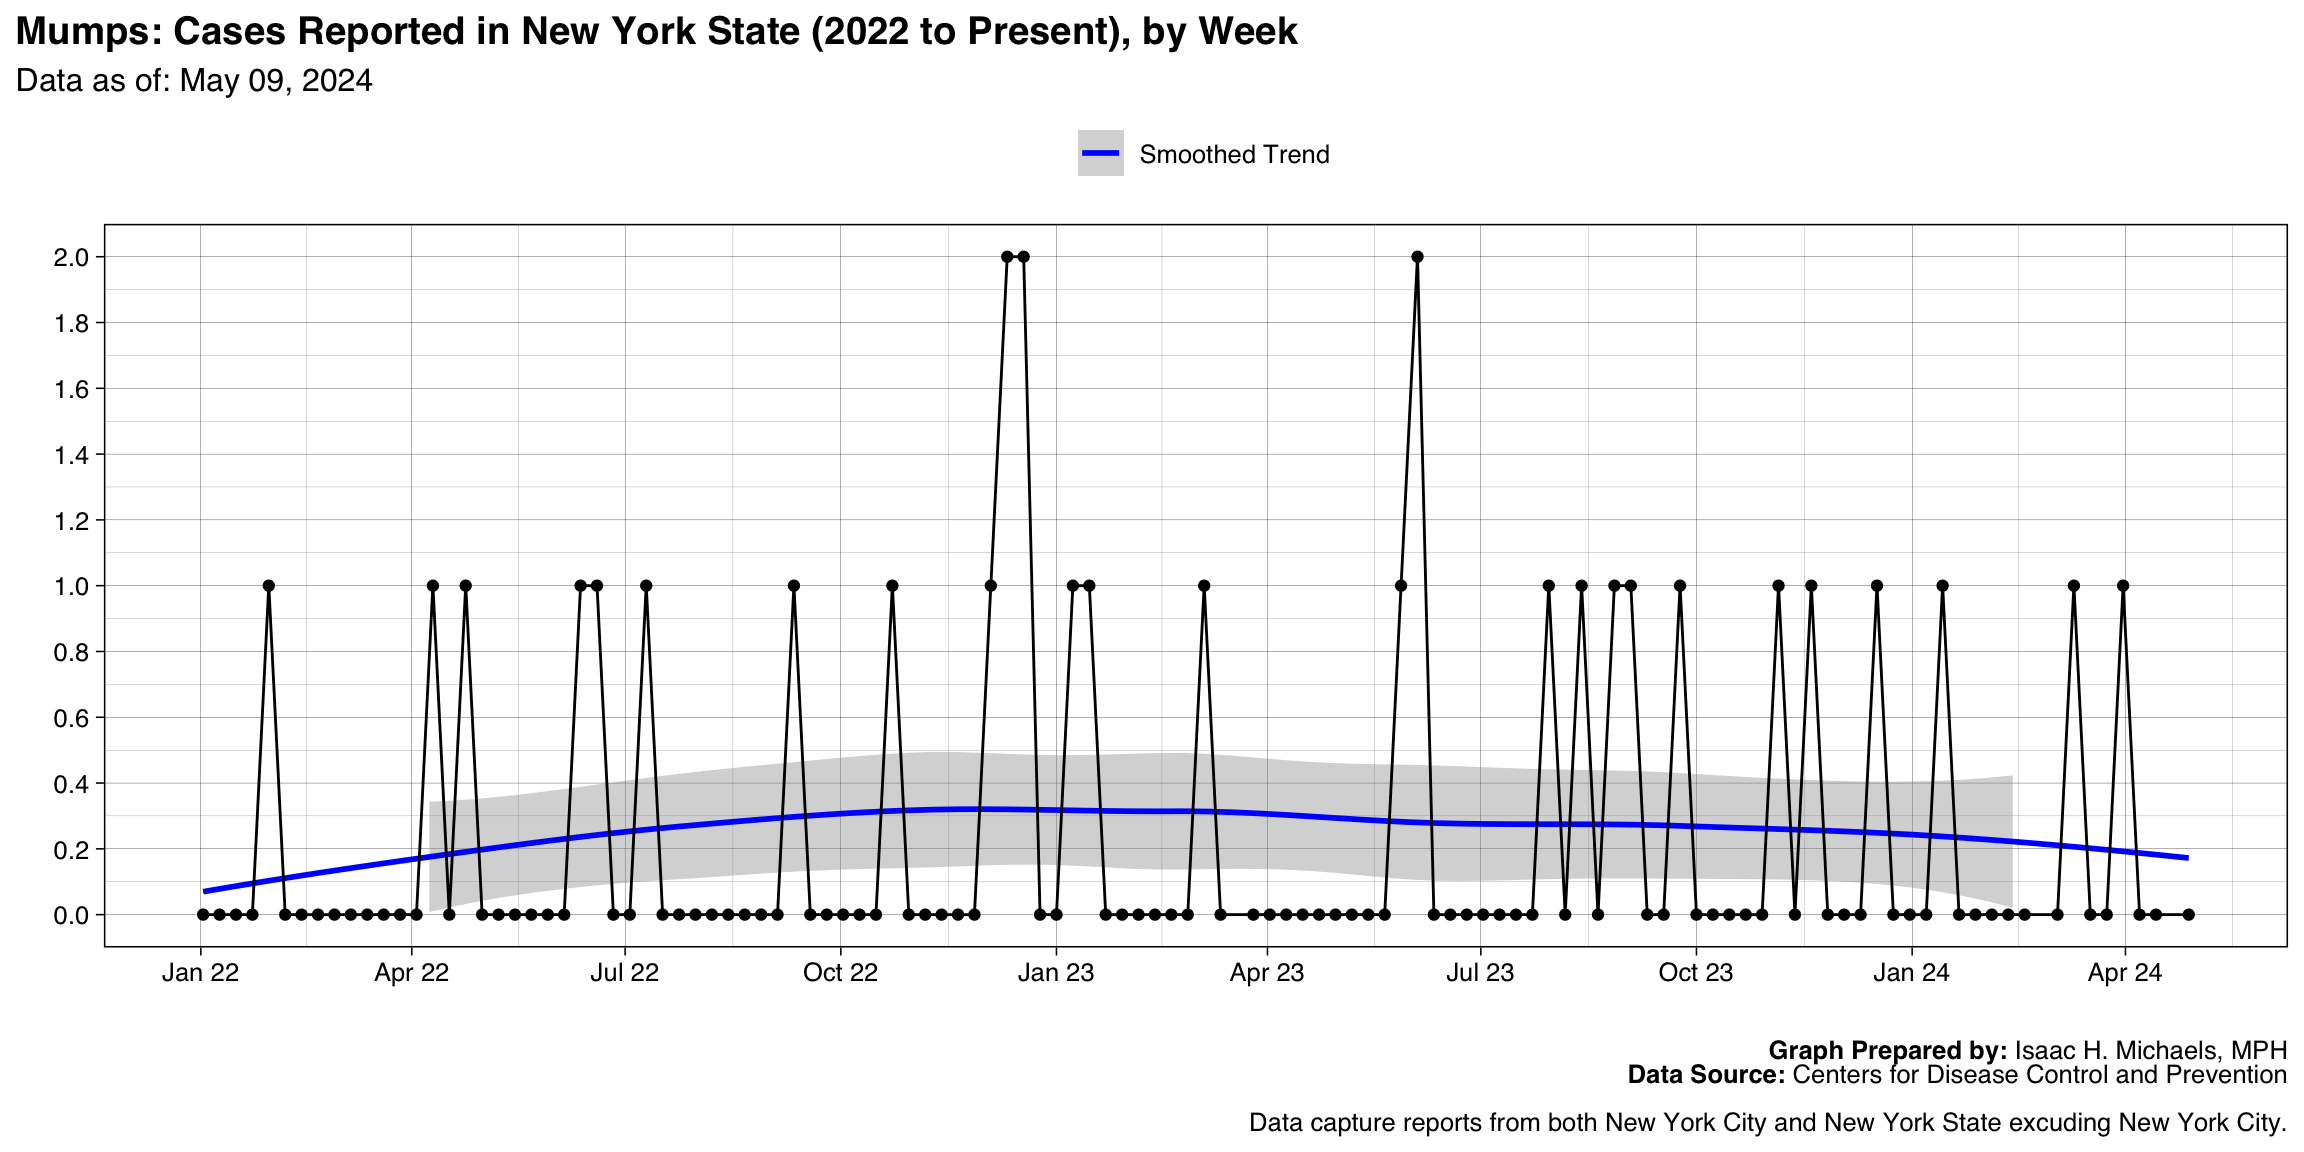
Mumps
Graph Prepared By: Isaac H. Michaels, MPH
Death Data Source: U.S. Centers for Disease Control and Prevention
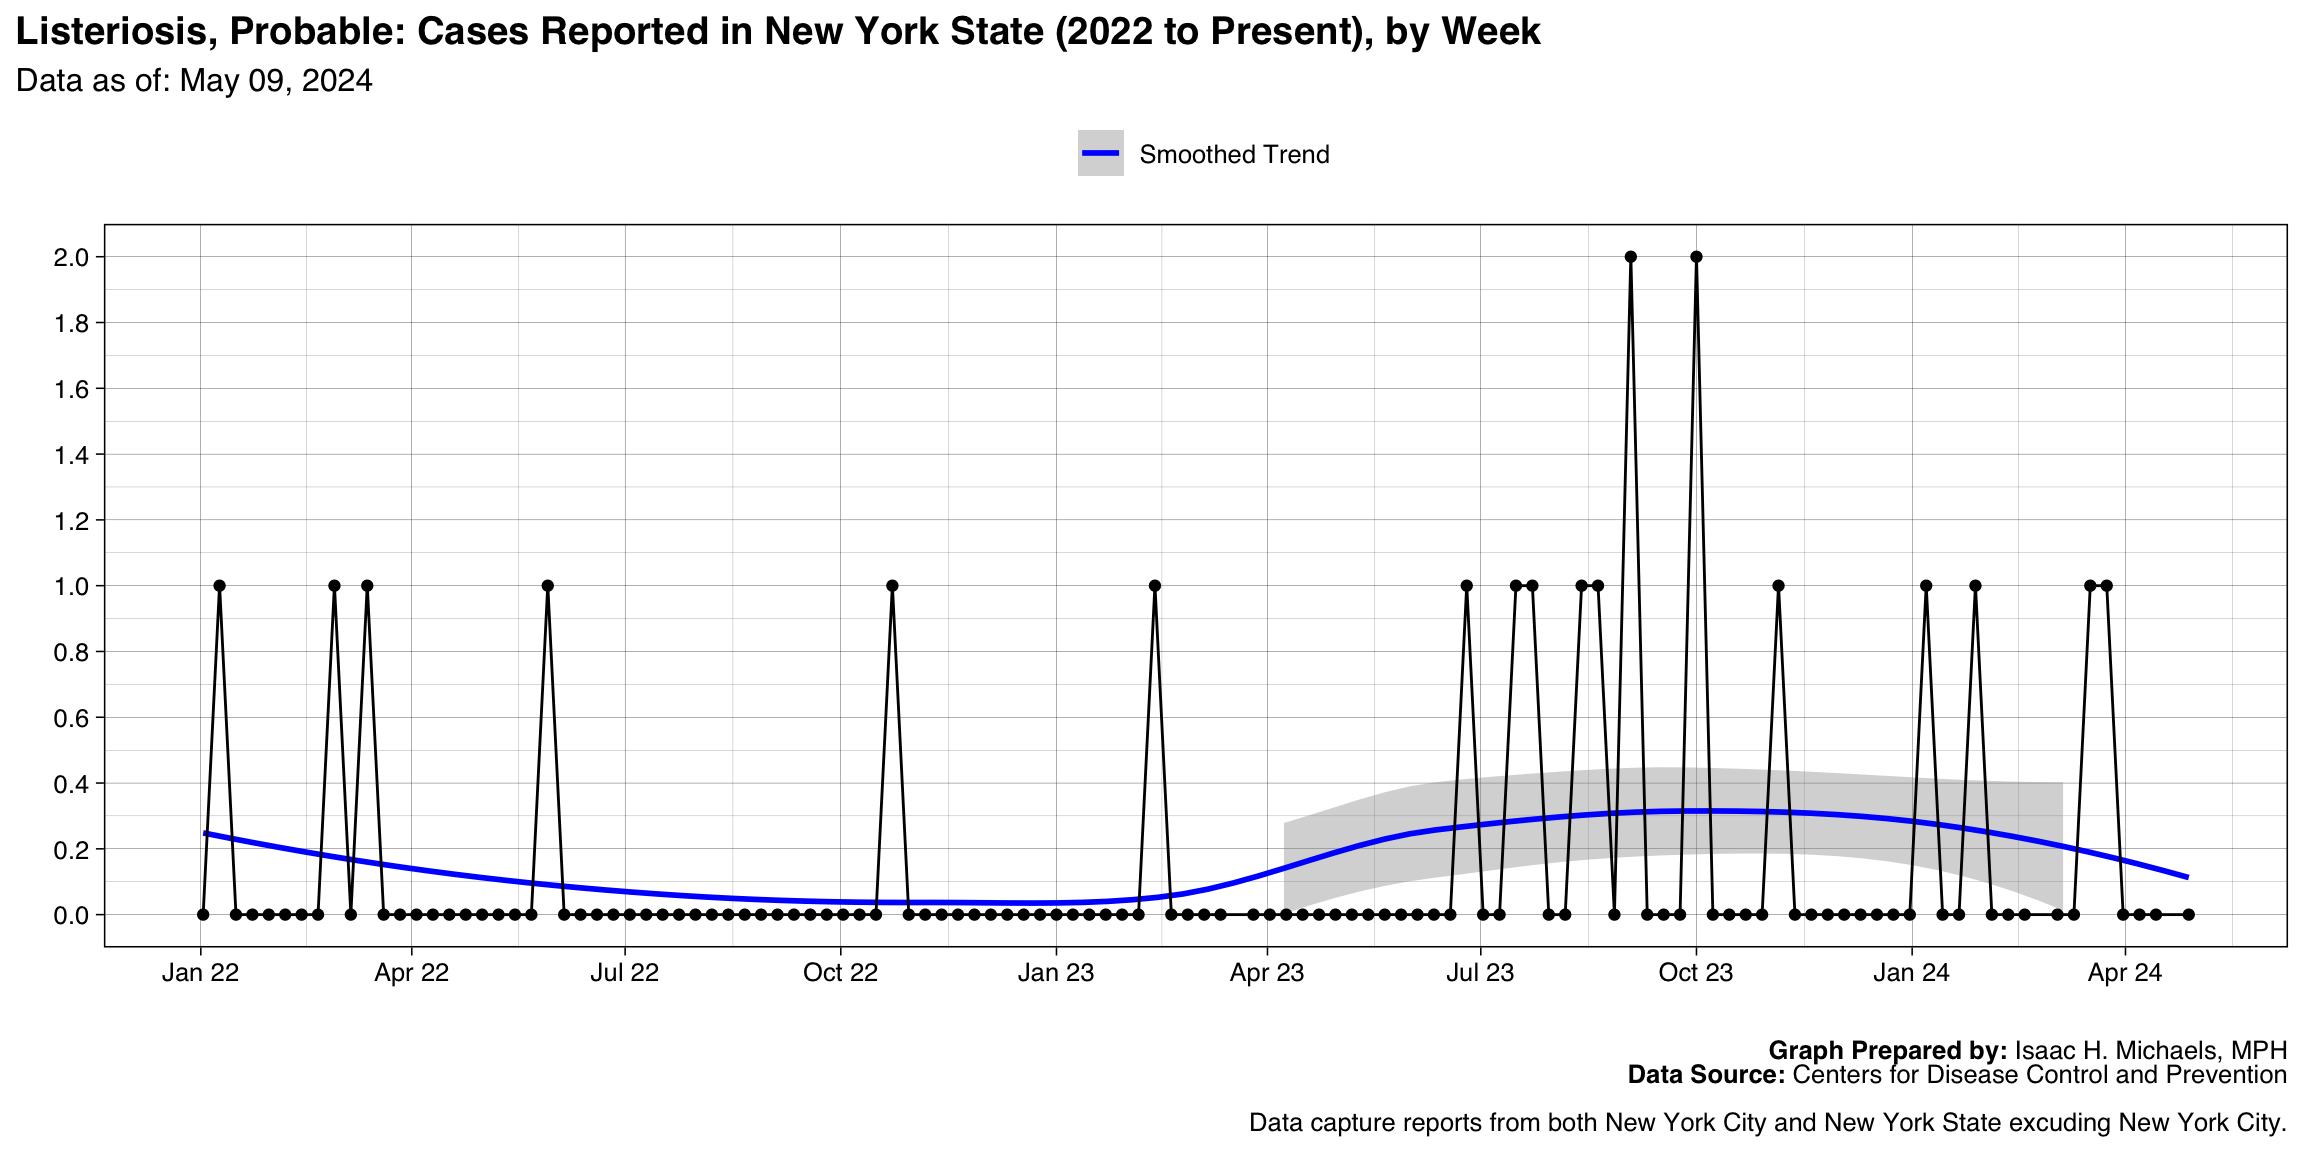
Listeriosis, Probable
Graph Prepared By: Isaac H. Michaels, MPH
Death Data Source: U.S. Centers for Disease Control and Prevention
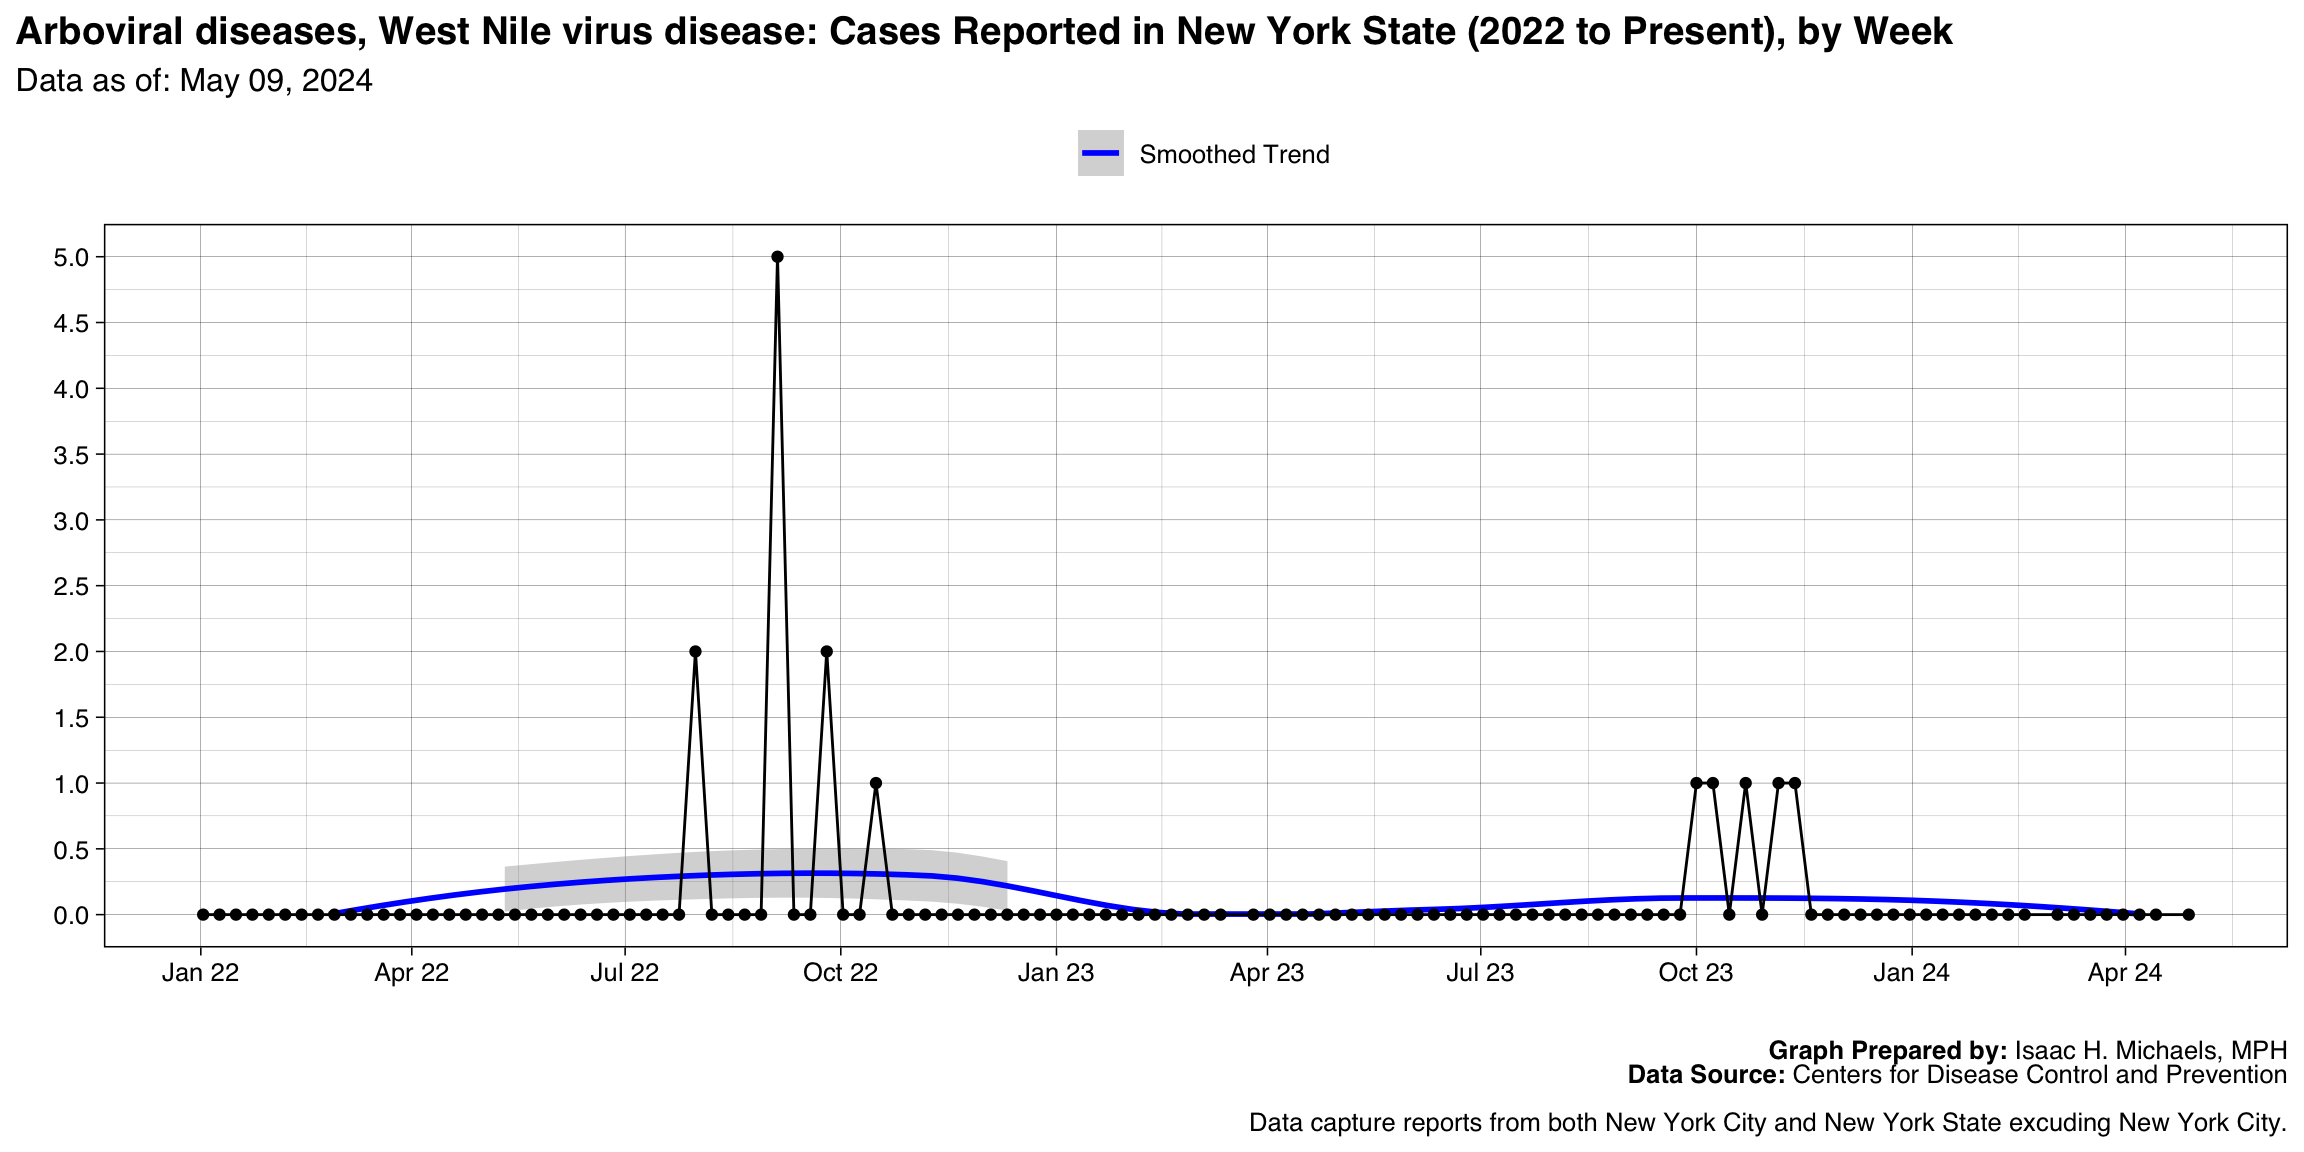
Arboviral diseases, West Nile virus disease
Graph Prepared By: Isaac H. Michaels, MPH
Death Data Source: U.S. Centers for Disease Control and Prevention
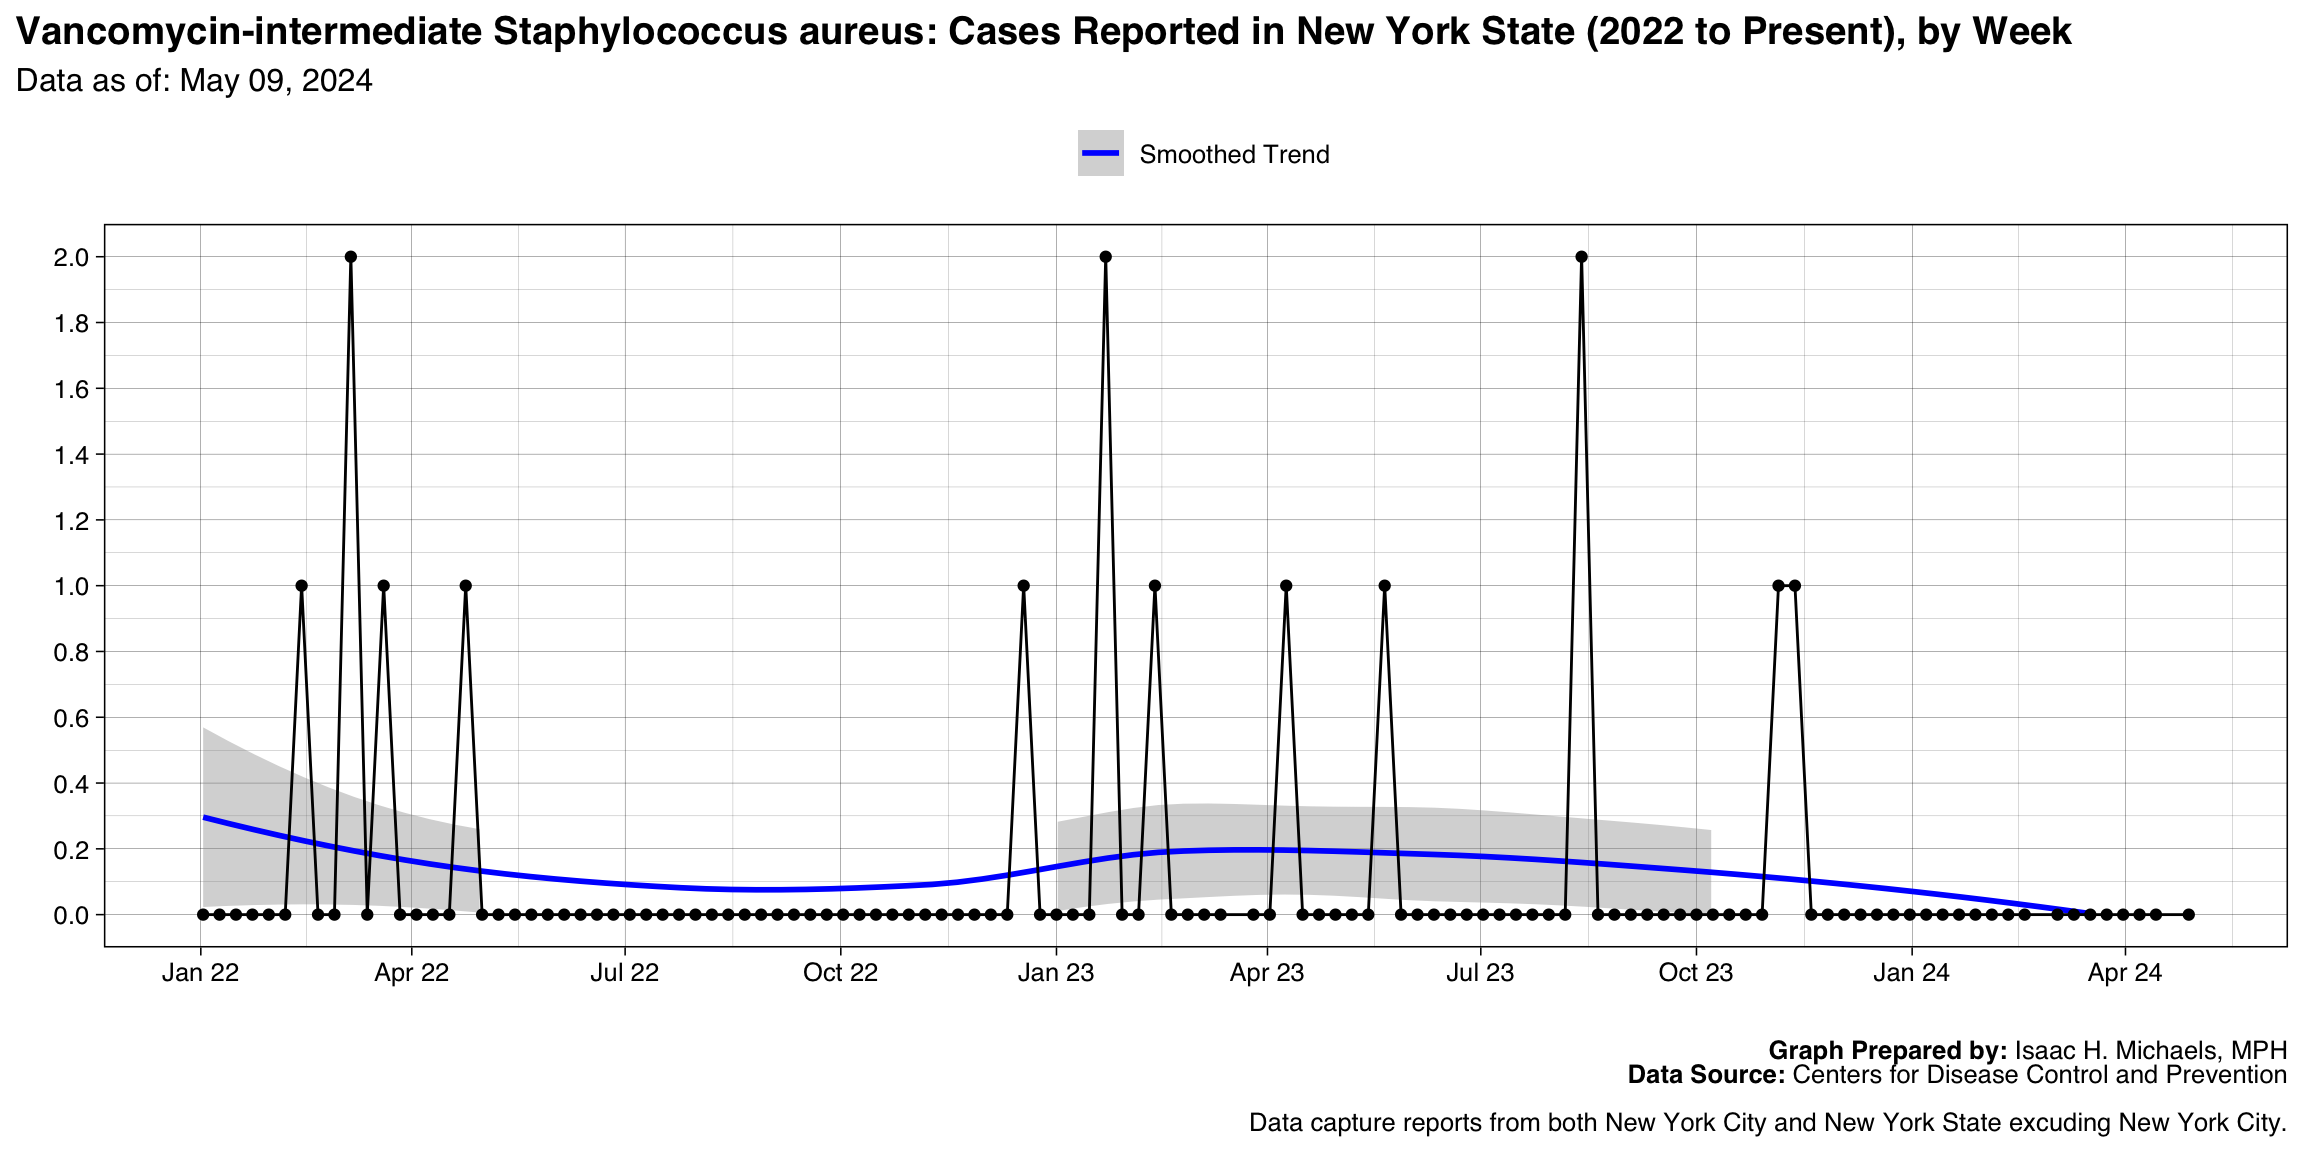
Vancomycin-intermediate Staphylococcus aureus
Graph Prepared By: Isaac H. Michaels, MPH
Death Data Source: U.S. Centers for Disease Control and Prevention
Q fever, Total
Graph Prepared By: Isaac H. Michaels, MPH
Death Data Source: U.S. Centers for Disease Control and Prevention
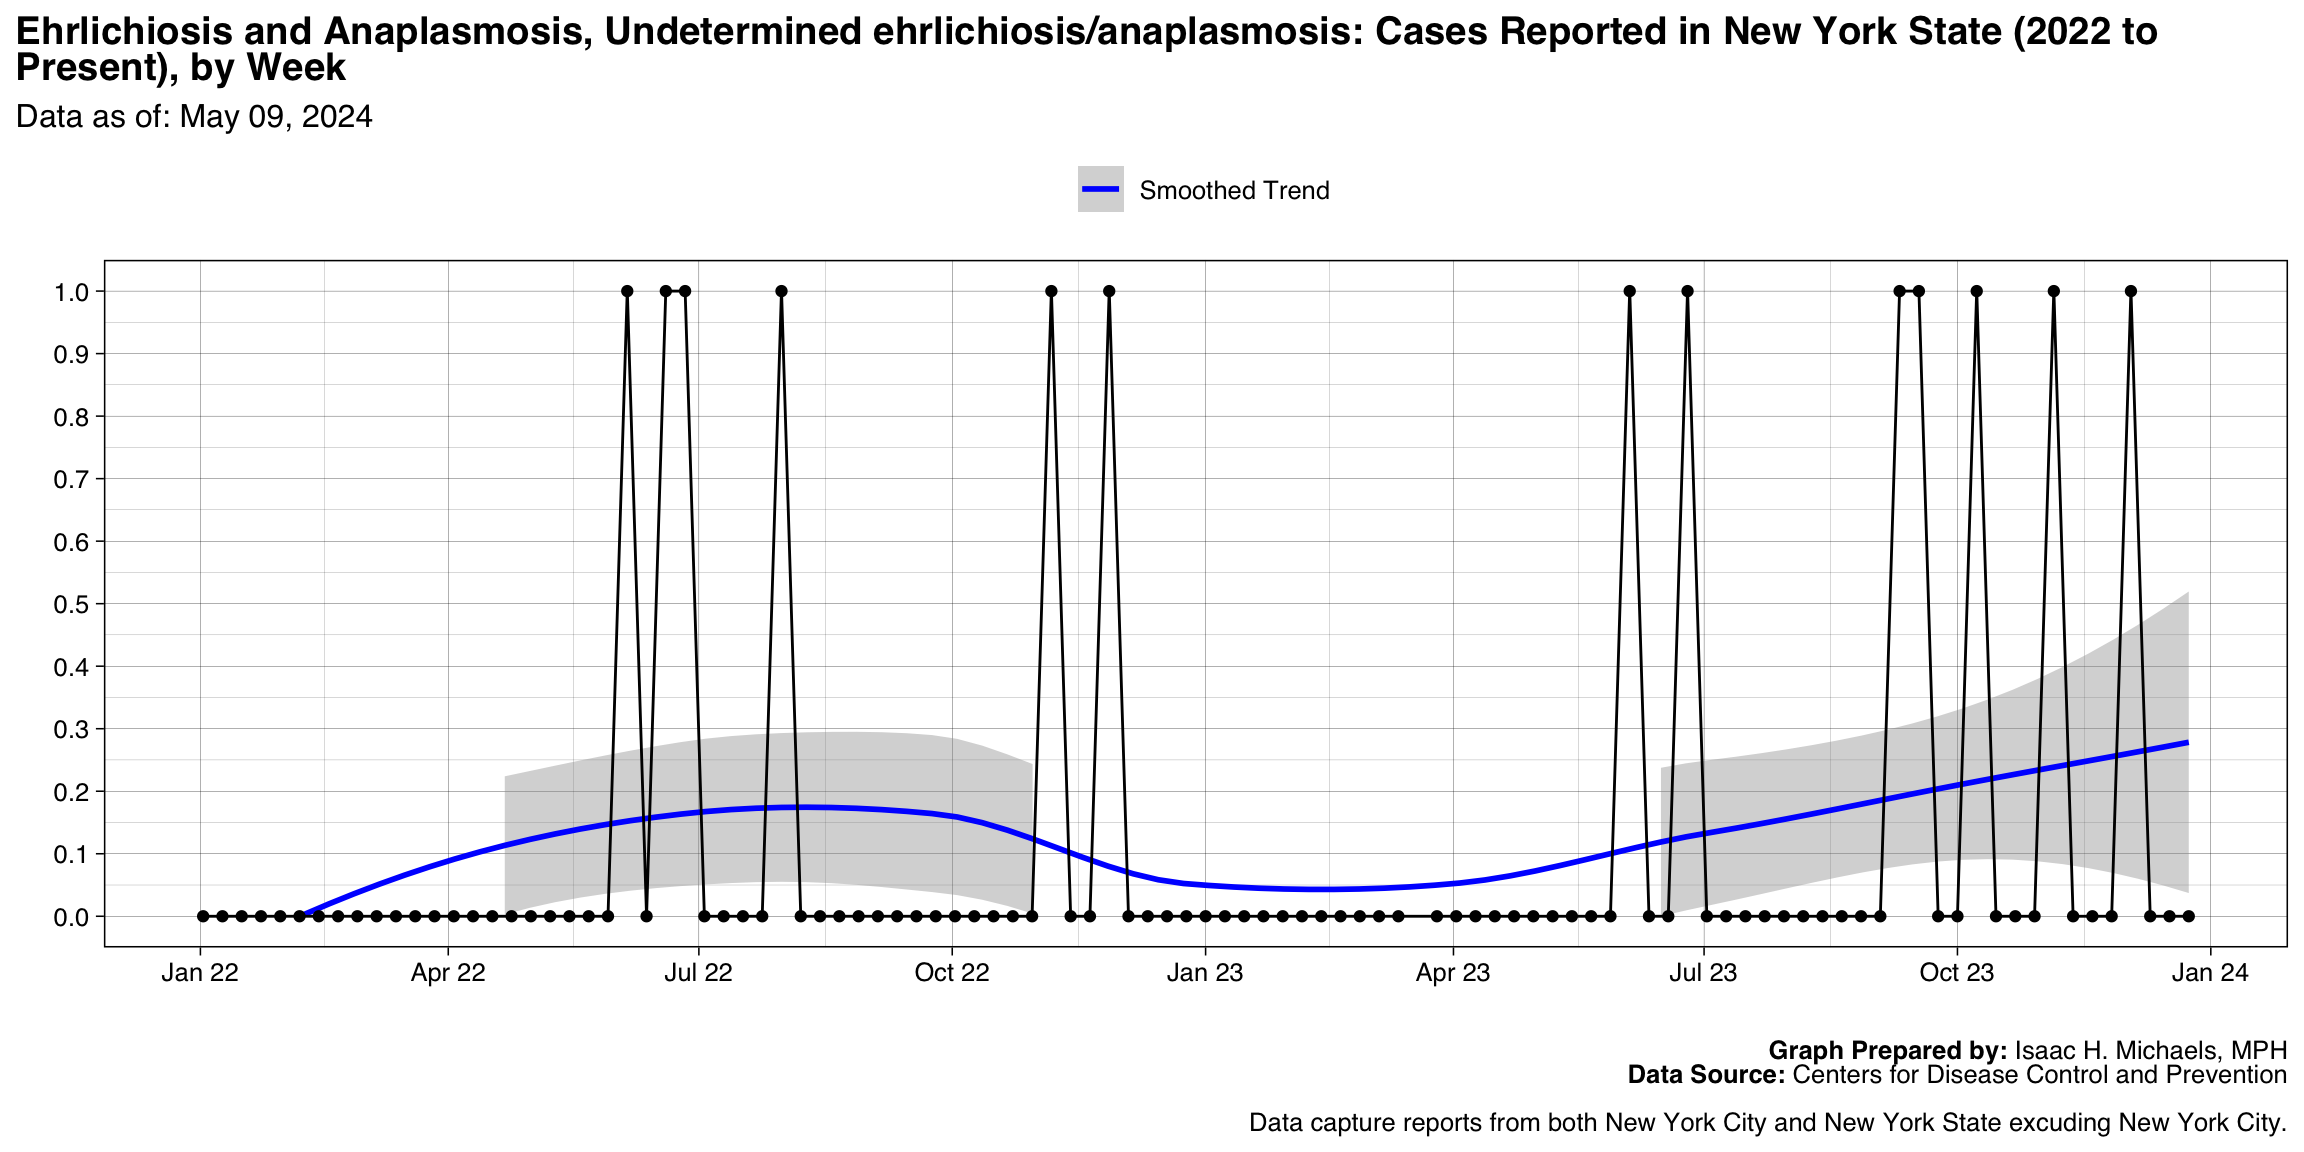
Ehrlichiosis and Anaplasmosis, Undetermined ehrlichiosis/anaplasmosis
Graph Prepared By: Isaac H. Michaels, MPH
Death Data Source: U.S. Centers for Disease Control and Prevention
Brucellosis
Graph Prepared By: Isaac H. Michaels, MPH
Death Data Source: U.S. Centers for Disease Control and Prevention
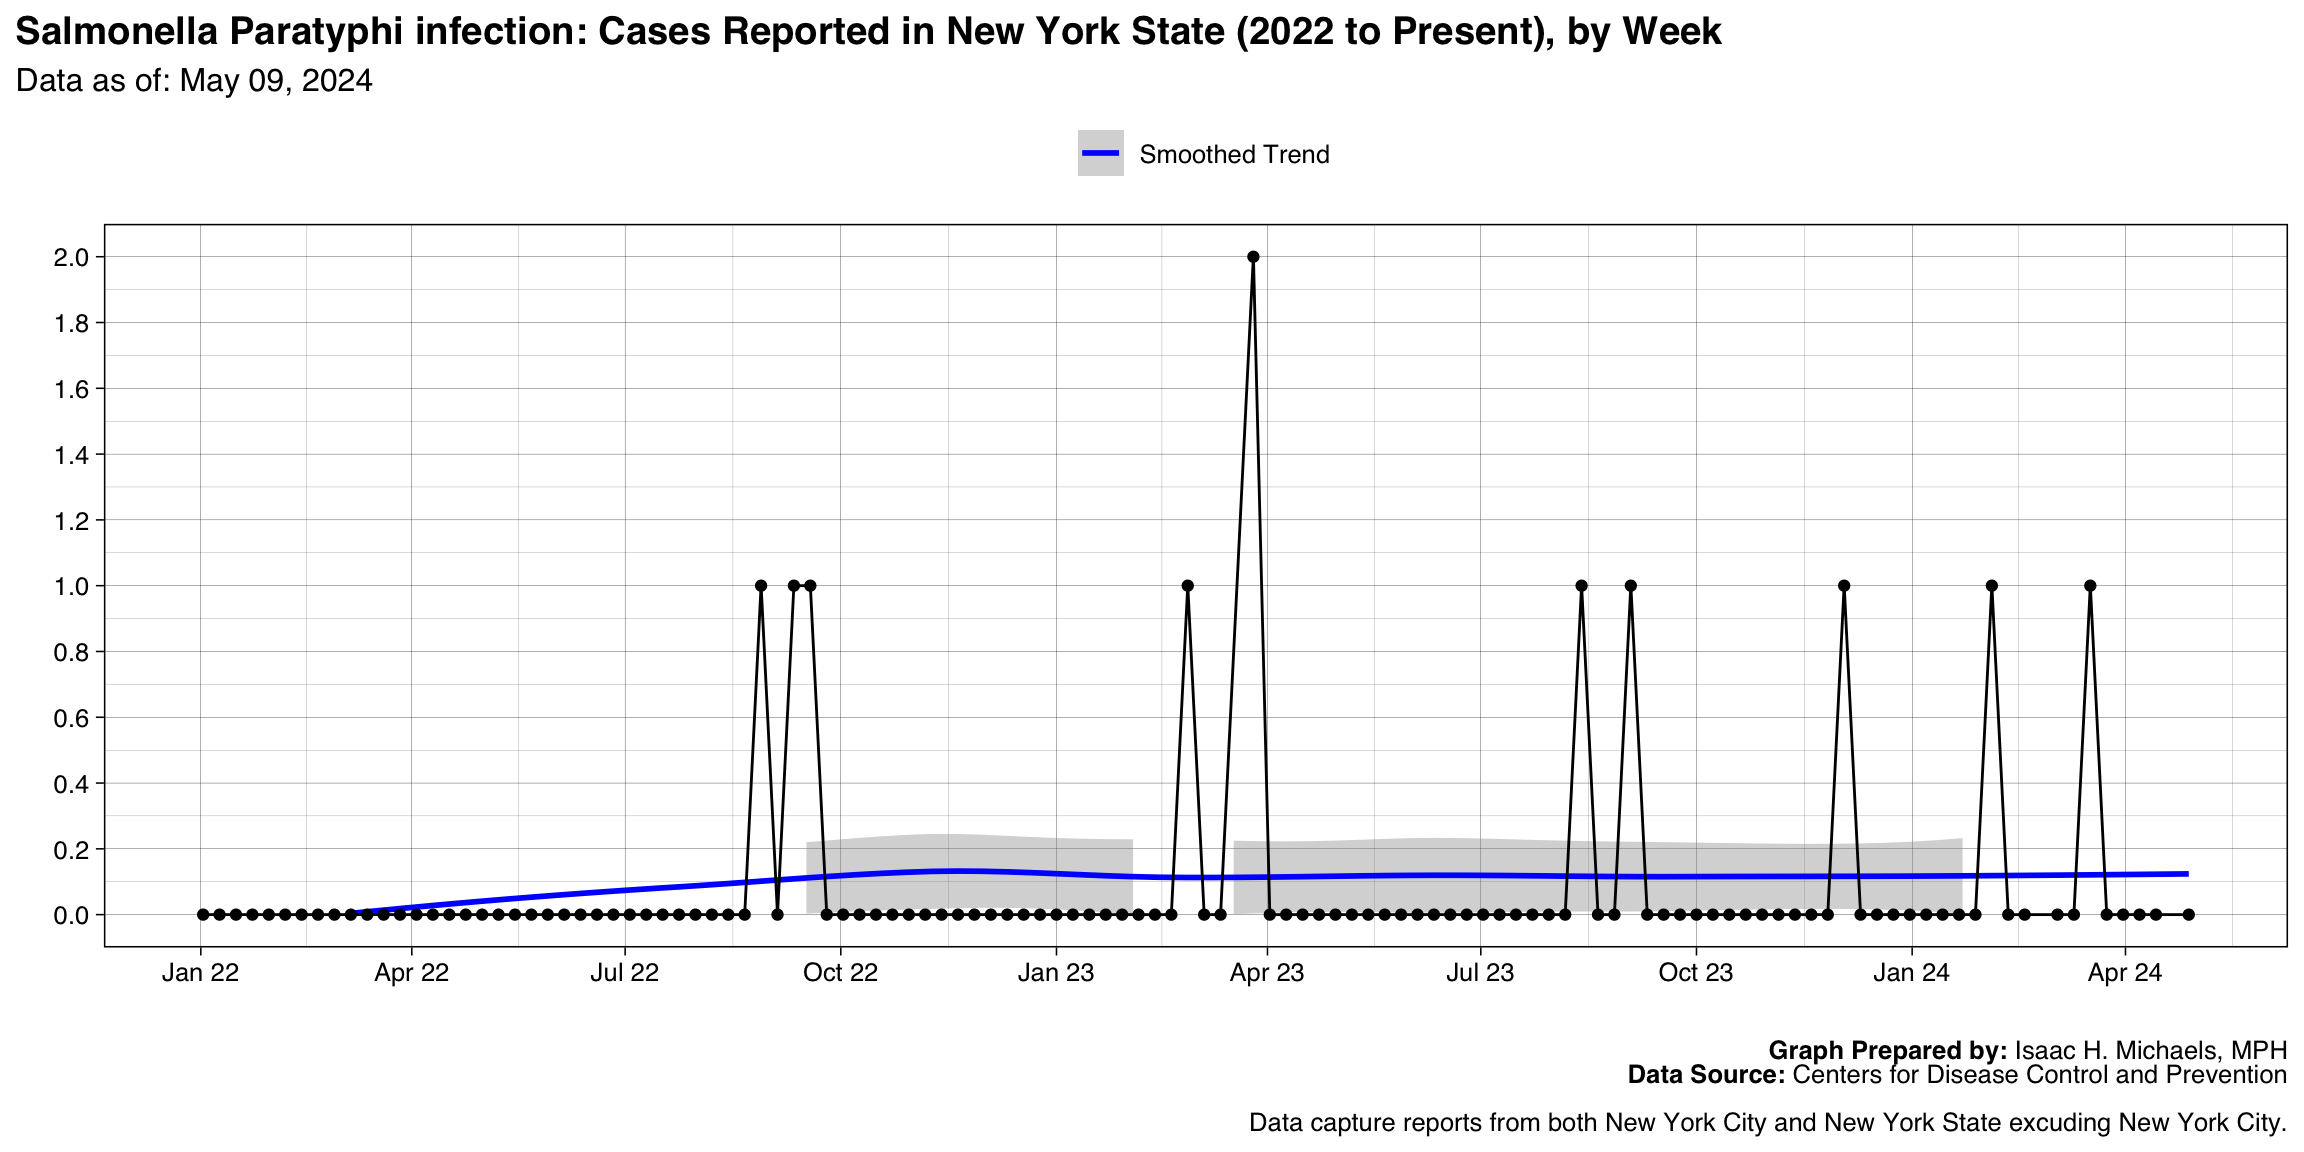
Salmonella Paratyphi infection
Graph Prepared By: Isaac H. Michaels, MPH
Death Data Source: U.S. Centers for Disease Control and Prevention
Hepatitis C, perinatal infection
Graph Prepared By: Isaac H. Michaels, MPH
Death Data Source: U.S. Centers for Disease Control and Prevention
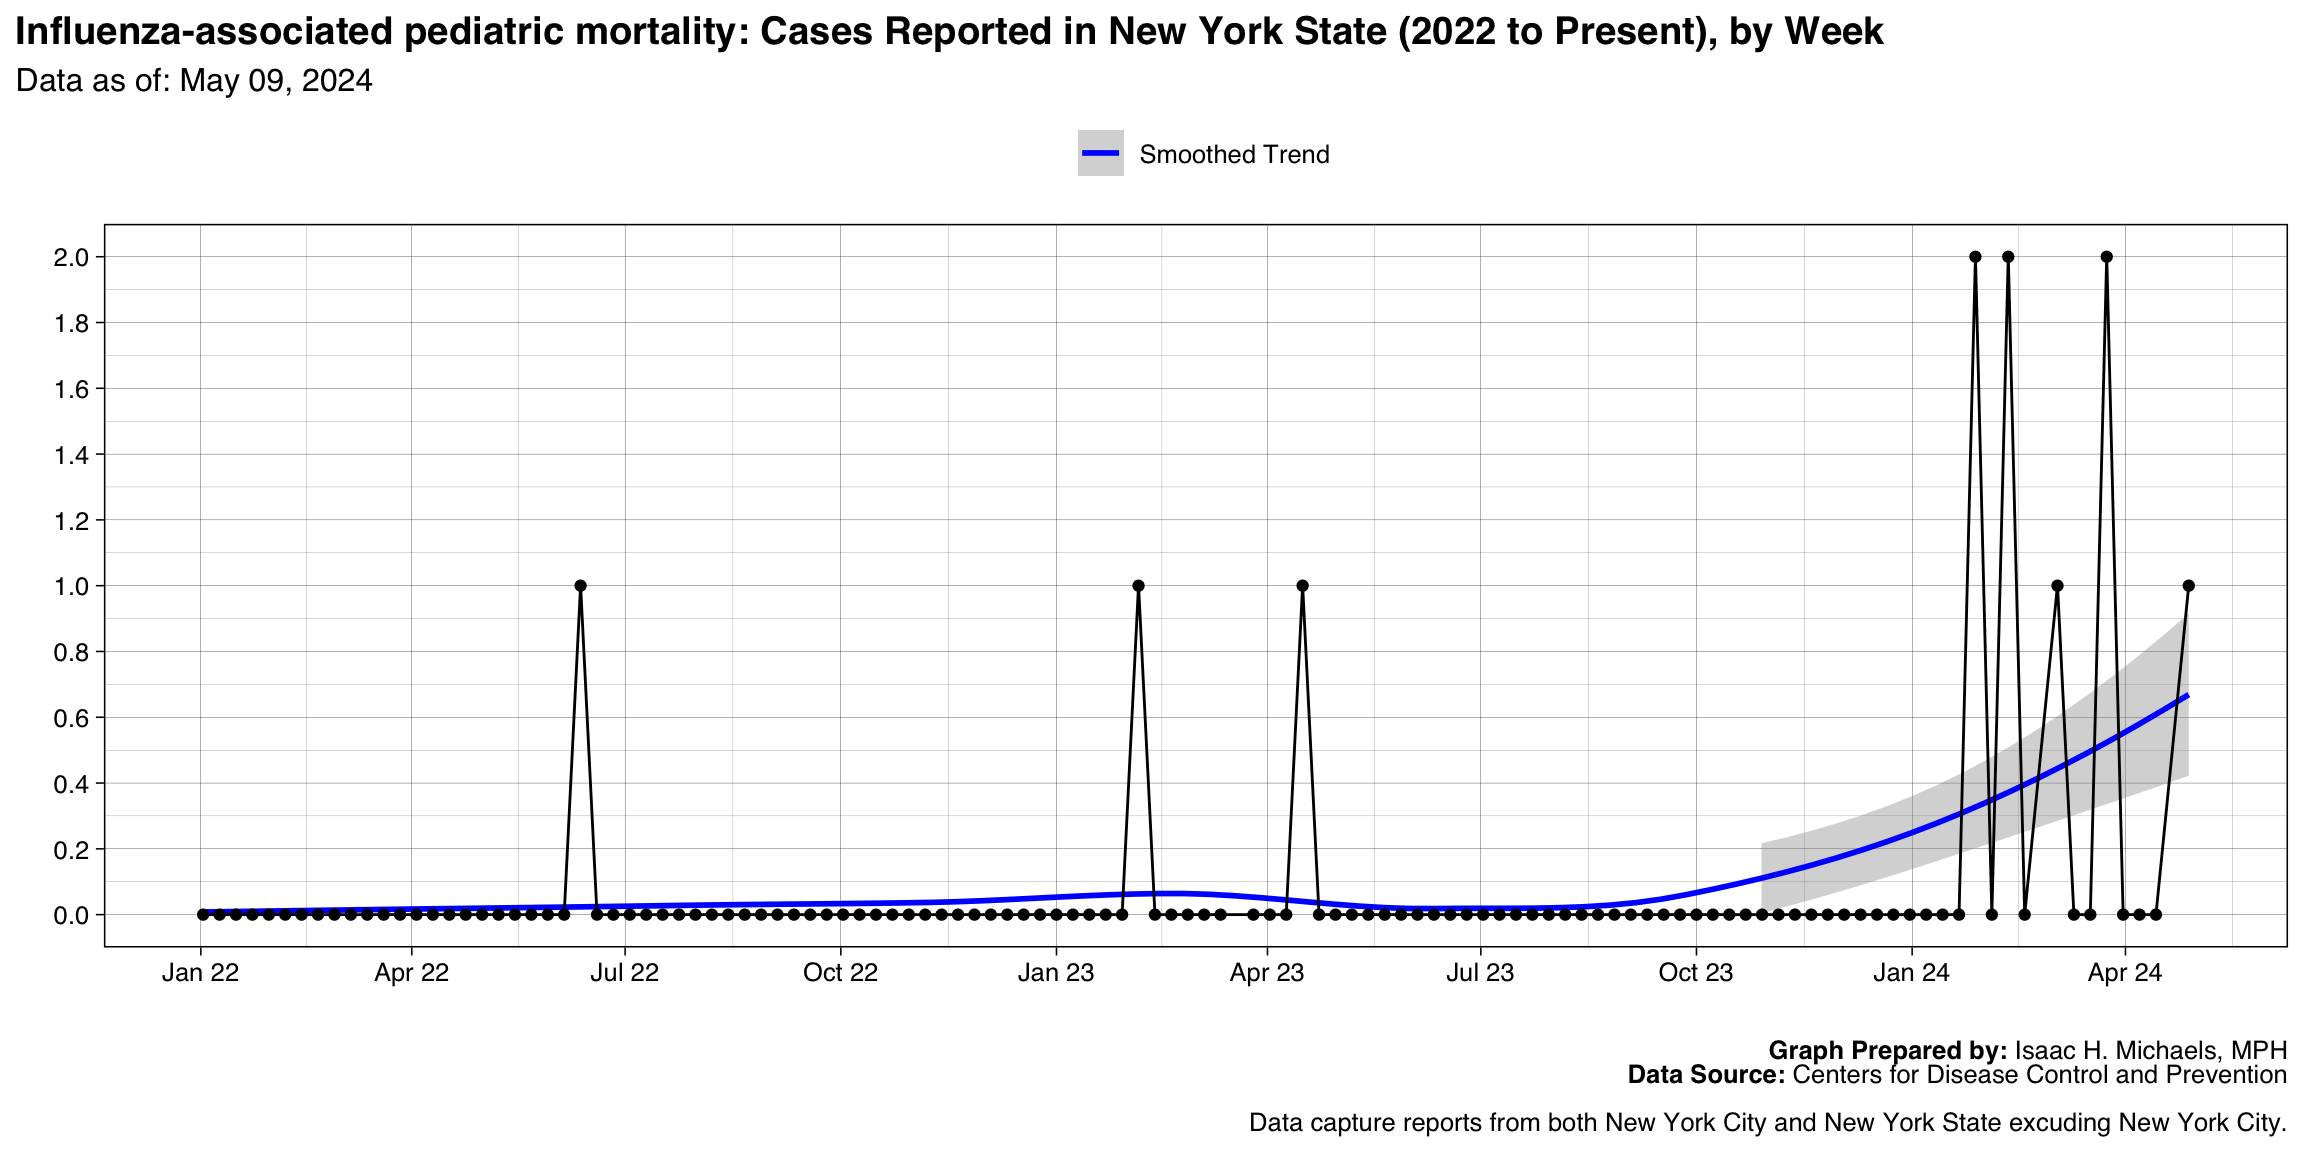
Influenza-associated pediatric mortality
Graph Prepared By: Isaac H. Michaels, MPH
Death Data Source: U.S. Centers for Disease Control and Prevention
Q fever, Acute
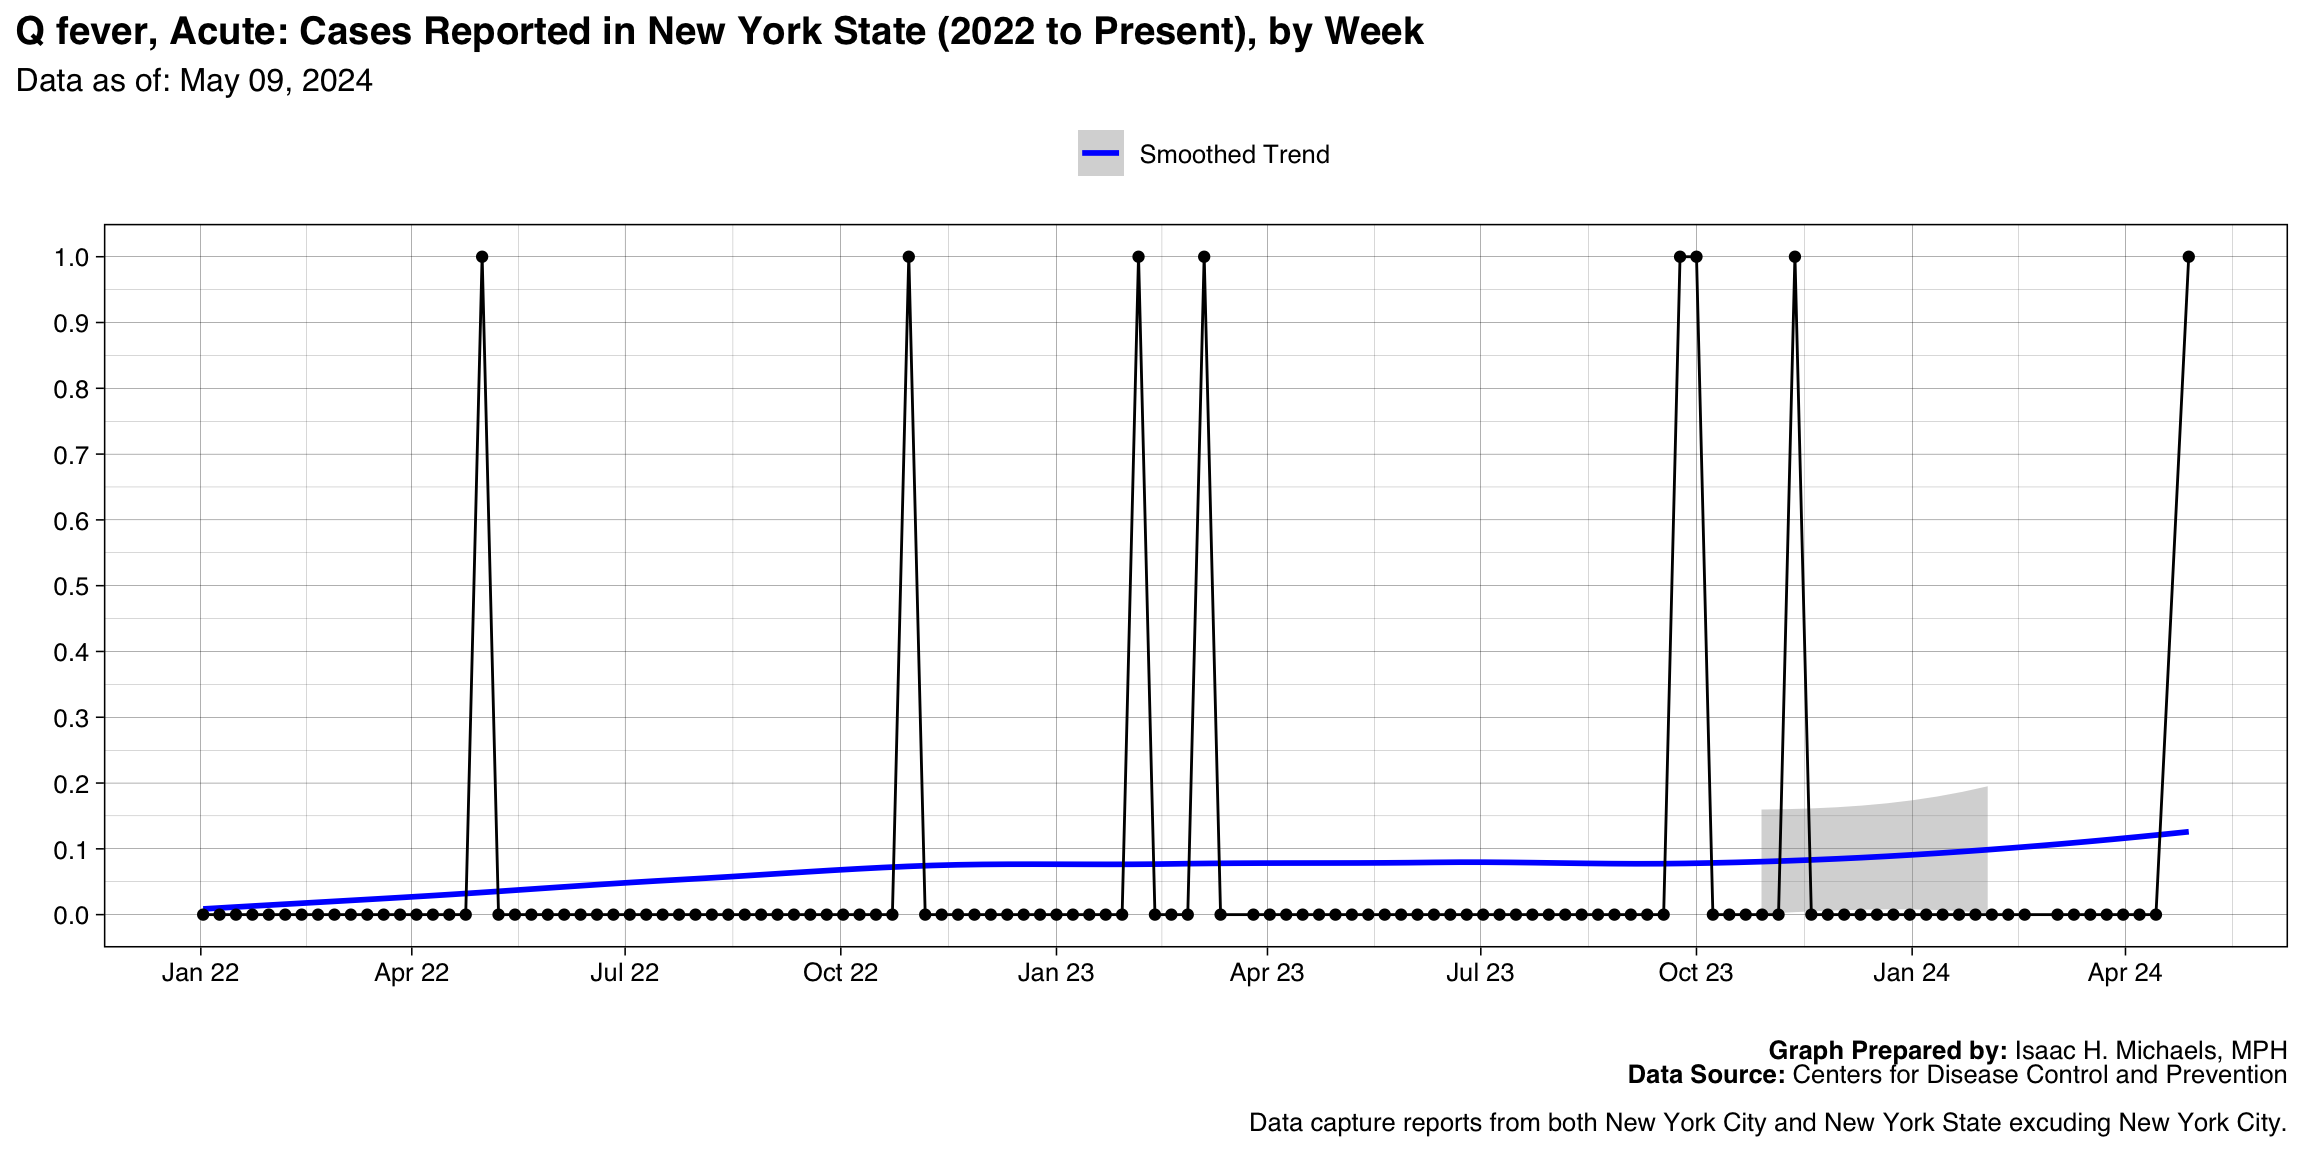
Graph Prepared By: Isaac H. Michaels, MPH
Death Data Source: U.S. Centers for Disease Control and Prevention
Invasive pneumococcal disease, age <5 years, Probable
Graph Prepared By: Isaac H. Michaels, MPH
Death Data Source: U.S. Centers for Disease Control and Prevention
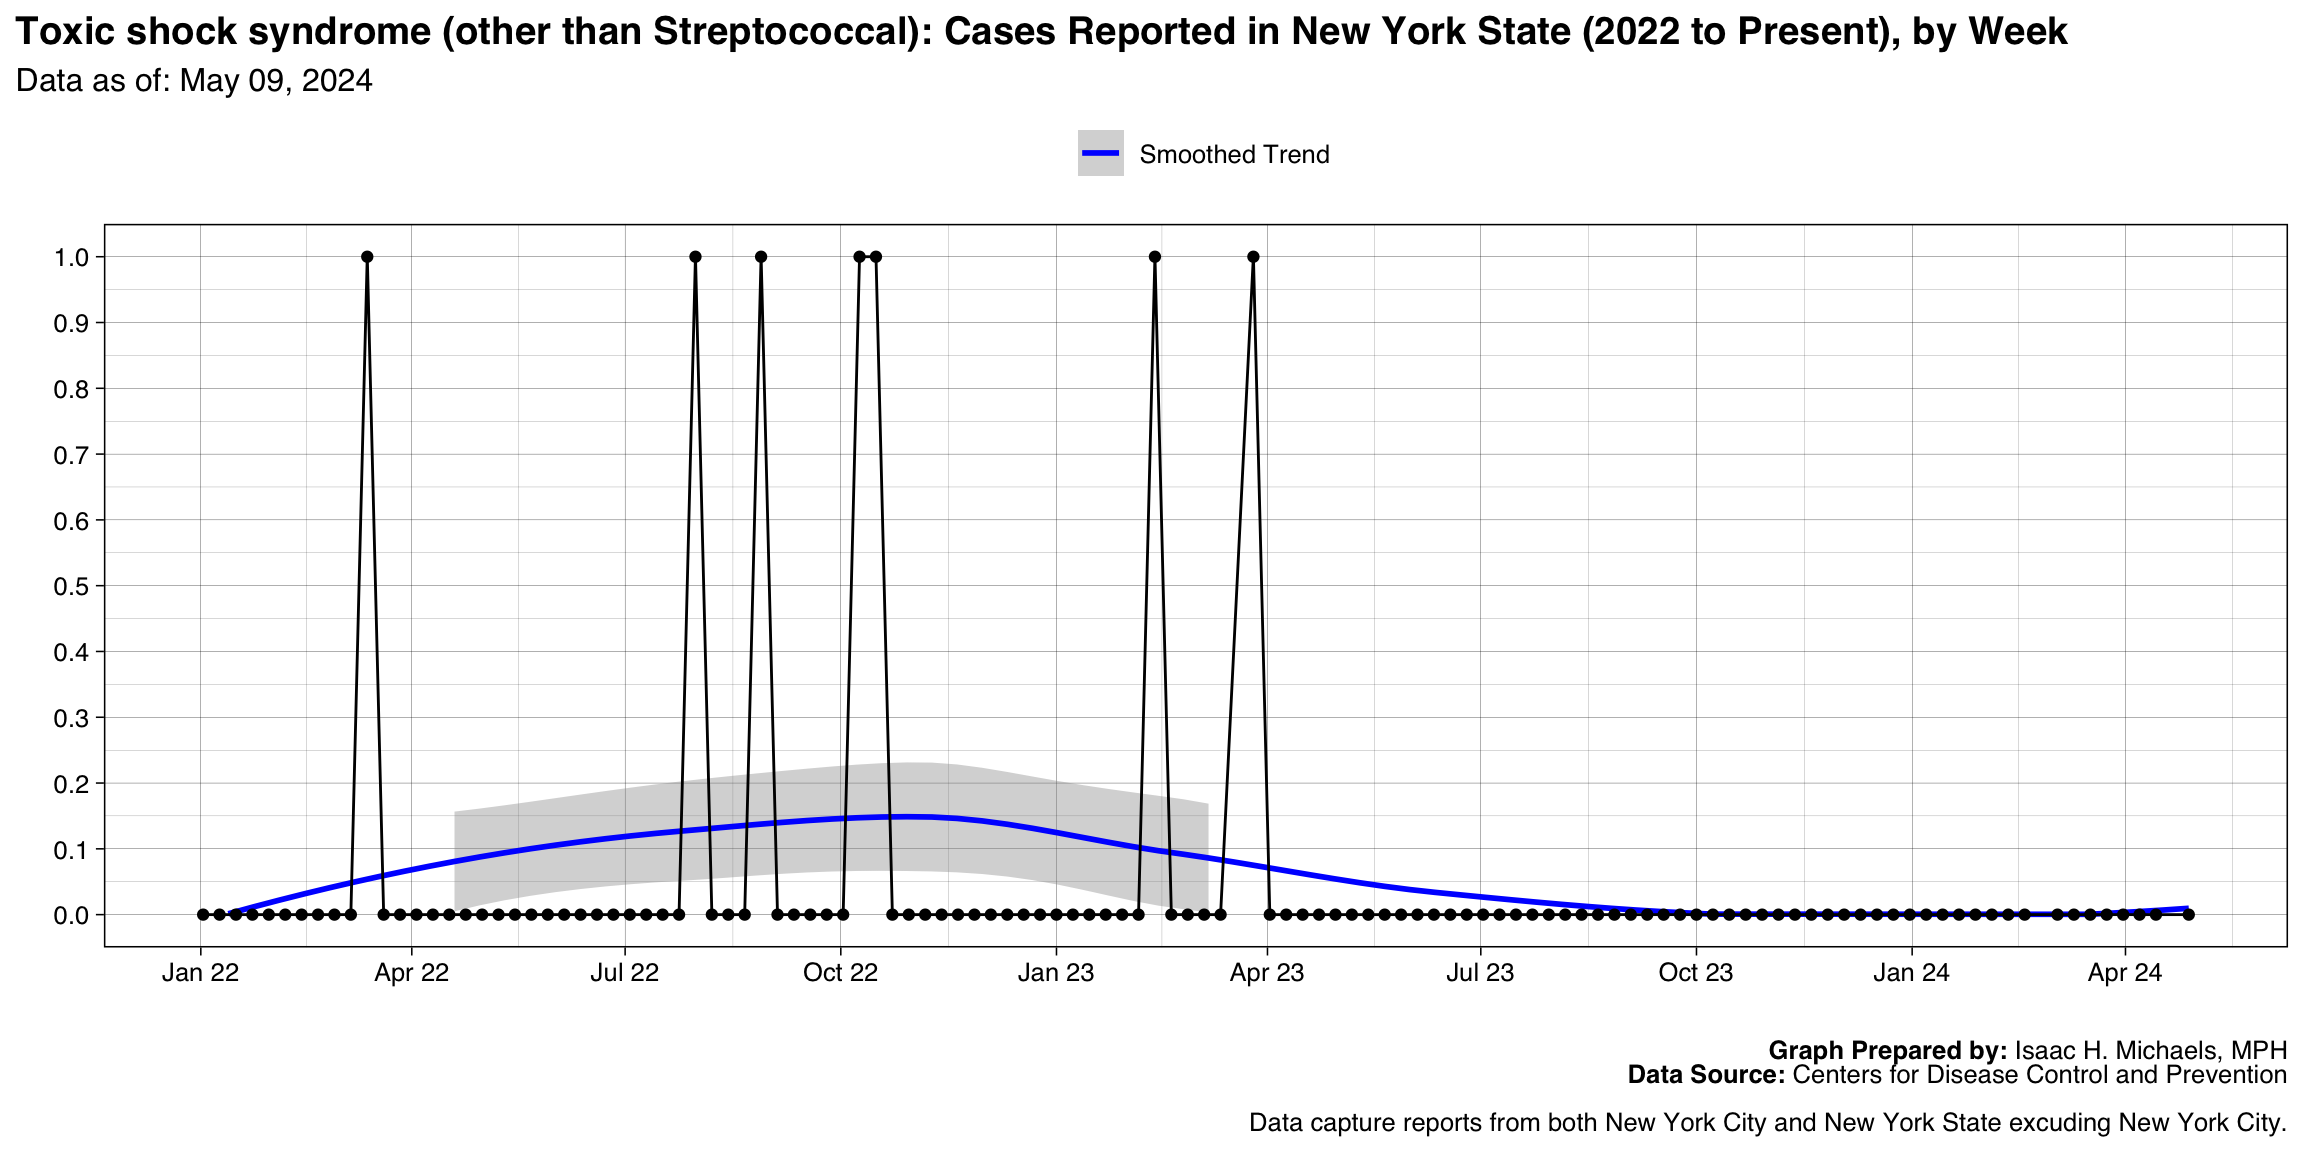
Toxic shock syndrome (other than Streptococcal)
Graph Prepared By: Isaac H. Michaels, MPH
Death Data Source: U.S. Centers for Disease Control and Prevention
Arboviral diseases, Chikungunya virus disease
Graph Prepared By: Isaac H. Michaels, MPH
Death Data Source: U.S. Centers for Disease Control and Prevention
Tularemia
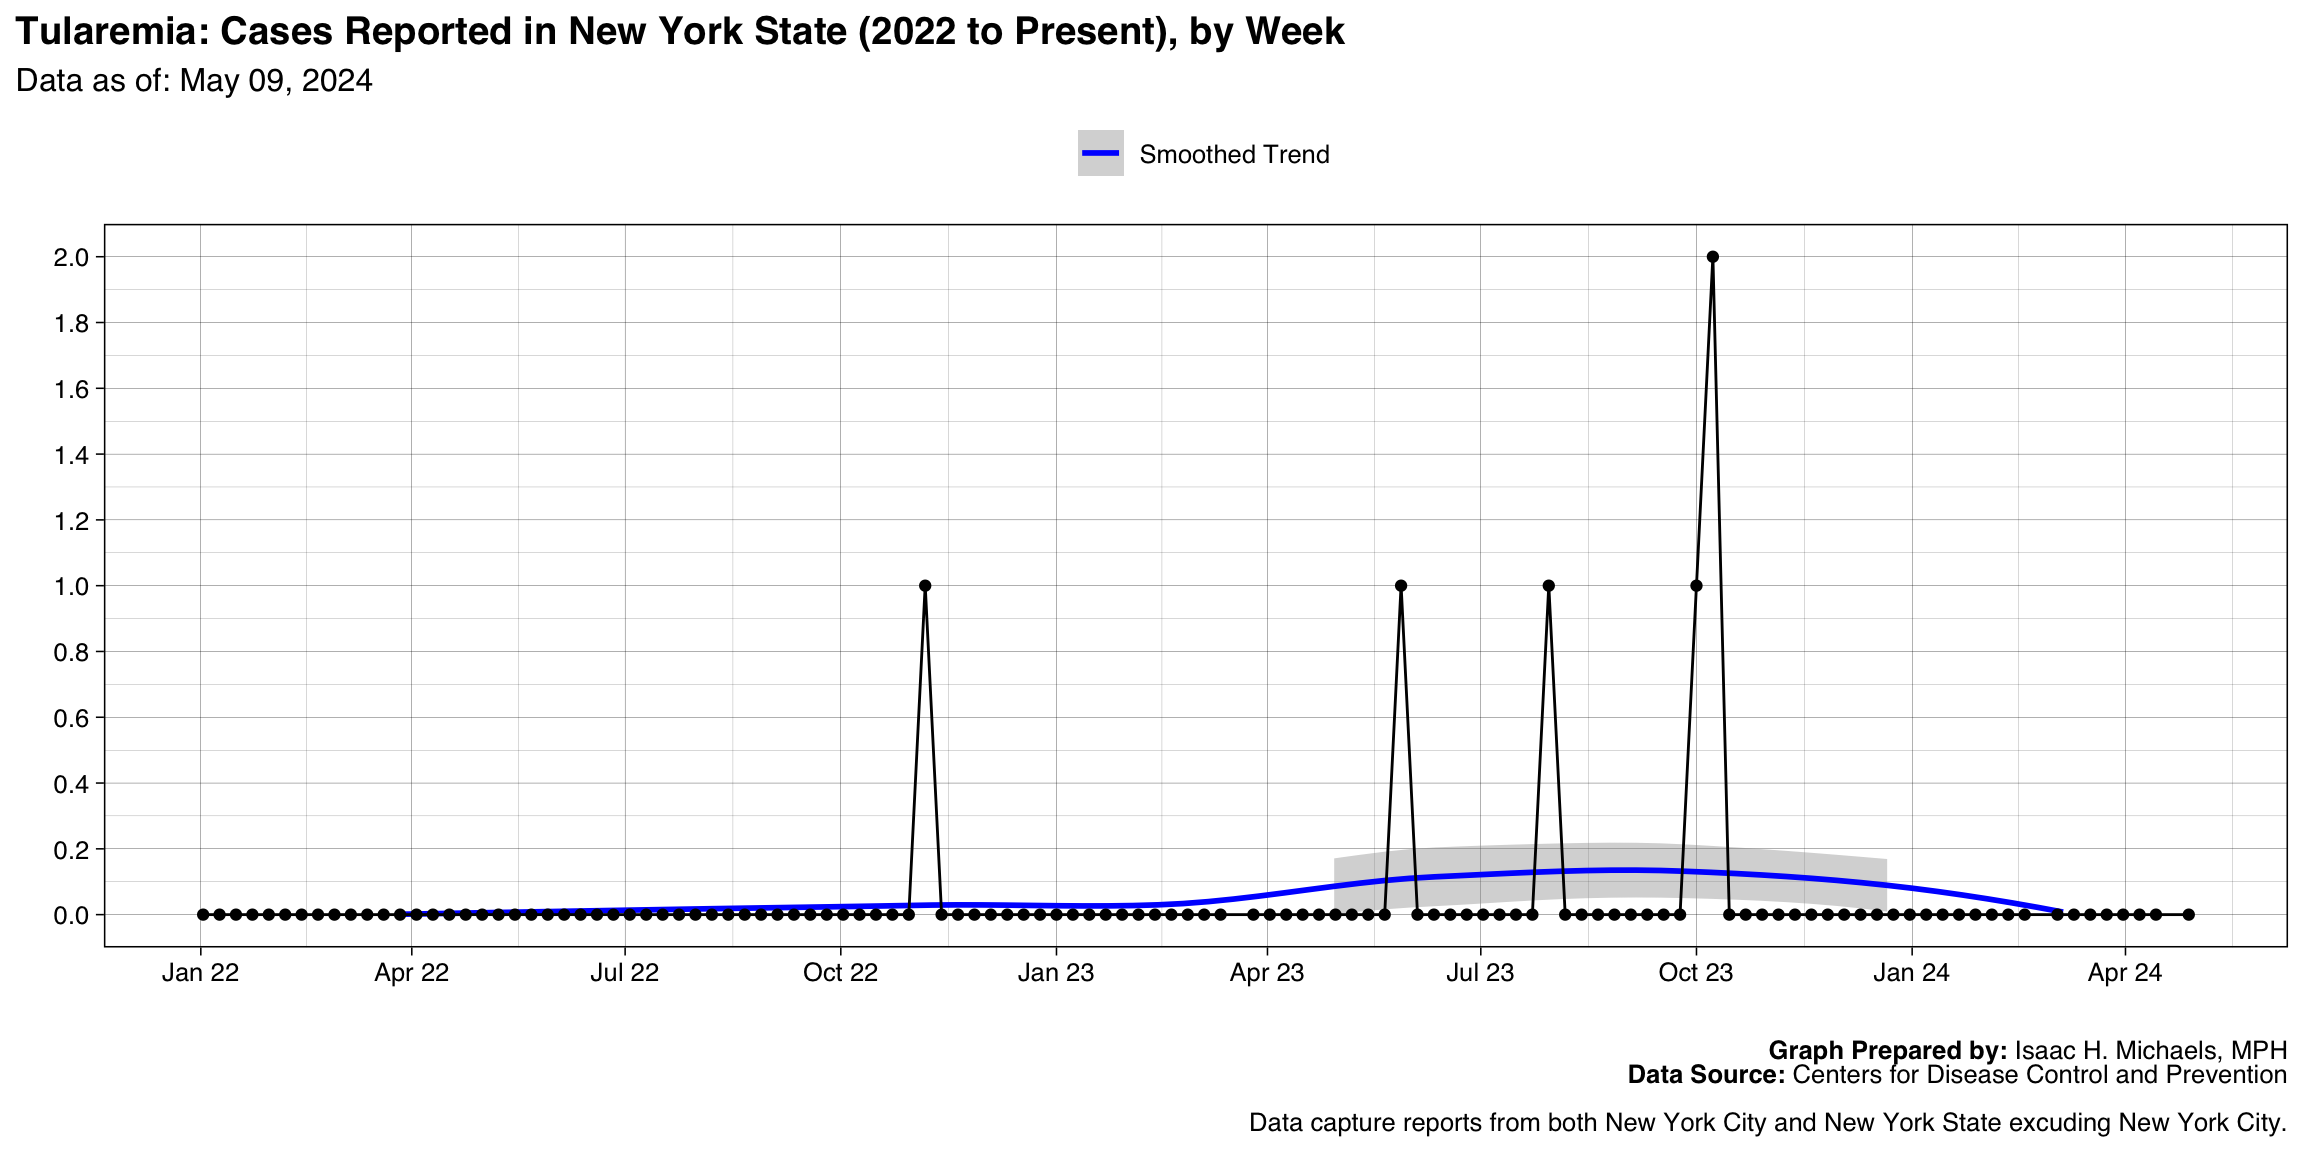
Graph Prepared By: Isaac H. Michaels, MPH
Death Data Source: U.S. Centers for Disease Control and Prevention
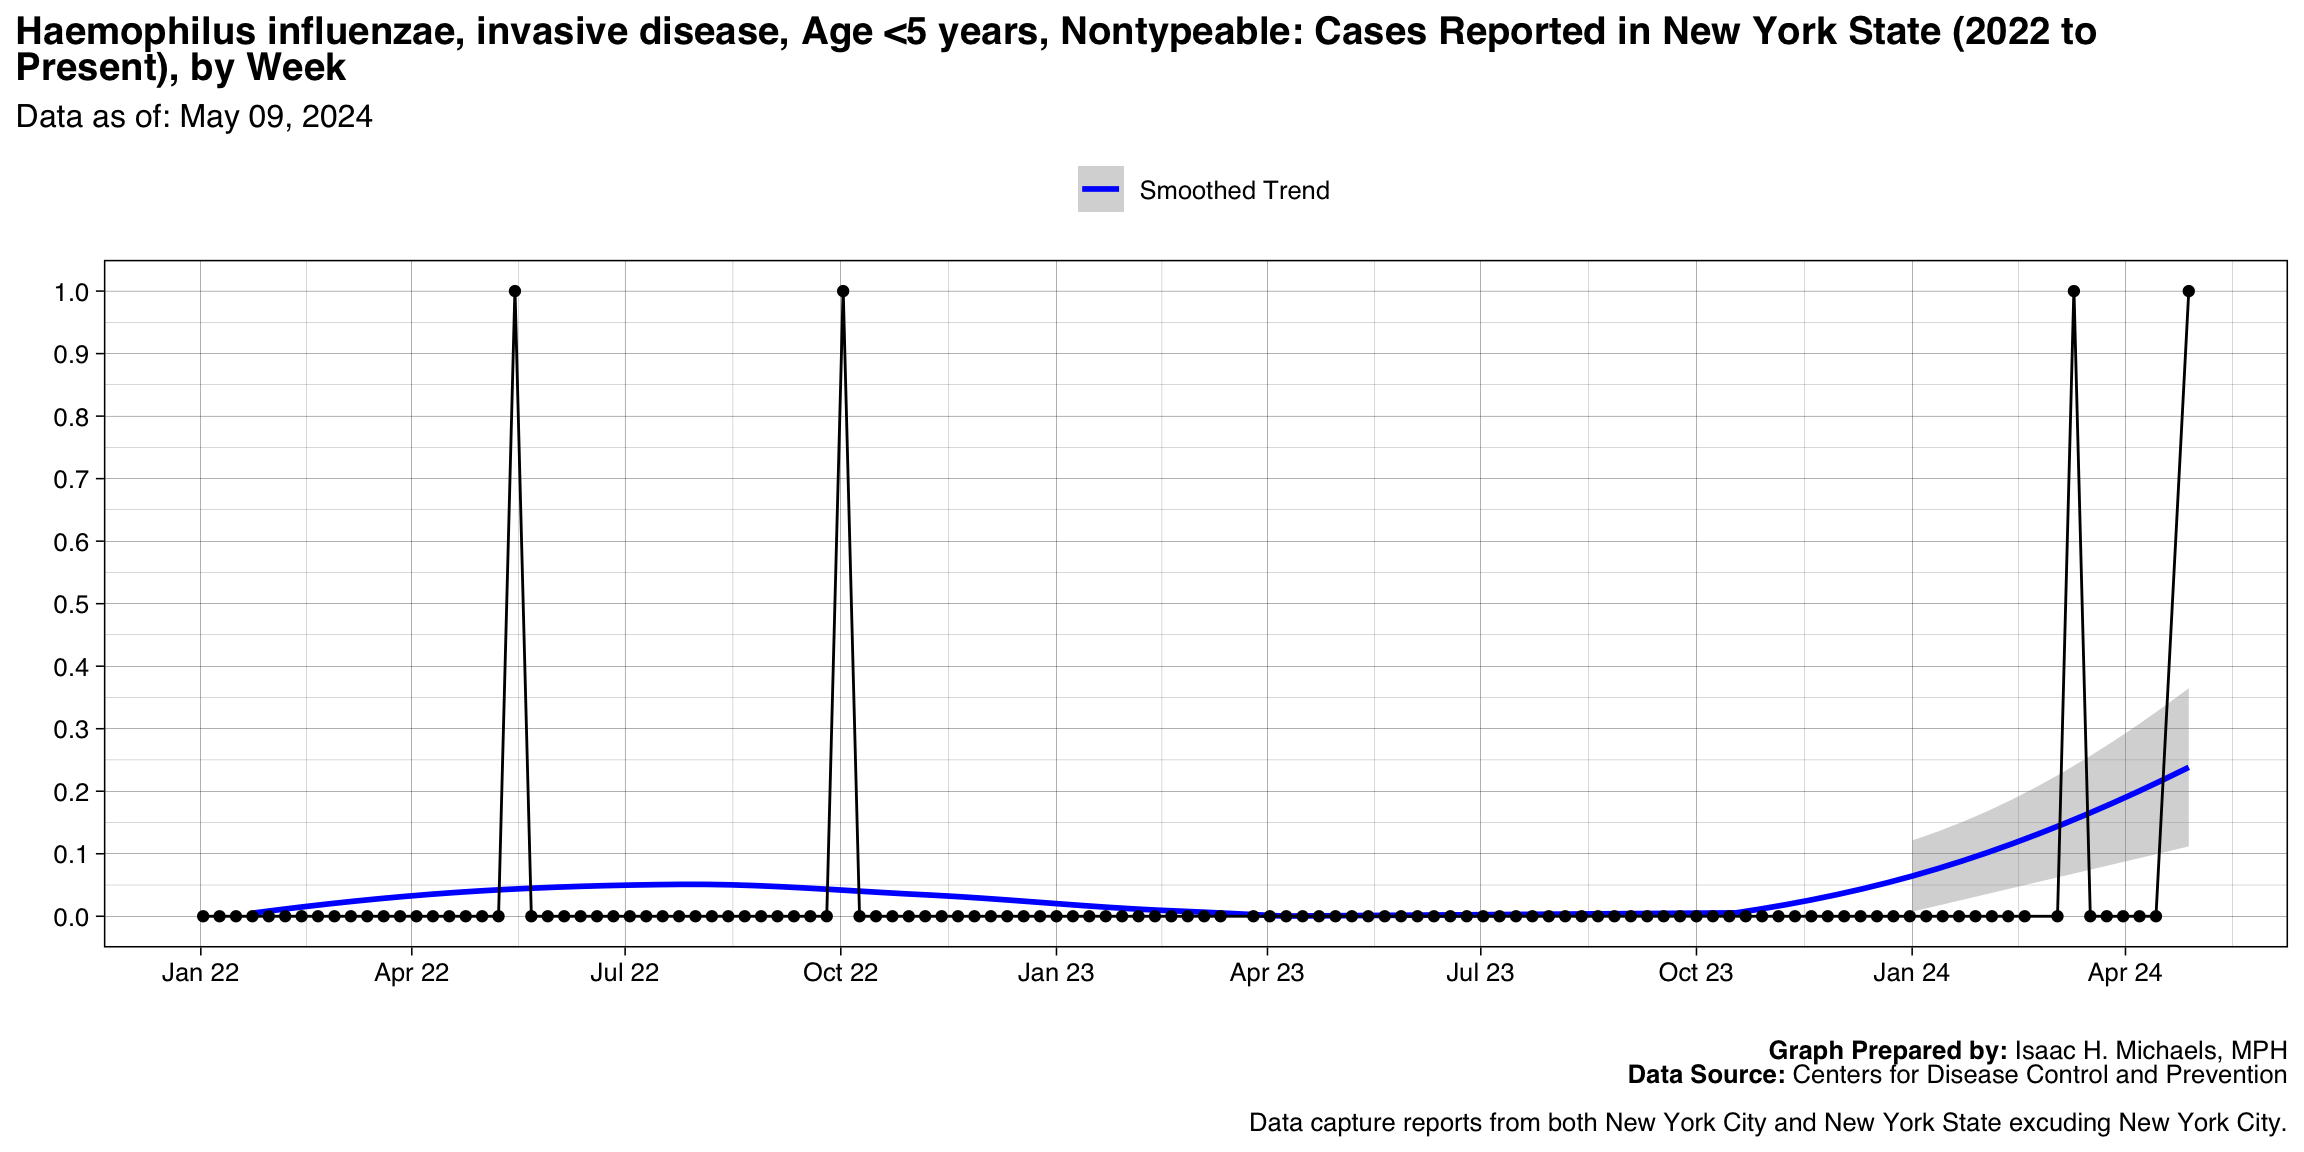
Haemophilus influenzae, invasive disease, Age <5 years, Nontypeable
Graph Prepared By: Isaac H. Michaels, MPH
Death Data Source: U.S. Centers for Disease Control and Prevention
Hepatitis B, acute, Probable
Graph Prepared By: Isaac H. Michaels, MPH
Death Data Source: U.S. Centers for Disease Control and Prevention
Q fever, Chronic
Graph Prepared By: Isaac H. Michaels, MPH
Death Data Source: U.S. Centers for Disease Control and Prevention
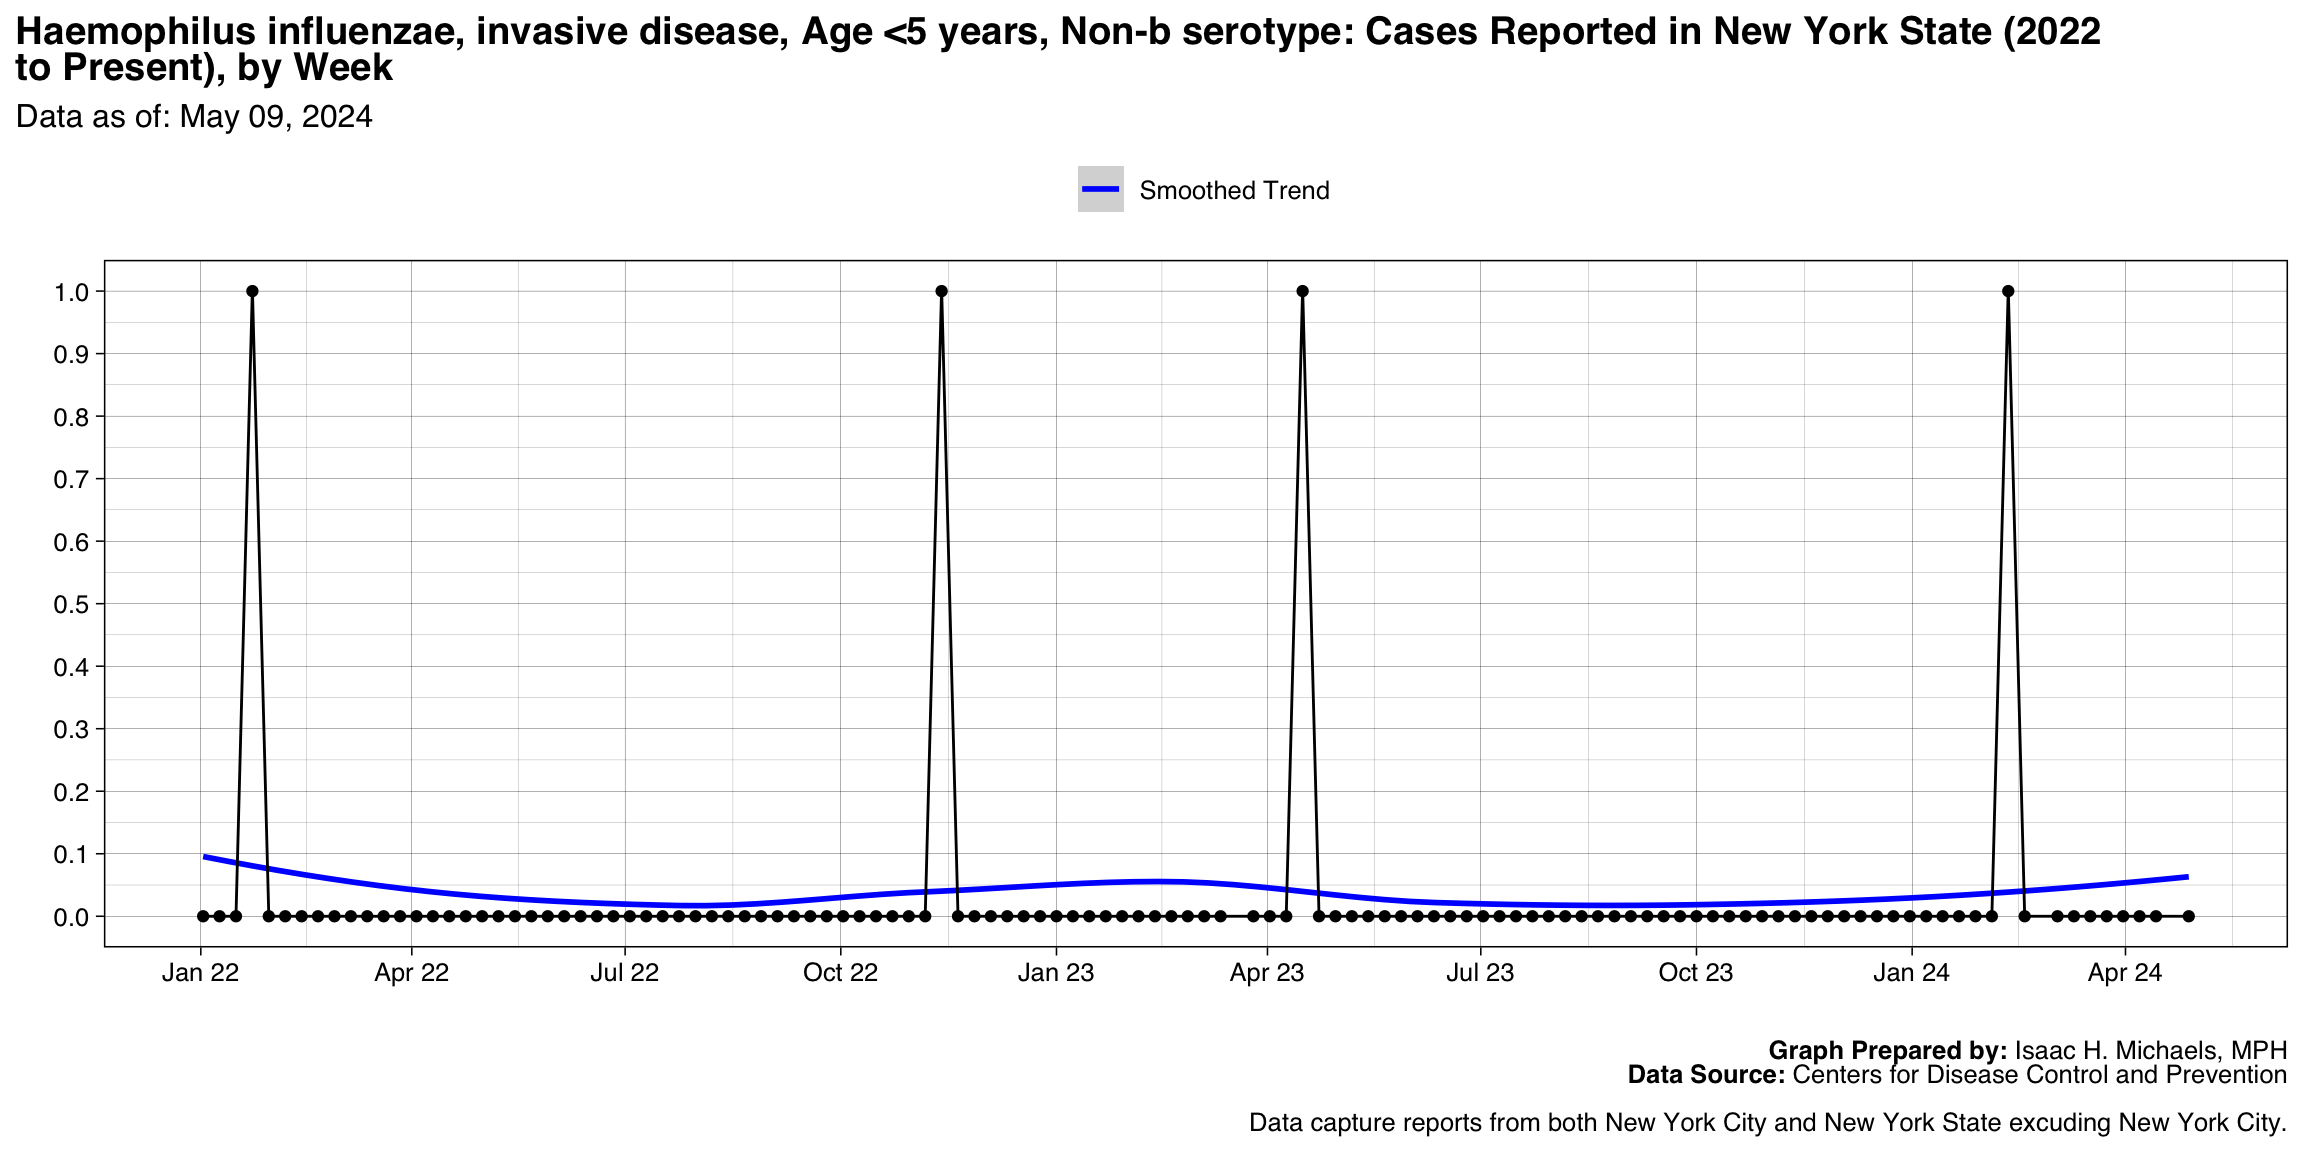
Haemophilus influenzae, invasive disease, Age <5 years, Non-b serotype
Graph Prepared By: Isaac H. Michaels, MPH
Death Data Source: U.S. Centers for Disease Control and Prevention
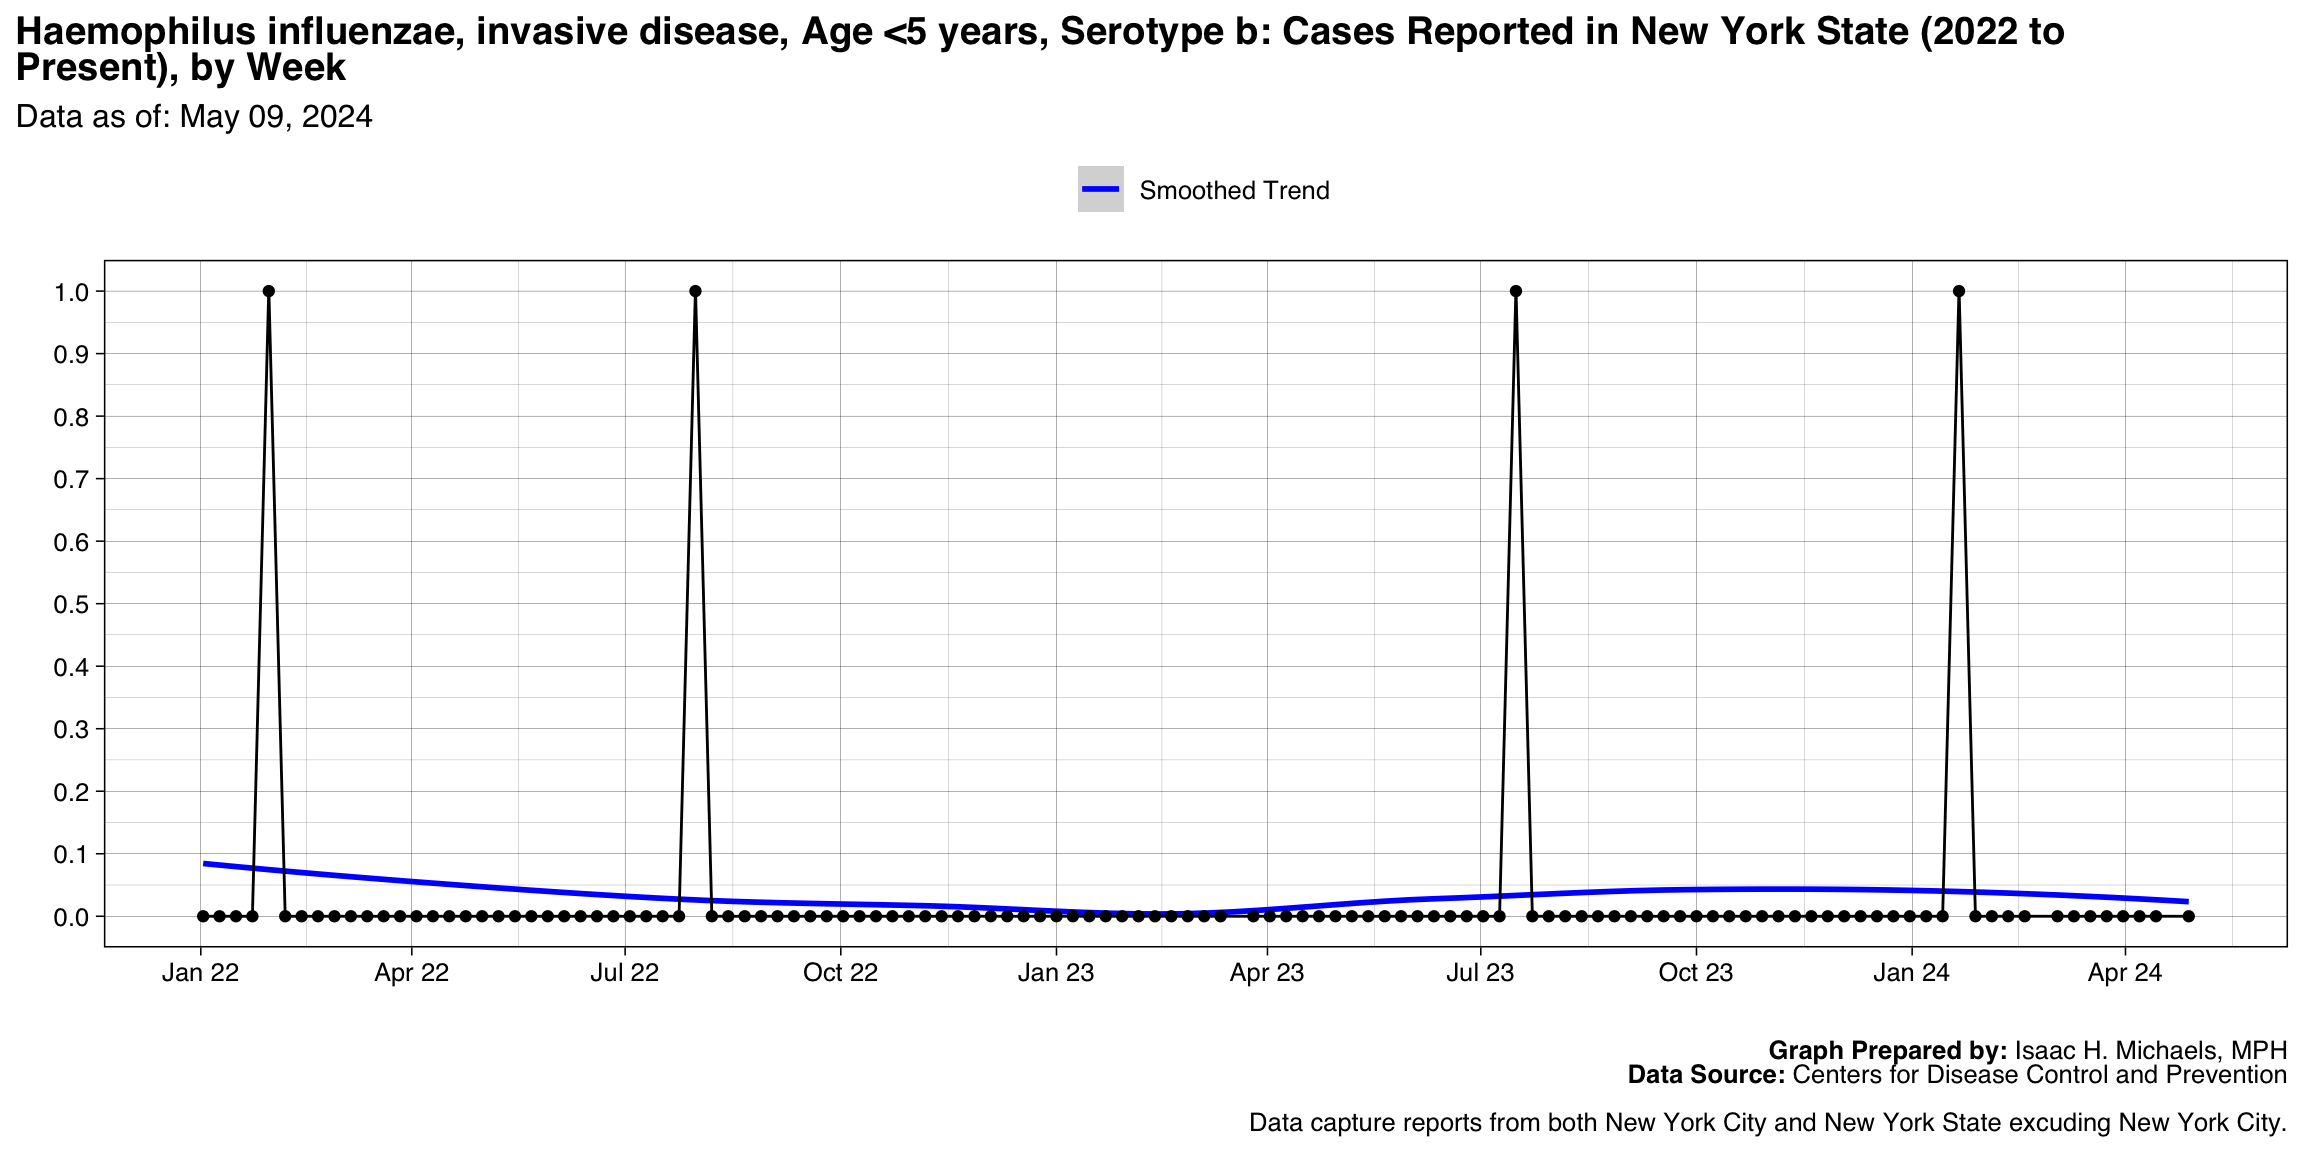
Haemophilus influenzae, invasive disease, Age <5 years, Serotype b
Graph Prepared By: Isaac H. Michaels, MPH
Death Data Source: U.S. Centers for Disease Control and Prevention
Leptospirosis
Graph Prepared By: Isaac H. Michaels, MPH
Death Data Source: U.S. Centers for Disease Control and Prevention
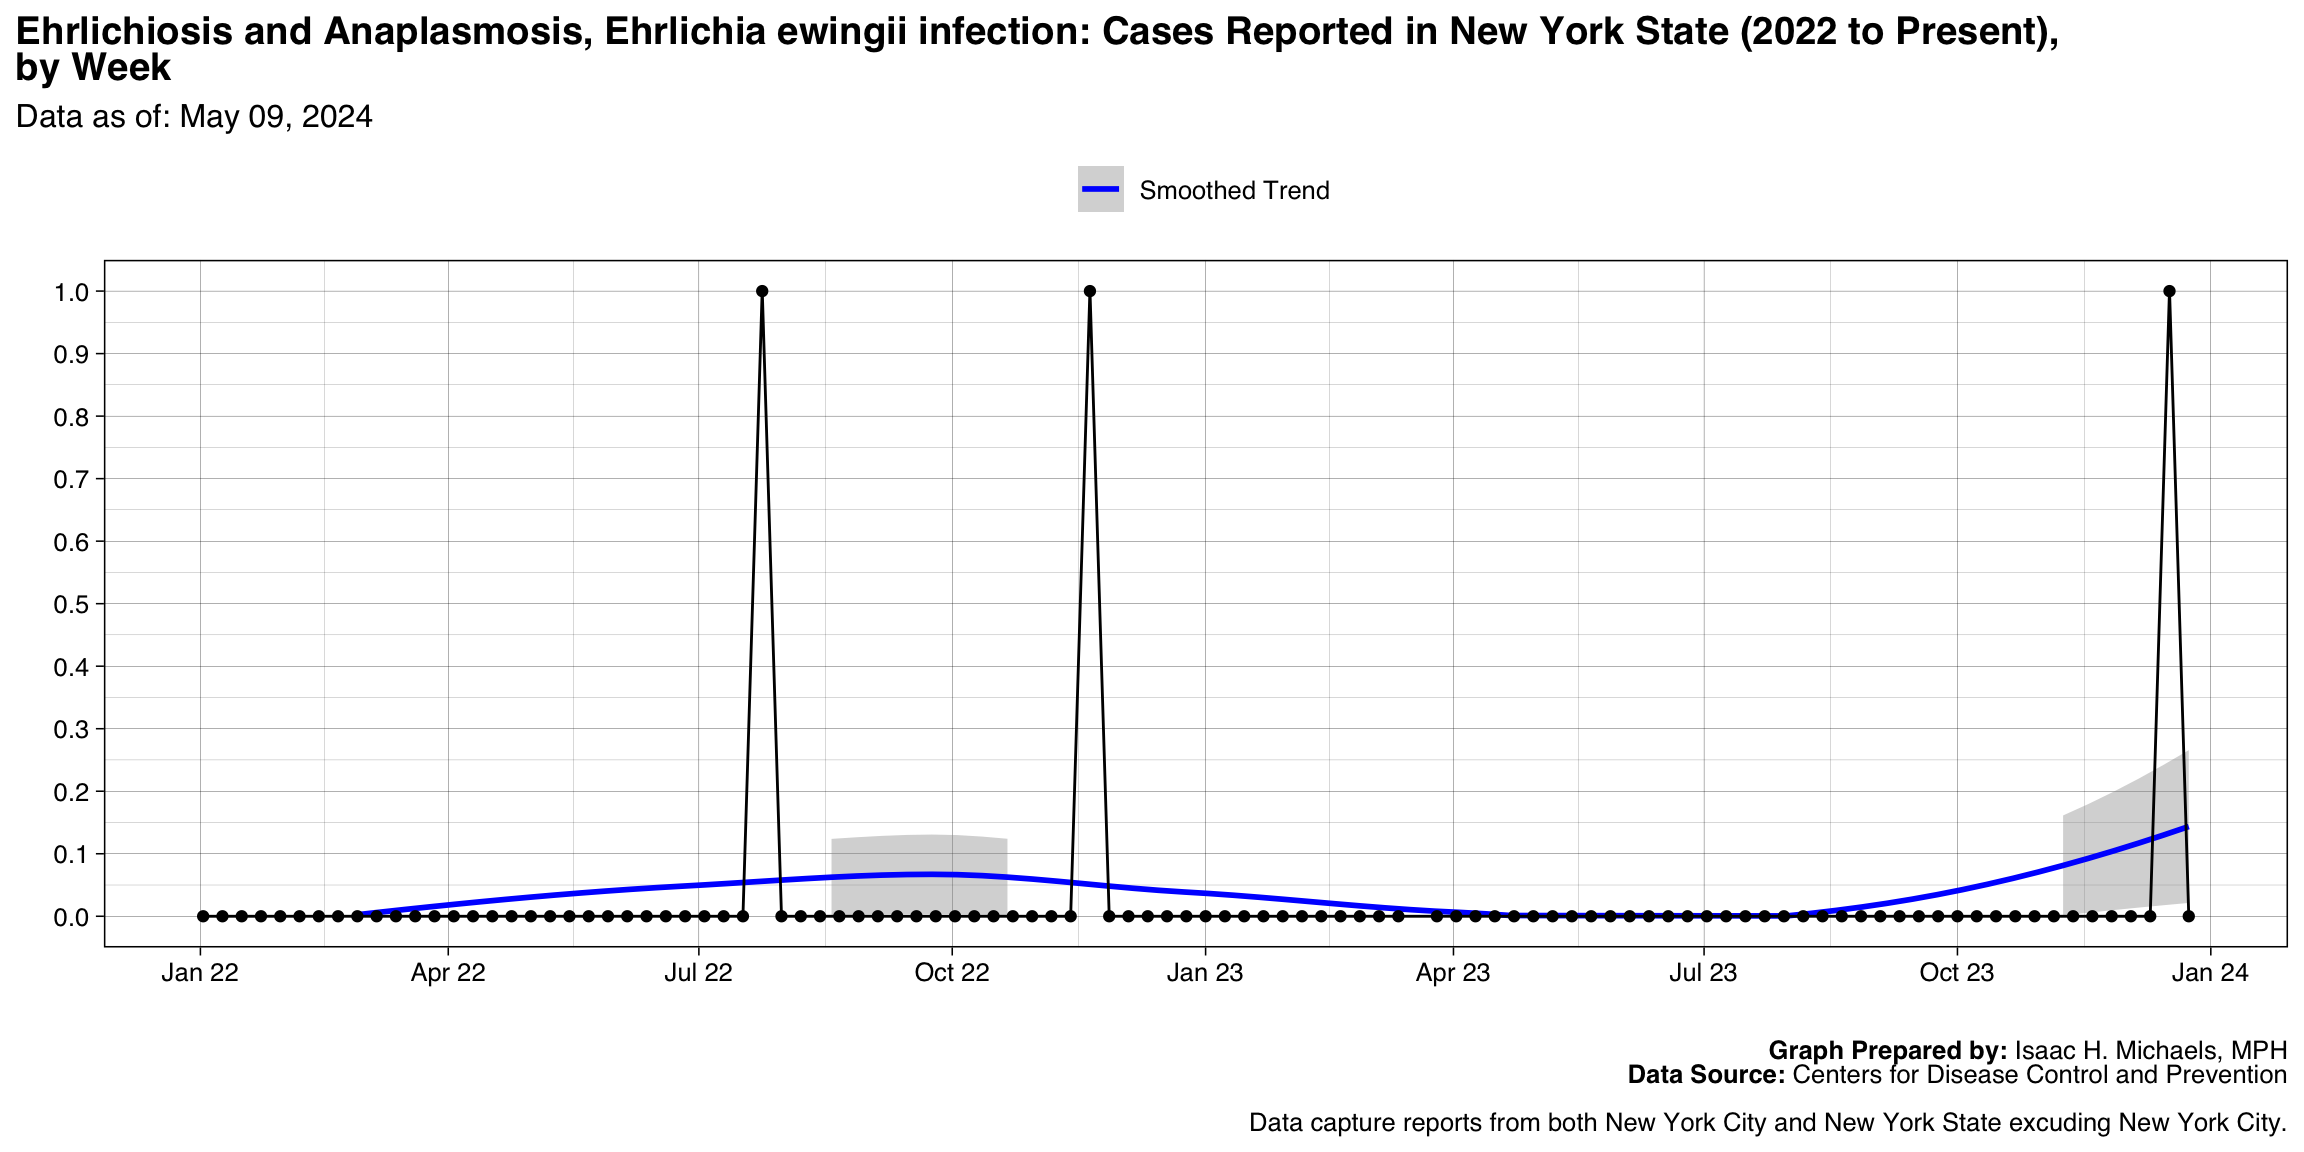
Ehrlichiosis and Anaplasmosis, Ehrlichia ewingii infection
Graph Prepared By: Isaac H. Michaels, MPH
Death Data Source: U.S. Centers for Disease Control and Prevention
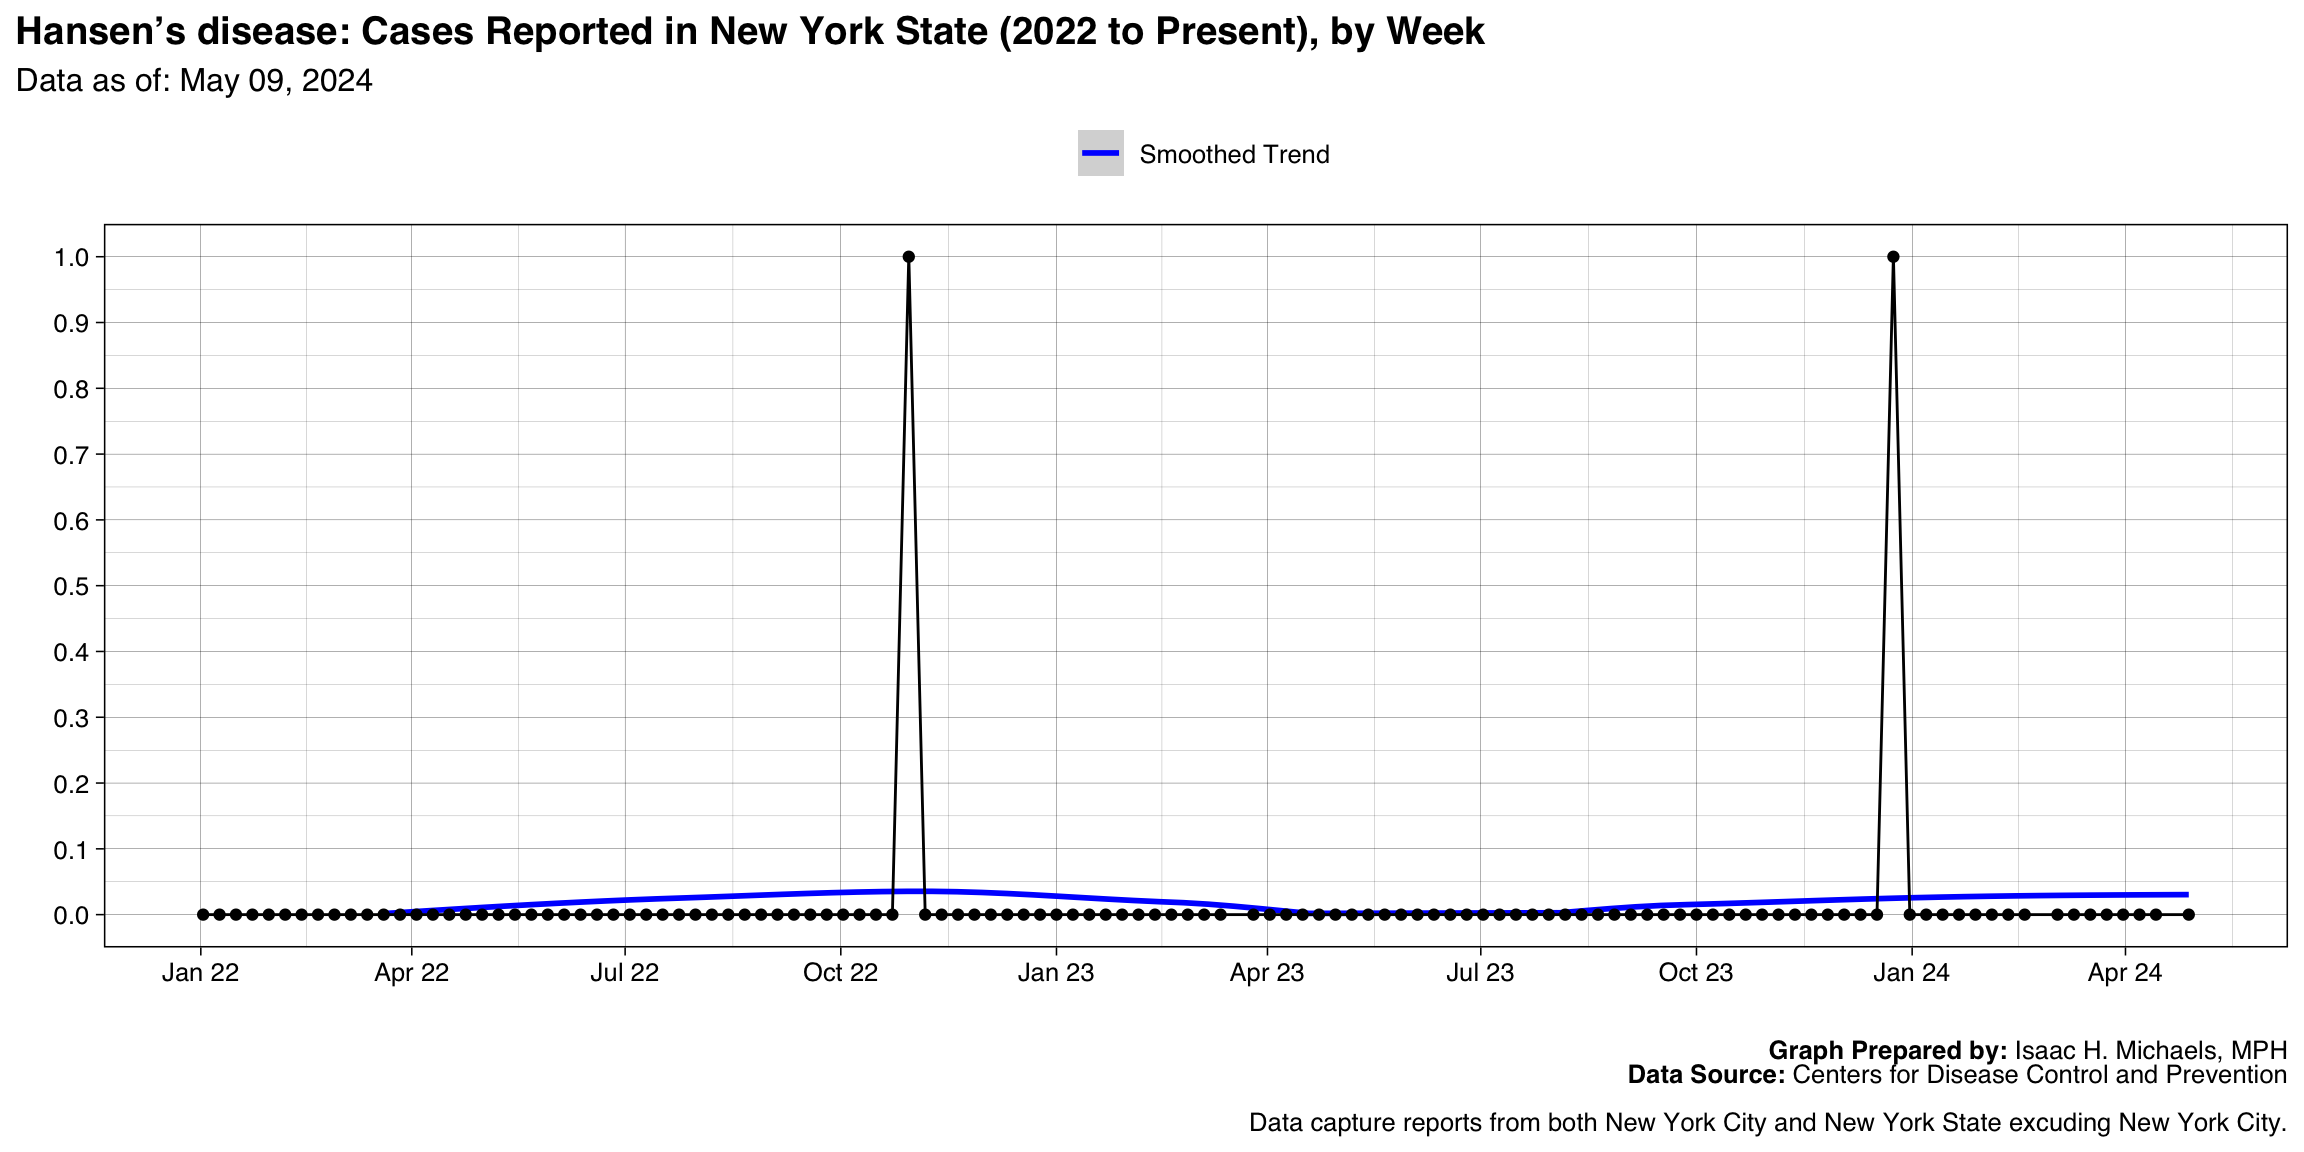
Hansen’s disease
Graph Prepared By: Isaac H. Michaels, MPH
Death Data Source: U.S. Centers for Disease Control and Prevention
Hepatitis B, acute
Graph Prepared By: Isaac H. Michaels, MPH
Death Data Source: U.S. Centers for Disease Control and Prevention
Hepatitis C, perinatal, Confirmed
Graph Prepared By: Isaac H. Michaels, MPH
Death Data Source: U.S. Centers for Disease Control and Prevention
Meningococcal disease, Serogroup B
Graph Prepared By: Isaac H. Michaels, MPH
Death Data Source: U.S. Centers for Disease Control and Prevention
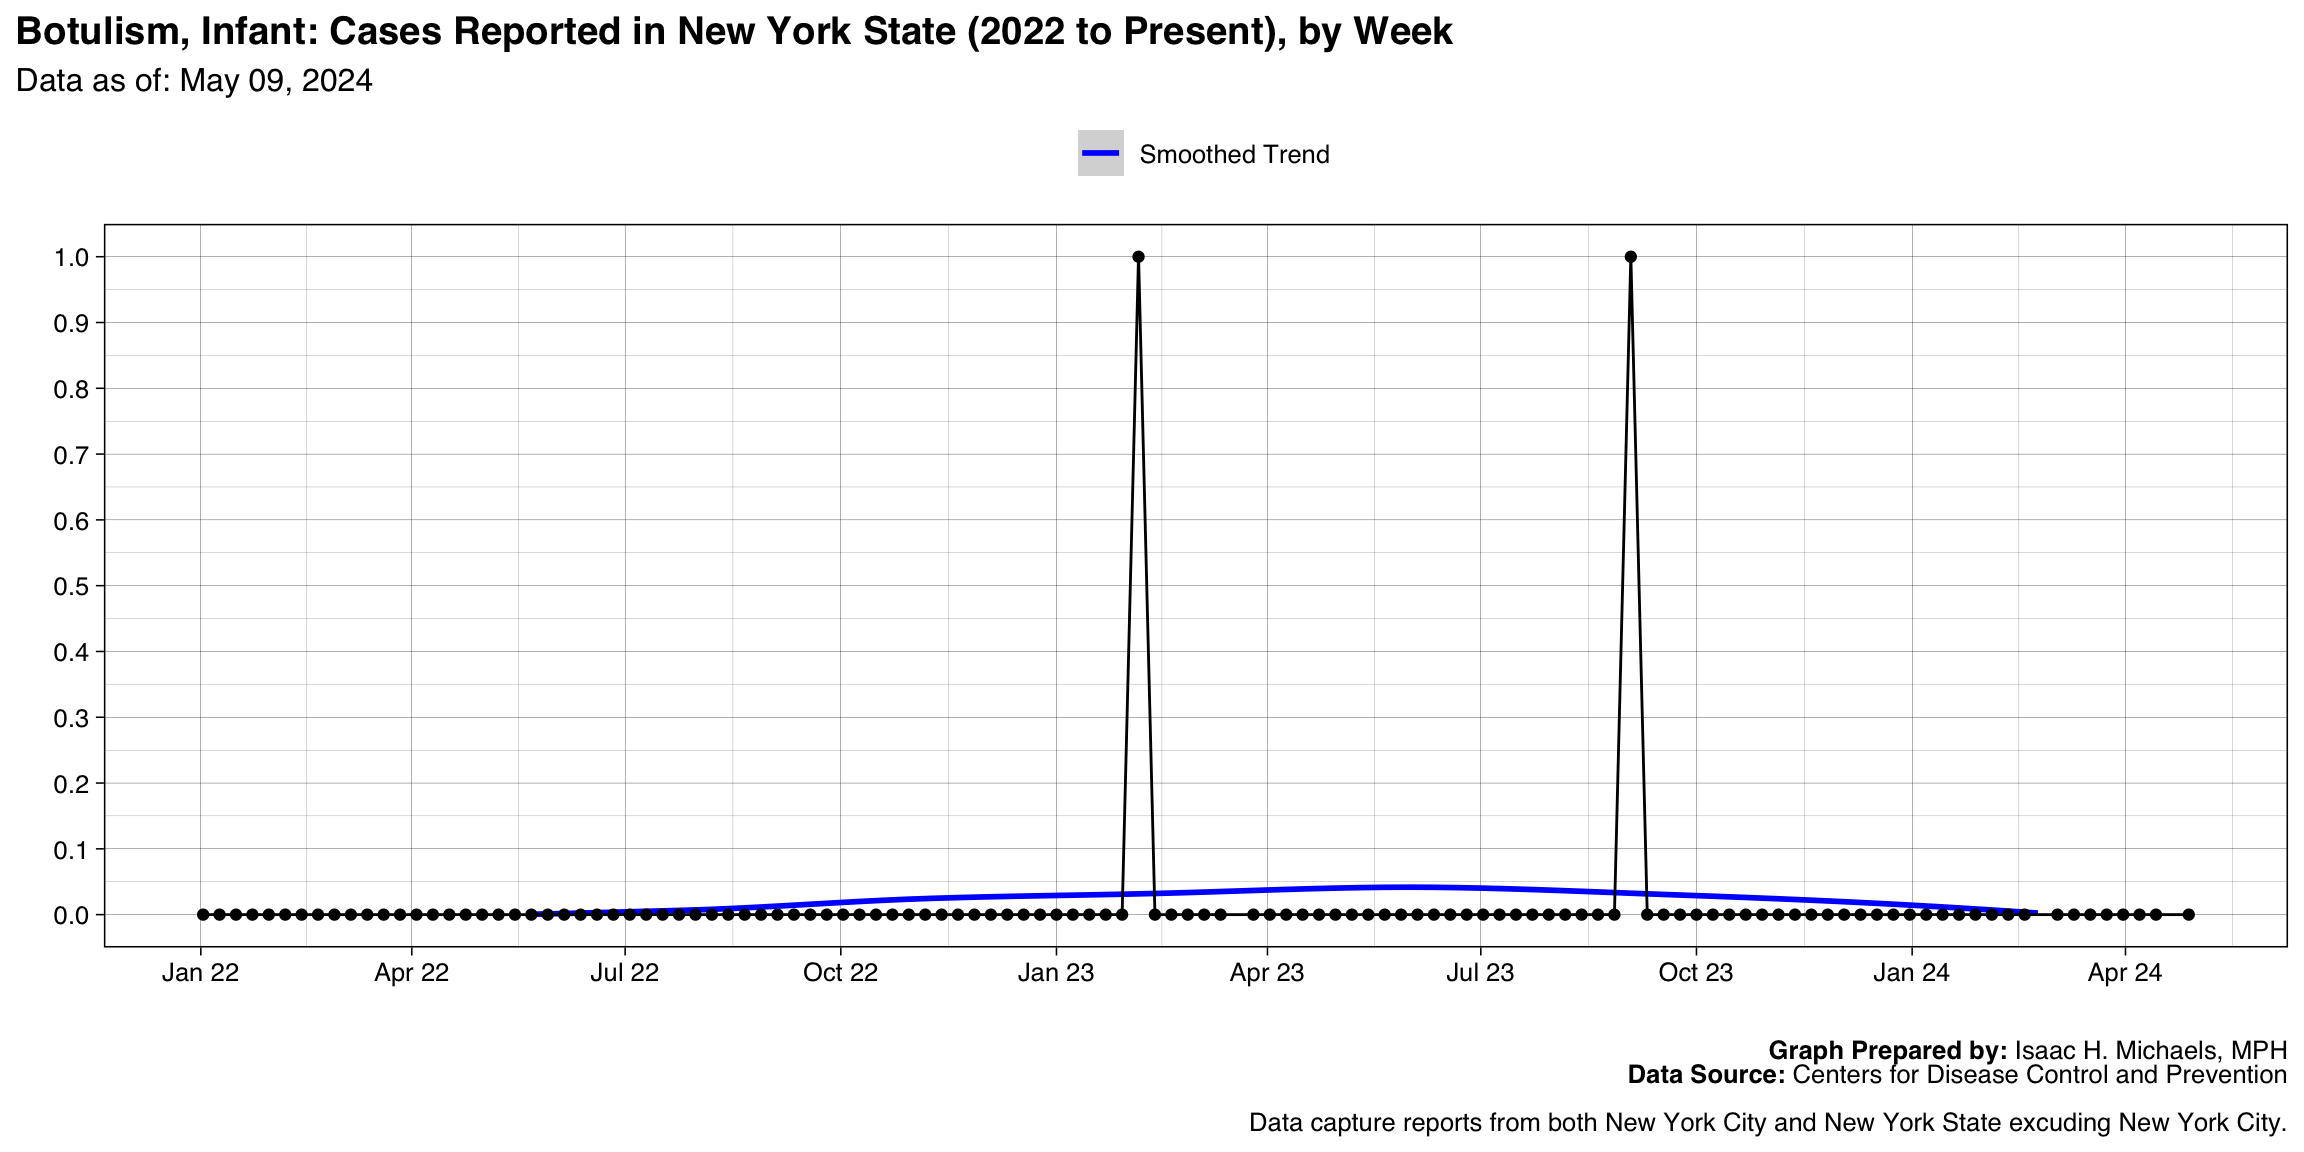
Botulism, Infant
Graph Prepared By: Isaac H. Michaels, MPH
Death Data Source: U.S. Centers for Disease Control and Prevention
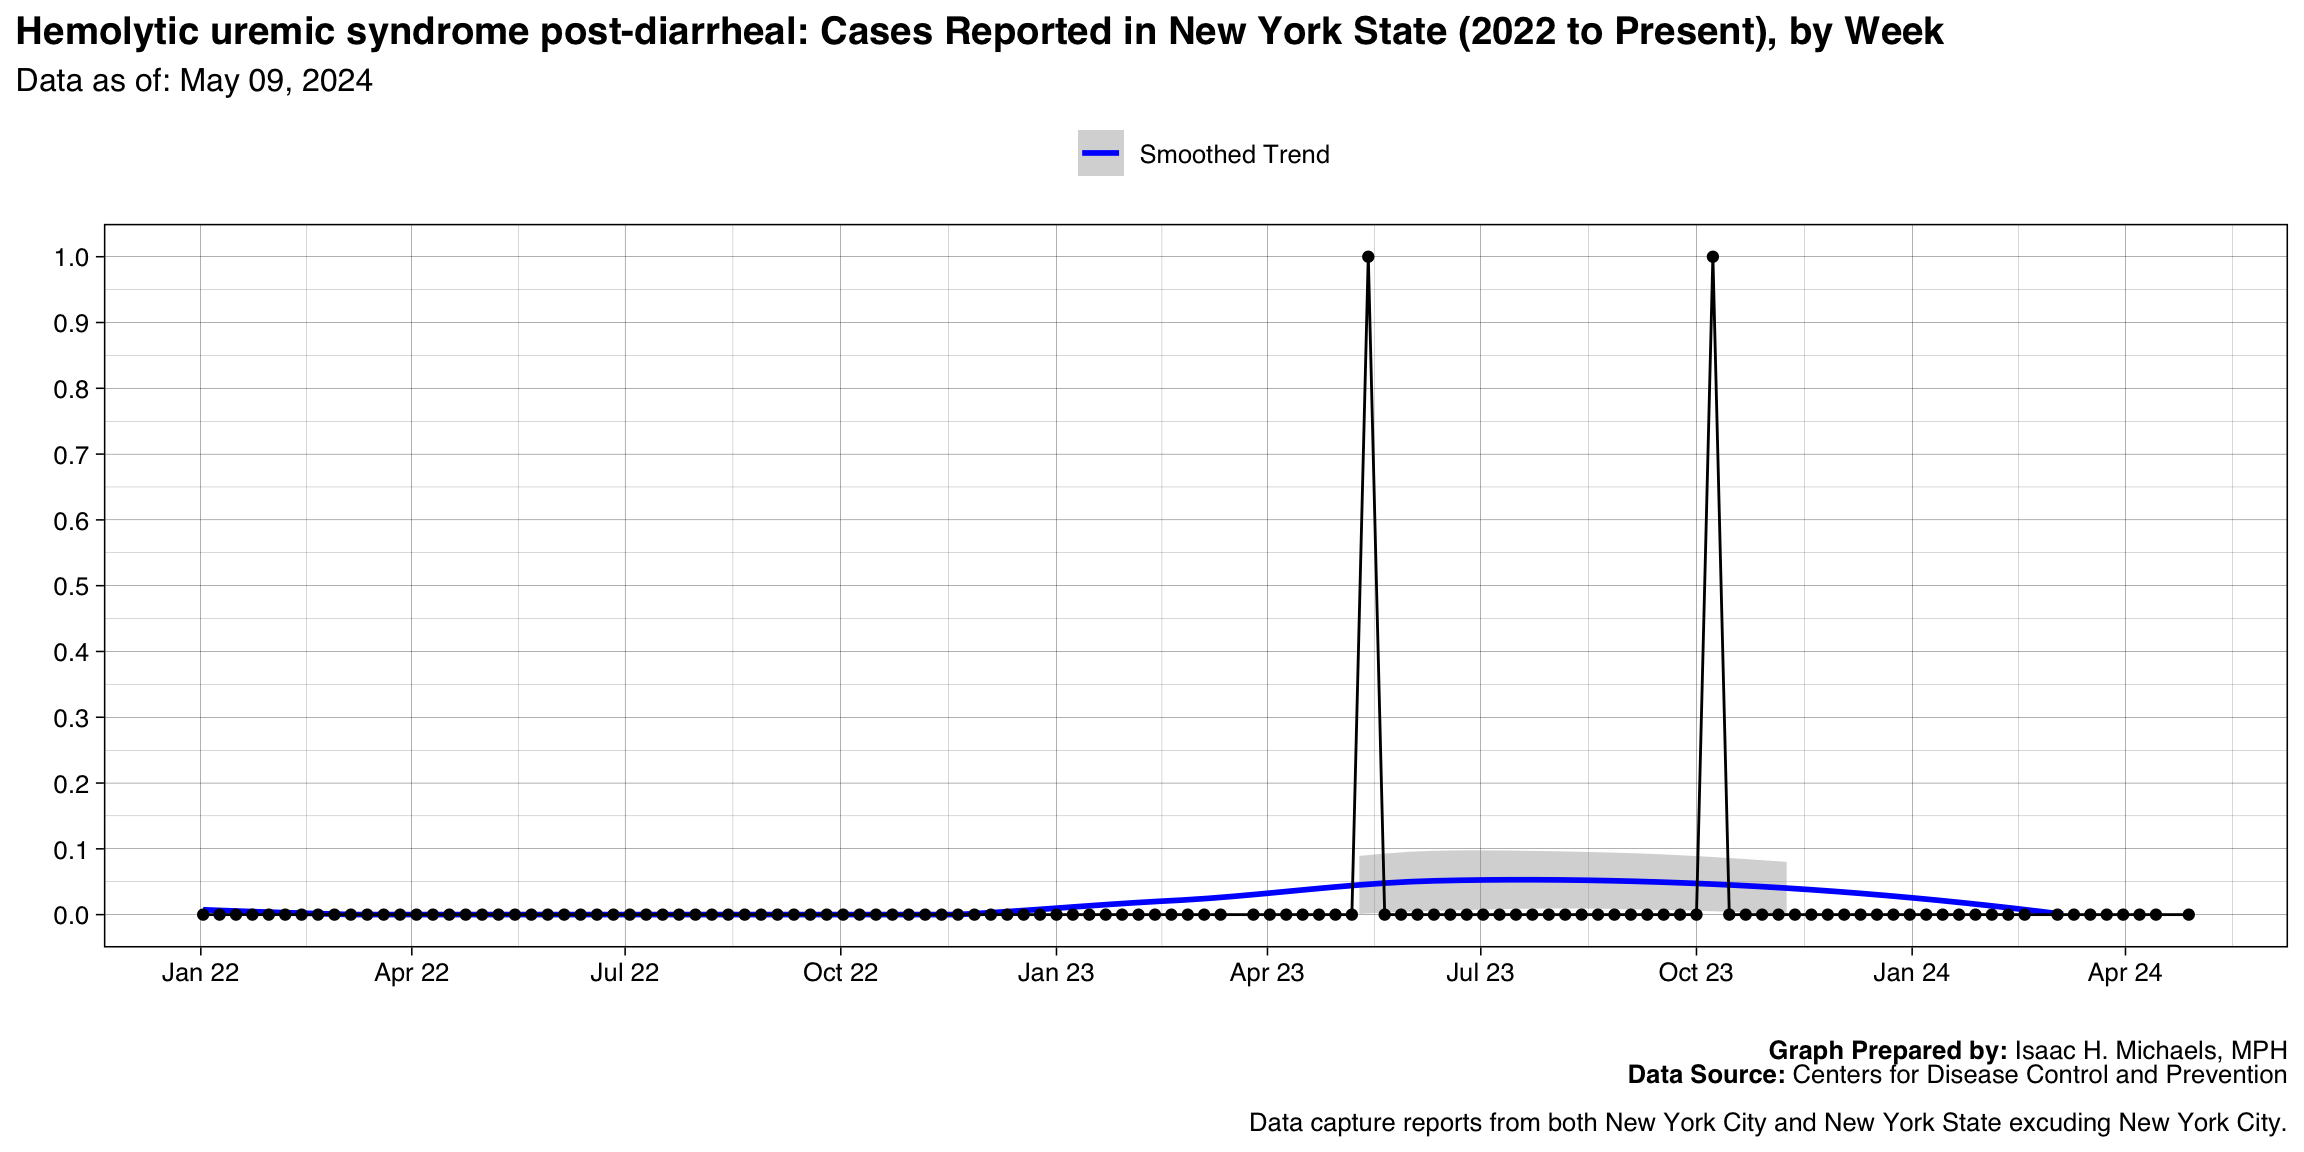
Hemolytic uremic syndrome post-diarrheal
Graph Prepared By: Isaac H. Michaels, MPH
Death Data Source: U.S. Centers for Disease Control and Prevention
Meningococcal disease, Serogroups ACWY
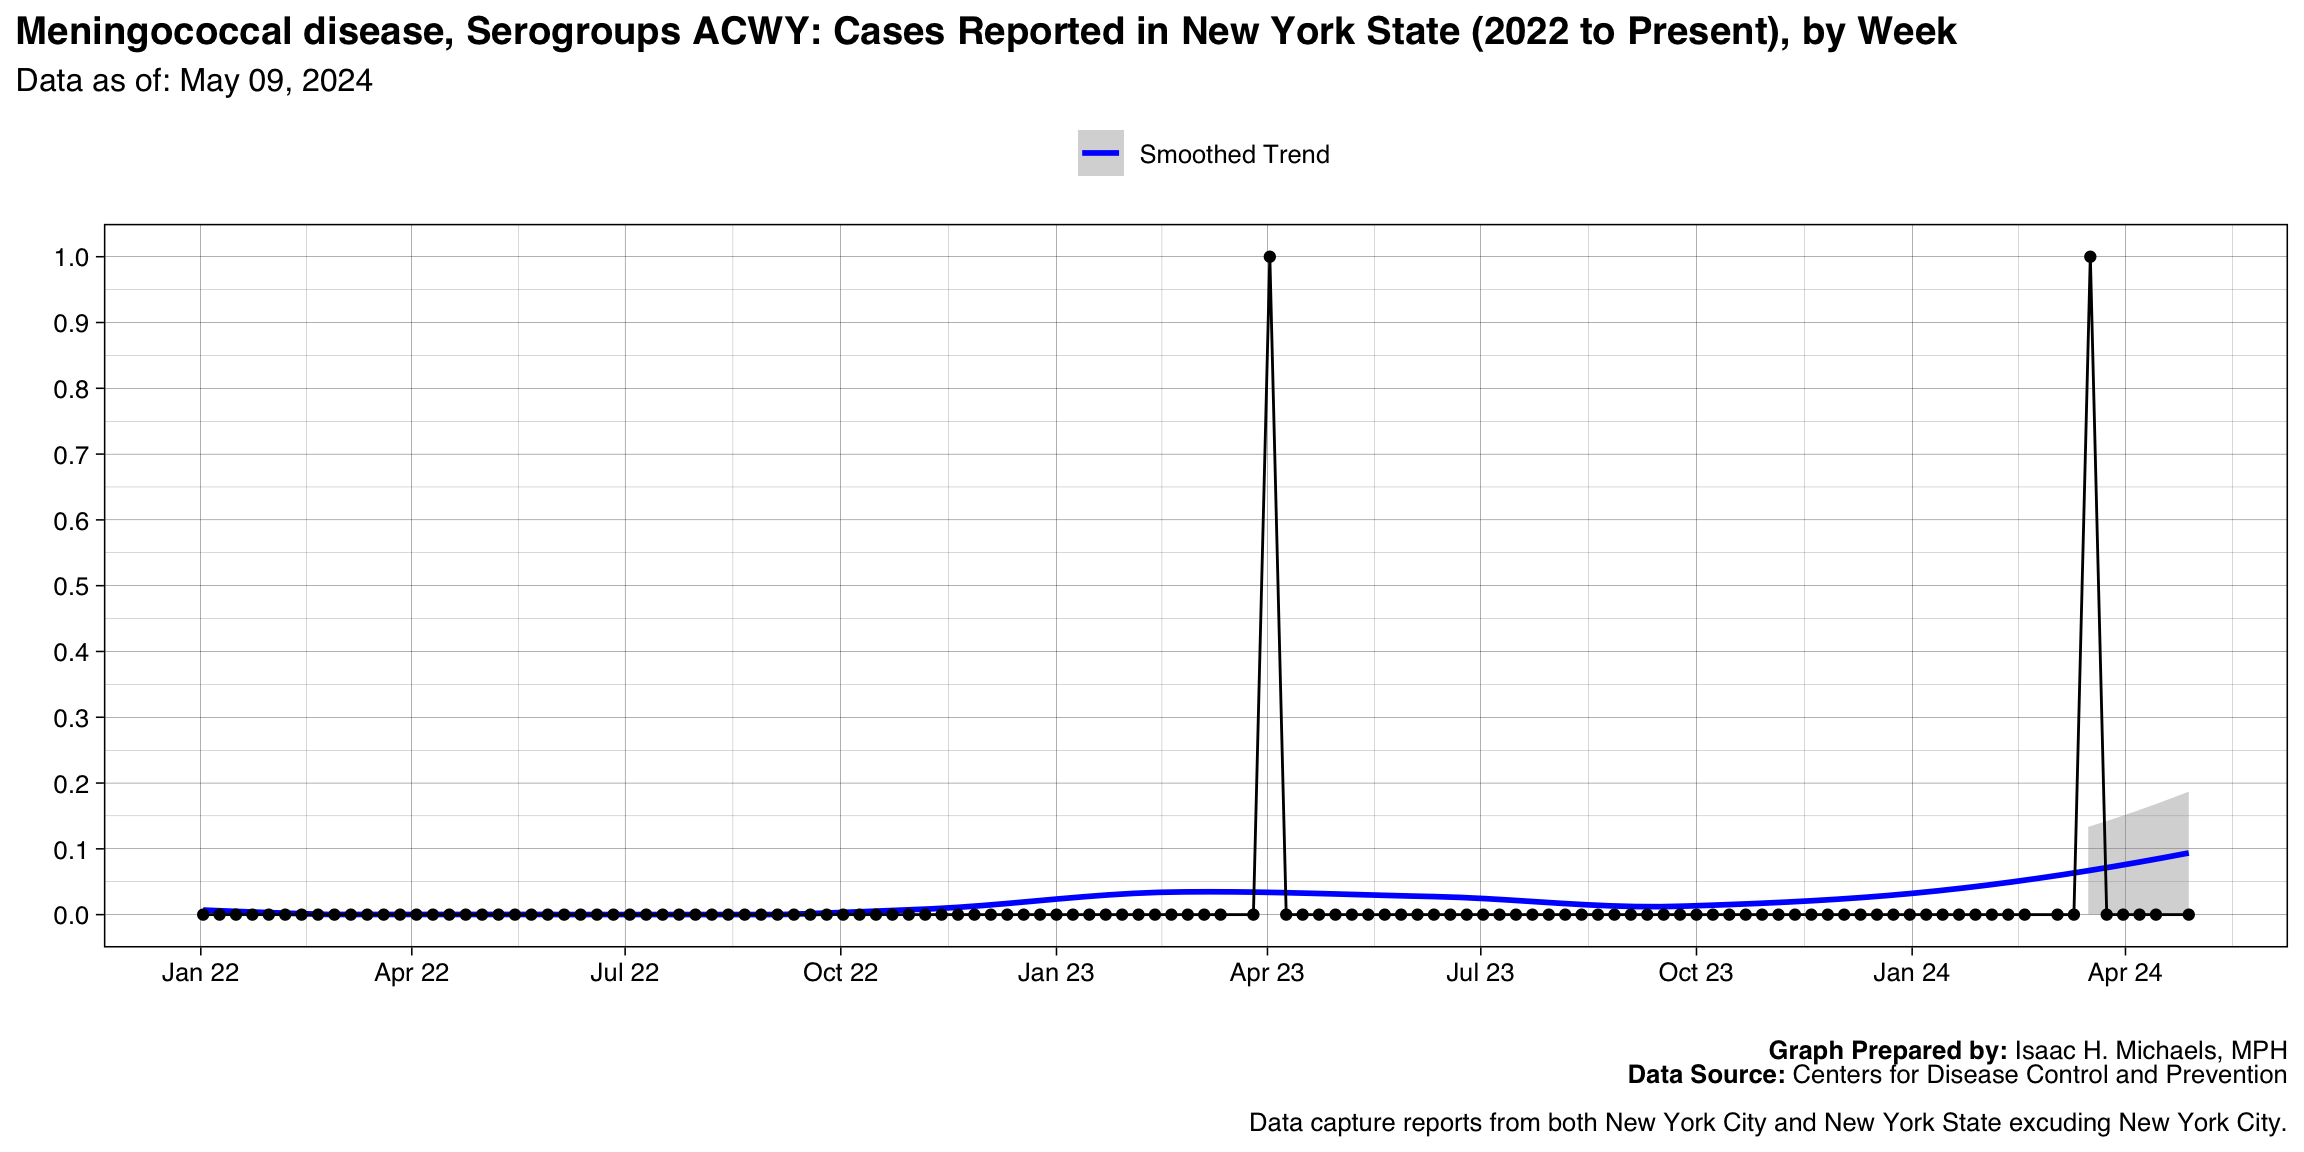
Graph Prepared By: Isaac H. Michaels, MPH
Death Data Source: U.S. Centers for Disease Control and Prevention
Arboviral diseases, Powassan virus disease
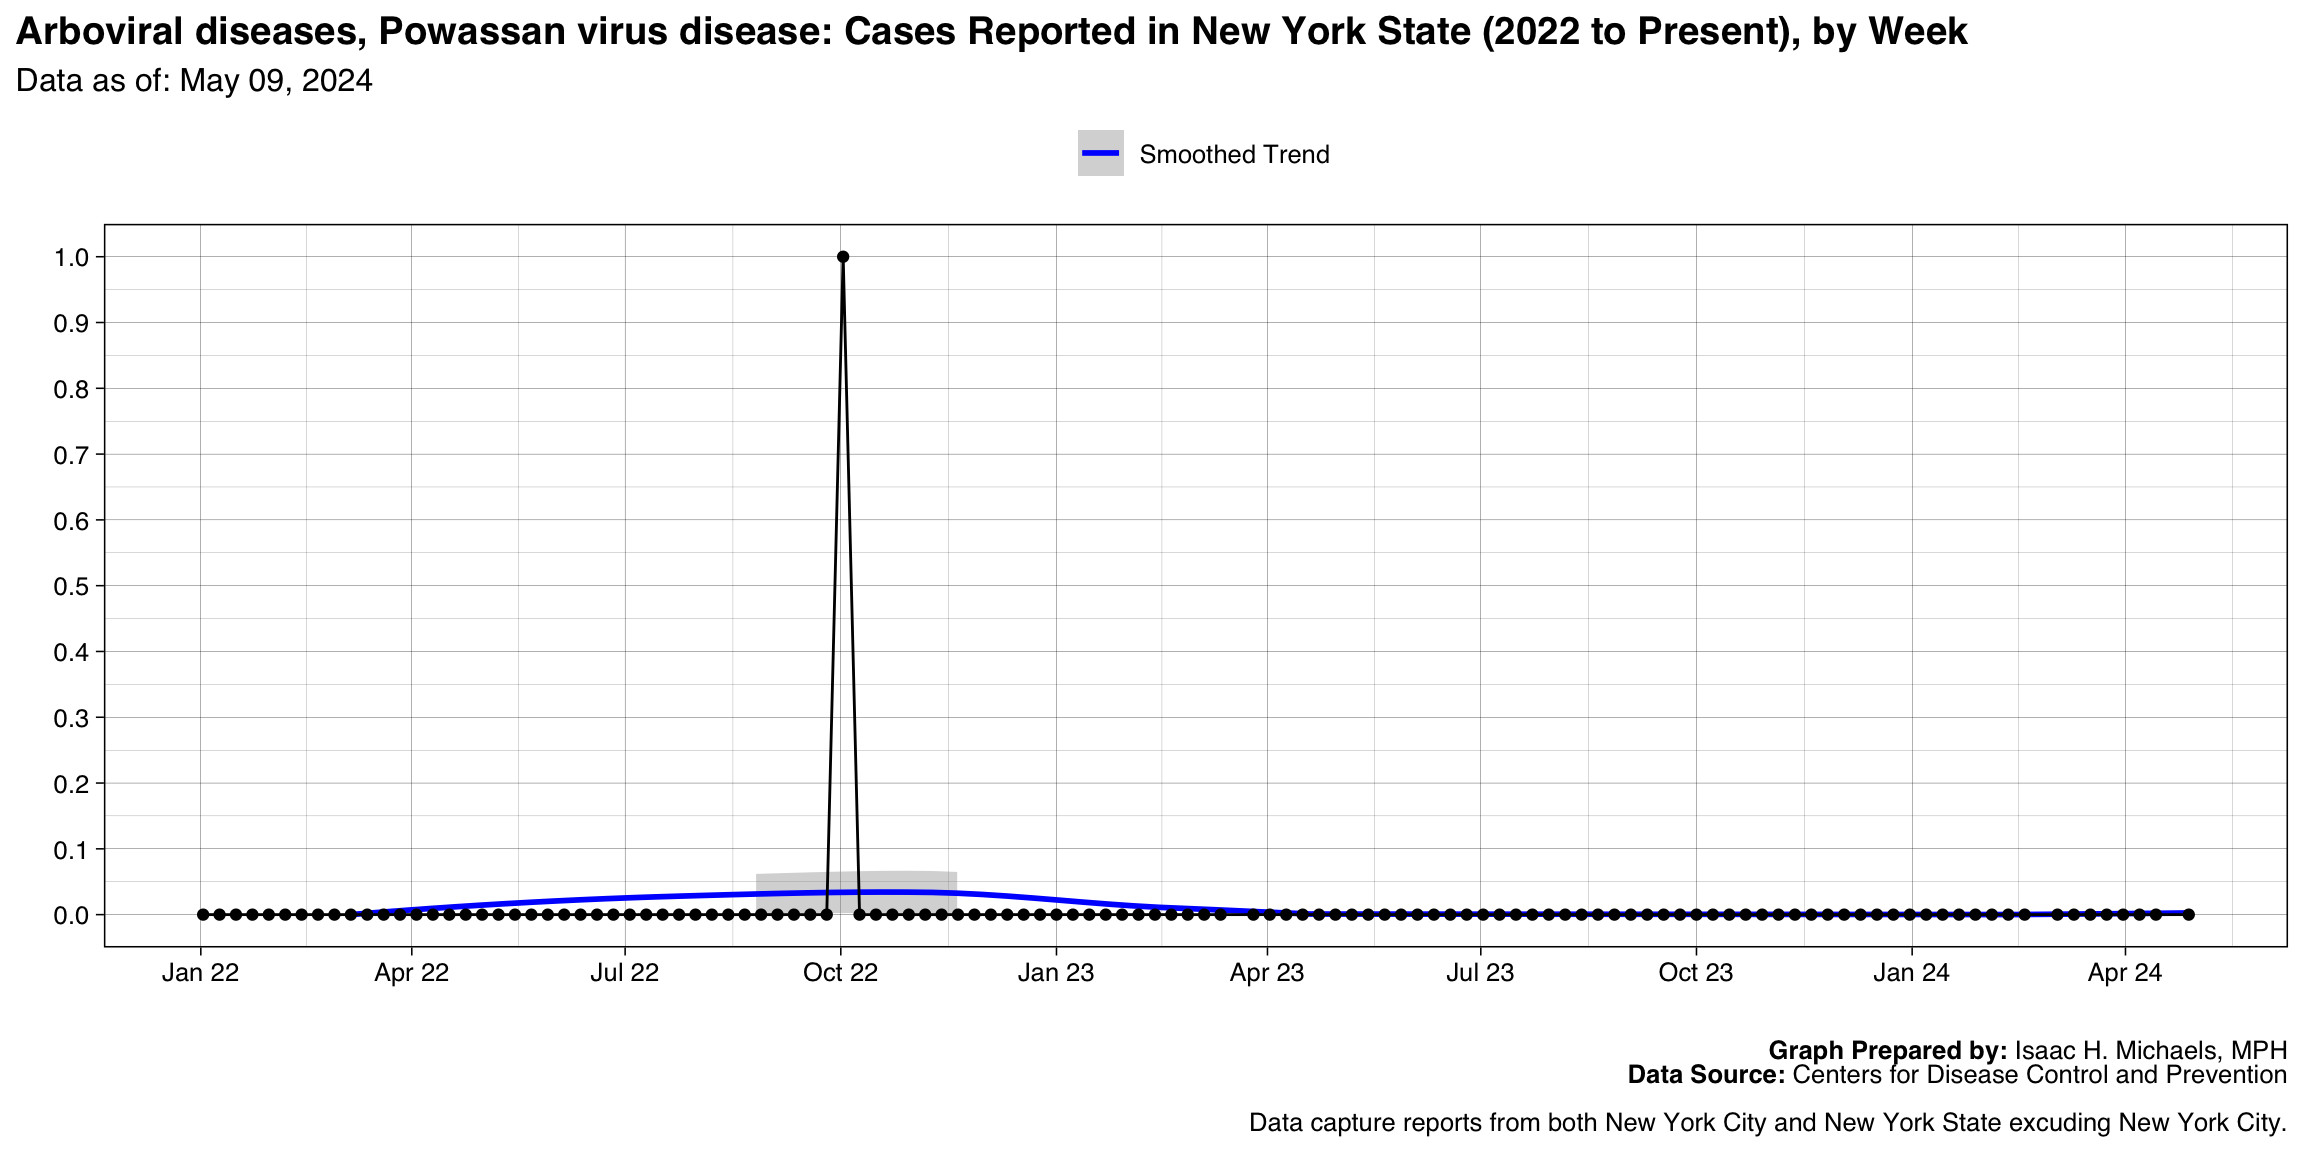
Graph Prepared By: Isaac H. Michaels, MPH
Death Data Source: U.S. Centers for Disease Control and Prevention
Botulism, Other (wound & unspecified)
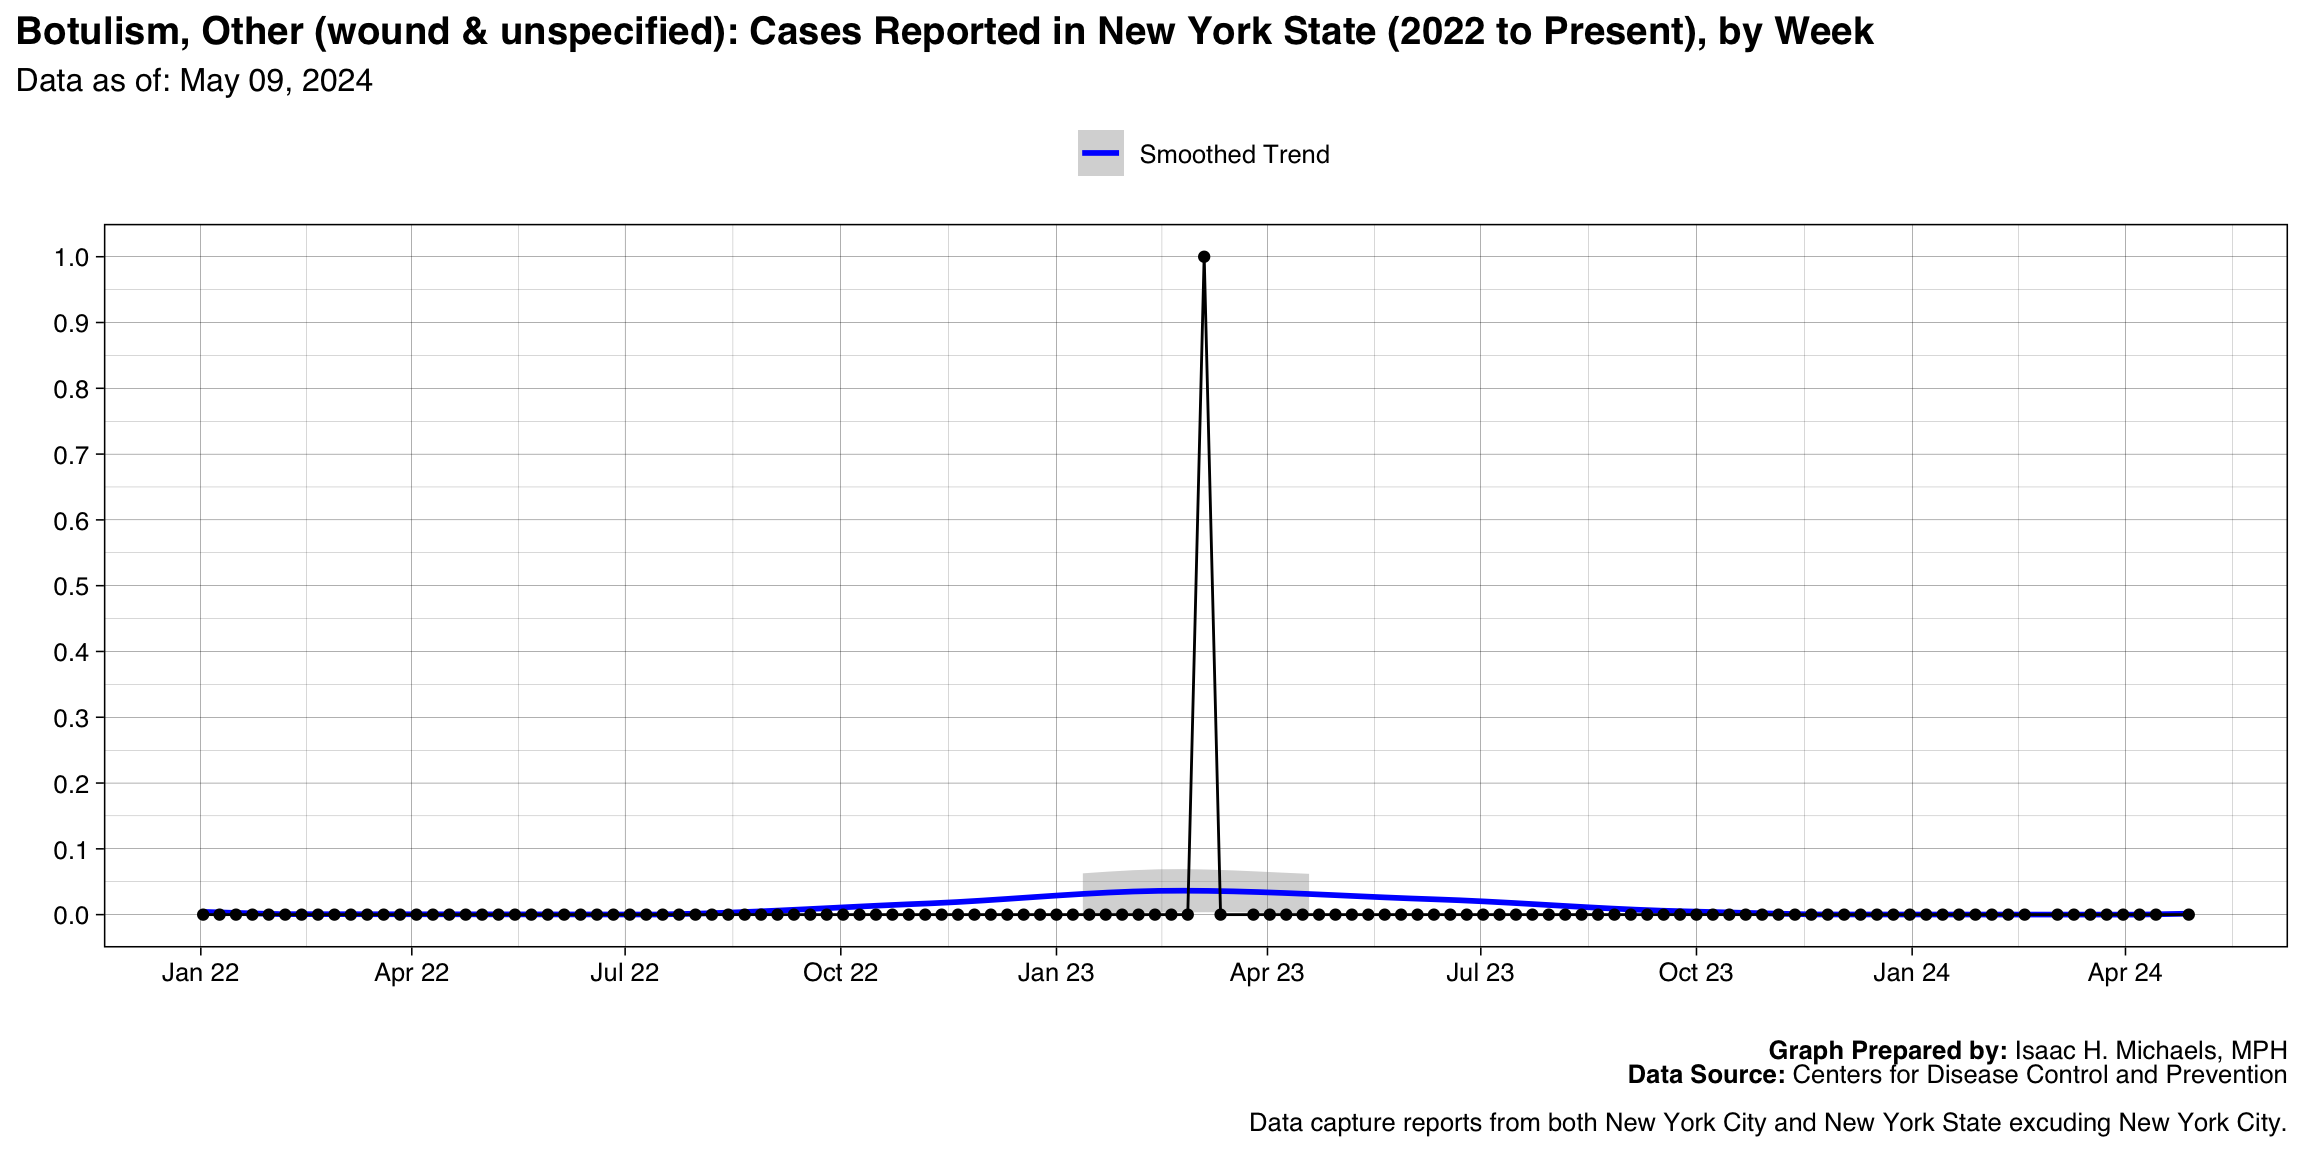
Graph Prepared By: Isaac H. Michaels, MPH
Death Data Source: U.S. Centers for Disease Control and Prevention
Chancroid
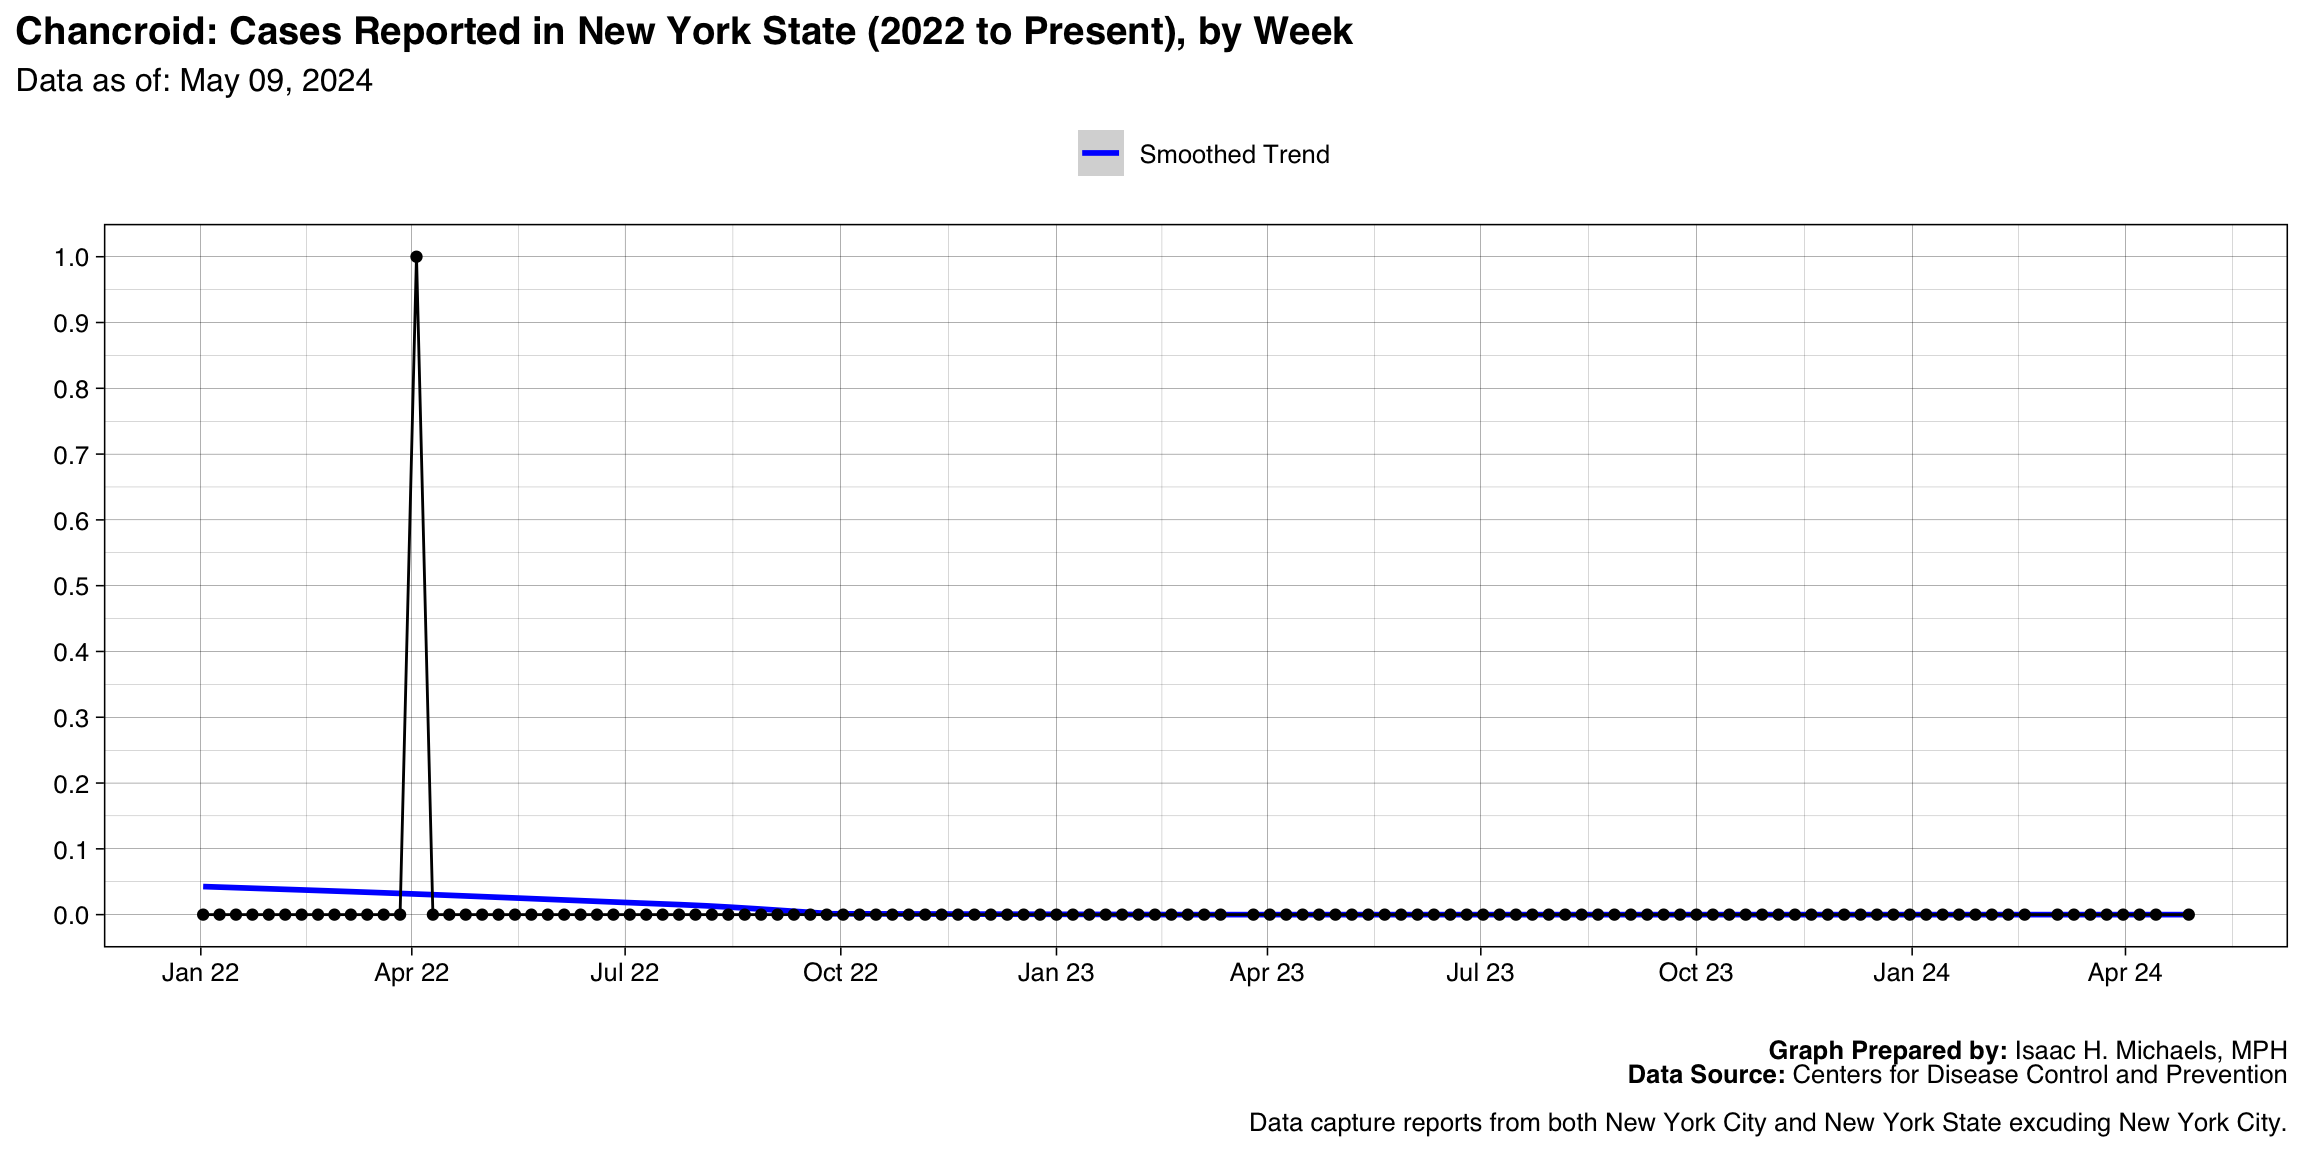
Graph Prepared By: Isaac H. Michaels, MPH
Death Data Source: U.S. Centers for Disease Control and Prevention
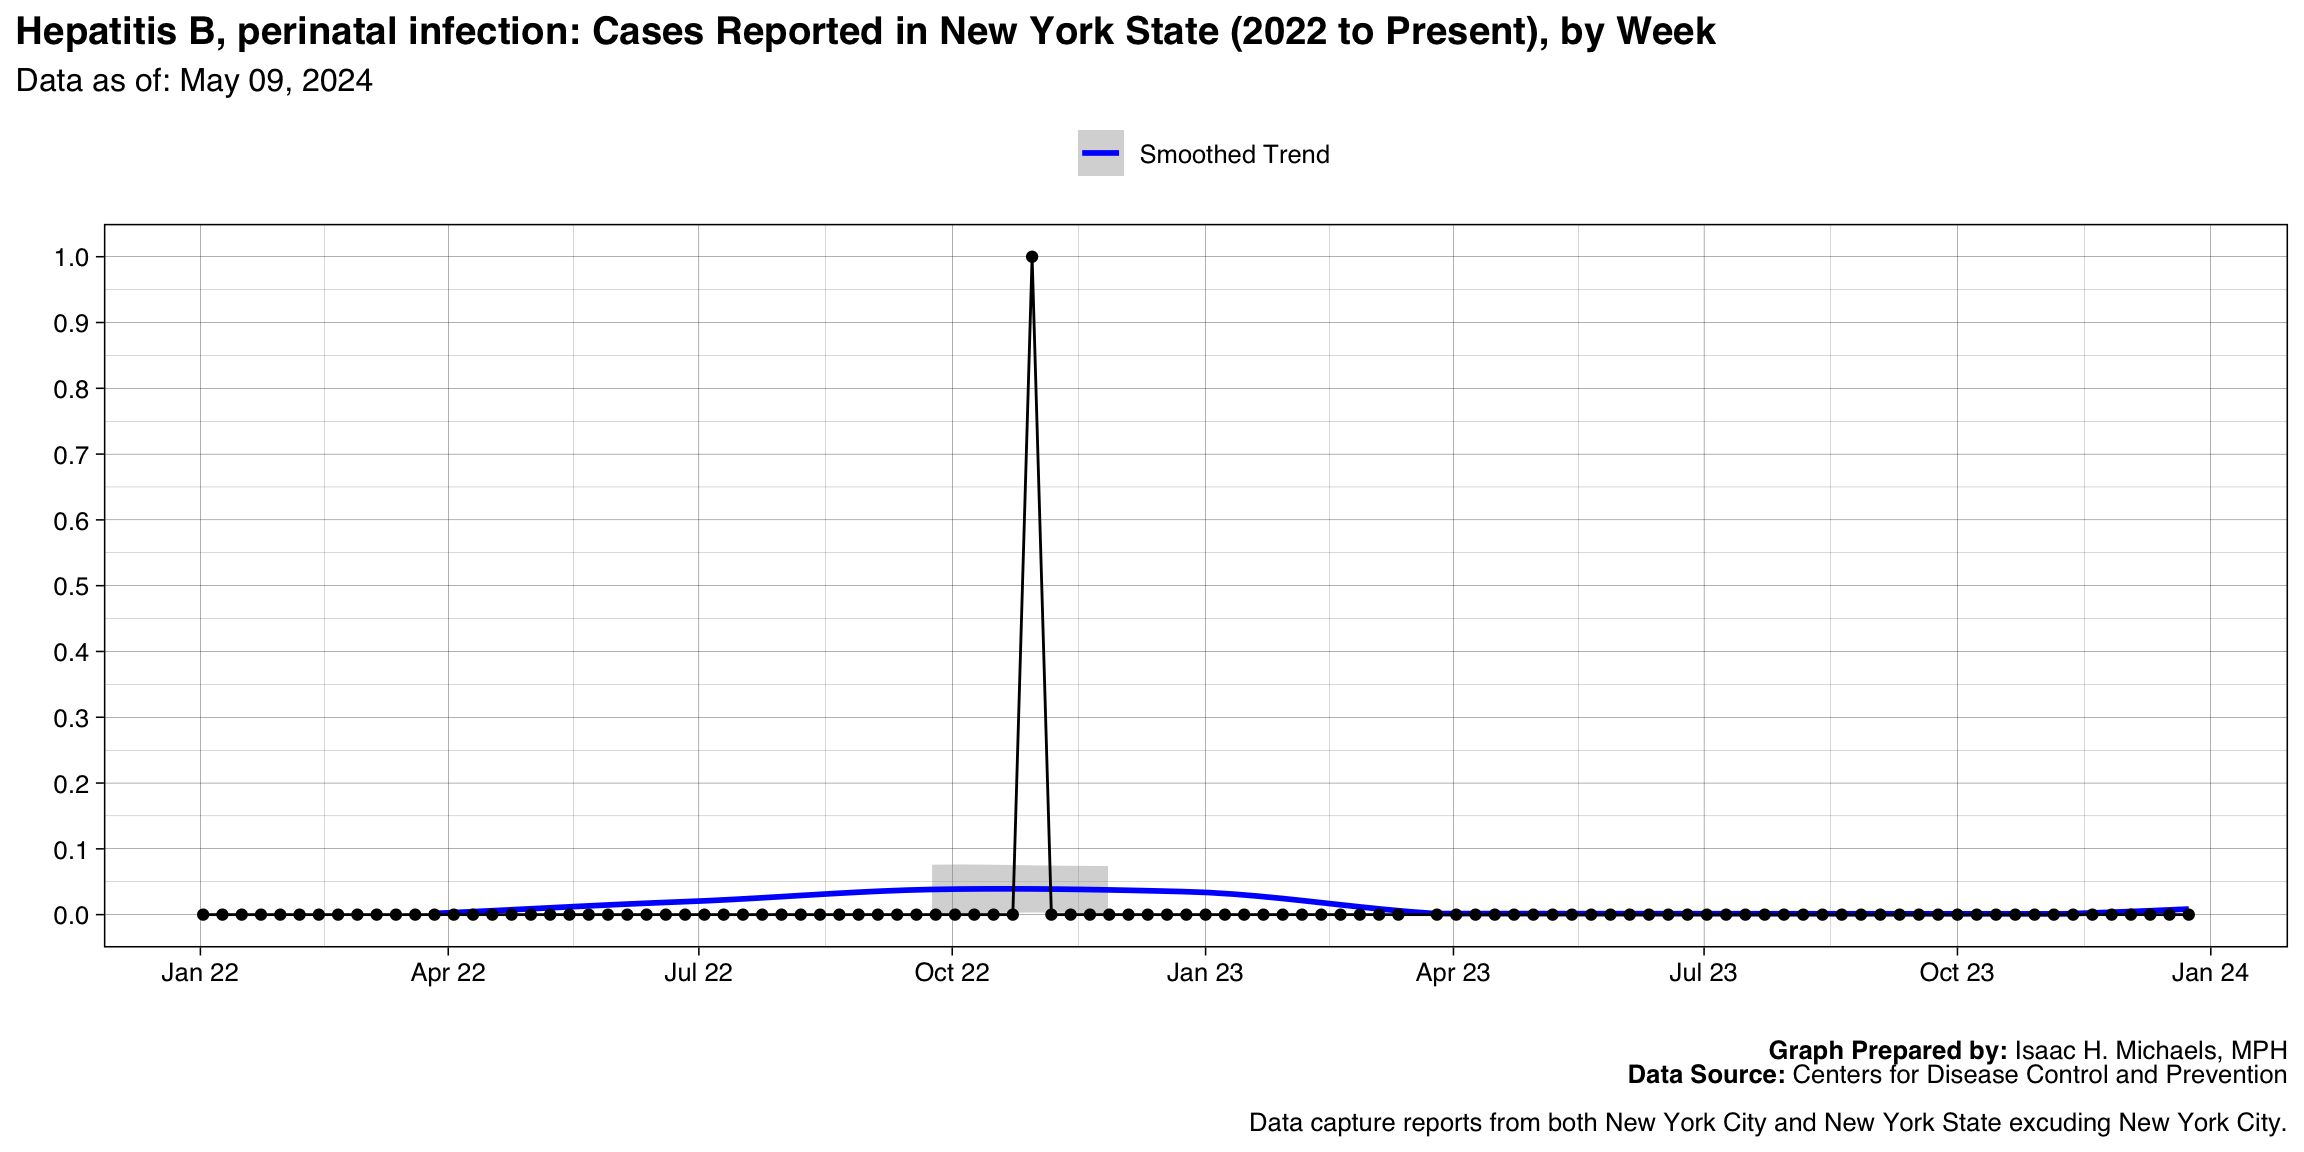
Hepatitis B, perinatal infection
Graph Prepared By: Isaac H. Michaels, MPH
Death Data Source: U.S. Centers for Disease Control and Prevention
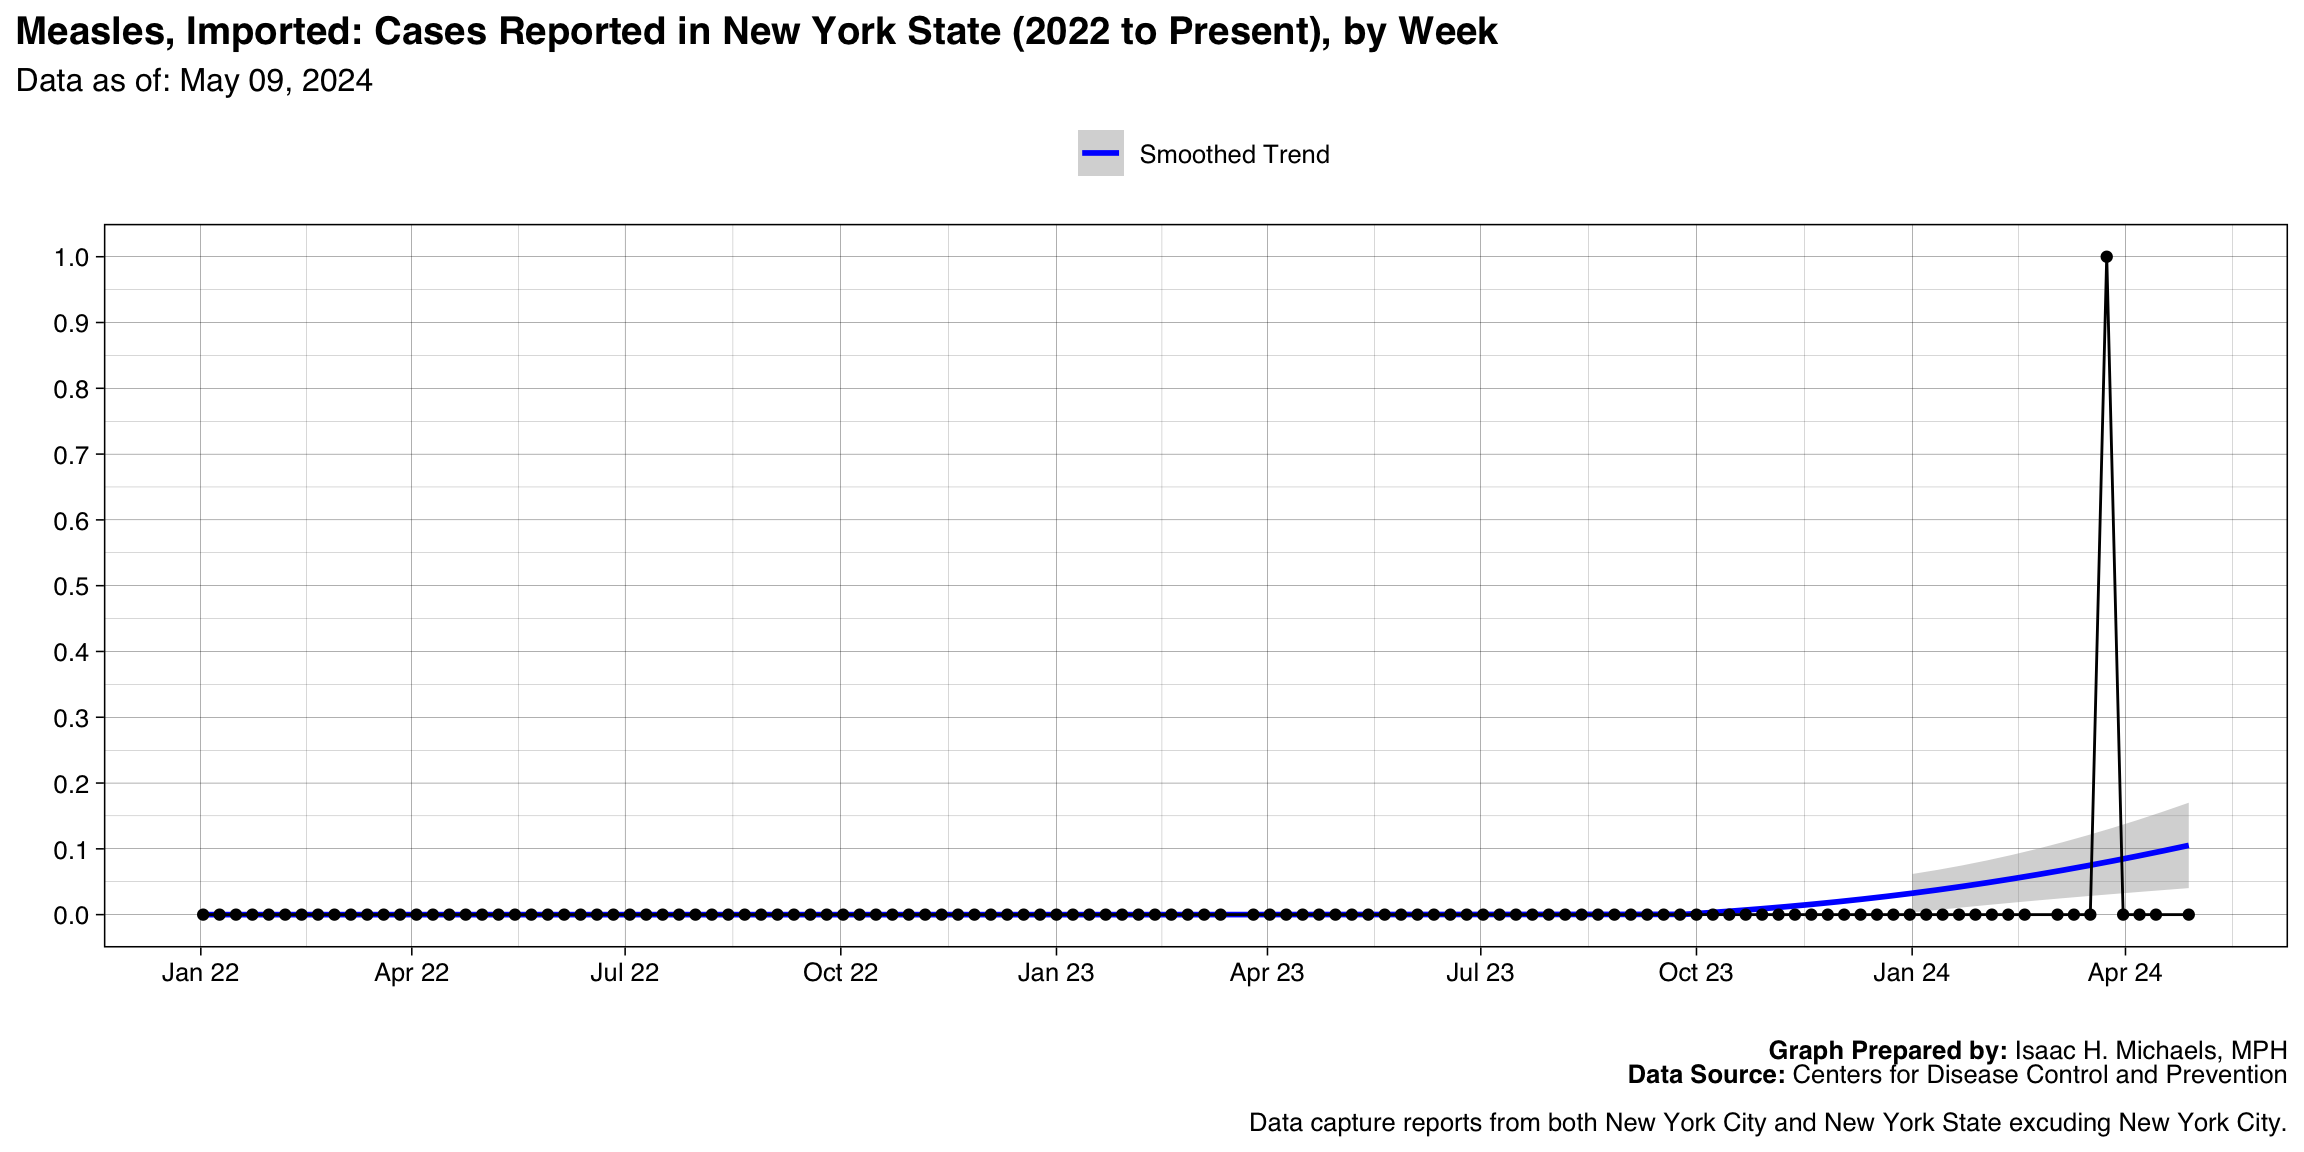
Measles, Imported
Graph Prepared By: Isaac H. Michaels, MPH
Death Data Source: U.S. Centers for Disease Control and Prevention
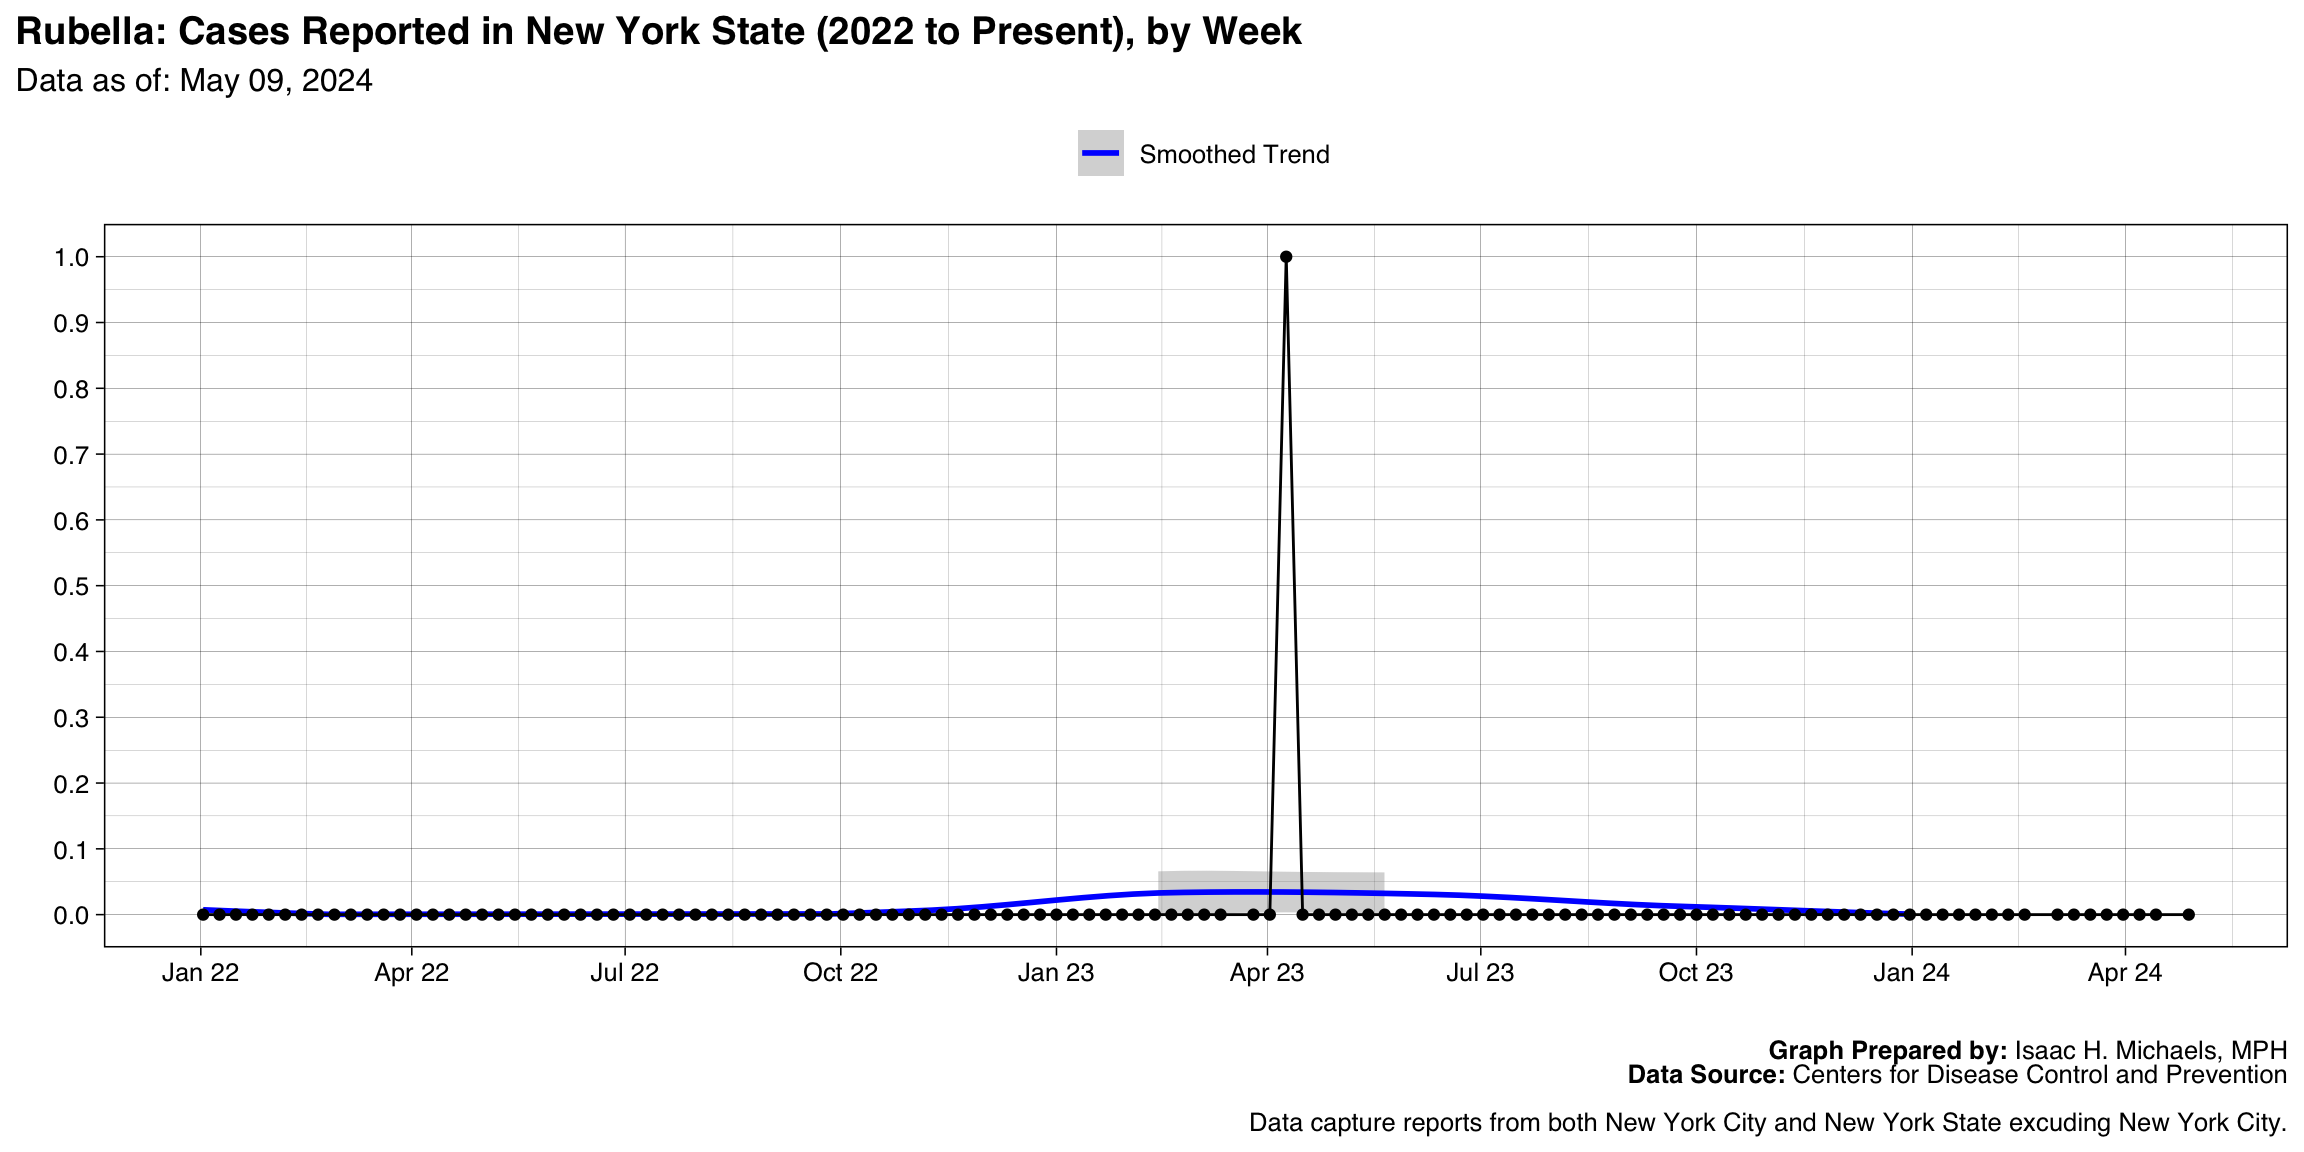
Rubella
Graph Prepared By: Isaac H. Michaels, MPH
Death Data Source: U.S. Centers for Disease Control and Prevention
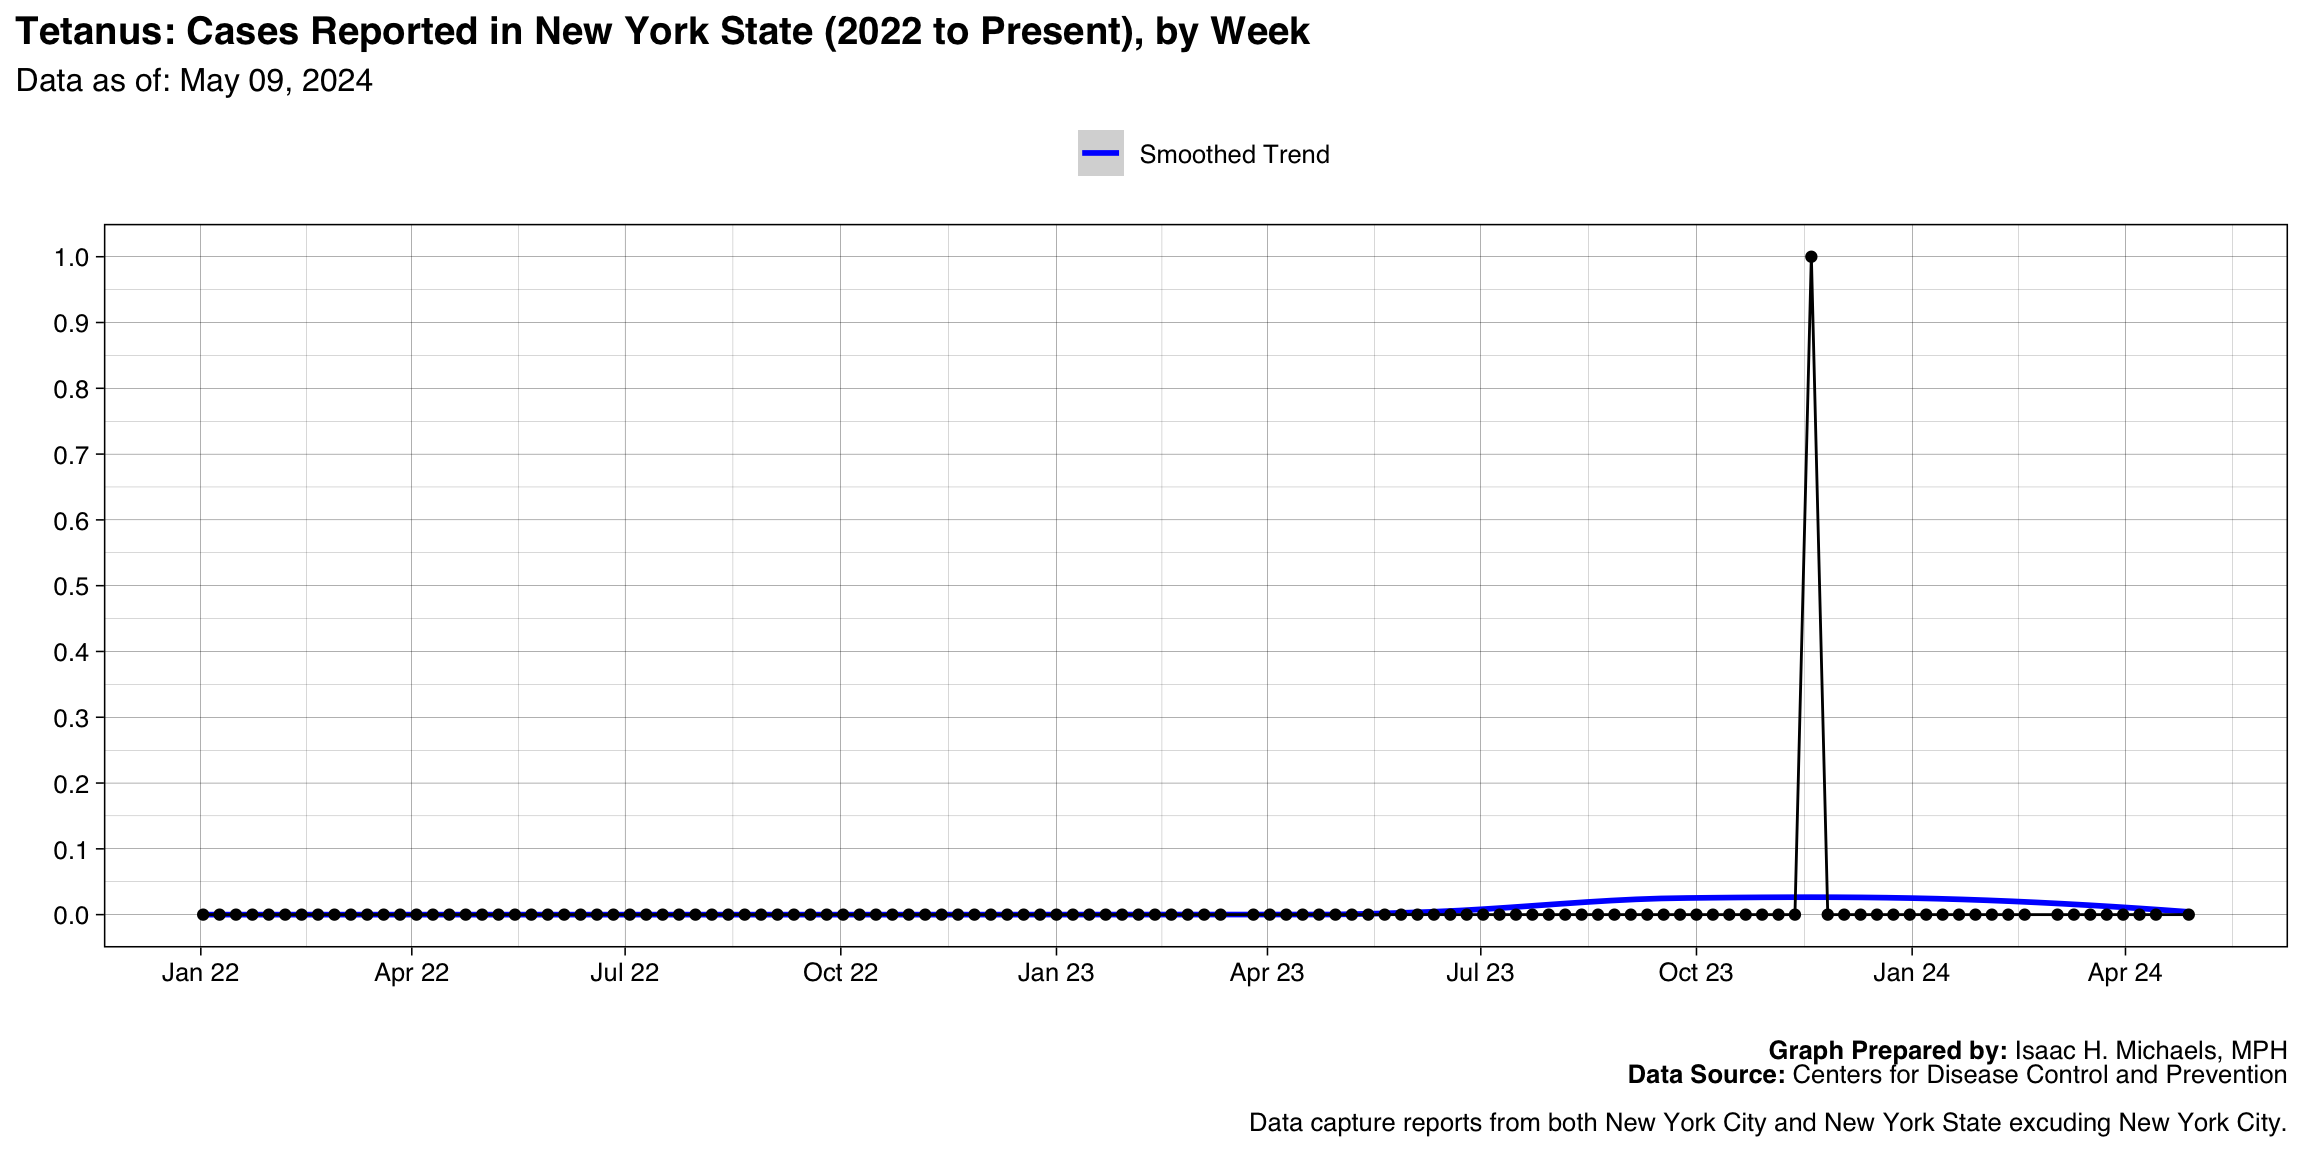
Tetanus
Graph Prepared By: Isaac H. Michaels, MPH
Death Data Source: U.S. Centers for Disease Control and Prevention