- Welcome
- Maps
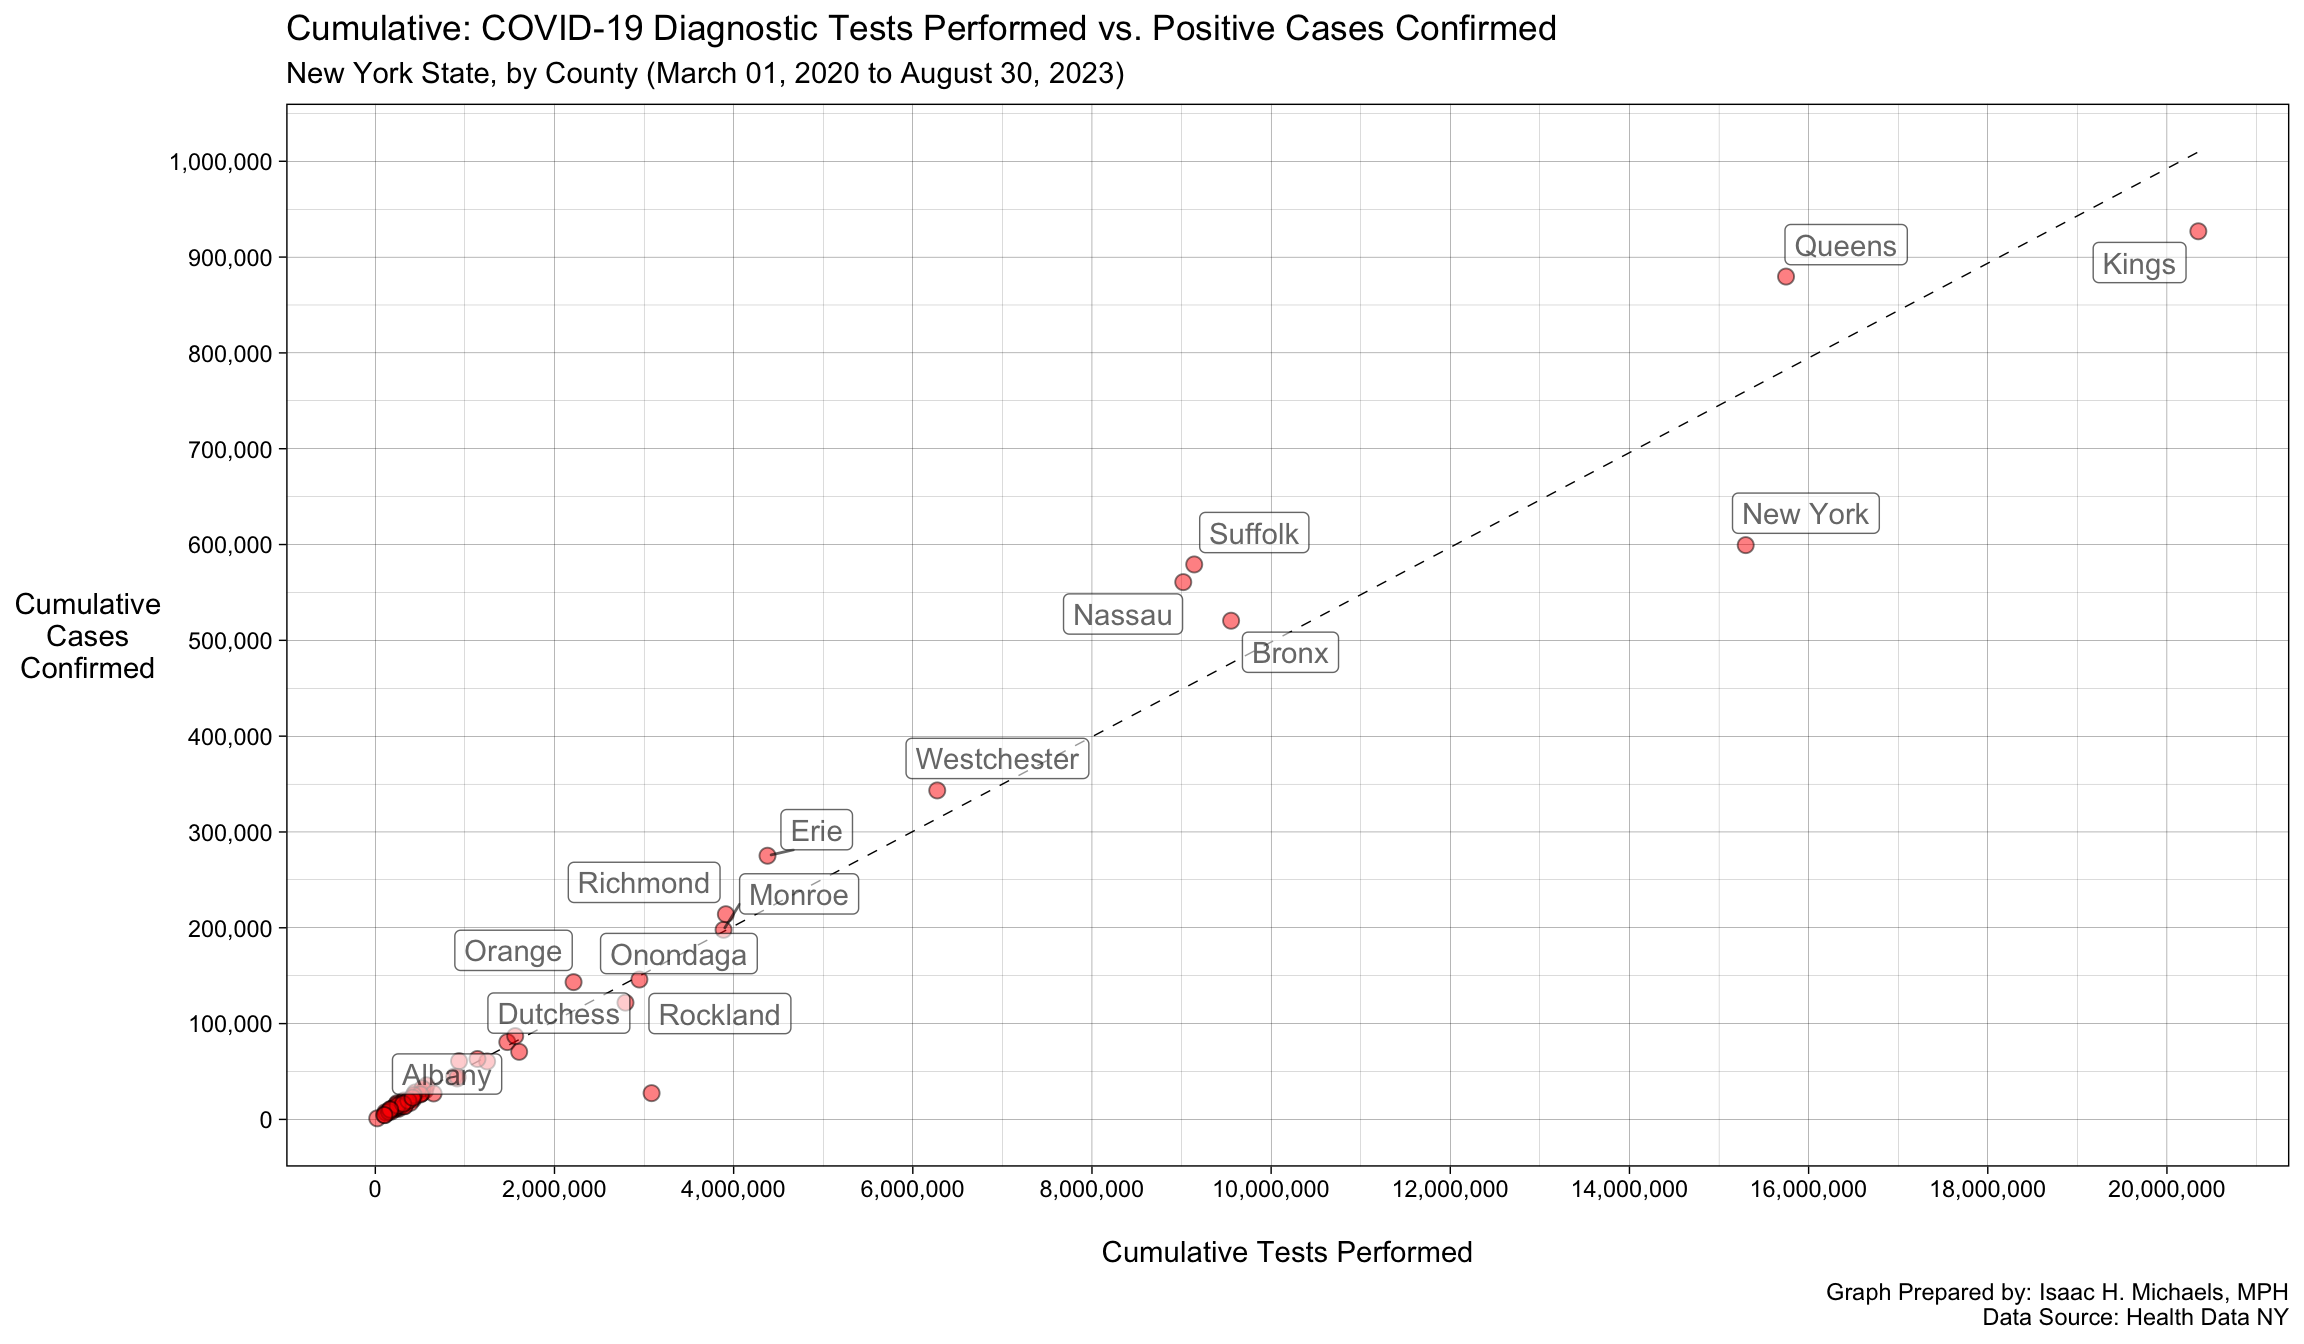
- Cumulative Indicators
- Diagnostic Tests, Hospitalizations, and Deaths (arrayed panels)
- Diagnostic Tests Performed vs. COVID-19 Cases Confirmed, by County
- Deaths
- Cumulative Deaths, by Select Causes
- COVID-19 Deaths, by County
- COVID-19 Deaths as Percentages of All Deaths
- COVID-19 Deaths by Sex
- COVID-19 Deaths by Age Group
- COVID-19 Deaths by Sex by Age Group
- COVID-19 Deaths vs. Population Distribution, by Race/Ethnicity Groups
- COVID-19 Deaths, by Place of Death
- Excess Deaths
- COVID-19 Cases and Deaths in Nursing Homes
- COVID-19 Cases in Colleges and Universities
- Immunization
- Trends and Statistics
- Diagnostic Tests, Hospitalizations, and Deaths
- County Transmission Levels
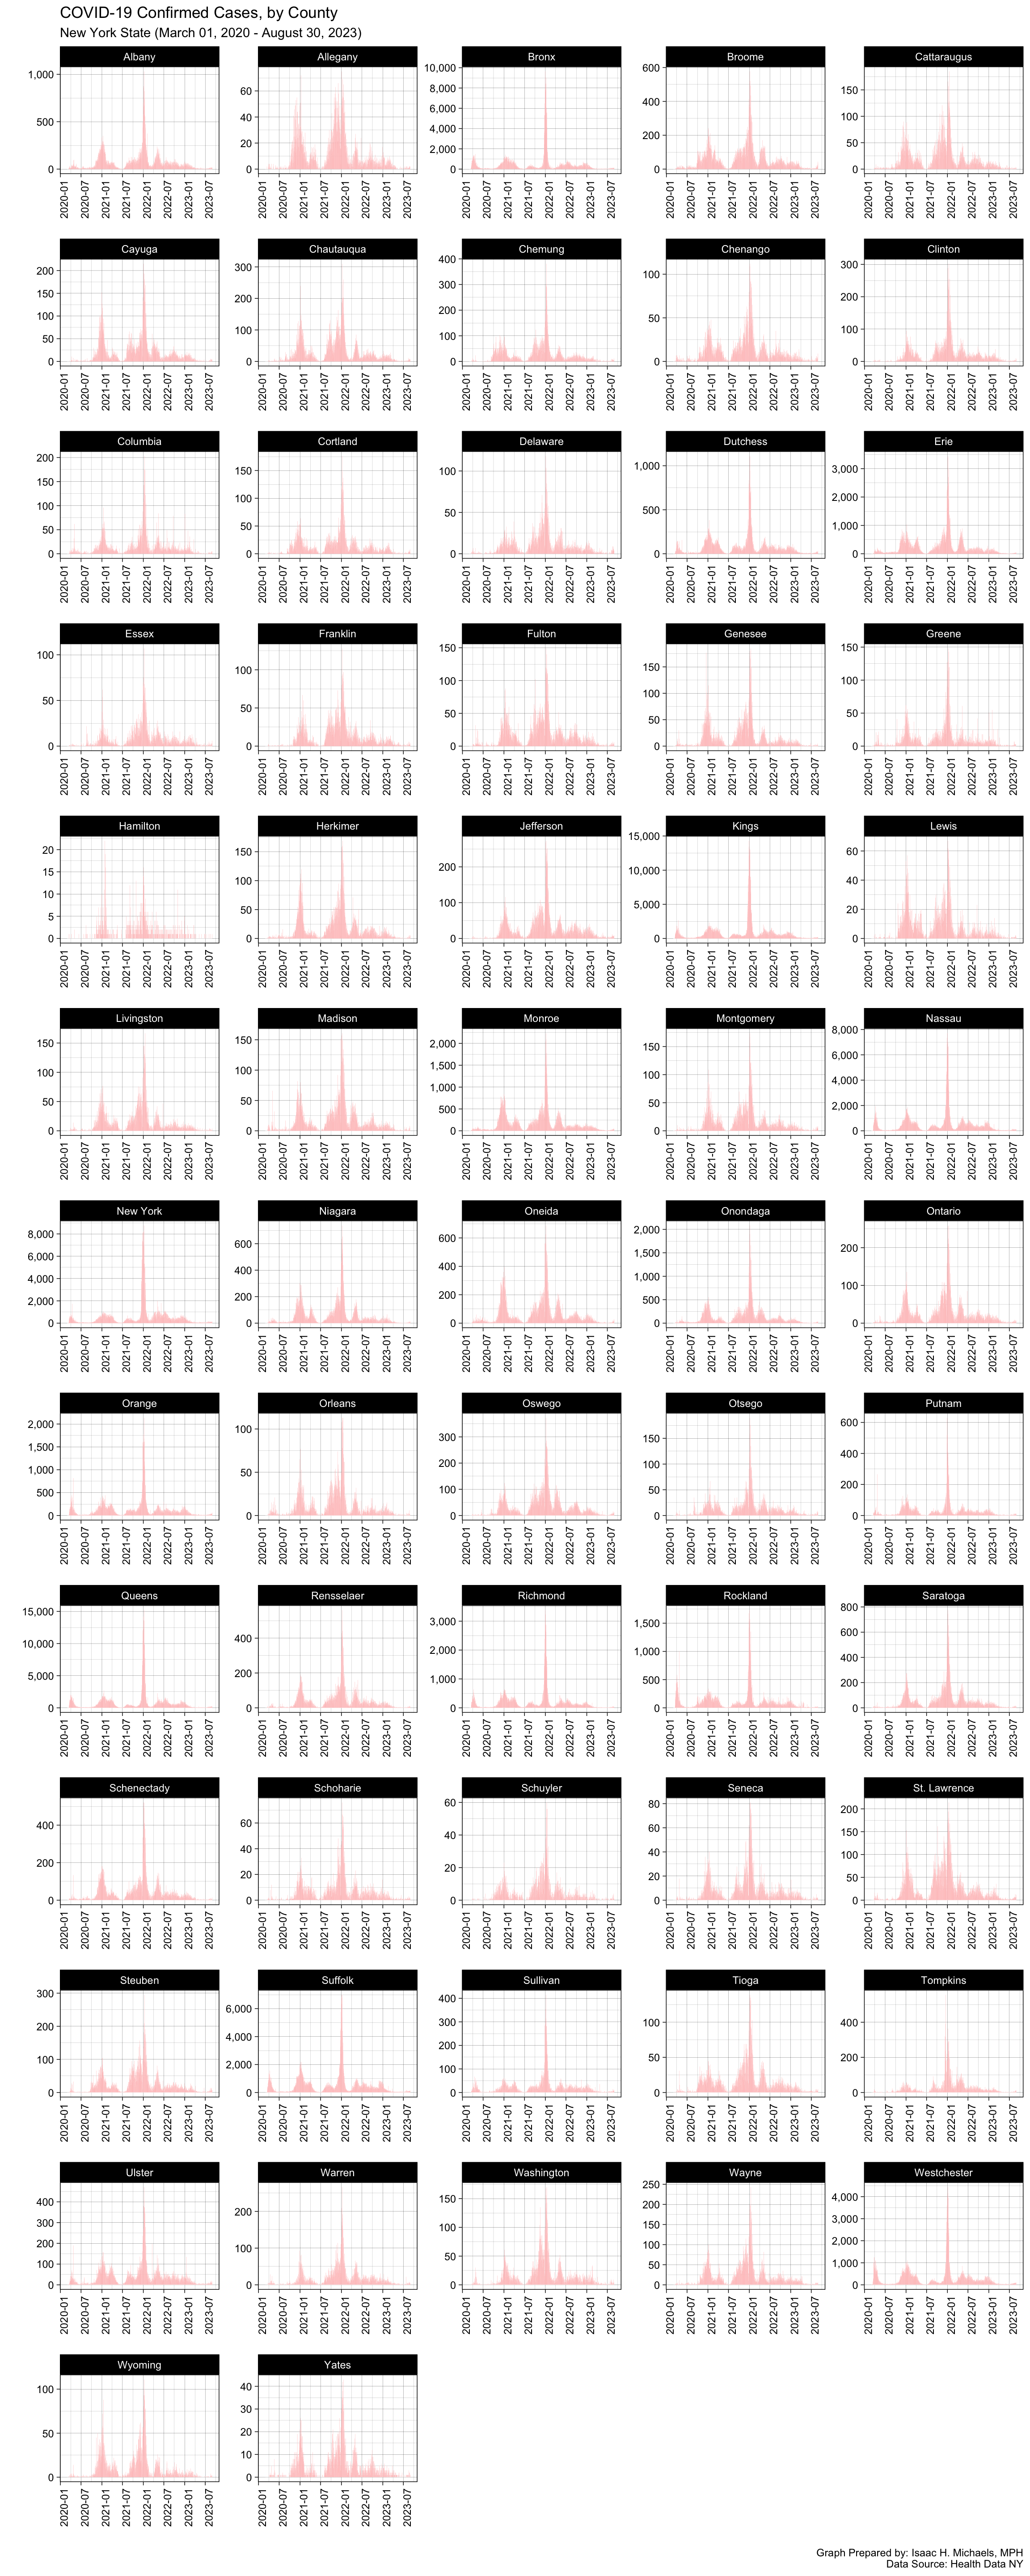
- COVID-19 Confirmed Cases
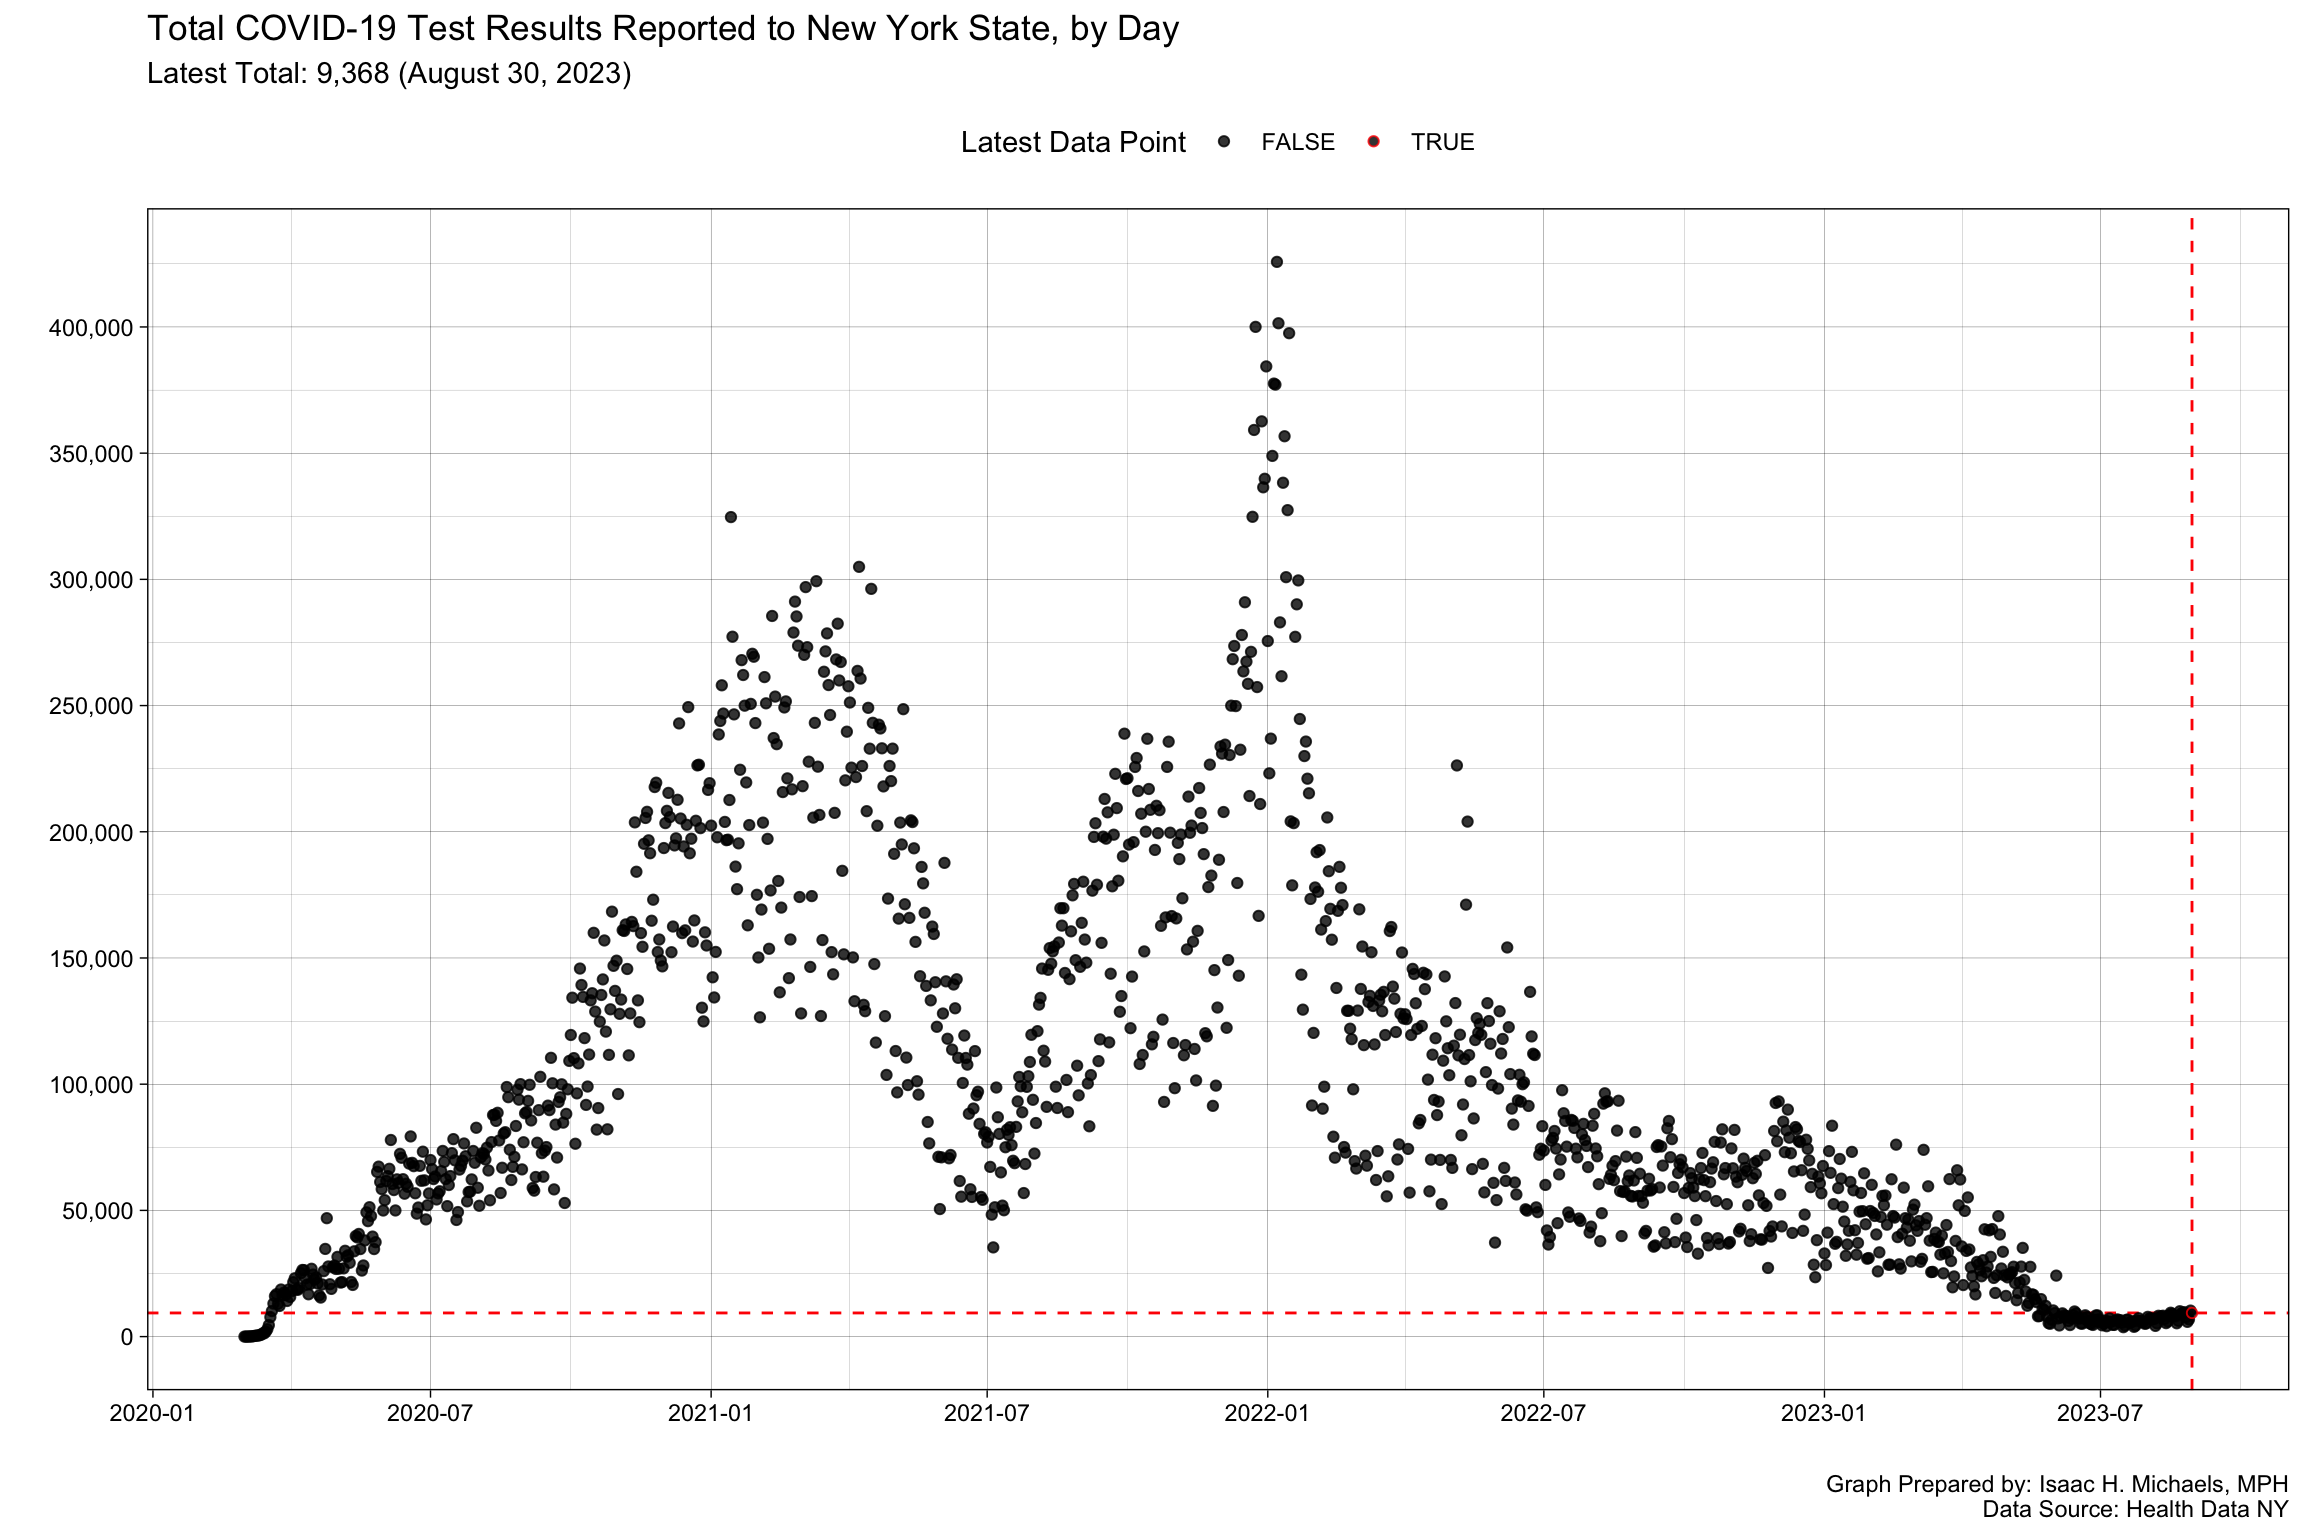
- Diagnostic Tests Performed Per Day
- Test Positivity Rate Trend
- Schools
- COVID-19 Wastewater Monitoring
- SARS-CoV-2 Variant Proportions
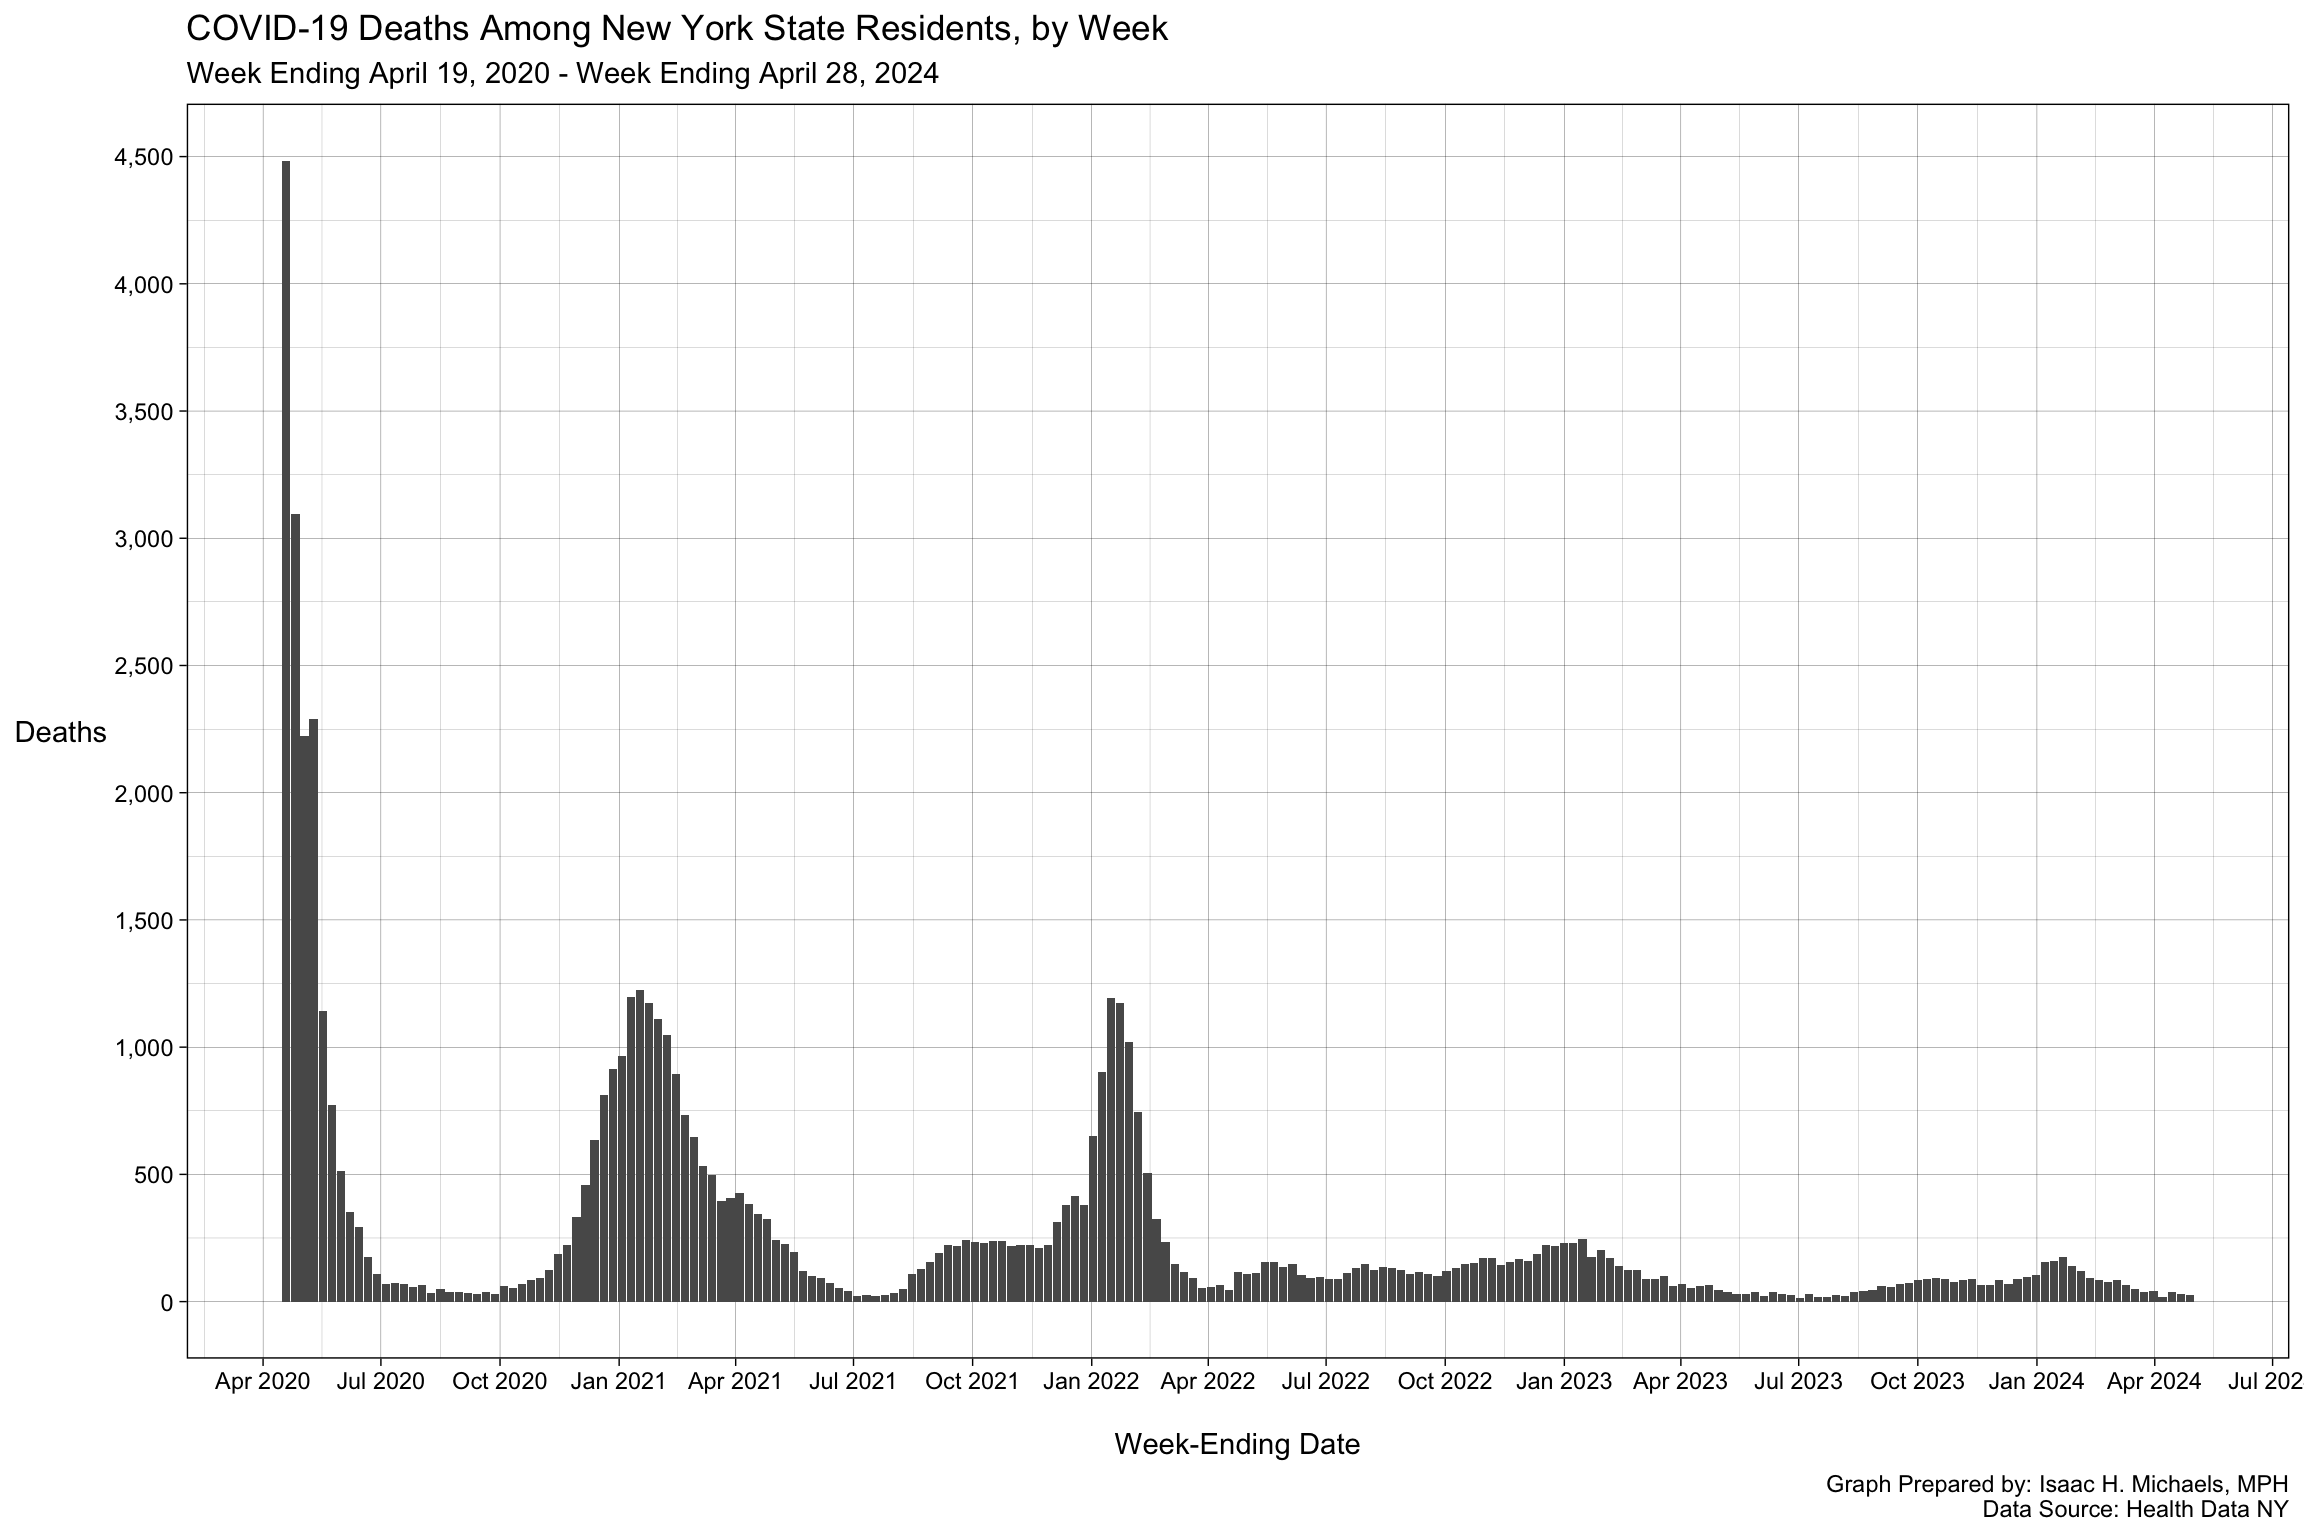
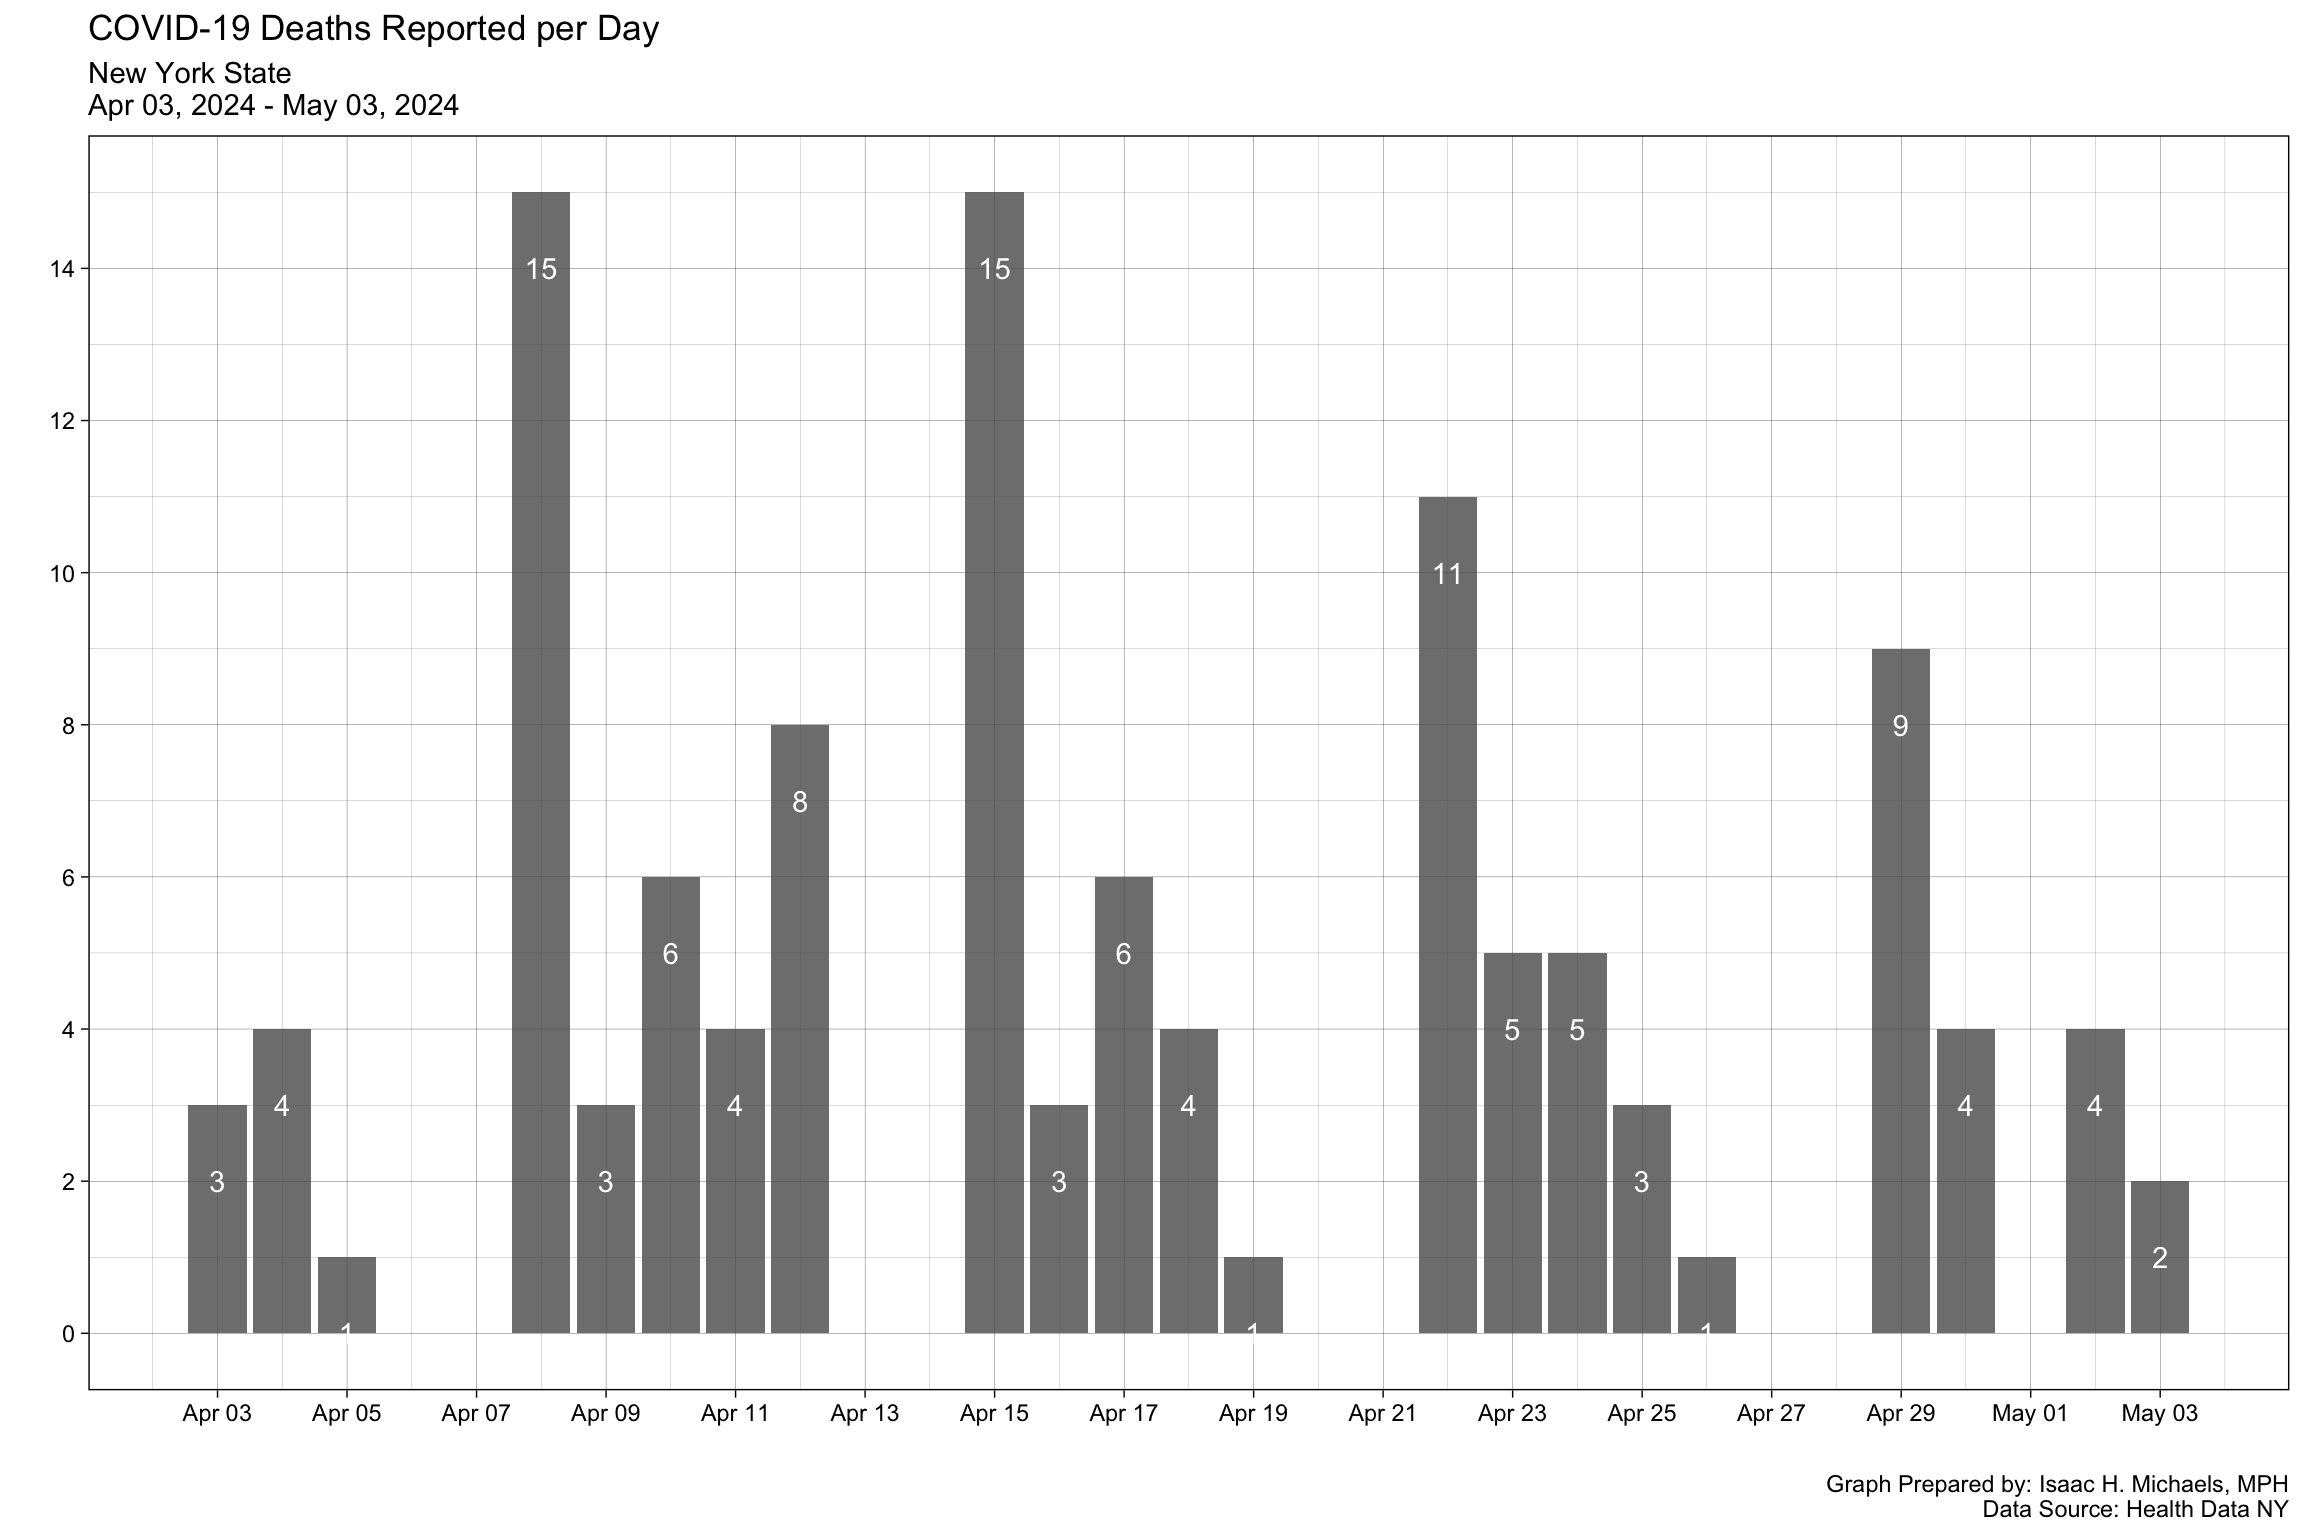
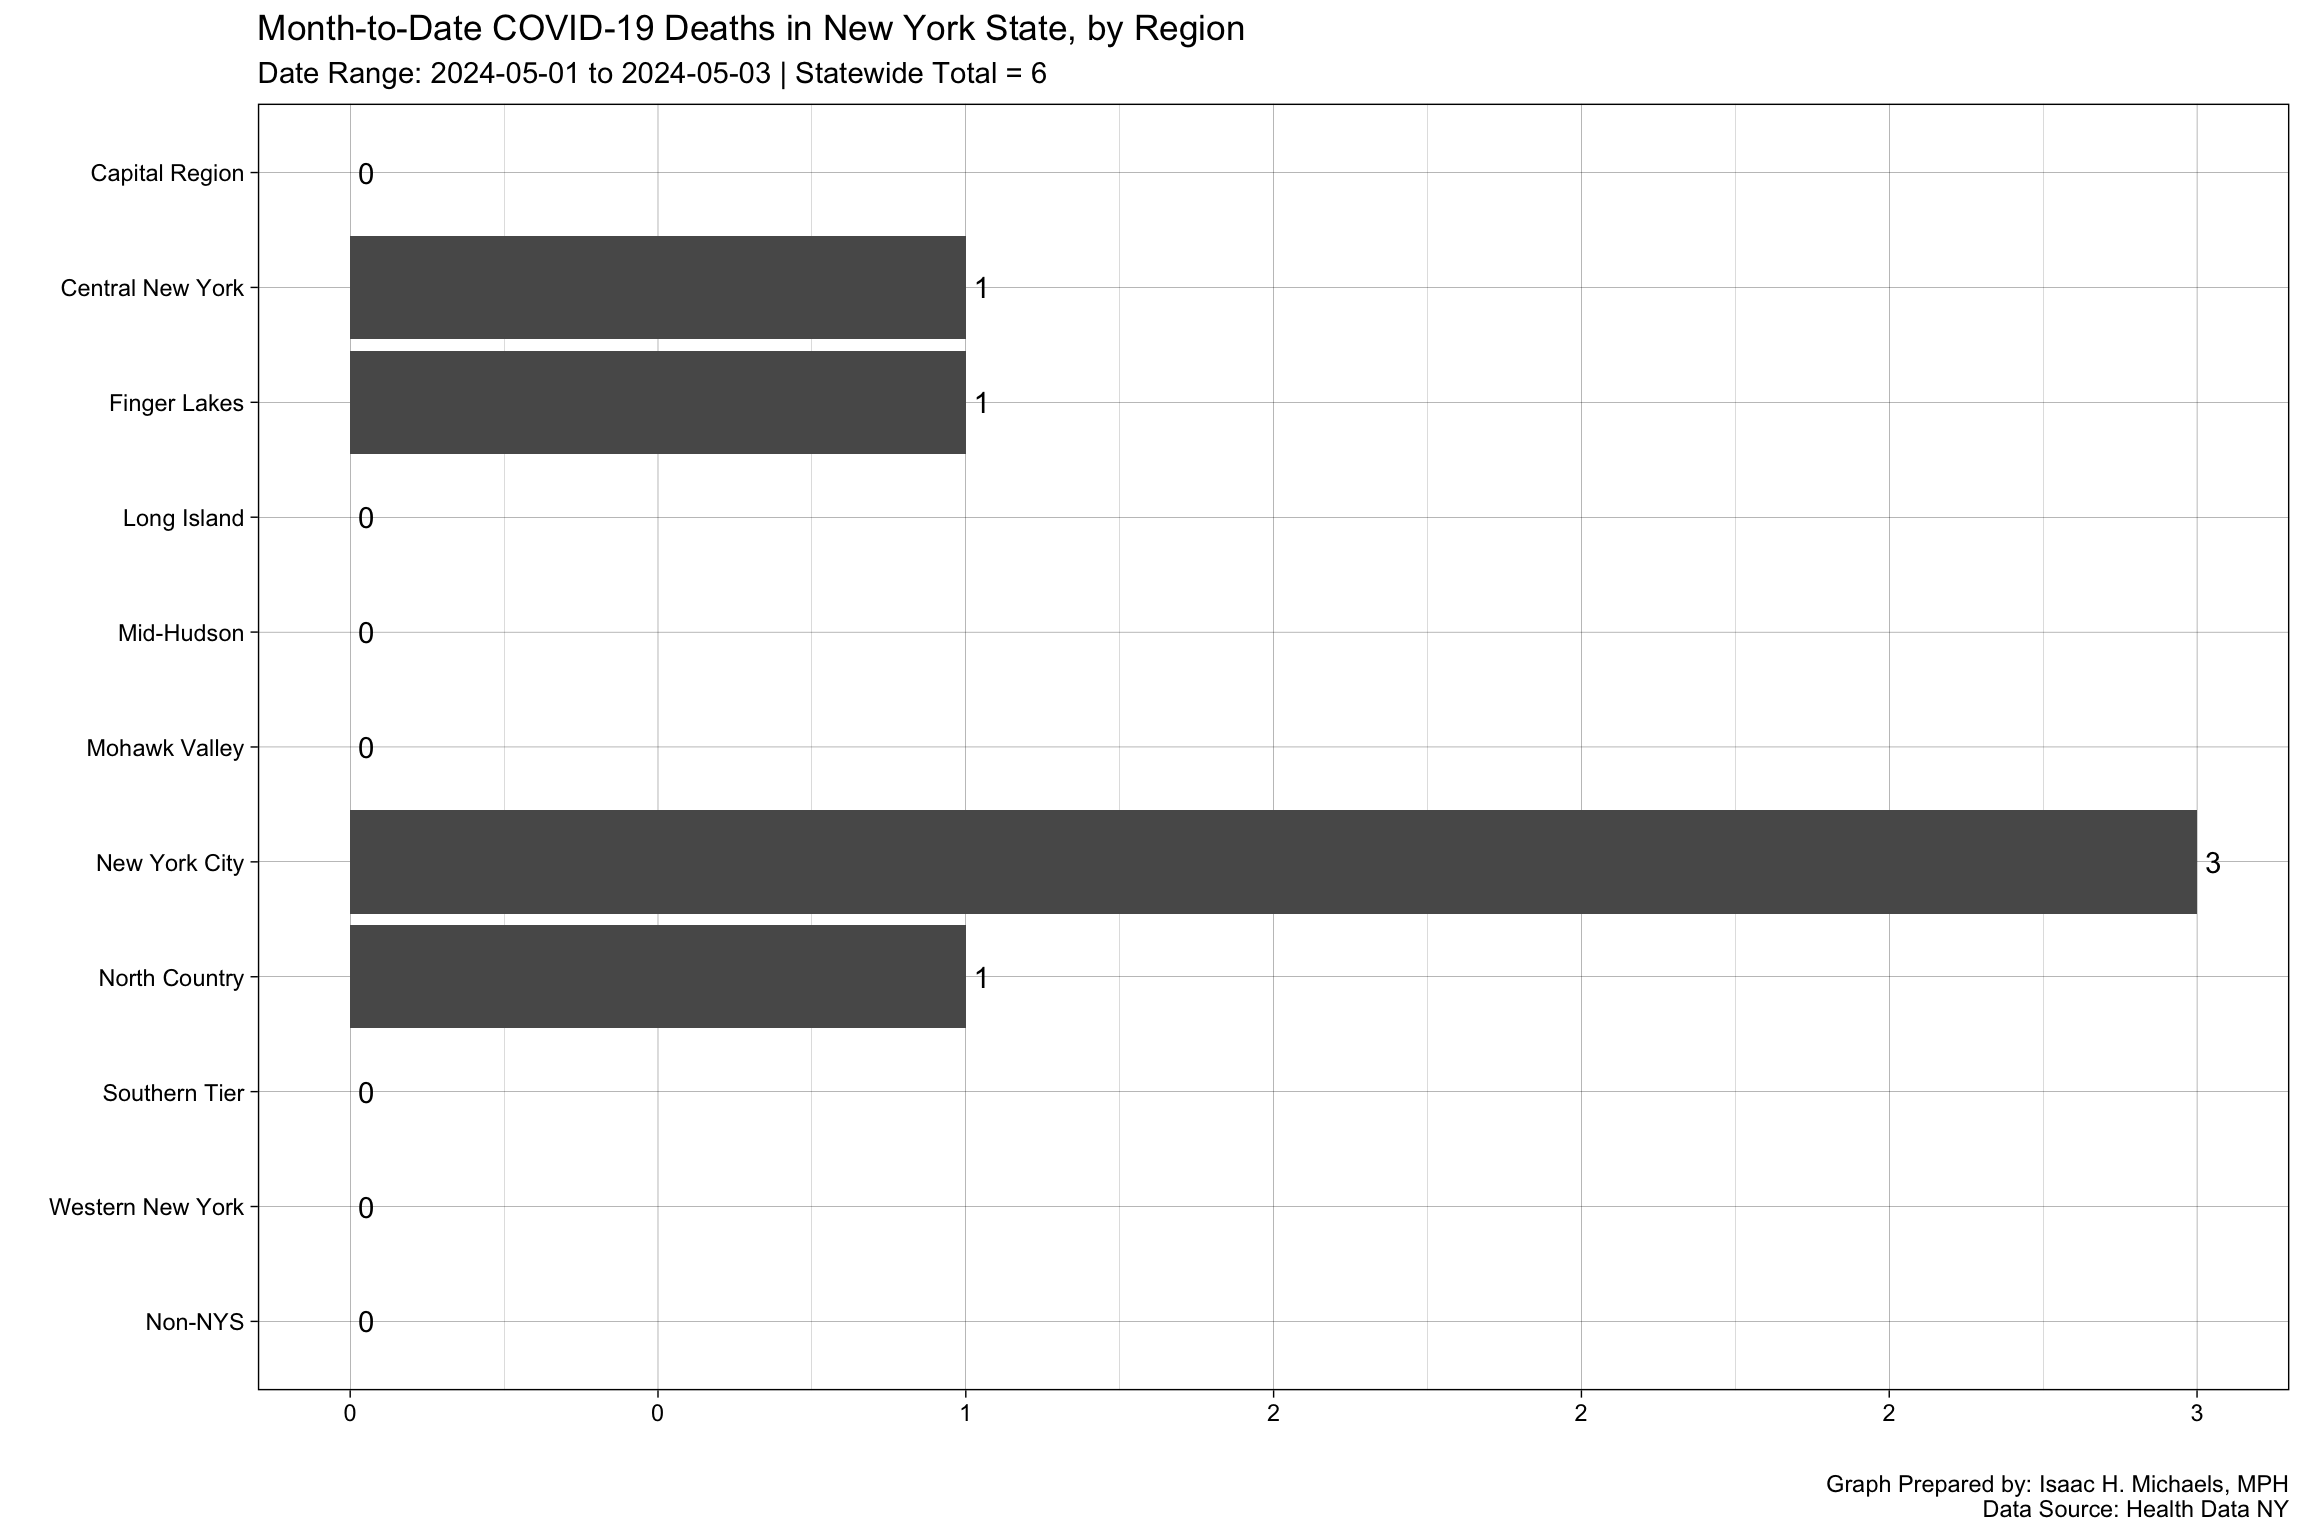
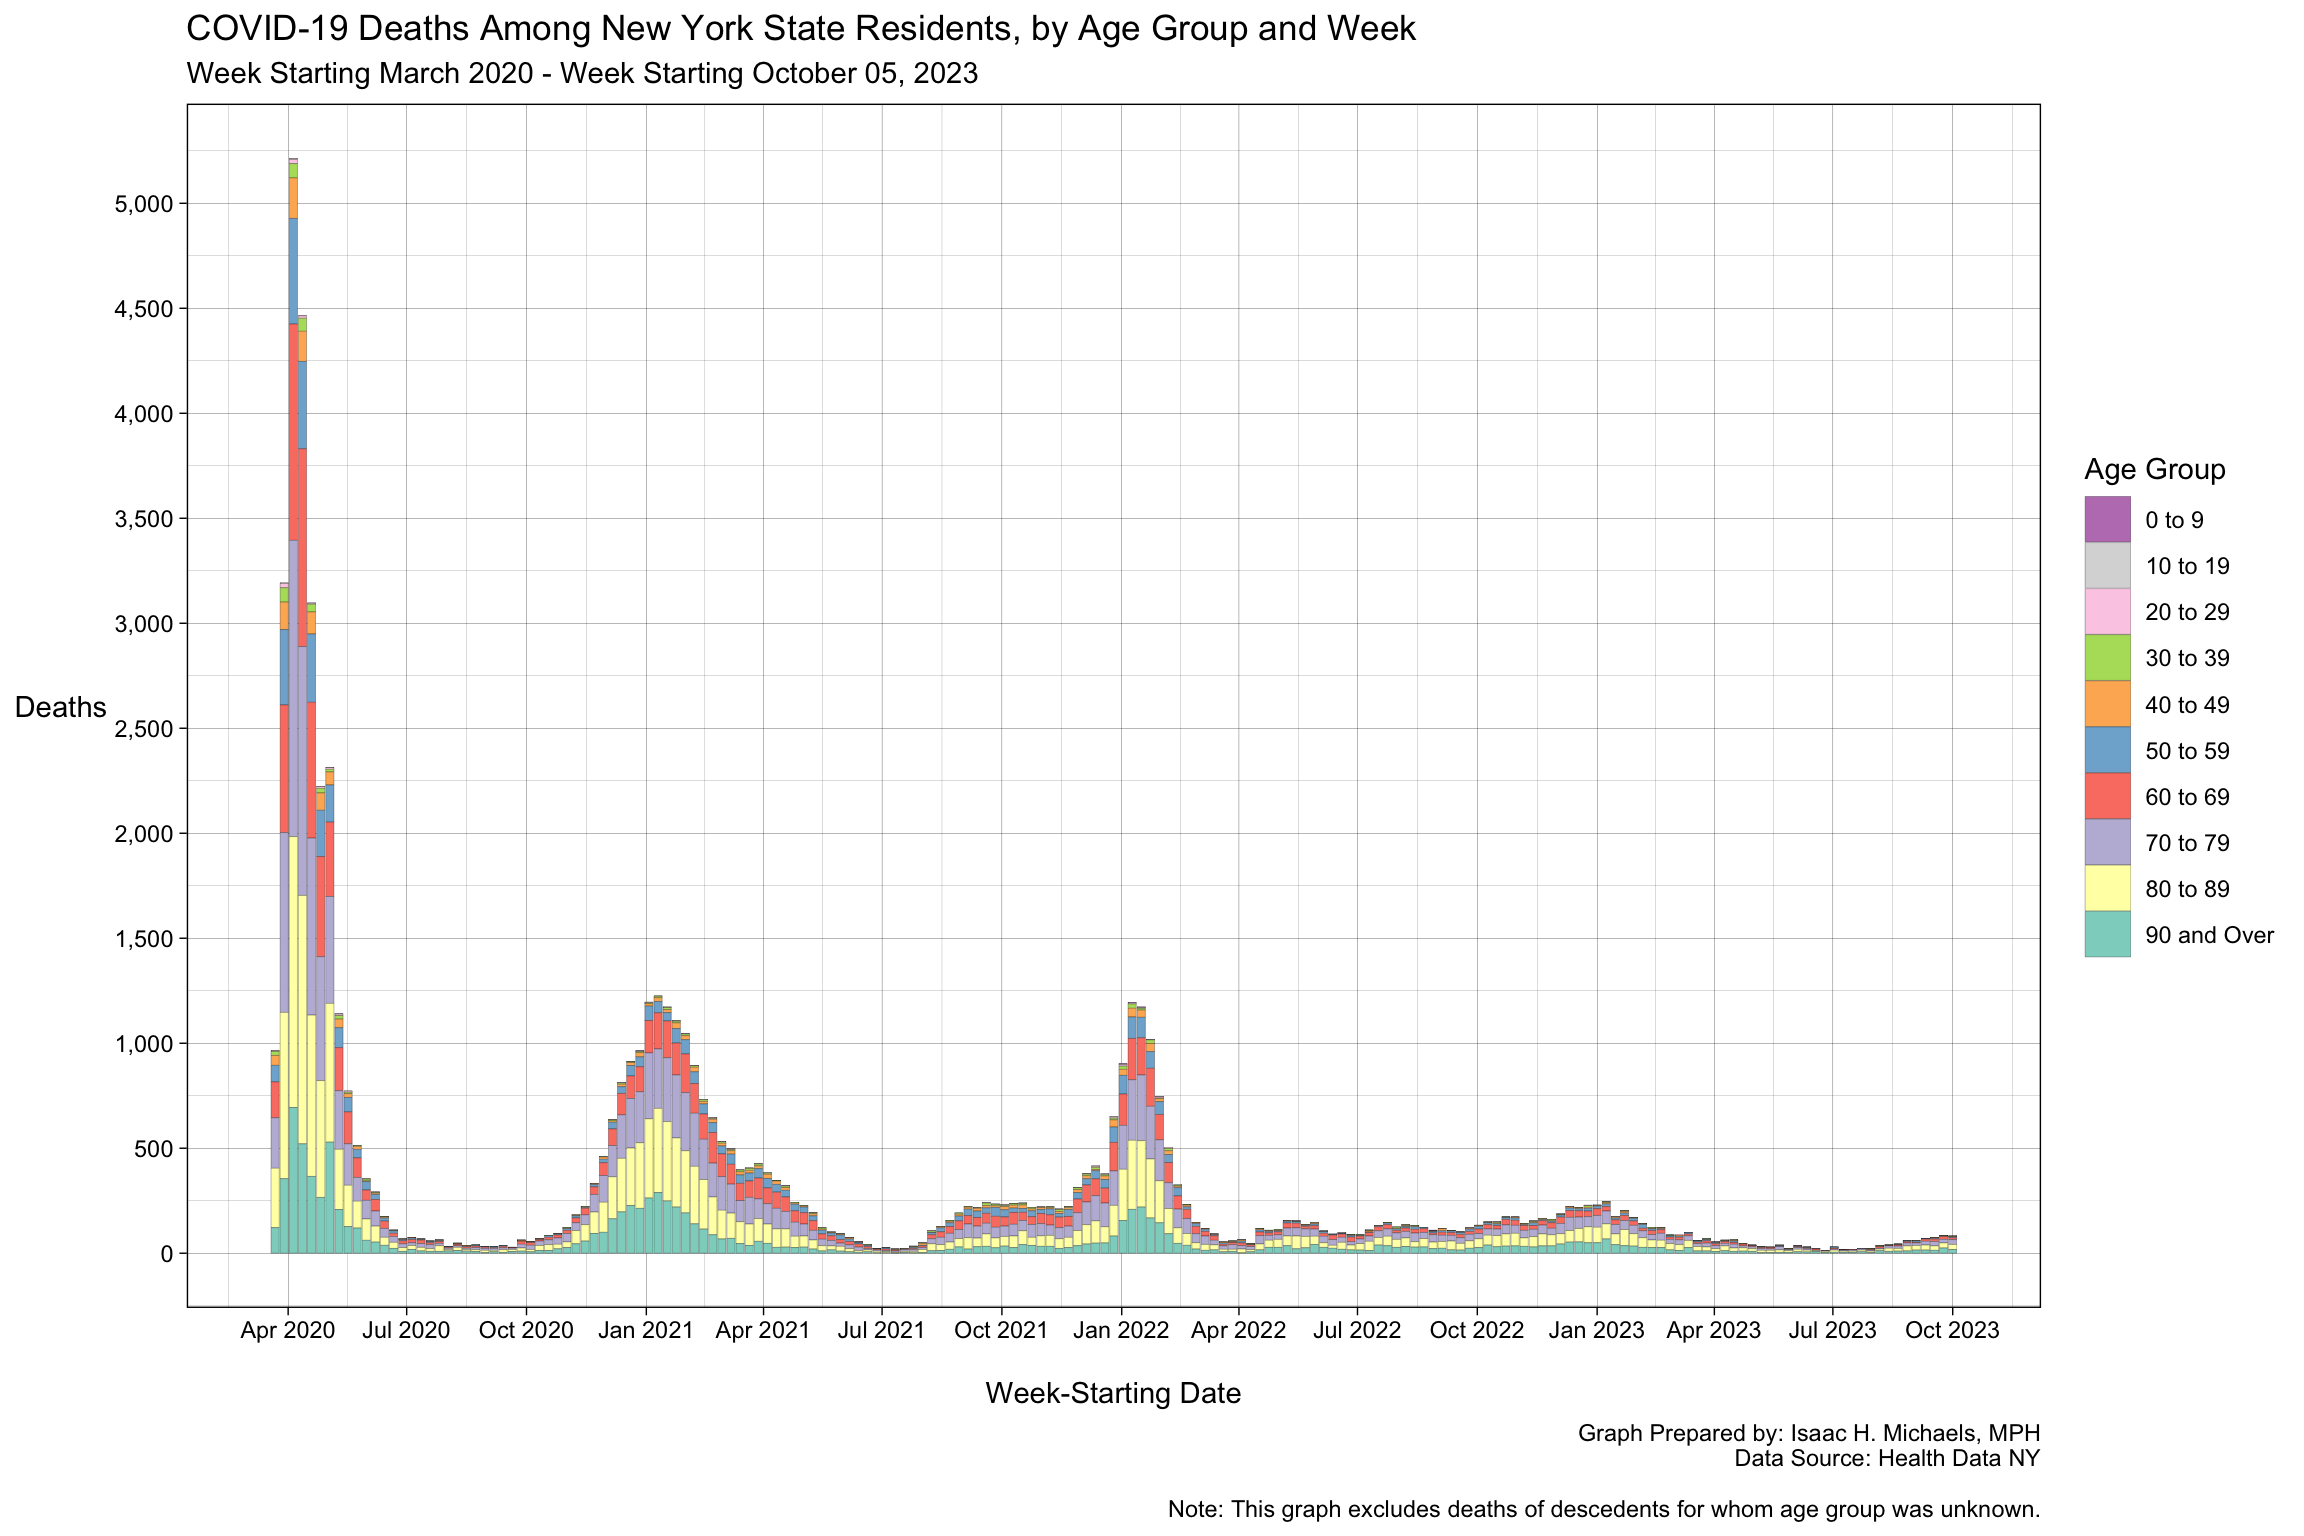
- COVID-19 Deaths
- Excess Deaths
- Hospital Admissions
- Hospitalized Patients
- Hospital Capacity
- Immunization
- Mobility
- Economic Impact
- Policy
- Data Tables
- Academic Literature on COVID-19 and New York
Published: March 17, 2020
Updated: October 21, 2024 at 05:48PM
Welcome
Welcome to this data tracker on COVID-19 in New York State and New York City. Here, you will find a collection of data related to COVID-19, including testing, fatalities, hospitalizations, vaccinations, and more. These data sources provide valuable insights into the impact of the pandemic in various locations and demographics.
Data Overview
The data presented on this page come from a variety of sources, including official government agencies, healthcare facilities, and research institutions. The primary goal of publishing these datasets is to provide timely information about the spread of the disease and its impact on public health. The data are updated regularly to ensure the most up-to-date information is available.
How to Use These Data
To navigate through the data, you can explore different sections of this page dedicated to specific aspects of the pandemic, such as testing, fatalities, hospitalizations, and vaccinations. Each section contains visualizations and detailed information that can help you understand the trends and patterns related to COVID-19.
You can access the data sources by clicking on the provided links. These sources include official websites, repositories, and platforms where the data are publicly available. By visiting these sources, you can explore the datasets further, access additional information, and verify the accuracy of the data presented on this page.
Why are These Data Important?
The COVID-19 pandemic has had a significant impact on public health and society as a whole. Understanding the data related to testing, fatalities, hospitalizations, and vaccinations is crucial for policymakers, healthcare professionals, researchers, and the general public. These data help us assess the effectiveness of public health measures, identify areas of concern, and make informed decisions to mitigate the impact of the pandemic.
What do These Data Show?
The data on this page provide insights into various aspects of the COVID-19 pandemic. They show the number of tests conducted, the number of positive cases, the distribution of fatalities by county, the hospitalization rates, and the progress of vaccination campaigns. These data can reveal trends, patterns, and disparities in the spread and impact of the virus across different regions and populations.
What do These Data not Show?
While the data presented on this page provide valuable information about the COVID-19 pandemic, it is essential to recognize their limitations. The data might not capture the full extent of the pandemic’s impact. Additionally, the data might be subject to delays, discrepancies, or incomplete reporting, which can affect their accuracy and interpretation.
It is important to recognize that the data sources utilized in these analyses have inherent limitations that may affect the accuracy or scope of the findings. To gain deeper insights into the specific limitations associated with each data source, I invite you to explore the data-source links that accompany each section of this page. These links provide access to comprehensive documentation that outlines the nuances and constraints of each respective data set.
Implications for Public Health Practice
The data presented on this website have important implications for public health practice. They can inform decision-making processes, guide resource allocation, and help identify areas that require targeted interventions. By analyzing these data, public health officials can develop strategies to mitigate the spread of the virus, protect vulnerable populations, and promote vaccination efforts.
Please note that while I strive to provide accurate and up-to-date information, the data presented on this website are subject to change as new data become available. It is always recommended to consult official sources and trusted authorities for the latest information on the COVID-19 pandemic.
Thank you for visiting my website, and I hope you find the data and information provided here informative and helpful.
Maps
Interactive
New York State by County
COVID-19 Diagnostic Testing
Date: August 30, 2023
Map Prepared By: Isaac H. Michaels, MPH
COVID Data Source: Health Data NY
Formulas:
Test Positivity Rate = Positive Tests / Total Tests
Positive Rate = Positive Tests / Population * 1,000
Testing Rate = Total Tests / Population * 1,000
Static
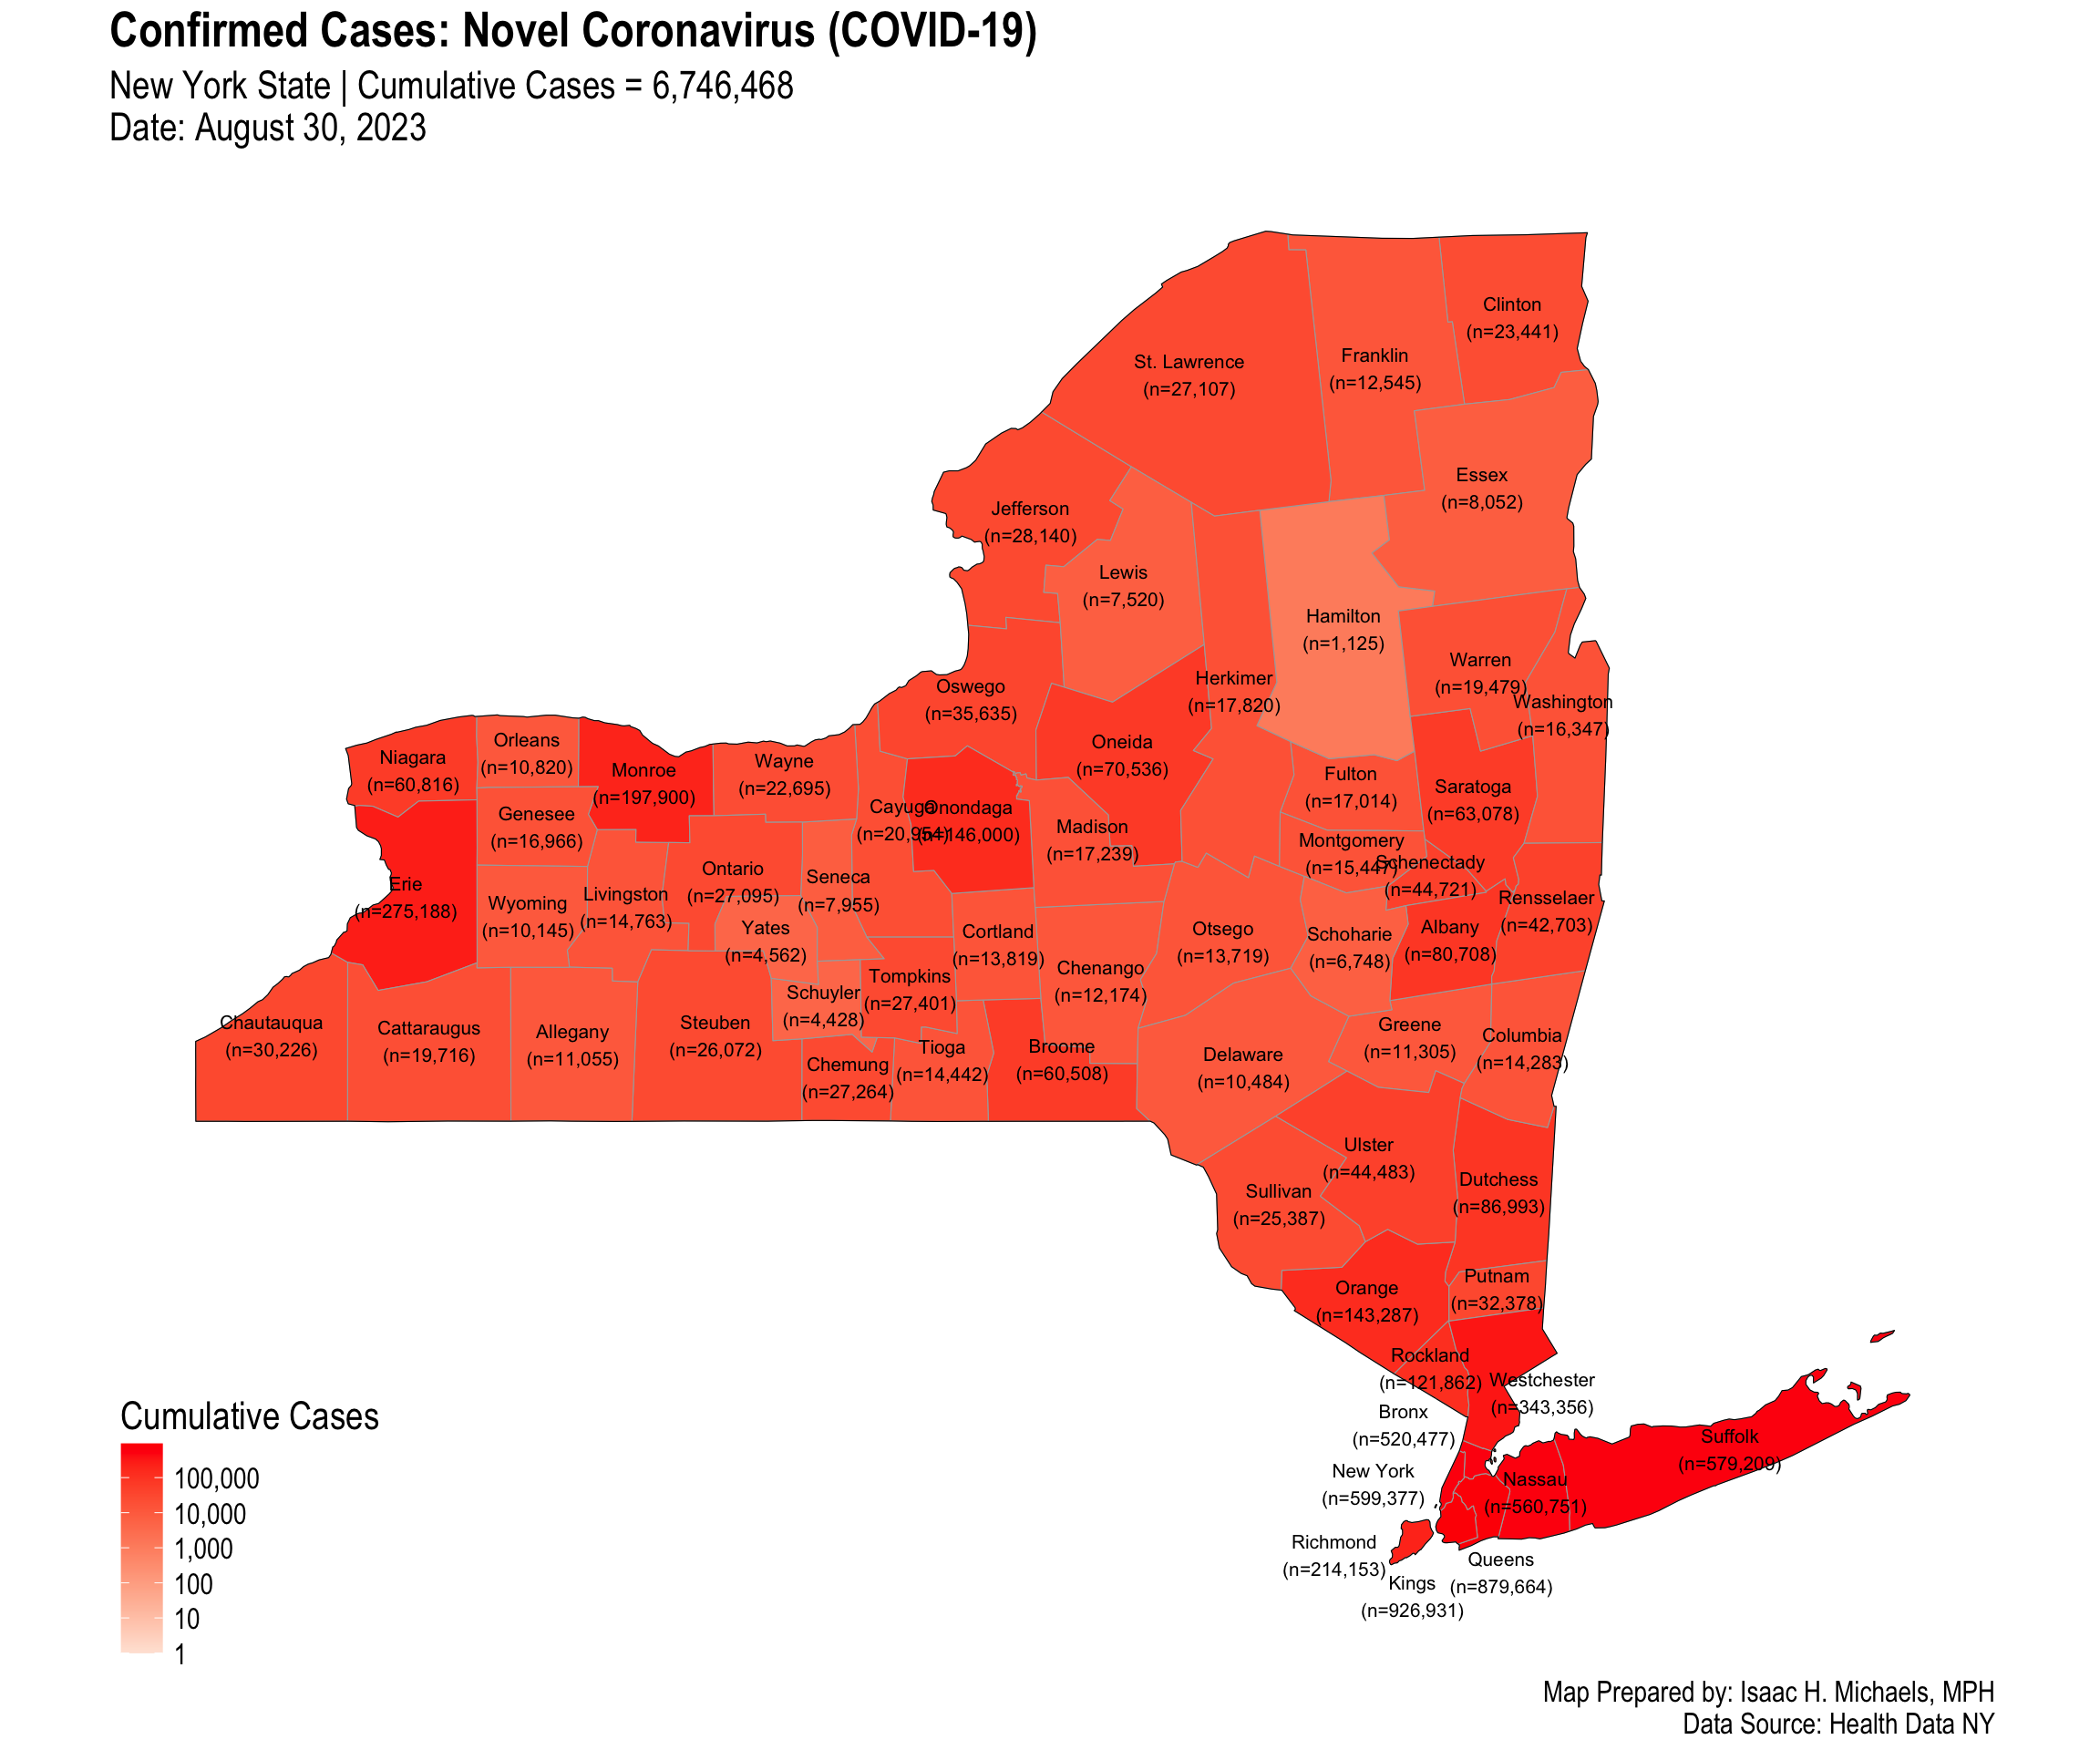
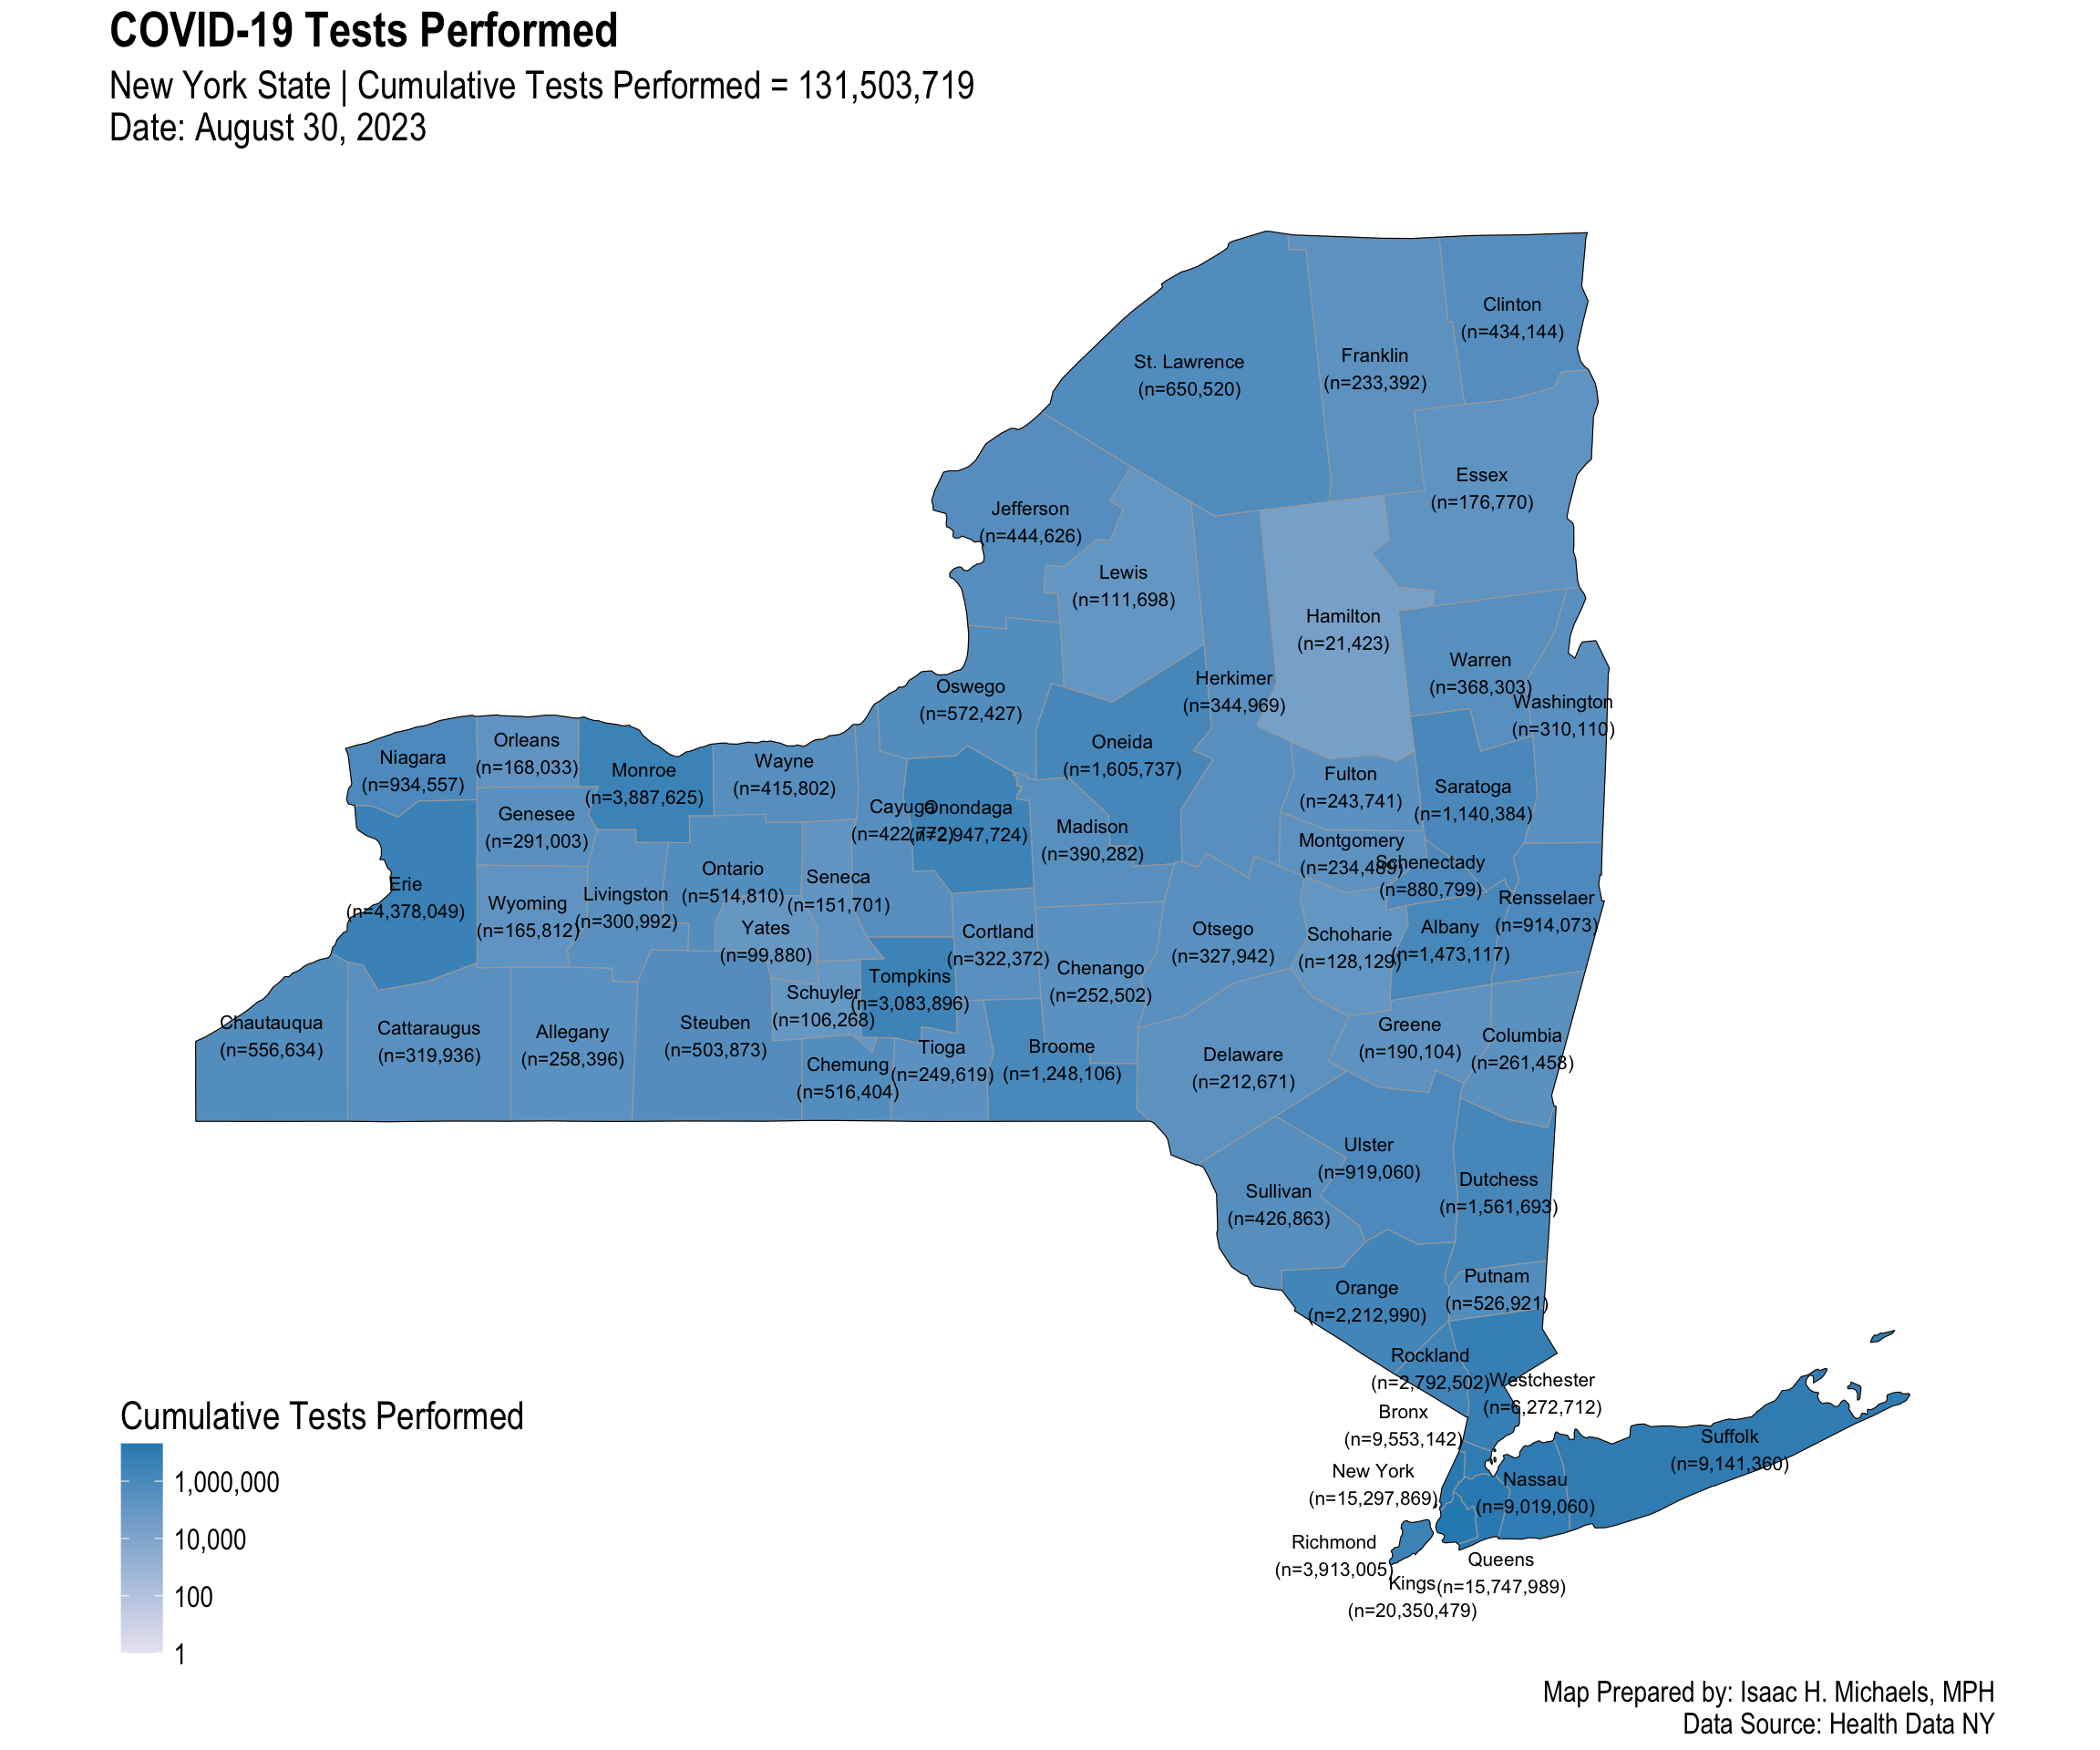
Confirmed Cases and Diagnostic Tests Performed, per Capita
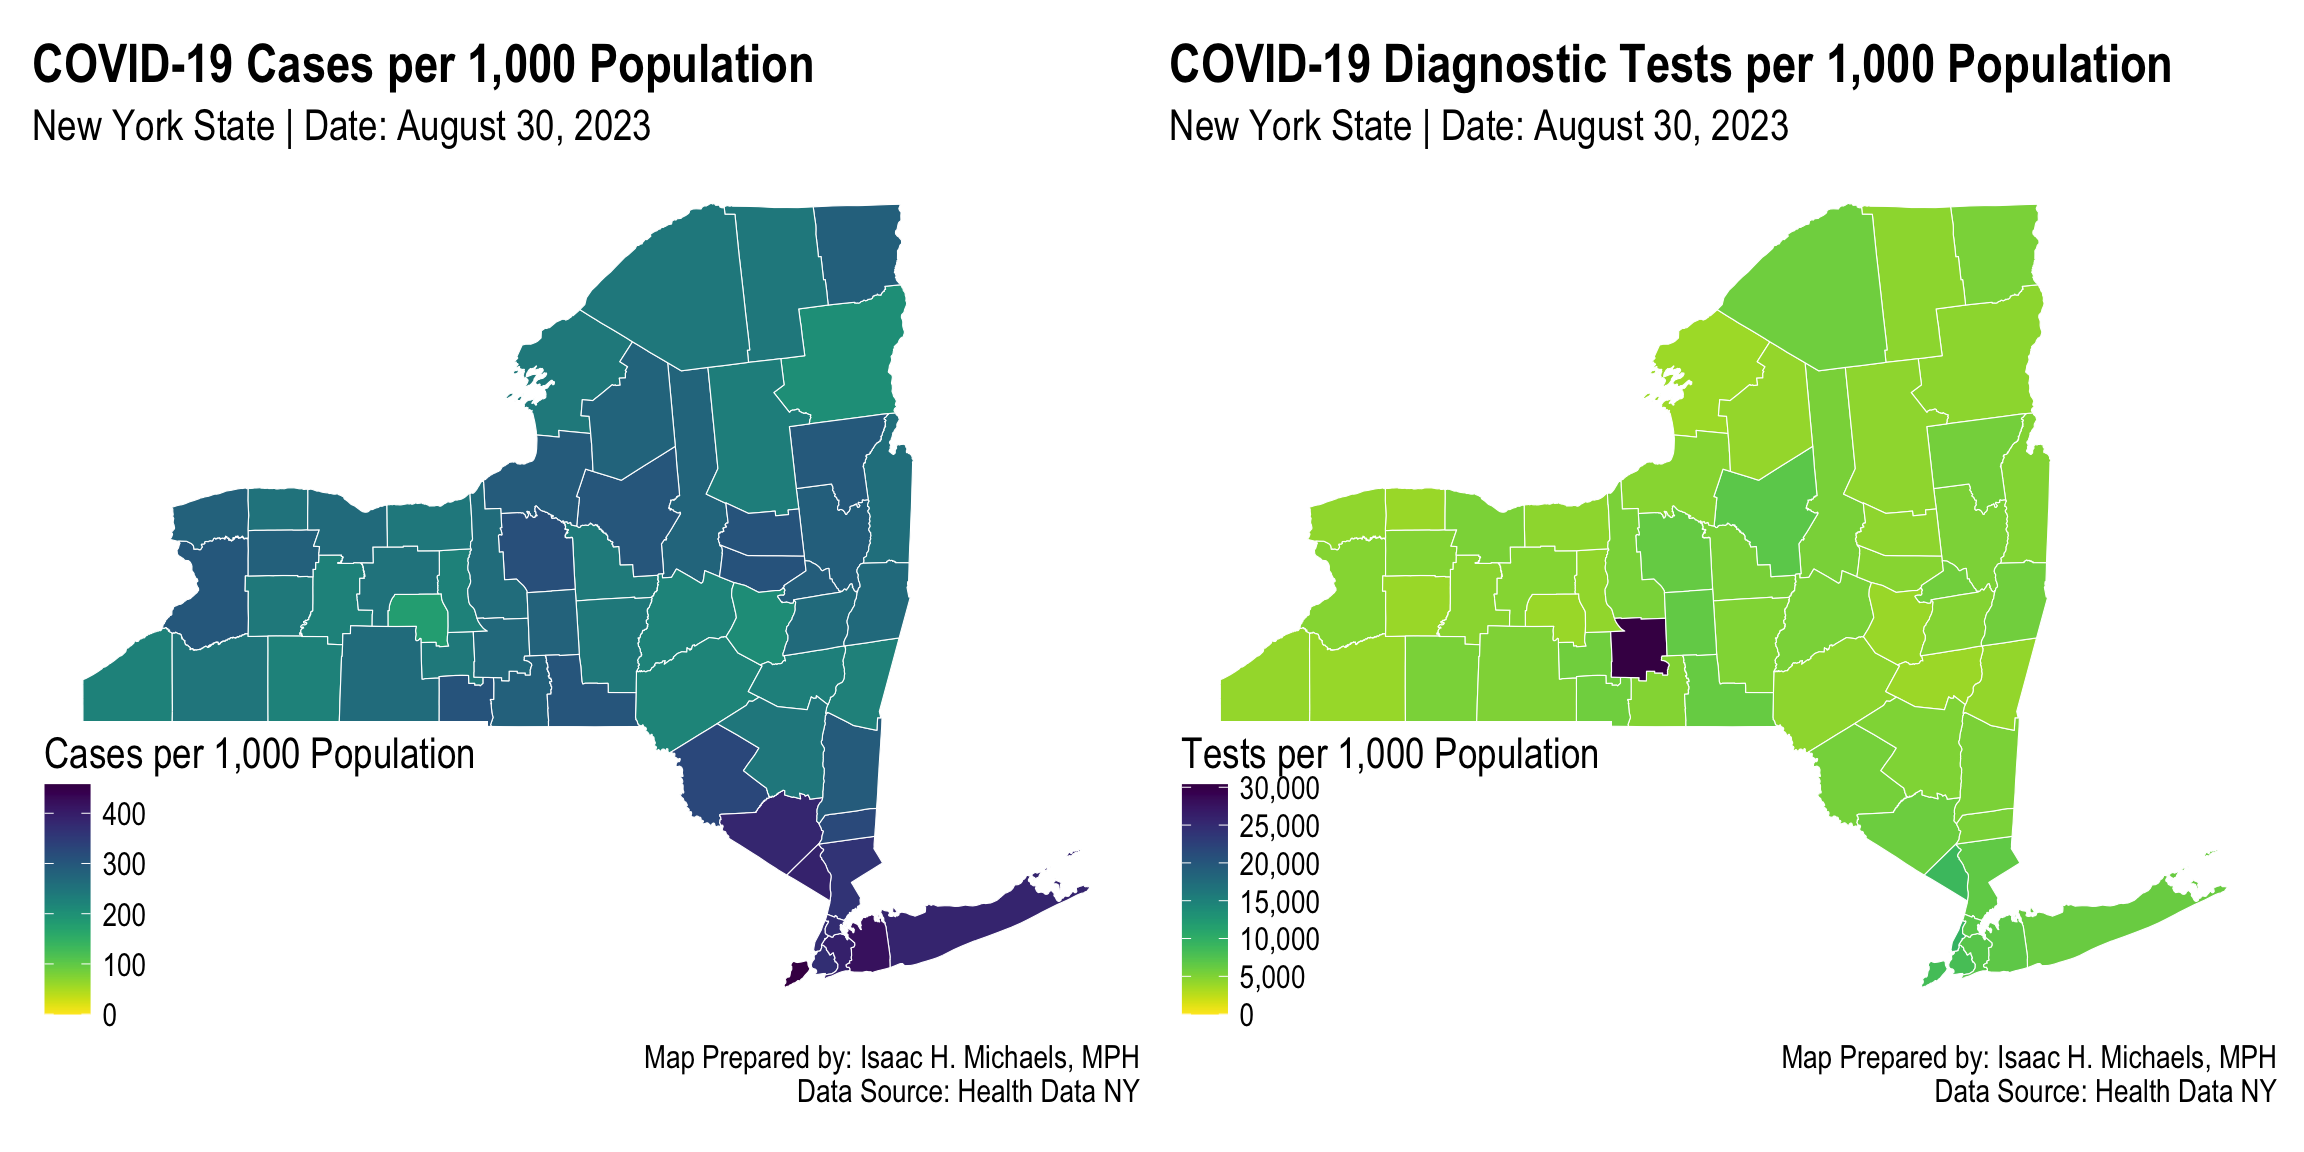
Maps Prepared By: Isaac H. Michaels, MPH
Data Source: Health Data NY
Cumulative Indicators
Diagnostic Tests, Hospitalizations, and Deaths (arrayed panels)
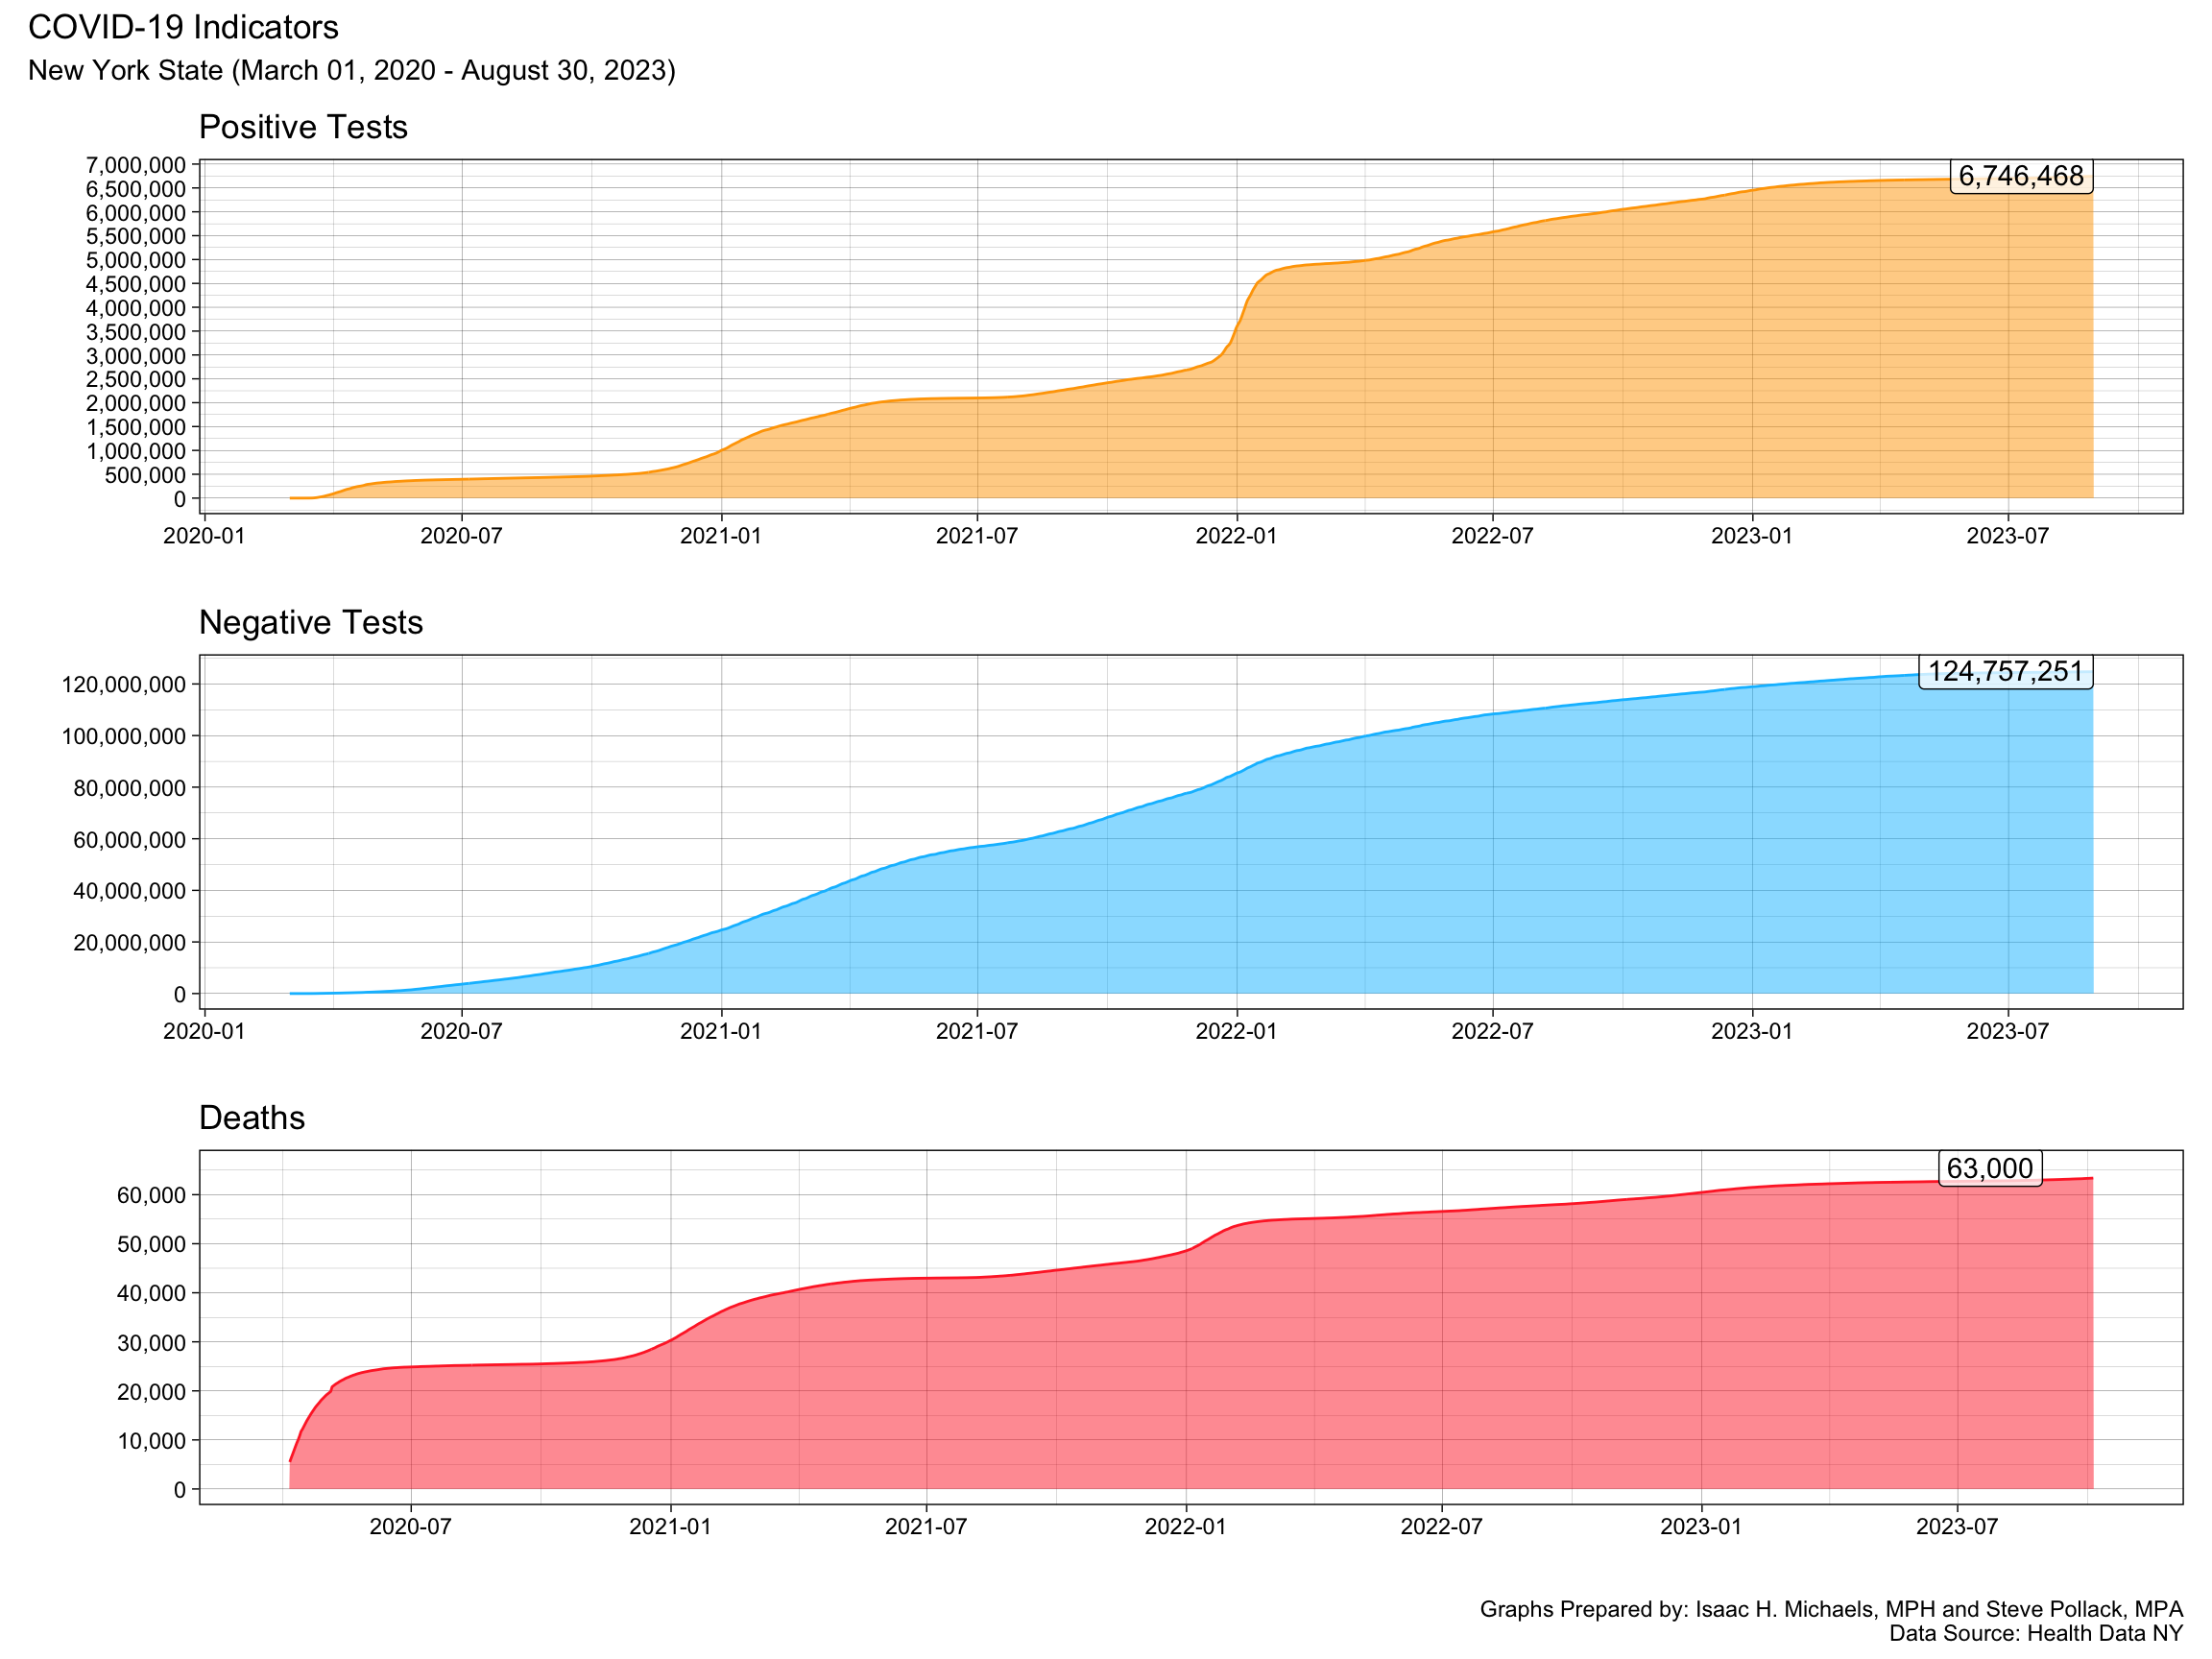
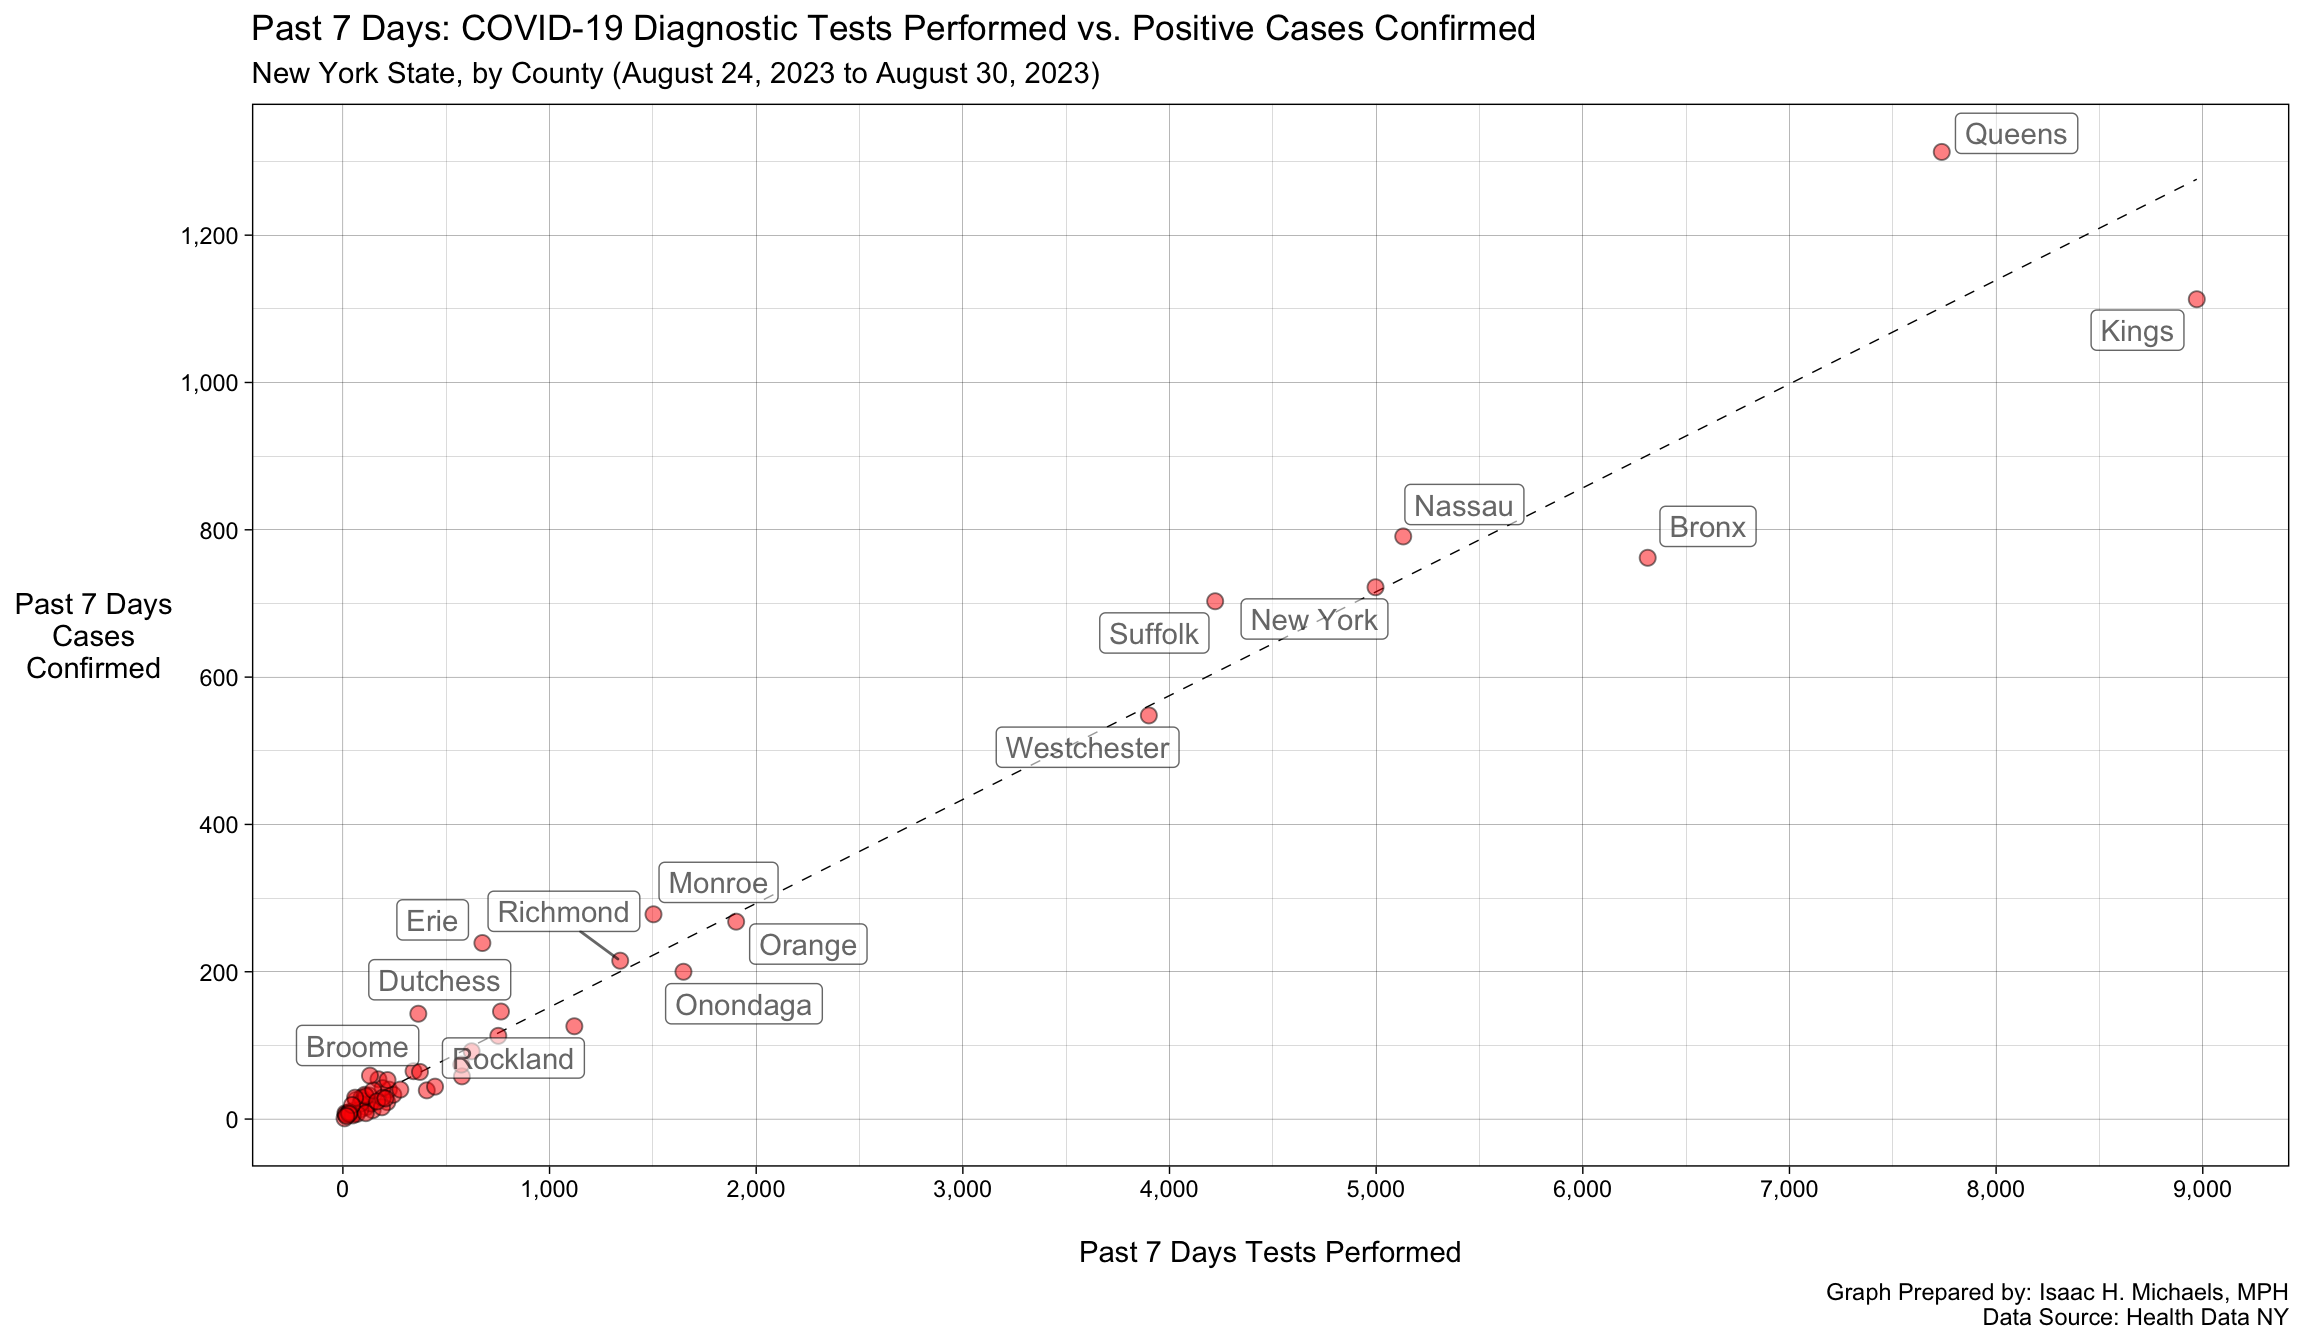
Graphs Prepared by: Isaac H. Michaels, MPH and Steve A. Pollack, MPA
Data Source: Health Data NY (Tests, Deaths)
Diagnostic Tests Performed vs. COVID-19 Cases Confirmed, by County
Deaths
Cumulative Deaths, by Select Causes
Graph Prepared By: Isaac H. Michaels, MPH
Data Source: National Center for Health Statistics
COVID-19 Deaths, by County
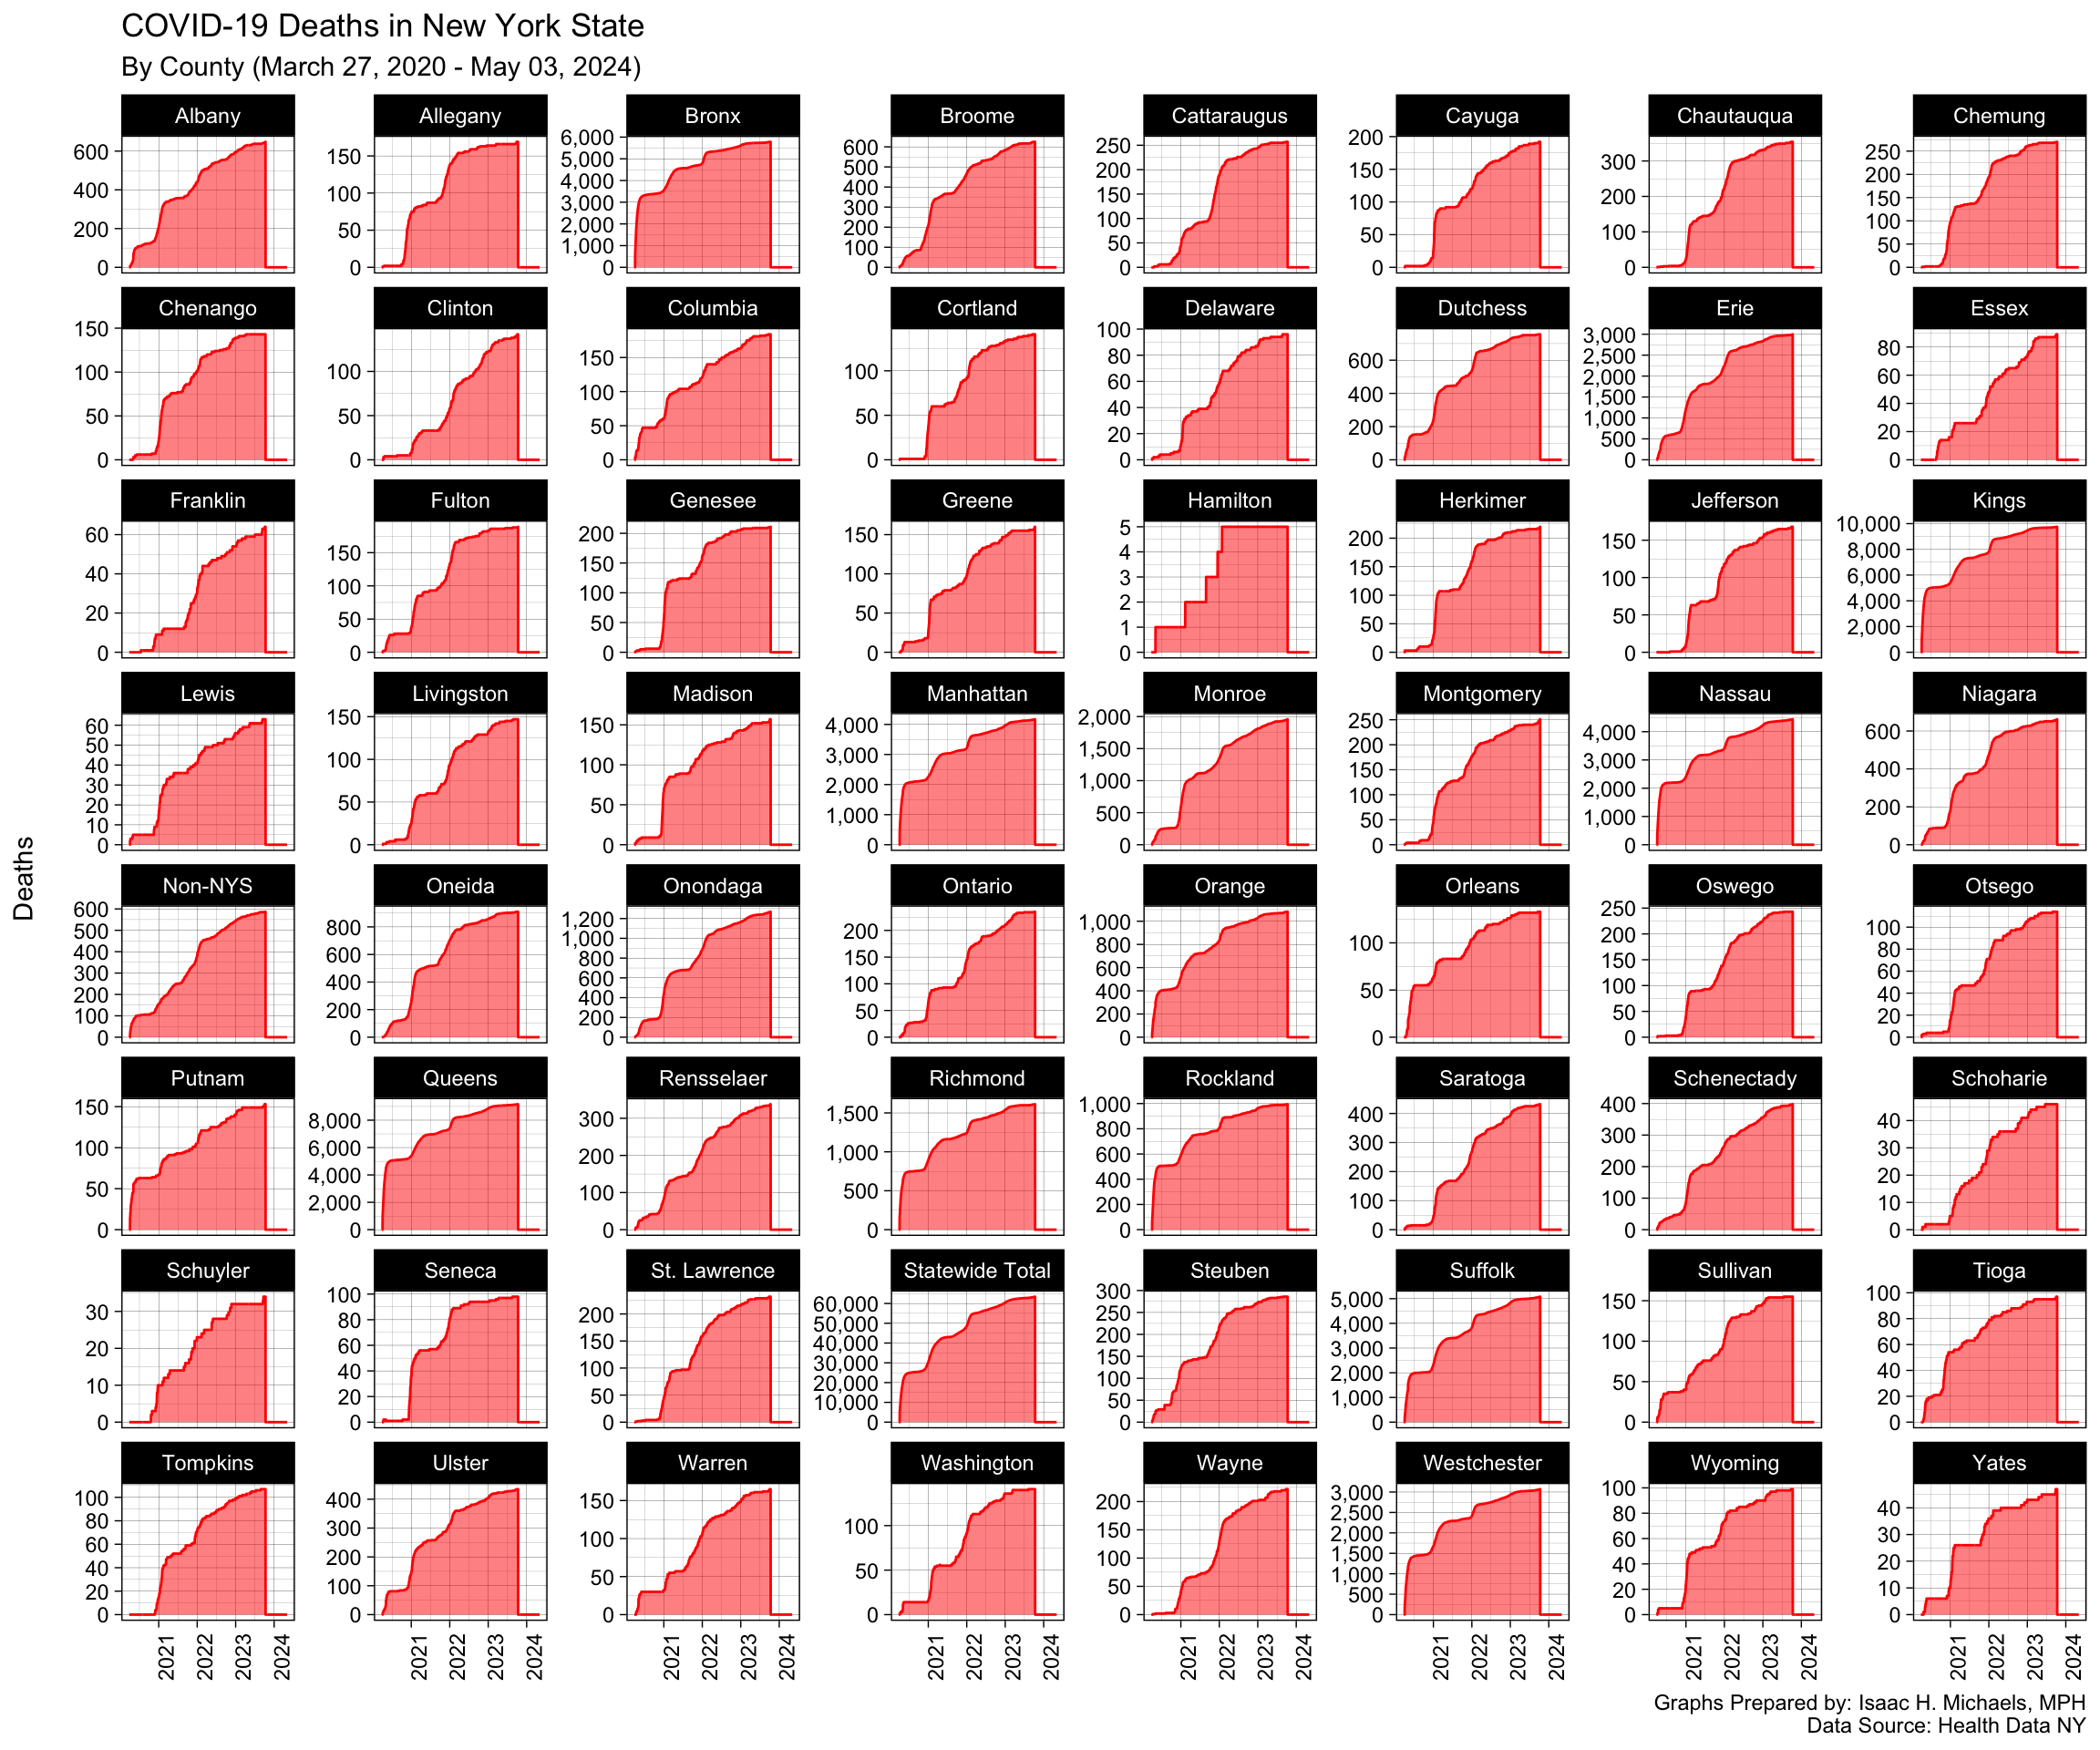
Note: New York City includes Bronx, Kings, New York, Queens, and Richmond counties.
Graphs Prepared By: Isaac H. Michaels, MPH
Data Source: Health Data NY
COVID-19 Deaths as Percentages of All Deaths
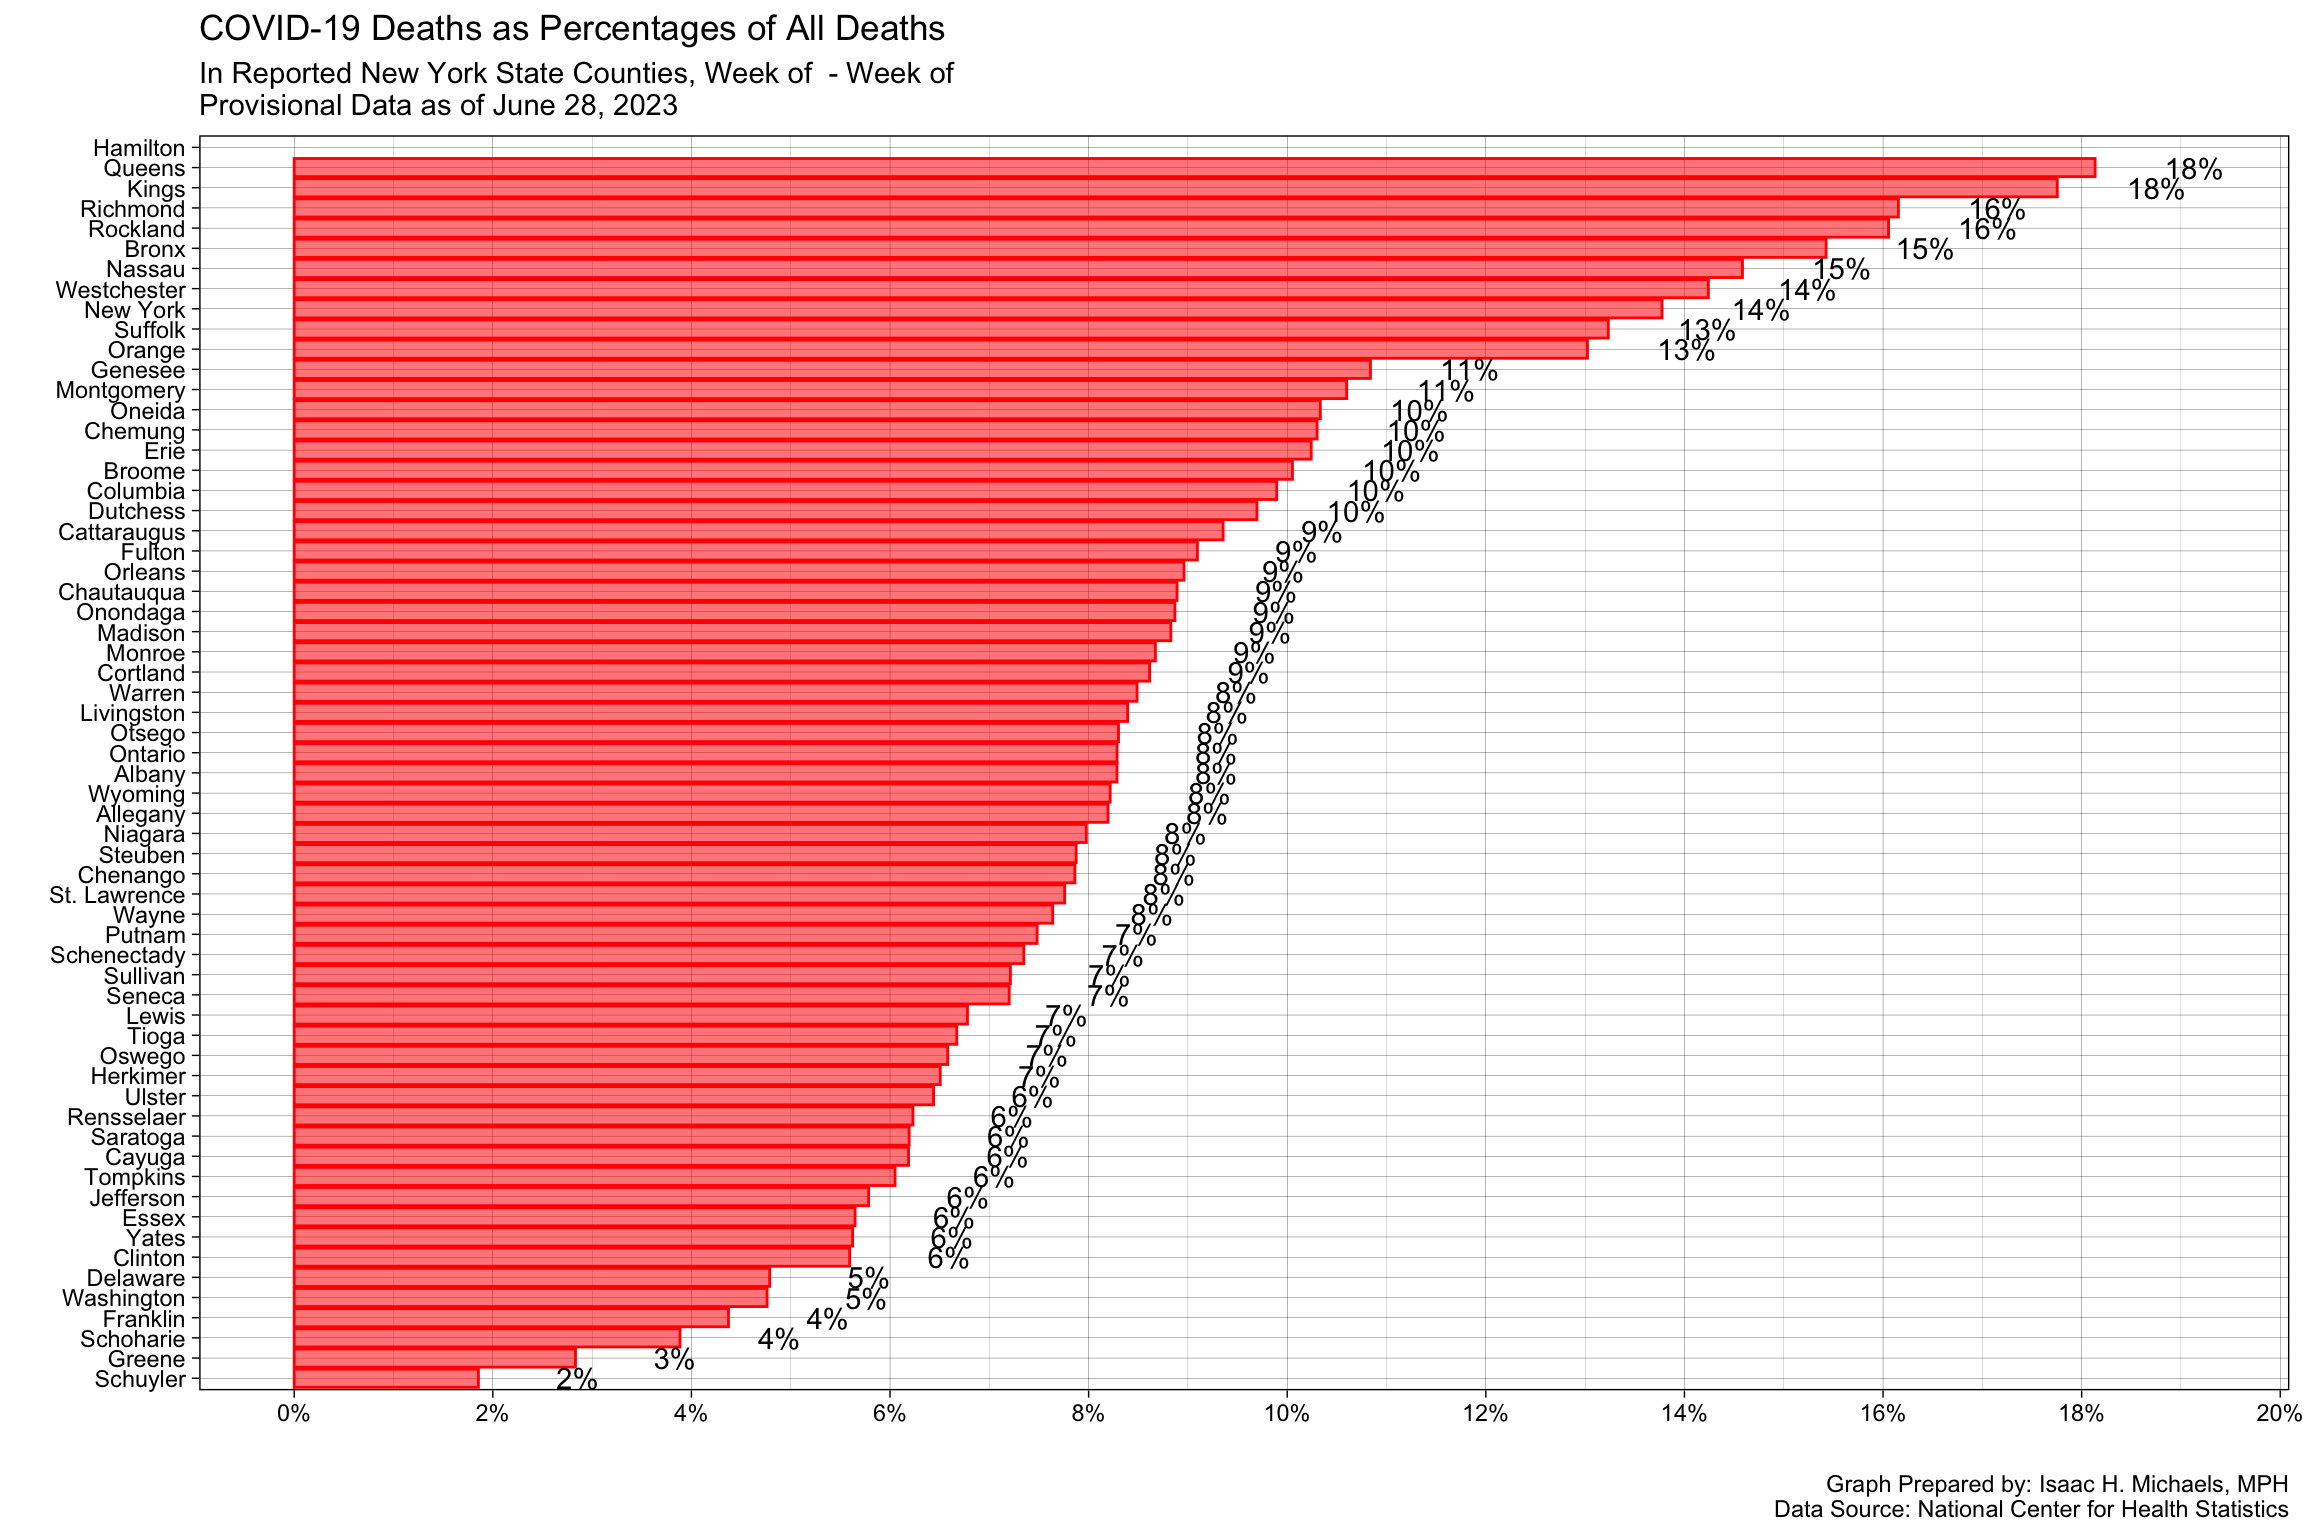
Graph Prepared By: Isaac H. Michaels, MPH
Data Source: National Center for Health Statistics
COVID-19 Deaths by Sex
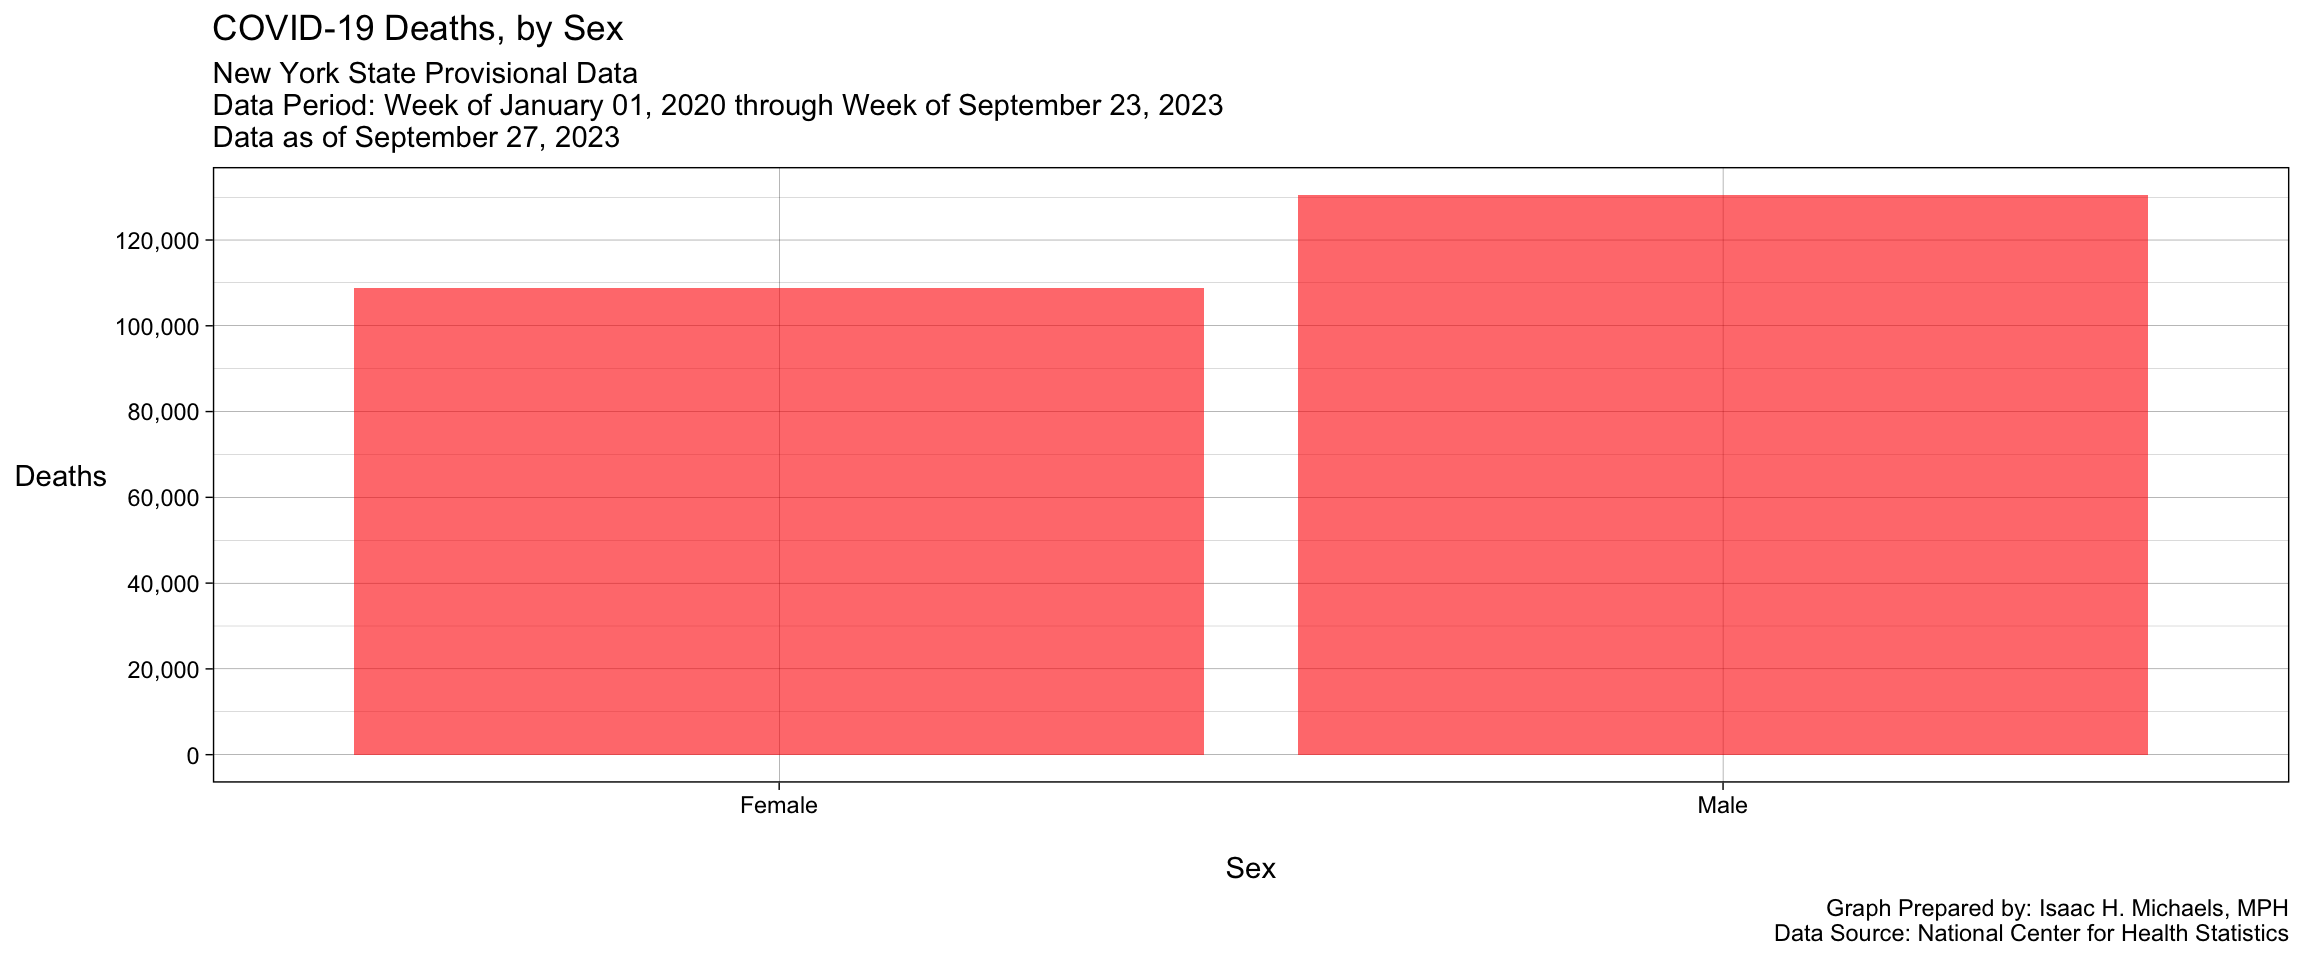
Graph Prepared By: Isaac H. Michaels, MPH
Data Source: National Center for Health Statistics
COVID-19 Deaths by Age Group
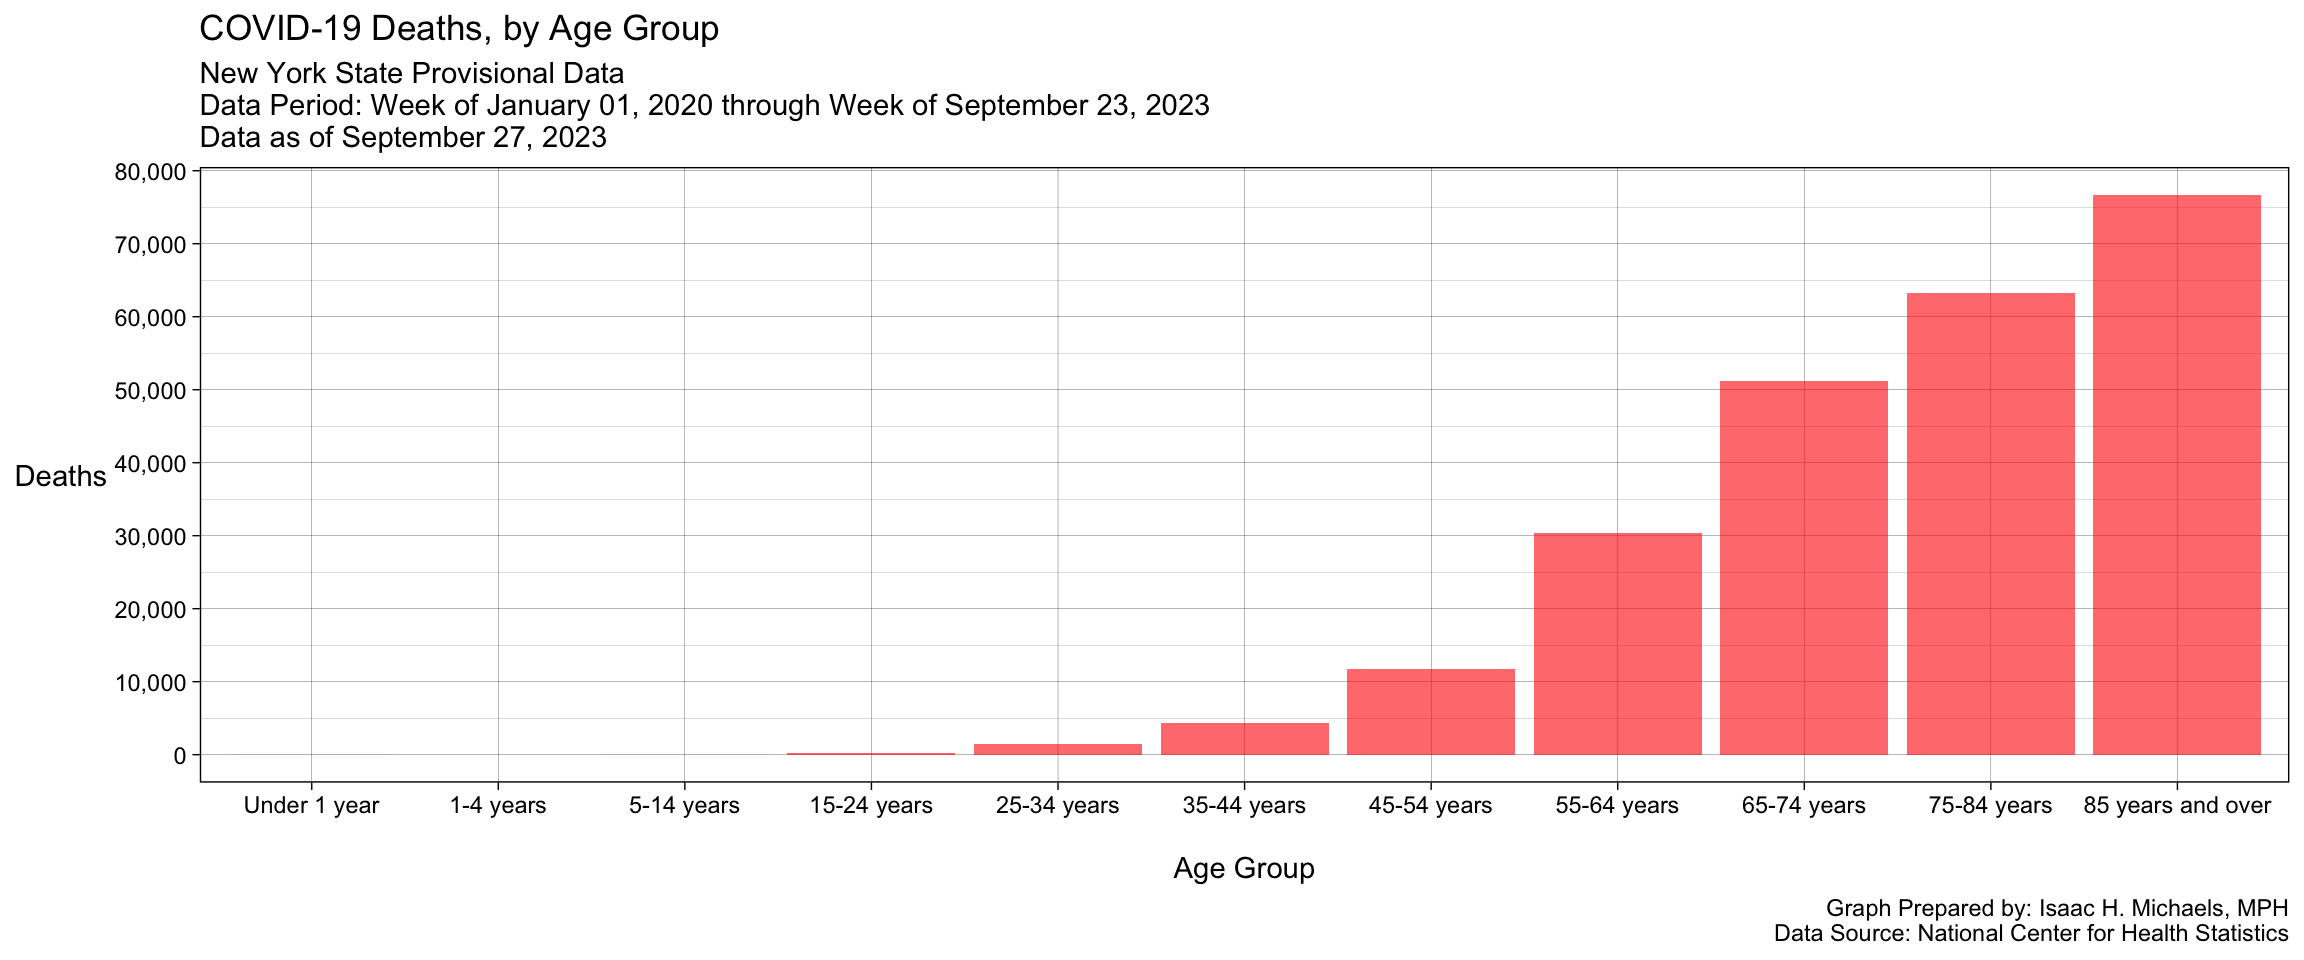
Graph Prepared By: Isaac H. Michaels, MPH
Data Source: National Center for Health Statistics
COVID-19 Deaths by Sex by Age Group
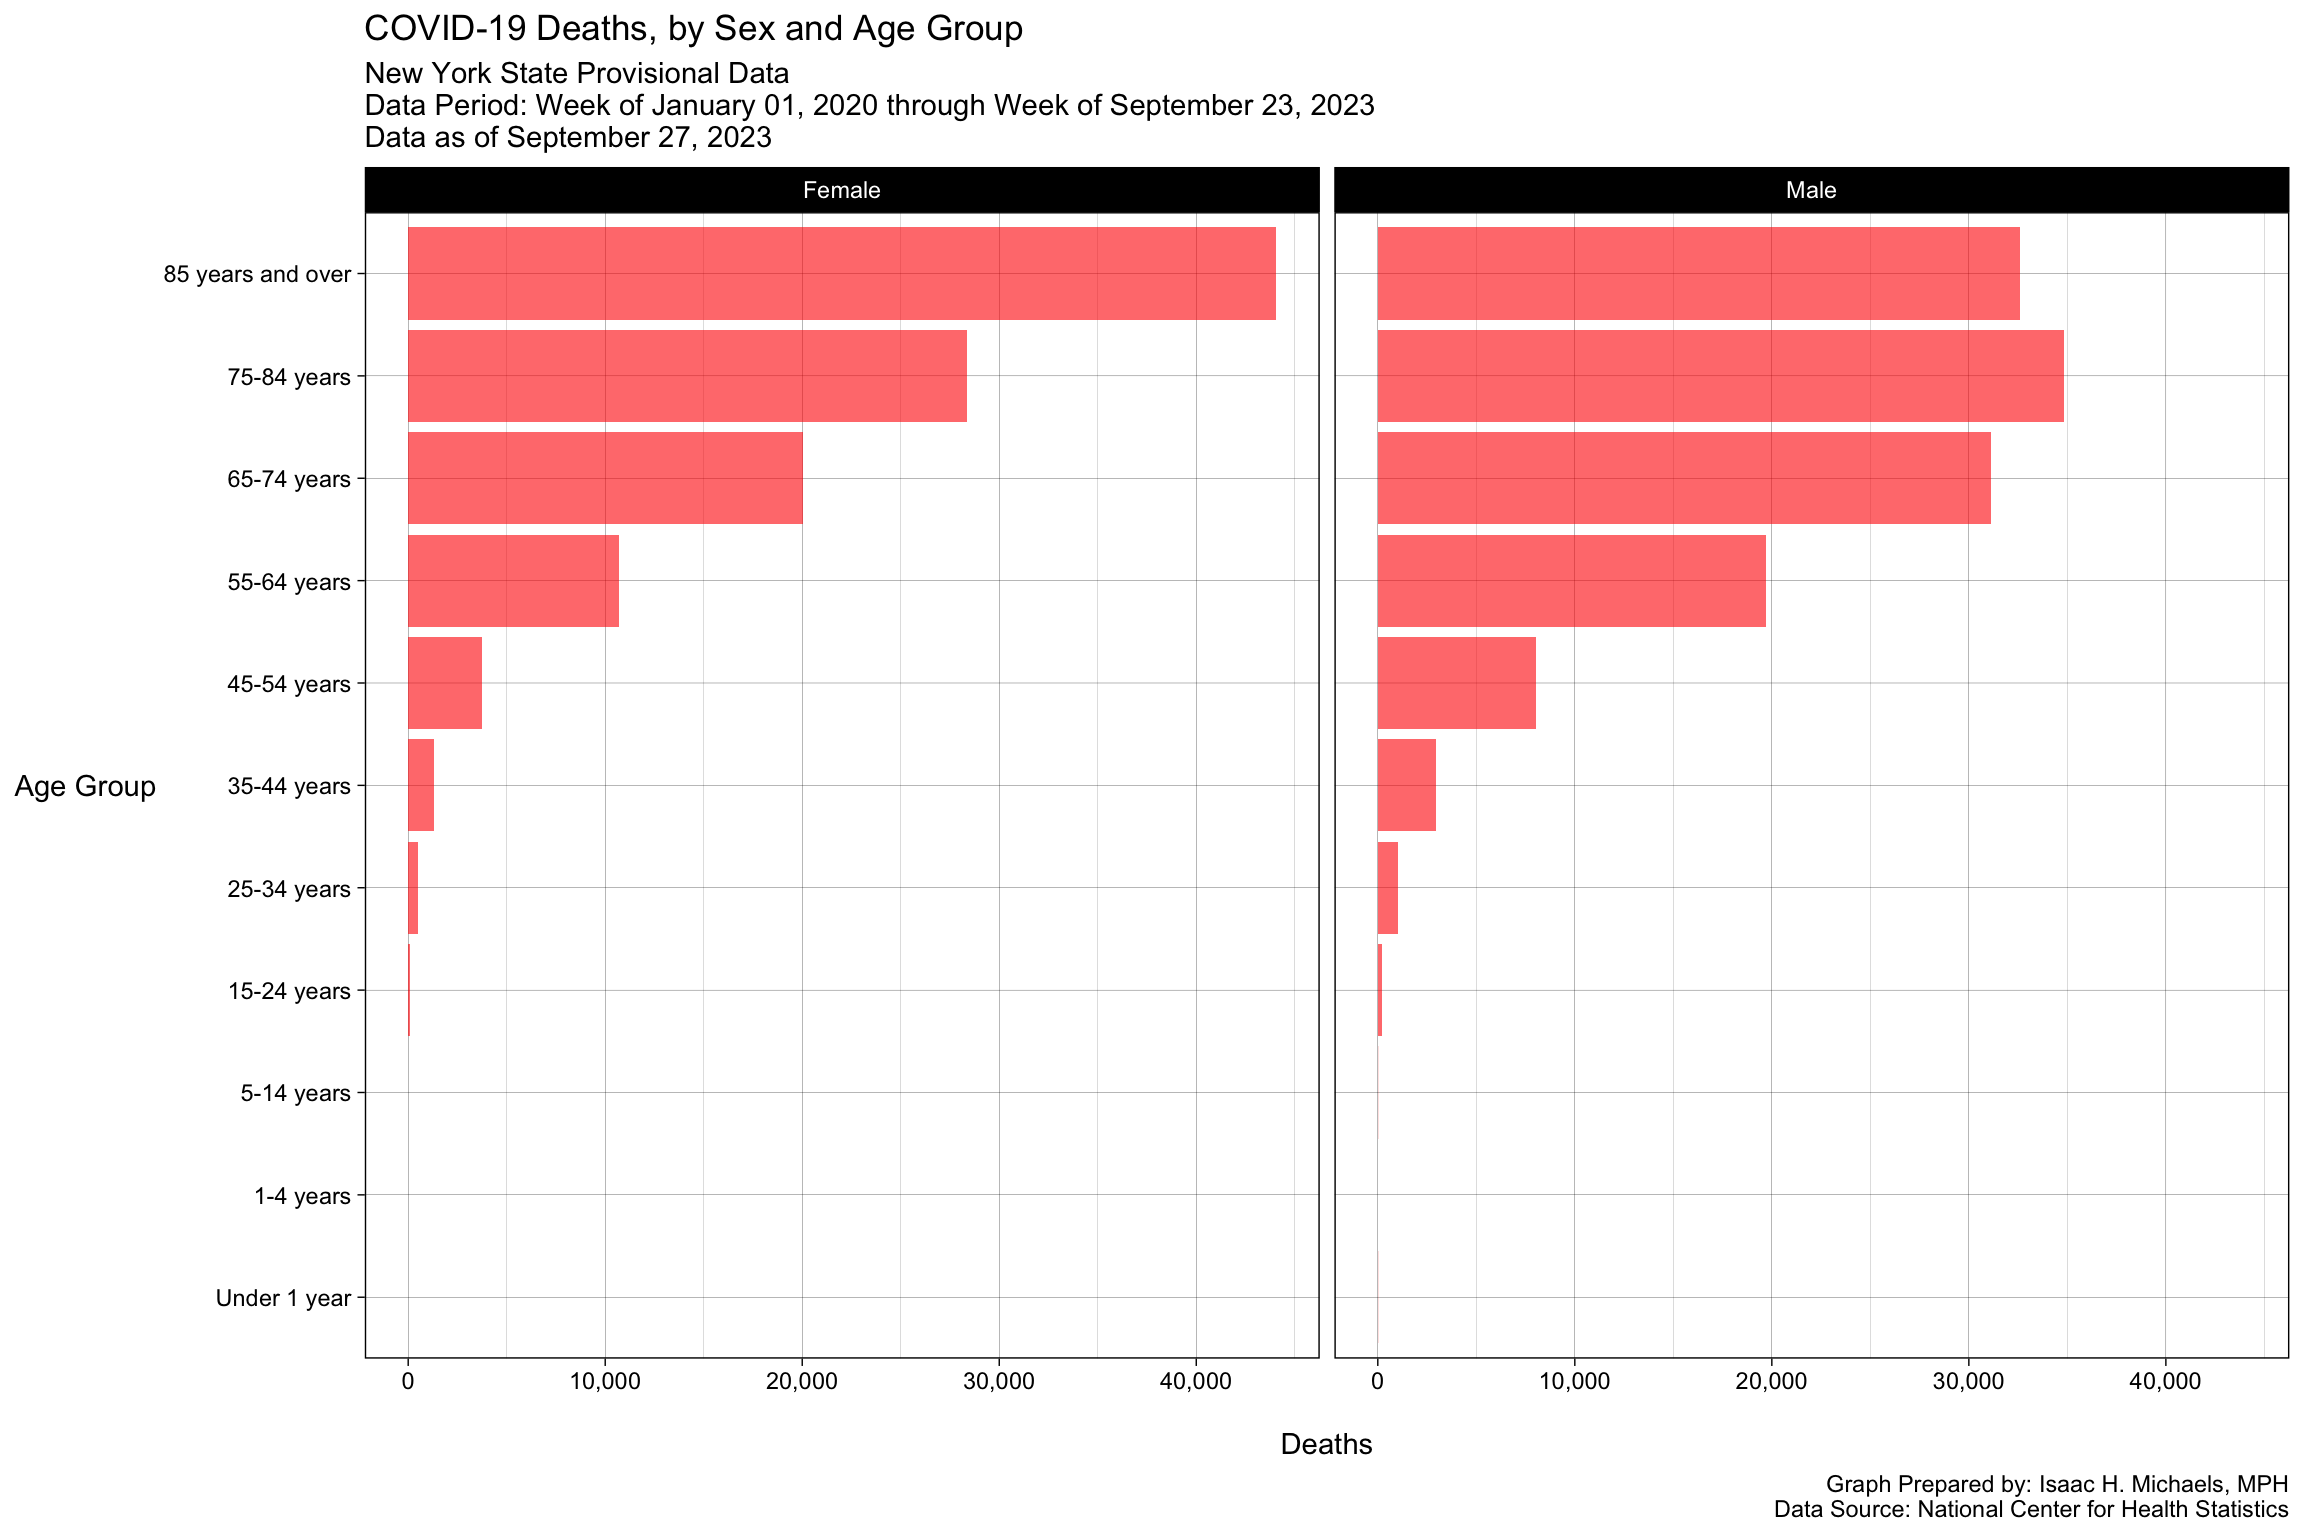
Graph Prepared By: Isaac H. Michaels, MPH
Data Source: National Center for Health Statistics
COVID-19 Deaths vs. Population Distribution, by Race/Ethnicity Groups
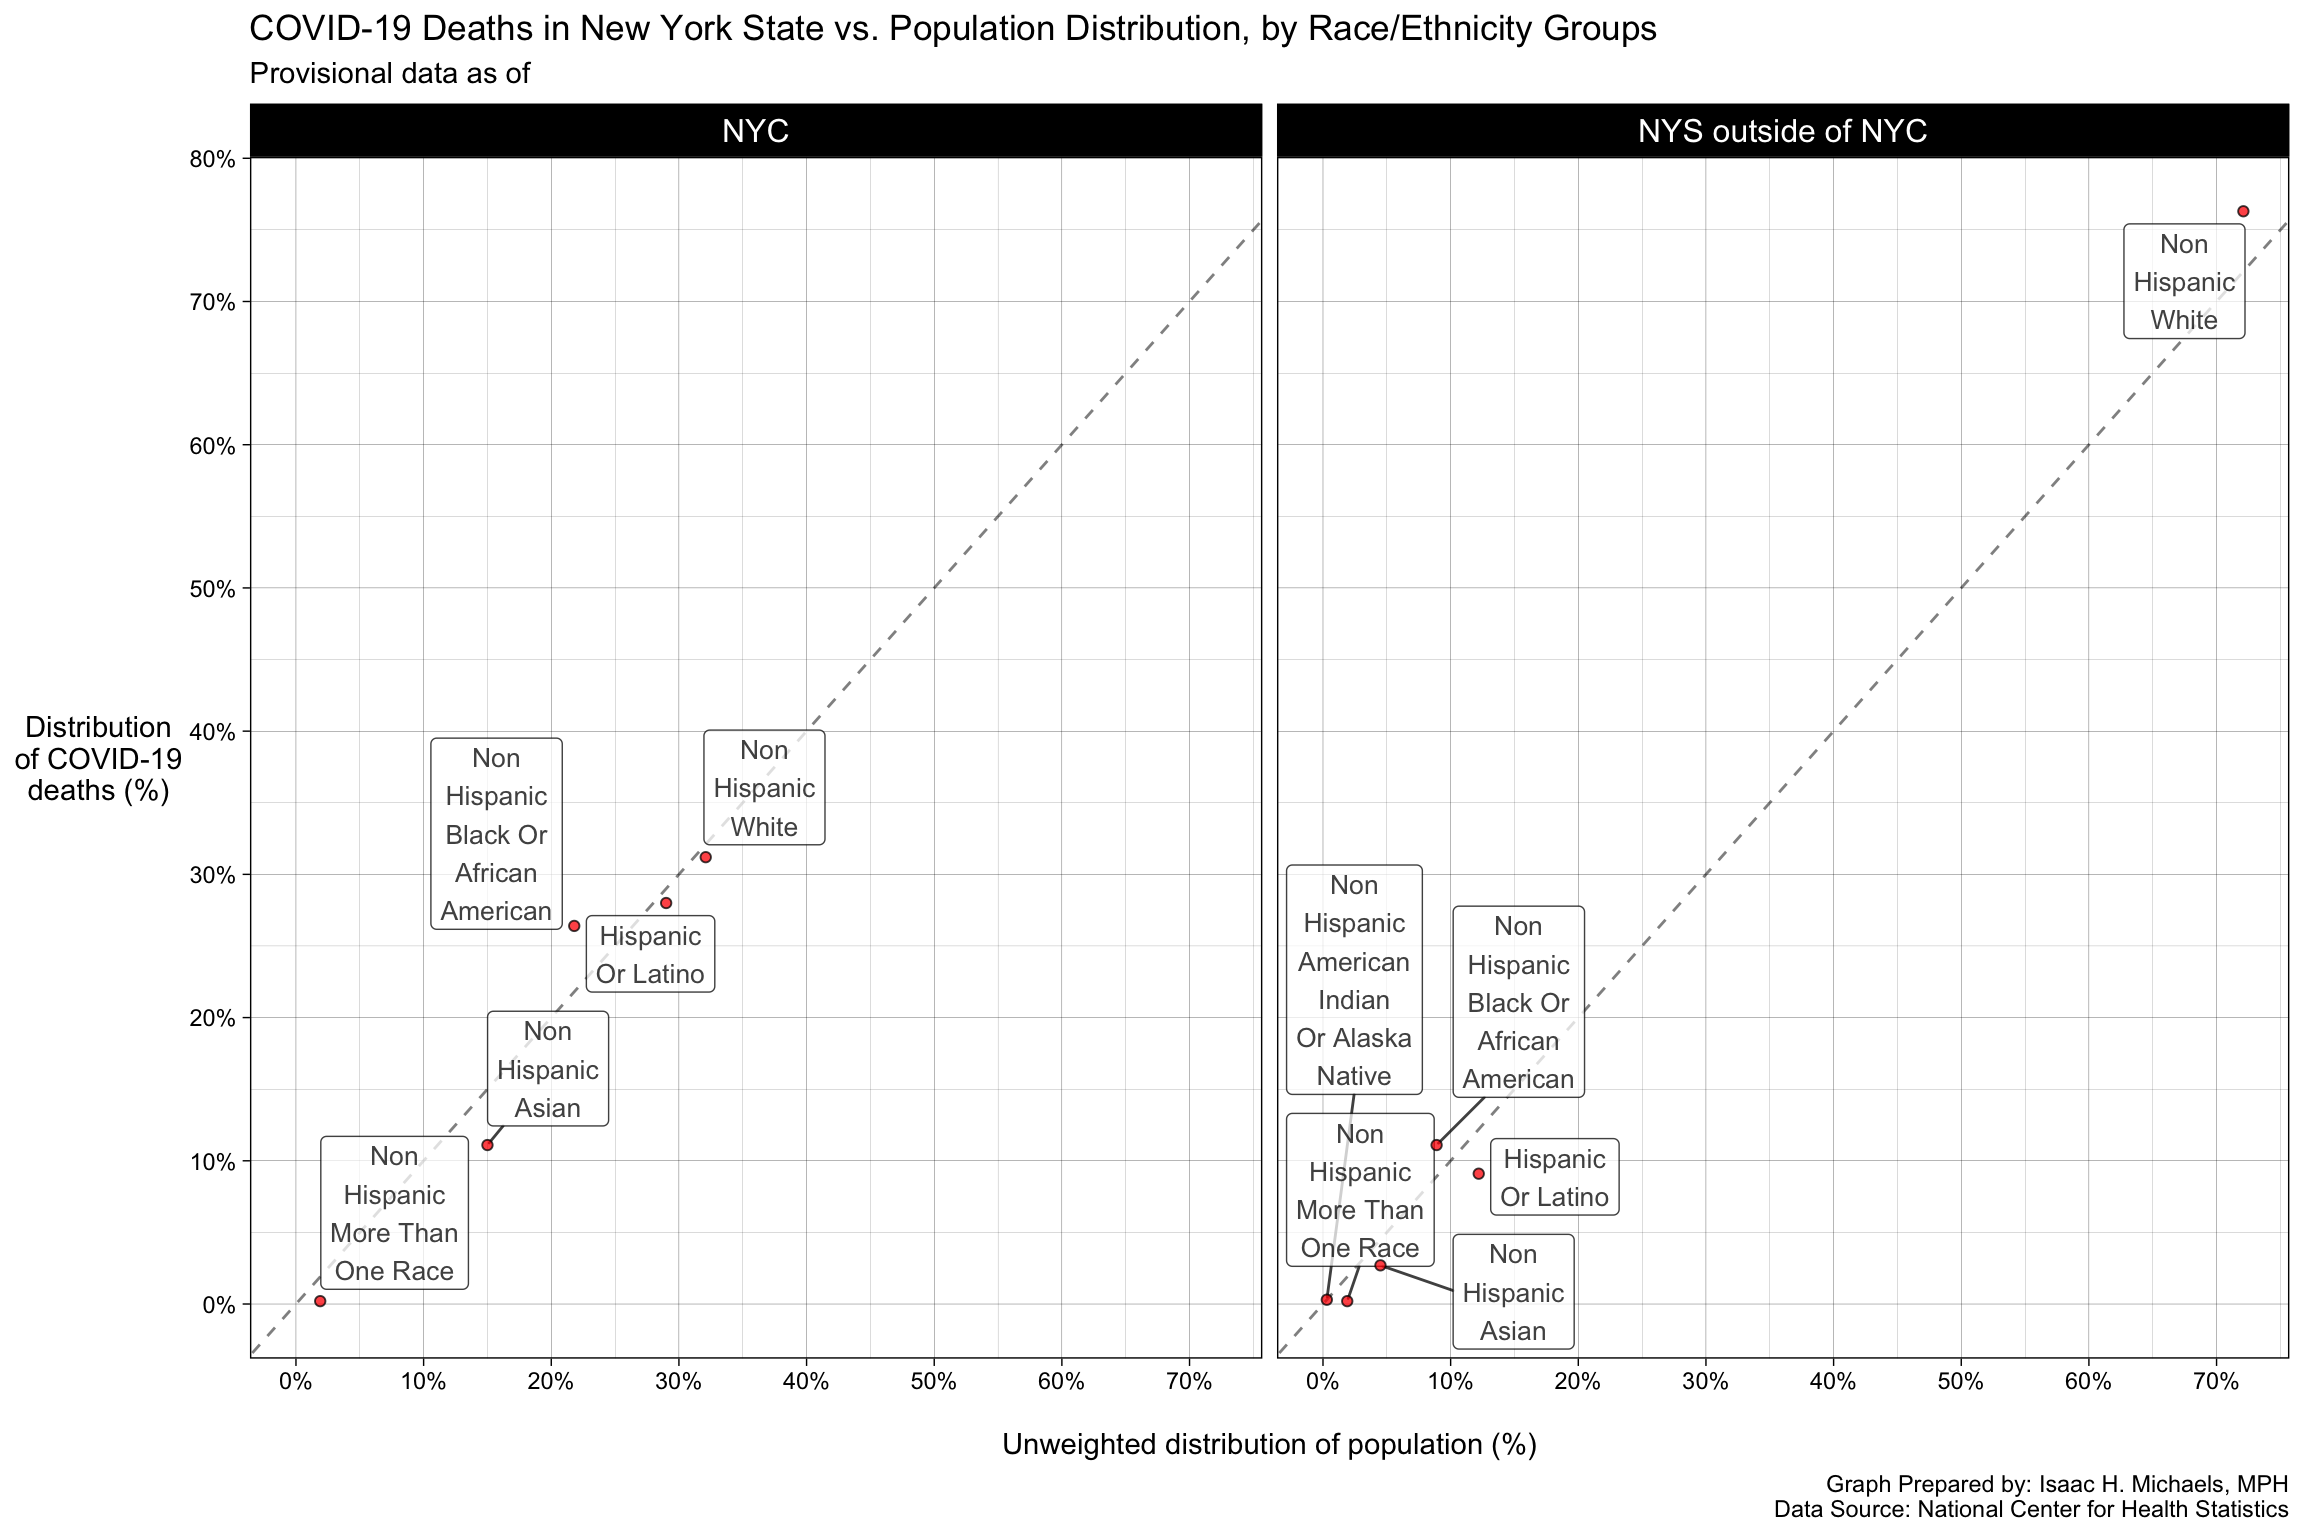
Graph Prepared By: Isaac H. Michaels, MPH
Data Source: National Center for Health Statistics
COVID-19 Deaths, by Place of Death
Graph Prepared By: Isaac H. Michaels, MPH
Data Source: Centers for Disease Control and Prevention
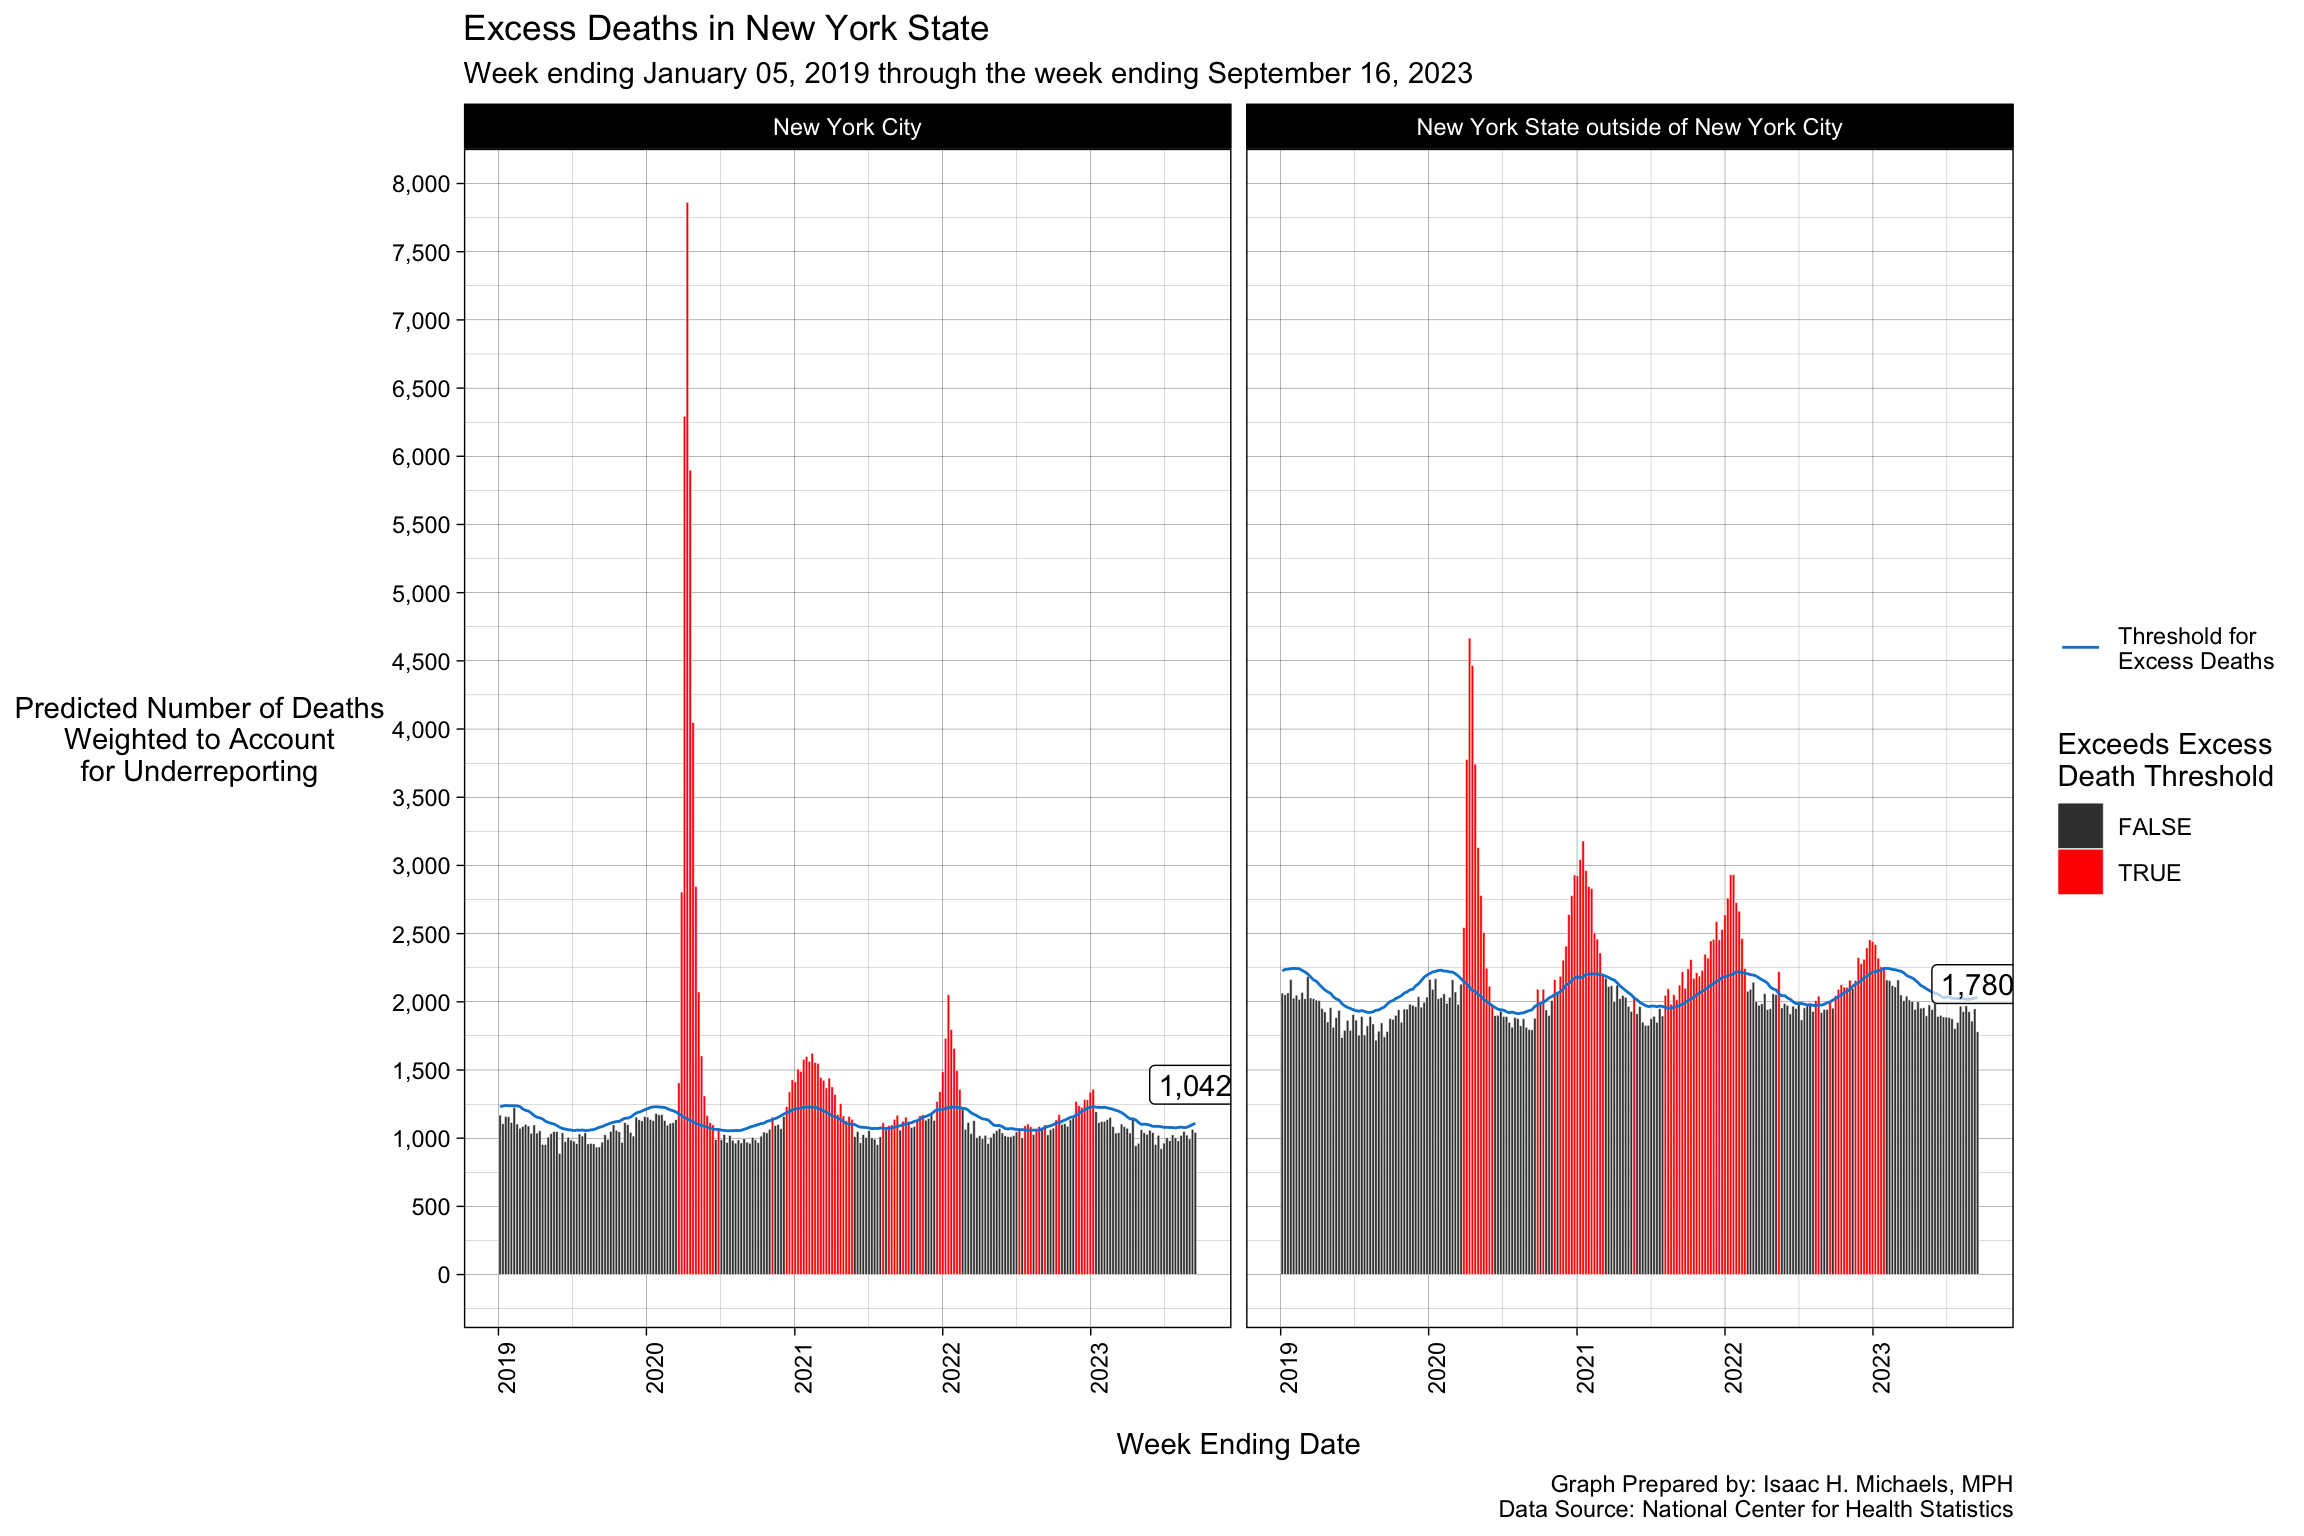
Excess Deaths
Graph Prepared By: Isaac H. Michaels, MPH
Data Sources: Health Data NY, National Center for Health Statistics
COVID-19 Cases and Deaths in Nursing Homes
Resident and Staff Outcomes
Graph Prepared By: Isaac H. Michaels, MPH
Data Source: Centers for Medicare and Medicaid Services
Confirmed Cases Among Resident vs. Staff, by Week
Graph Prepared By: Isaac H. Michaels, MPH
Data Source: Centers for Medicare and Medicaid Services
Deaths, by Facility
Graph Prepared By: Isaac H. Michaels, MPH
Data Source: Centers for Medicare and Medicaid Services
COVID-19 Cases in Colleges and Universities
Cumulative Cases by County
Note: New York City includes Bronx, Kings, New York, Queens, and Richmond counties.
Graph Prepared By: Isaac H. Michaels, MPH
Data Source: The New York Times
Cumulative Cases by School
Graph Prepared By: Isaac H. Michaels, MPH
Data Source: The New York Times
Immunization
Bivalent Booster Dose Uptake
Graph
Graph Prepared By: Isaac H. Michaels, MPH
Data Source: Centers for Disease Control and Prevention
Vaccine Uptake, by Dose
Graph Prepared By: Isaac H. Michaels, MPH
Data Source: Centers for Disease Control and Prevention
Vaccine Uptake, by County
Graph Prepared By: Isaac H. Michaels, MPH
Data Source: Centers for Disease Control and Prevention (State Level,County Level)
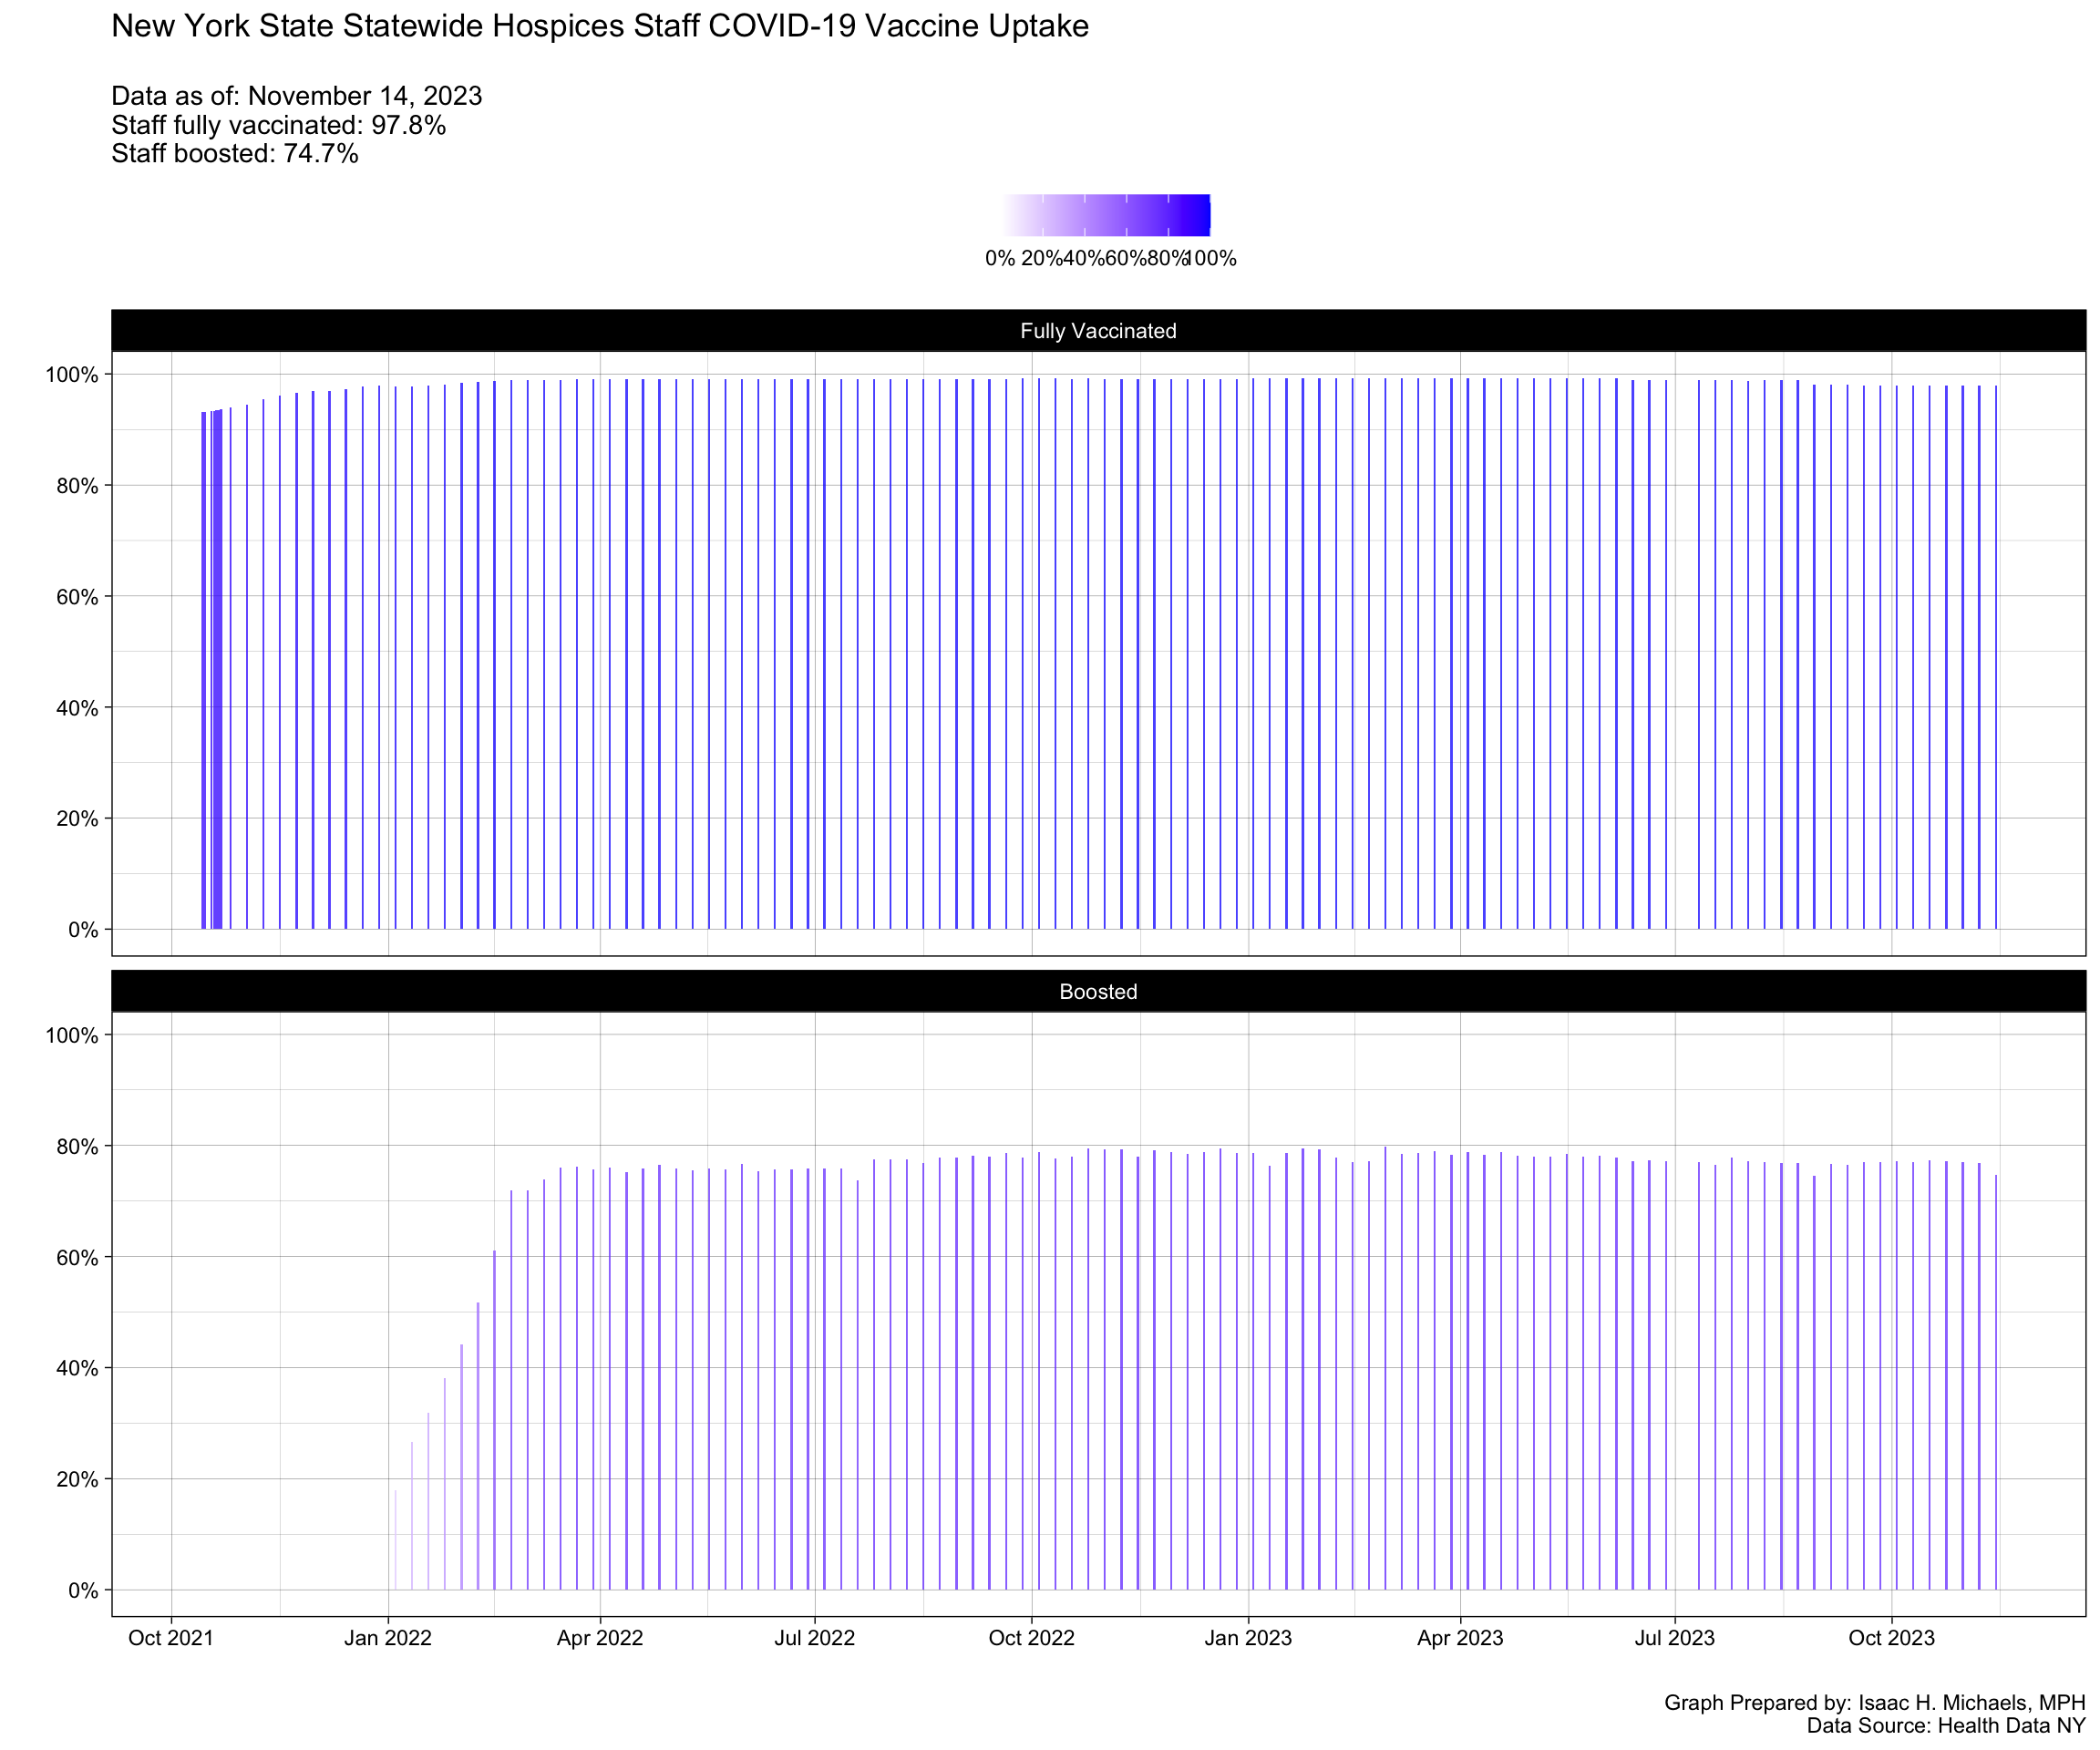
Vaccine Uptake by Health Care Staff
Nursing Home and Adult Care Facility Staff
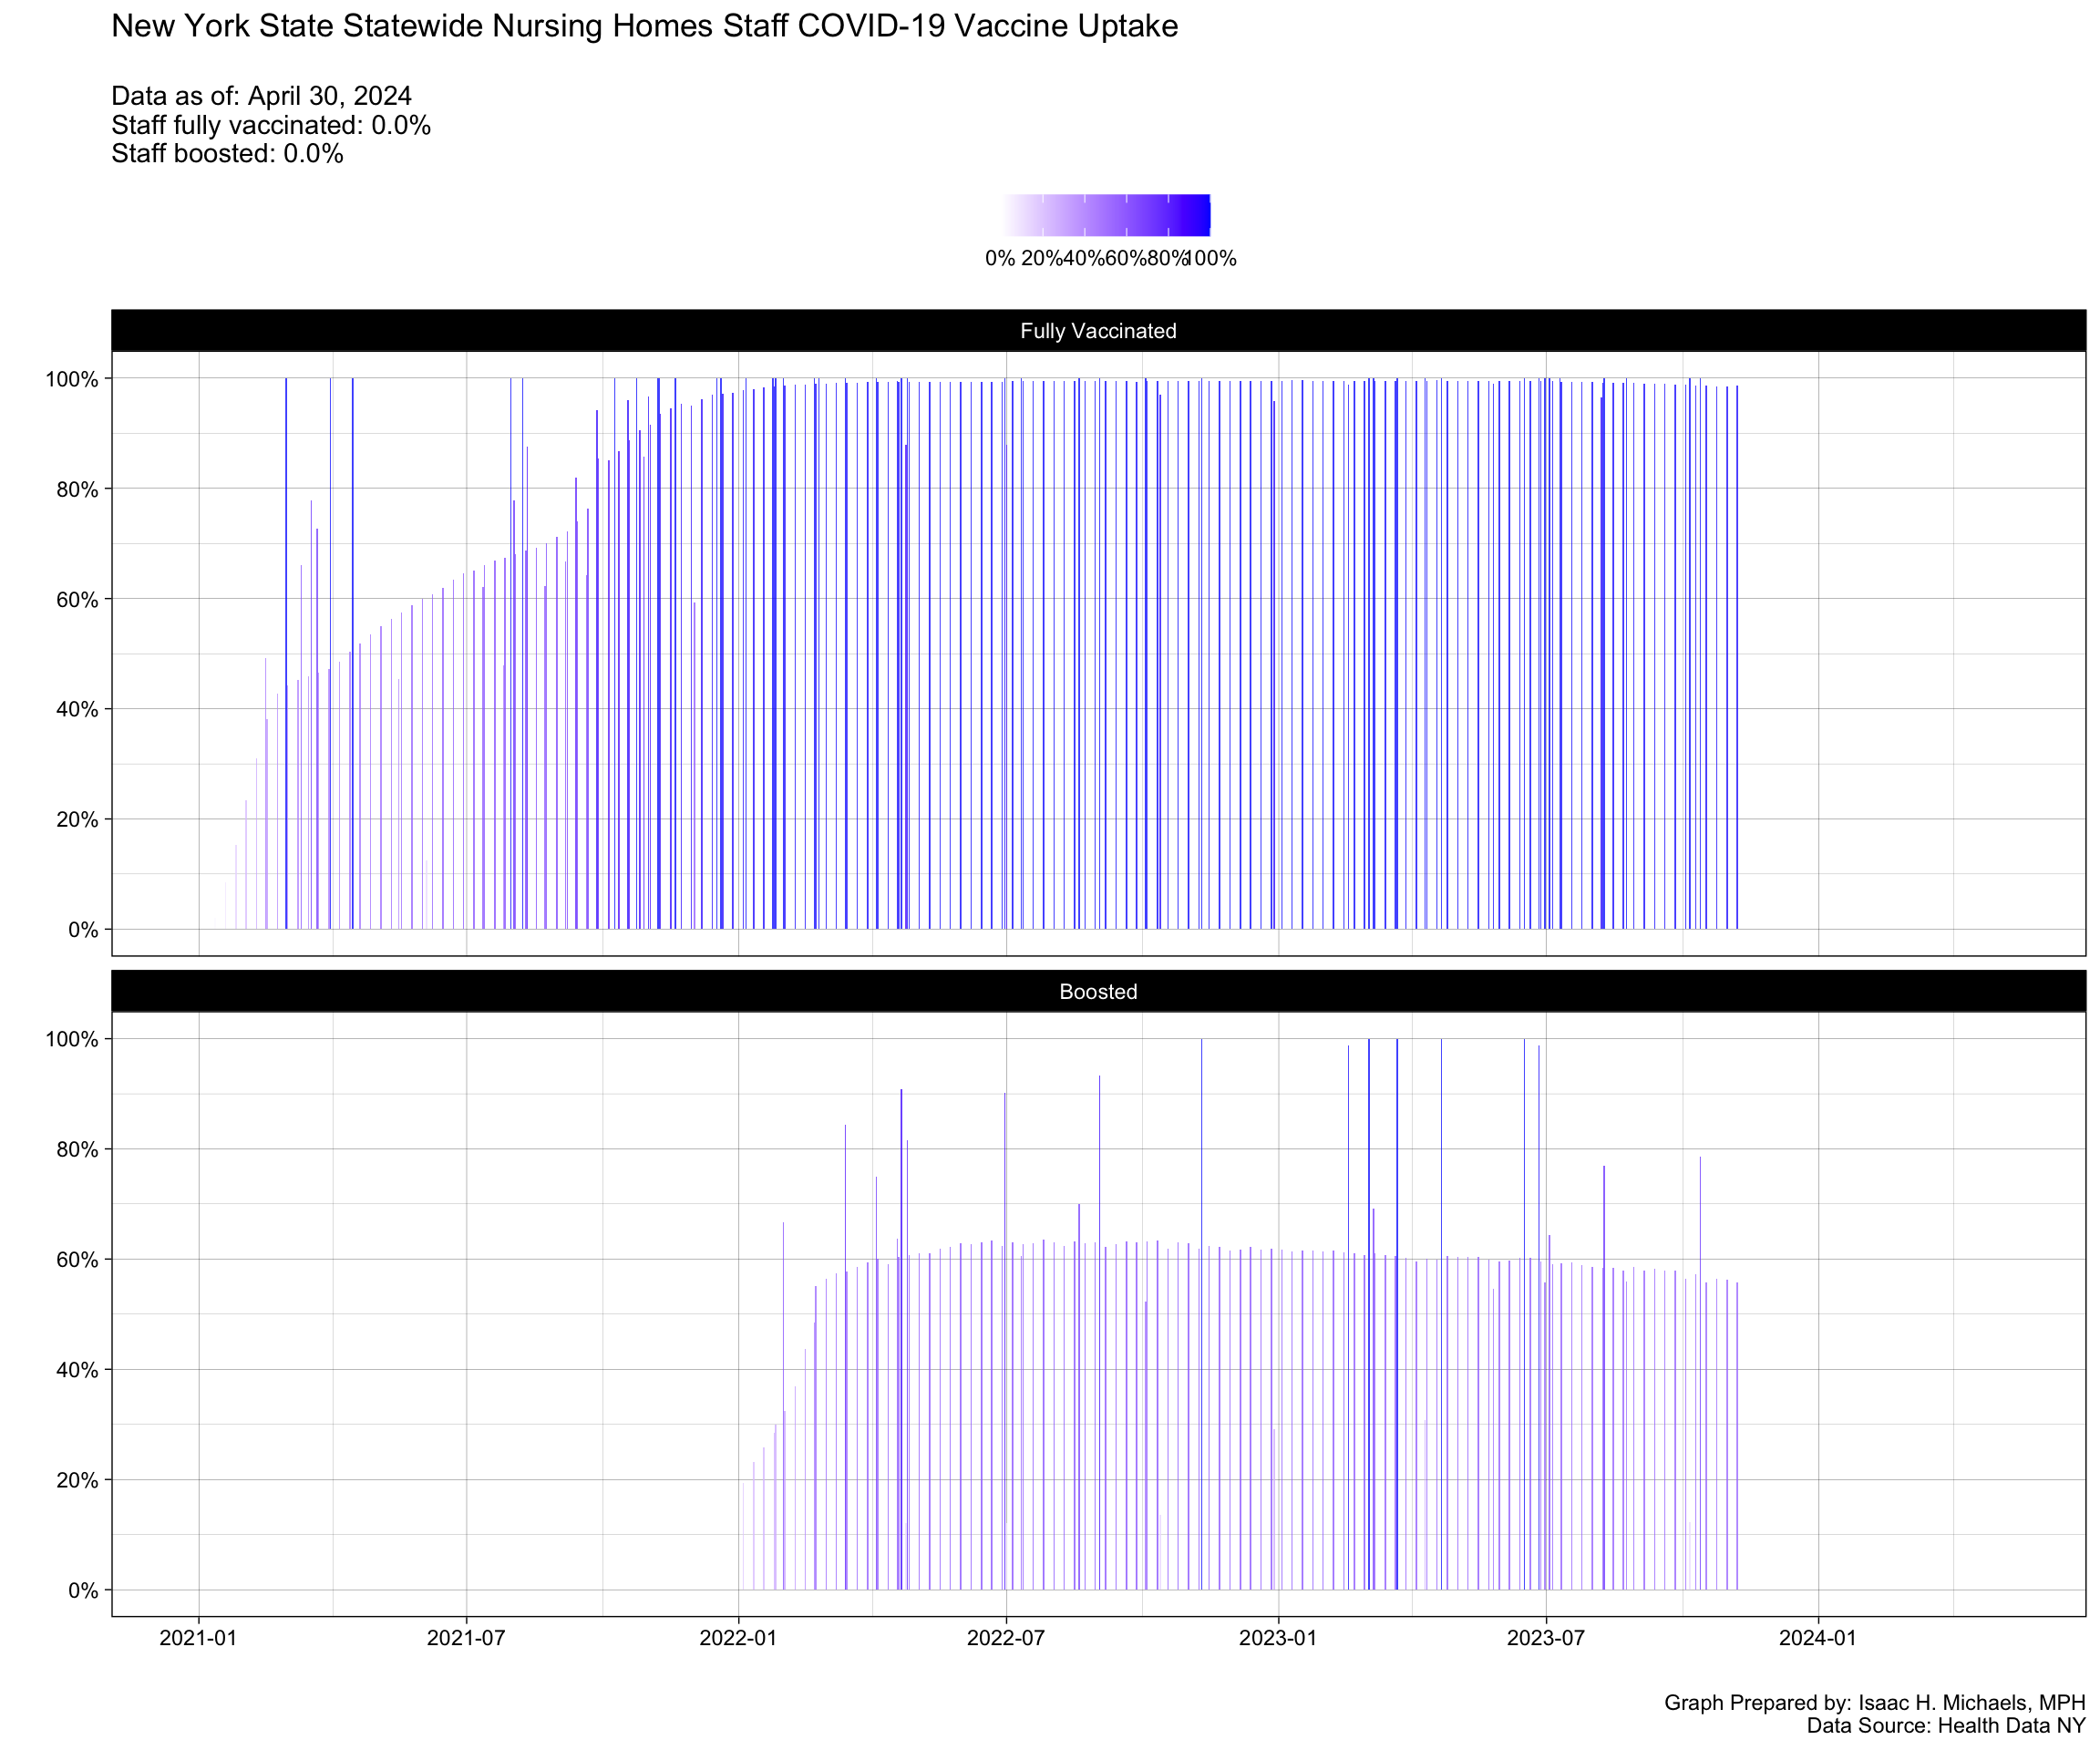
Graph Prepared By: Isaac H. Michaels, MPH
Data Source: Health Data NY
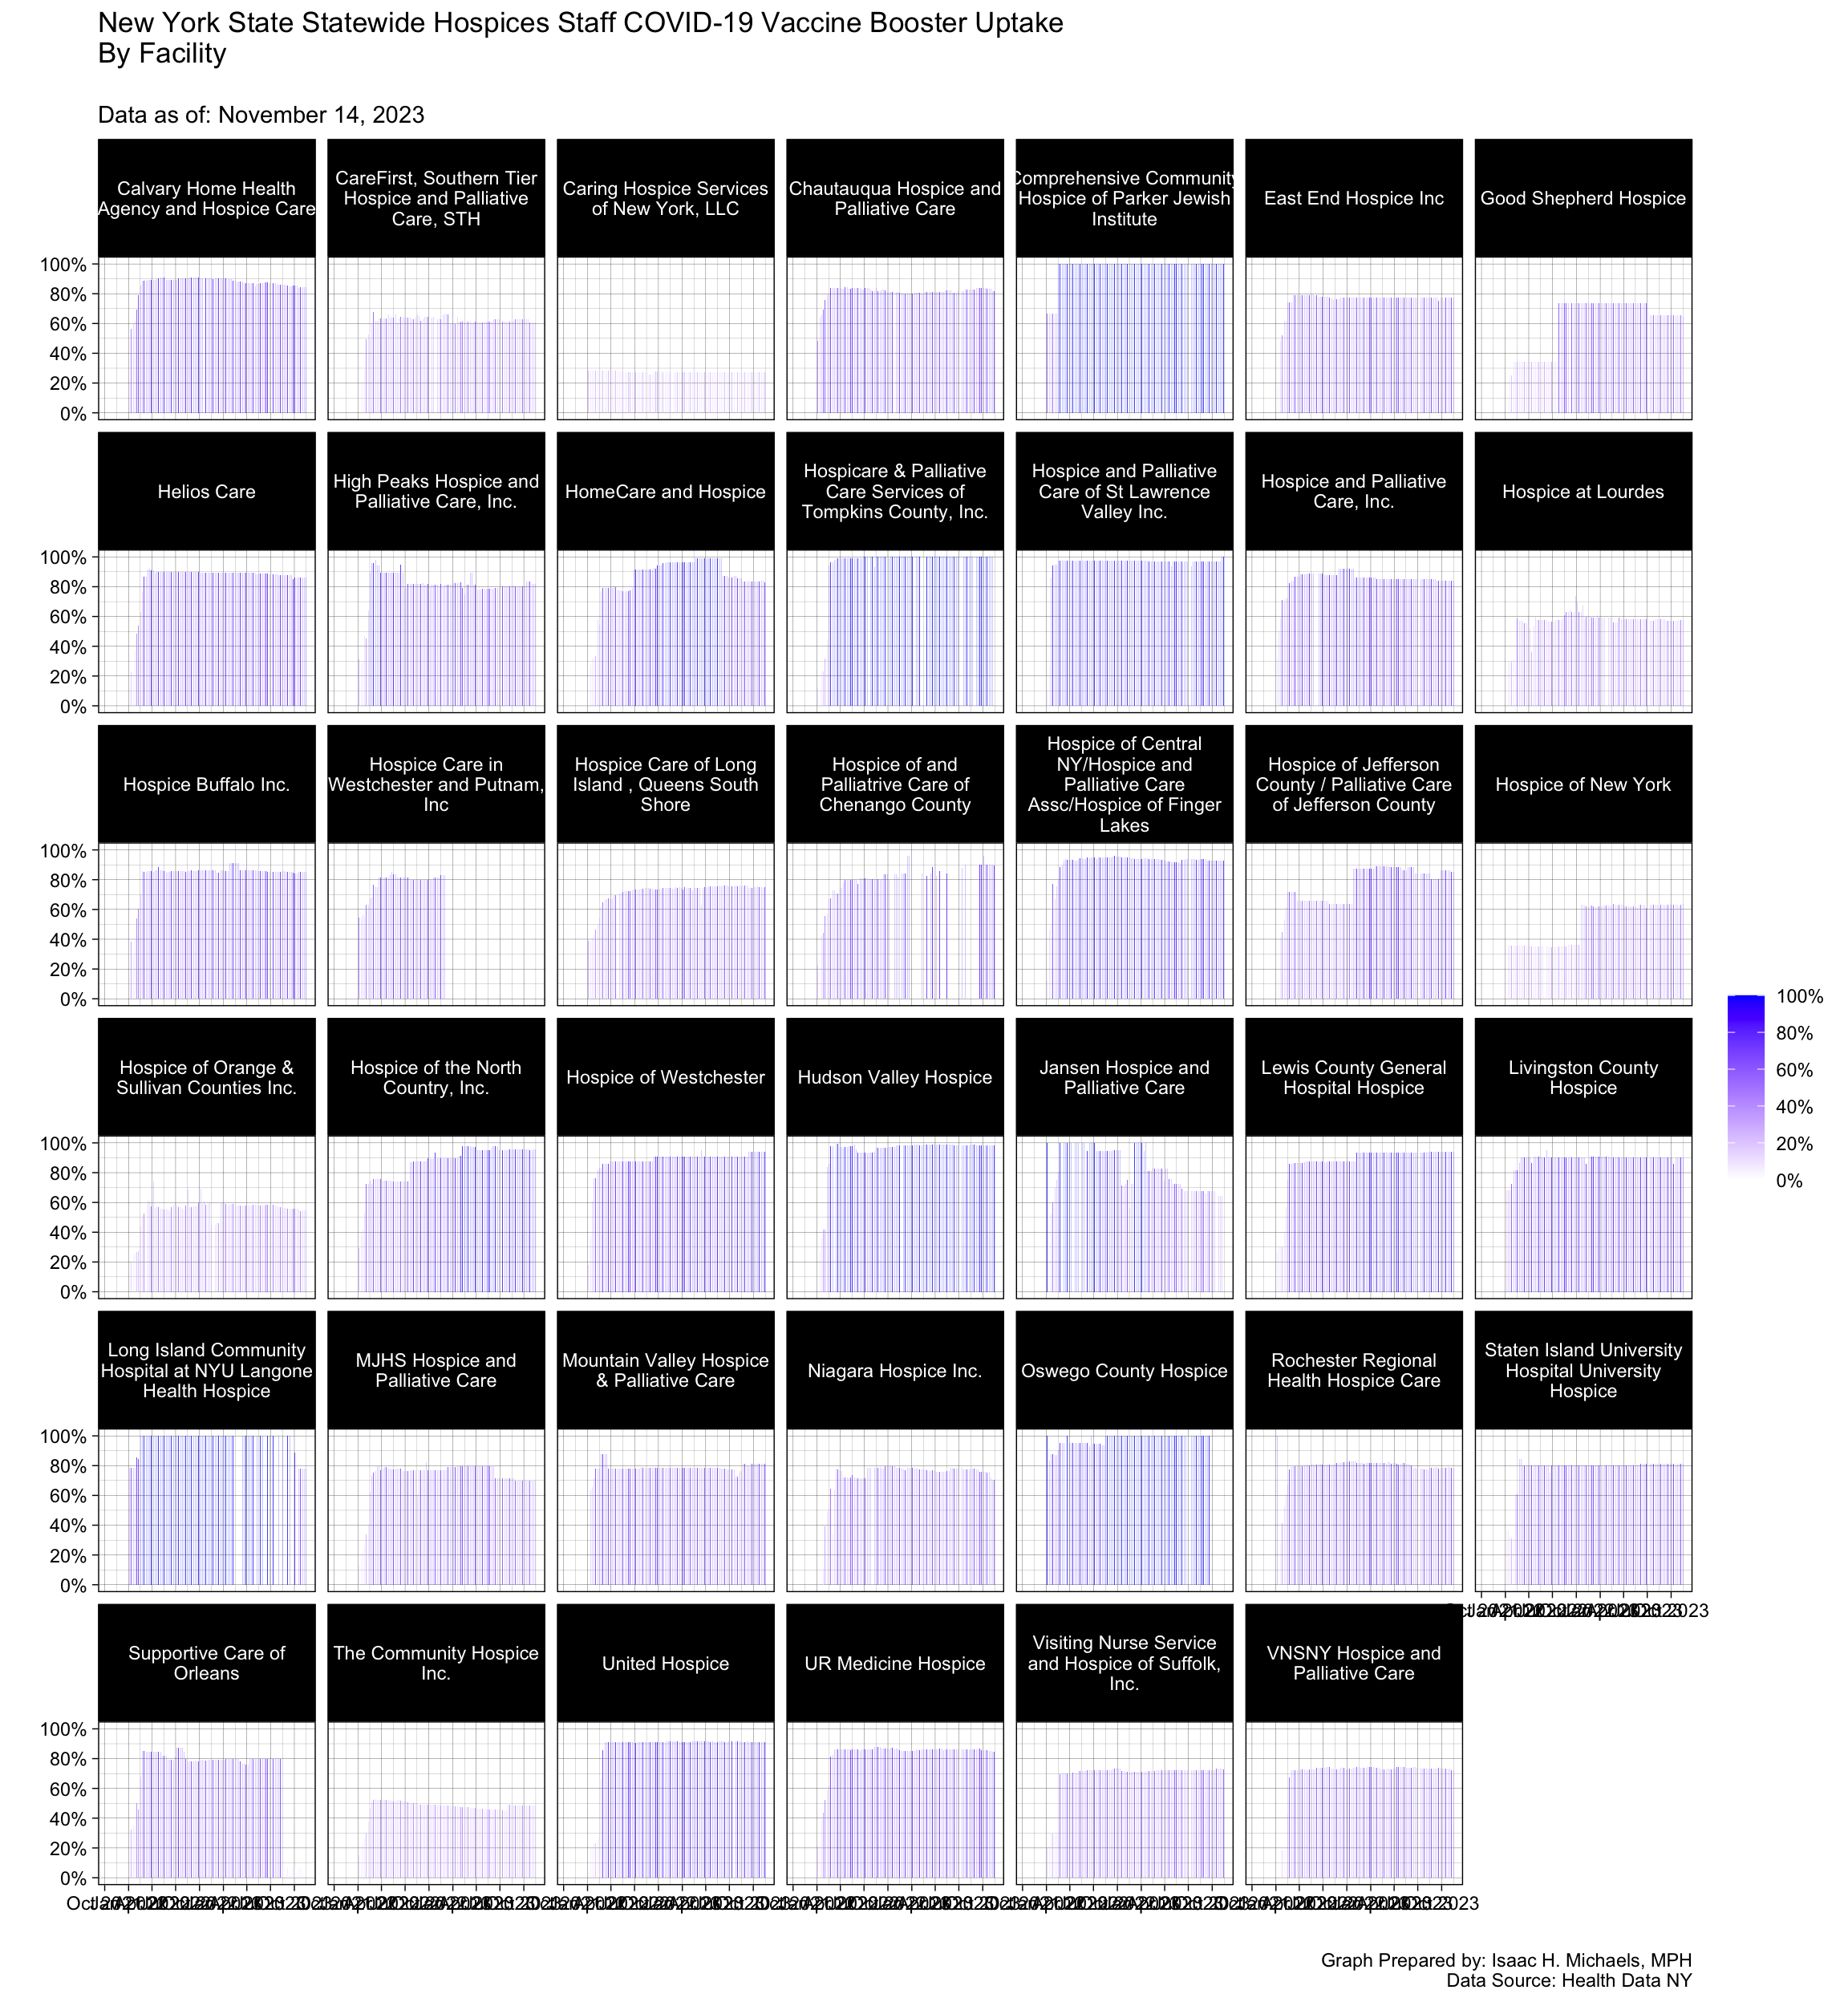
Nursing Home and Adult Care Facility Staff, by Facility

Graph Prepared By: Isaac H. Michaels, MPH
Data Source: Health Data NY
Trends and Statistics
Diagnostic Tests, Hospitalizations, and Deaths
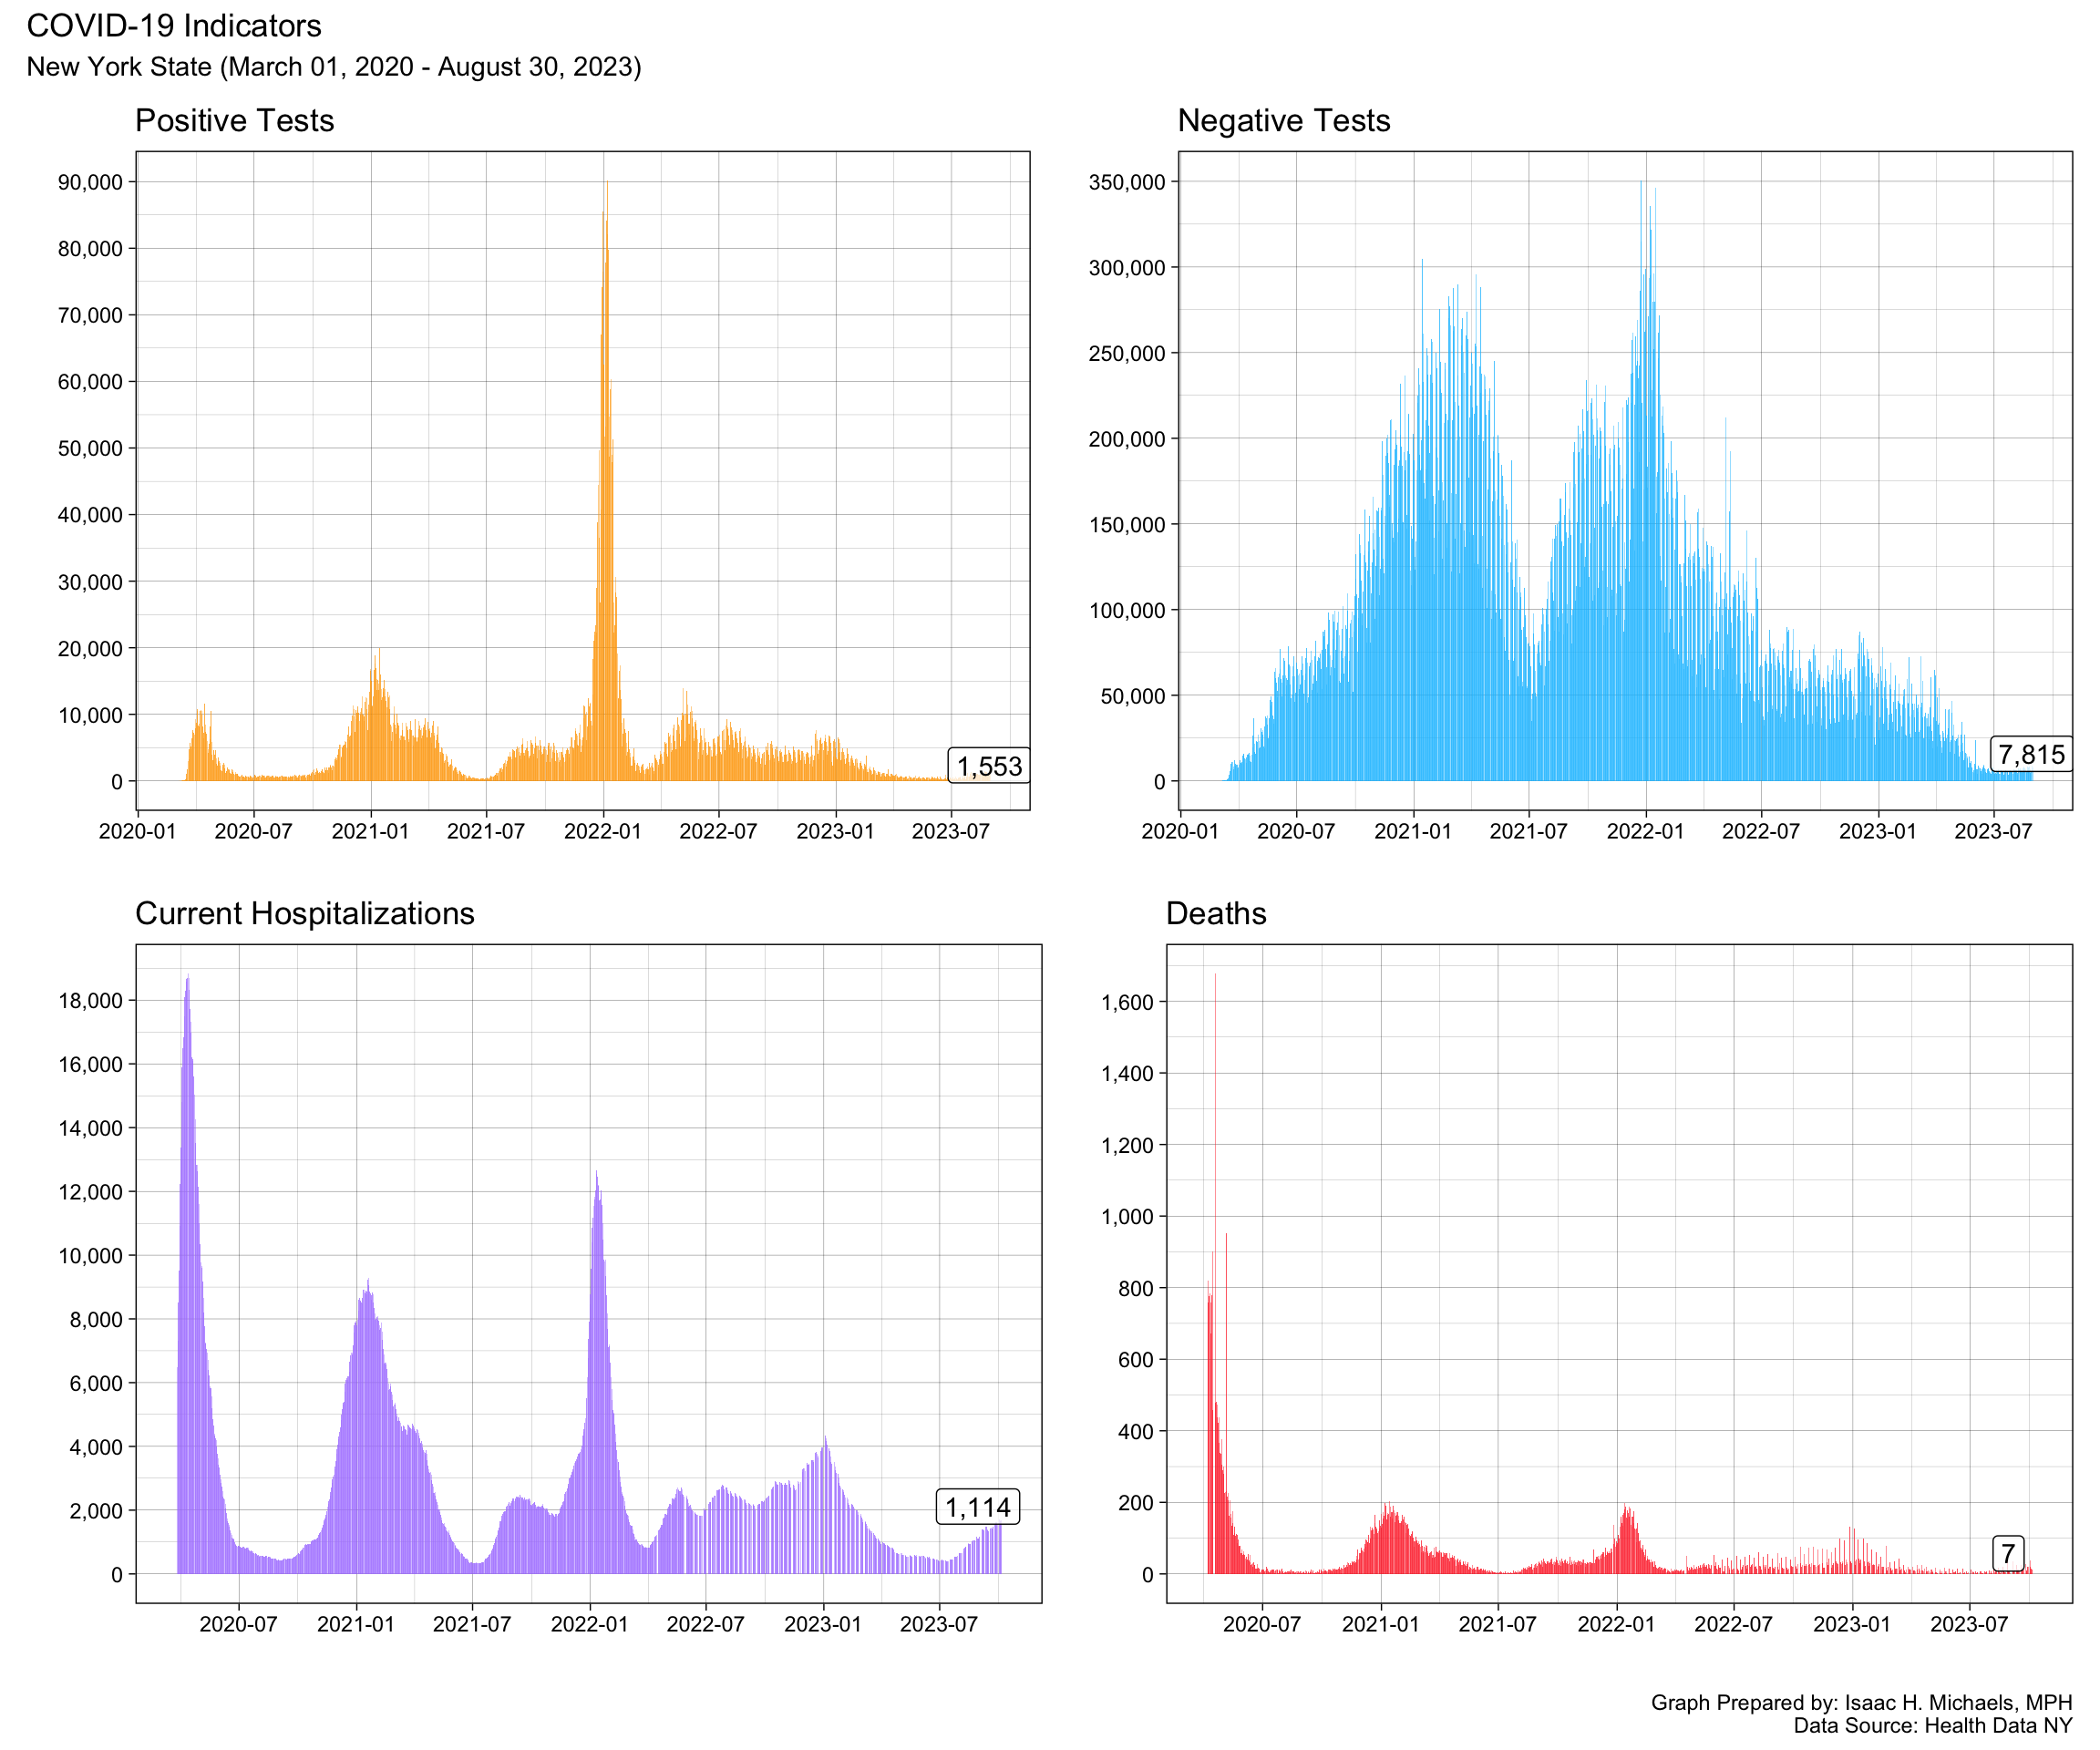
Graphs Prepared by: Isaac H. Michaels, MPH
Data Source: Health Data NY (Tests, Hospitalizations, Deaths)
Graphs Prepared by: Isaac H. Michaels, MPH
Data Source: Health Data NY
Graphs Prepared by: Isaac H. Michaels, MPH
Data Source: Health Data NY
Graphs Prepared by: Isaac H. Michaels, MPH
Data Source: Health Data NY
County Transmission Levels
Map
Graph
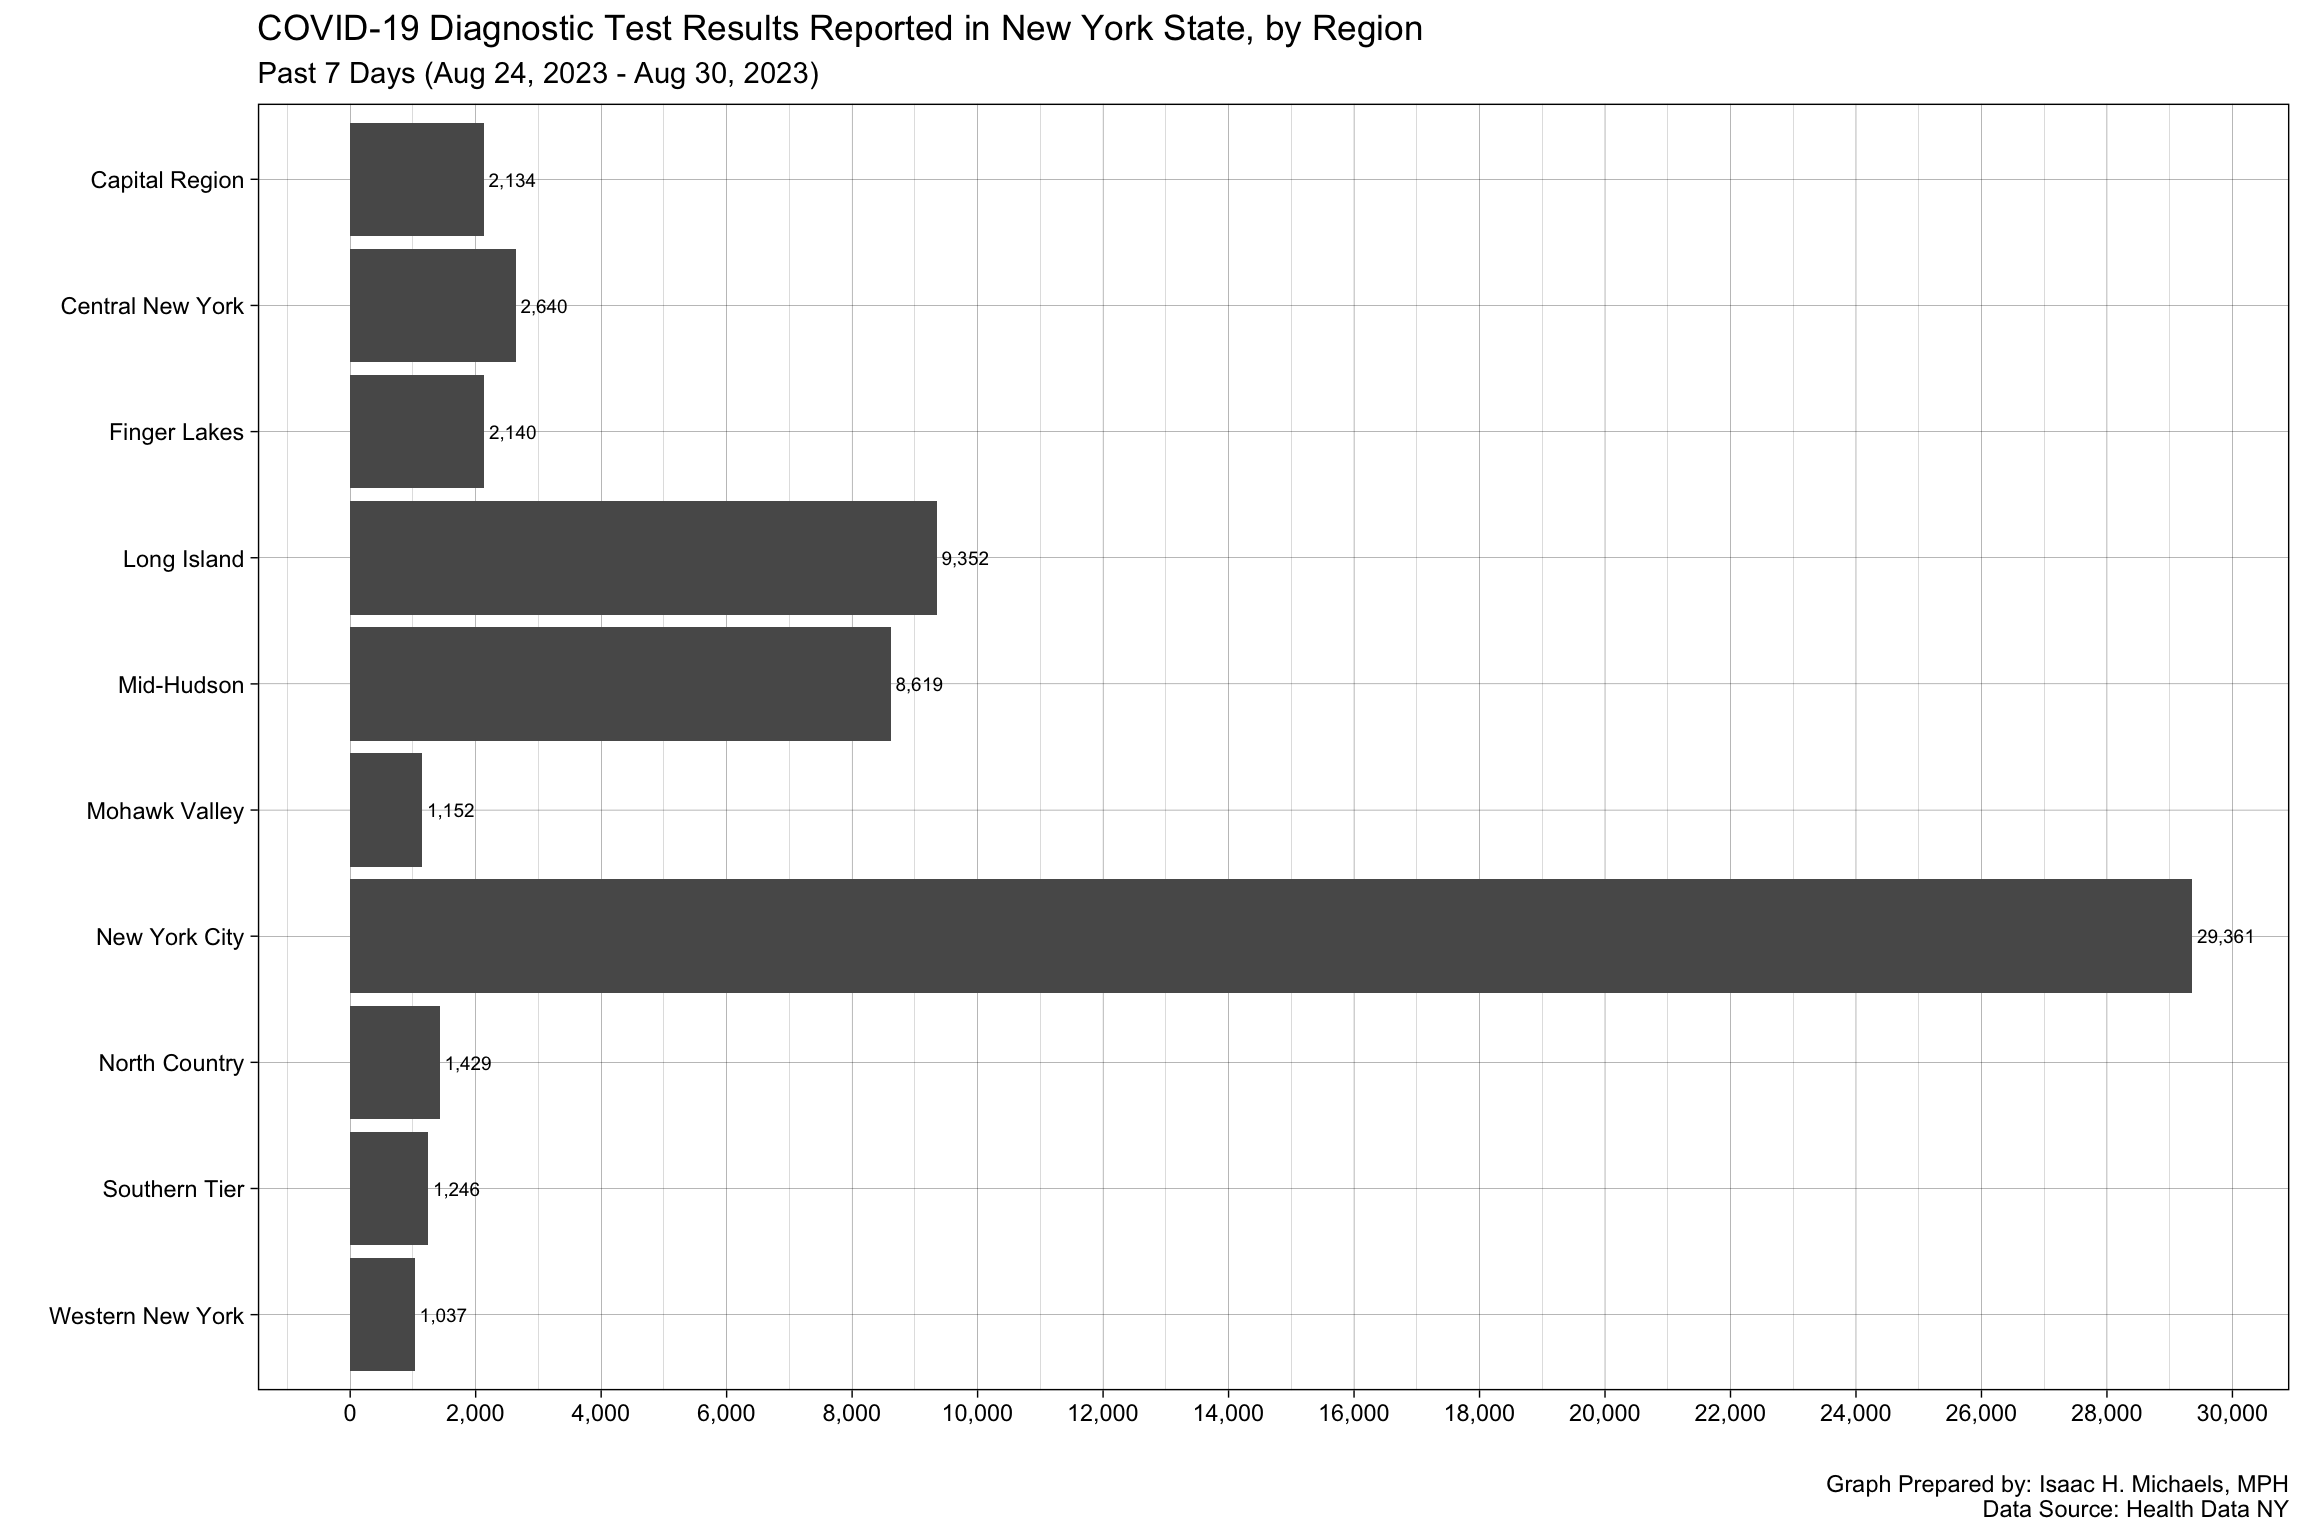
By Region
![]()
Graphs Prepared by: Isaac H. Michaels, MPH
Data Source: Health Data NY (Tests, Population)
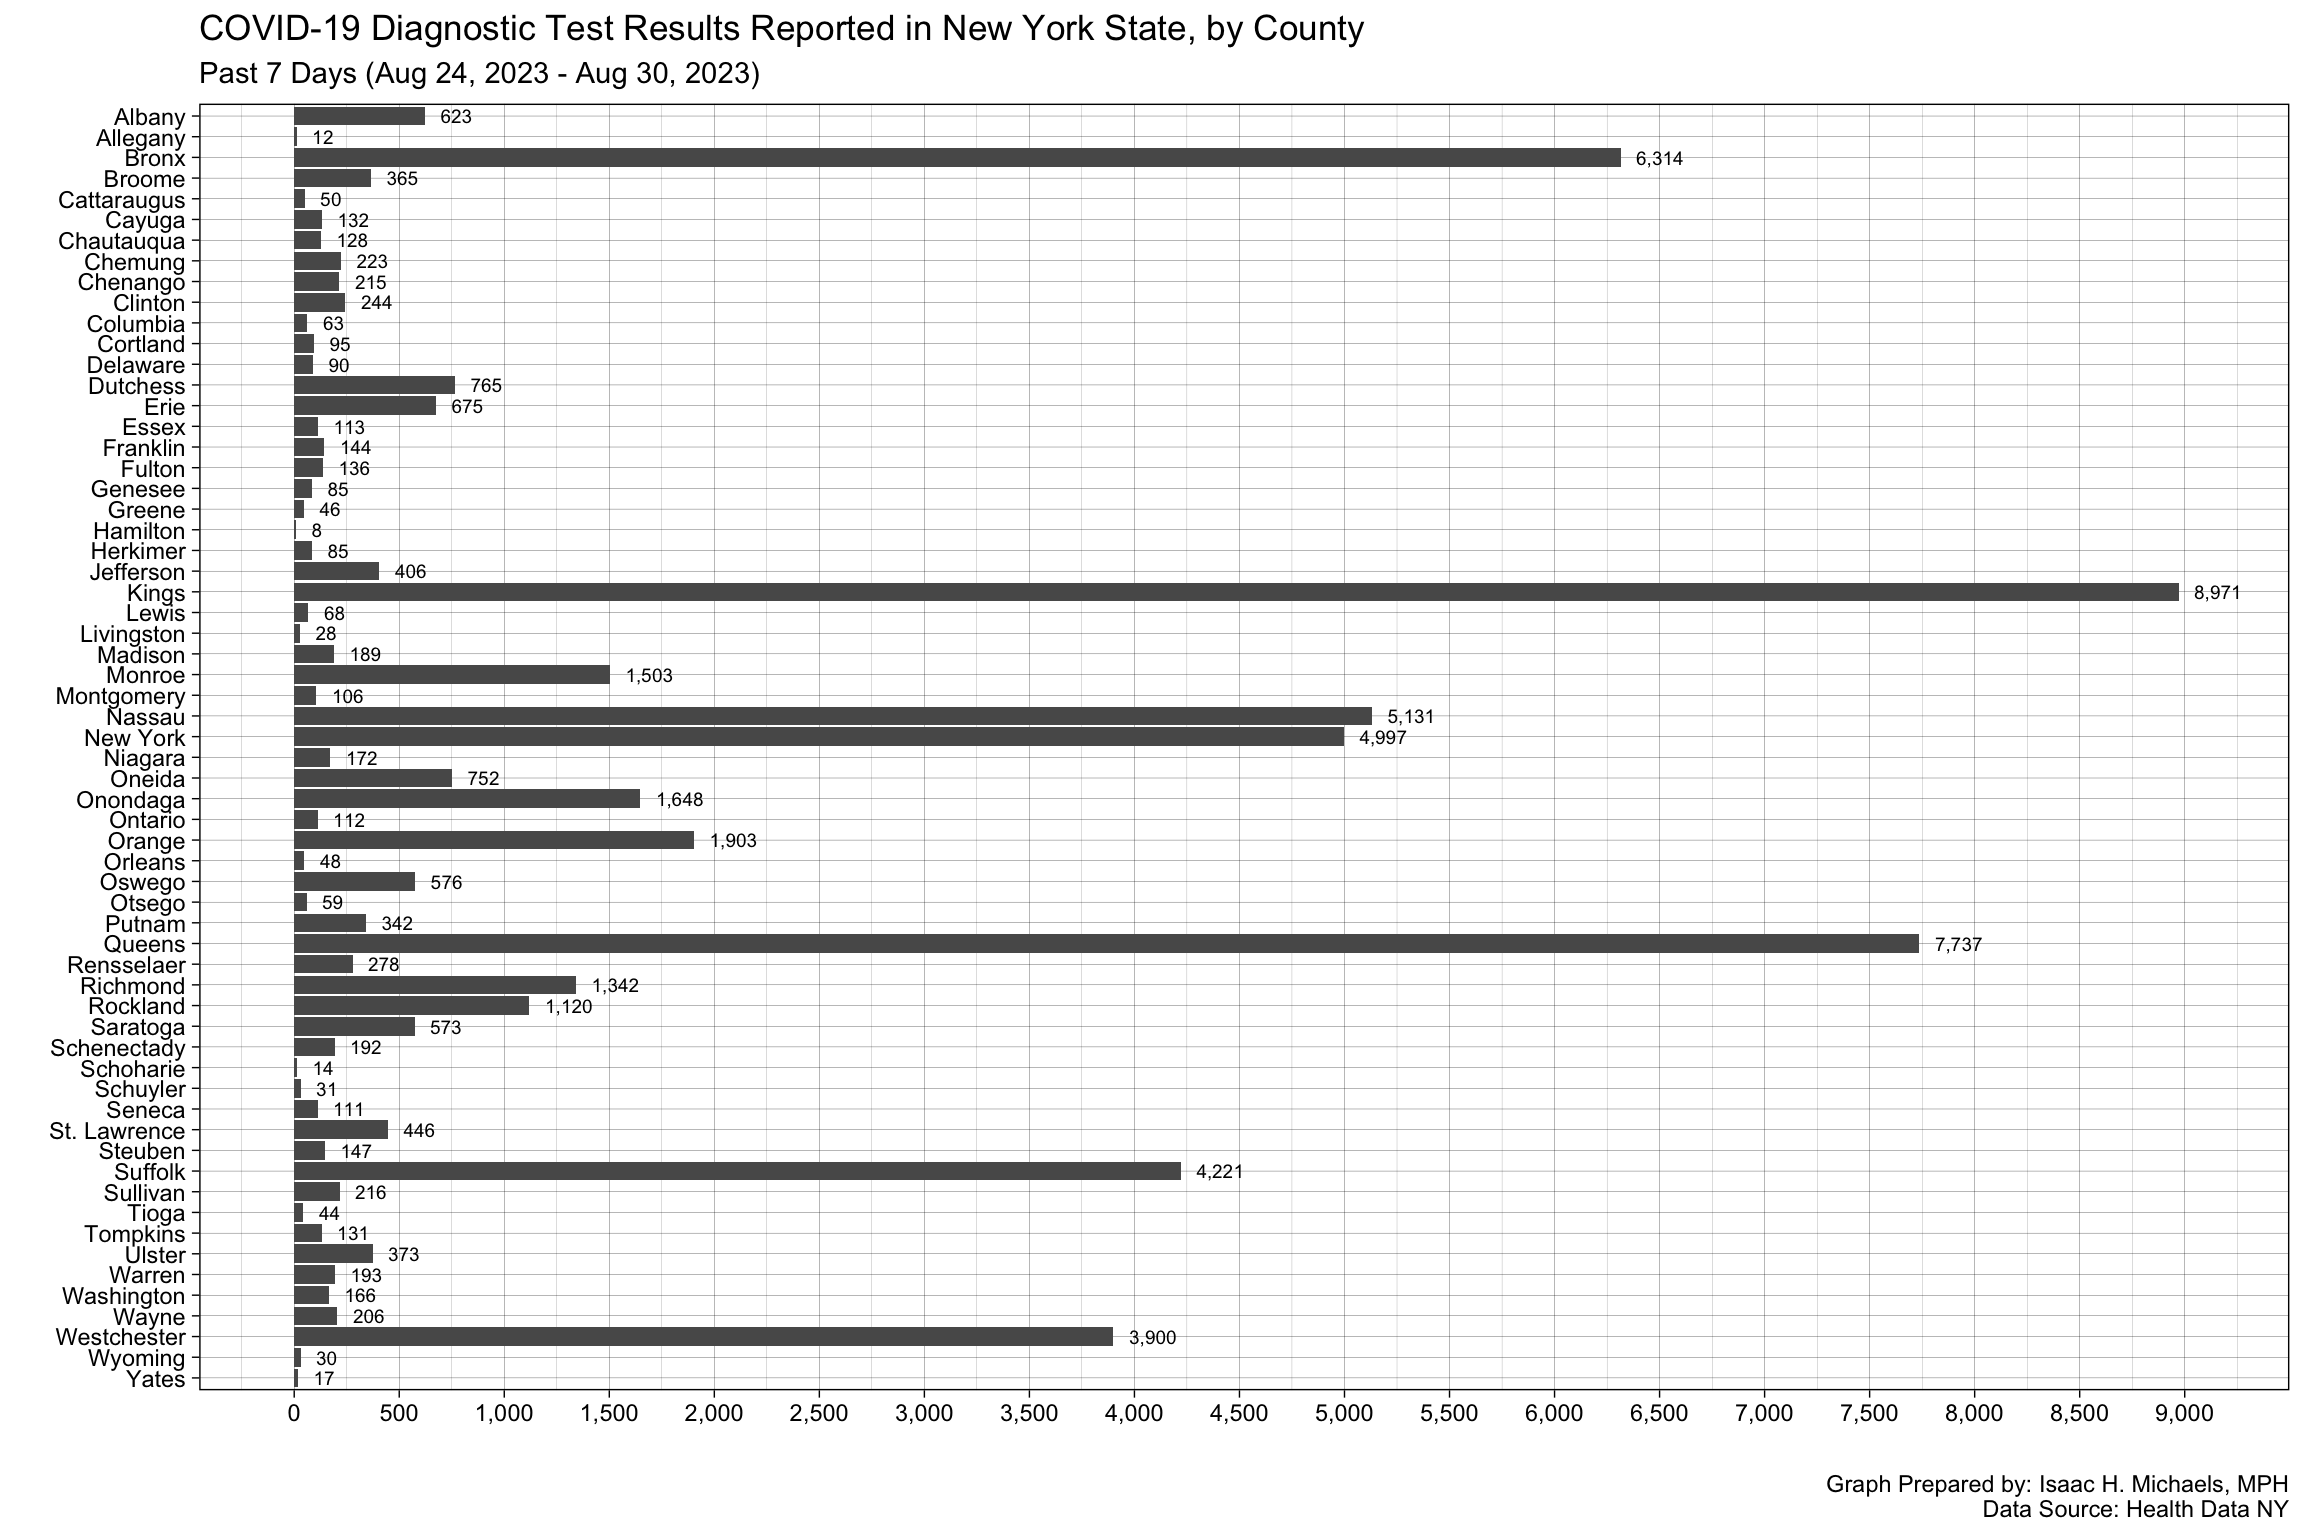
By County
![]()
Graphs Prepared by: Isaac H. Michaels, MPH
Data Source: Health Data NY (Tests, Population)
CDC Transmission Level Definitions ![]()
Table
By Region
| Transmission Level | n | Regions |
|---|---|---|
| High | 10 | Capital Region, Central New York, Finger Lakes, Long Island, Mid-Hudson, Mohawk Valley, New York City, North Country, Southern Tier, Western New York |
| Substantial | 0 | |
| Moderate | 0 | |
| Low | 0 |
Table Prepared by: Isaac H. Michaels, MPH
Data Source: Health Data NY (Tests, Population)
By County
| Transmission Level | n | Counties |
|---|---|---|
| High | 57 | Albany, Allegany, Bronx, Broome, Cattaraugus, Cayuga, Chautauqua, Chemung, Chenango, Clinton, Columbia, Cortland, Delaware, Dutchess, Erie, Essex, Fulton, Genesee, Greene, Hamilton, Herkimer, Kings, Lewis, Livingston, Monroe, Montgomery, Nassau, New York, Niagara, Oneida, Onondaga, Ontario, Orange, Orleans, Oswego, Otsego, Putnam, Queens, Rensselaer, Richmond, Rockland, Saratoga, Schenectady, Schoharie, Schuyler, Steuben, Suffolk, Sullivan, Tioga, Tompkins, Ulster, Warren, Washington, Wayne, Westchester, Wyoming, Yates |
| Substantial | 4 | Franklin, Jefferson, Madison, St. Lawrence |
| Moderate | 1 | Seneca |
| Low | 0 |
Table Prepared by: Isaac H. Michaels, MPH
Data Source: Health Data NY (Tests, Population)
Animated Graphs
Region-Level Transmission Levels
Graph Prepared By: Isaac H. Michaels, MPH
Data Source: Health Data NY
County-Level Transmission Levels
Graph Prepared By: Isaac H. Michaels, MPH
Data Source: Health Data NY
COVID-19 Confirmed Cases
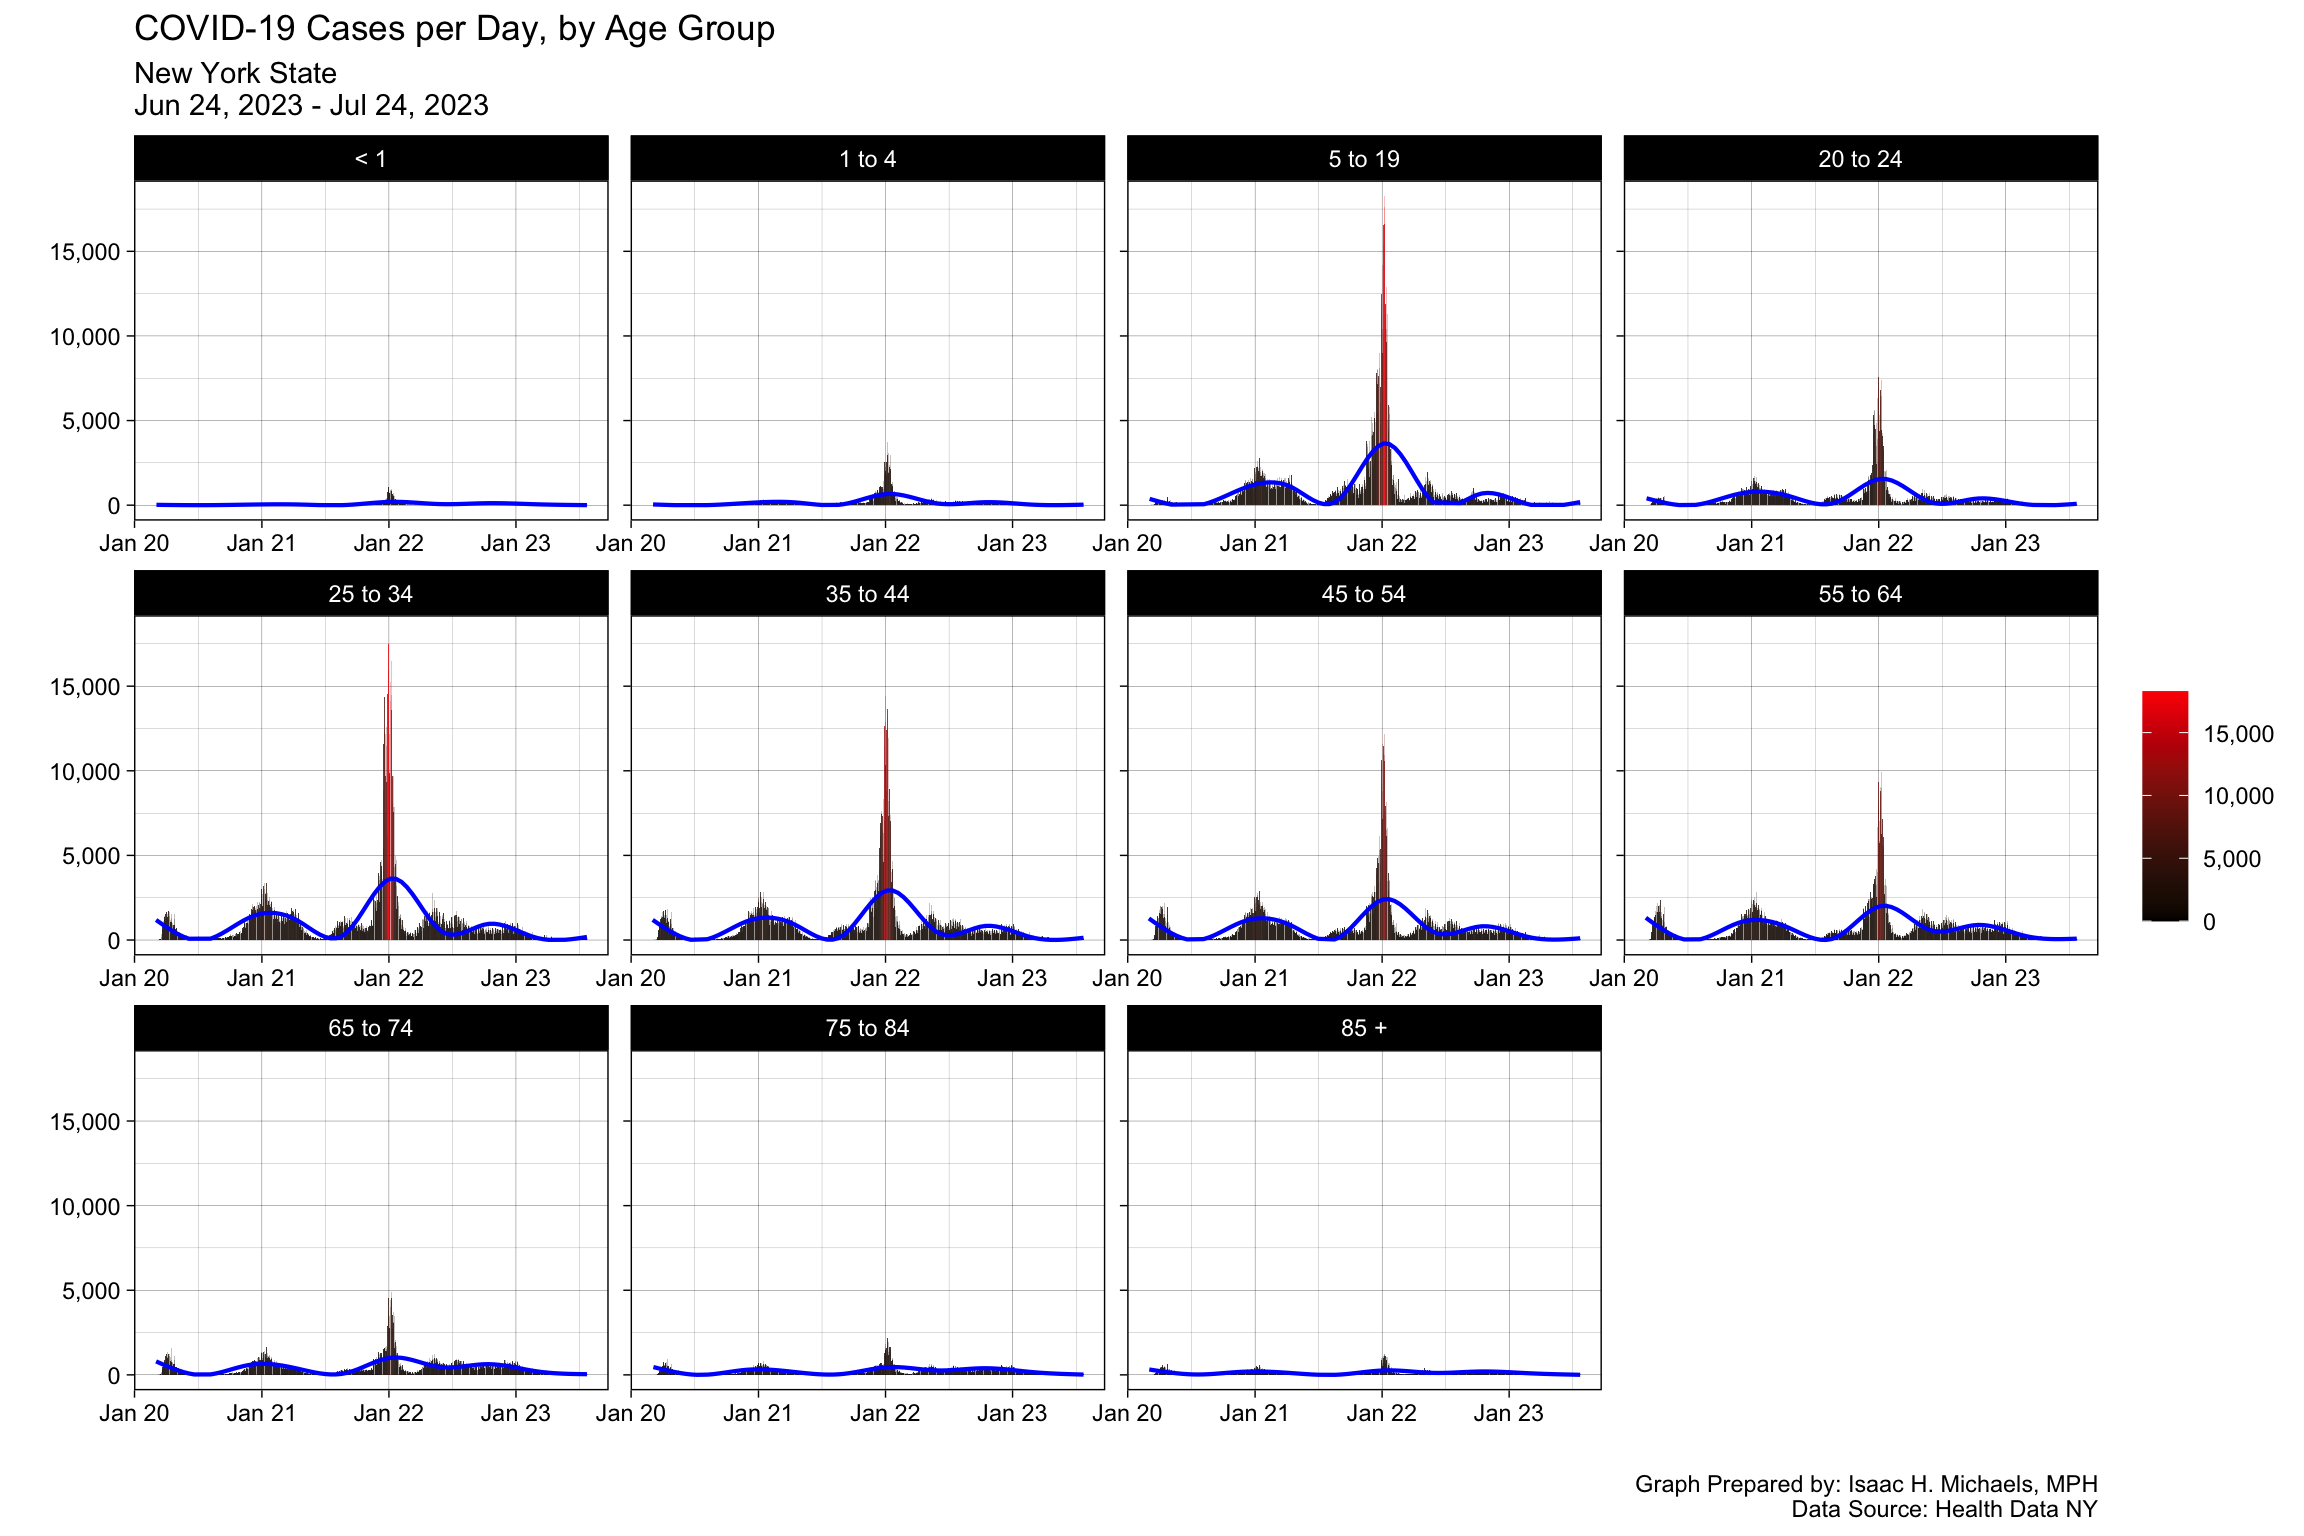
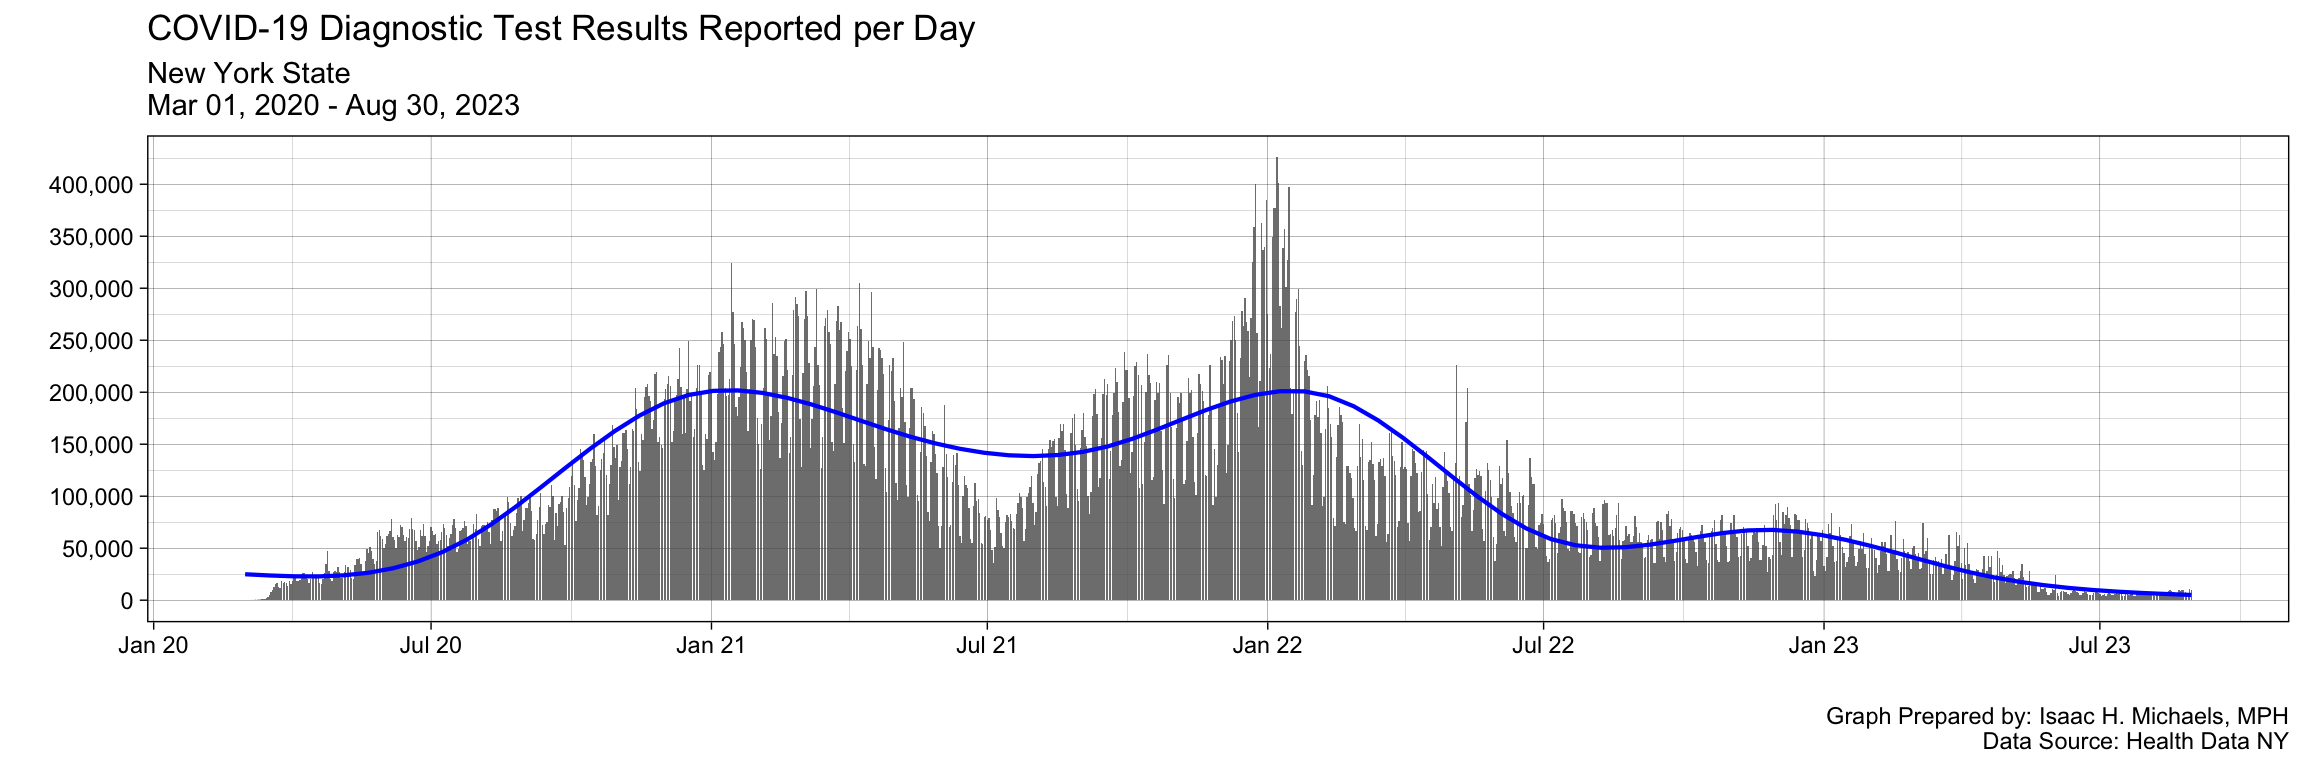
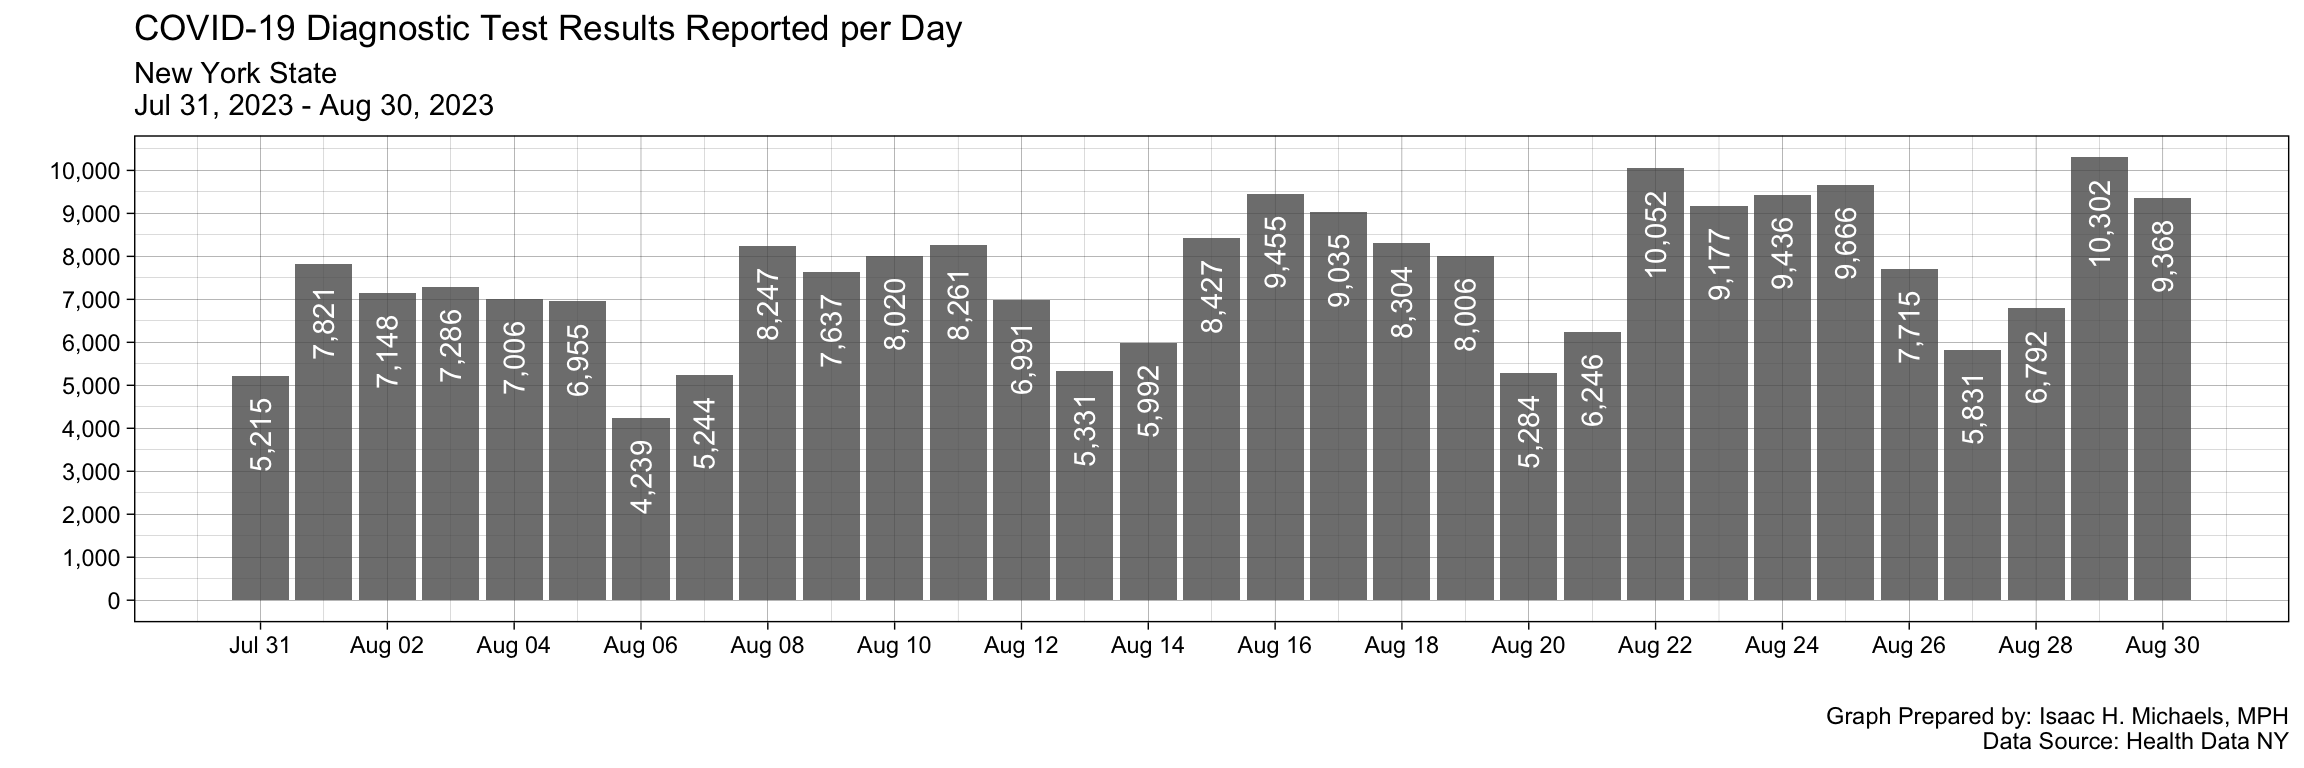
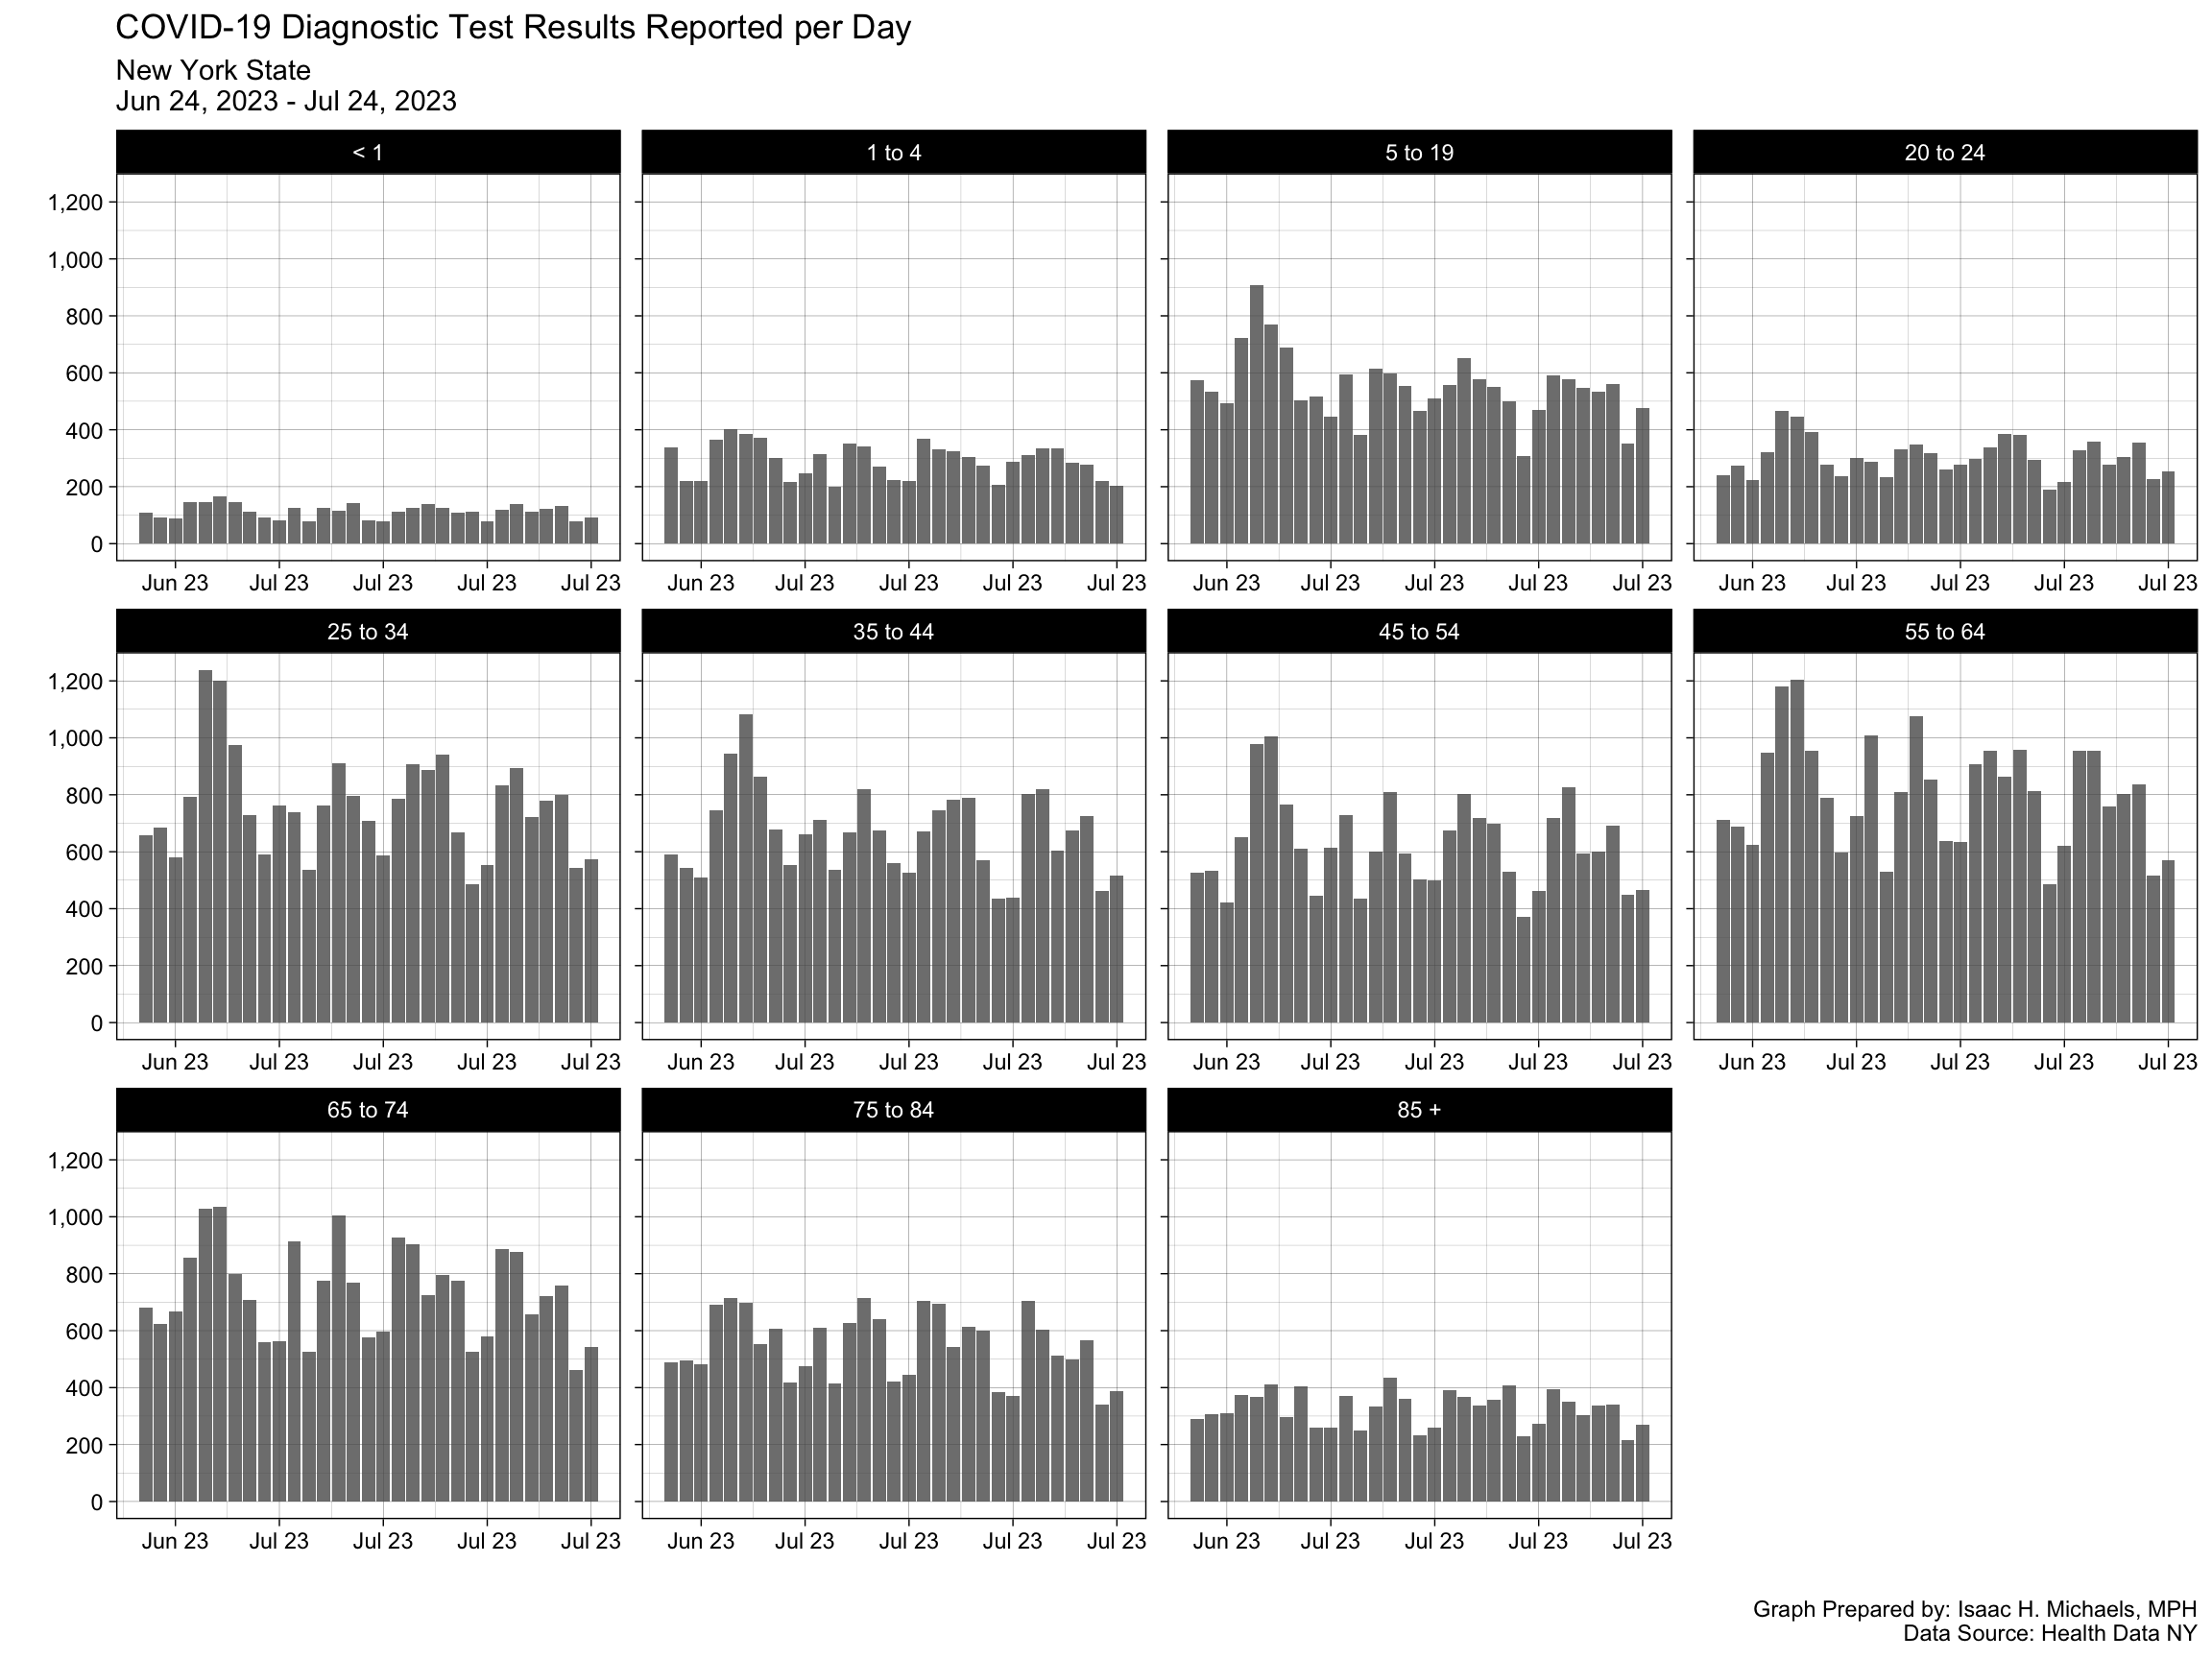
Diagnostic Tests Performed Per Day
Overall
By Age Group

Test Positivity Rate Trend
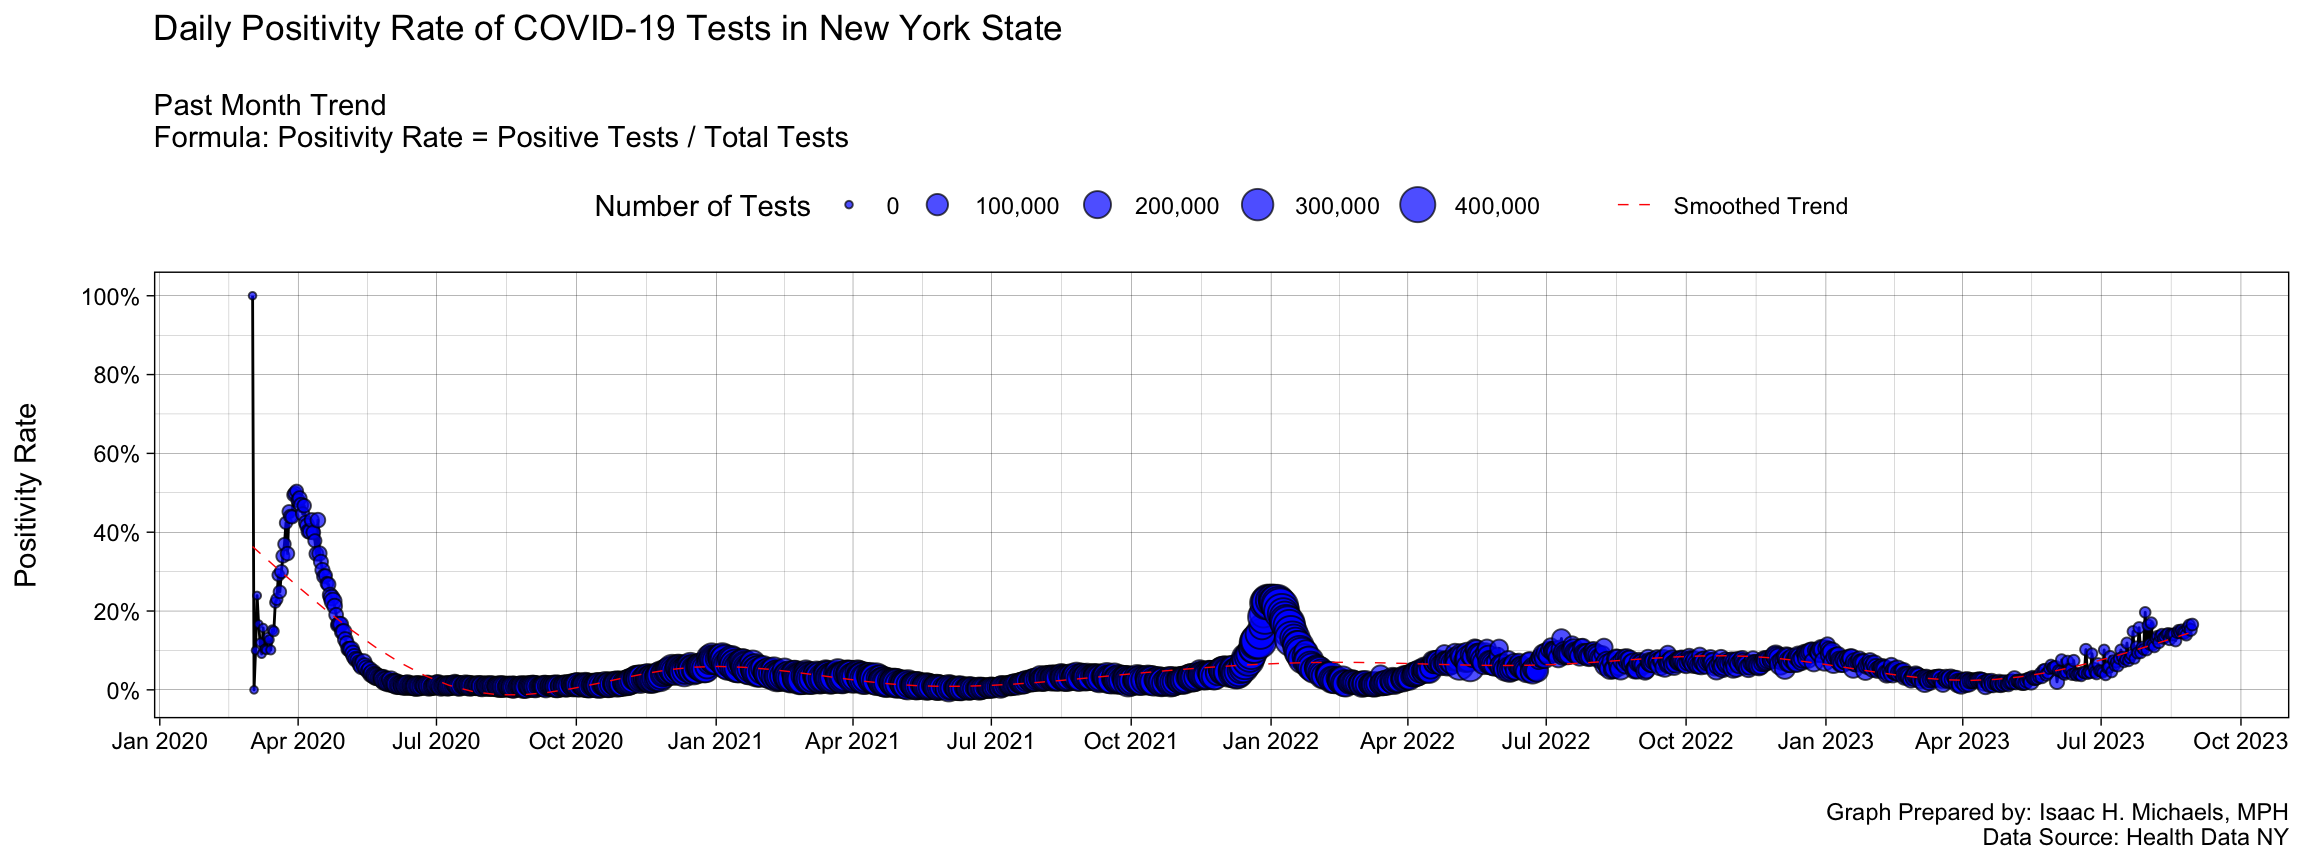
Statewide Test Positivity Rates (March 3, 2020 to Present)
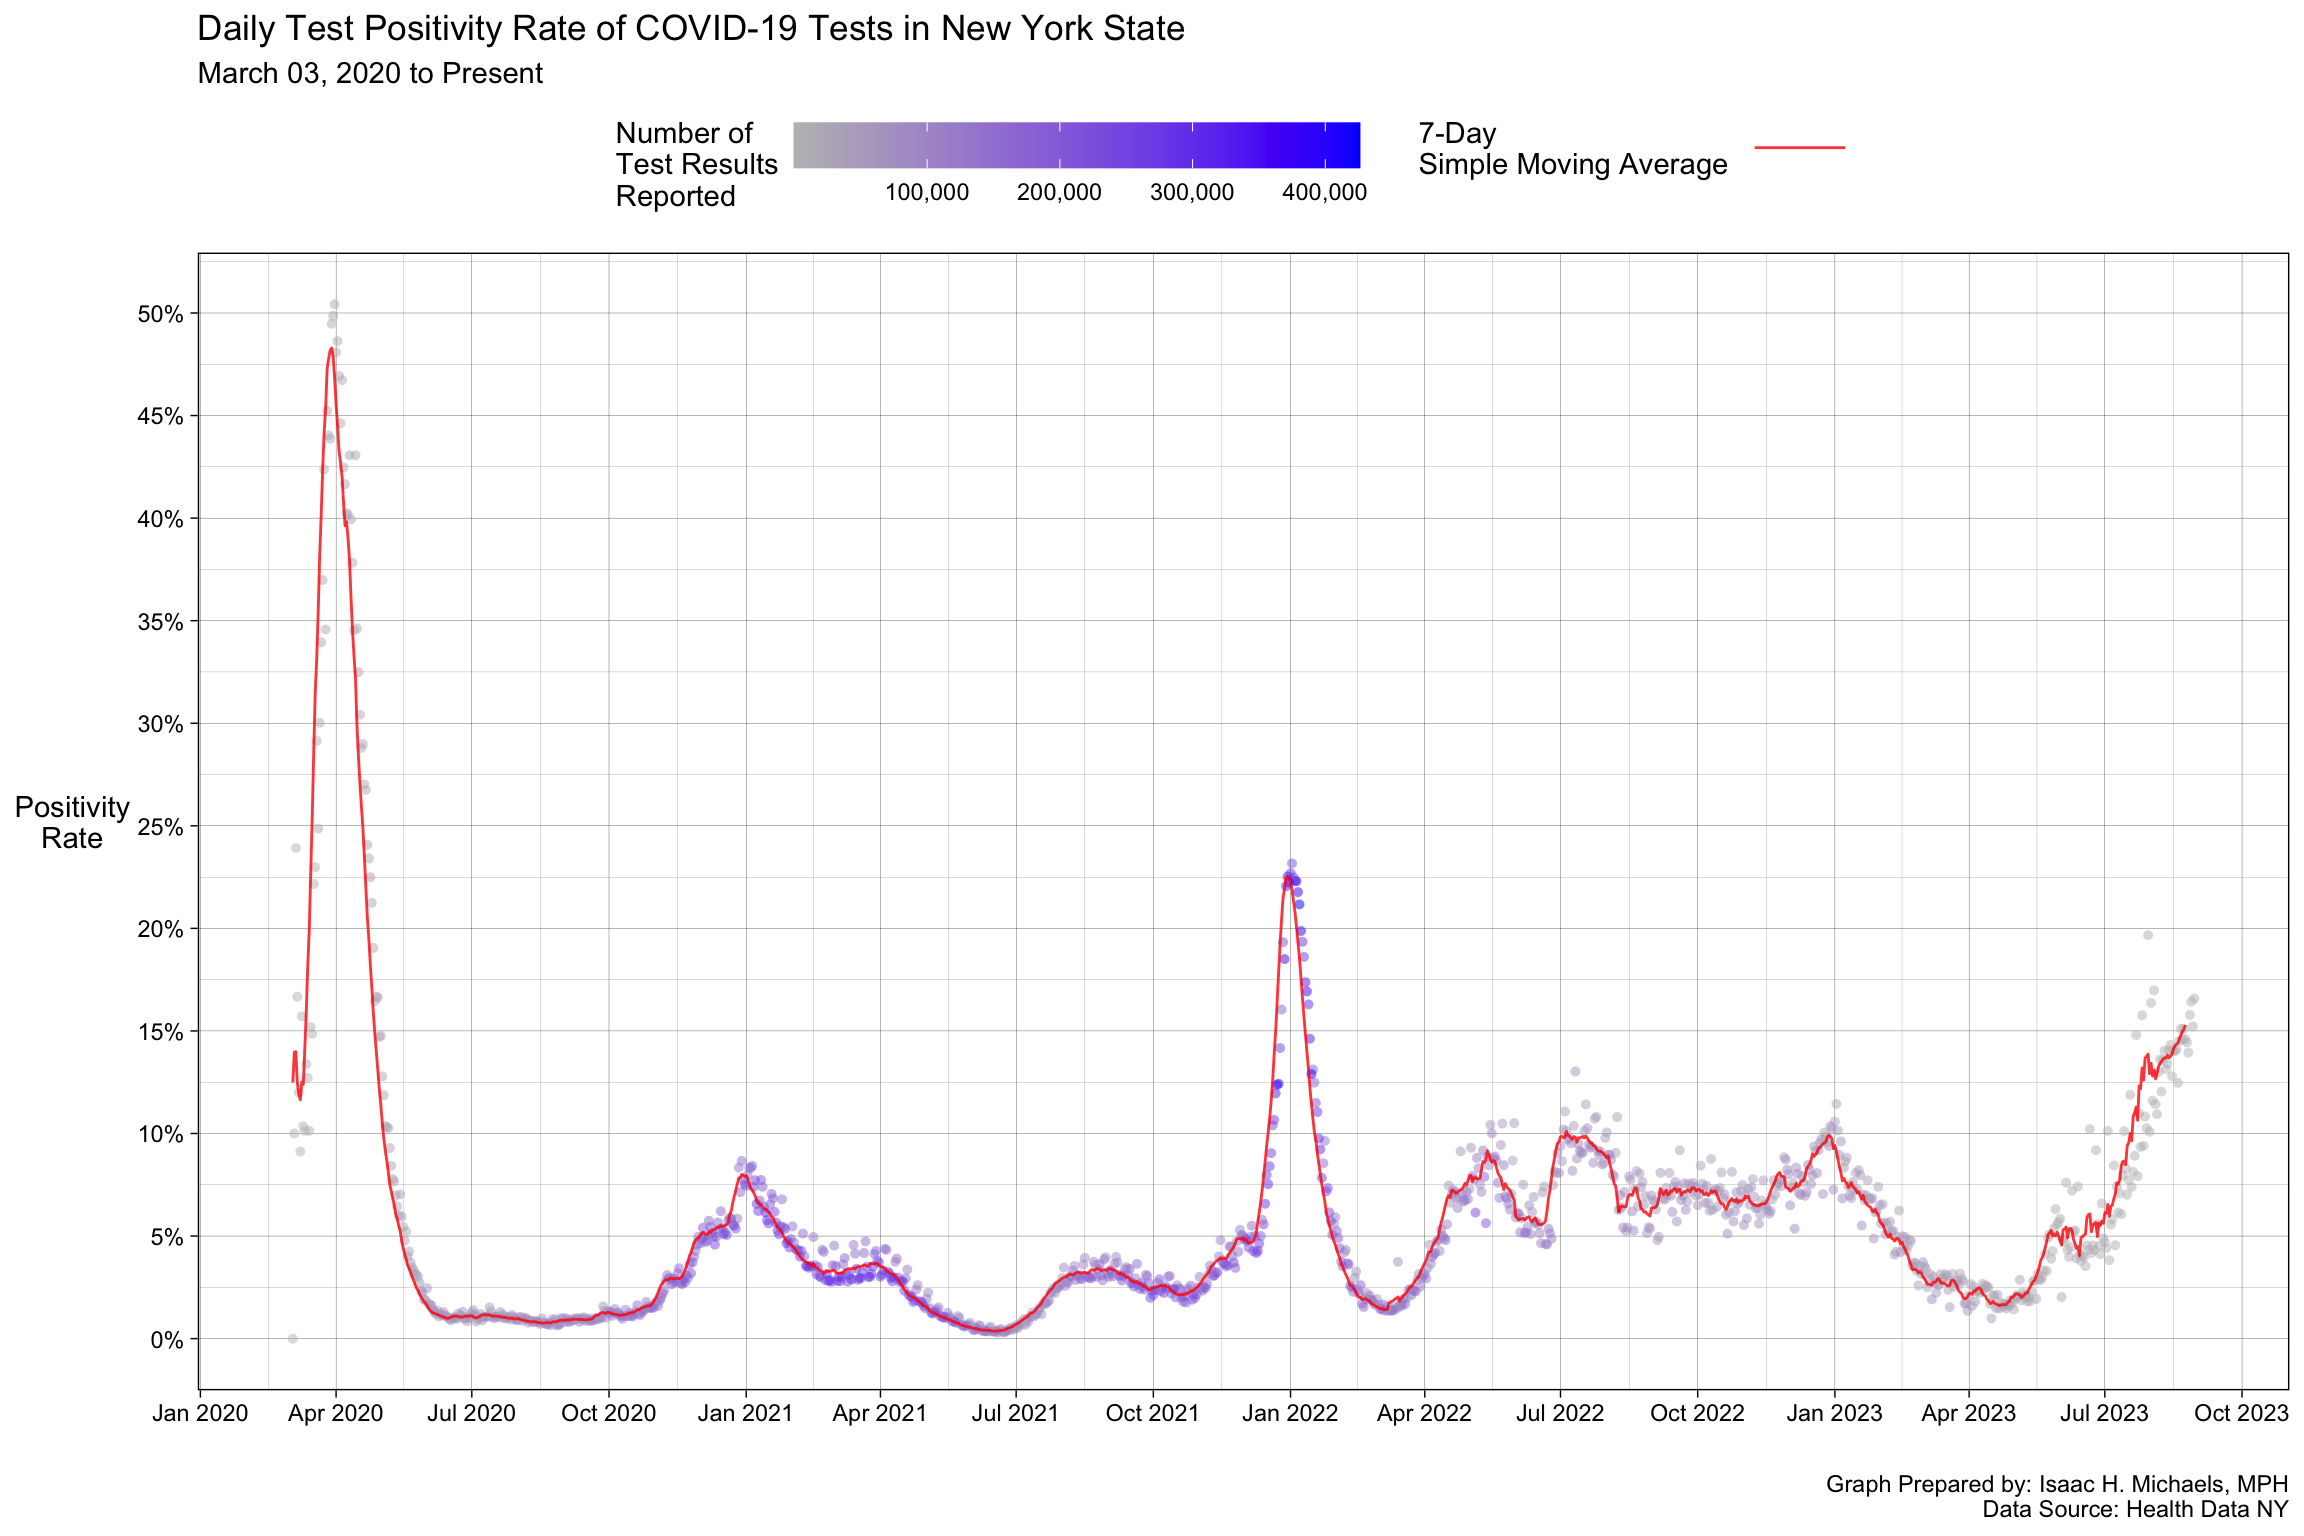
Graph Prepared by: Isaac H. Michaels, MPH
Data Source: Health Data NY
Past Month Test Positivity Rate
Regions
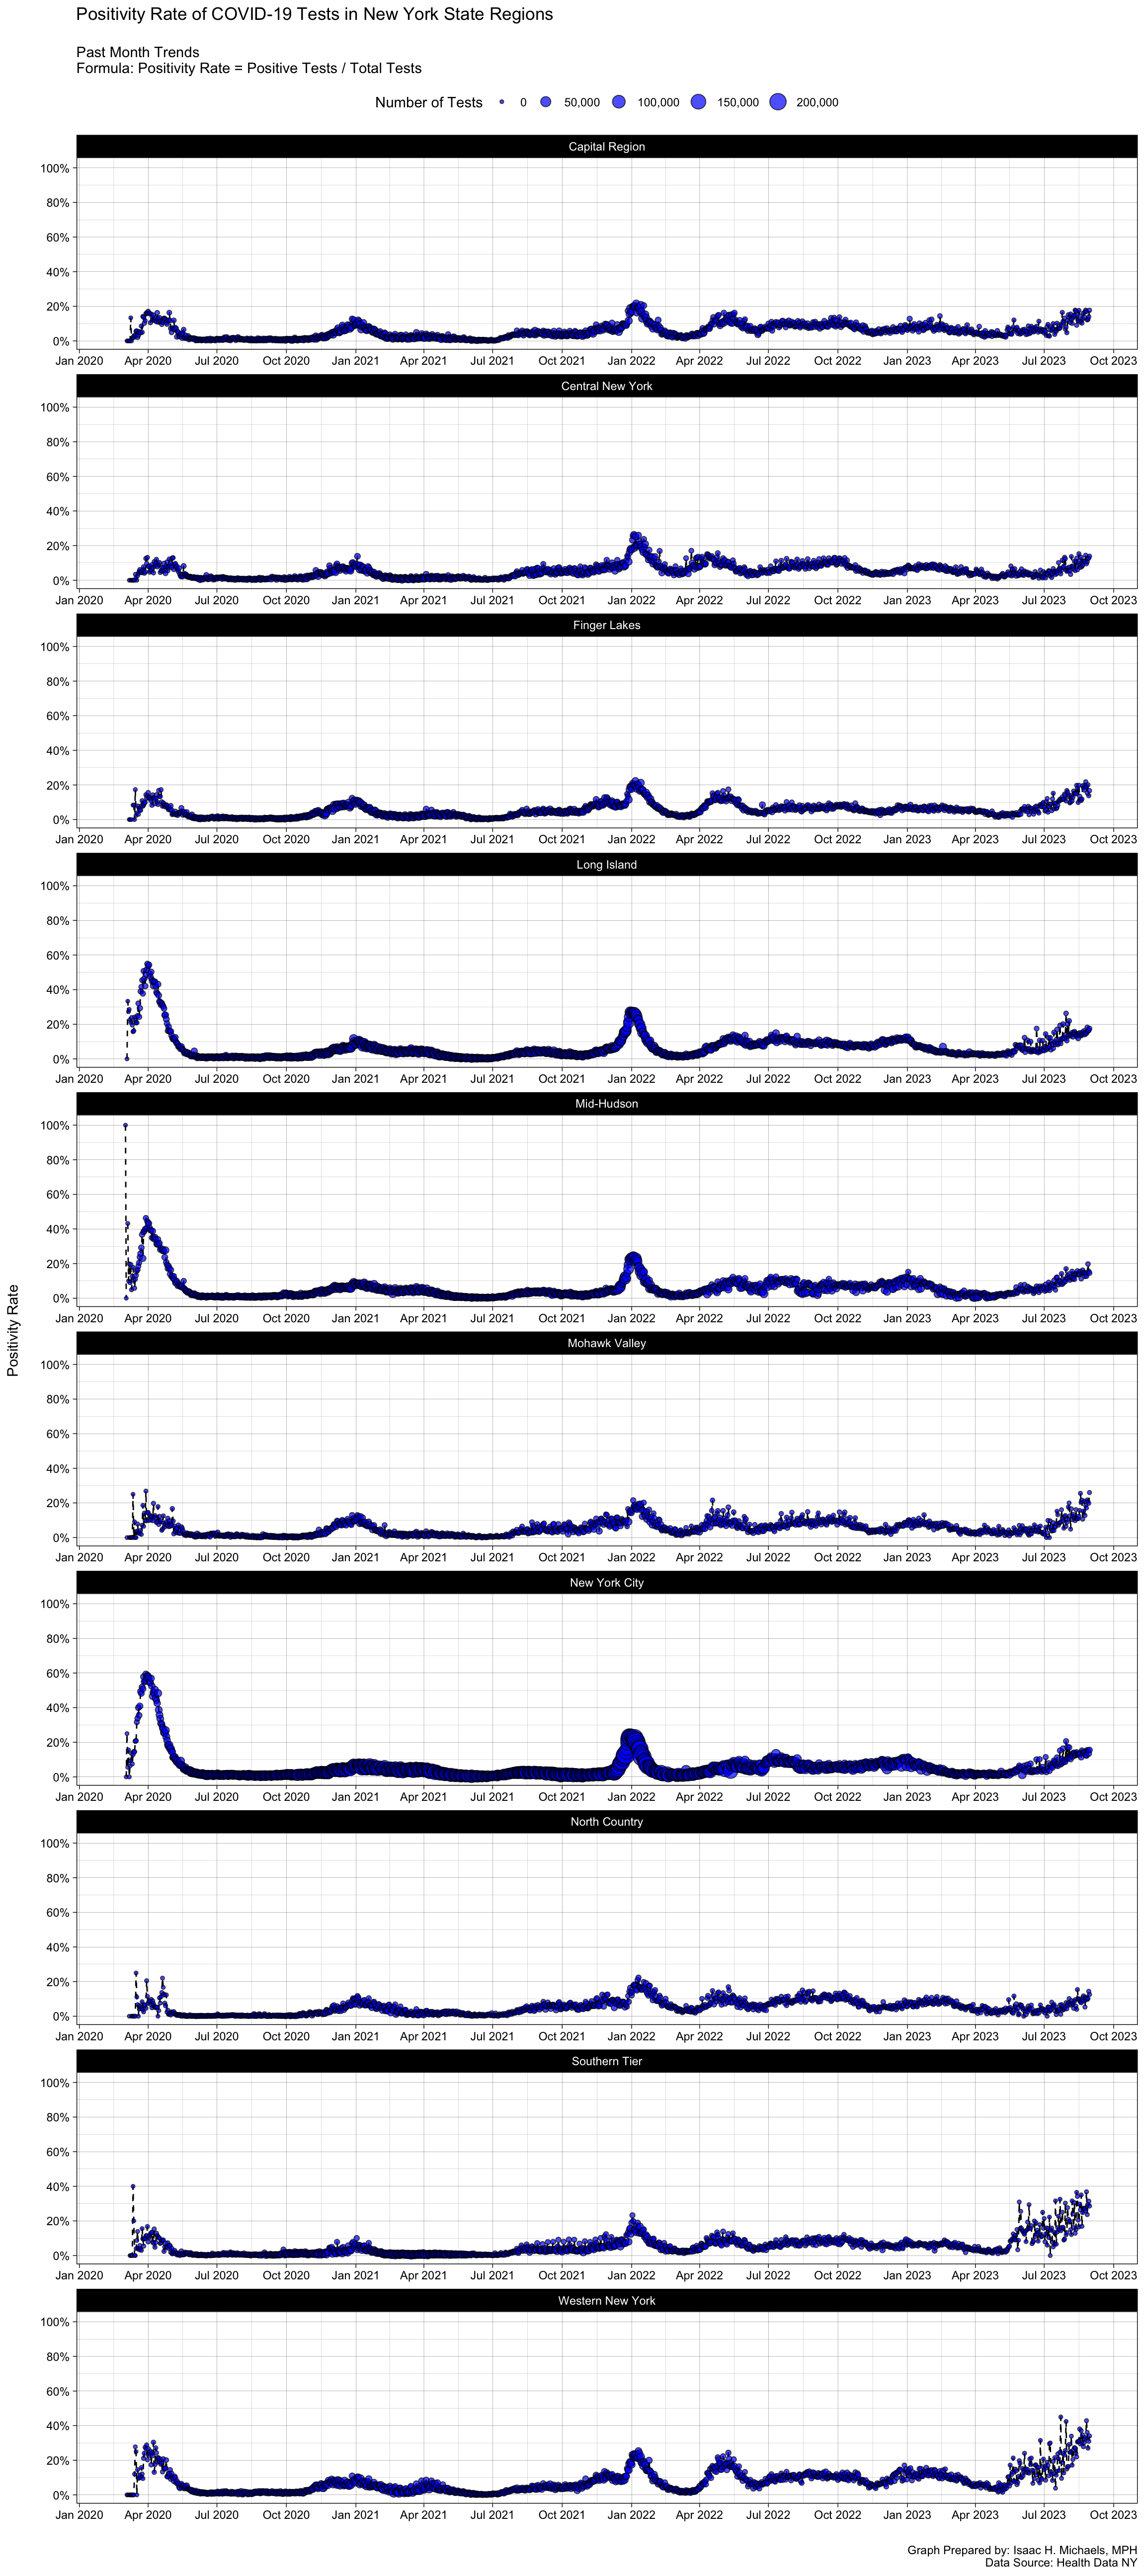
Graph Prepared by: Isaac H. Michaels, MPH
Data Source: Health Data NY
Regions include the following counties:
Capital Region: Albany, Columbia, Greene, Saratoga, Schenectady, Rensselaer, Warren, Washington
Central New York: Cayuga, Cortland, Madison, Onondaga, Oswego
Finger Lakes: Genesee, Livingston, Monroe, Ontario, Orleans, Seneca, Wayne, Wyoming, Yates
Long Island: Nassau, Suffolk
Mid-Hudson: Dutchess, Orange, Putnam, Rockland, Sullivan, Ulster, Westchester
Mohawk Valley: Fulton, Herkimer, Montgomery, Oneida, Otsego, Schoharie
New York City: Bronx, Kings, New York, Richmond, Queens
North Country: Clinton, Essex, Franklin, Hamilton, Jefferson, Lewis, St. Lawrence
Southern Tier: Broome, Chemung, Chenango, Delaware, Schuyler, Steuben, Tioga, Tompkins
Western New York: Allegany, Cattaraugus, Chautauqua, Erie, Niagara

COVID-19 Self-Test Results
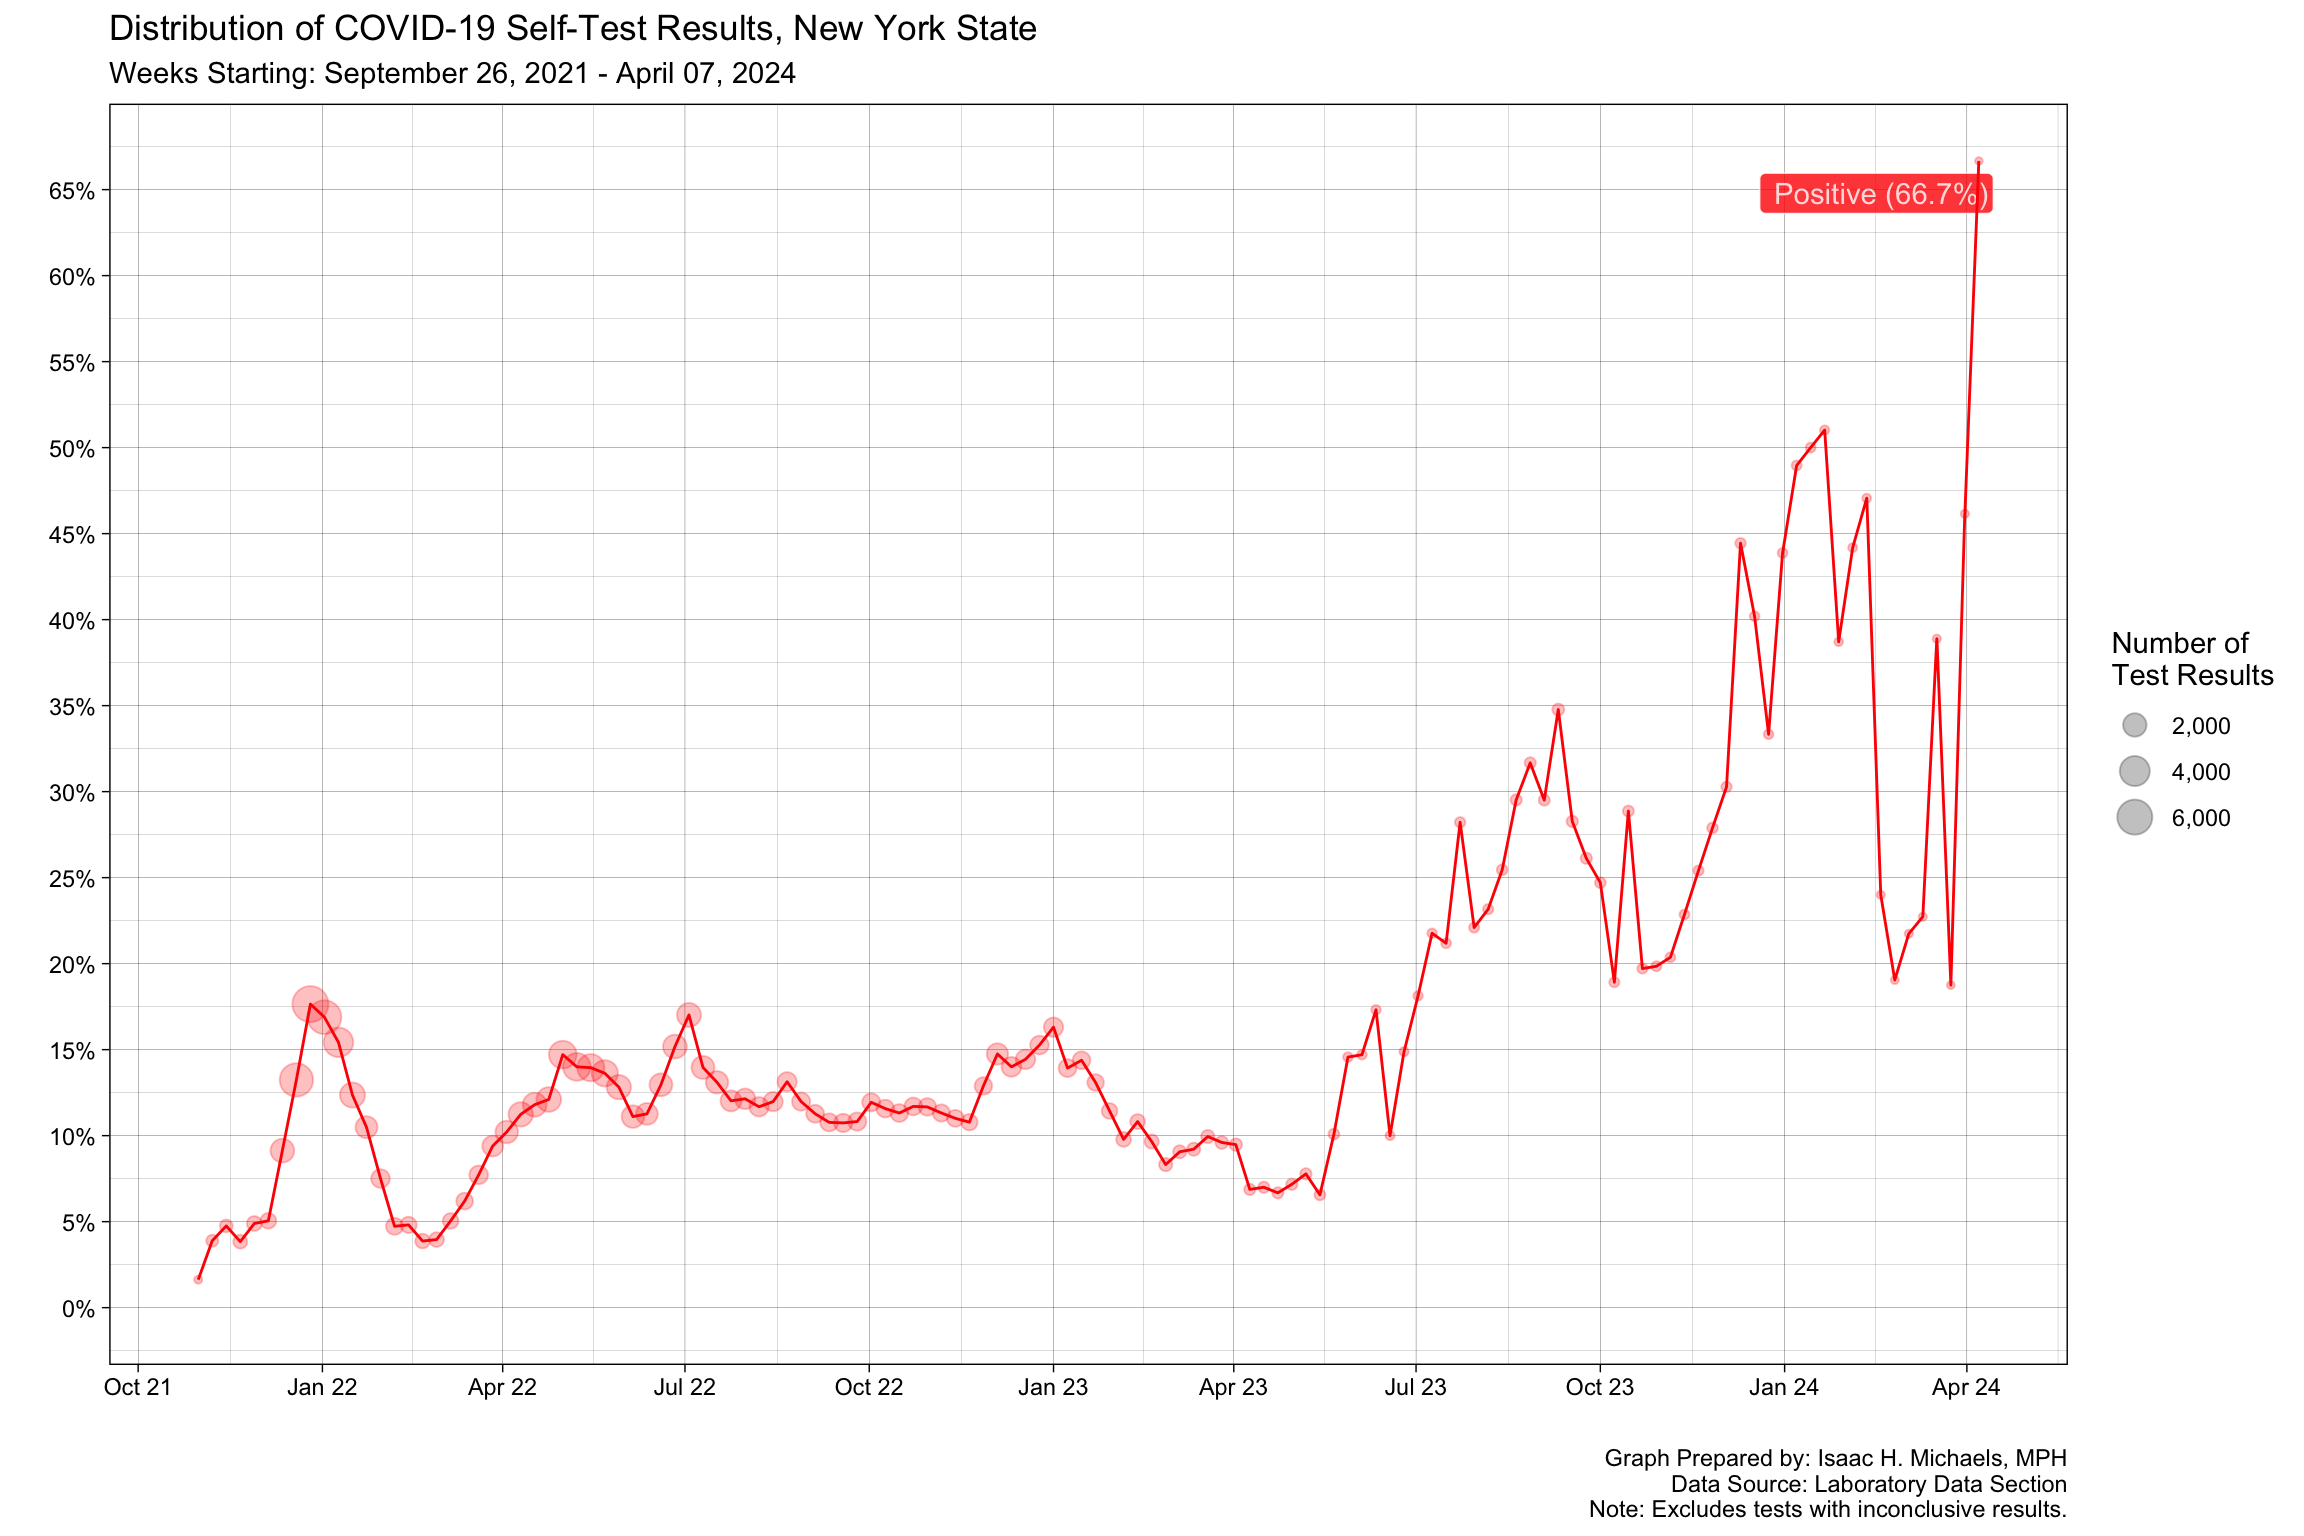
Graph Prepared by: Isaac H. Michaels, MPH
Data Source: Laboratory Data Section
Schools
Positive COVID-19 Tests Reported by Schools in New York State
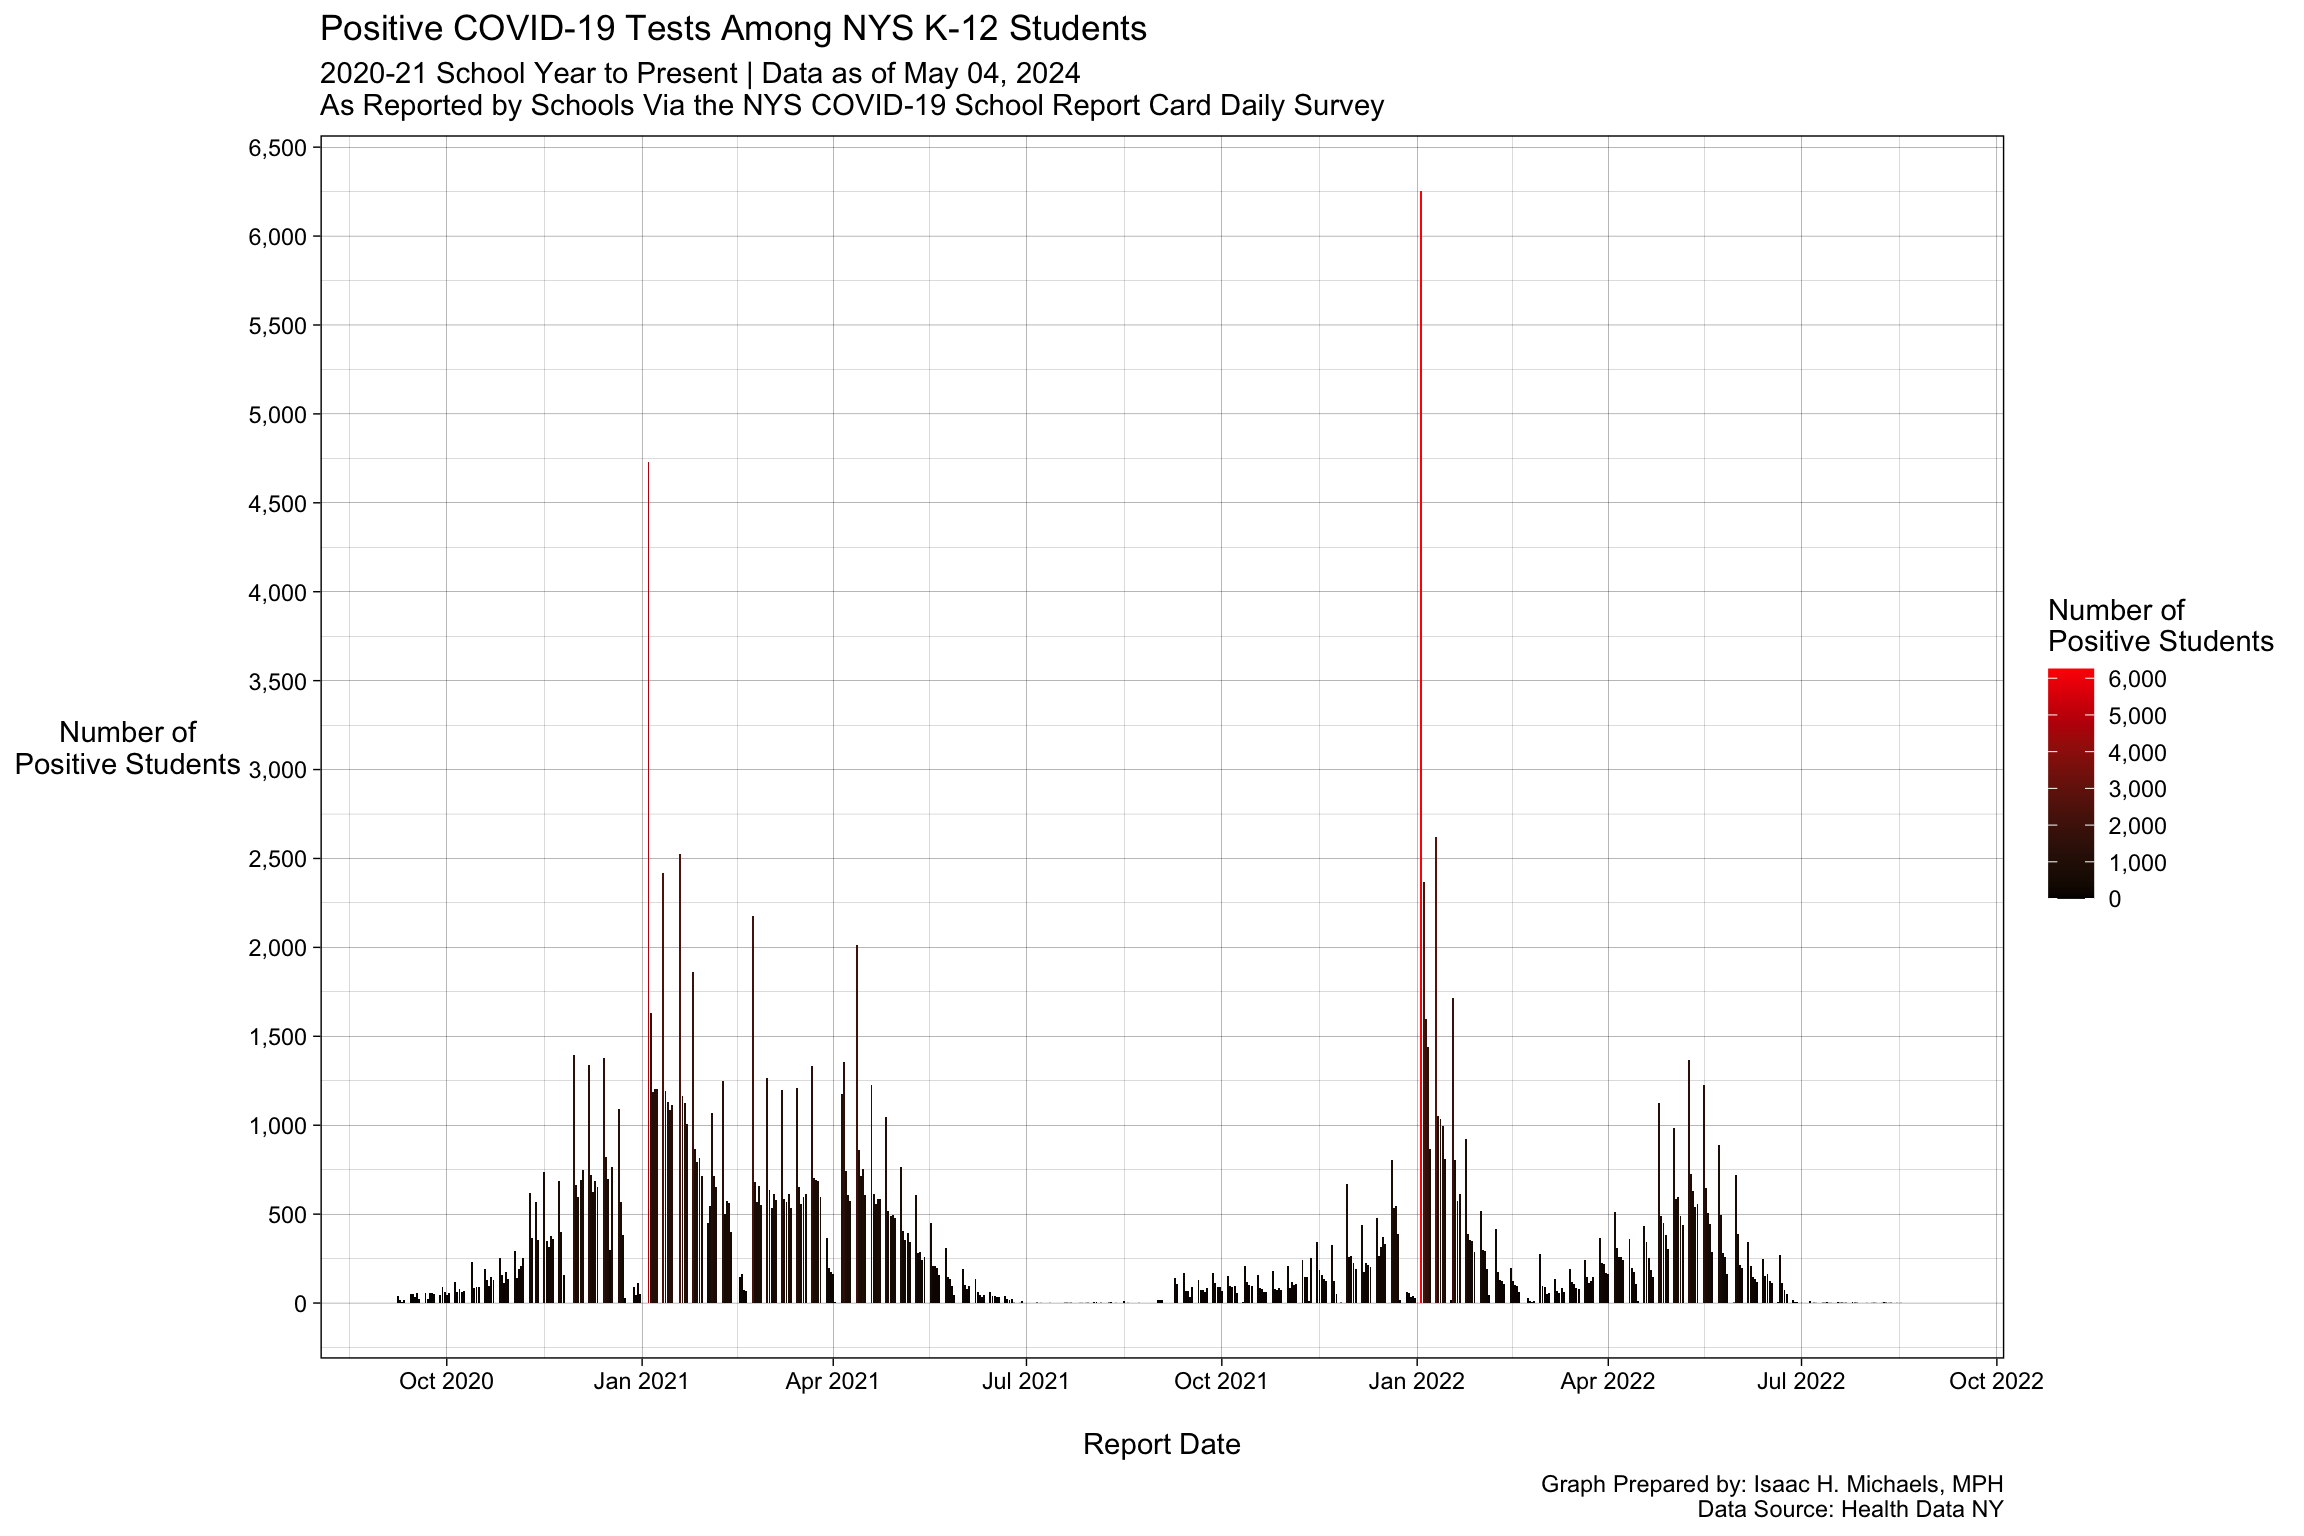
Graph Prepared by: Isaac H. Michaels, MPH
Data Source: Health Data NY(2020-2021, Public Schools 2021-2022, Private Schools 2021-2022, Charter Schools 2021-2022, BOCES Schools 2021-2022)
Positive COVID-19 Tests Reported by Public Schools in New York City
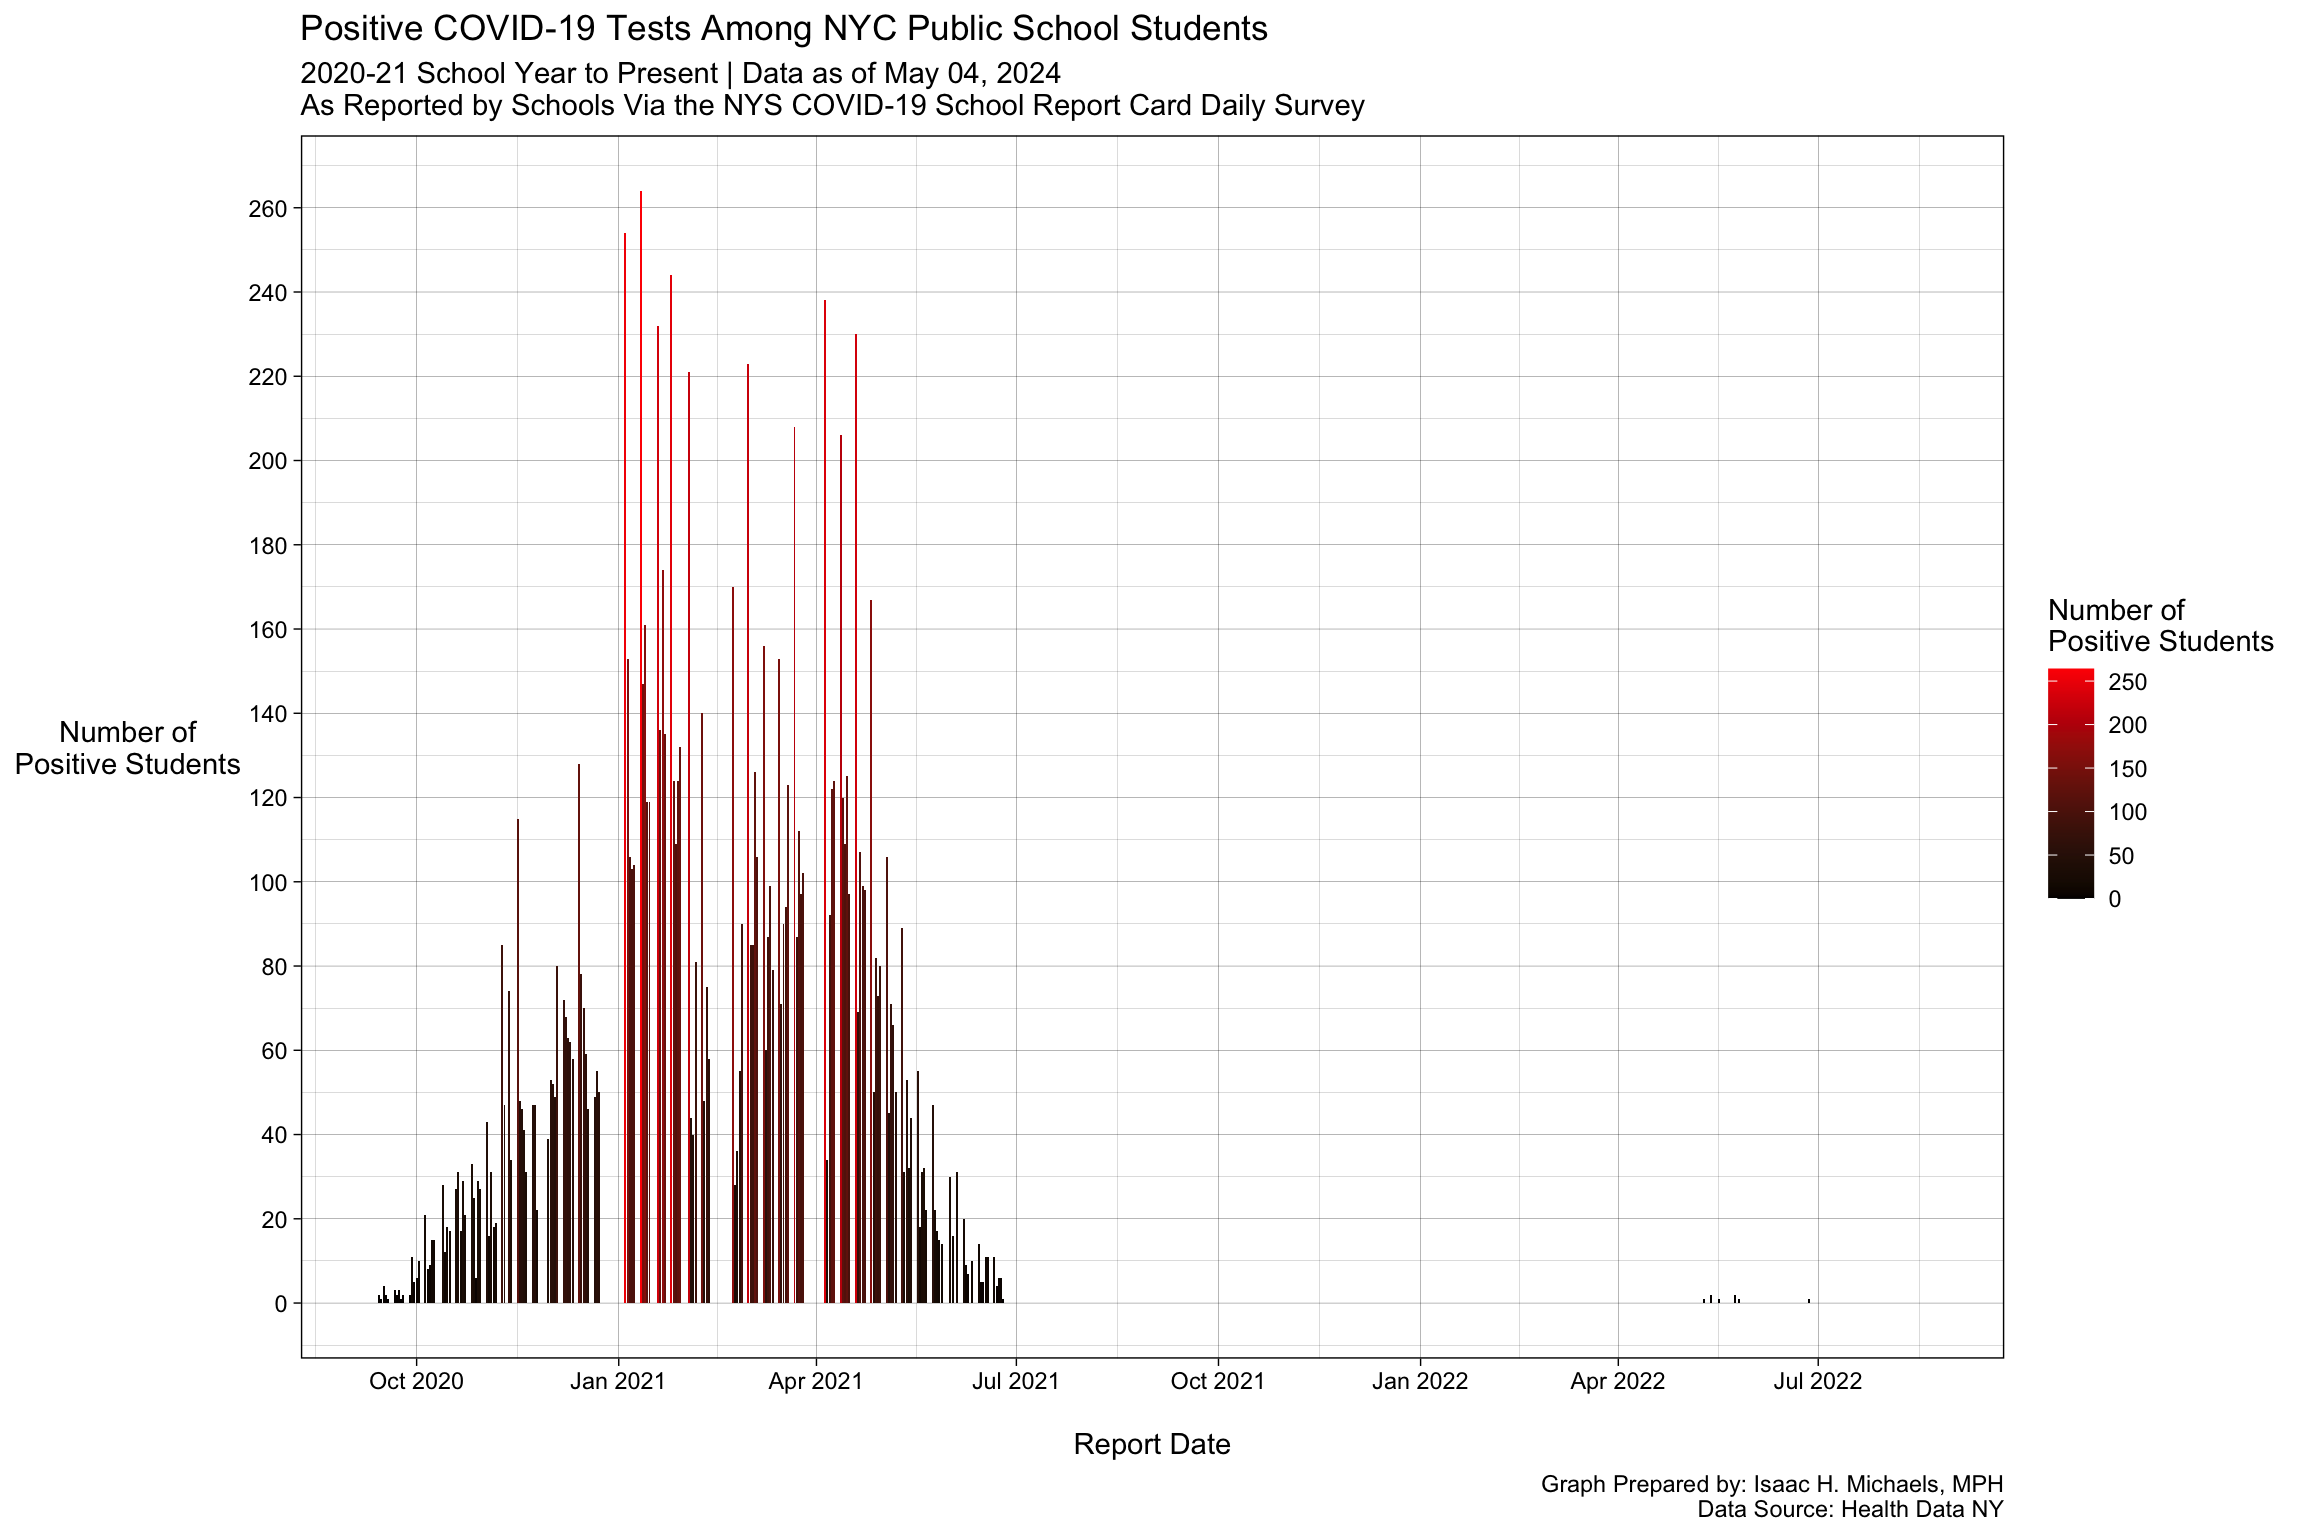
Graph Prepared by: Isaac H. Michaels, MPH
Data Source: Health Data NY(2020-2021, 2021-2022)
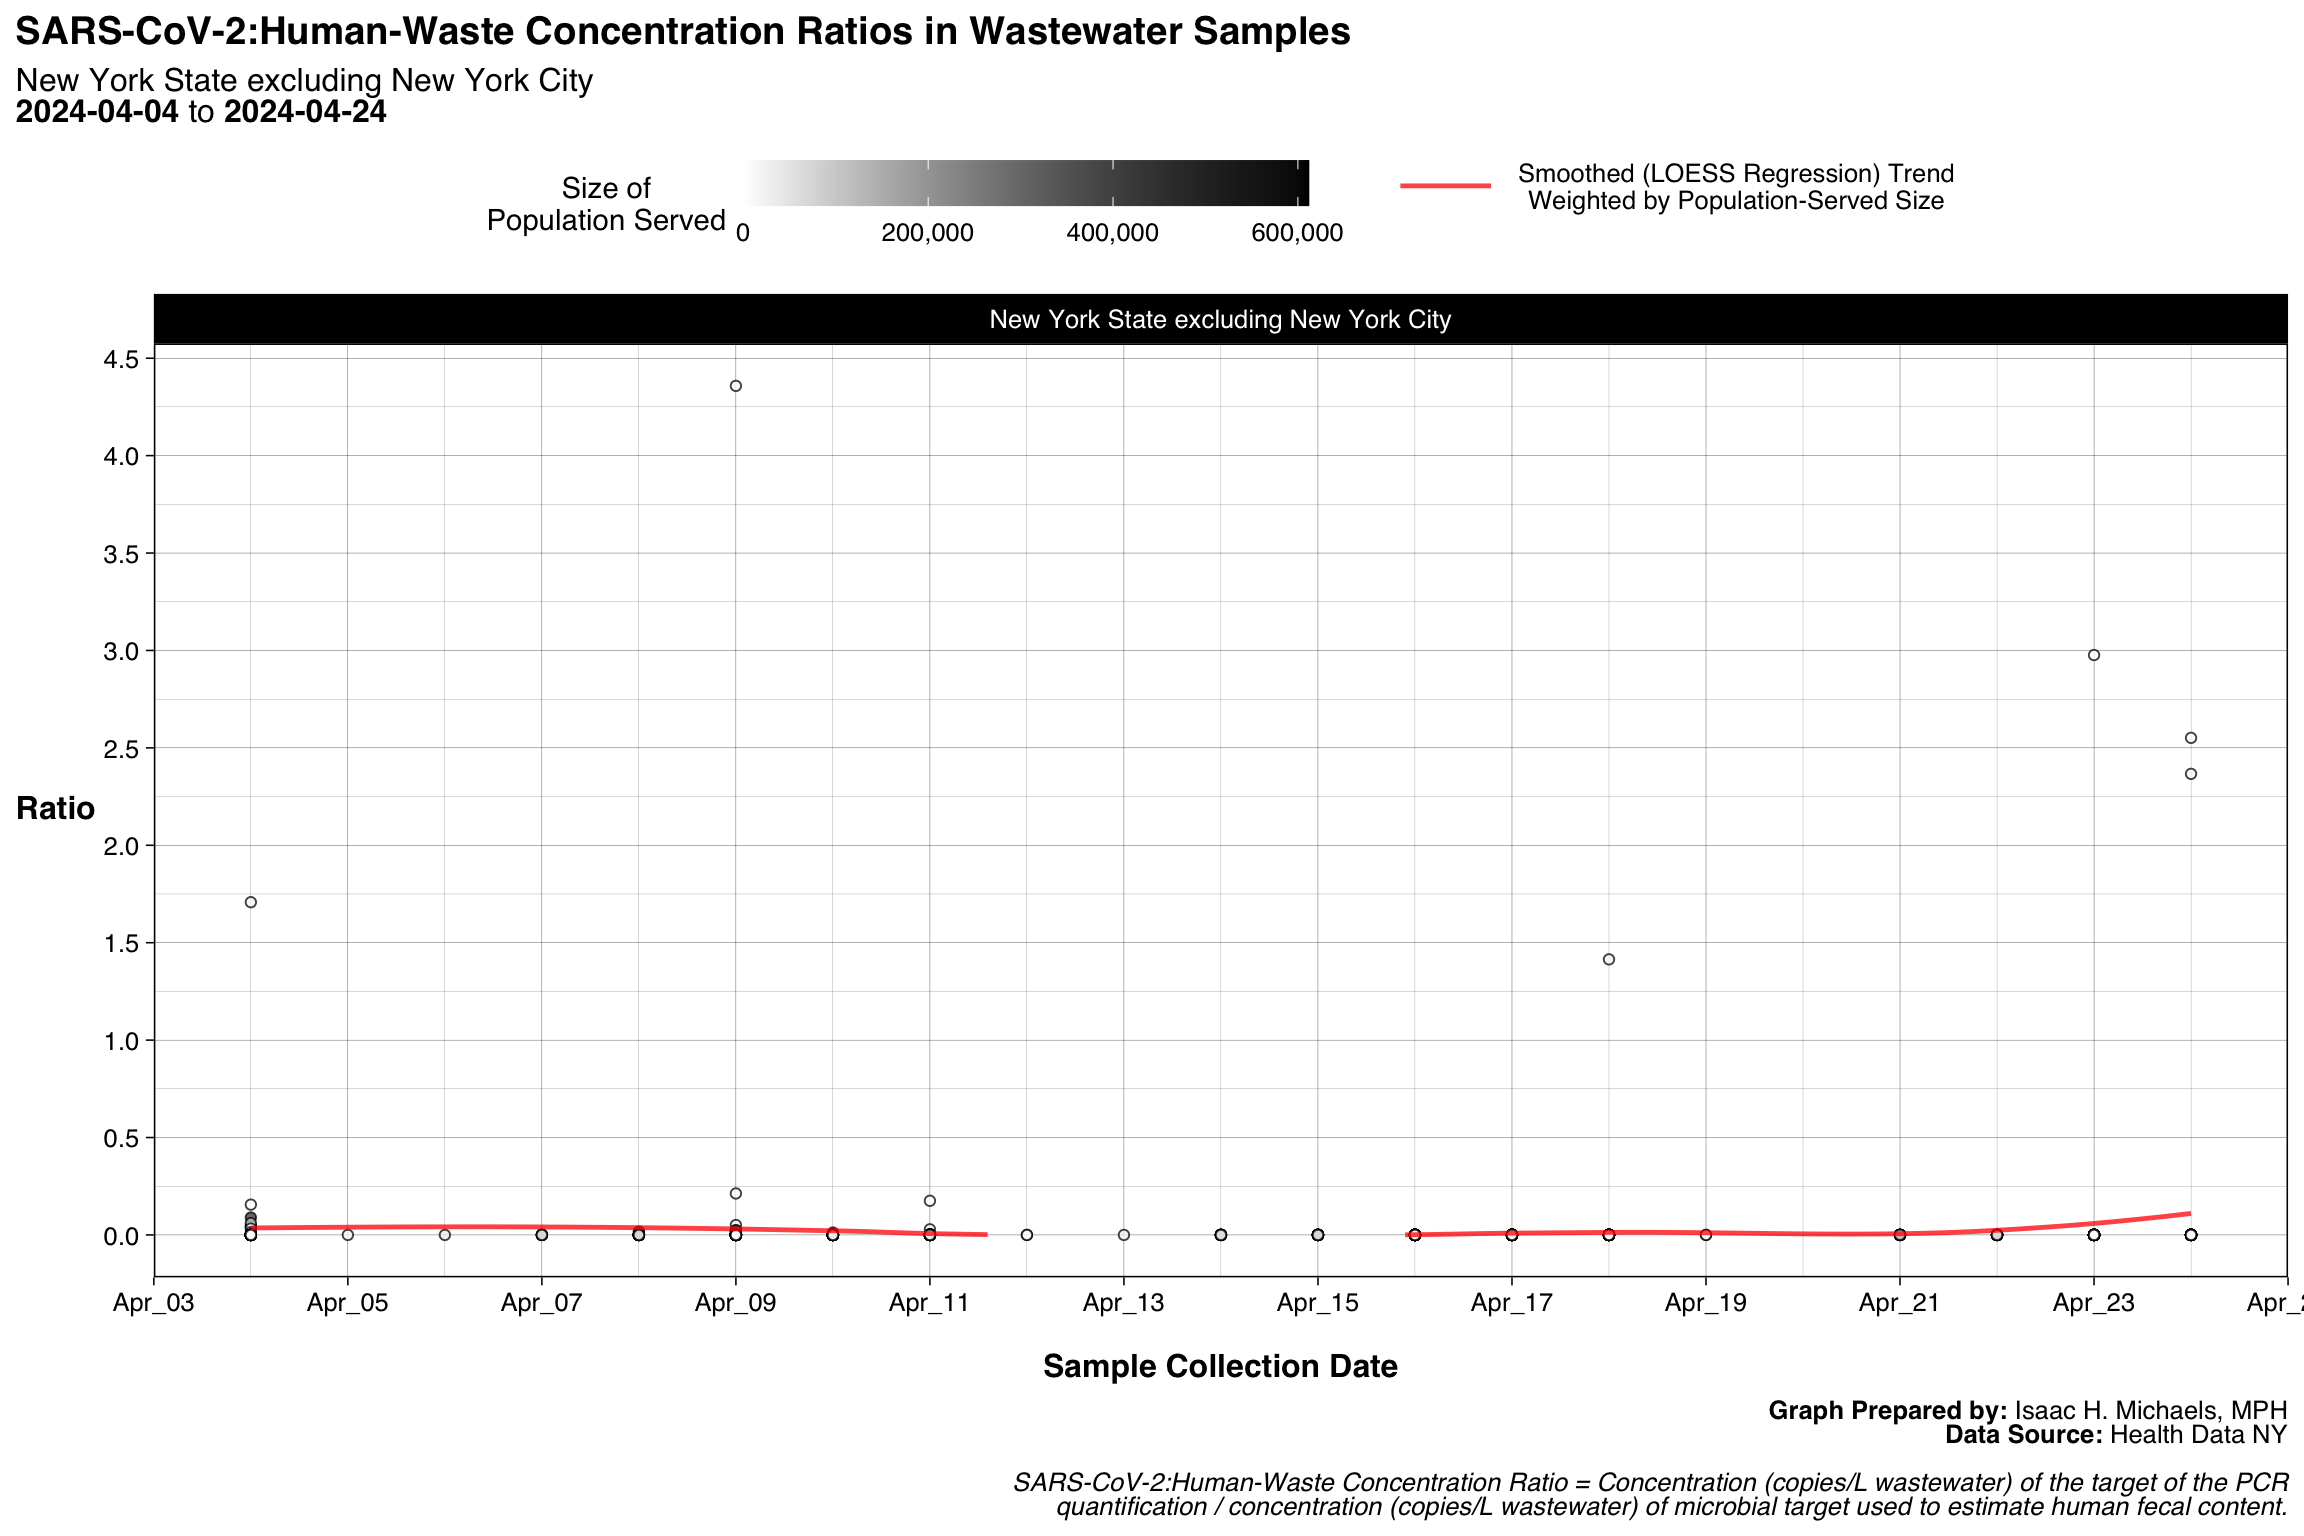
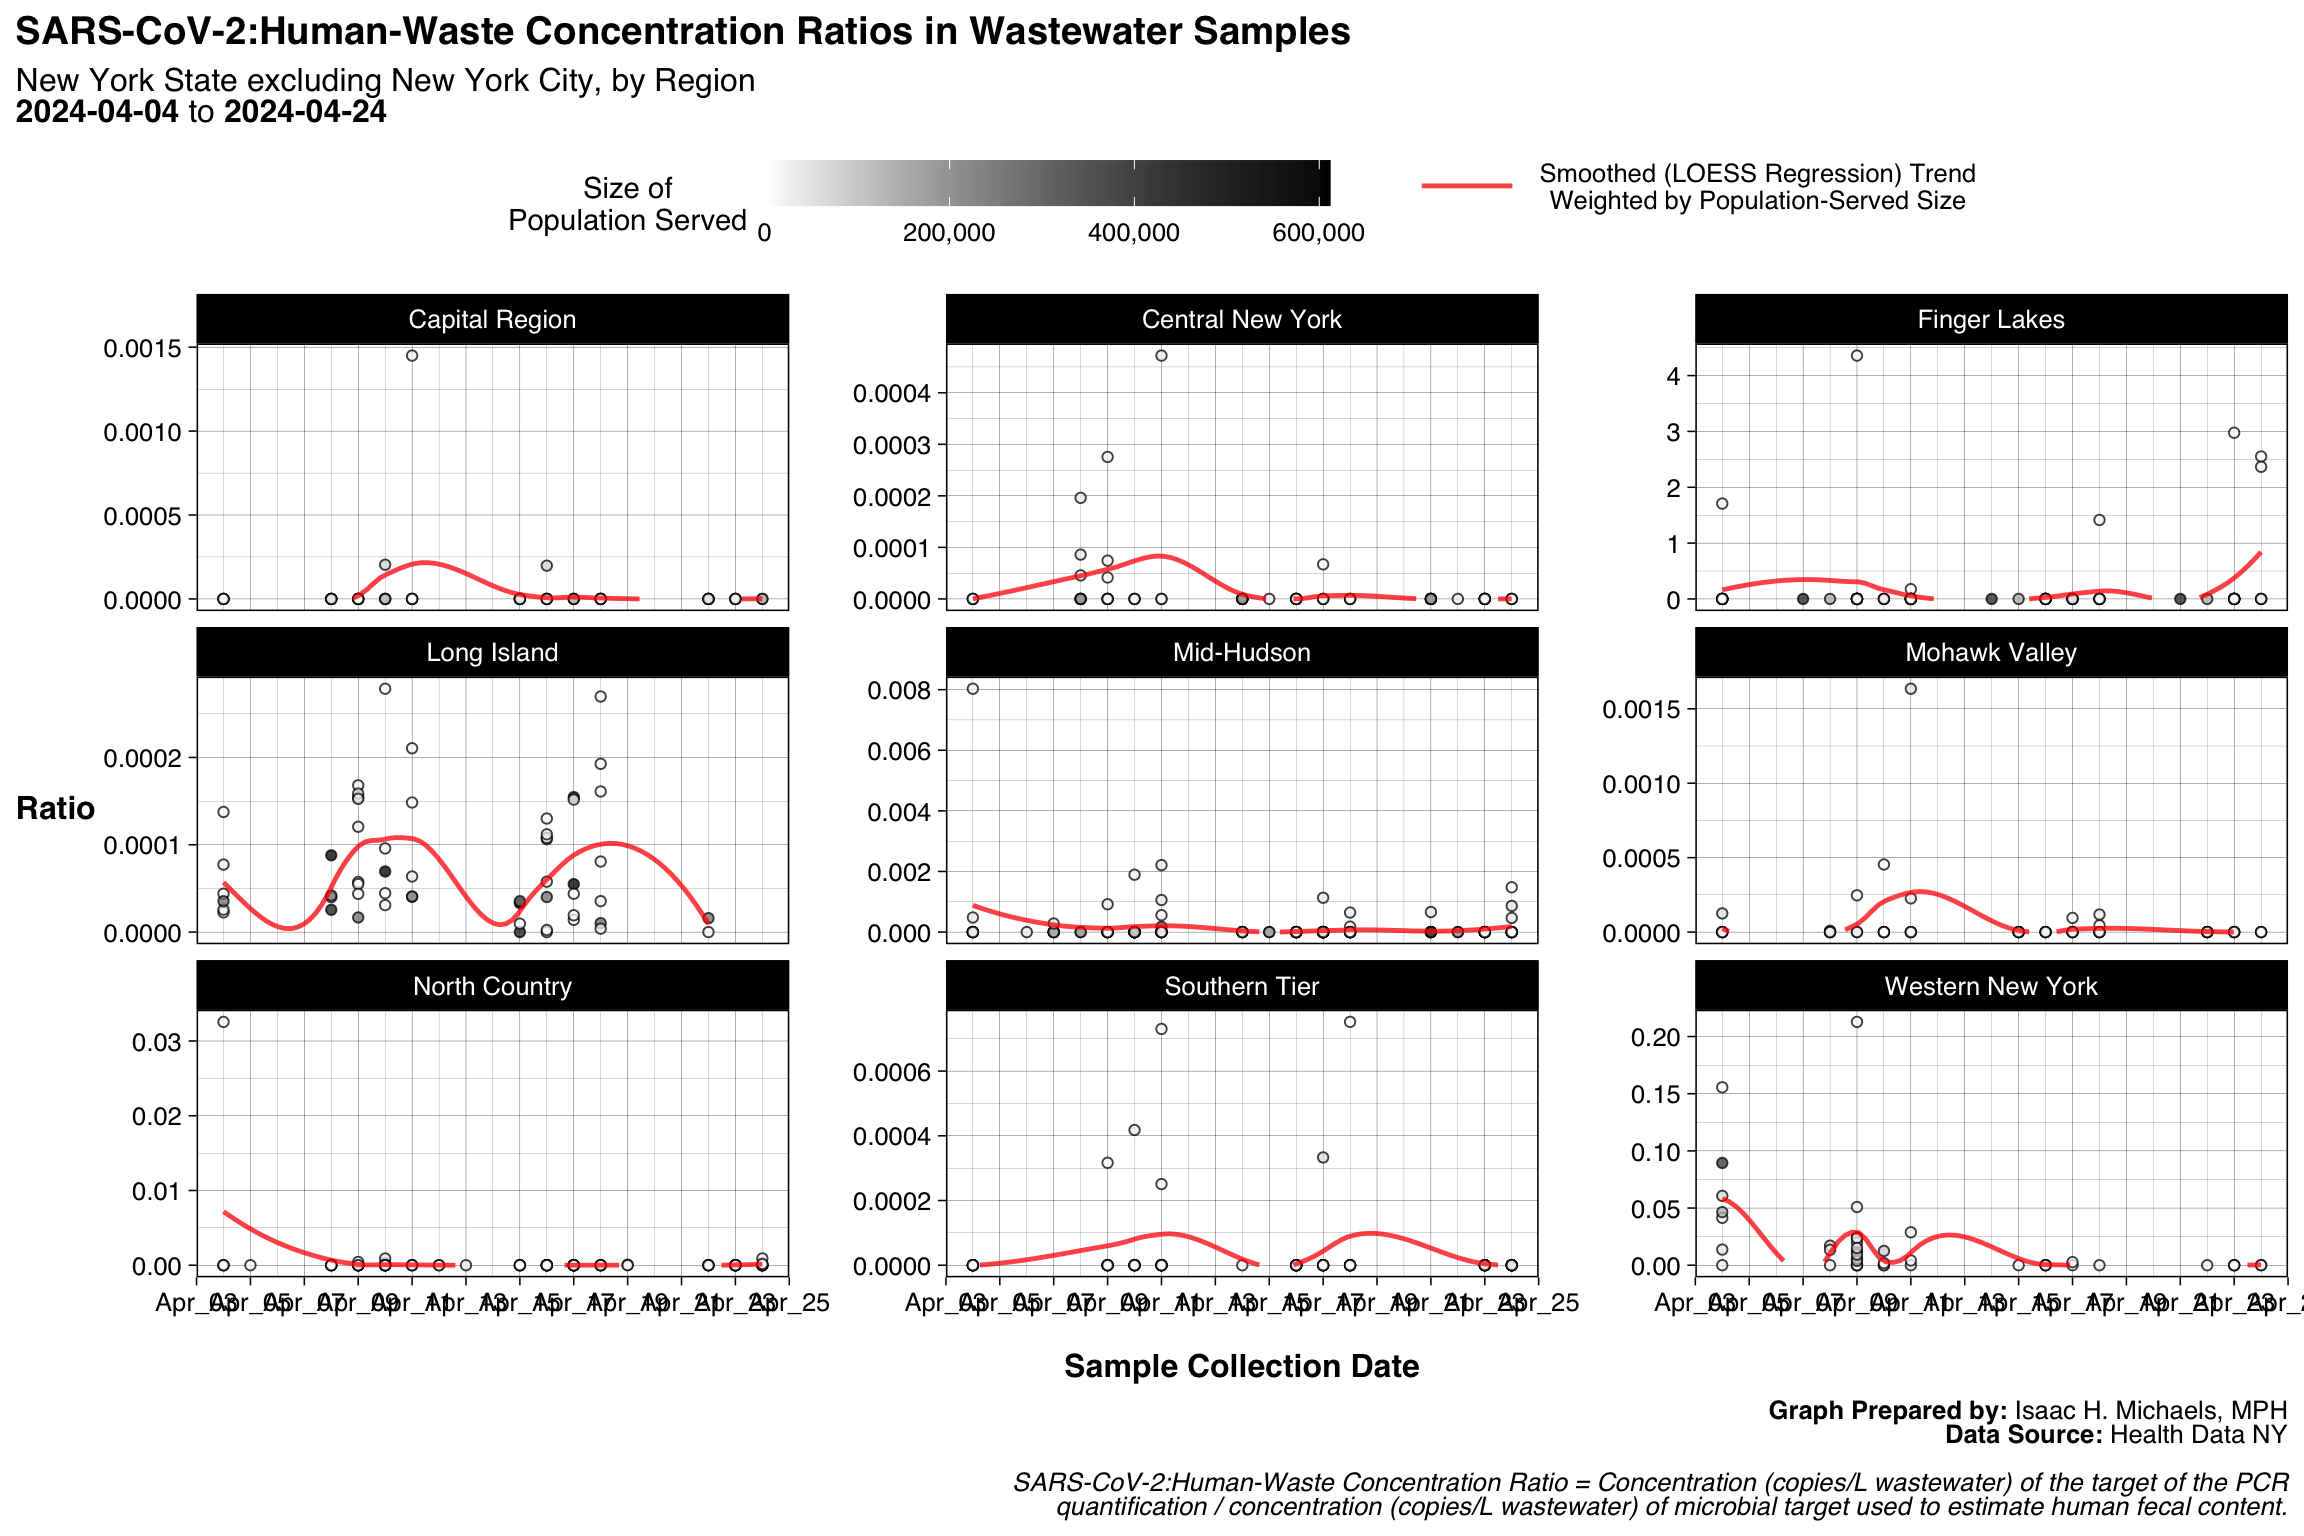
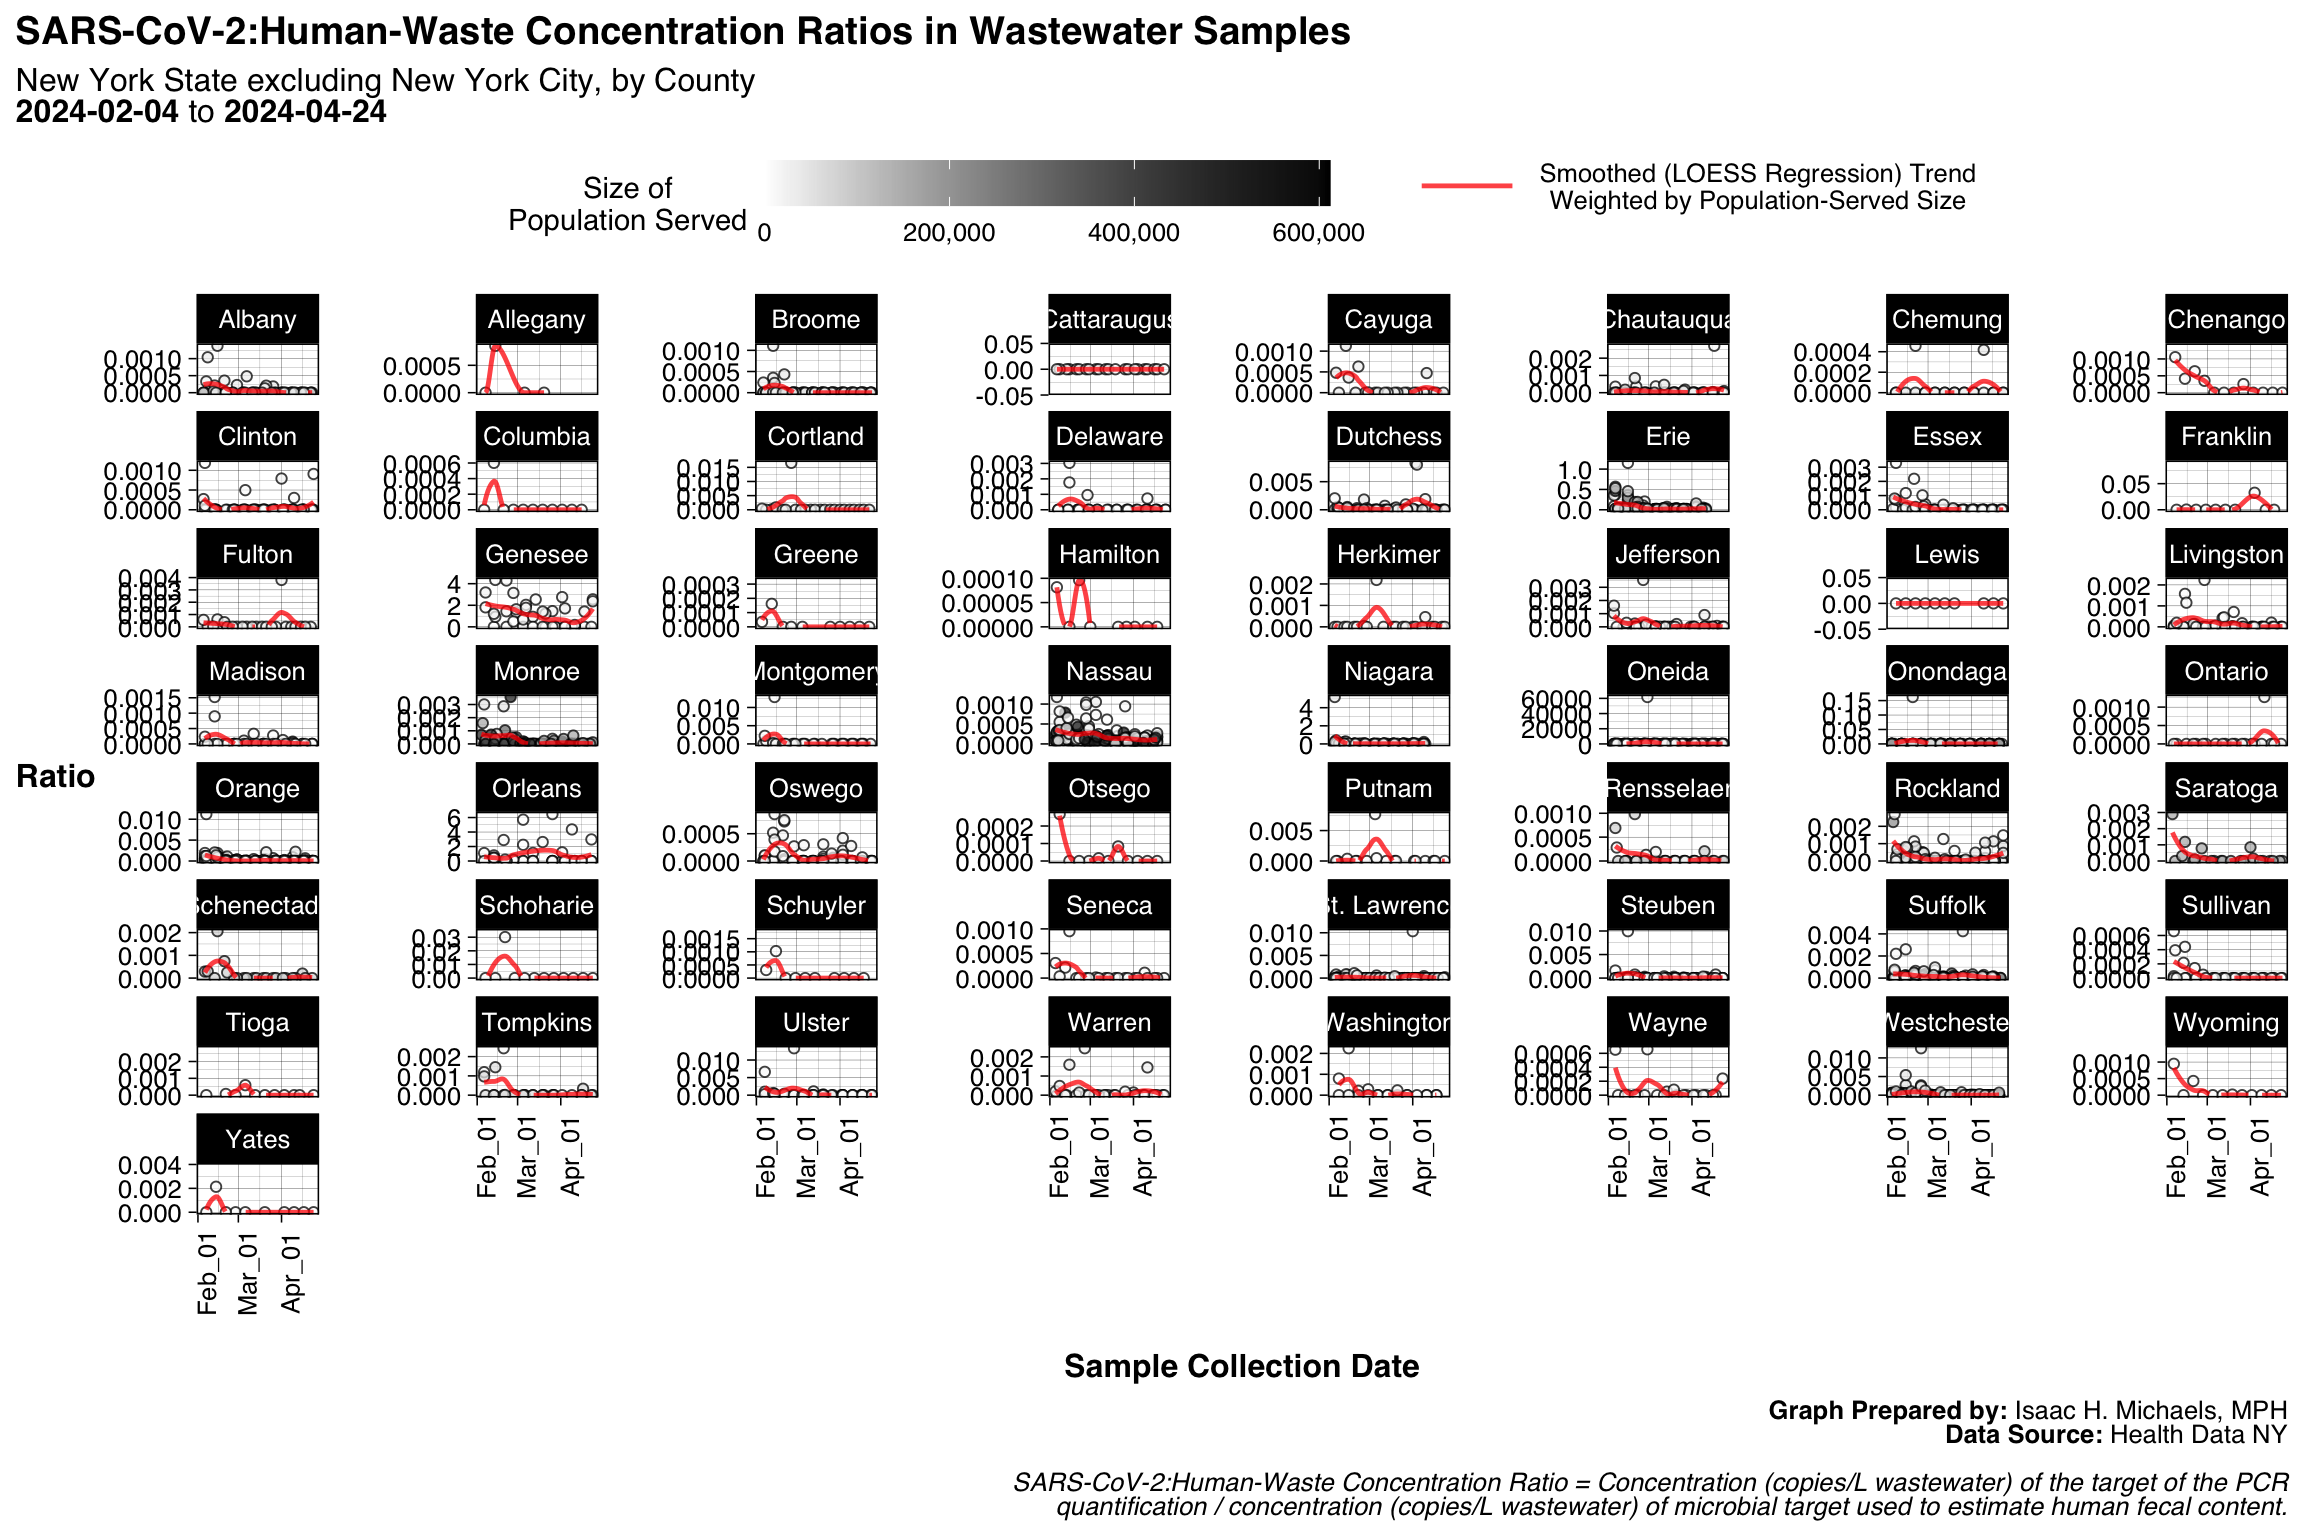
COVID-19 Wastewater Monitoring
New York City (Past 30 Days)
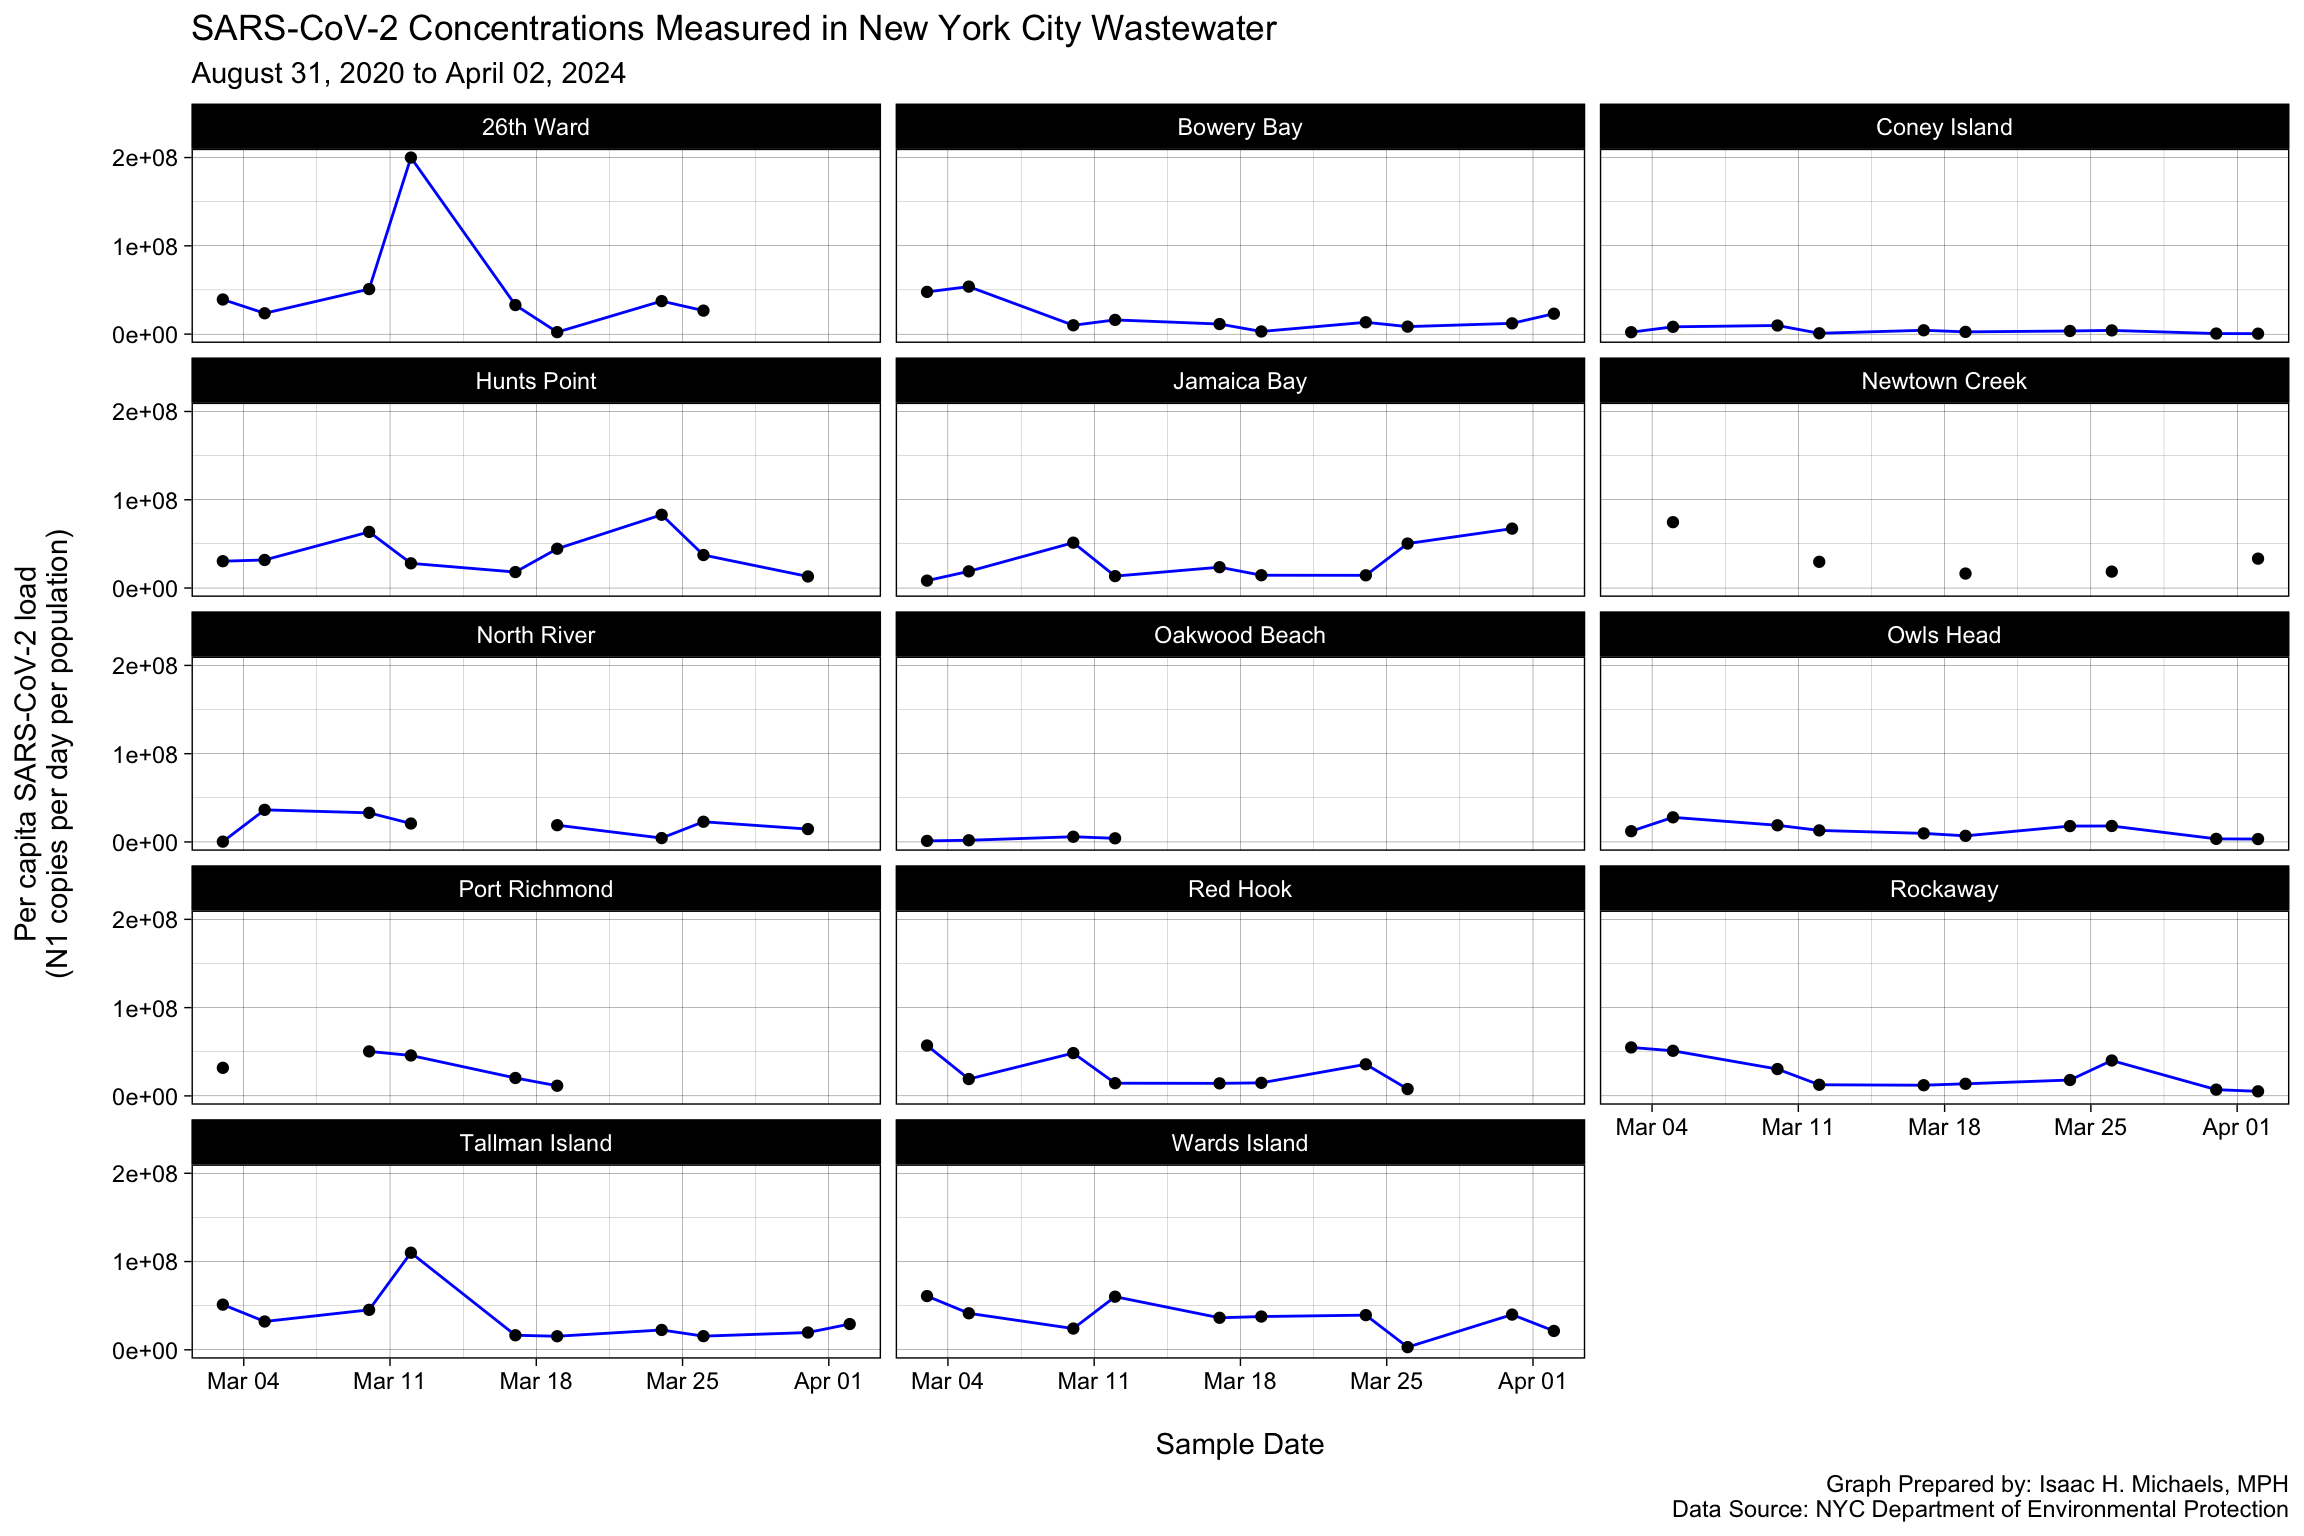
Graph Prepared by: Isaac H. Michaels, MPH
Data Source: NYC Department of Environmental Protection
New York State excluding New York City (Past 30 Days)
Wastewater Sample Collection Frequency, by County
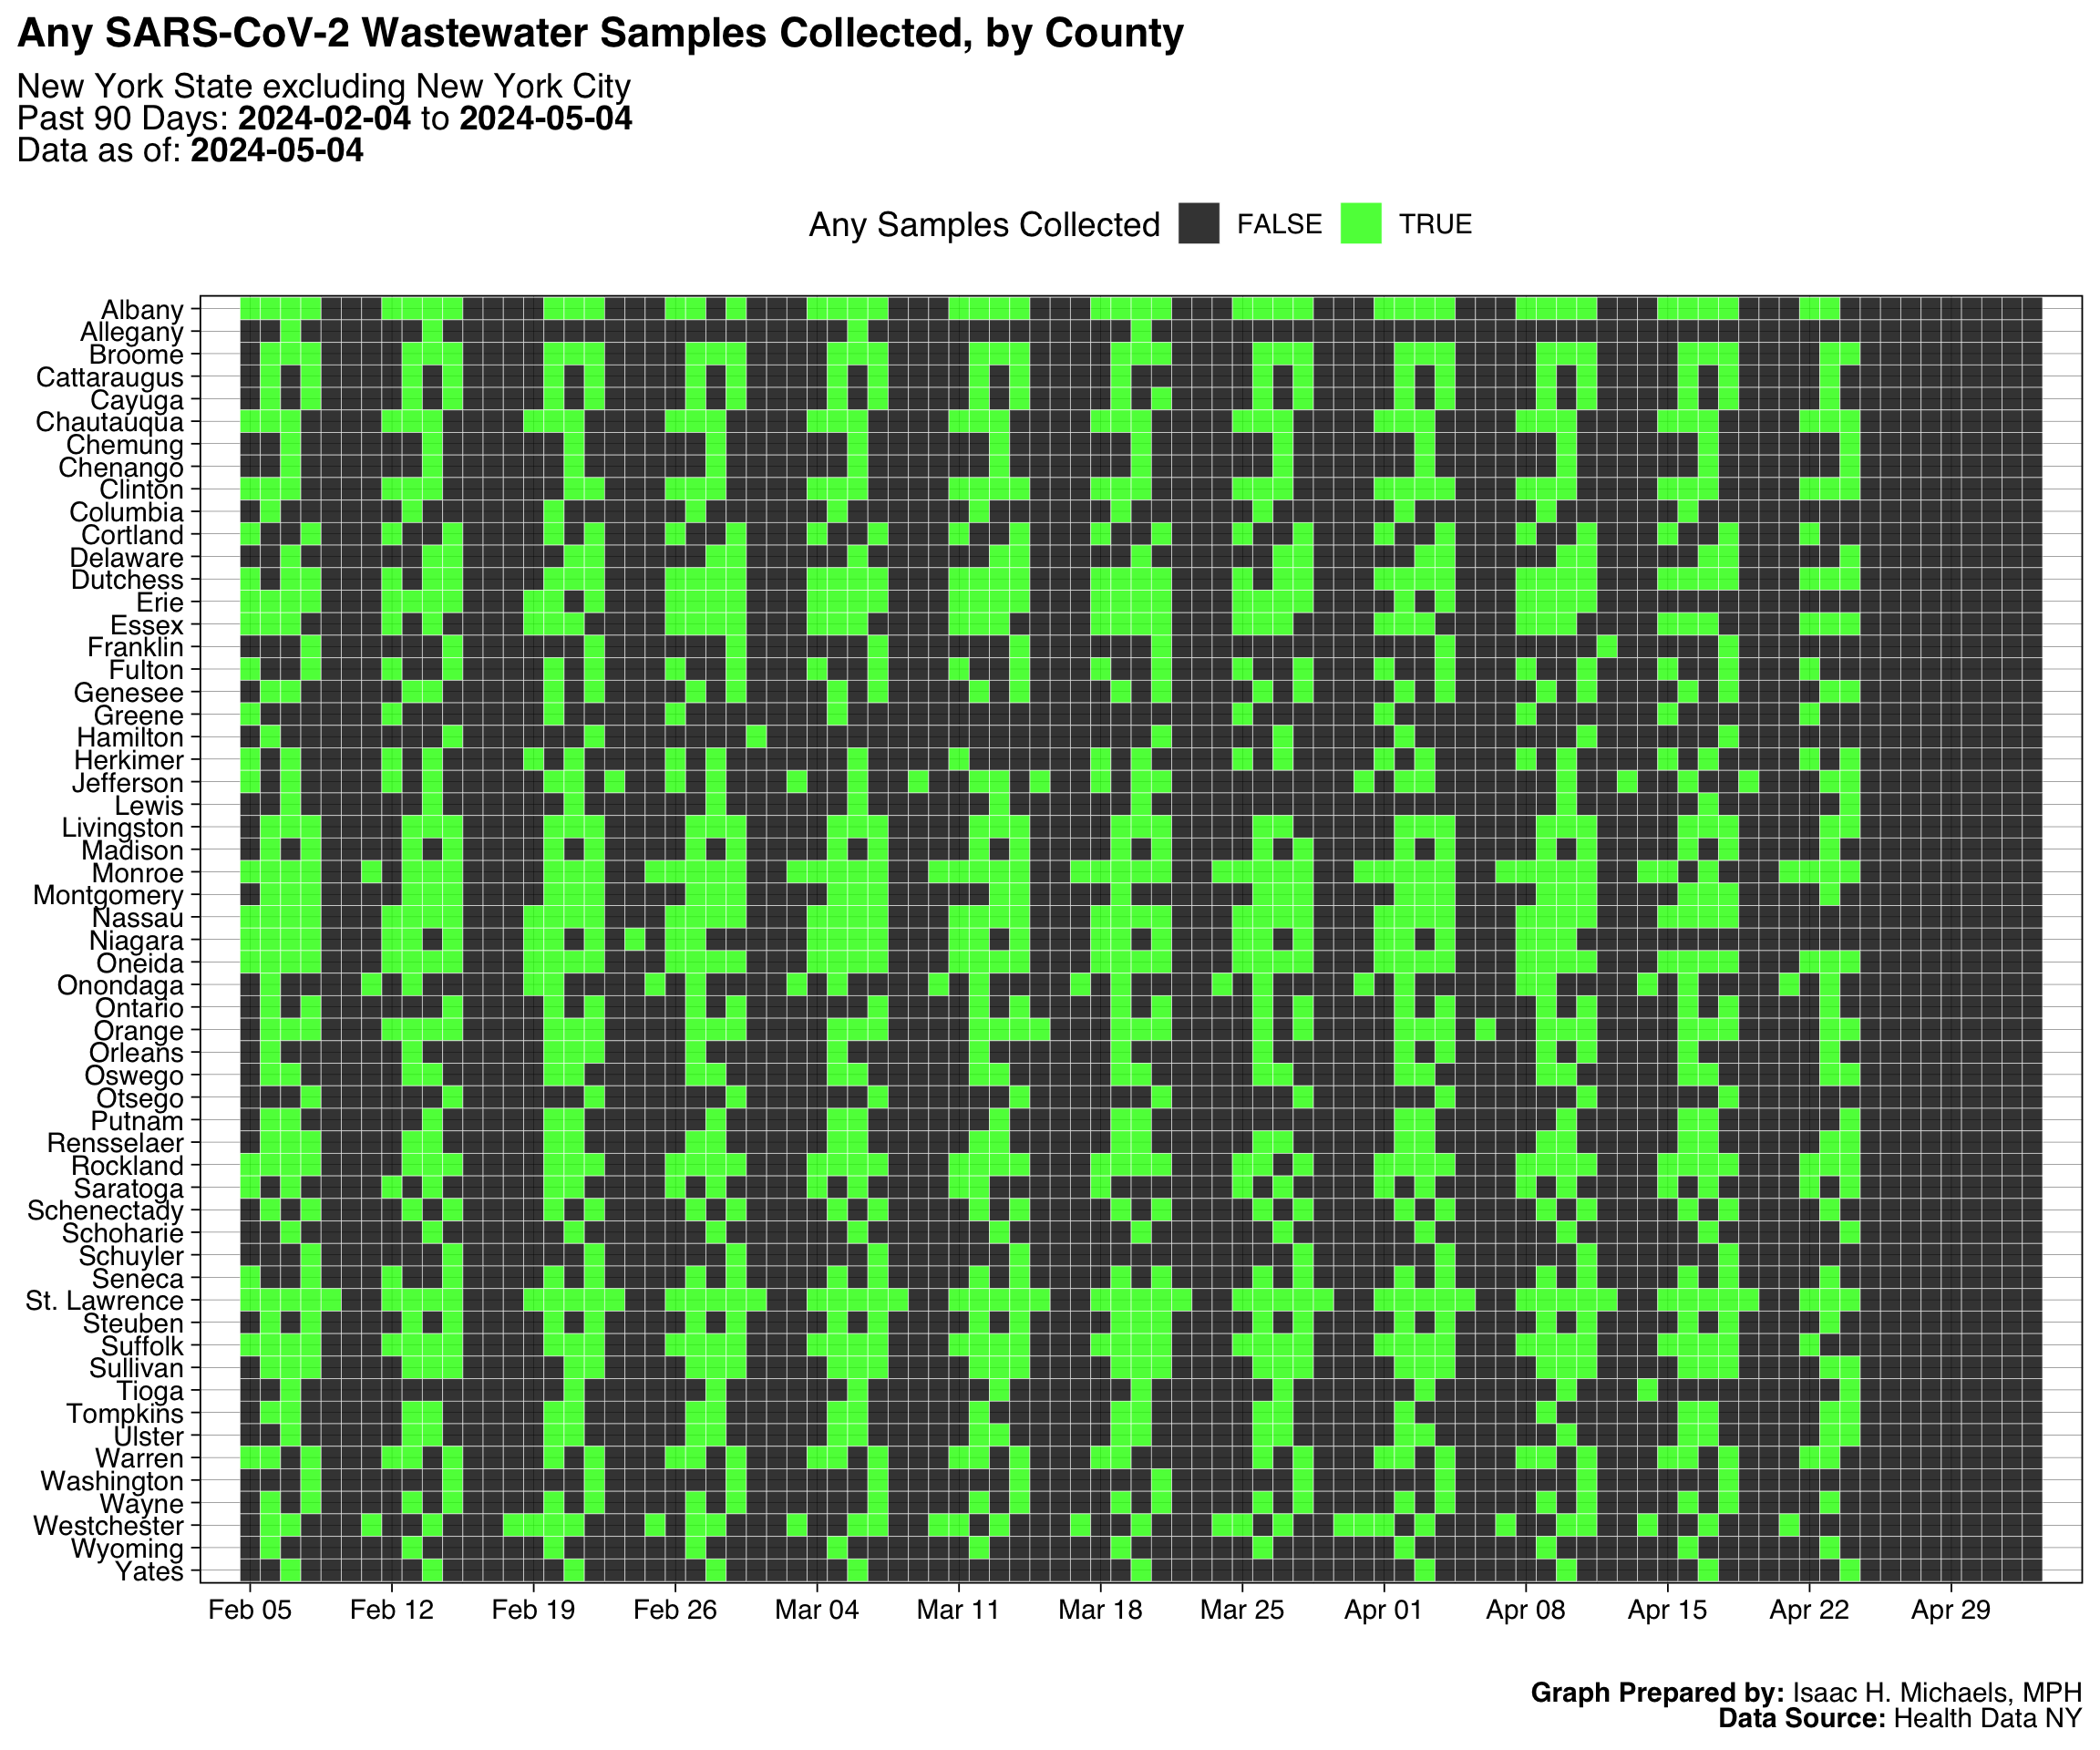
Graph Prepared by: Isaac H. Michaels, MPH
Data Source: Health Data NY
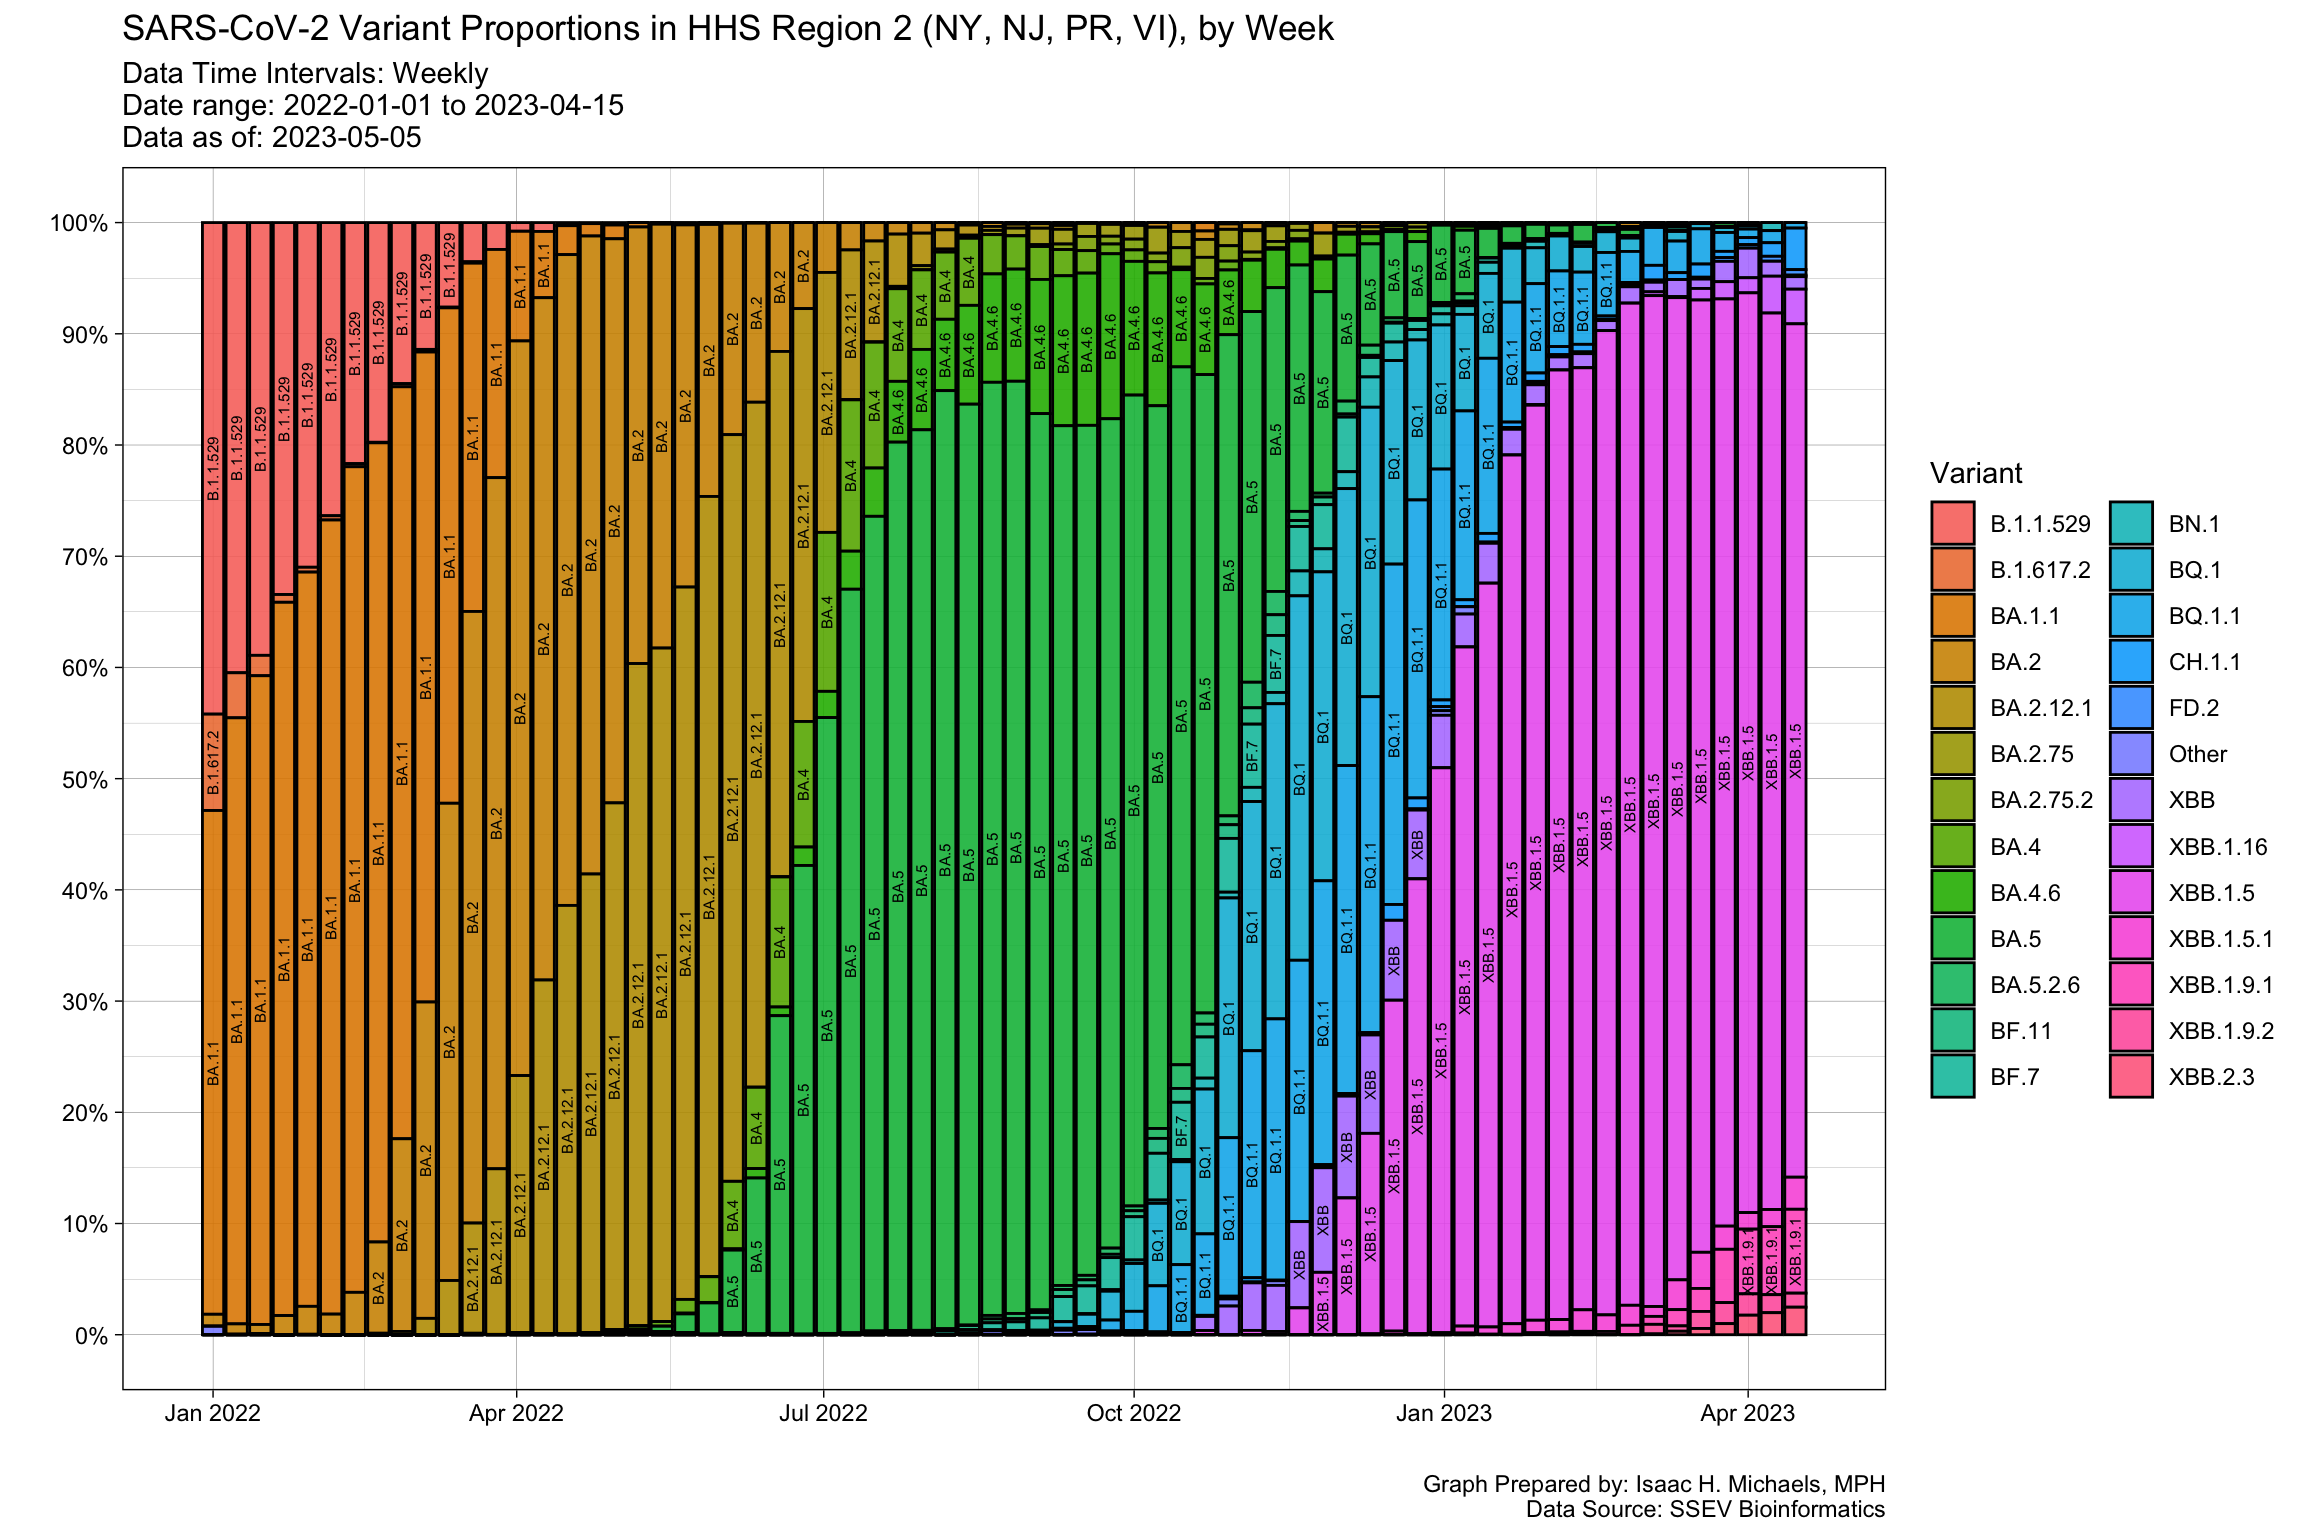
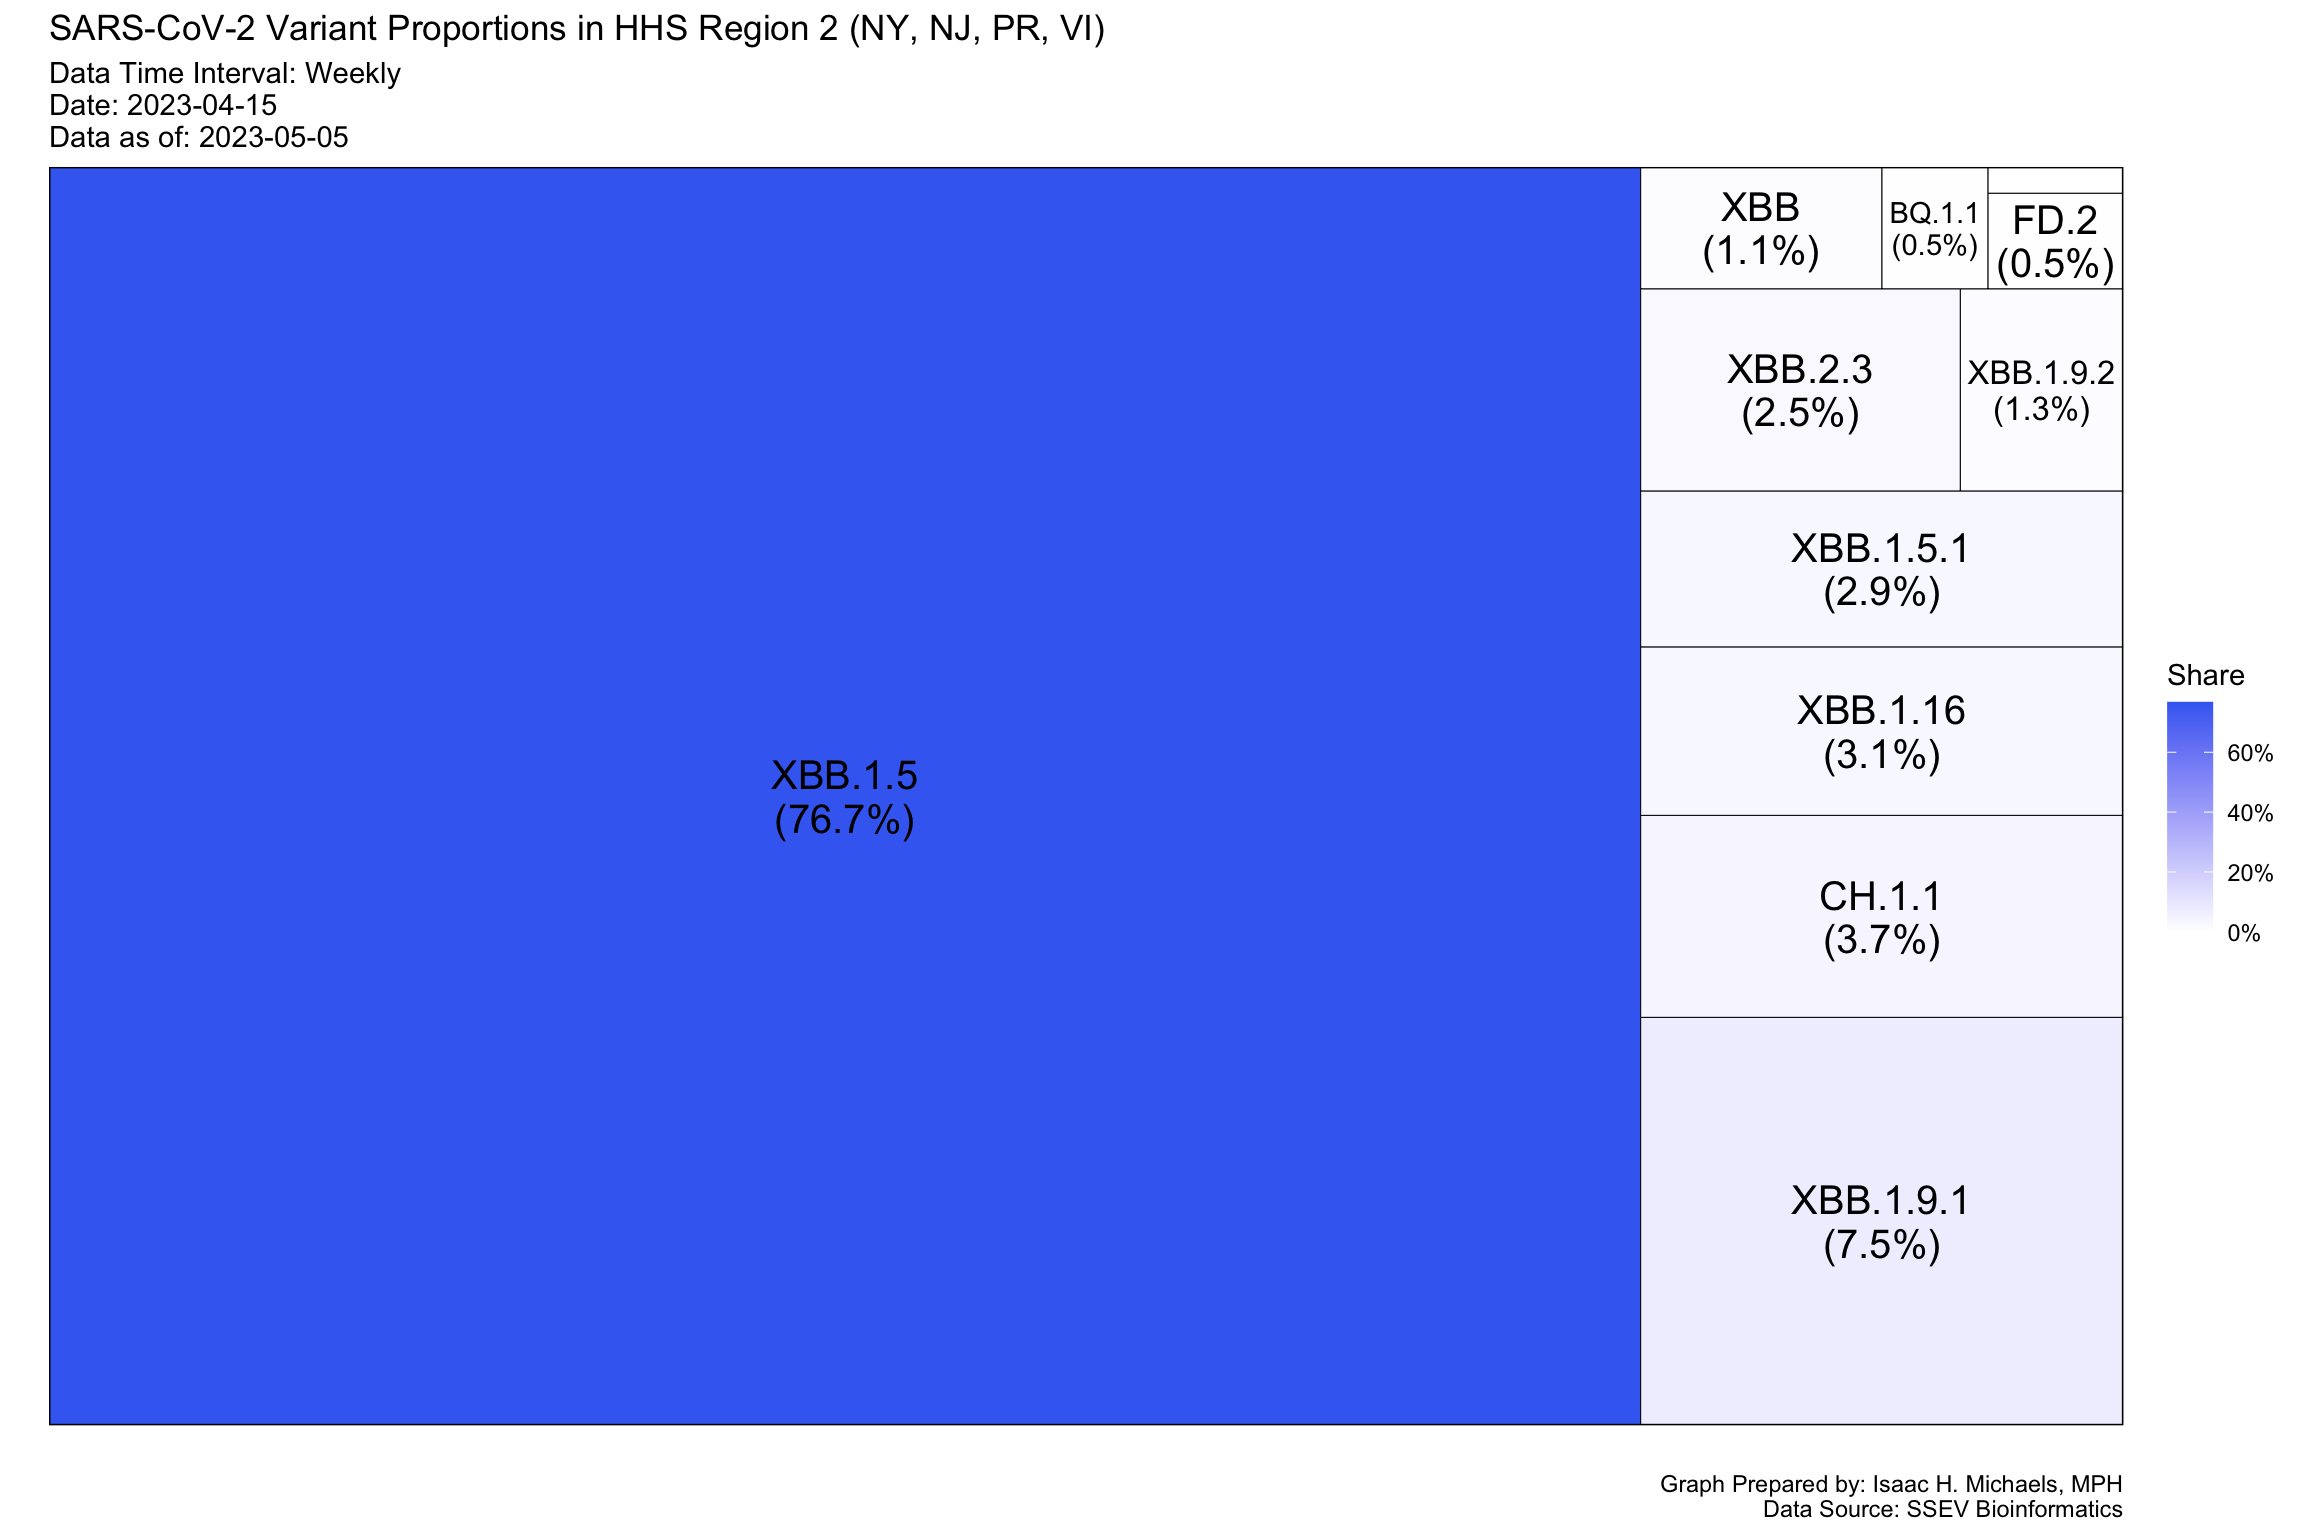
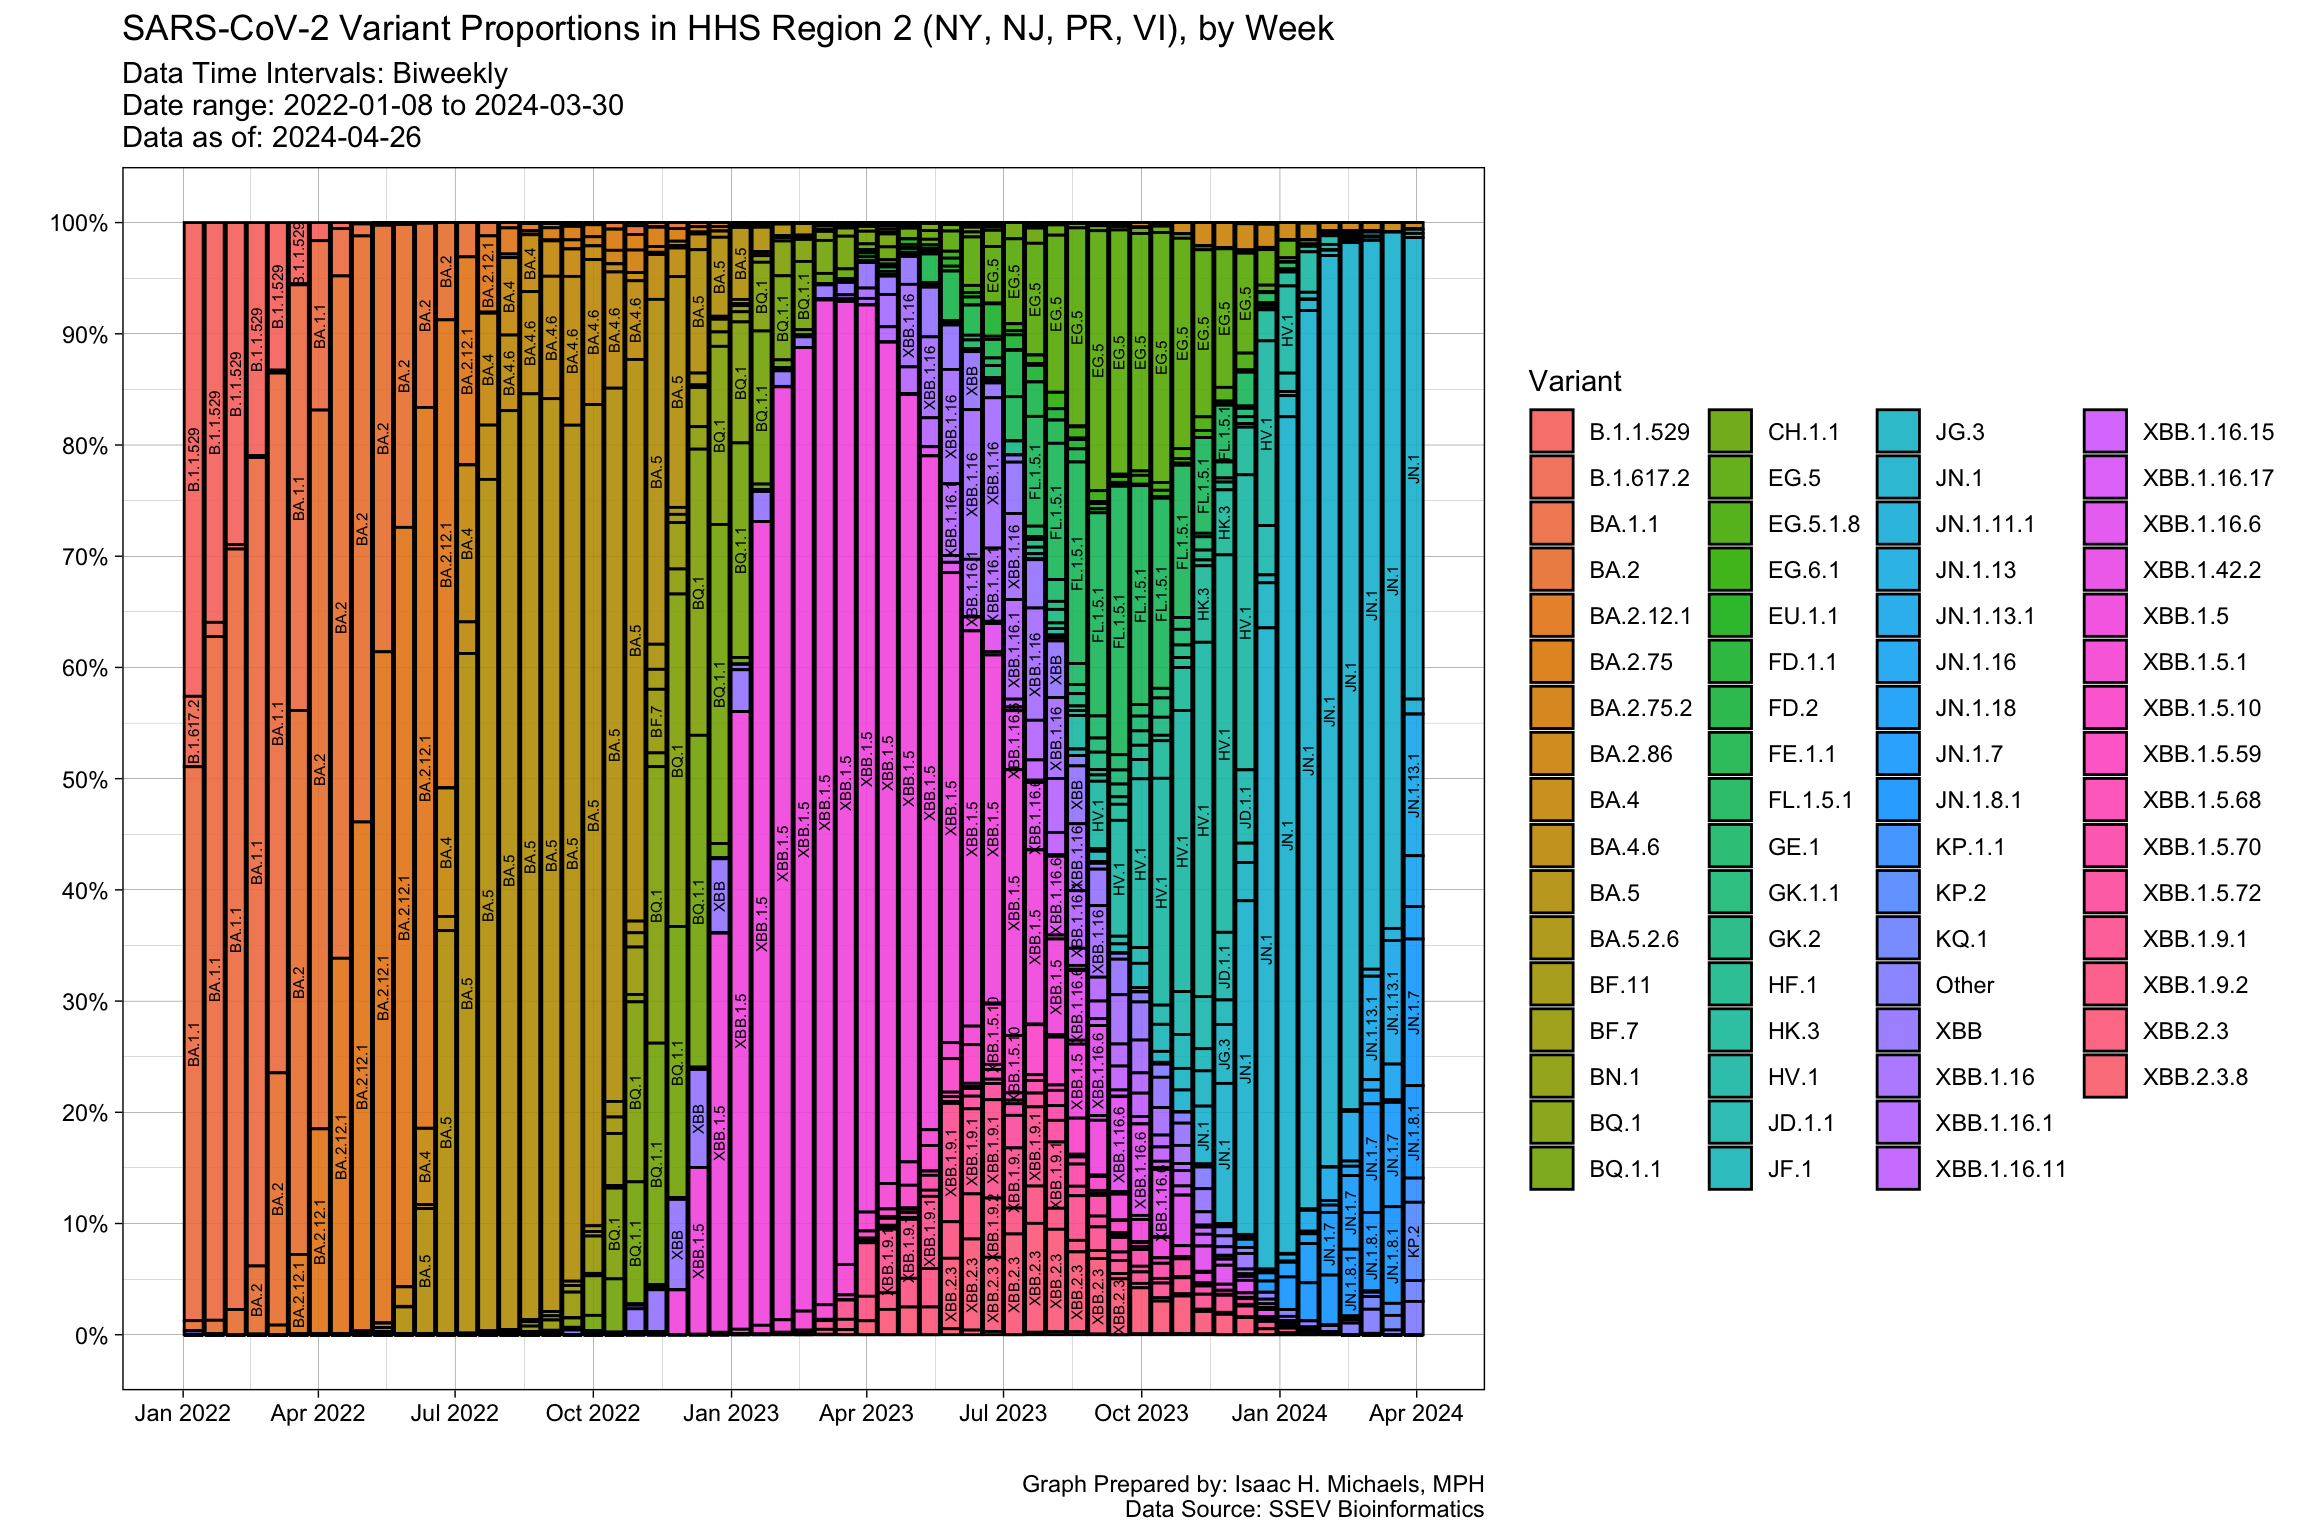
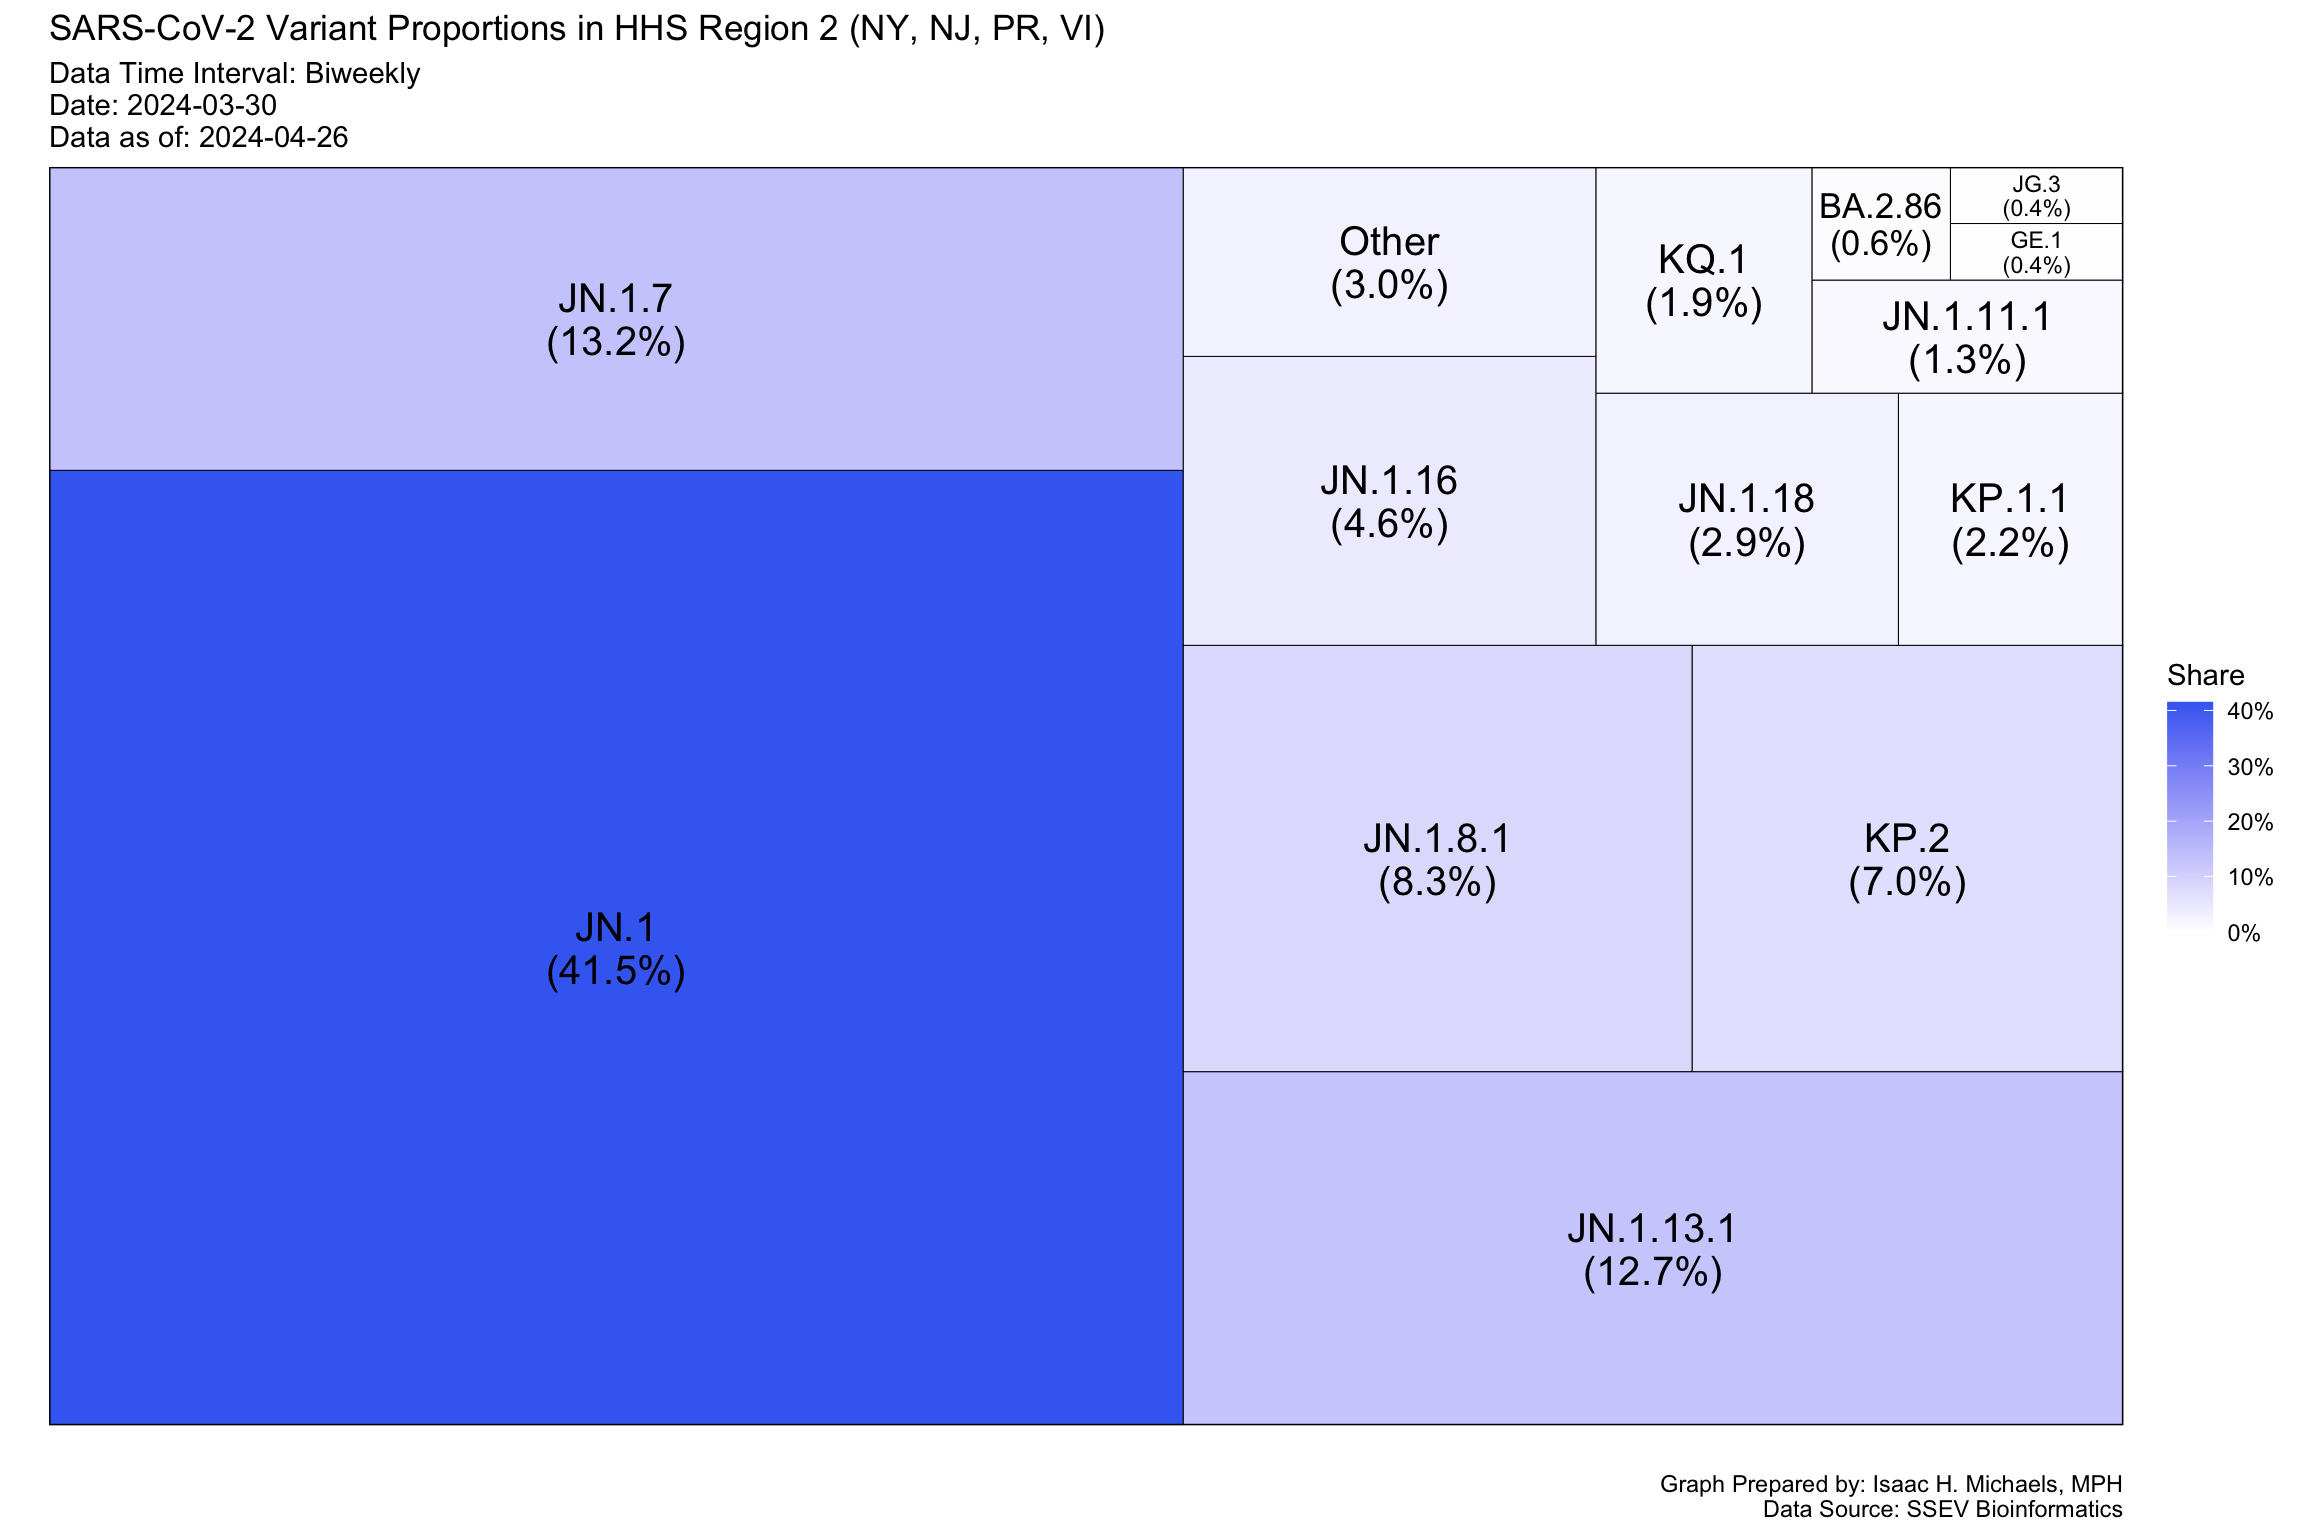
SARS-CoV-2 Variant Proportions
Weekly Data Intervals
Biweekly Data Intervals
COVID-19 Deaths
Excess Deaths
Graph Prepared By: Isaac H. Michaels, MPH
Data Source: National Center for Health Statistics
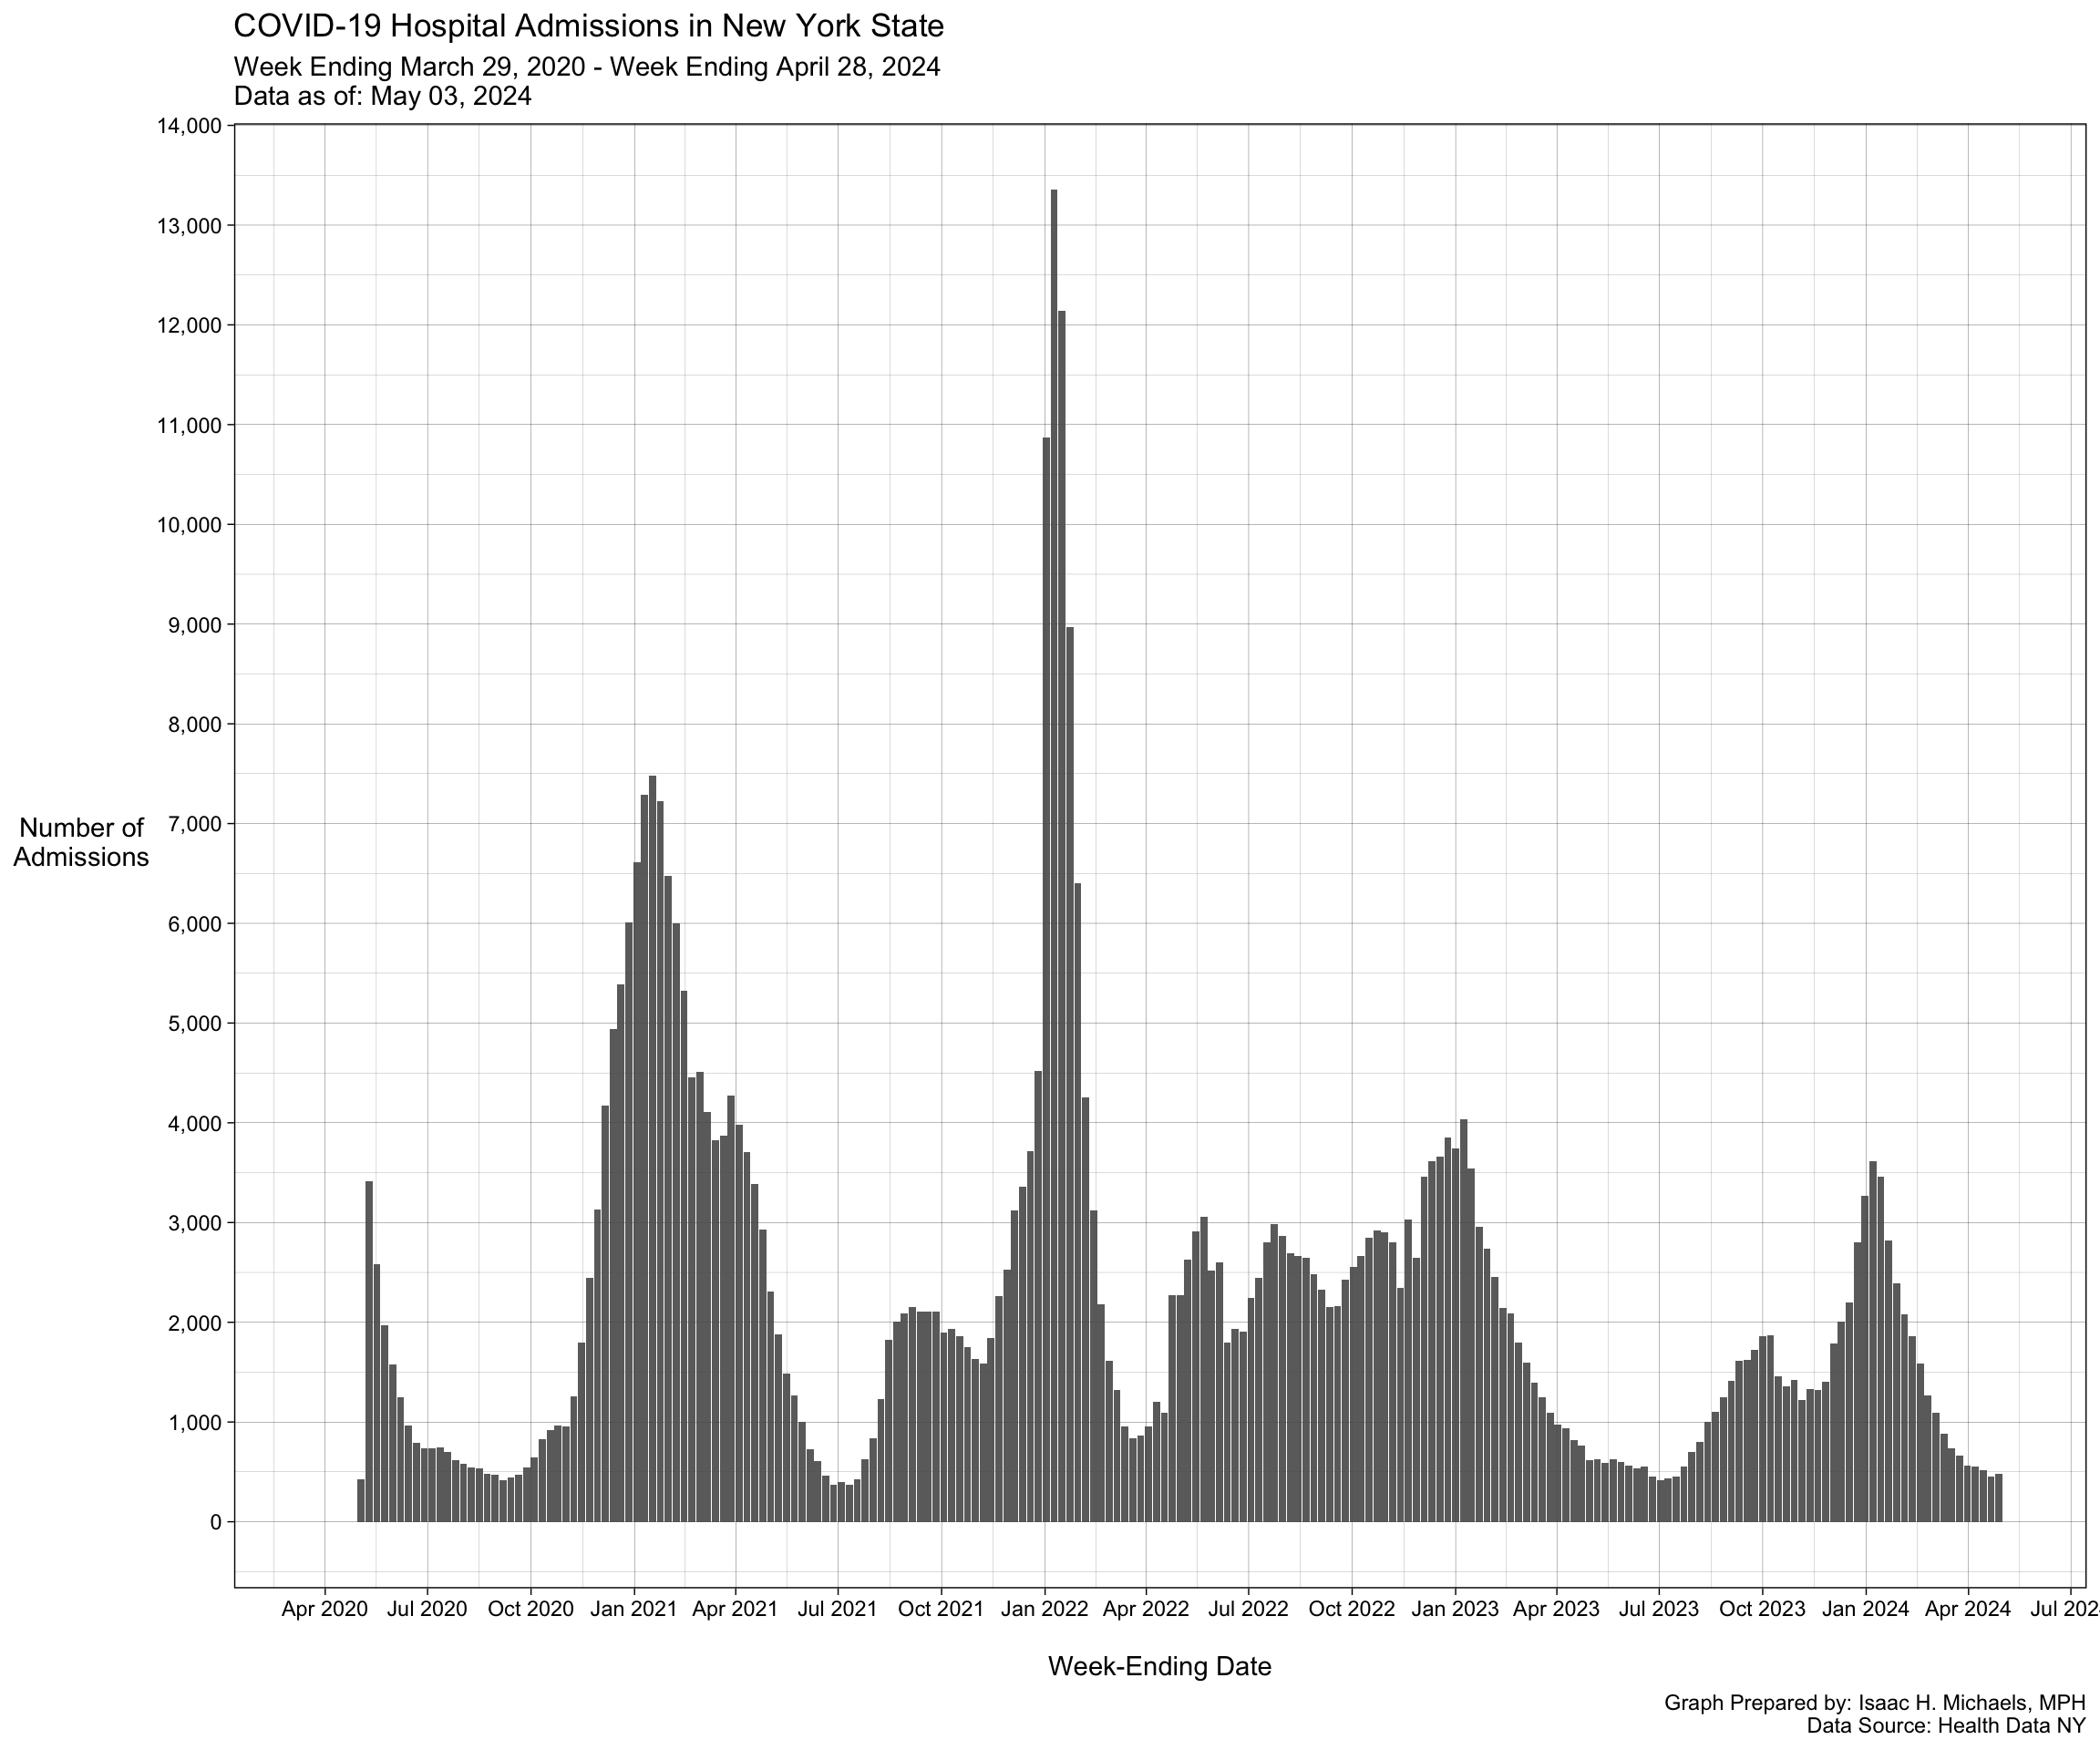
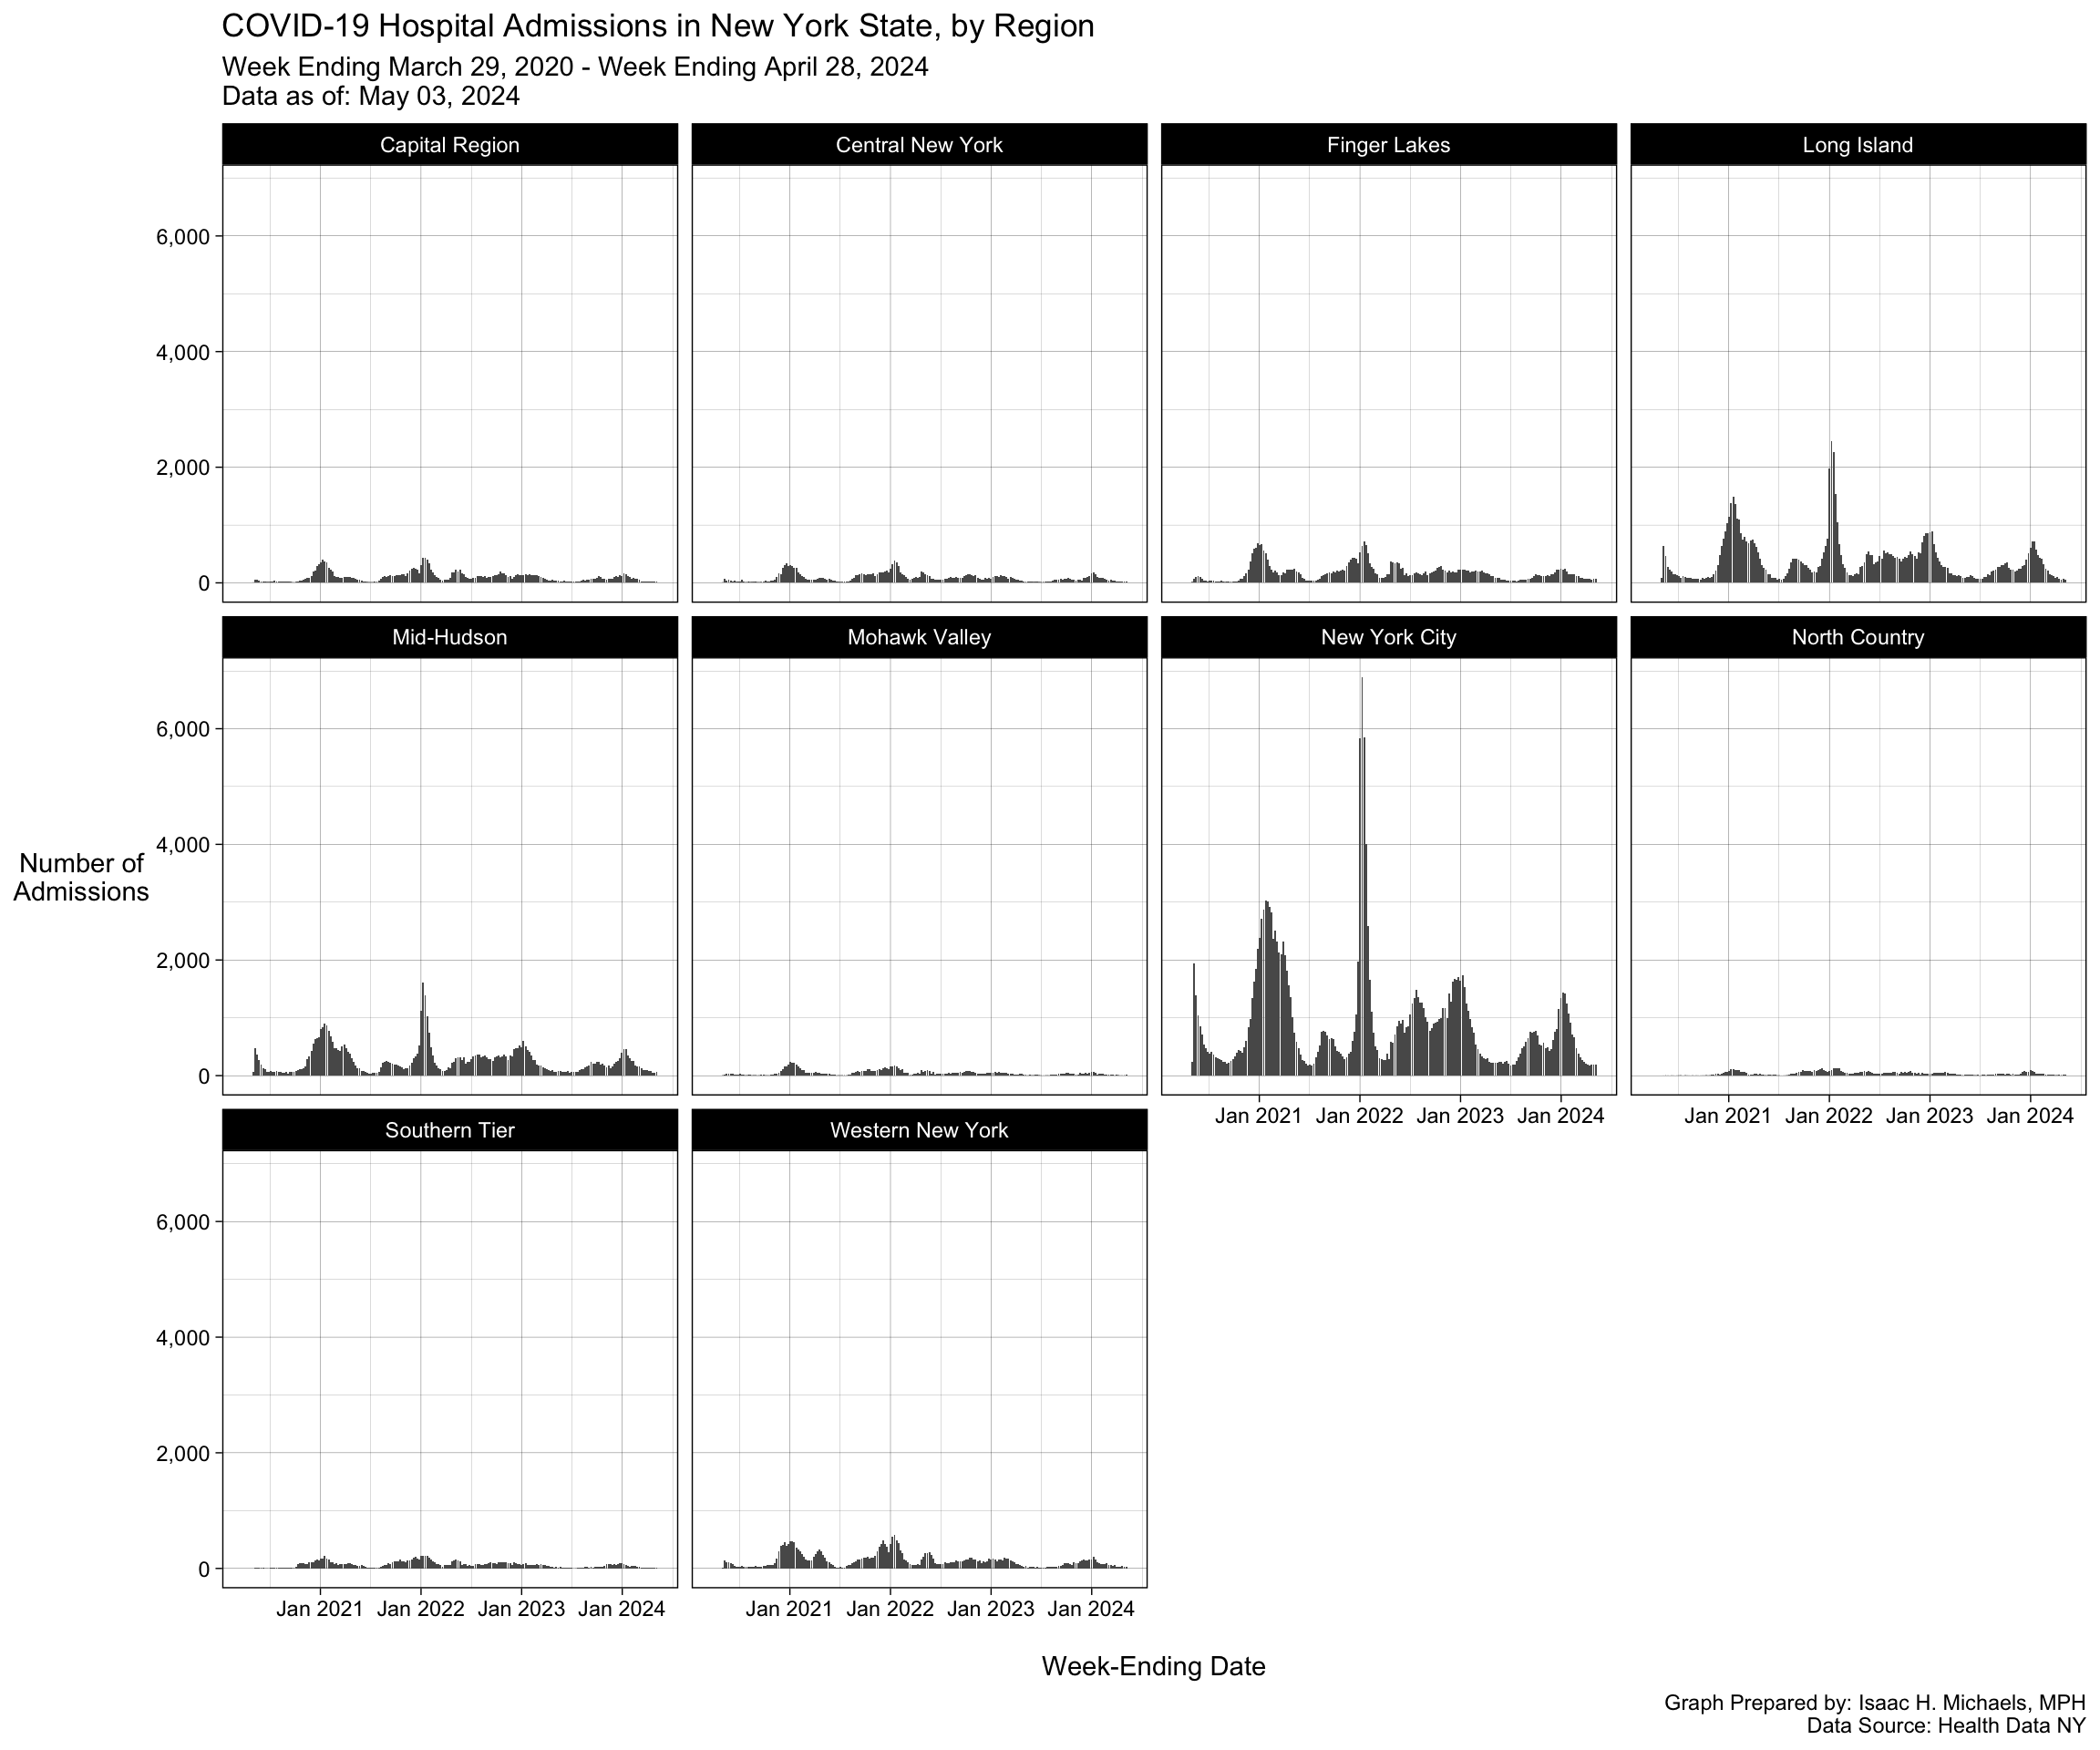
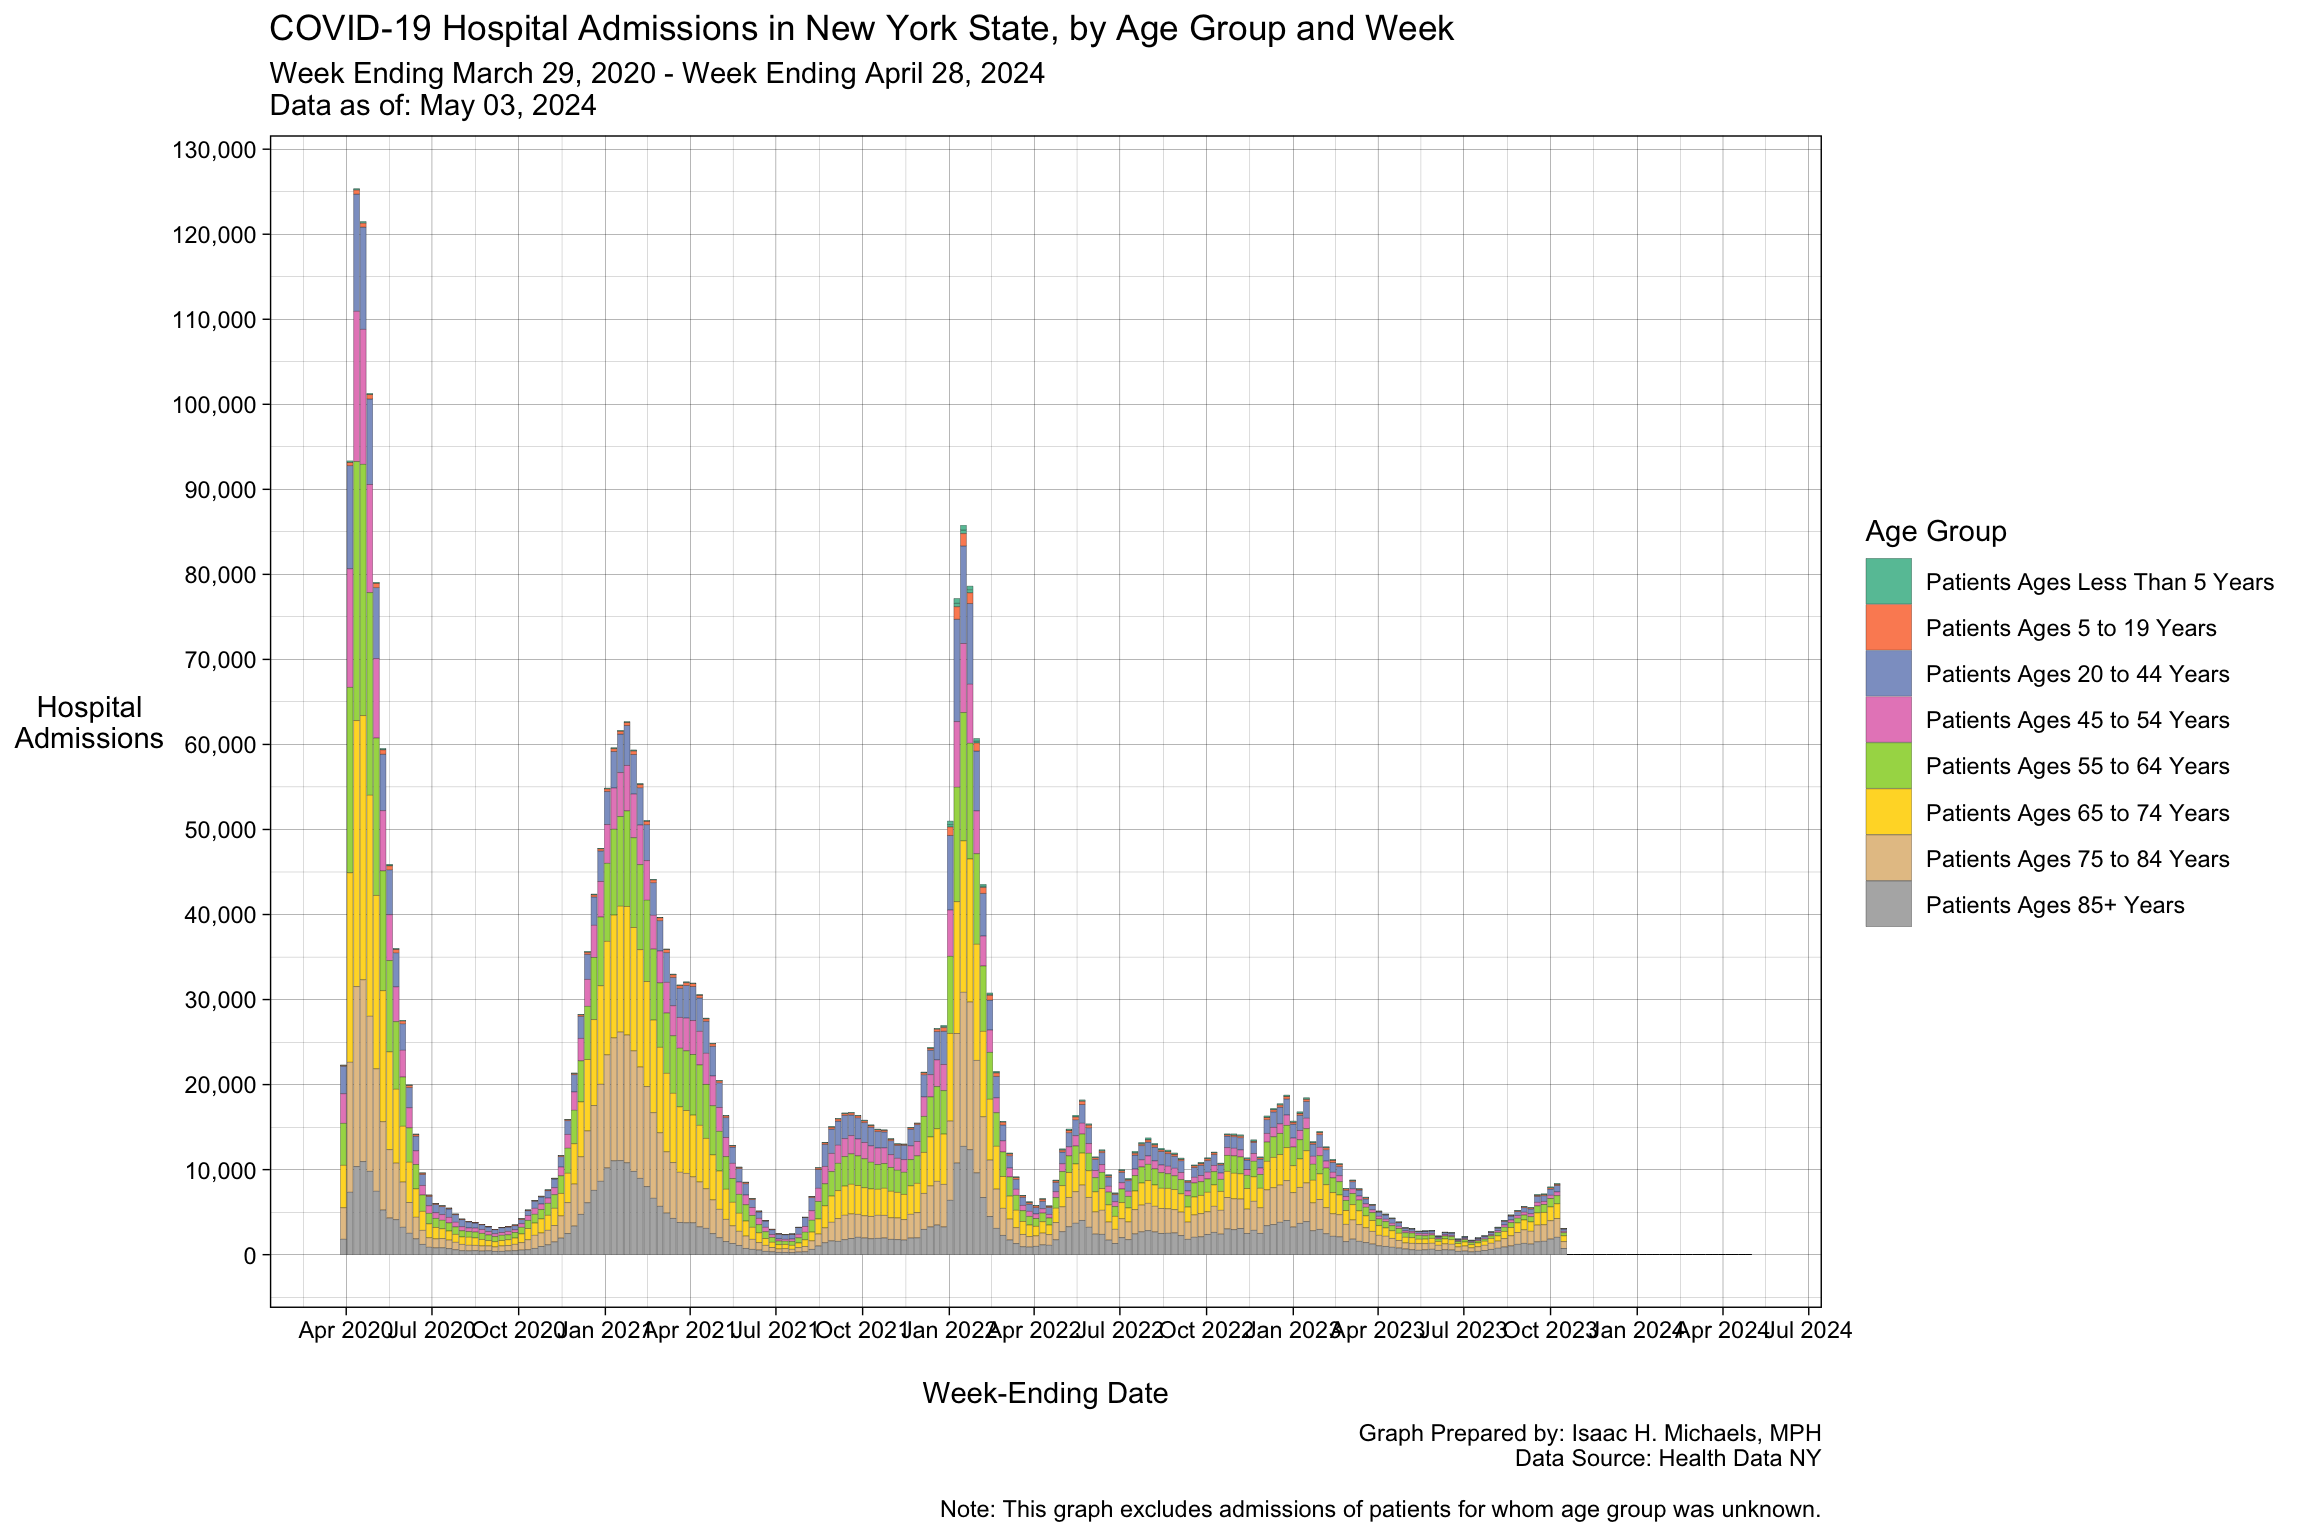
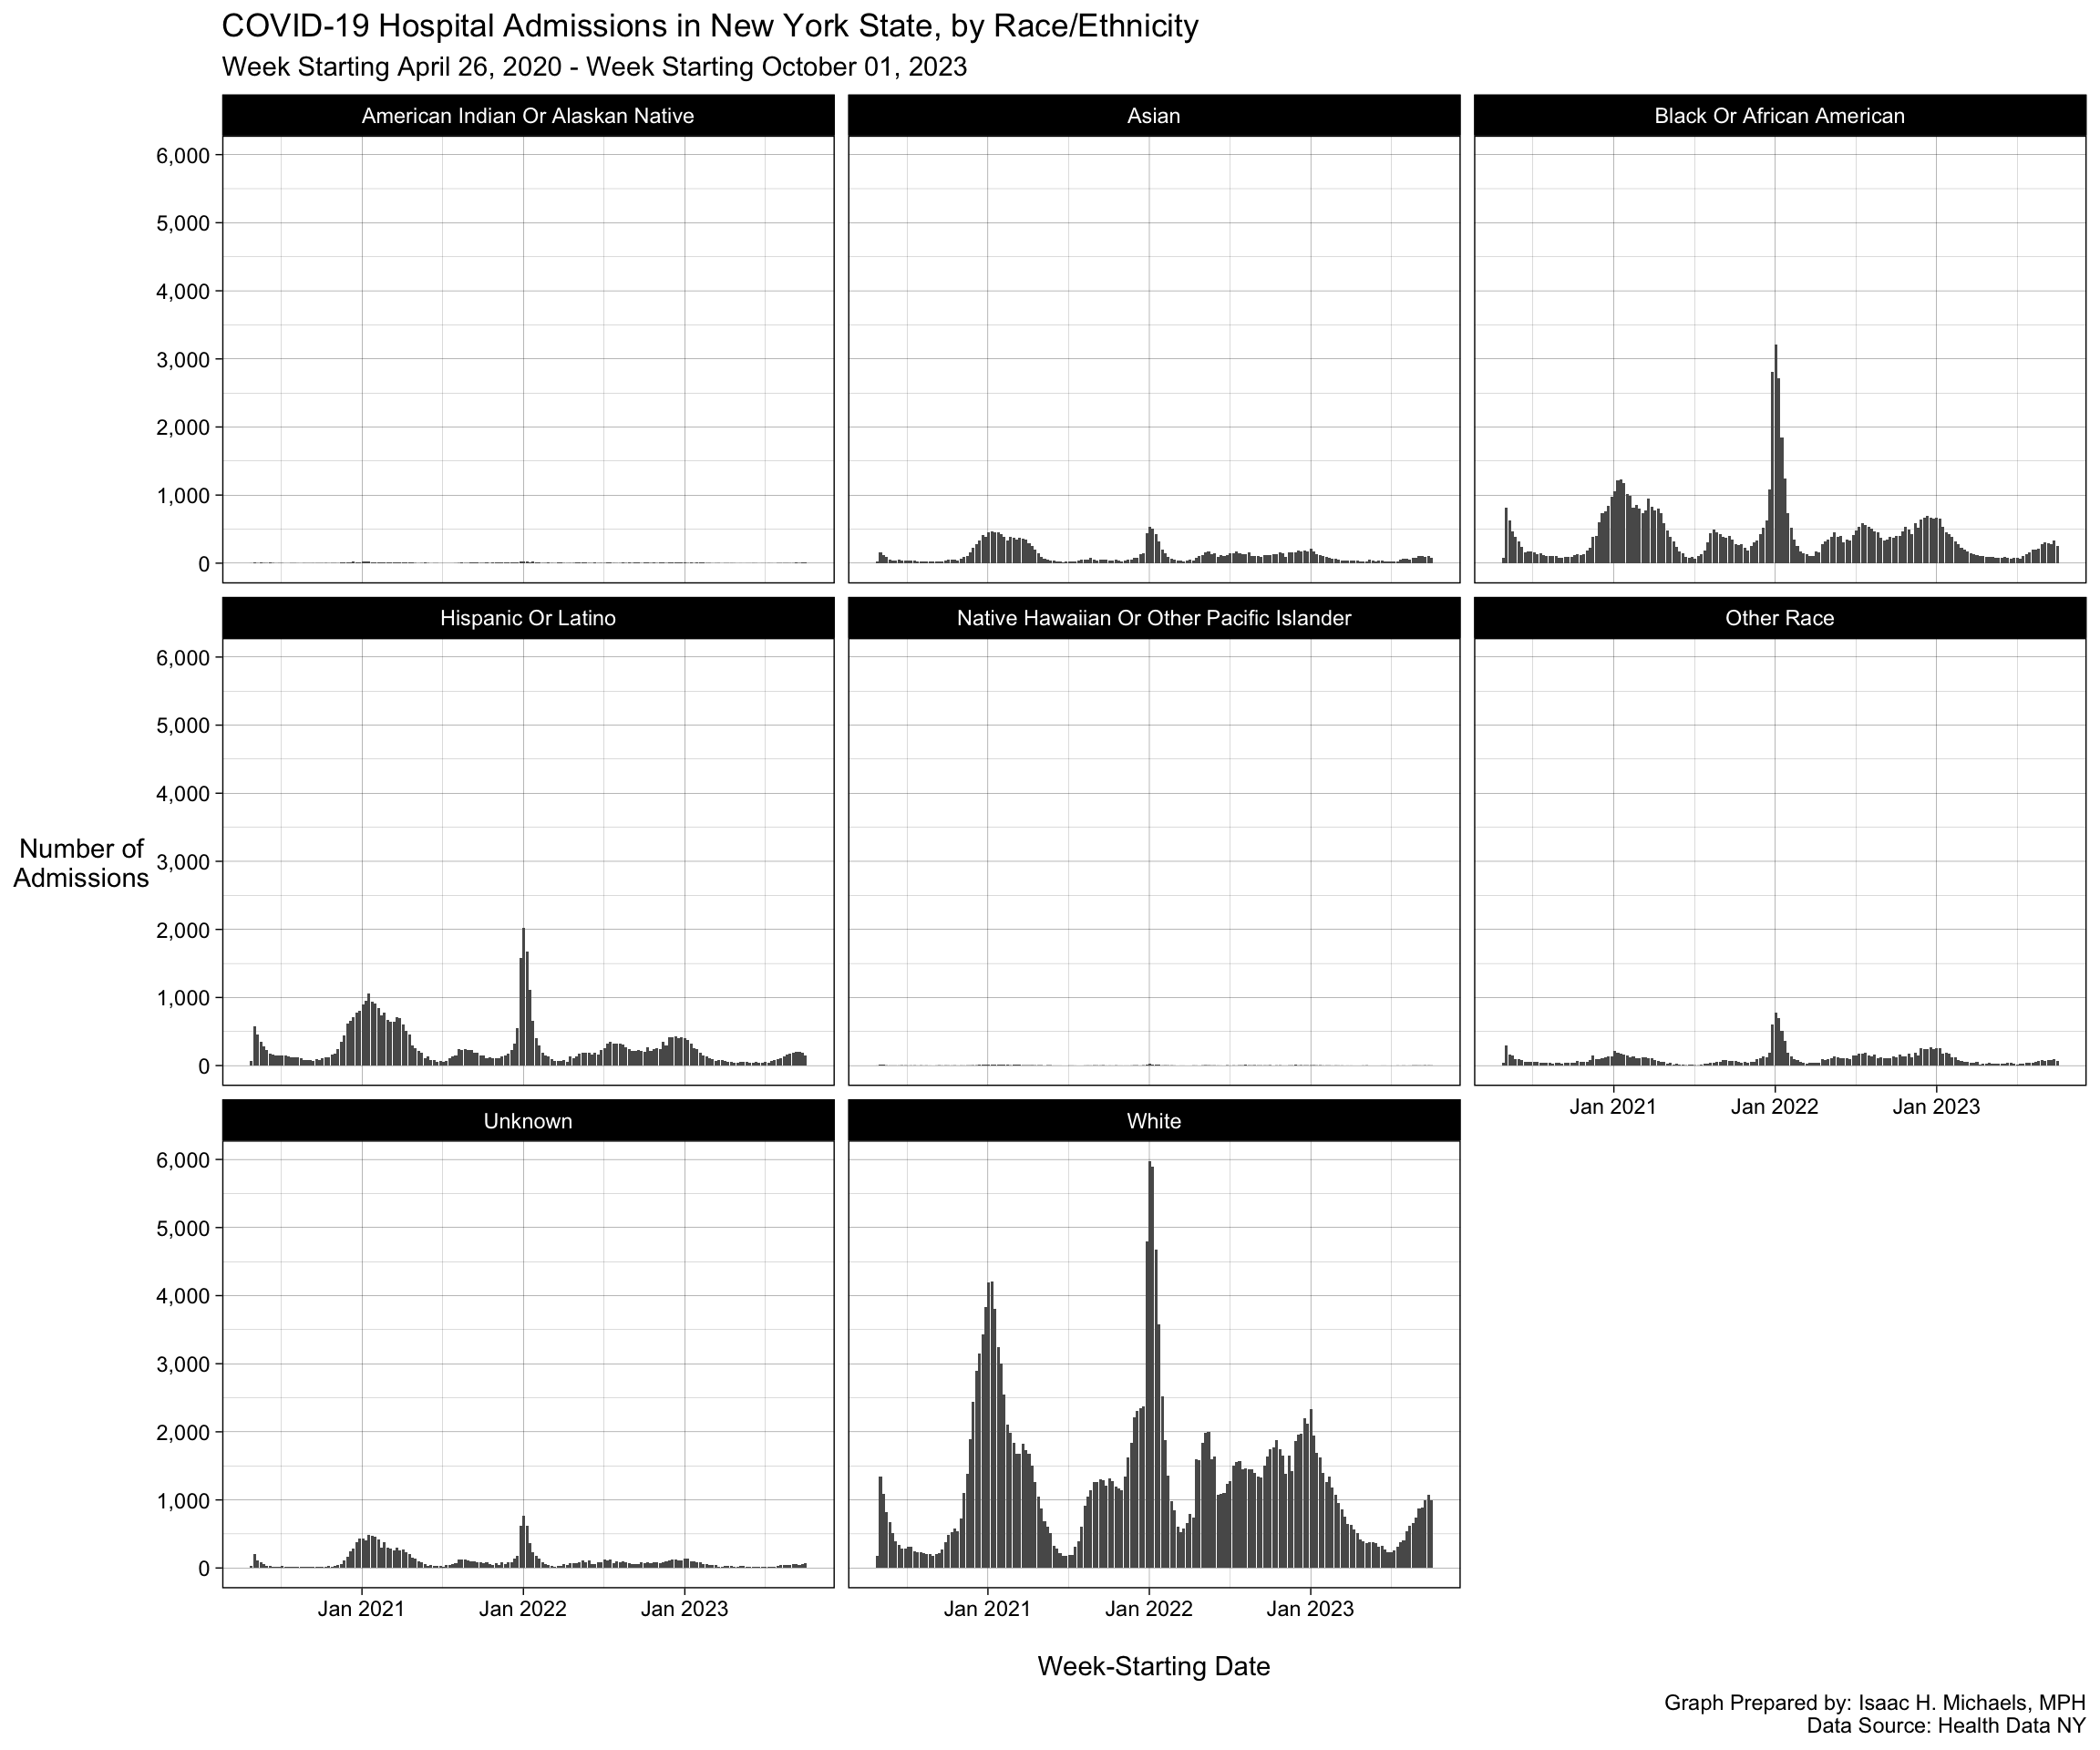
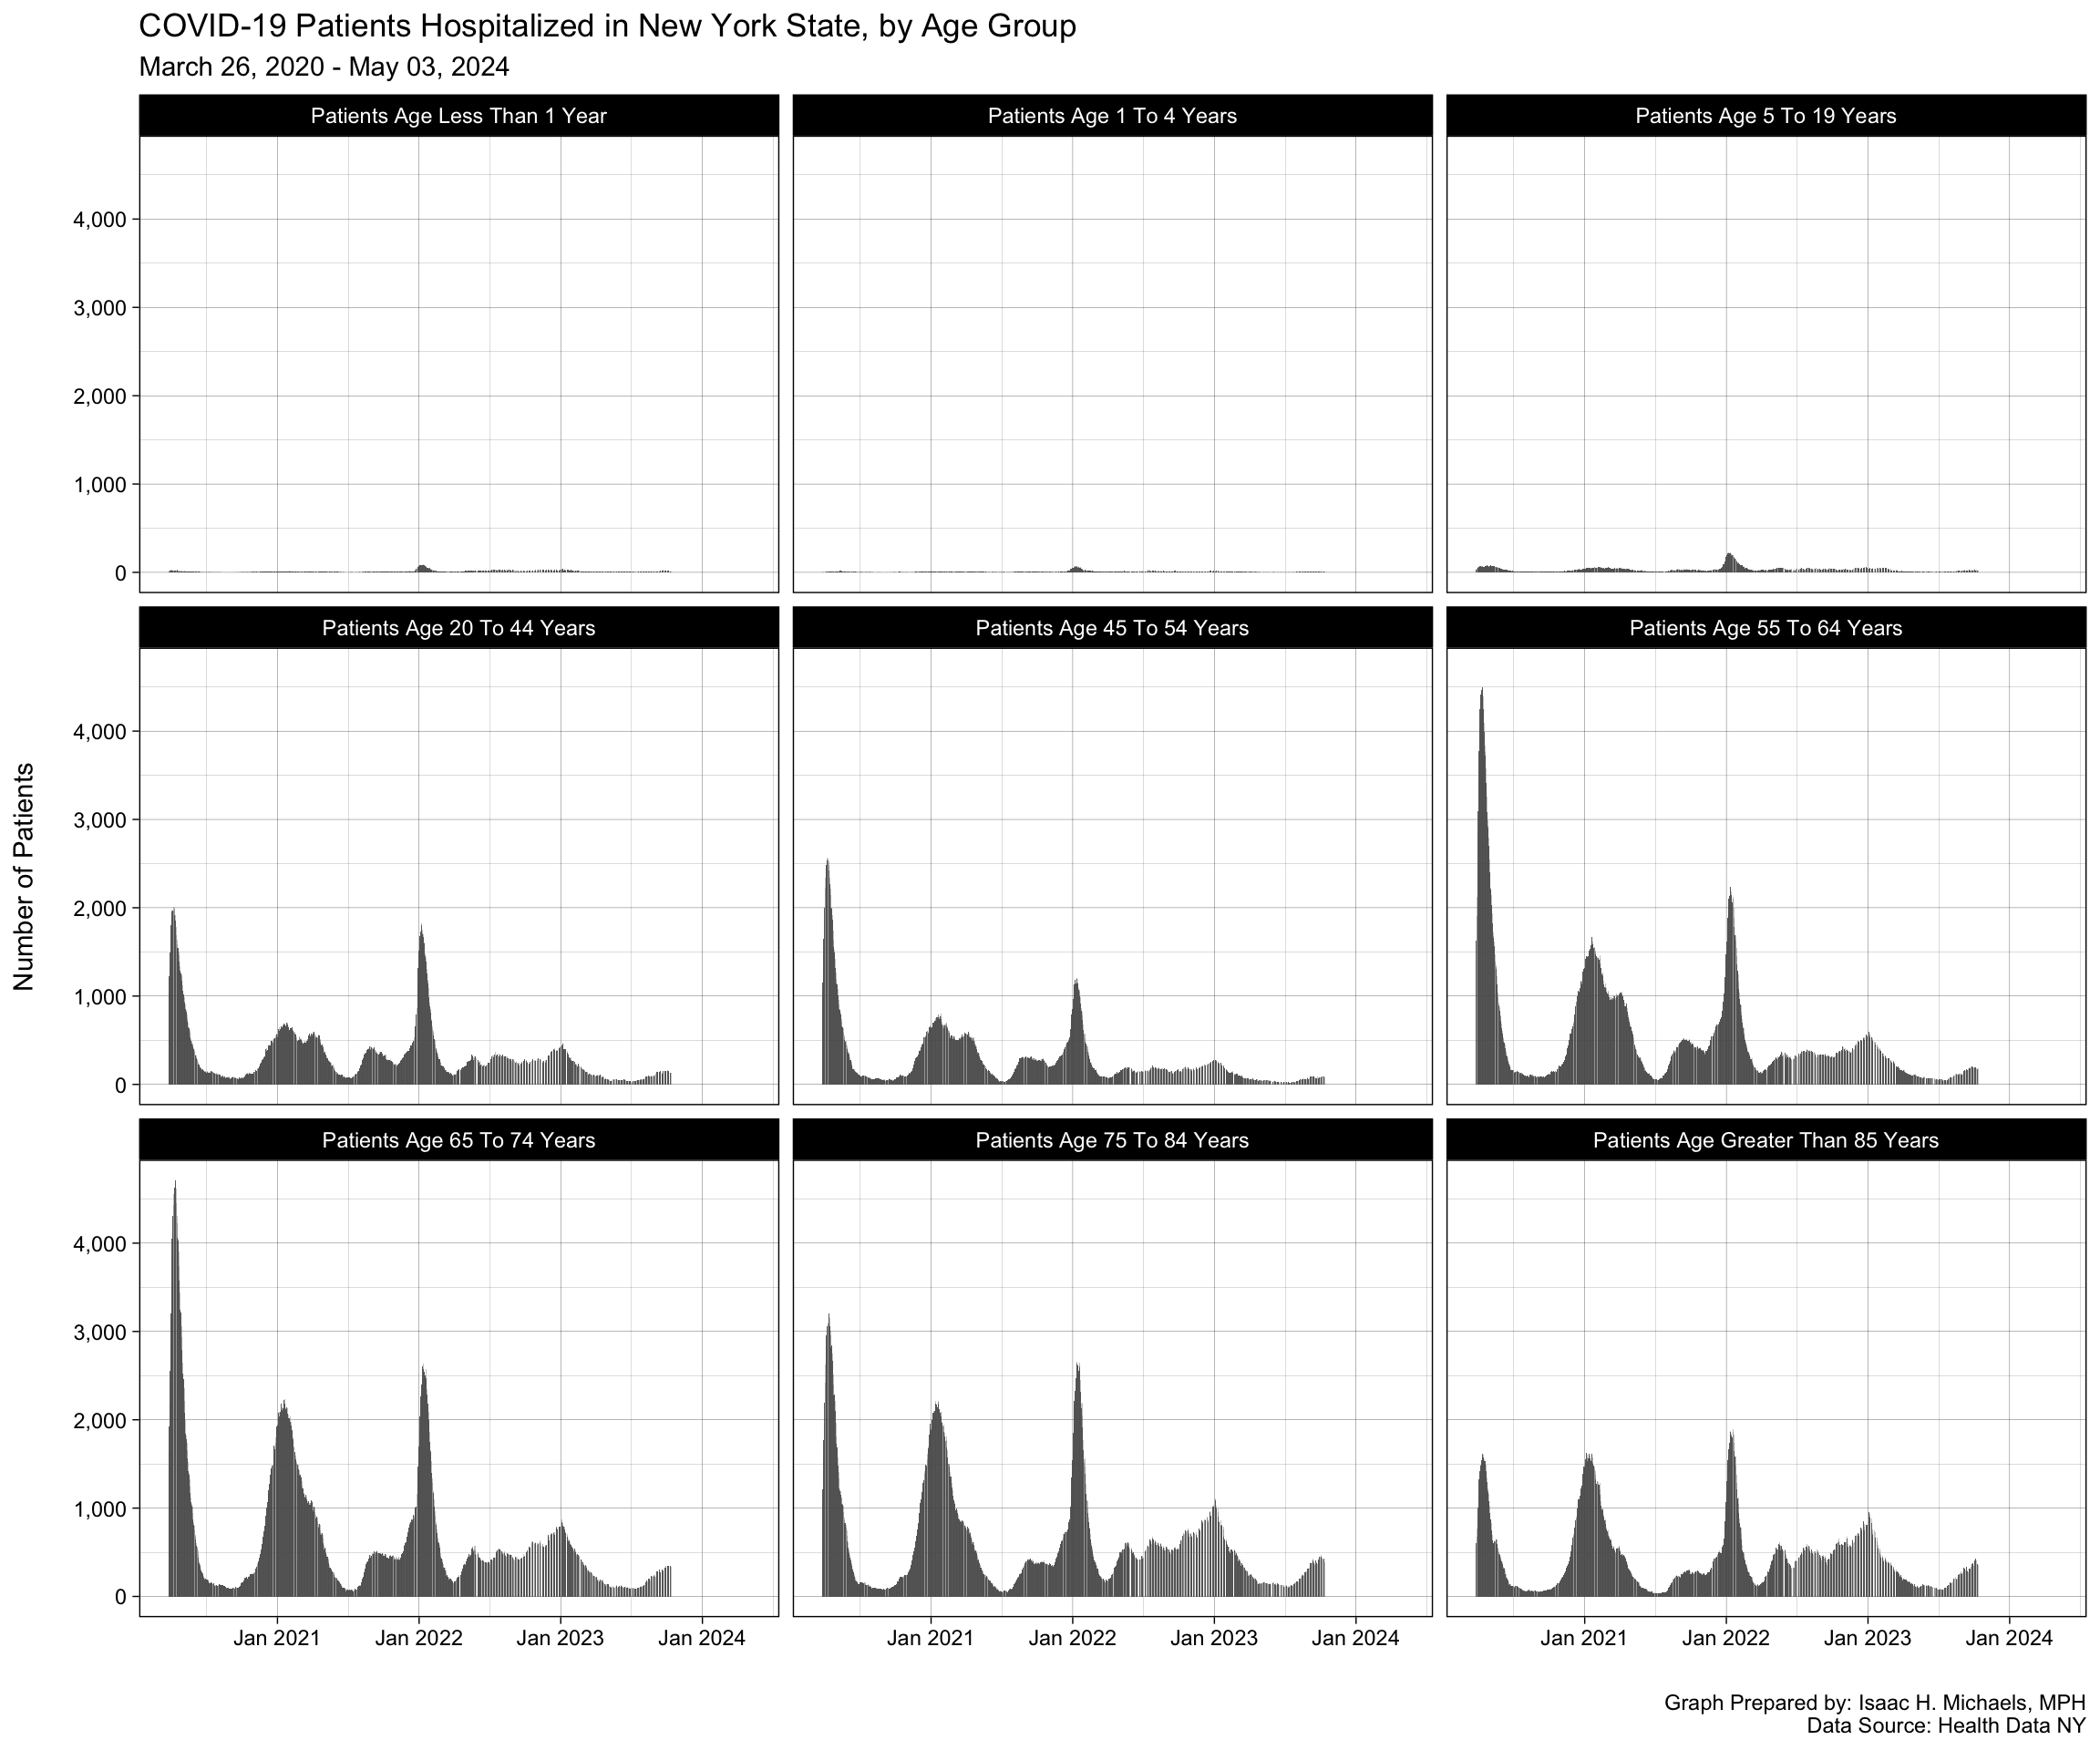
Hospital Admissions
By Age Group
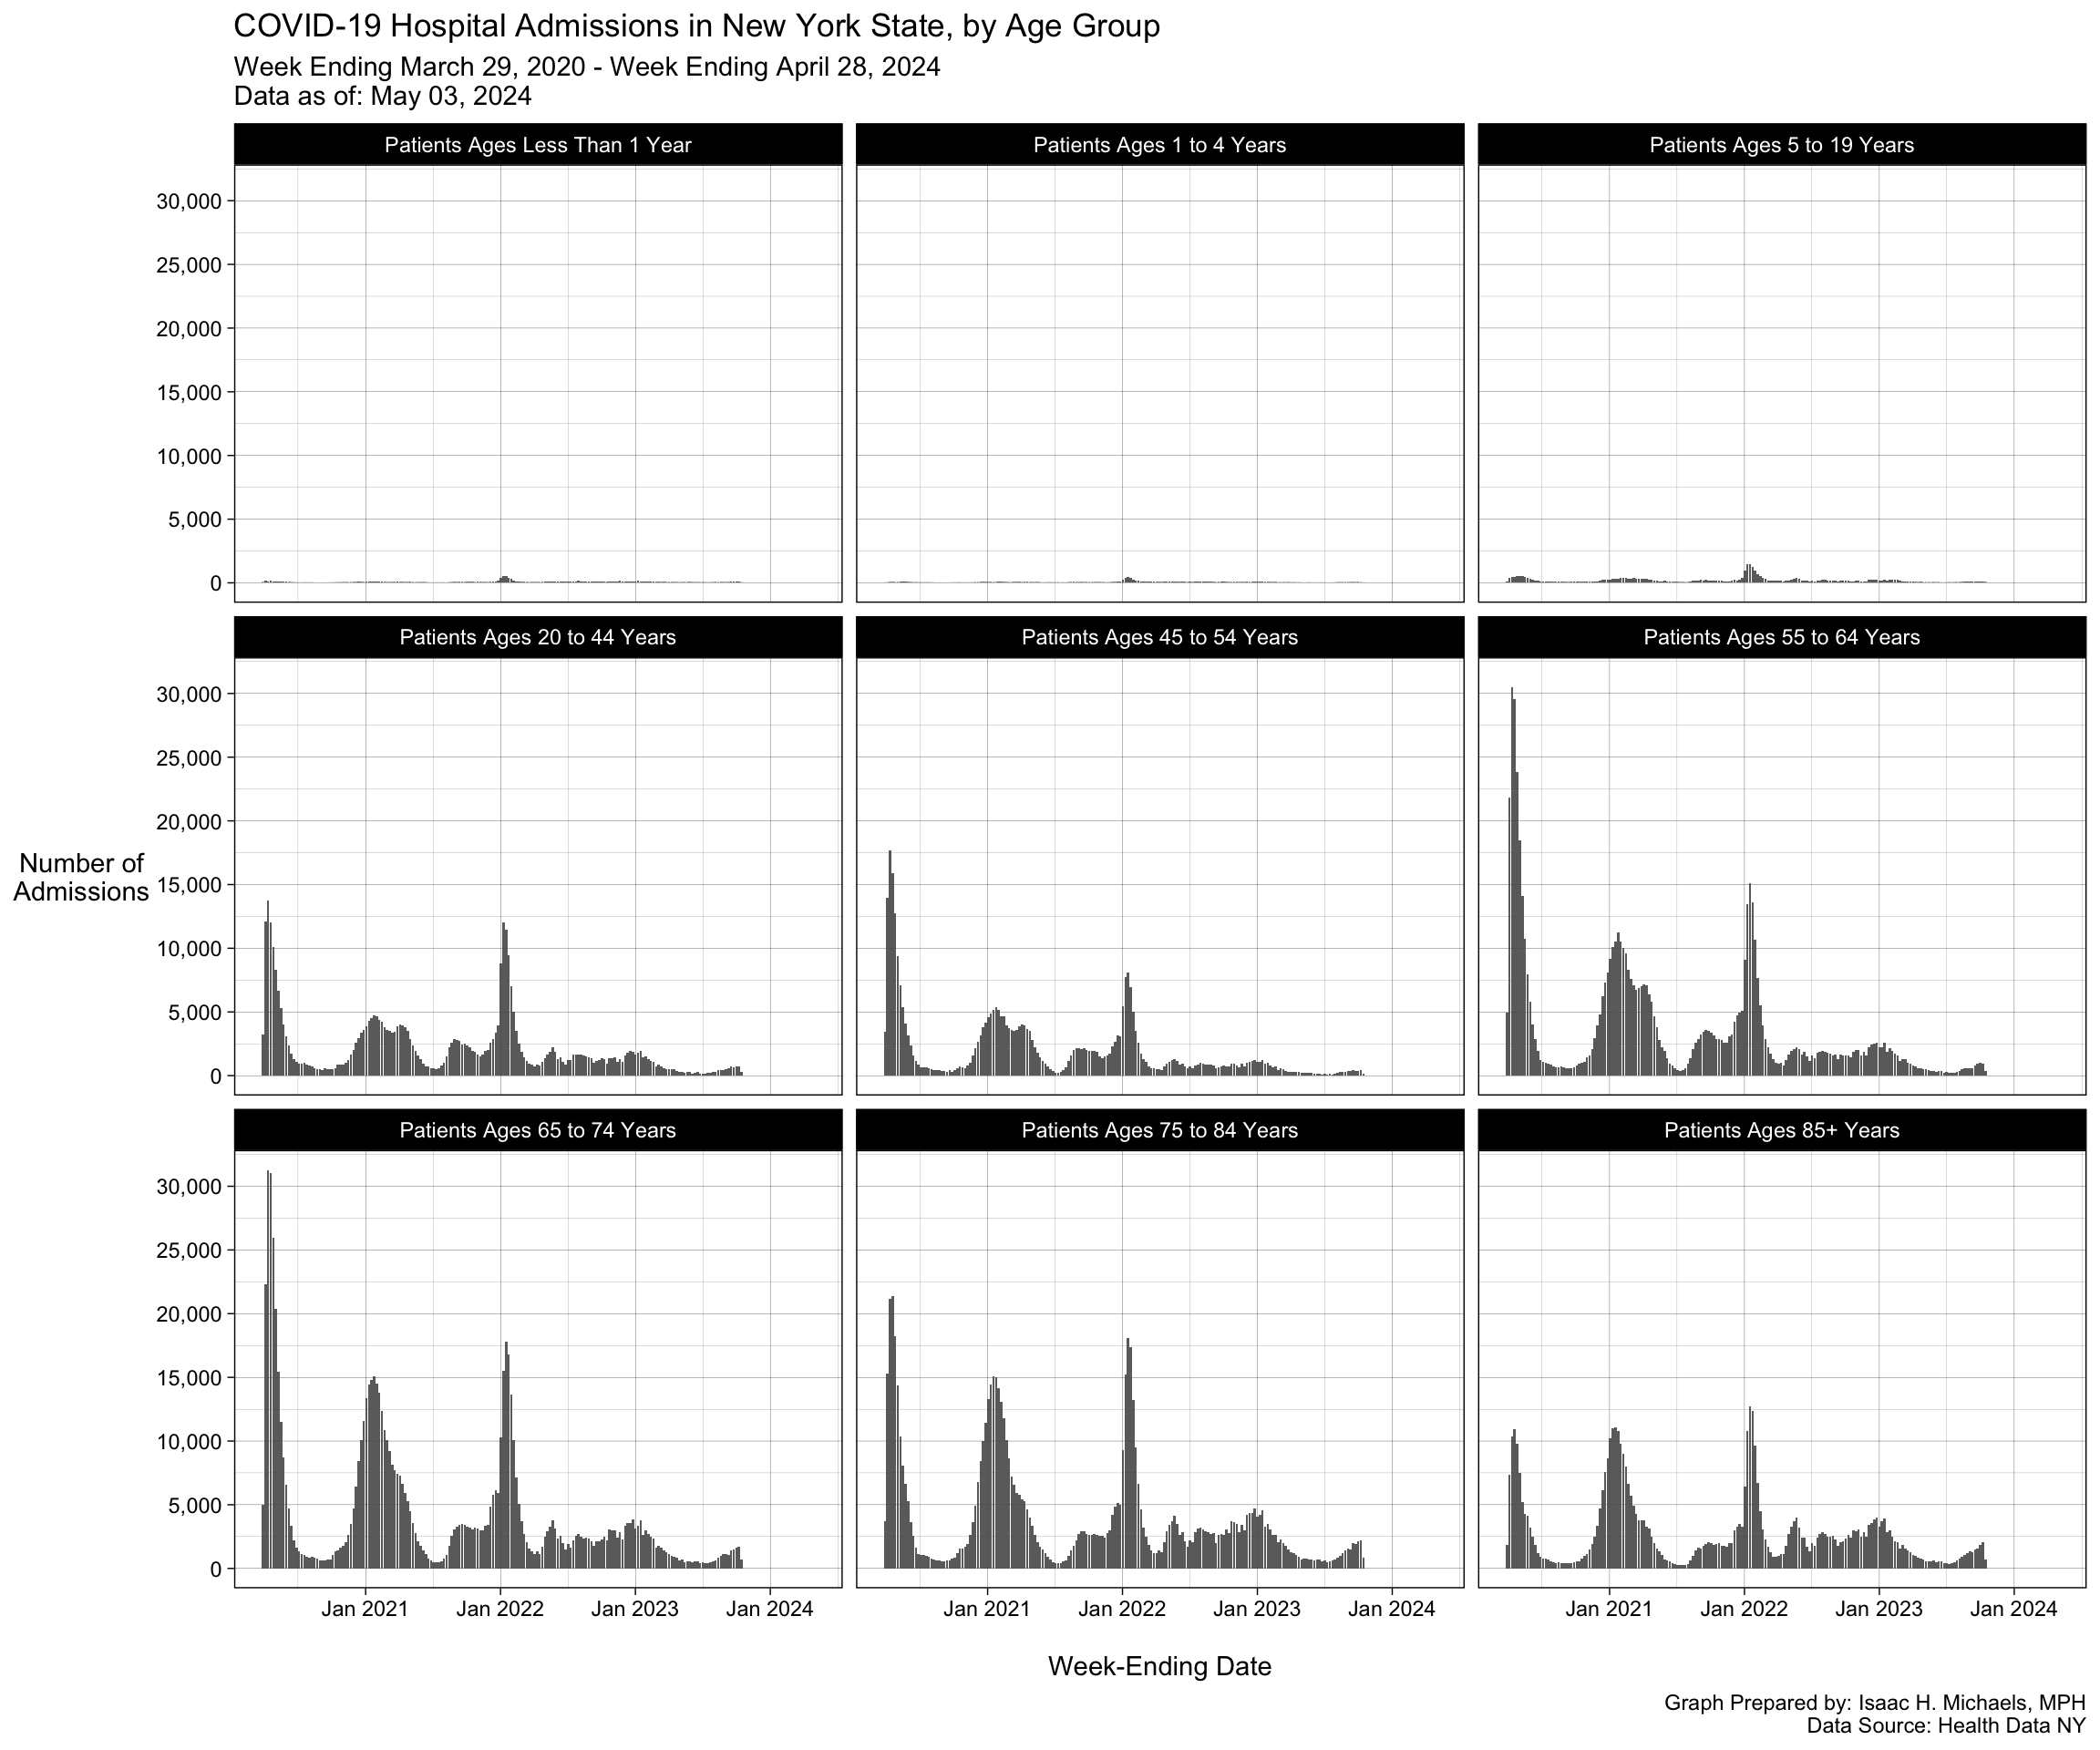
Graph Prepared By: Isaac H. Michaels, MPH
Data Source: Health Data NY
Graph Prepared By: Isaac H. Michaels, MPH
Data Source: Health Data NY
Percentage of Inpatients Admitted Due to COVID-19
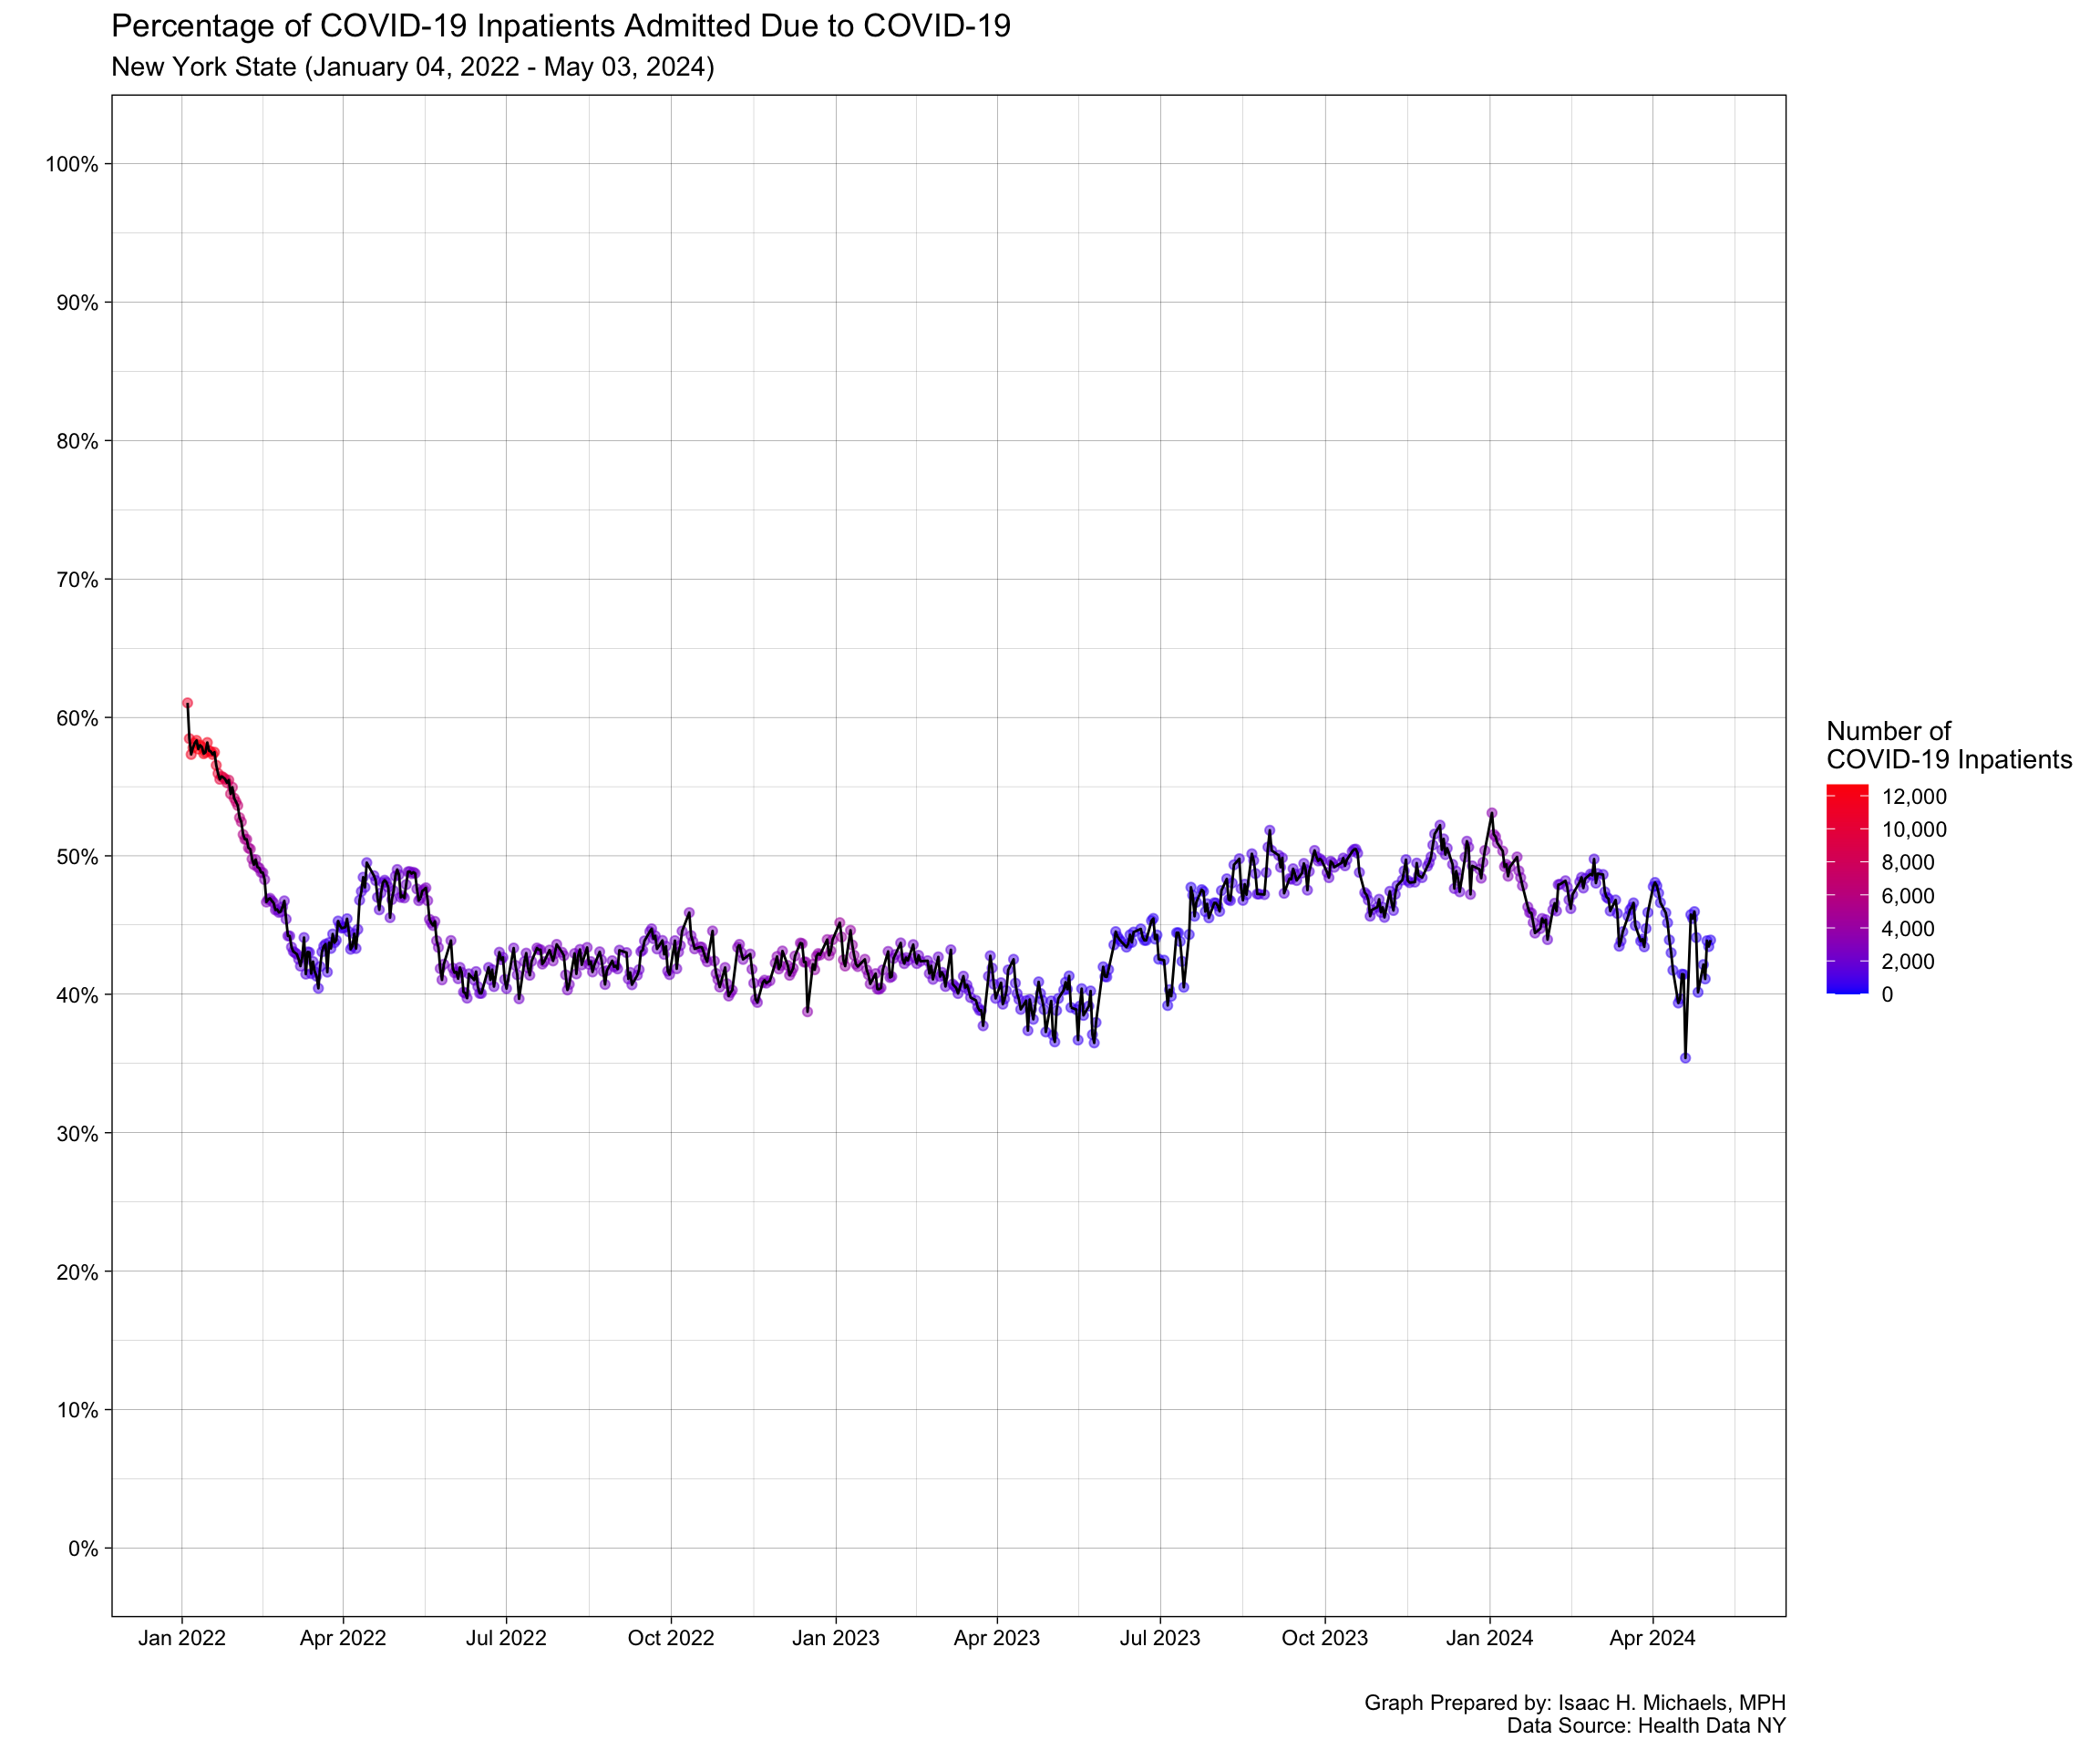
Graph Prepared By: Isaac H. Michaels, MPH
Data Source: Health Data NY
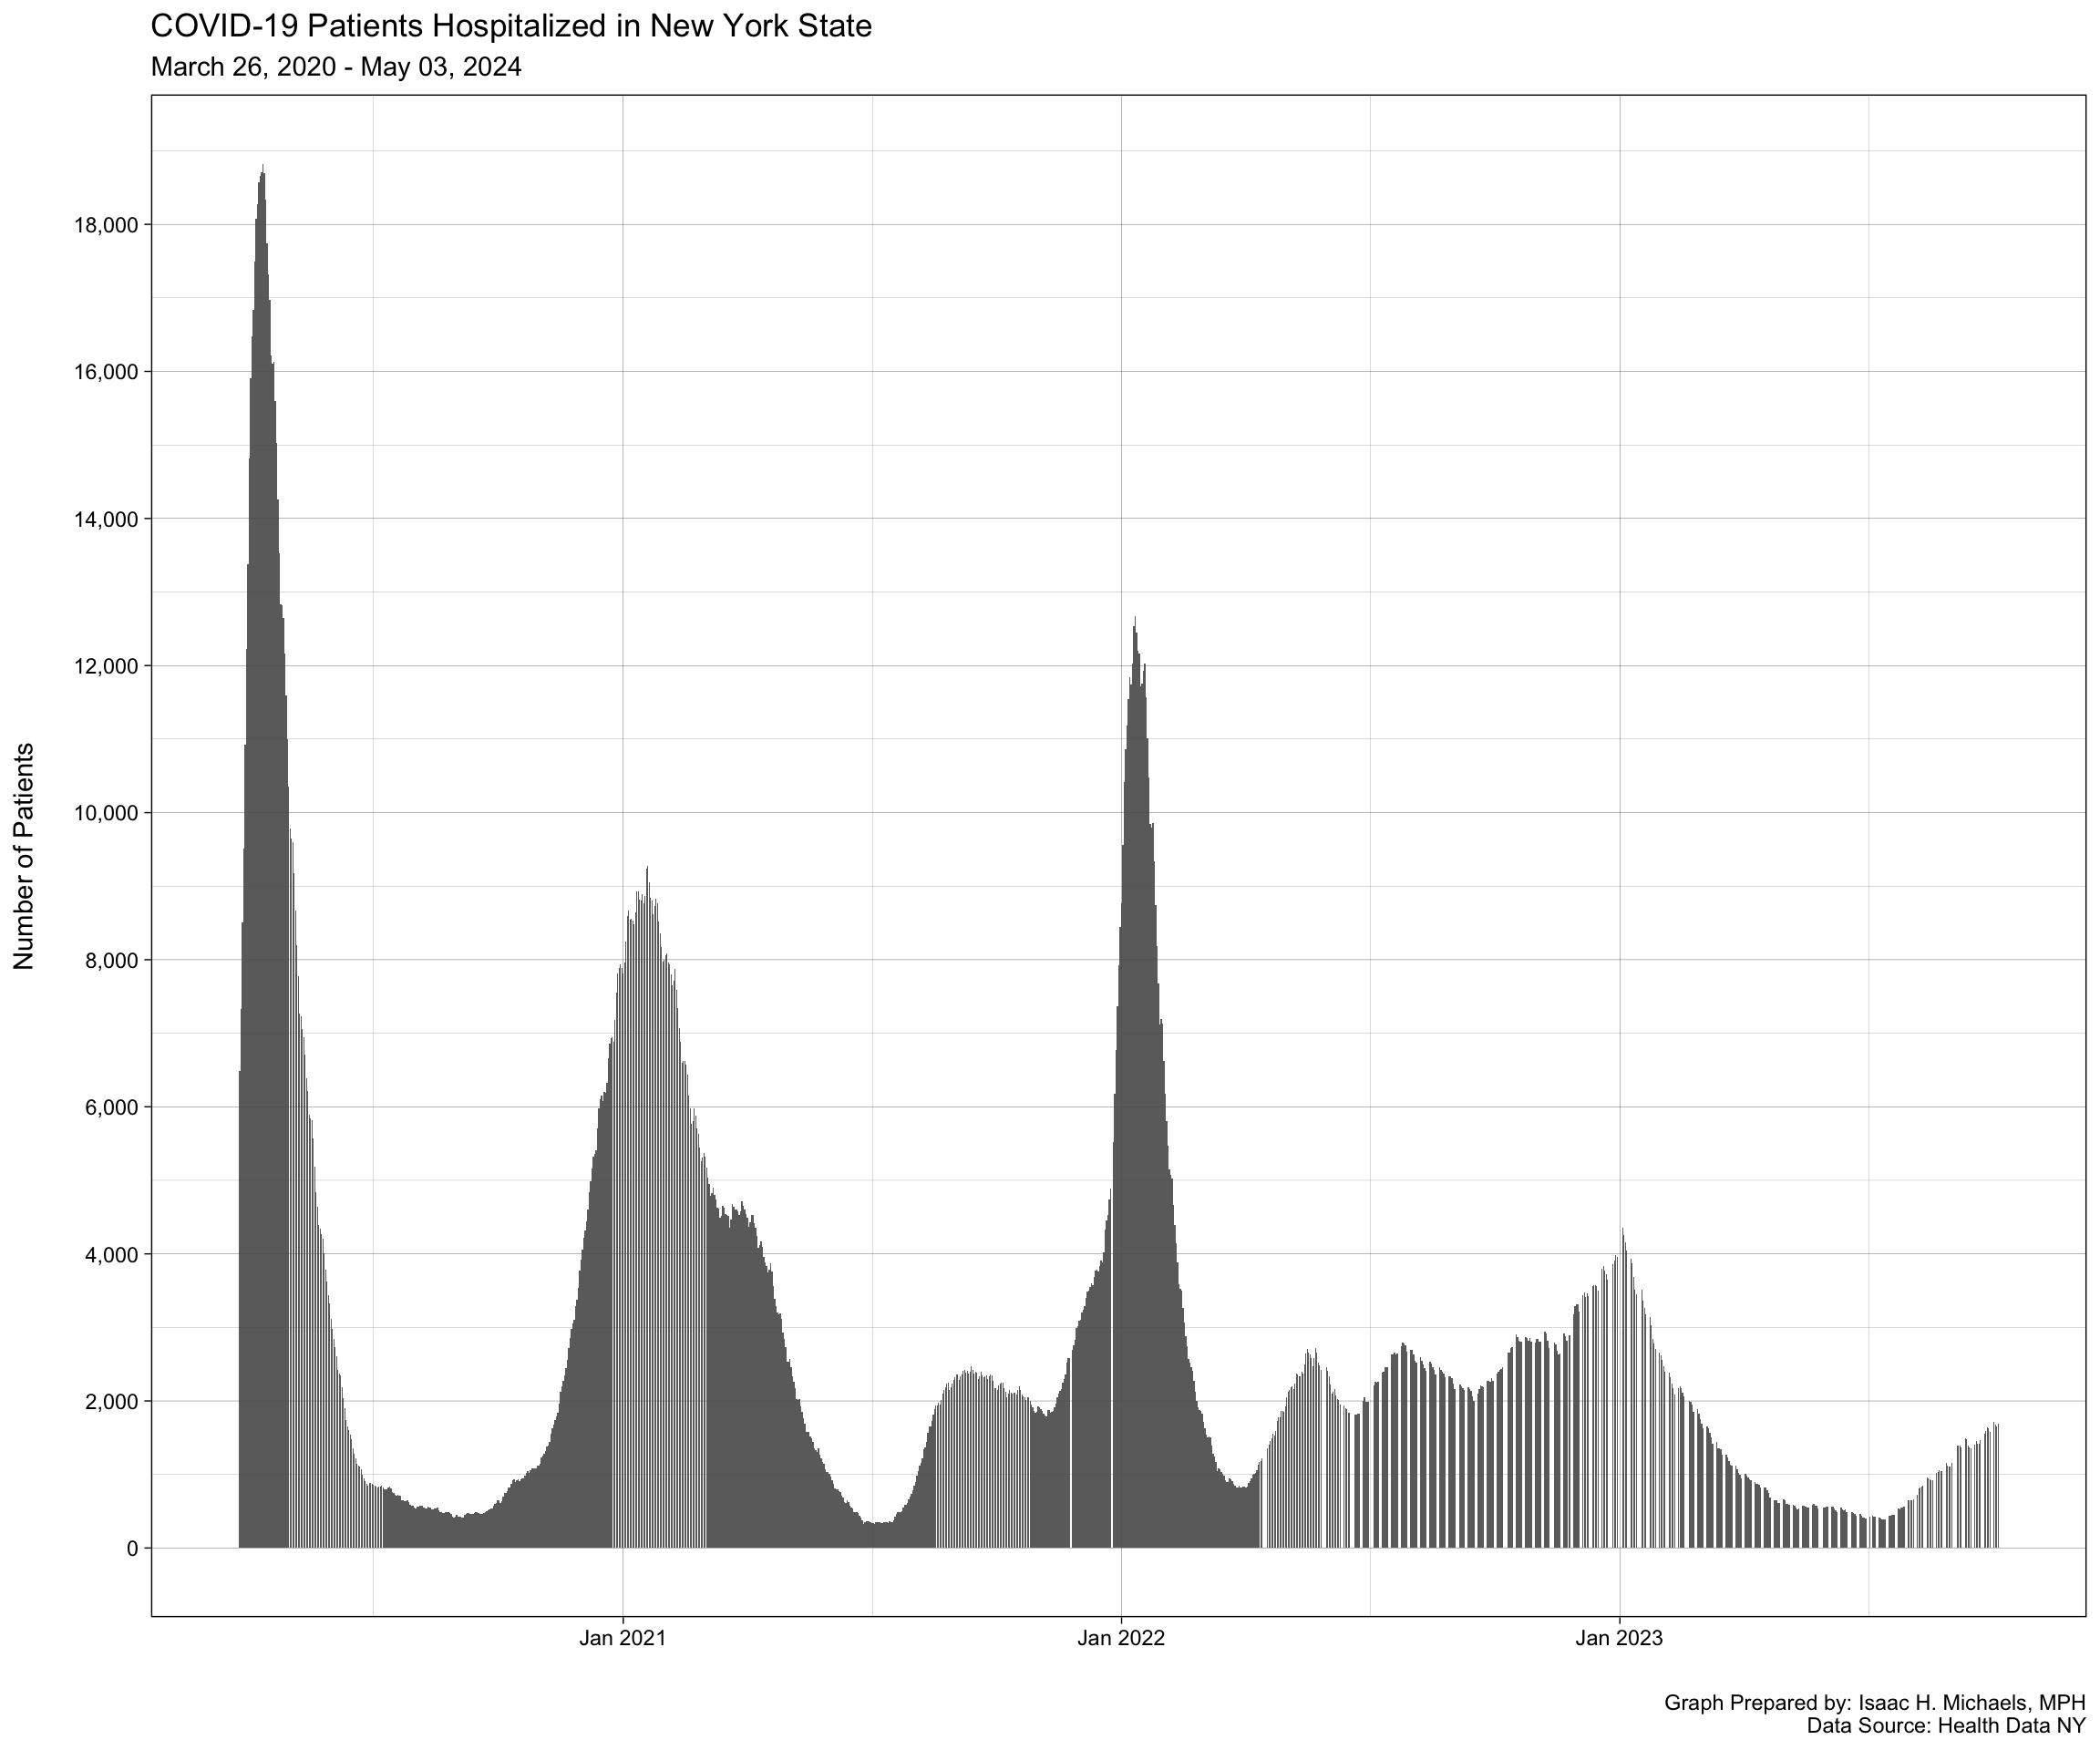
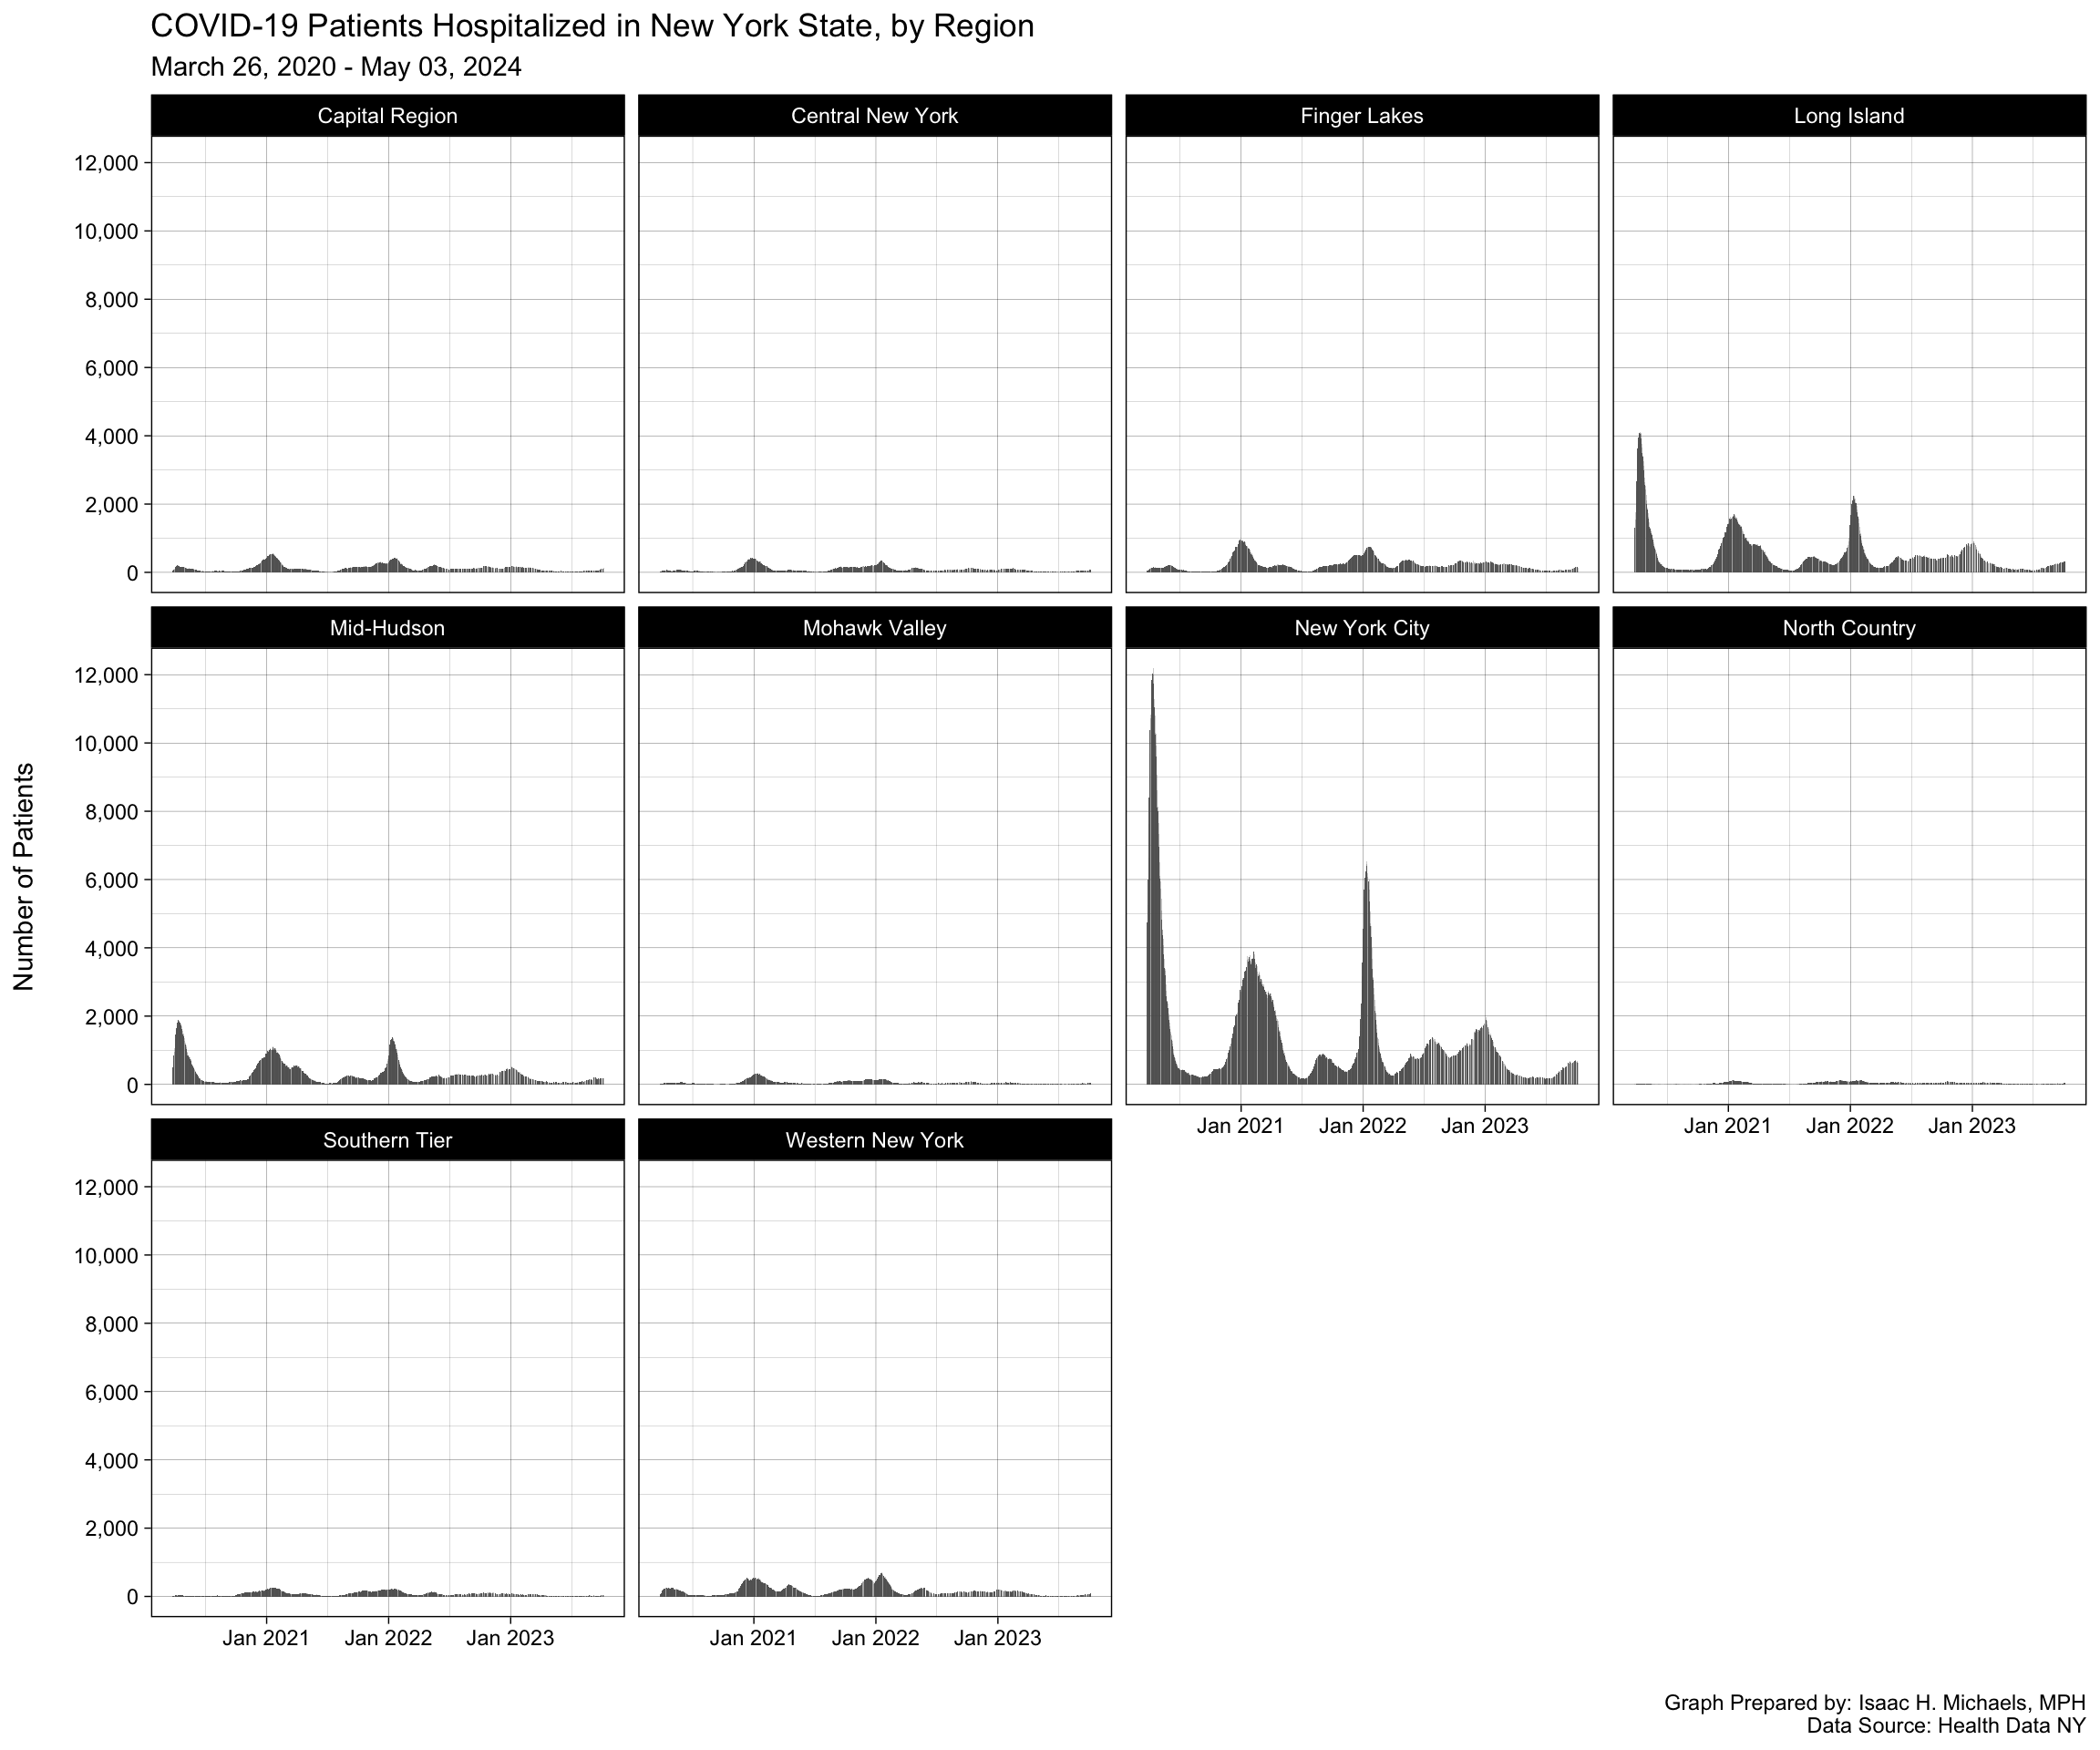
Hospitalized Patients
Hospital Capacity
Statewide
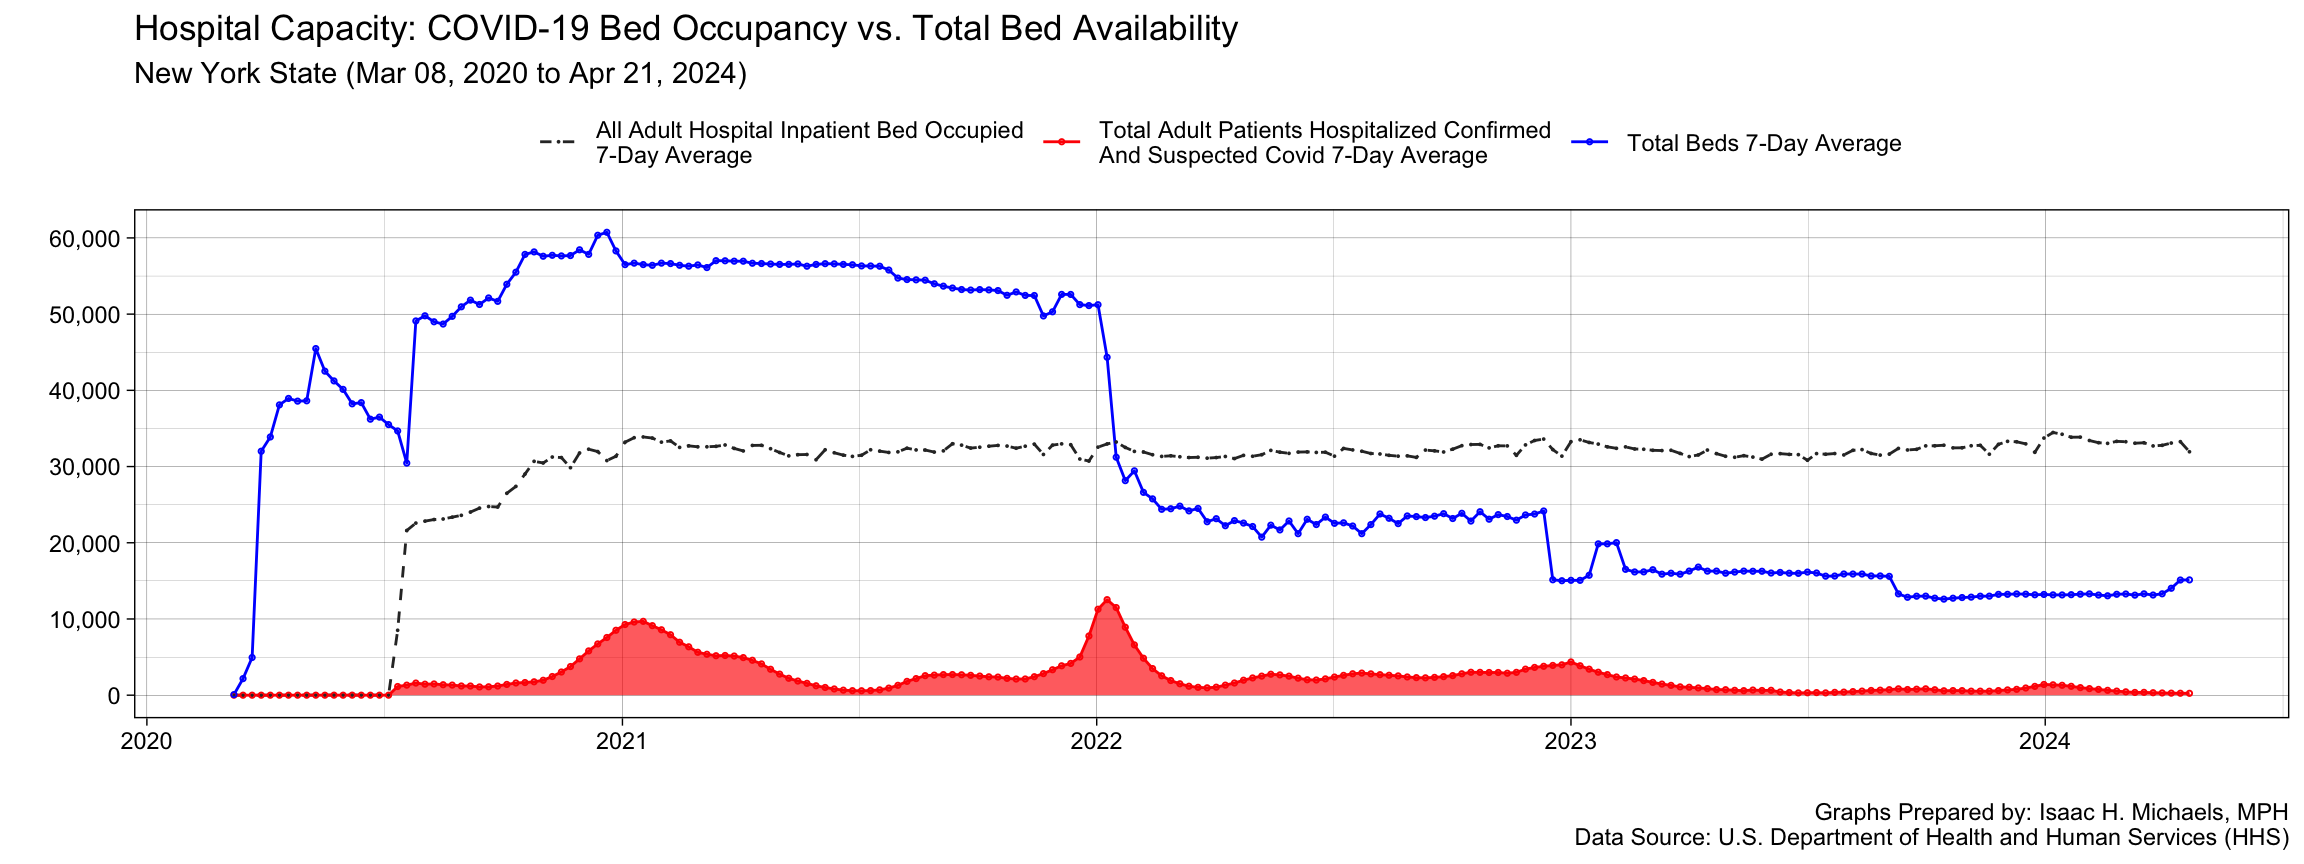
Graph Prepared By: Isaac H. Michaels, MPH
Data Source: U.S. Department of Health and Human Services (HHS)
By Region
Graph Prepared By: Isaac H. Michaels, MPH
Data Source: U.S. Department of Health and Human Services (HHS)
Regions include the following counties:
Capital Region: Albany, Columbia, Greene, Saratoga, Schenectady, Rensselaer, Warren, Washington
Central New York: Cayuga, Cortland, Madison, Onondaga, Oswego
Finger Lakes: Genesee, Livingston, Monroe, Ontario, Orleans, Seneca, Wayne, Wyoming, Yates
Long Island: Nassau, Suffolk
Mid-Hudson: Dutchess, Orange, Putnam, Rockland, Sullivan, Ulster, Westchester
Mohawk Valley: Fulton, Herkimer, Montgomery, Oneida, Otsego, Schoharie
New York City: Bronx, Kings, New York, Richmond, Queens
North Country: Clinton, Essex, Franklin, Hamilton, Jefferson, Lewis, St. Lawrence
Southern Tier: Broome, Chemung, Chenango, Delaware, Schuyler, Steuben, Tioga, Tompkins
Western New York: Allegany, Cattaraugus, Chautauqua, Erie, Niagara
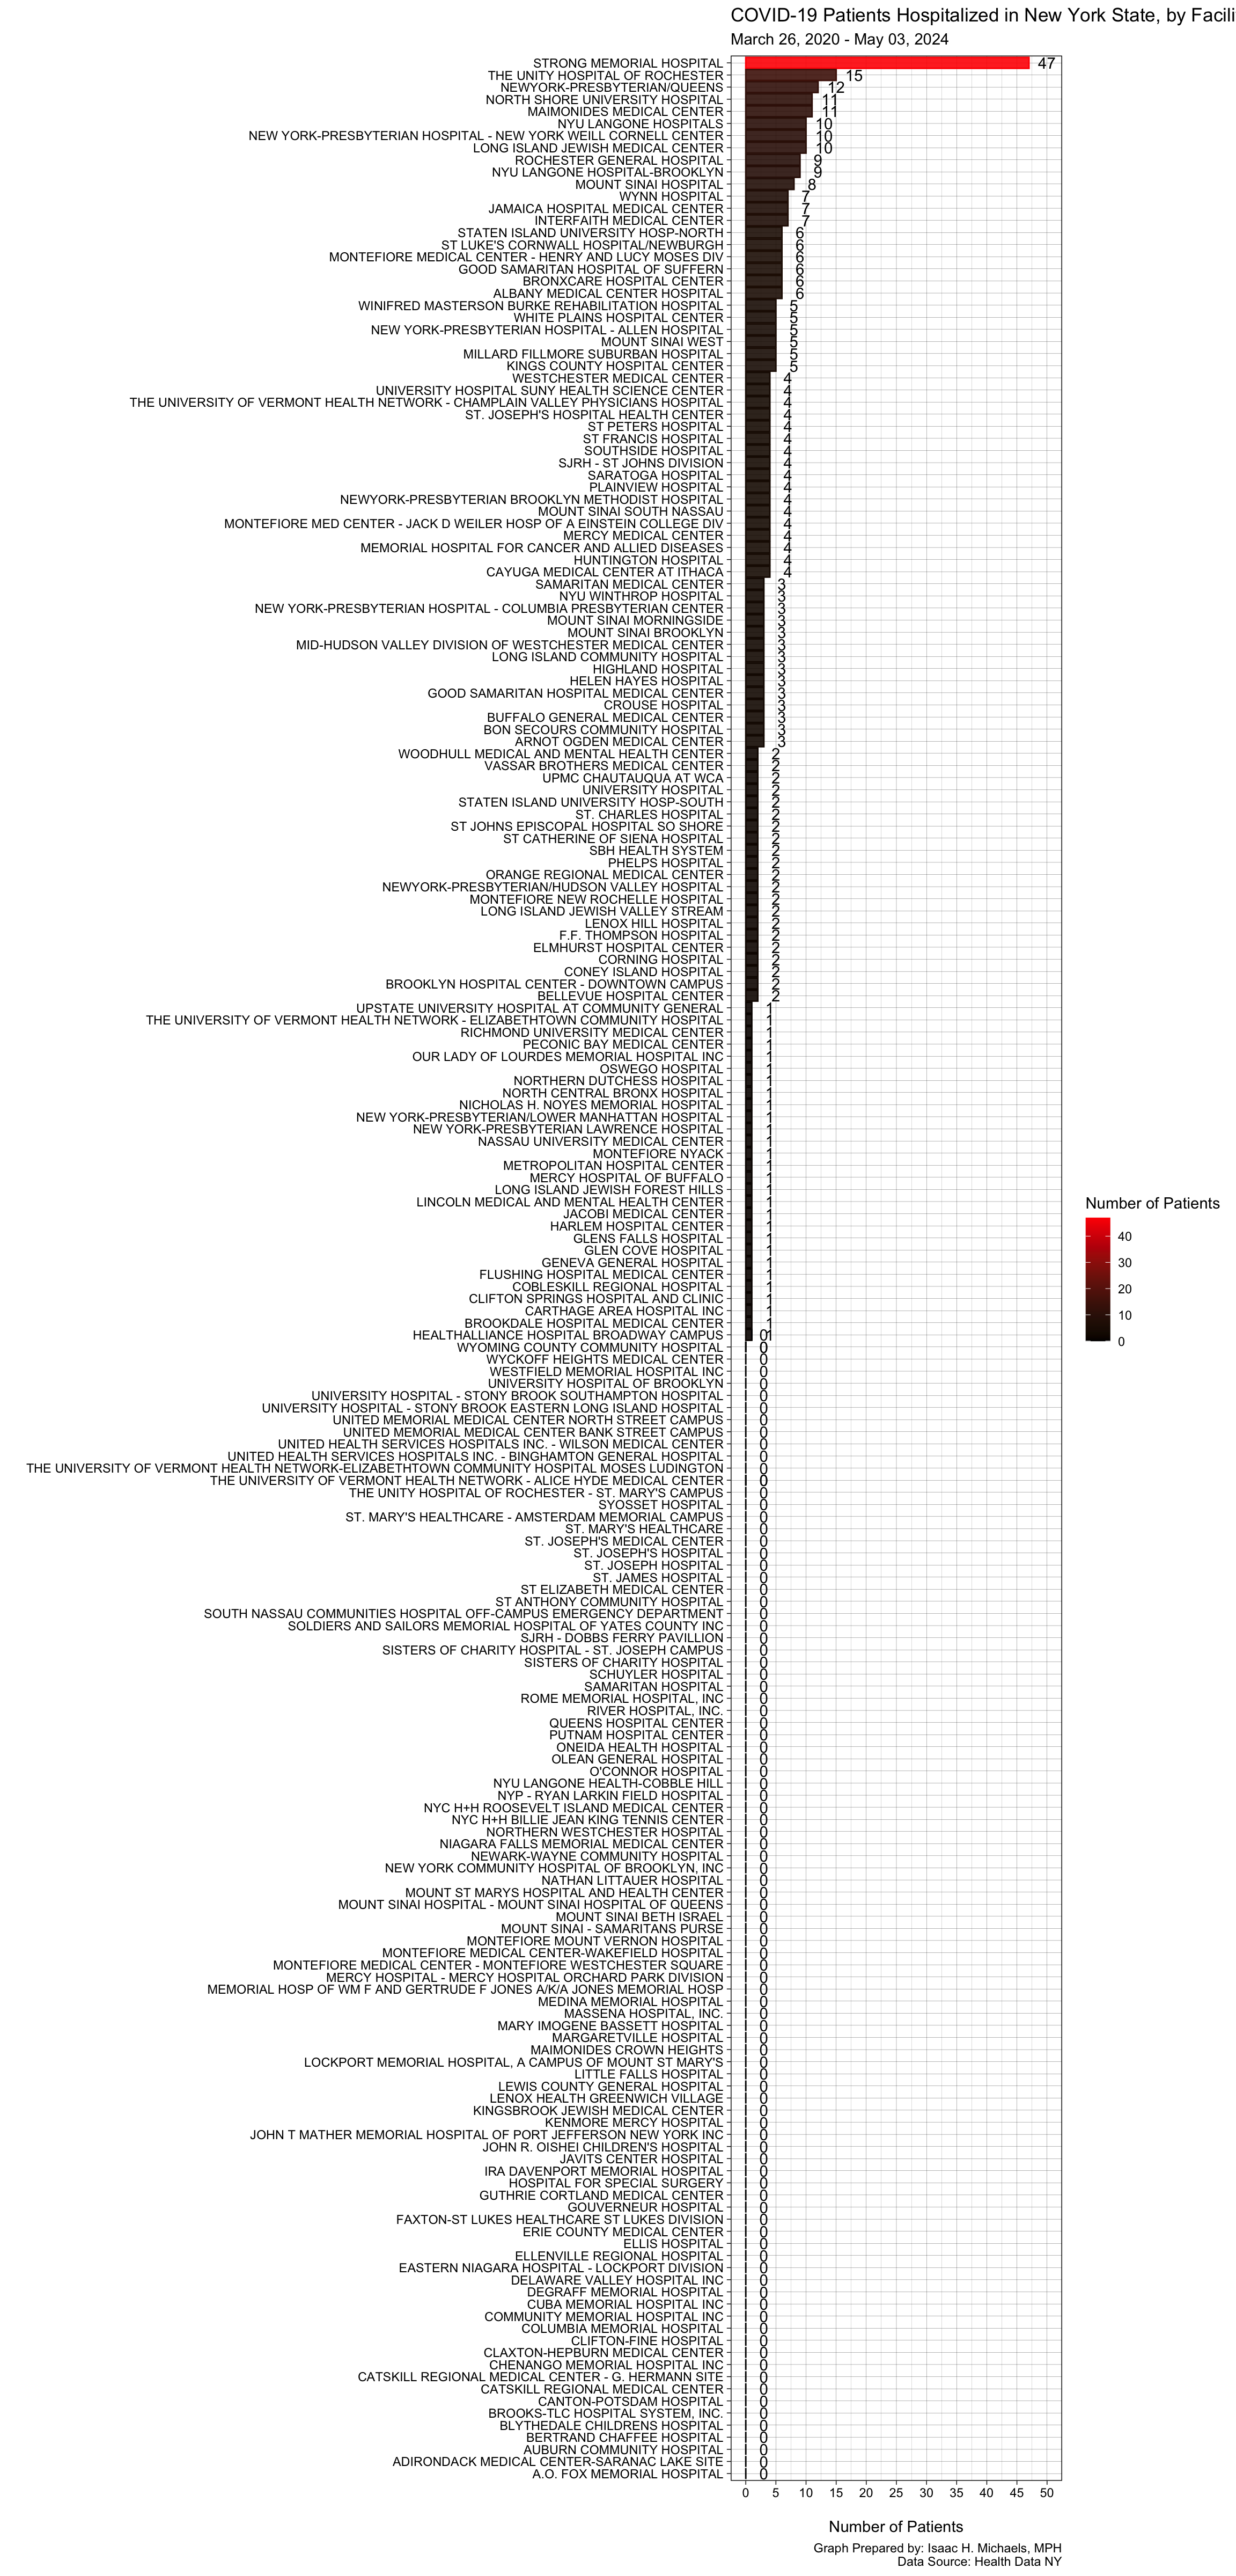
By Facility
Graph Prepared By: Isaac H. Michaels, MPH
Data Source: U.S. Department of Health and Human Services (HHS)
Immunization
Vaccine Administrations per Day
Graph Prepared By: Isaac H. Michaels, MPH
Data Source: Health Data NY
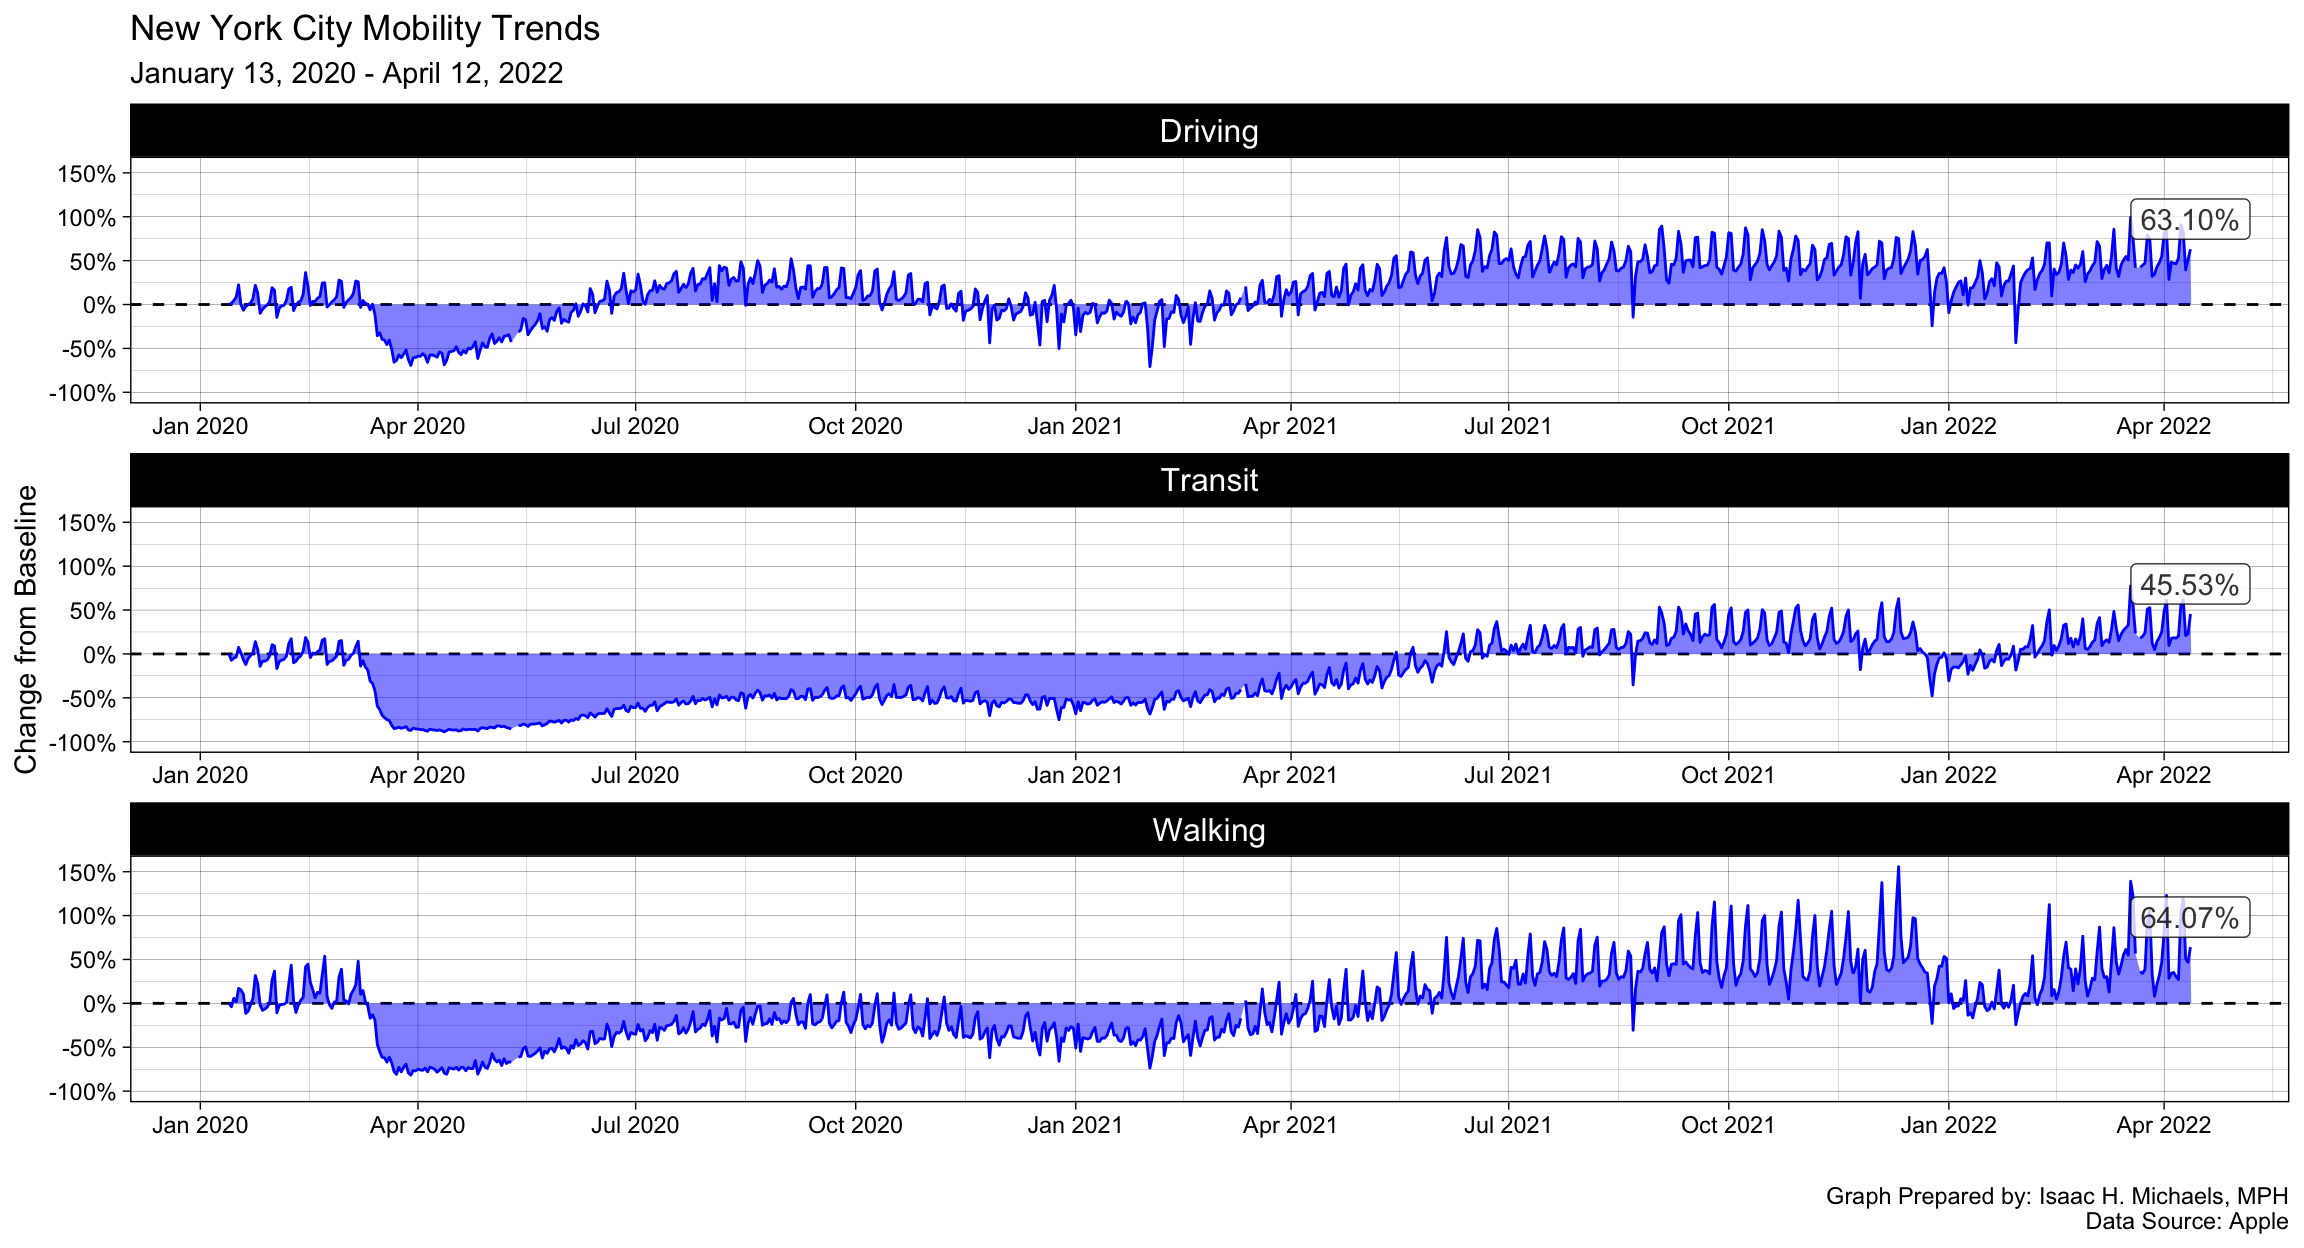
Mobility
New York State Mobility Trends
Graph Prepared by: Isaac H. Michaels, MPH
Data Source: Google LLC “Google COVID-19 Community Mobility Reports.” https://www.google.com/covid19/mobility/ Accessed: 2024-10-21.
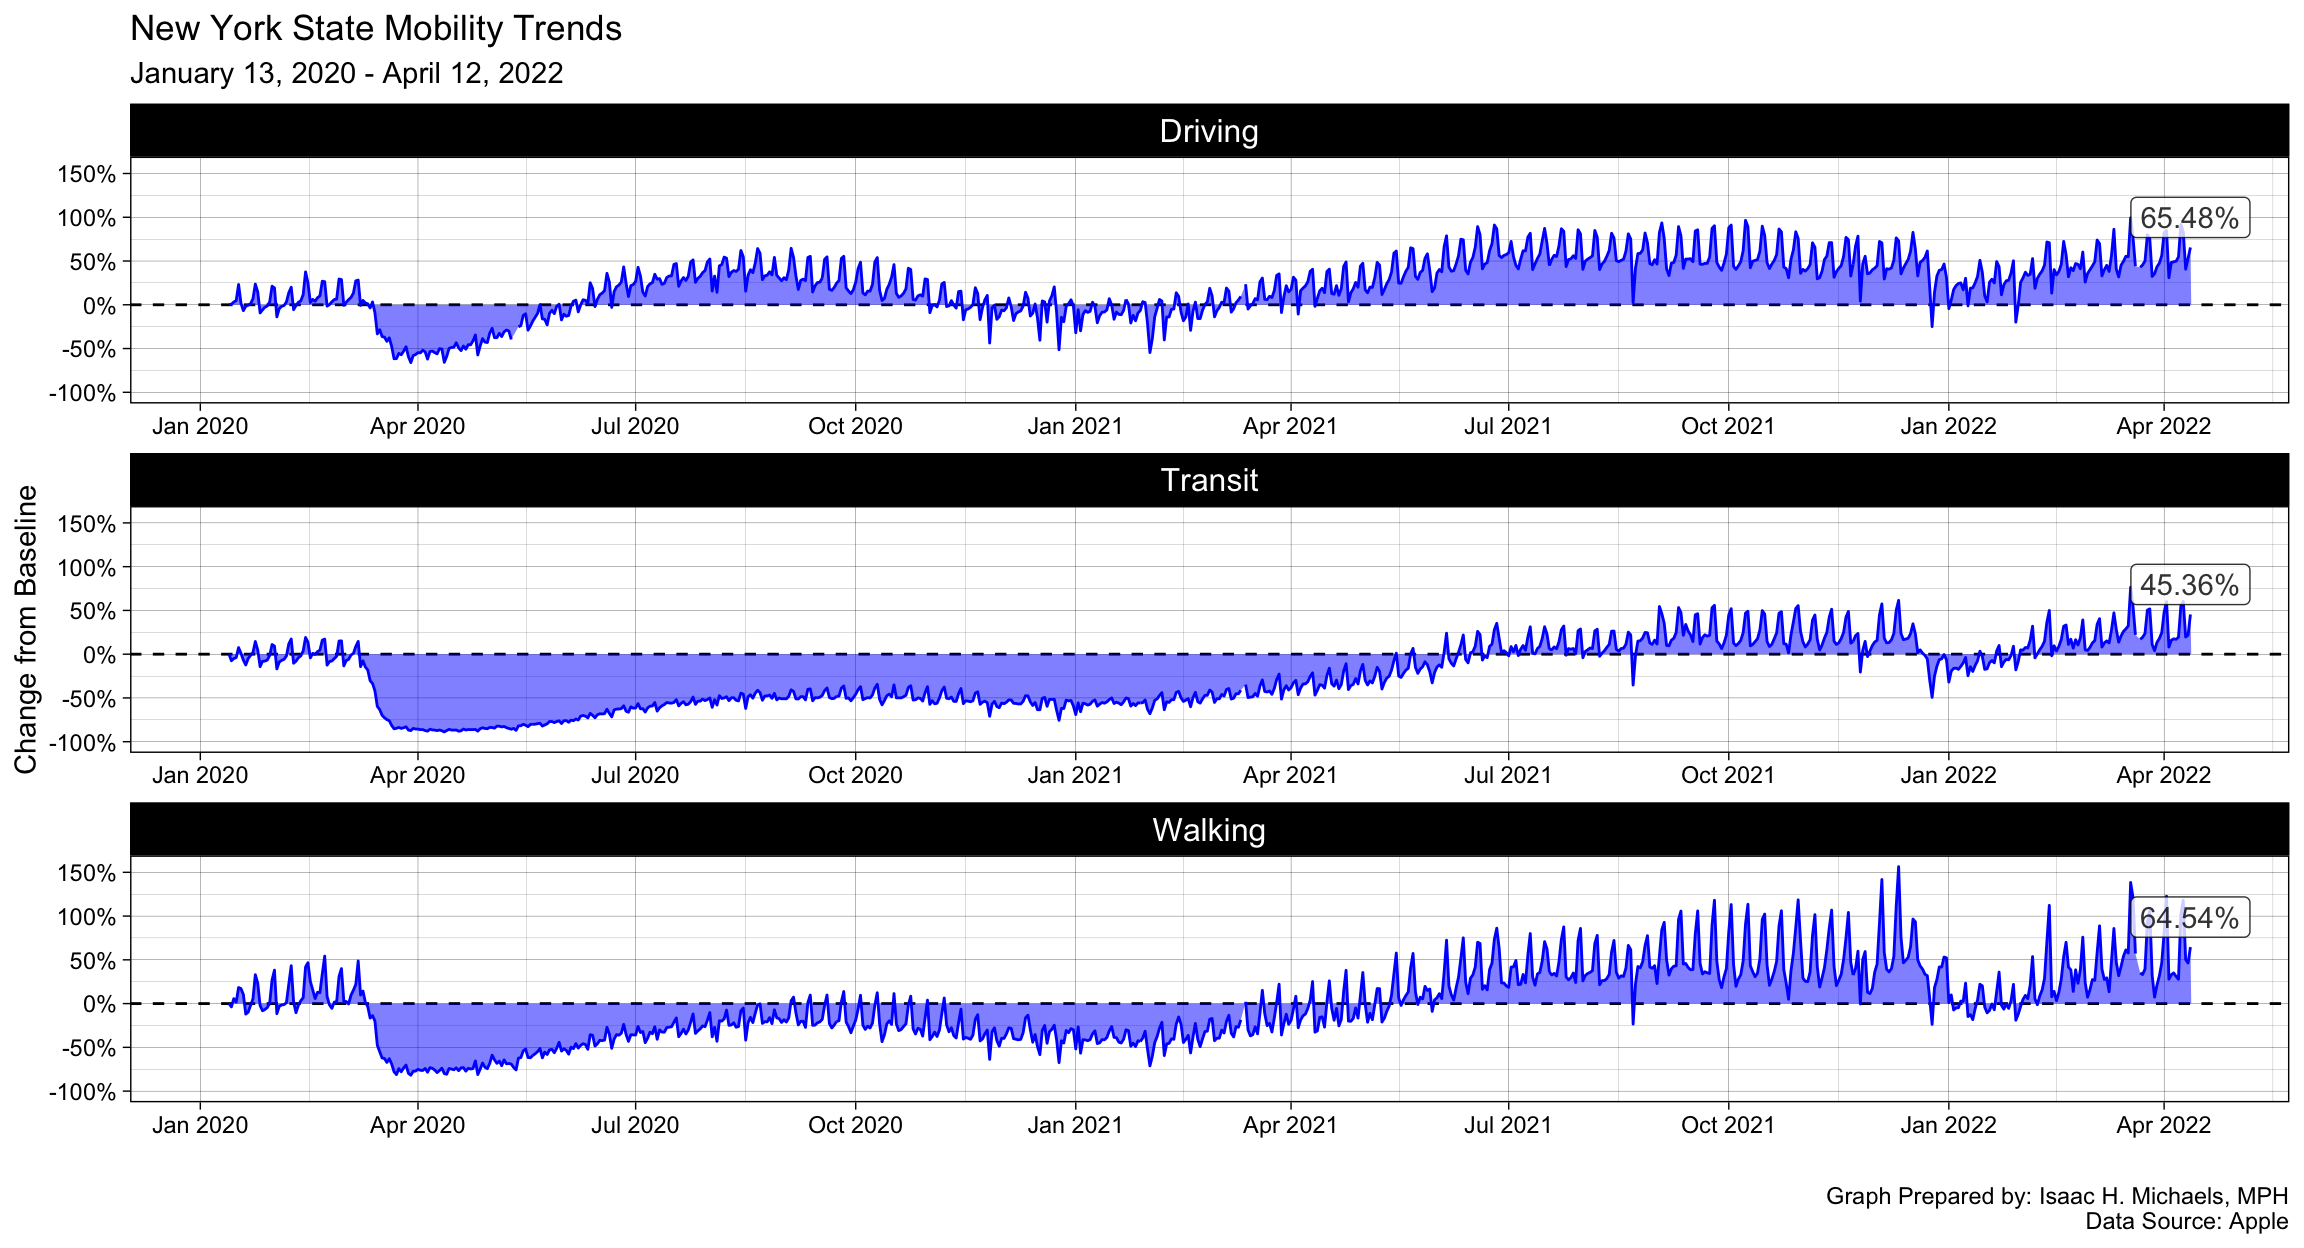
Graph Prepared by: Isaac H. Michaels, MPH
Data Source: Apple
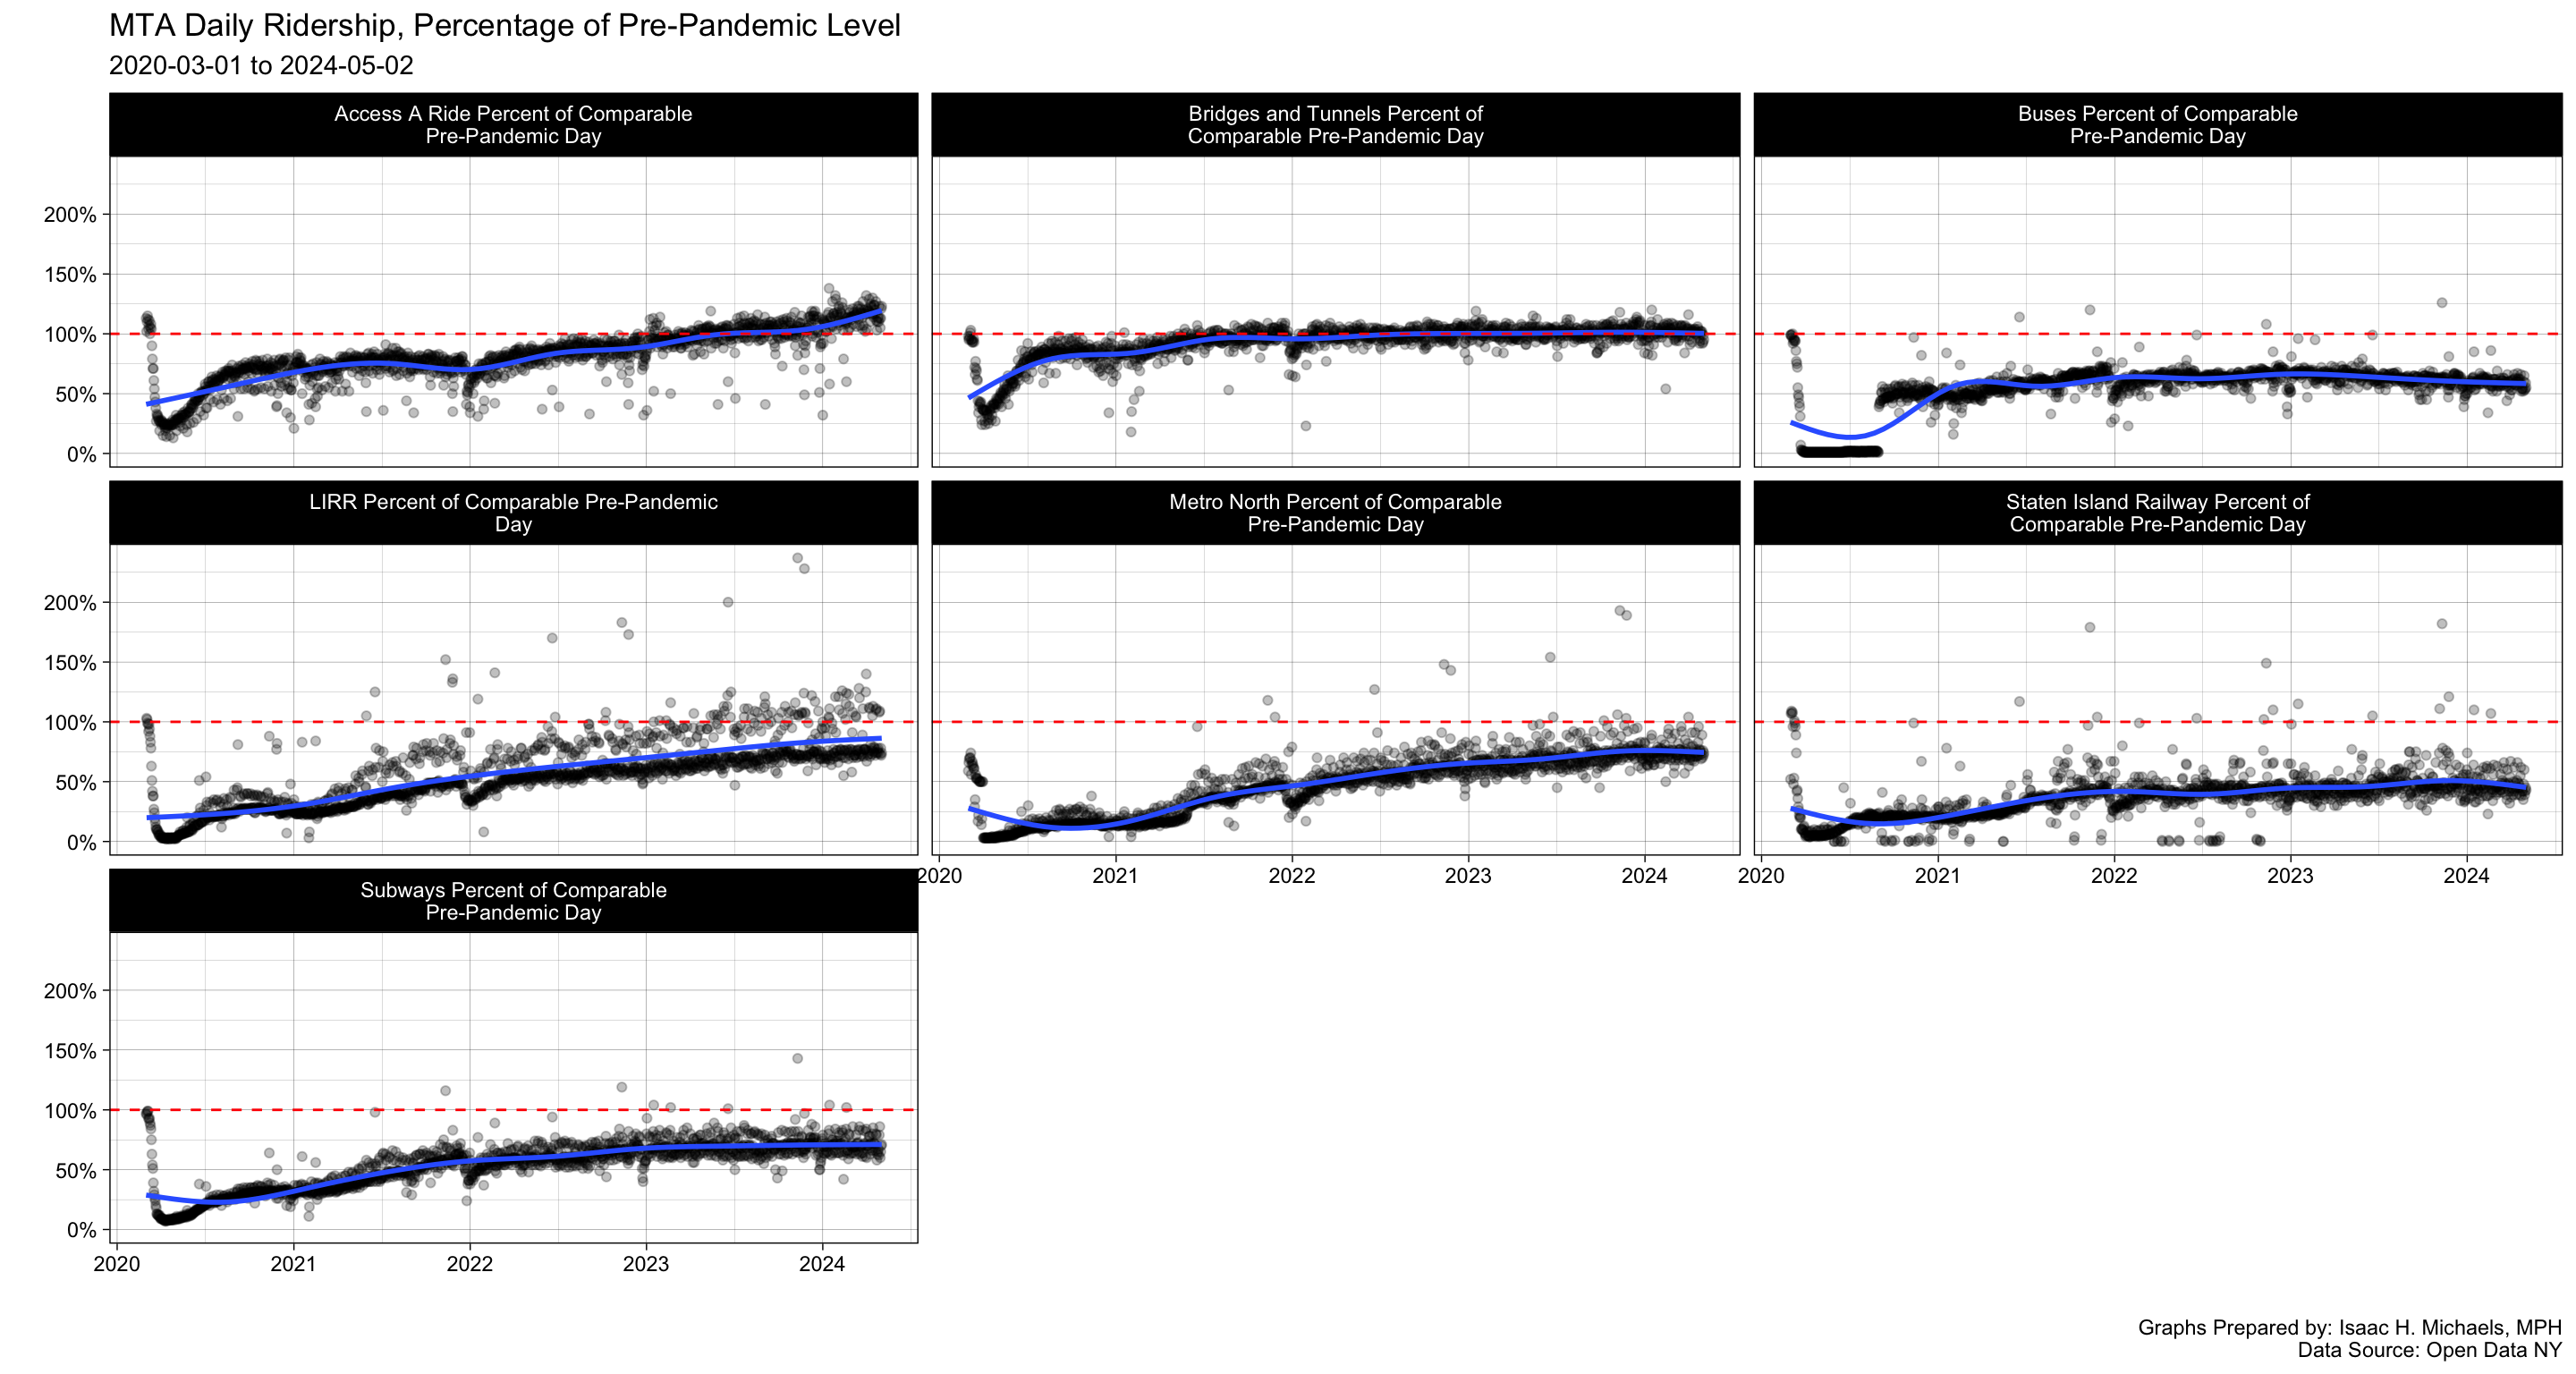
Graph Prepared by: Isaac H. Michaels, MPH
Data Source: Open Data NY
Mobility Trends in New York State Counties

Graph Prepared by: Isaac H. Michaels, MPH
Data Source: Google LLC “Google COVID-19 Community Mobility Reports.” https://www.google.com/covid19/mobility/ Accessed: 2024-10-21.
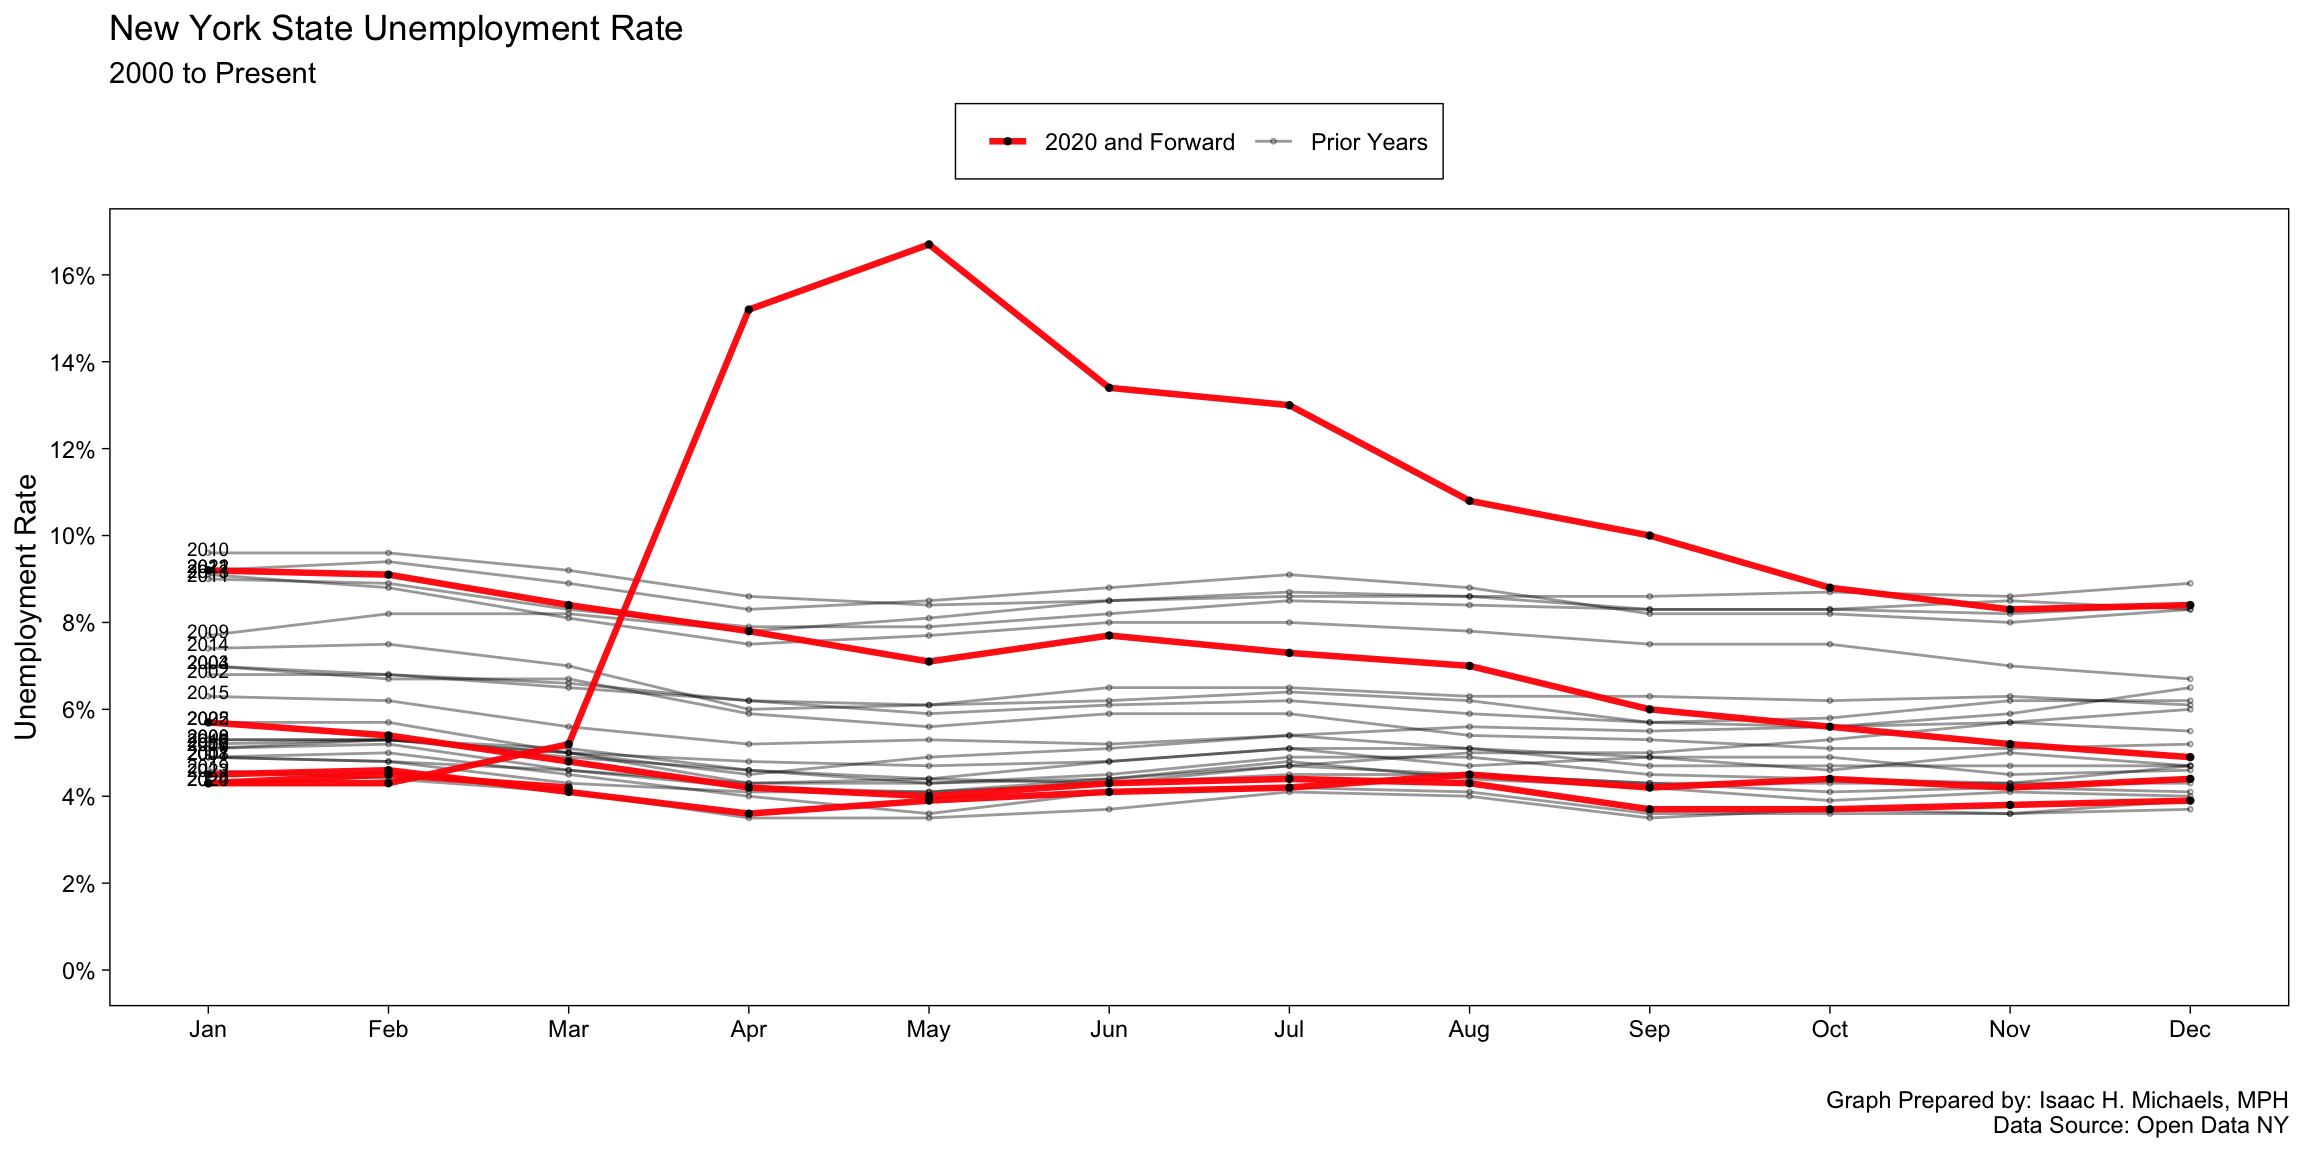
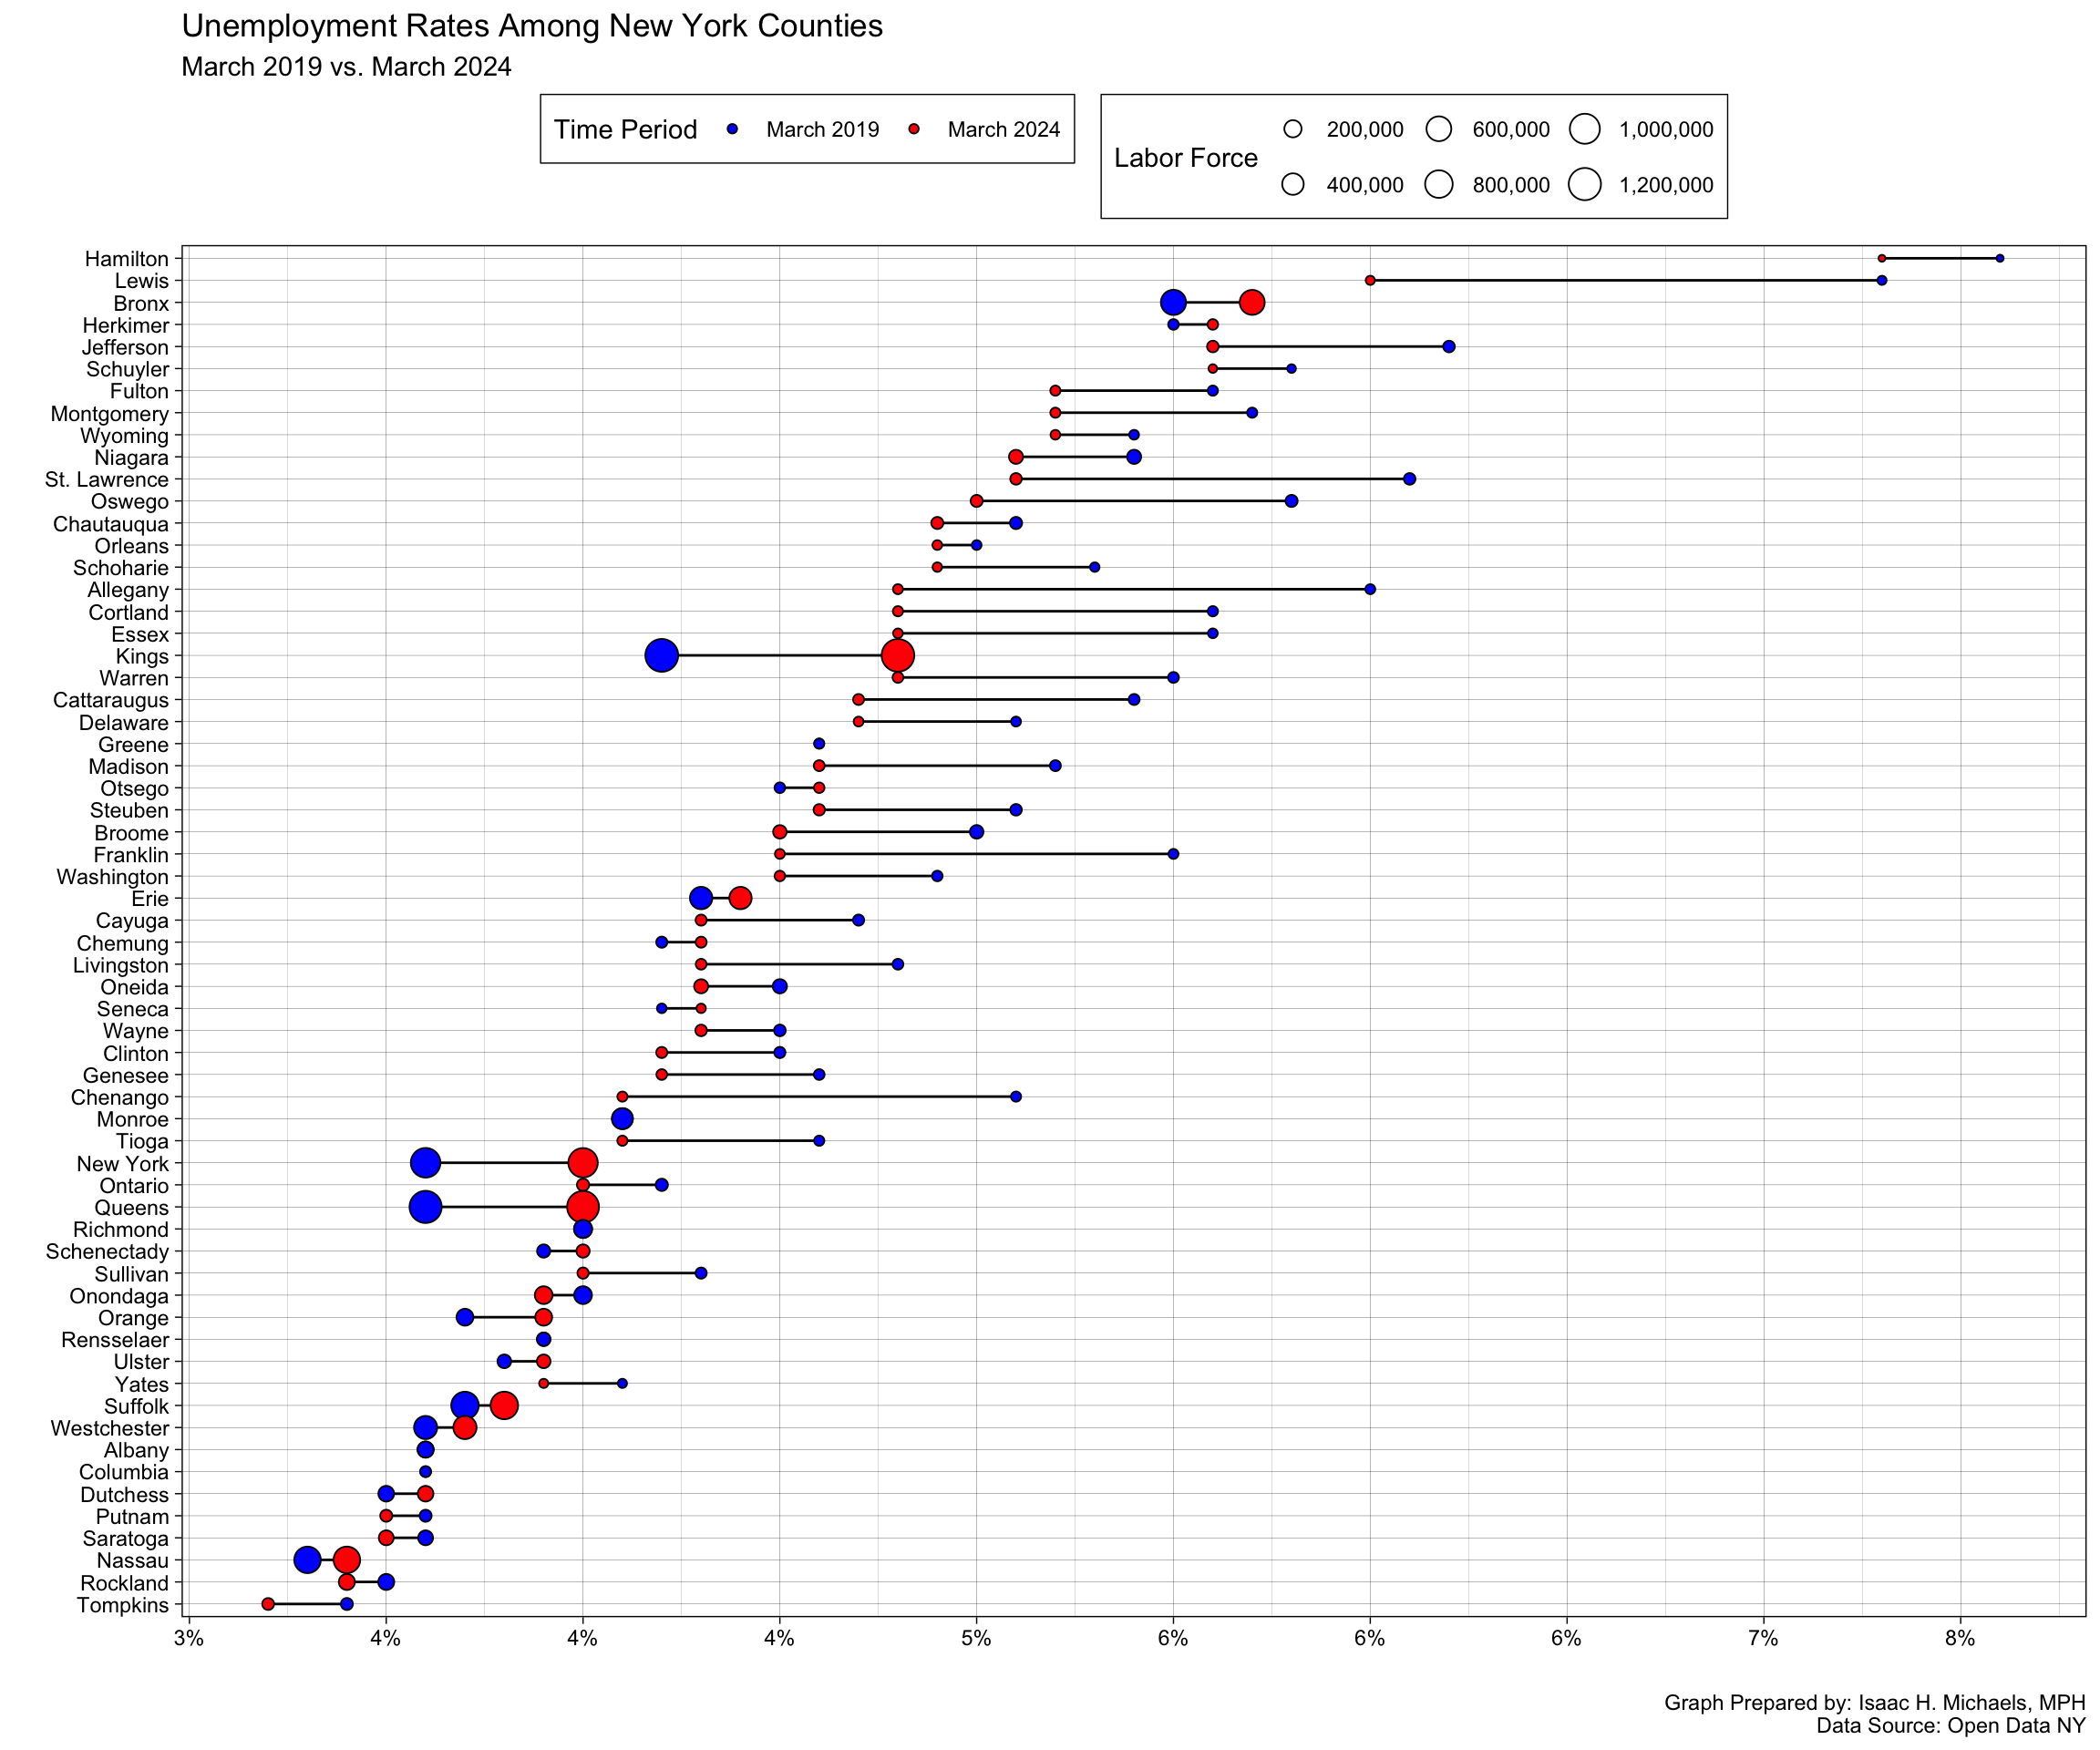
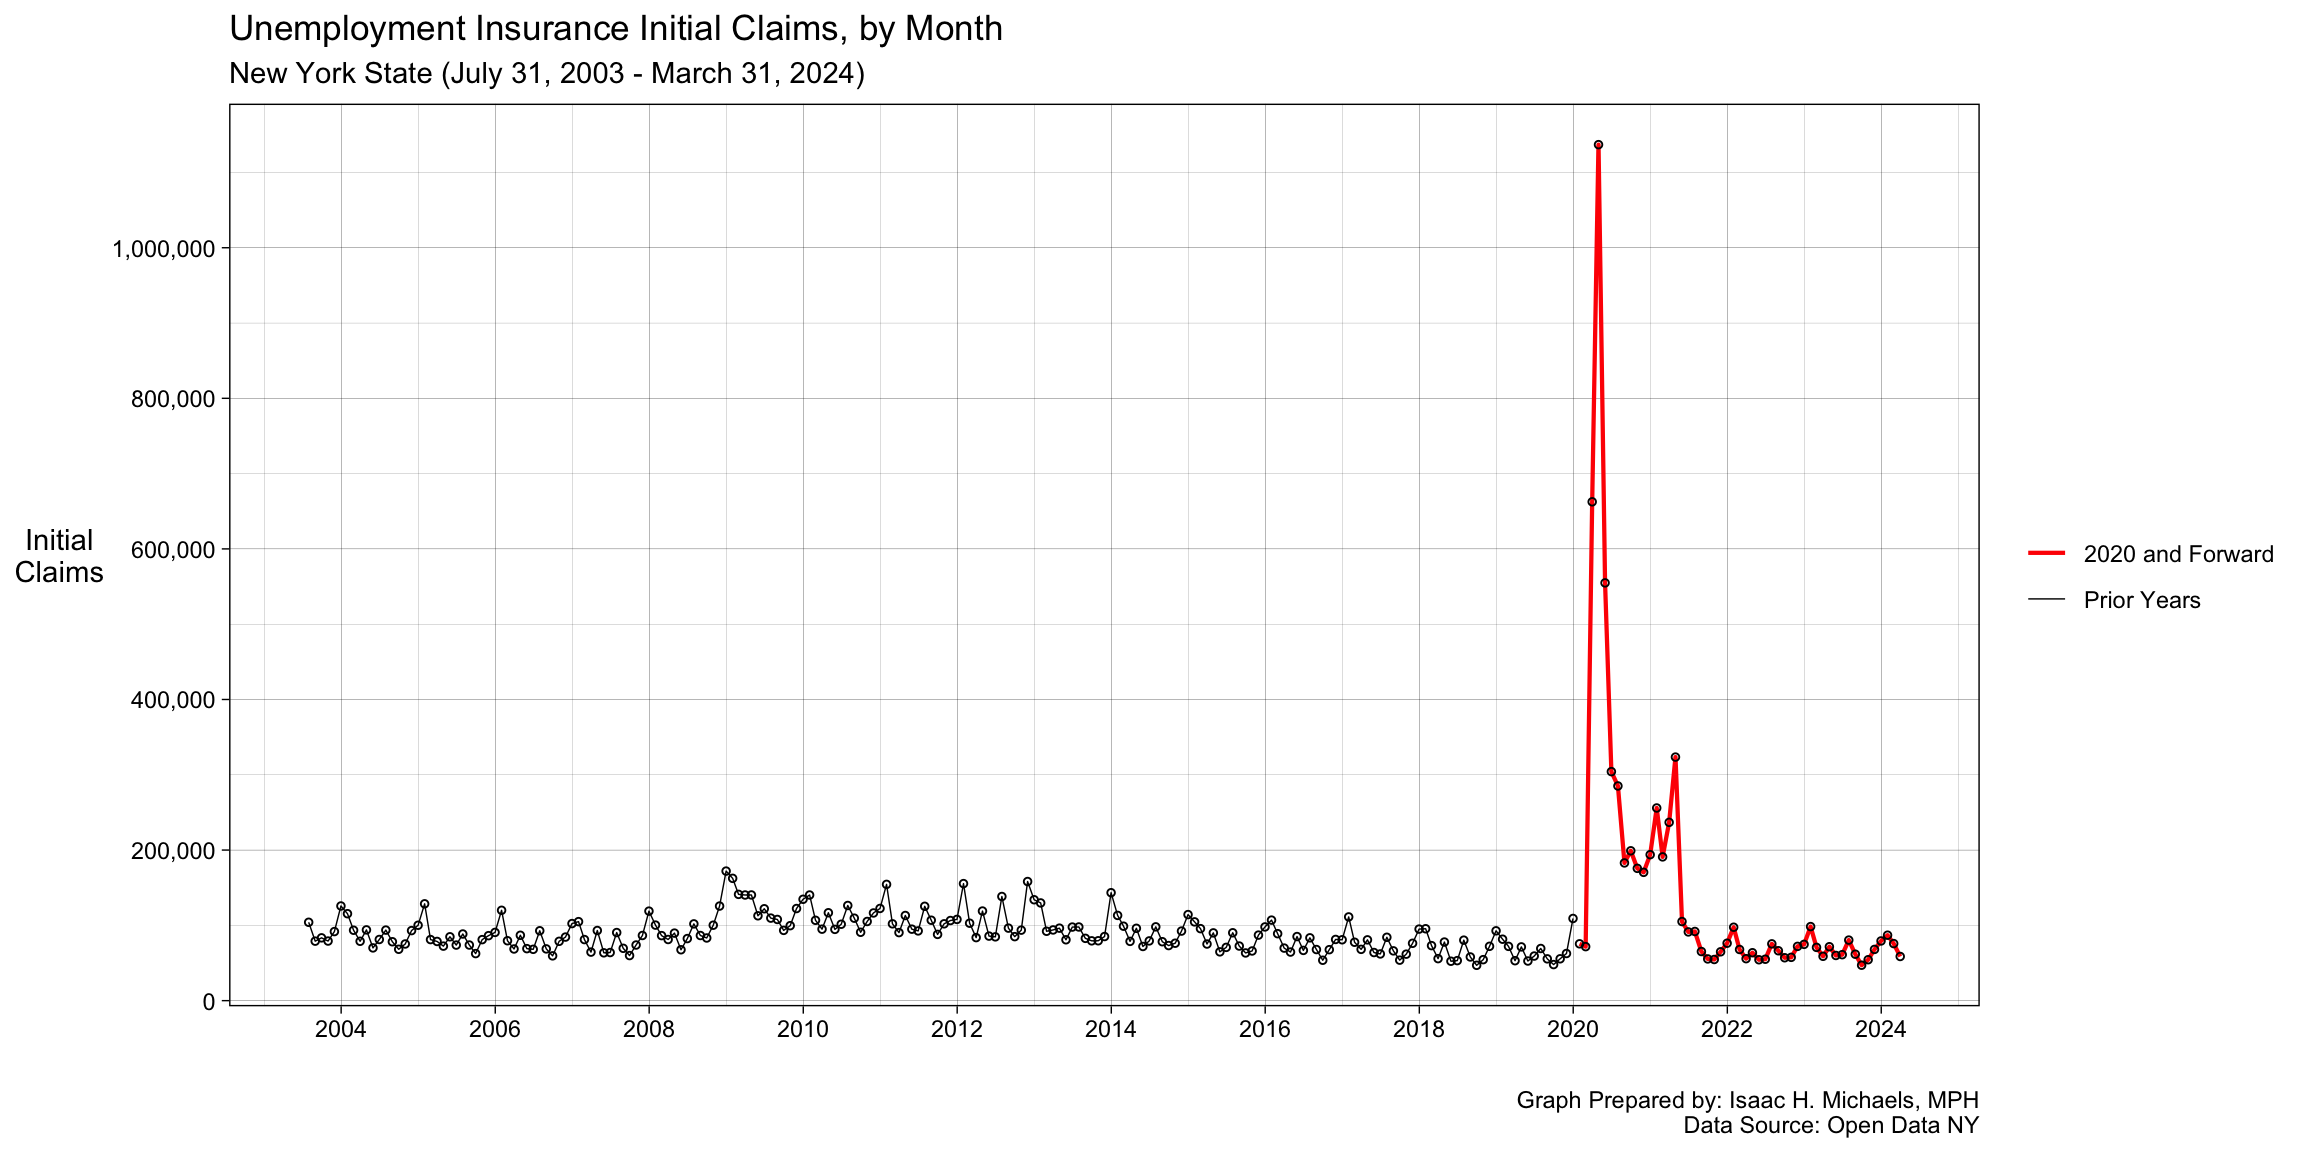
Economic Impact
Policy
State and County Policies
Table Prepared By: Isaac H. Michaels, MPH
Data Source: United States Department of Health and Human Services (HHS)
State-Level Vaccine Mandates
Table Prepared By: Isaac H. Michaels, MPH
Data Source: Centers for Disease Control and Prevention
Data Tables
County-Level Data
COVID-19 Diagnostic Tests
Date: August 30, 2023
| County | Positive Tests | Cumulative Positive Tests | Tests Performed | Cumulative Tests Performed |
|---|---|---|---|---|
| Albany | 17 | 80,708 | 103 | 1,473,117 |
| Allegany | 0 | 11,055 | 1 | 258,396 |
| Bronx | 142 | 520,477 | 1,099 | 9,553,142 |
| Broome | 33 | 60,508 | 87 | 1,248,106 |
| Cattaraugus | 2 | 19,716 | 6 | 319,936 |
| Cayuga | 4 | 20,954 | 16 | 422,772 |
| Chautauqua | 6 | 30,226 | 24 | 556,634 |
| Chemung | 4 | 27,264 | 25 | 516,404 |
| Chenango | 9 | 12,174 | 77 | 252,502 |
| Clinton | 7 | 23,441 | 50 | 434,144 |
| Columbia | 2 | 14,283 | 9 | 261,458 |
| Cortland | 8 | 13,819 | 21 | 322,372 |
| Delaware | 2 | 10,484 | 9 | 212,671 |
| Dutchess | 19 | 86,993 | 136 | 1,561,693 |
| Erie | 46 | 275,188 | 133 | 4,378,049 |
| Essex | 3 | 8,052 | 20 | 176,770 |
| Franklin | 1 | 12,545 | 27 | 233,392 |
| Fulton | 3 | 17,014 | 18 | 243,741 |
| Genesee | 2 | 16,966 | 16 | 291,003 |
| Greene | 0 | 11,305 | 4 | 190,104 |
| Hamilton | 1 | 1,125 | 2 | 21,423 |
| Herkimer | 3 | 17,820 | 16 | 344,969 |
| Jefferson | 6 | 28,140 | 52 | 444,626 |
| Kings | 201 | 926,931 | 1,491 | 20,350,479 |
| Lewis | 1 | 7,520 | 13 | 111,698 |
| Livingston | 4 | 14,763 | 8 | 300,992 |
| Madison | 1 | 17,239 | 36 | 390,282 |
| Monroe | 46 | 197,900 | 285 | 3,887,625 |
| Montgomery | 3 | 15,447 | 9 | 234,489 |
| Nassau | 113 | 560,751 | 773 | 9,019,060 |
| New York | 123 | 599,377 | 755 | 15,297,869 |
| Niagara | 13 | 60,816 | 33 | 934,557 |
| Oneida | 28 | 70,536 | 115 | 1,605,737 |
| Onondaga | 32 | 146,000 | 256 | 2,947,724 |
| Ontario | 7 | 27,095 | 27 | 514,810 |
| Orange | 41 | 143,287 | 352 | 2,212,990 |
| Orleans | 1 | 10,820 | 8 | 168,033 |
| Oswego | 12 | 35,635 | 82 | 572,427 |
| Otsego | 7 | 13,719 | 14 | 327,942 |
| Putnam | 11 | 32,378 | 58 | 526,921 |
| Queens | 217 | 879,664 | 1,048 | 15,747,989 |
| Rensselaer | 8 | 42,703 | 42 | 914,073 |
| Richmond | 20 | 214,153 | 133 | 3,913,005 |
| Rockland | 20 | 121,862 | 187 | 2,792,502 |
| Saratoga | 13 | 63,078 | 107 | 1,140,384 |
| Schenectady | 14 | 44,721 | 39 | 880,799 |
| Schoharie | 1 | 6,748 | 1 | 128,129 |
| Schuyler | 1 | 4,428 | 7 | 106,268 |
| Seneca | 1 | 7,955 | 16 | 151,701 |
| St. Lawrence | 12 | 27,107 | 83 | 650,520 |
| Steuben | 7 | 26,072 | 18 | 503,873 |
| Suffolk | 123 | 579,209 | 574 | 9,141,360 |
| Sullivan | 11 | 25,387 | 38 | 426,863 |
| Tioga | 4 | 14,442 | 5 | 249,619 |
| Tompkins | 11 | 27,401 | 20 | 3,083,896 |
| Ulster | 8 | 44,483 | 56 | 919,060 |
| Warren | 5 | 19,479 | 28 | 368,303 |
| Washington | 4 | 16,347 | 24 | 310,110 |
| Wayne | 6 | 22,695 | 47 | 415,802 |
| Westchester | 100 | 343,356 | 617 | 6,272,712 |
| Wyoming | 2 | 10,145 | 6 | 165,812 |
| Yates | 1 | 4,562 | 6 | 99,880 |
Table Prepared By: Isaac H. Michaels, MPH
Data Source: Health Data NY
COVID-19 Deaths
| County | 2024-10-18 | 2024-10-17 | 2024-10-16 | 2024-10-15 |
|---|---|---|---|---|
| Albany | 0 | 0 | 0 | 0 |
| Allegany | 0 | 0 | 0 | 0 |
| Bronx | 0 | 0 | 0 | 0 |
| Broome | 0 | 0 | 0 | 0 |
| Cattaraugus | 0 | 0 | 0 | 0 |
| Cayuga | 0 | 0 | 0 | 0 |
| Chautauqua | 0 | 0 | 0 | 0 |
| Chemung | 0 | 0 | 0 | 0 |
| Chenango | 0 | 0 | 0 | 0 |
| Clinton | 0 | 0 | 0 | 0 |
| Columbia | 0 | 0 | 0 | 0 |
| Cortland | 0 | 0 | 0 | 0 |
| Delaware | 0 | 0 | 0 | 0 |
| Dutchess | 0 | 0 | 0 | 0 |
| Erie | 0 | 0 | 0 | 0 |
| Essex | 0 | 0 | 0 | 0 |
| Franklin | 0 | 0 | 0 | 0 |
| Fulton | 0 | 0 | 0 | 0 |
| Genesee | 0 | 0 | 0 | 0 |
| Greene | 0 | 0 | 0 | 0 |
| Hamilton | 0 | 0 | 0 | 0 |
| Herkimer | 0 | 0 | 0 | 0 |
| Jefferson | 0 | 0 | 0 | 0 |
| Kings | 0 | 0 | 0 | 0 |
| Lewis | 0 | 0 | 0 | 0 |
| Livingston | 0 | 0 | 0 | 0 |
| Madison | 0 | 0 | 0 | 0 |
| Manhattan | 0 | 0 | 0 | 0 |
| Monroe | 0 | 0 | 0 | 0 |
| Montgomery | 0 | 0 | 0 | 0 |
| Nassau | 0 | 0 | 0 | 0 |
| Niagara | 0 | 0 | 0 | 0 |
| Non-NYS | 0 | 0 | 0 | 0 |
| Oneida | 0 | 0 | 0 | 0 |
| Onondaga | 0 | 0 | 0 | 0 |
| Ontario | 0 | 0 | 0 | 0 |
| Orange | 0 | 0 | 0 | 0 |
| Orleans | 0 | 0 | 0 | 0 |
| Oswego | 0 | 0 | 0 | 0 |
| Otsego | 0 | 0 | 0 | 0 |
| Putnam | 0 | 0 | 0 | 0 |
| Queens | 0 | 0 | 0 | 0 |
| Rensselaer | 0 | 0 | 0 | 0 |
| Richmond | 0 | 0 | 0 | 0 |
| Rockland | 0 | 0 | 0 | 0 |
| Saratoga | 0 | 0 | 0 | 0 |
| Schenectady | 0 | 0 | 0 | 0 |
| Schoharie | 0 | 0 | 0 | 0 |
| Schuyler | 0 | 0 | 0 | 0 |
| Seneca | 0 | 0 | 0 | 0 |
| St. Lawrence | 0 | 0 | 0 | 0 |
| Statewide Total | 0 | 0 | 0 | 0 |
| Steuben | 0 | 0 | 0 | 0 |
| Suffolk | 0 | 0 | 0 | 0 |
| Sullivan | 0 | 0 | 0 | 0 |
| Tioga | 0 | 0 | 0 | 0 |
| Tompkins | 0 | 0 | 0 | 0 |
| Ulster | 0 | 0 | 0 | 0 |
| Warren | 0 | 0 | 0 | 0 |
| Washington | 0 | 0 | 0 | 0 |
| Wayne | 0 | 0 | 0 | 0 |
| Westchester | 0 | 0 | 0 | 0 |
| Wyoming | 0 | 0 | 0 | 0 |
| Yates | 0 | 0 | 0 | 0 |
Table Prepared By: Isaac H. Michaels, MPH
Data Source: Health Data NY
Federal Funding
CDC COVID-19 STLT Funding
| Jurisdiction | Supplemental Act Name | Award Name | Amound |
|---|---|---|---|
| New York | Paycheck Protection Program and Health Care Enhancement Act | ELC Epi & Lab Capacity for HHS | $807,512,729 |
| New York | Paycheck Protection Program and Health Care Enhancement Act | ELC Epi & Lab Capacity for HHS | $700,248,982 |
| New York | Coronavirus Response and Relief Supplemental Appropriations Act, 2021 | ELC Epi & Lab Capacity for HHS | $639,861,809 |
| New York | Coronavirus Response and Relief Supplemental Appropriations Act, 2021 | ELC Epi & Lab Capacity for HHS | $479,853,706 |
| New York | American Rescue Plan Act of 2021 | ELC Epi & Lab Capacity for School Testing | $334,830,878 |
| New York | American Rescue Plan Act of 2021 | ELC Epi & Lab Capacity for School Testing | $251,100,841 |
| New York | American Rescue Plan Act of 2021/6 | Strengthening U.S. Public Health Infrastructure, Workforce, and Data Systems | $131,513,529 |
| New York | American Rescue Plan Act of 2021/6 | Strengthening U.S. Public Health Infrastructure, Workforce, and Data Systems | $103,315,139 |
| New York | Coronavirus Response and Relief Supplemental Appropriations Act, 2021 | COVID-19 Vaccine Preparedness/2 | $100,449,264 |
| New York | American Rescue Plan Act of 2021 | COVID-19 Vaccine Preparedness/3 | $100,449,263 |
| New York | American Rescue Plan Act of 2021 | COVID-19 Vaccine Preparedness/3 | $81,479,388 |
| New York | Coronavirus Response and Relief Supplemental Appropriations Act, 2021 | COVID-19 Vaccine Preparedness/2 | $75,330,252 |
| New York | American Rescue Plan Act of 2021 | Crisis CoAg Workforce | $66,017,548 |
| New York | American Rescue Plan Act of 2021 | Crisis CoAg Workforce | $49,758,827 |
| New York | Coronavirus Response and Relief Supplemental Appropriations Act, 2021 | National Initiative to Address COVID-19 Health Disparities Among Populations at High-Risk and Underserved, Including Racial and Ethnic Minority Populations and Rural Communities | $34,946,946 |
| New York | Coronavirus Response and Relief Supplemental Appropriations Act, 2021 | National Initiative to Address COVID-19 Health Disparities Among Populations at High-Risk and Underserved, Including Racial and Ethnic Minority Populations and Rural Communities | $33,726,393 |
| New York | American Rescue Plan Act of 2021 | DIS Workforce | $24,820,233 |
| New York | American Rescue Plan Act of 2021 | ELC Detection & Mitigation of COVID-19 in Confinement Facilities | $20,790,000 |
| New York | Coronavirus Aid, Relief, and Economic Security Act | ELC Epi & Lab Capacity Reopen America | $18,790,865 |
| New York | American Rescue Plan Act of 2021 | ELC State-based Nursing Home and Long Term Care Strike Teams | $18,653,245 |
| New York | Coronavirus Aid, Relief, and Economic Security Act | ELC Epi & Lab Capacity Reopen America | $18,544,755 |
| New York | Coronavirus Preparedness and Response Supplemental Appropriations Act, 2020 | Crisis CoAg Award #2 | $16,911,778 |
| New York | Coronavirus Preparedness and Response Supplemental Appropriations Act, 2020 | Crisis CoAg Award #2 | $16,690,279 |
| New York | American Rescue Plan Act of 2021 | DIS Workforce | $14,079,945 |
| New York | American Rescue Plan Act of 2021 | ELC Strengthening Healthcare Associated Infections and Antibiotic Resistance Programs | $13,468,642 |
| New York | American Rescue Plan Act of 2021 | COVID-19 Vaccine Preparedness Adjustment/2 | $12,897,438 |
| New York | American Rescue Plan Act of 2021 | COVID-19 Vaccine Preparedness | $8,161,503 |
| New York | Coronavirus Aid, Relief, and Economic Security Act | COVID-19 Vaccine Preparedness | $7,540,875 |
| New York | American Rescue Plan Act of 2021 | ELC Epi & Lab Capacity for Genomic Sequencing | $7,007,315 |
| New York | Coronavirus Preparedness and Response Supplemental Appropriations Act, 2020 | Crisis CoAg Award #3 | $6,882,189 |
| New York | American Rescue Plan Act of 2021 | ELC National Wastewater Surveillance System (NWSS) | $6,604,675 |
| New York | Coronavirus Aid, Relief, and Economic Security Act | COVID-19 Vaccine Preparedness | $6,588,043 |
| New York | American Rescue Plan Act of 2021 | COVID-19 Vaccine Preparedness | $6,120,583 |
| New York | American Rescue Plan Act of 2021 | ELC Epi & Lab Capacity for Genomic Sequencing | $5,480,079 |
| New York | Coronavirus Preparedness and Response Supplemental Appropriations Act, 2020 | Crisis CoAg Award #3 | $5,434,587 |
| New York | Coronavirus Aid, Relief, and Economic Security Act | ELC Accelerating Data Modernization in Jurisdictions | $5,340,214 |
| New York | Coronavirus Aid, Relief, and Economic Security Act | Influenza Season Early Preparedness | $5,277,968 |
| New York | Coronavirus Aid, Relief, and Economic Security Act | COVID-19 Vaccine Preparedness | $5,277,968 |
| New York | American Rescue Plan Act of 2021 | ELC Strengthening Healthcare Associated Infections and Antibiotic Resistance Programs | $5,124,138 |
| New York | Coronavirus Aid, Relief, and Economic Security Act | Influenza Season Early Preparedness | $4,611,066 |
| New York | Coronavirus Aid, Relief, and Economic Security Act | COVID-19 Vaccine Preparedness | $4,611,066 |
| New York | American Rescue Plan Act of 2021 | ELC Detection & Mitigation of COVID-19 Among People Experiencing Homelessness | $4,497,600 |
| New York | Coronavirus Aid, Relief, and Economic Security Act | ELC Accelerating Data Modernization in Jurisdictions | $4,086,486 |
| New York | Coronavirus Preparedness and Response Supplemental Appropriations Act, 2020 | ELC Infection Control Training | $3,995,012 |
| New York | American Rescue Plan Act of 2021 | ELC Detection & Mitigation of COVID-19 Among People Experiencing Homelessness | $2,968,416 |
| New York | American Rescue Plan Act of 2021 | ELC State-based Nursing Home and Long Term Care Strike Teams | $2,949,604 |
| New York | Paycheck Protection Program and Health Care Enhancement Act | ELC Epi & Lab Capacity | $2,903,500 |
| New York | American Rescue Plan Act of 2021 | ELC Detection & Mitigation of COVID-19 in Confinement Facilities | $2,730,000 |
| New York | Coronavirus Preparedness and Response Supplemental Appropriations Act, 2020 | Emerging Infections Program Award | $2,700,000 |
| New York | Paycheck Protection Program and Health Care Enhancement Act | ELC Epi & Lab Capacity | $1,879,500 |
| New York | Coronavirus Preparedness and Response Supplemental Appropriations Act, 2020 | Crisis CoAg Award #1 | $1,750,000 |
| New York | Coronavirus Preparedness and Response Supplemental Appropriations Act, 2020 | Crisis CoAg Award #1 | $1,750,000 |
| New York | Coronavirus Aid, Relief, and Economic Security Act/5 | Community Health Workers for COVID Response and Resilient Communities (CCR) | $1,199,624 |
| New York | Coronavirus Aid, Relief, and Economic Security Act/5 | Community Health Workers for COVID Response and Resilient Communities (CCR) | $1,199,554 |
| New York | Paycheck Protection Program and Health Care Enhancement Act | ELC National Wastewater Surveillance System (NWSS) | $1,042,693 |
| New York | Coronavirus Preparedness and Response Supplemental Appropriations Act, 2020 | ELC Infection Control Training | $1,001,206 |
| New York | Coronavirus Preparedness and Response Supplemental Appropriations Act, 2020 | ELC Epi & Lab Capacity | $1,000,000 |
| New York | Coronavirus Aid, Relief, and Economic Security Act | All Other STLT Awards | $652,415 |
| New York | Coronavirus Aid, Relief, and Economic Security Act | Emerging Infections Program Award | $560,000 |
| New York | Coronavirus Response and Relief Supplemental Appropriations Act, 2021 | Emerging Infections Program Award | $459,511 |
| New York | Coronavirus Aid, Relief, and Economic Security Act | All Other STLT Awards | $457,840 |
| New York | American Rescue Plan Act of 2021 | ELC Public Health Laboratory Preparedness | $427,519 |
| New York | American Rescue Plan Act of 2021 | ELC National Wastewater Surveillance System (NWSS) | $414,994 |
| New York | Coronavirus Aid, Relief, and Economic Security Act | All Other STLT Awards | $260,603 |
| New York | Coronavirus Aid, Relief, and Economic Security Act | All Other STLT Awards | $259,785 |
| New York | American Rescue Plan Act of 2021 | ELC Public Health Laboratory Preparedness | $142,473 |
| New York | Coronavirus Preparedness and Response Supplemental Appropriations Act, 2020 | ELC Epi & Lab Capacity | $0 |
| New York | American Rescue Plan Act of 2021 | COVID-19 Vaccine Preparedness Adjustment/2 | $0 |
| New York | Coronavirus Preparedness and Response Supplemental Appropriations Act, 2020 | Emerging Infections Program Award | $0 |
Table Prepared By: Isaac H. Michaels, MPH
Data Source: Centers for Disease Control and Prevention
Academic Literature on COVID-19 and New York
Table Prepared By: Isaac H. Michaels, MPH Data Source: PubMed