Published: August 5, 2020
Updated: April 15, 2025 at 05:35PM
Introduction
Welcome to this data visualization page on hate crimes in New York State and New York City. On this page, you will find a variety of maps, graphs, and heat maps that showcase the distribution and trends of hate crimes in the region. All of the data used in these visualizations are open data, retrieved from Open Data NY and NYC Open Data.
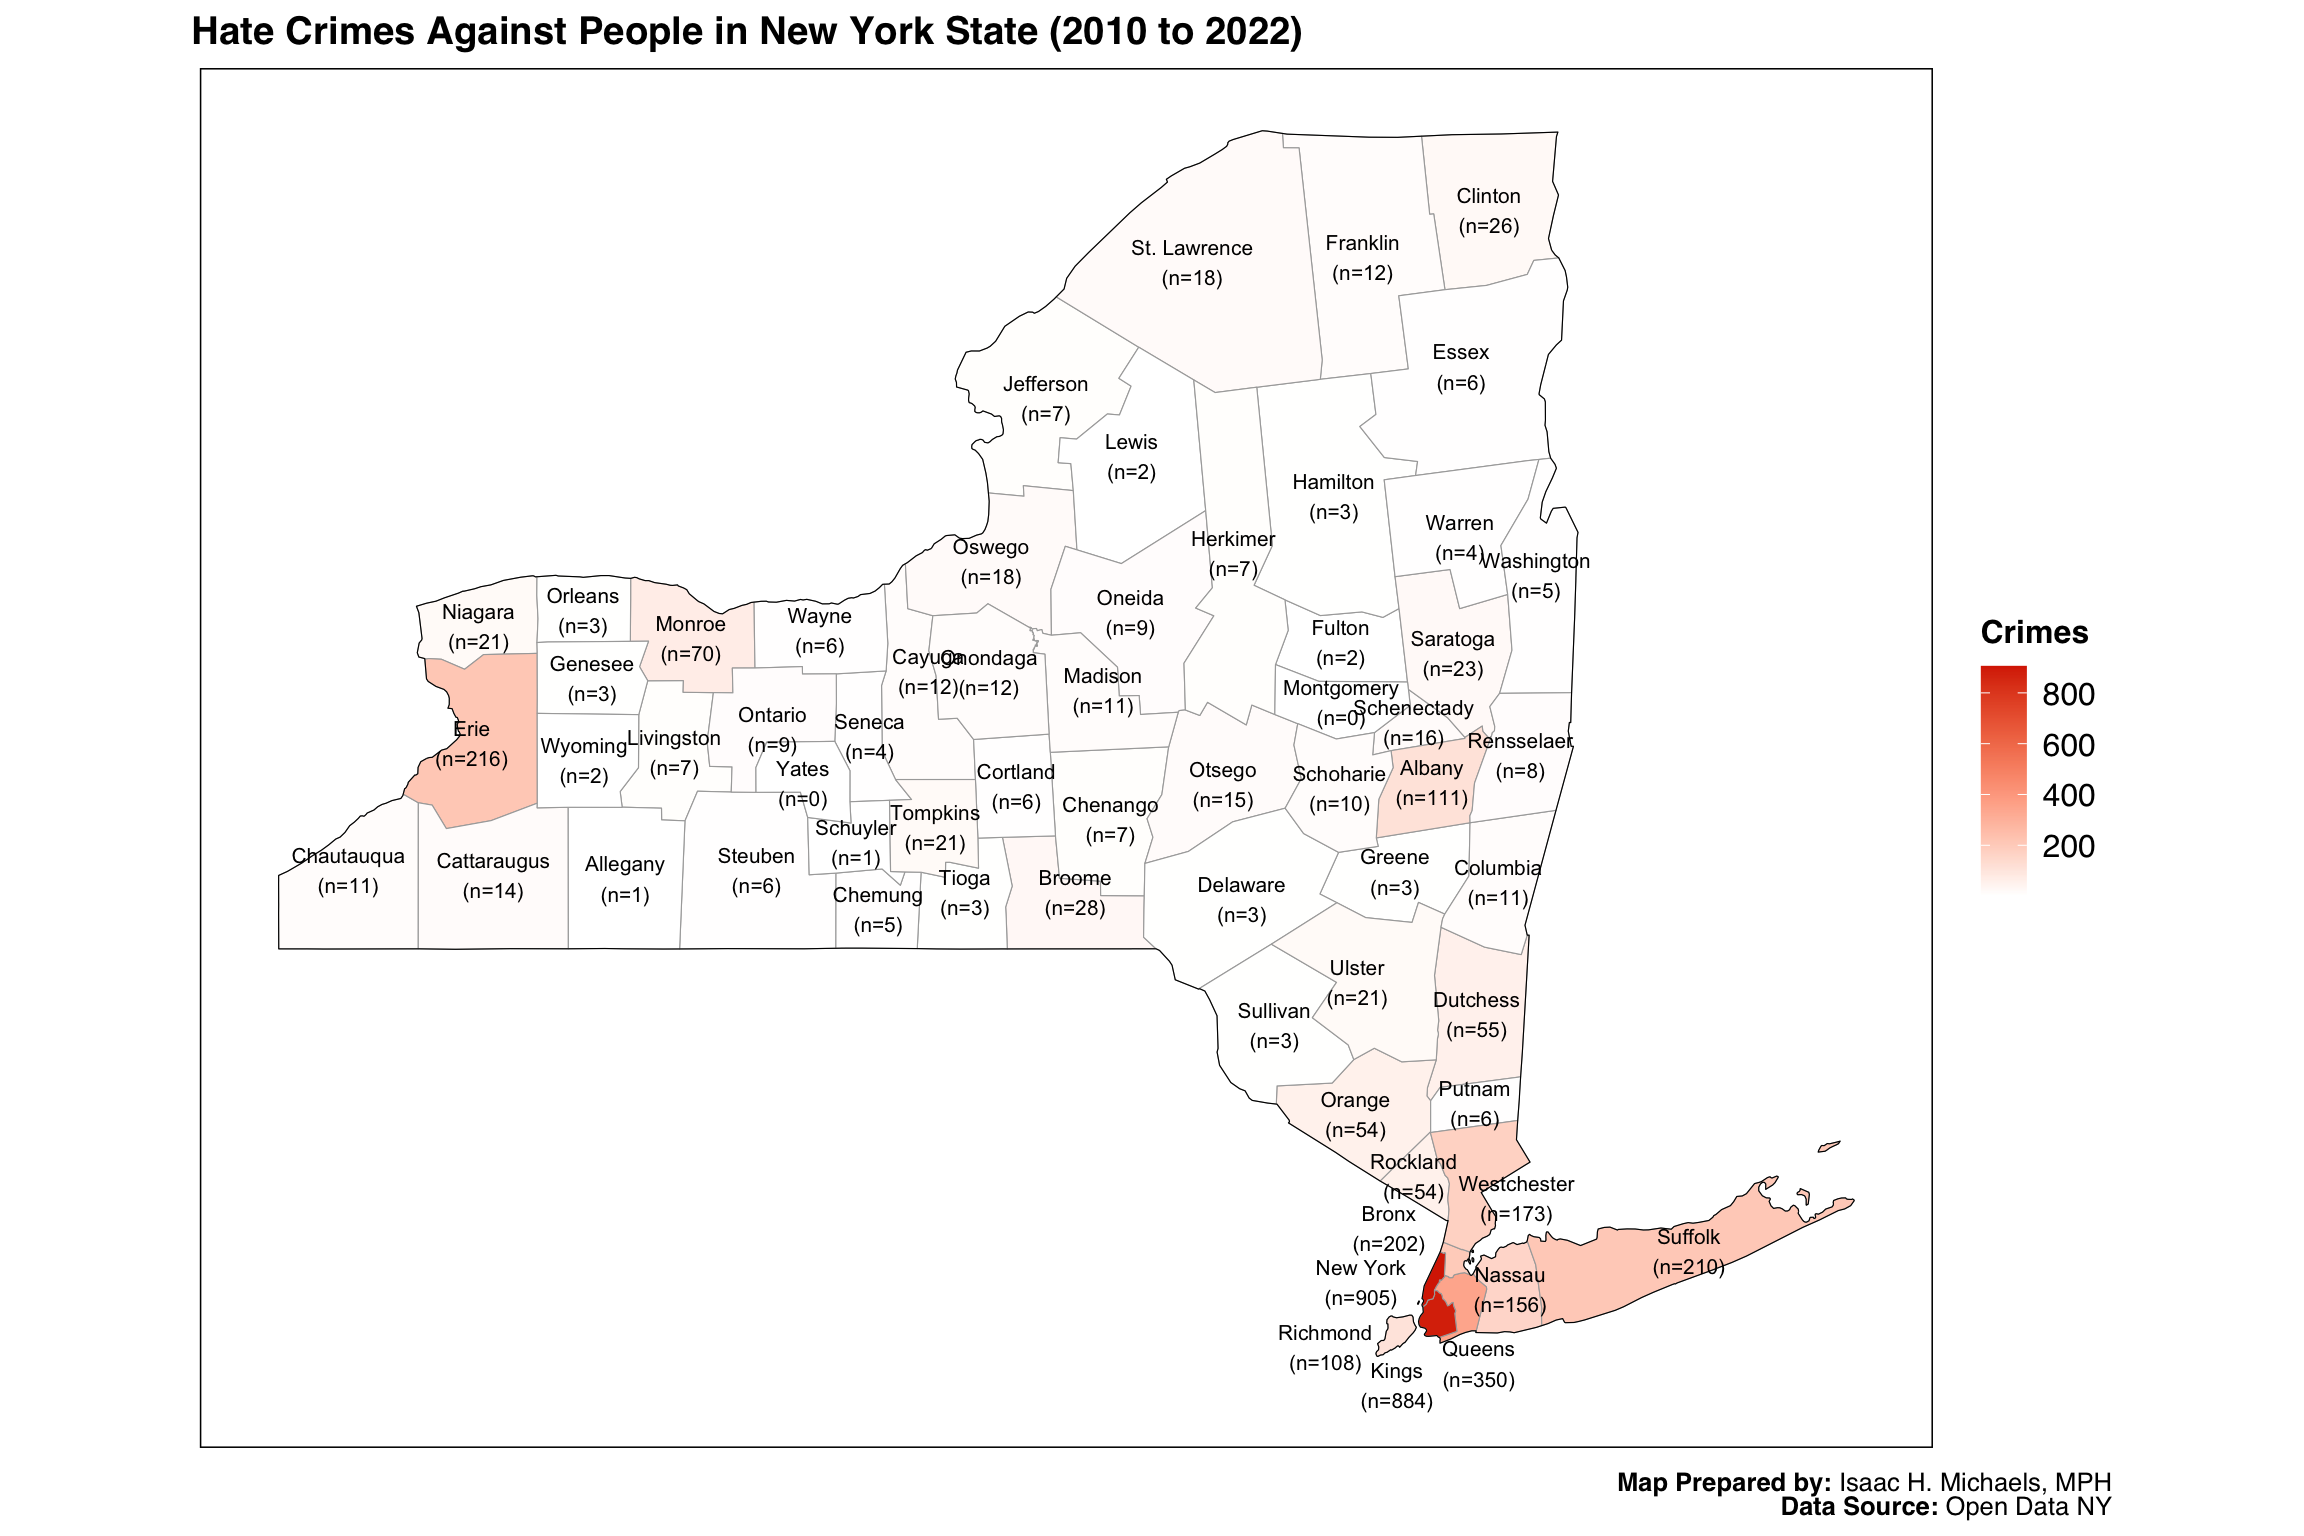
Maps
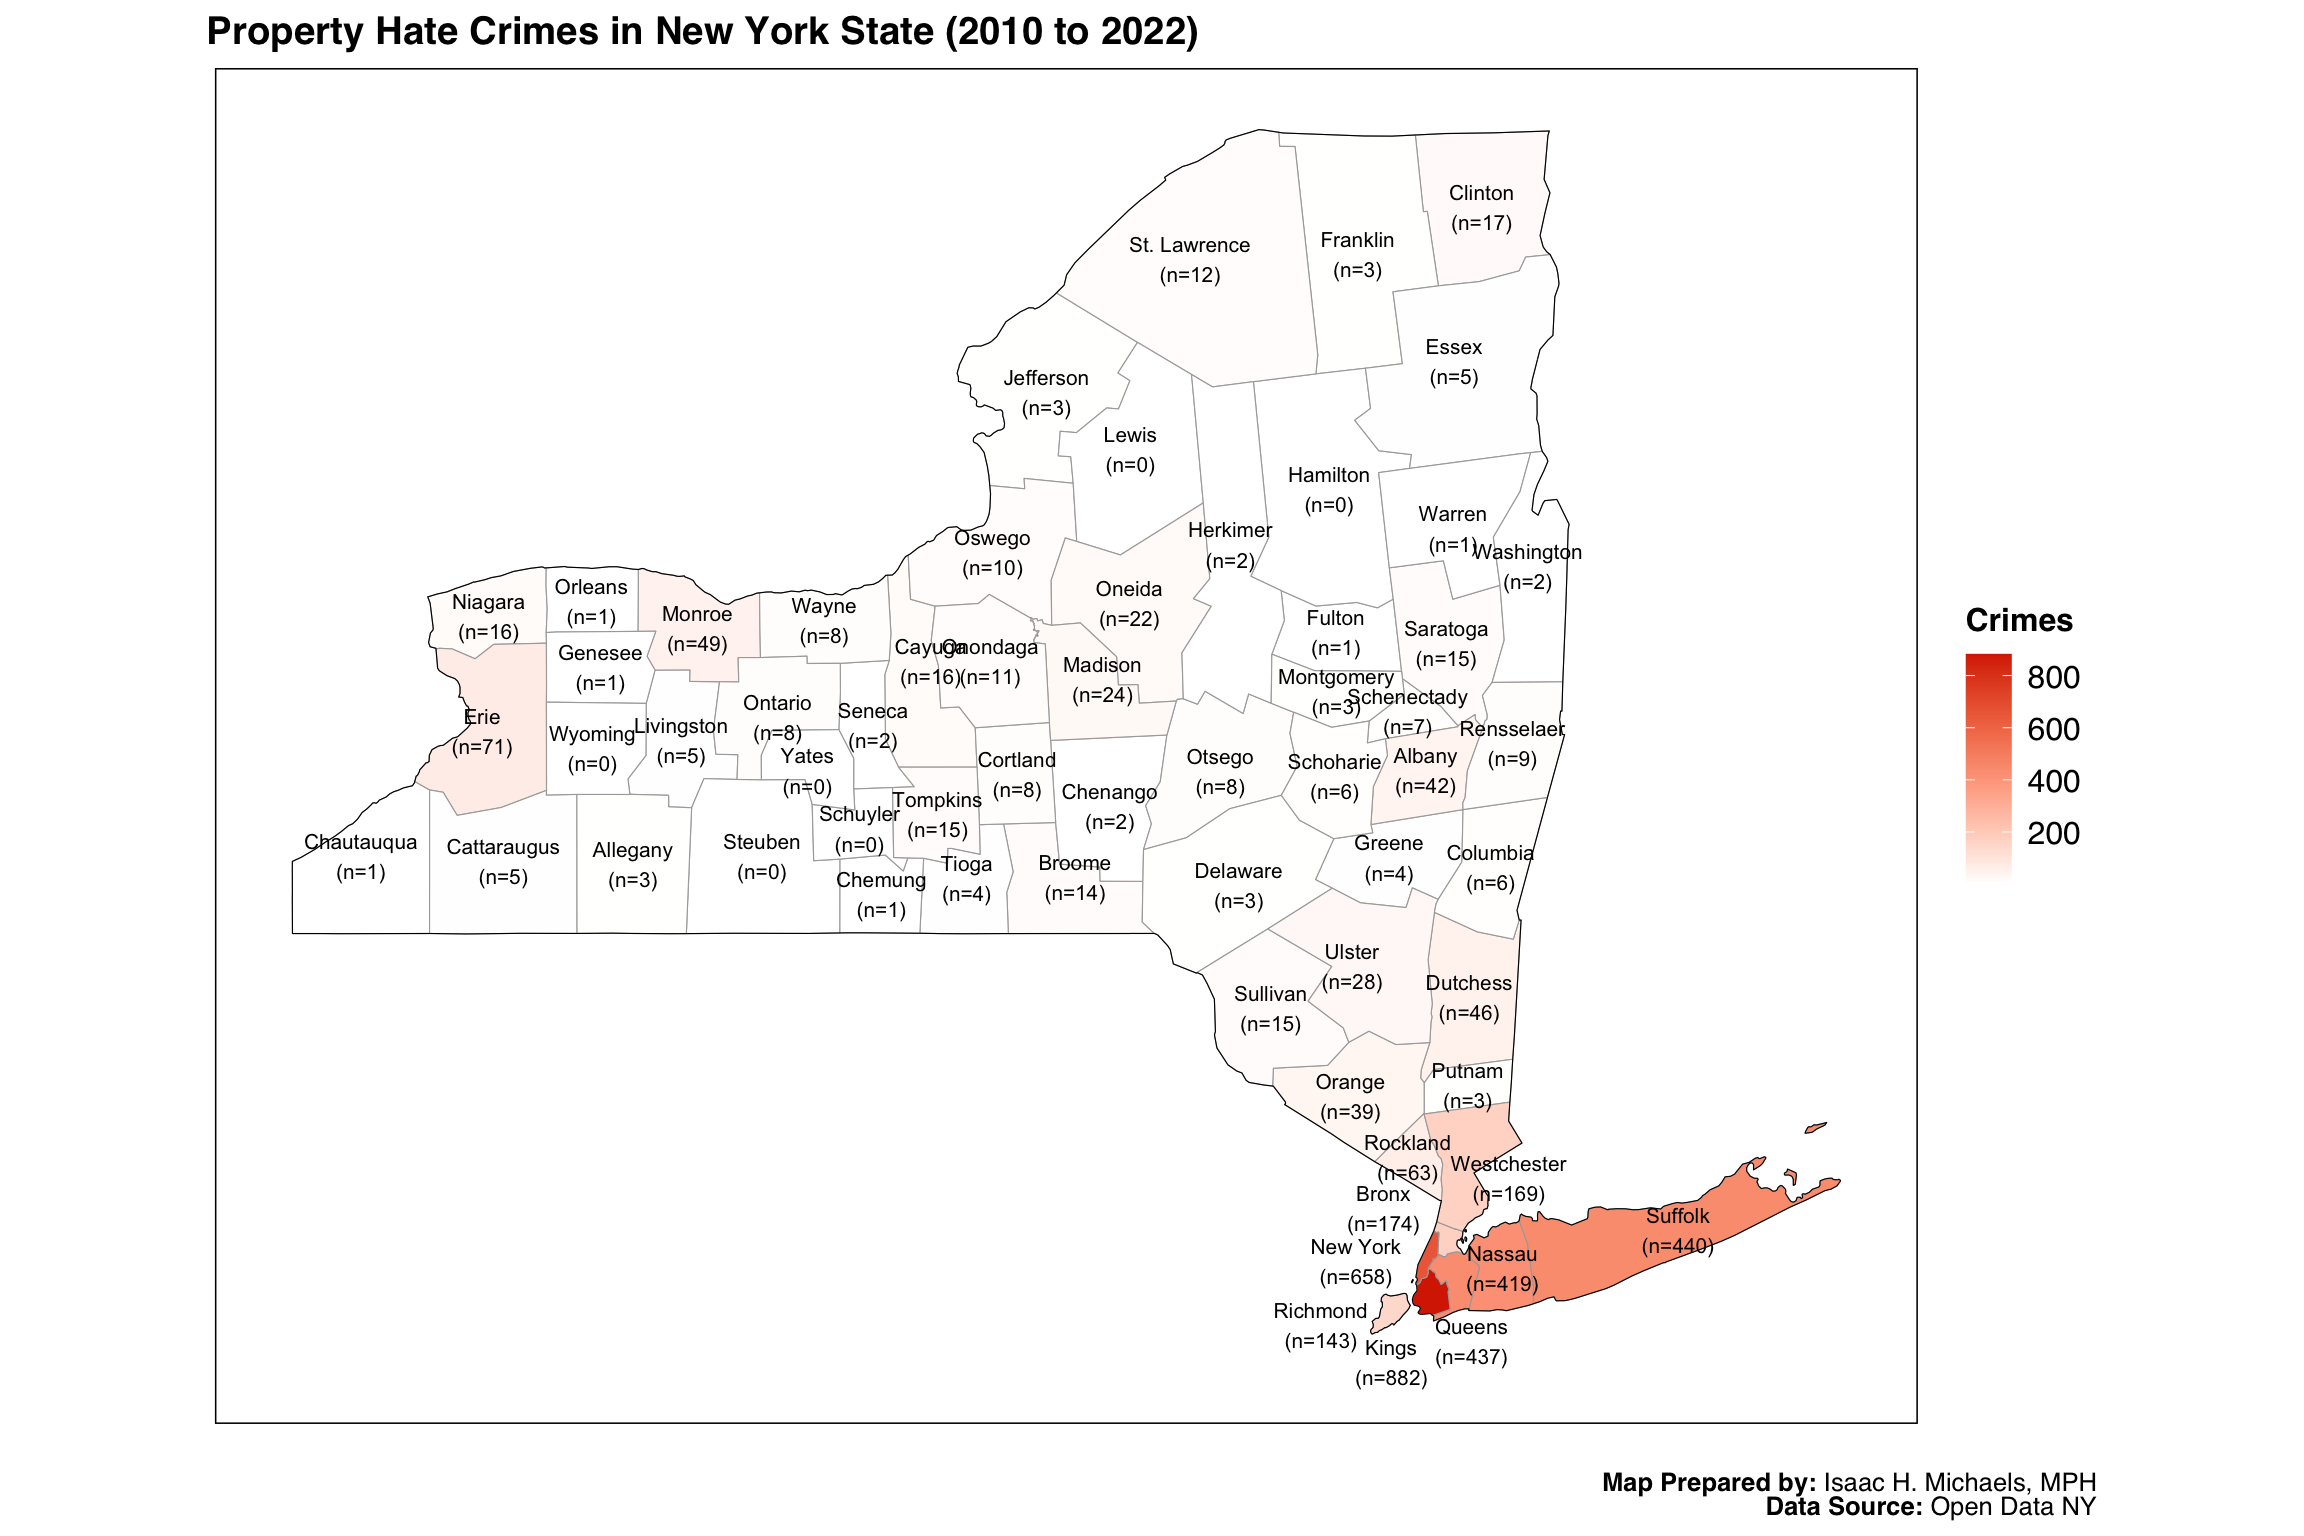
In the Maps section, you will find choropleth maps that illustrate the overall and stratified distribution of hate crimes across the state and city. These maps show the number of hate crimes by location, as well as by bias type and crime type.
Trends
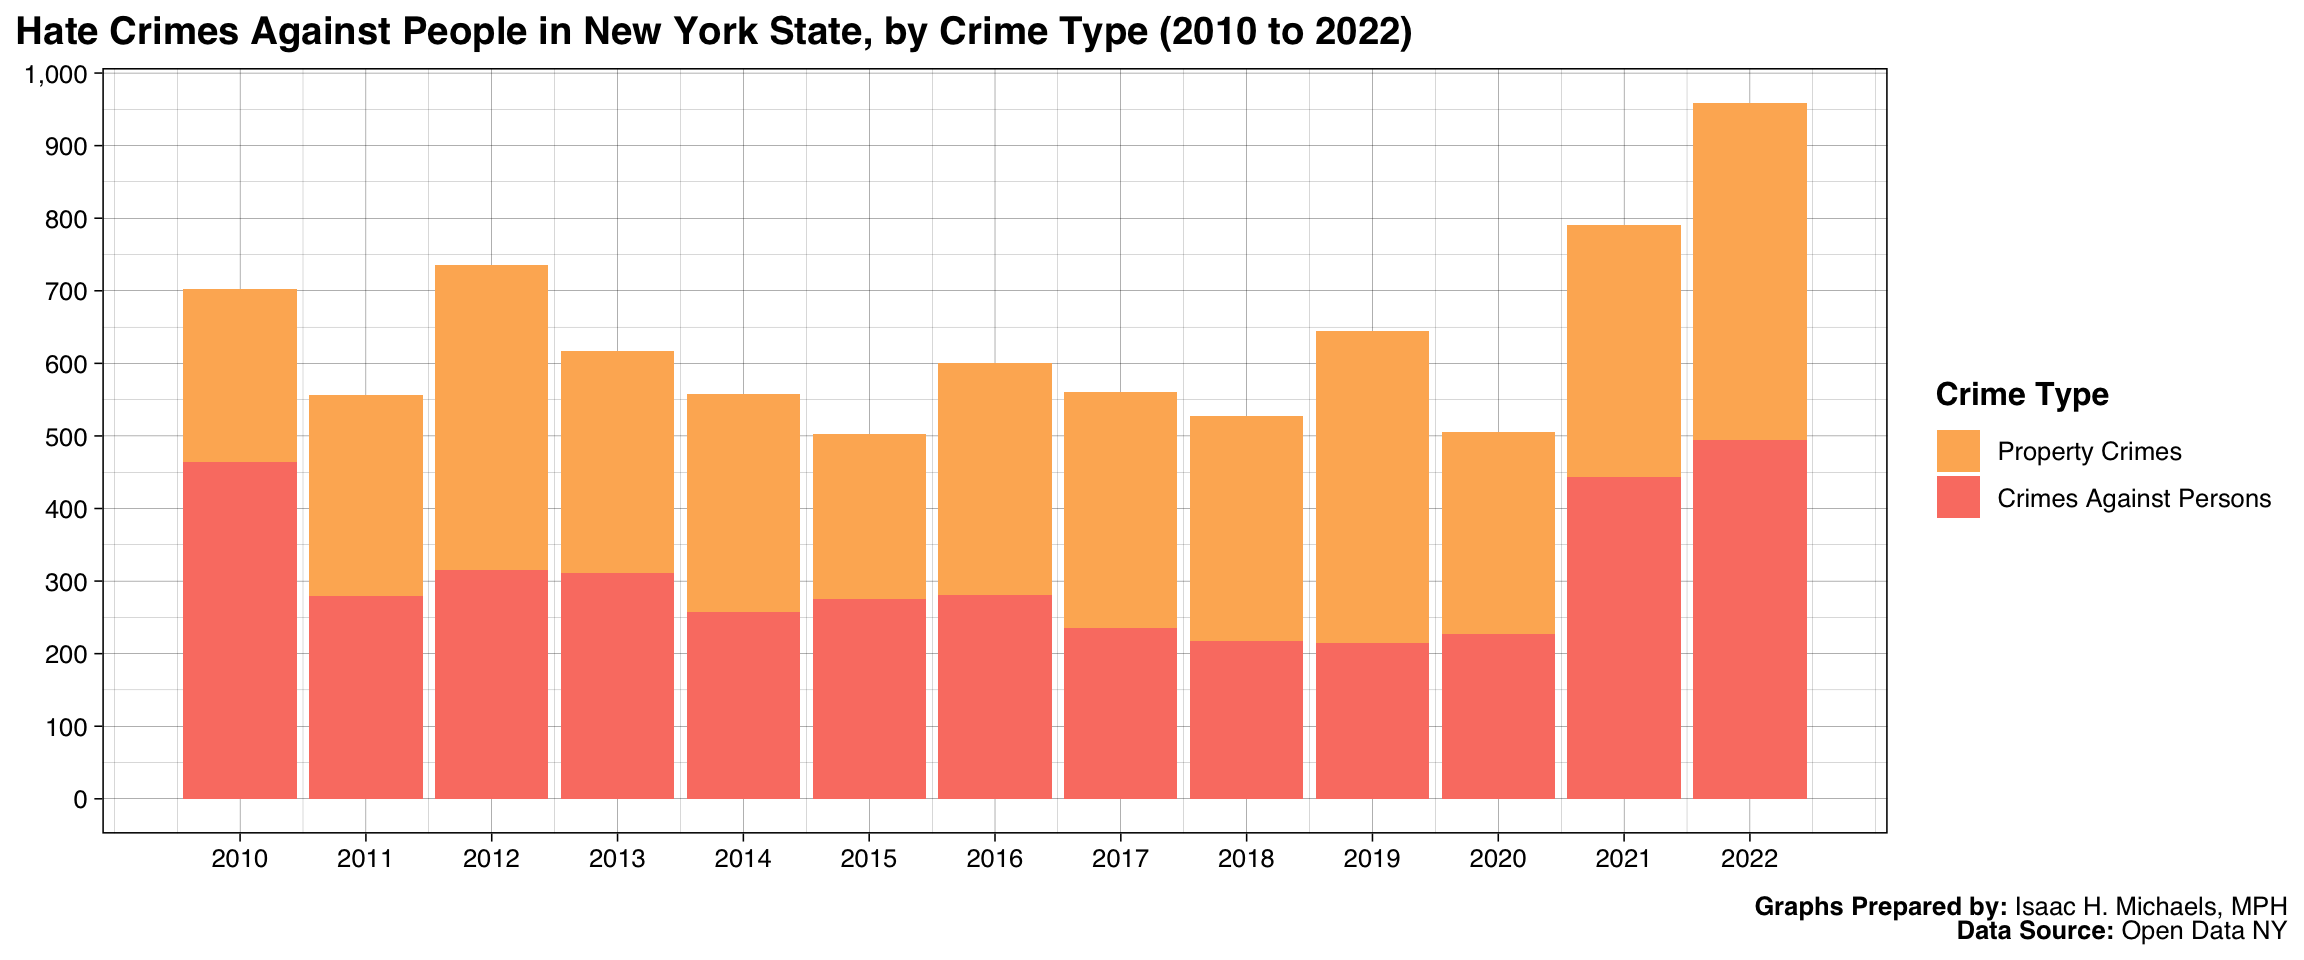
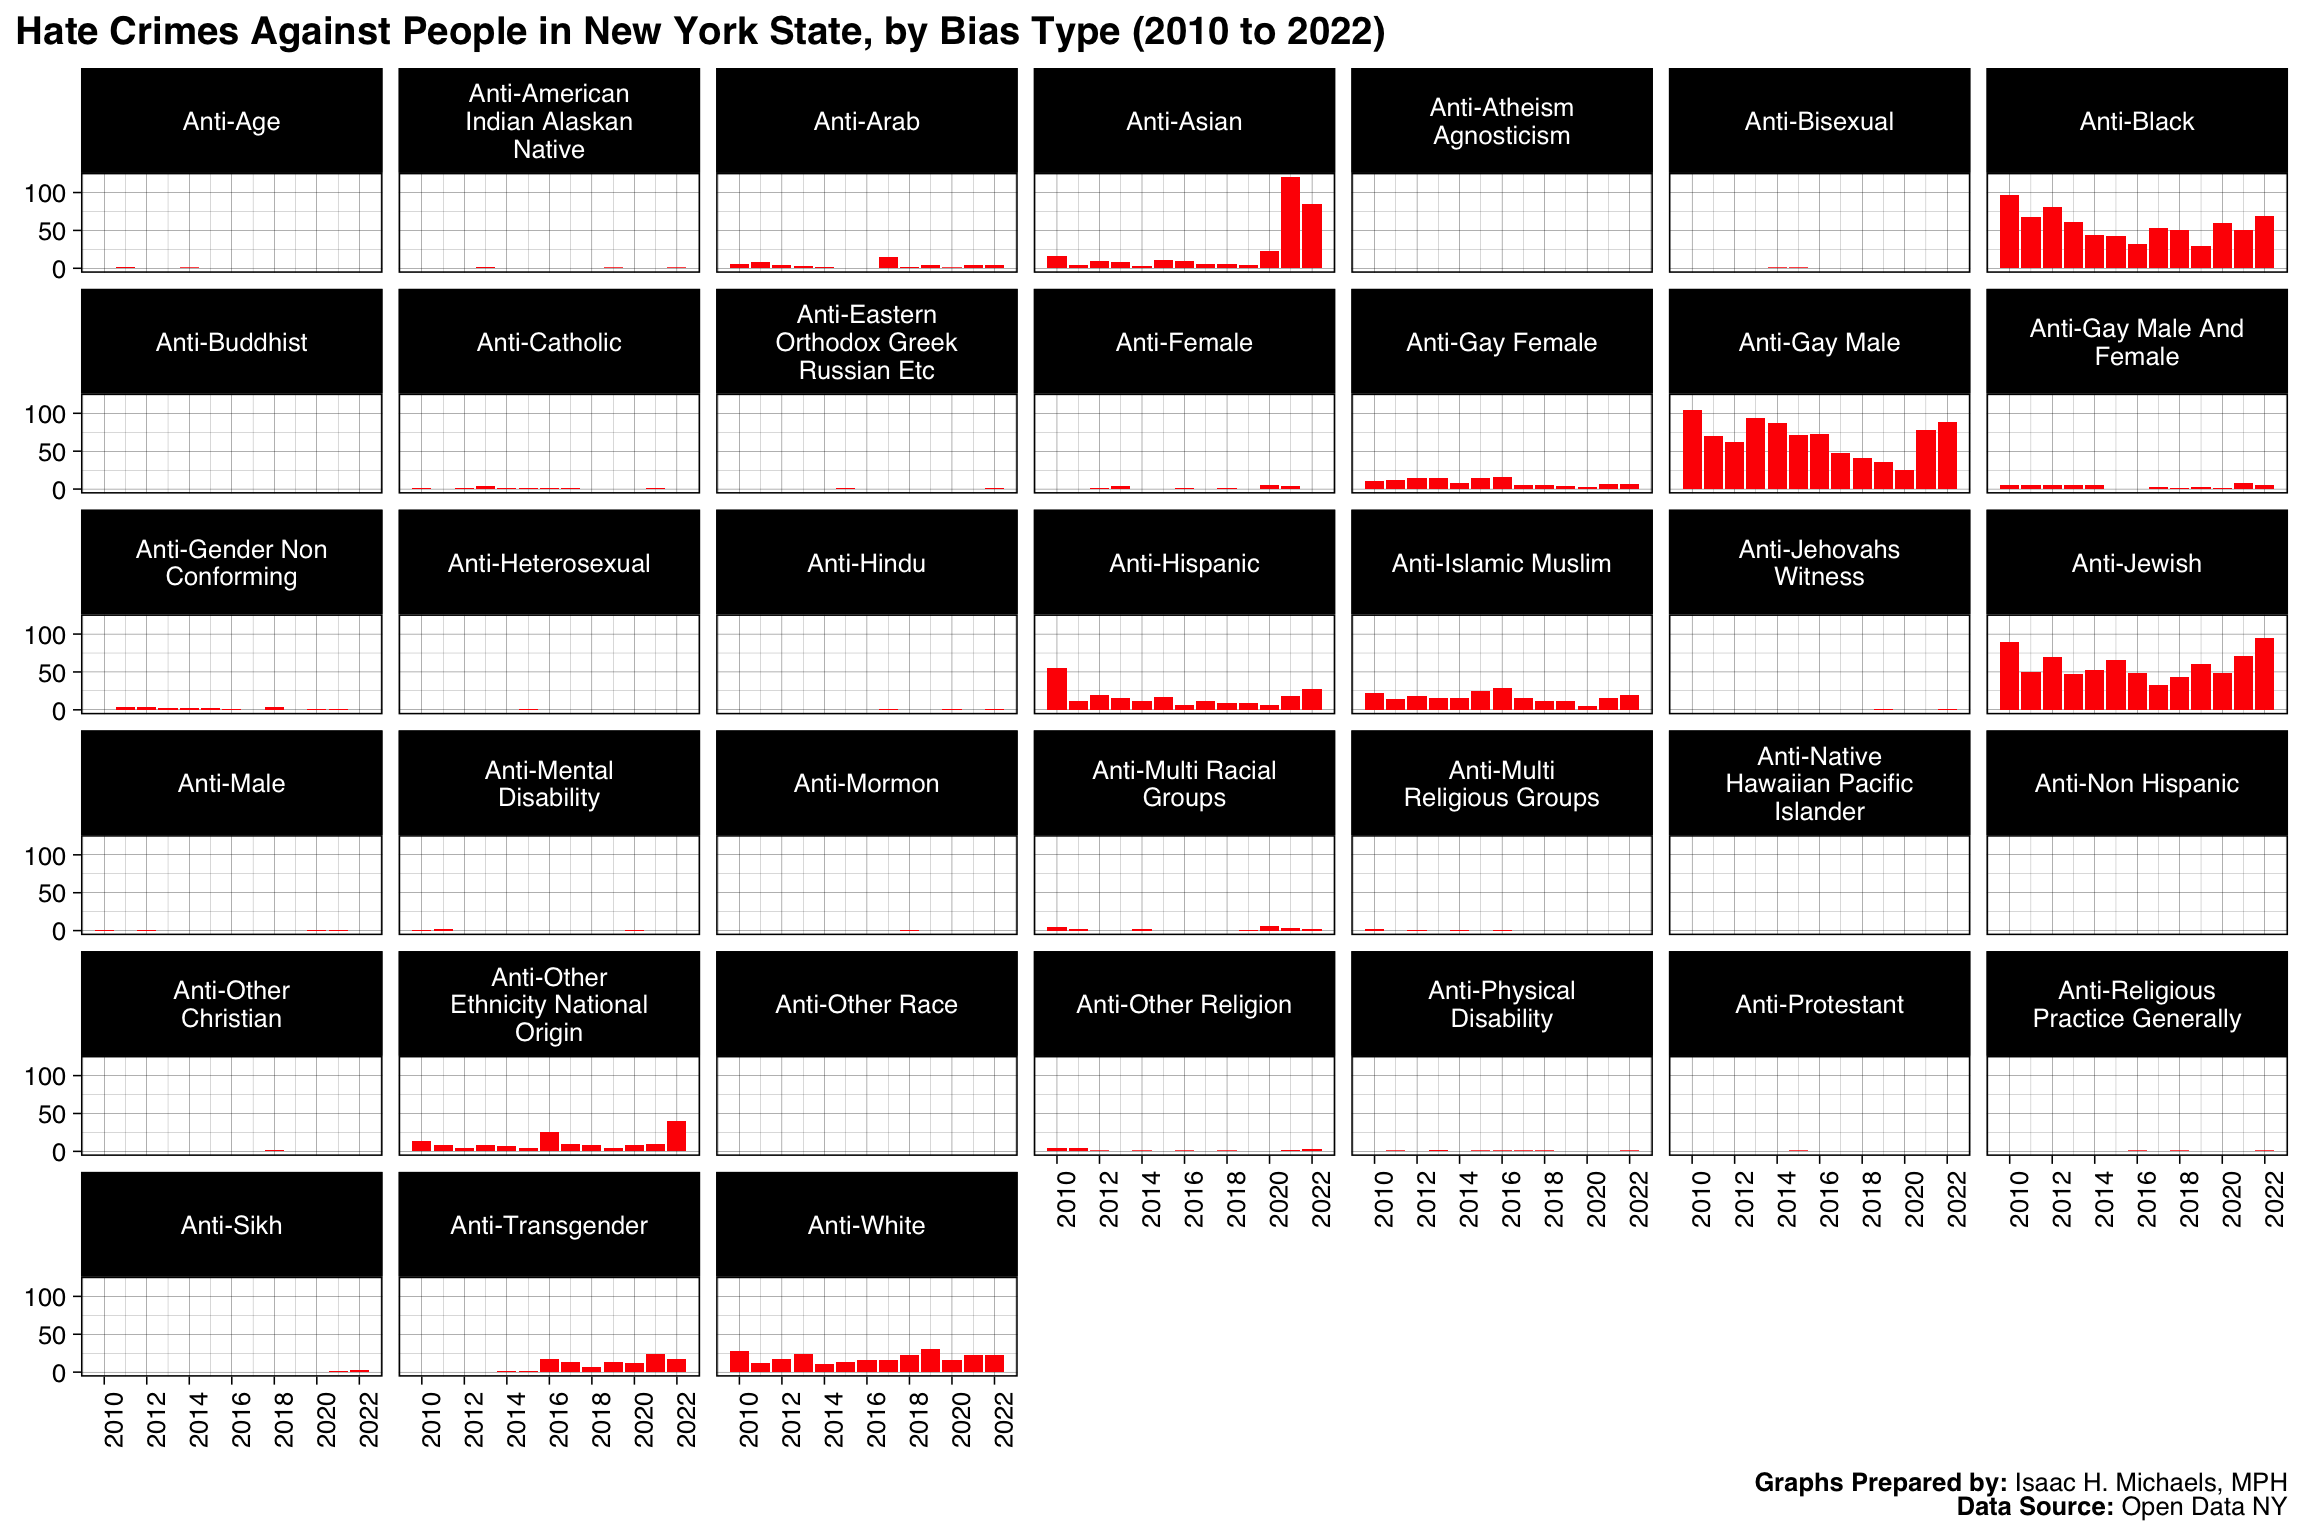
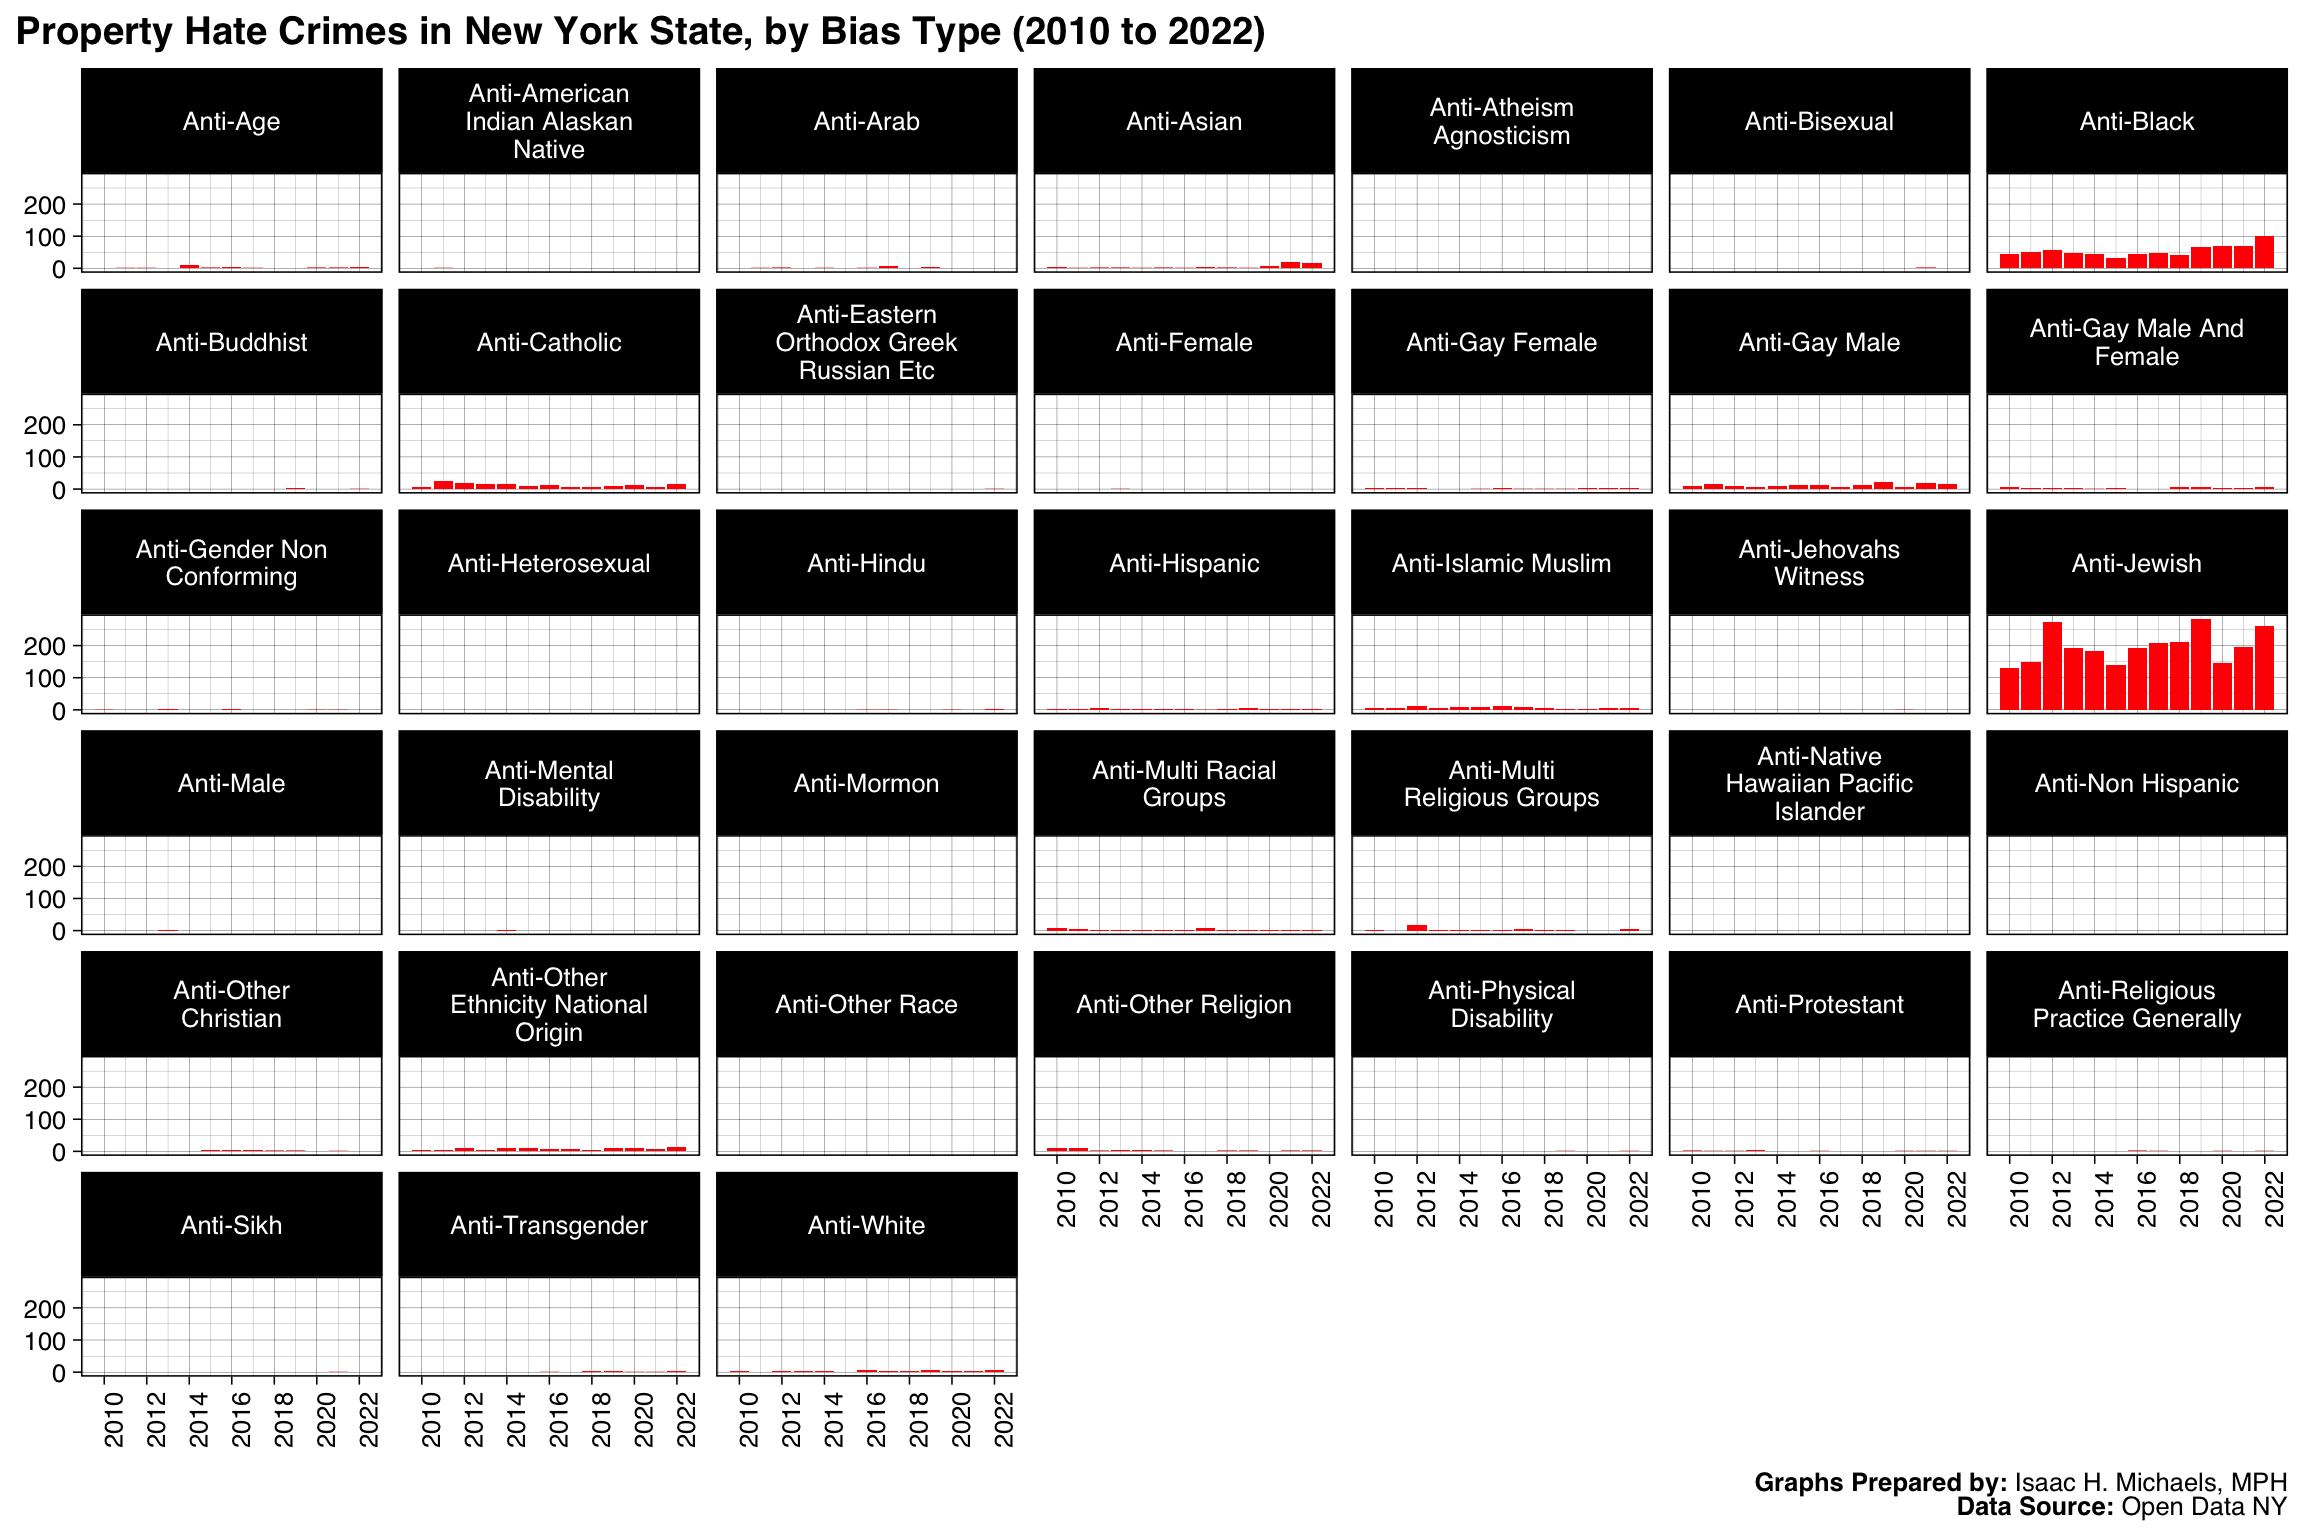
The Trends section contains trend graphs that show the overall and stratified trend of hate crimes over time in the state. These graphs allow you to see how the number of hate crimes has changed over the years and to identify any patterns or trends that may exist. The trends are shown for overall hate crimes, hate crimes against people, and hate crimes against property.
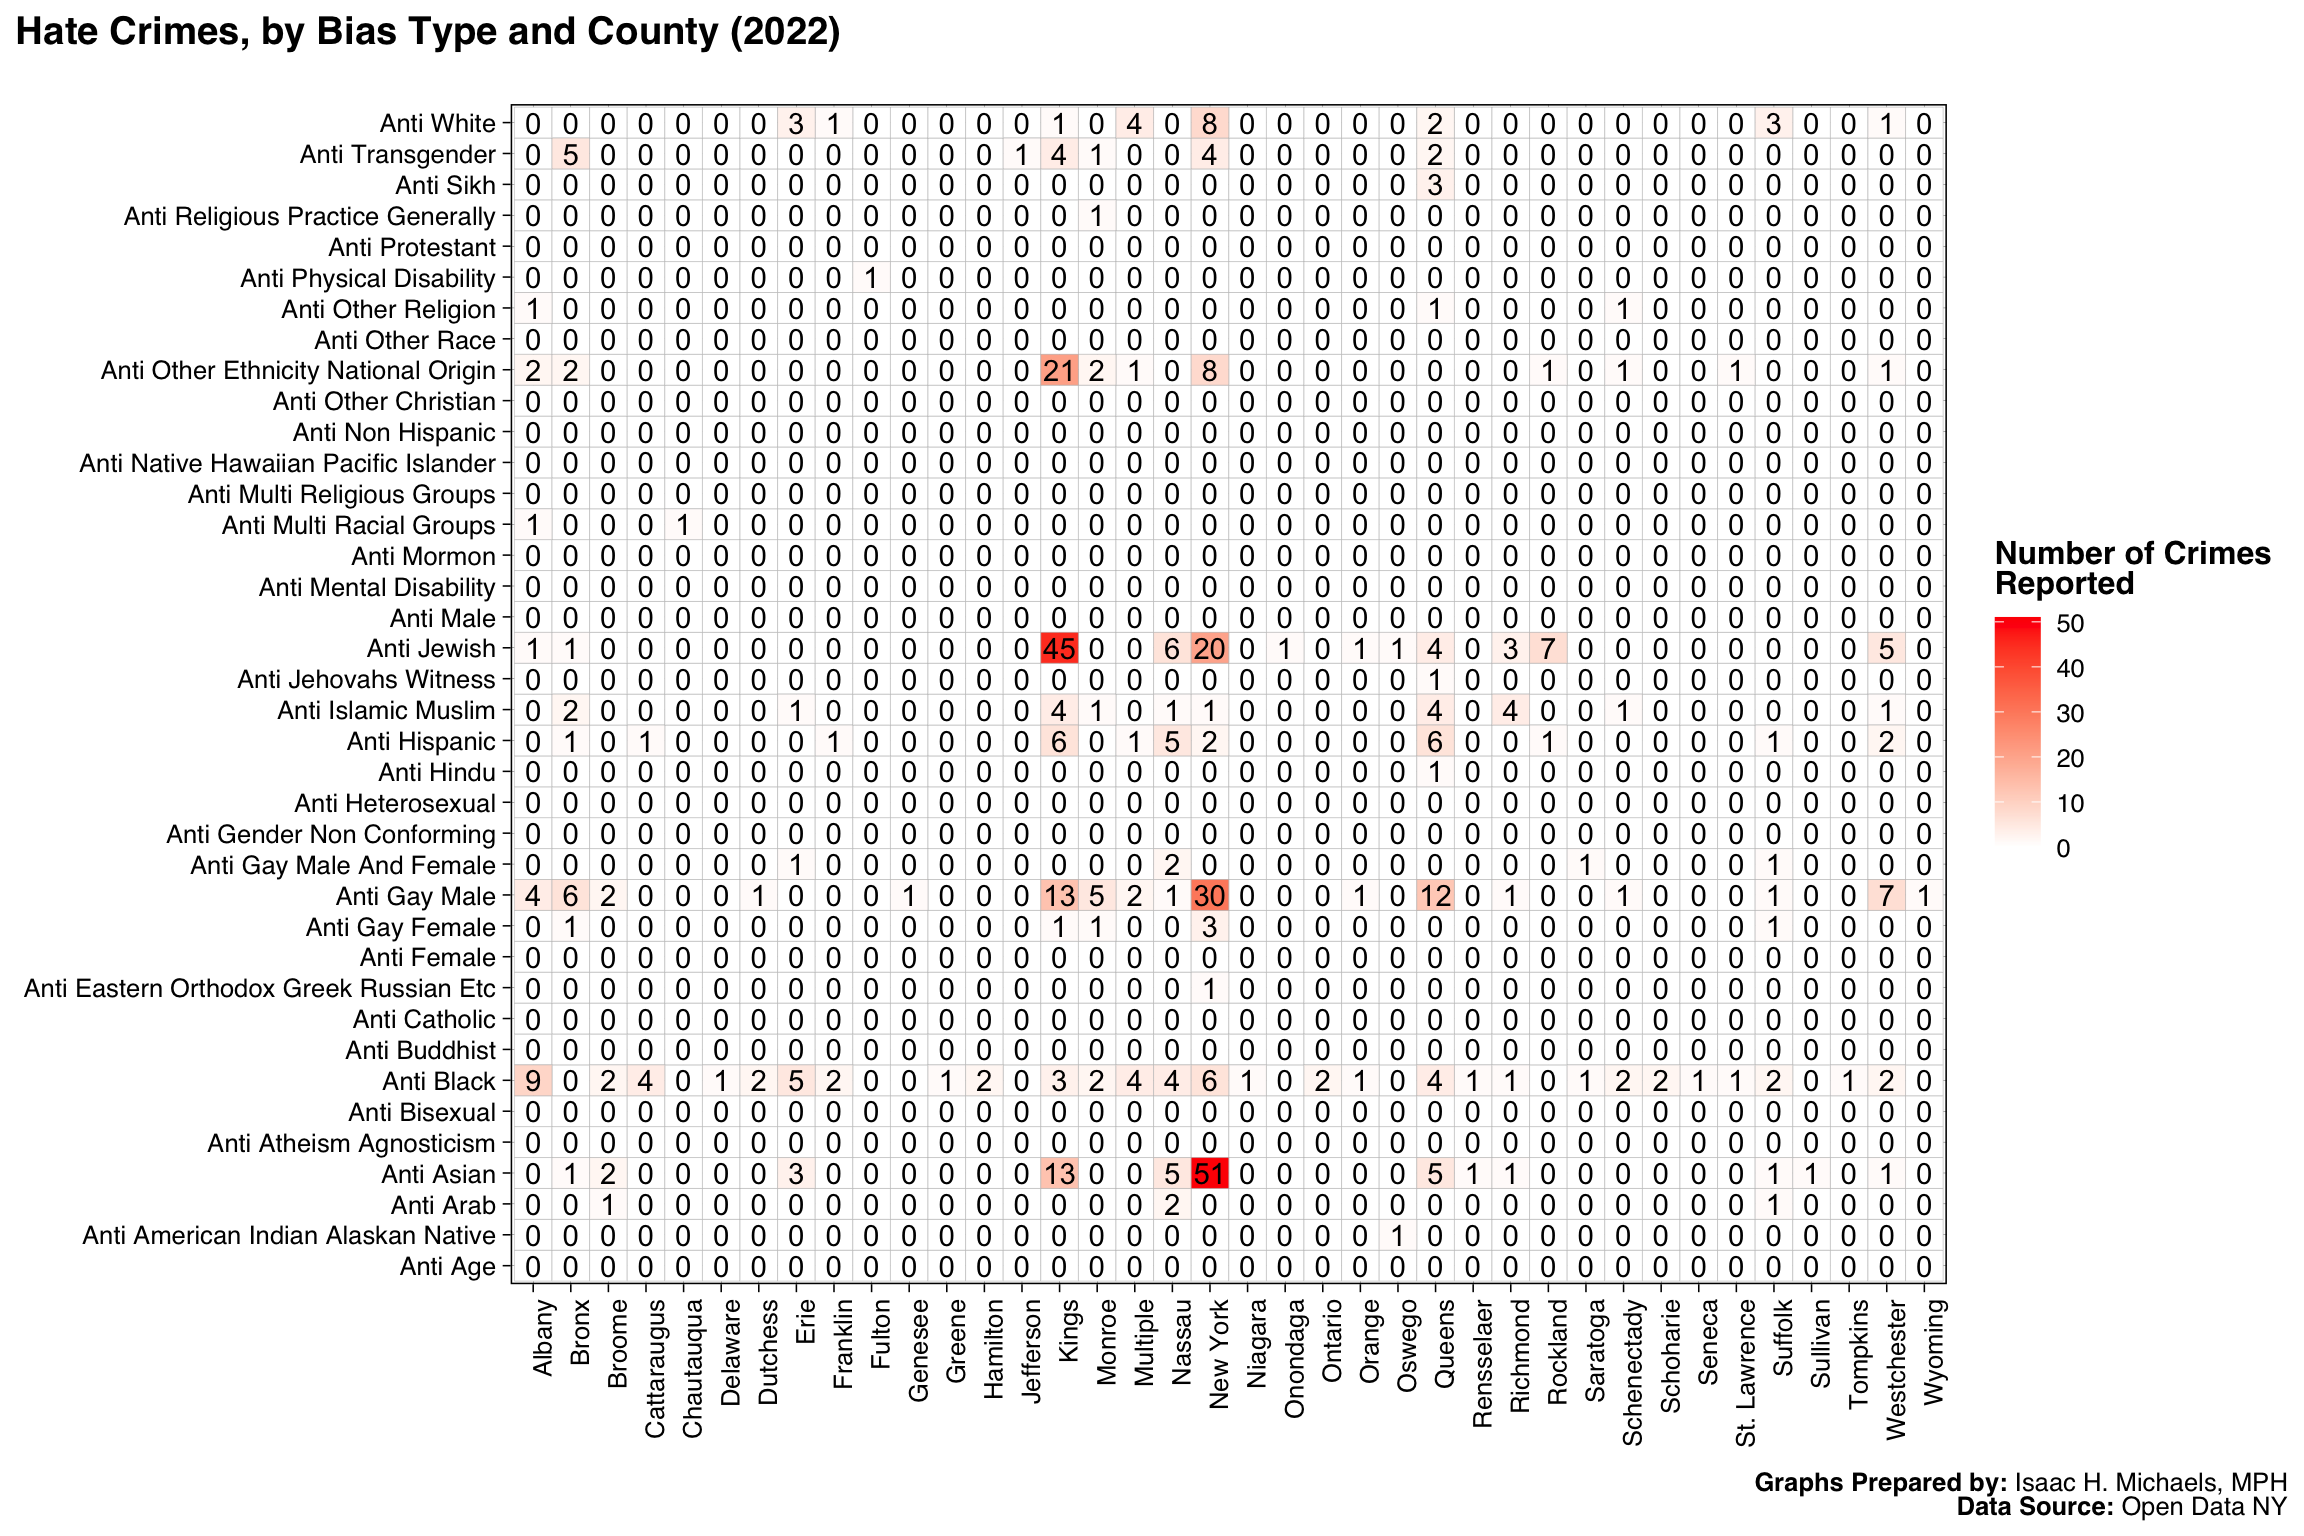
County Distributions
The County Distributions section contains a heat map that shows the distribution of hate crimes by bias motive in each county of the state. This heat map allows you to see how hate crimes are distributed across the different counties and to identify any regional patterns or differences.
New York City
In the New York City section, you will find maps, graphs, and heat maps that showcase the distribution and trends of hate crimes in the city. These visualizations allow you to see how hate crimes are distributed across the different boroughs and to identify any patterns or trends within the city.
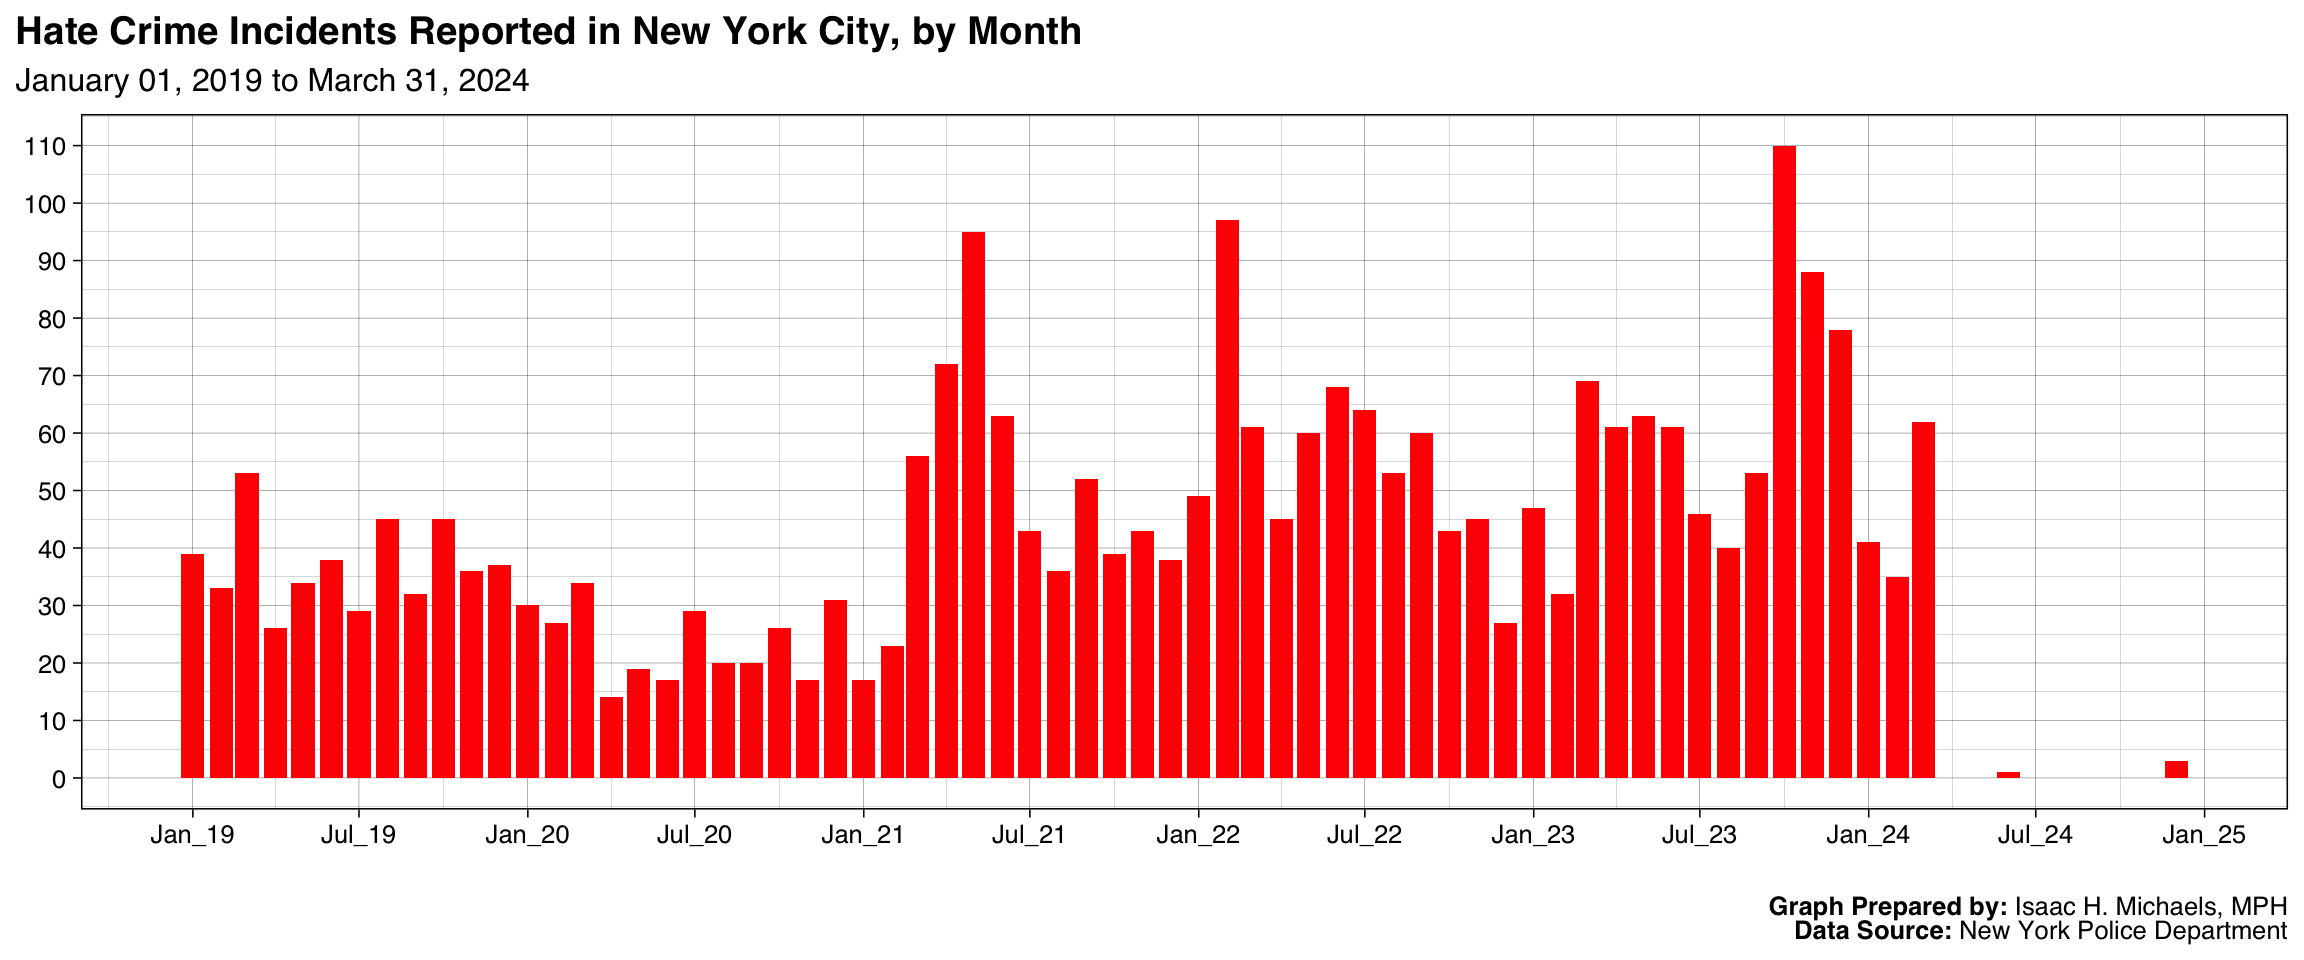
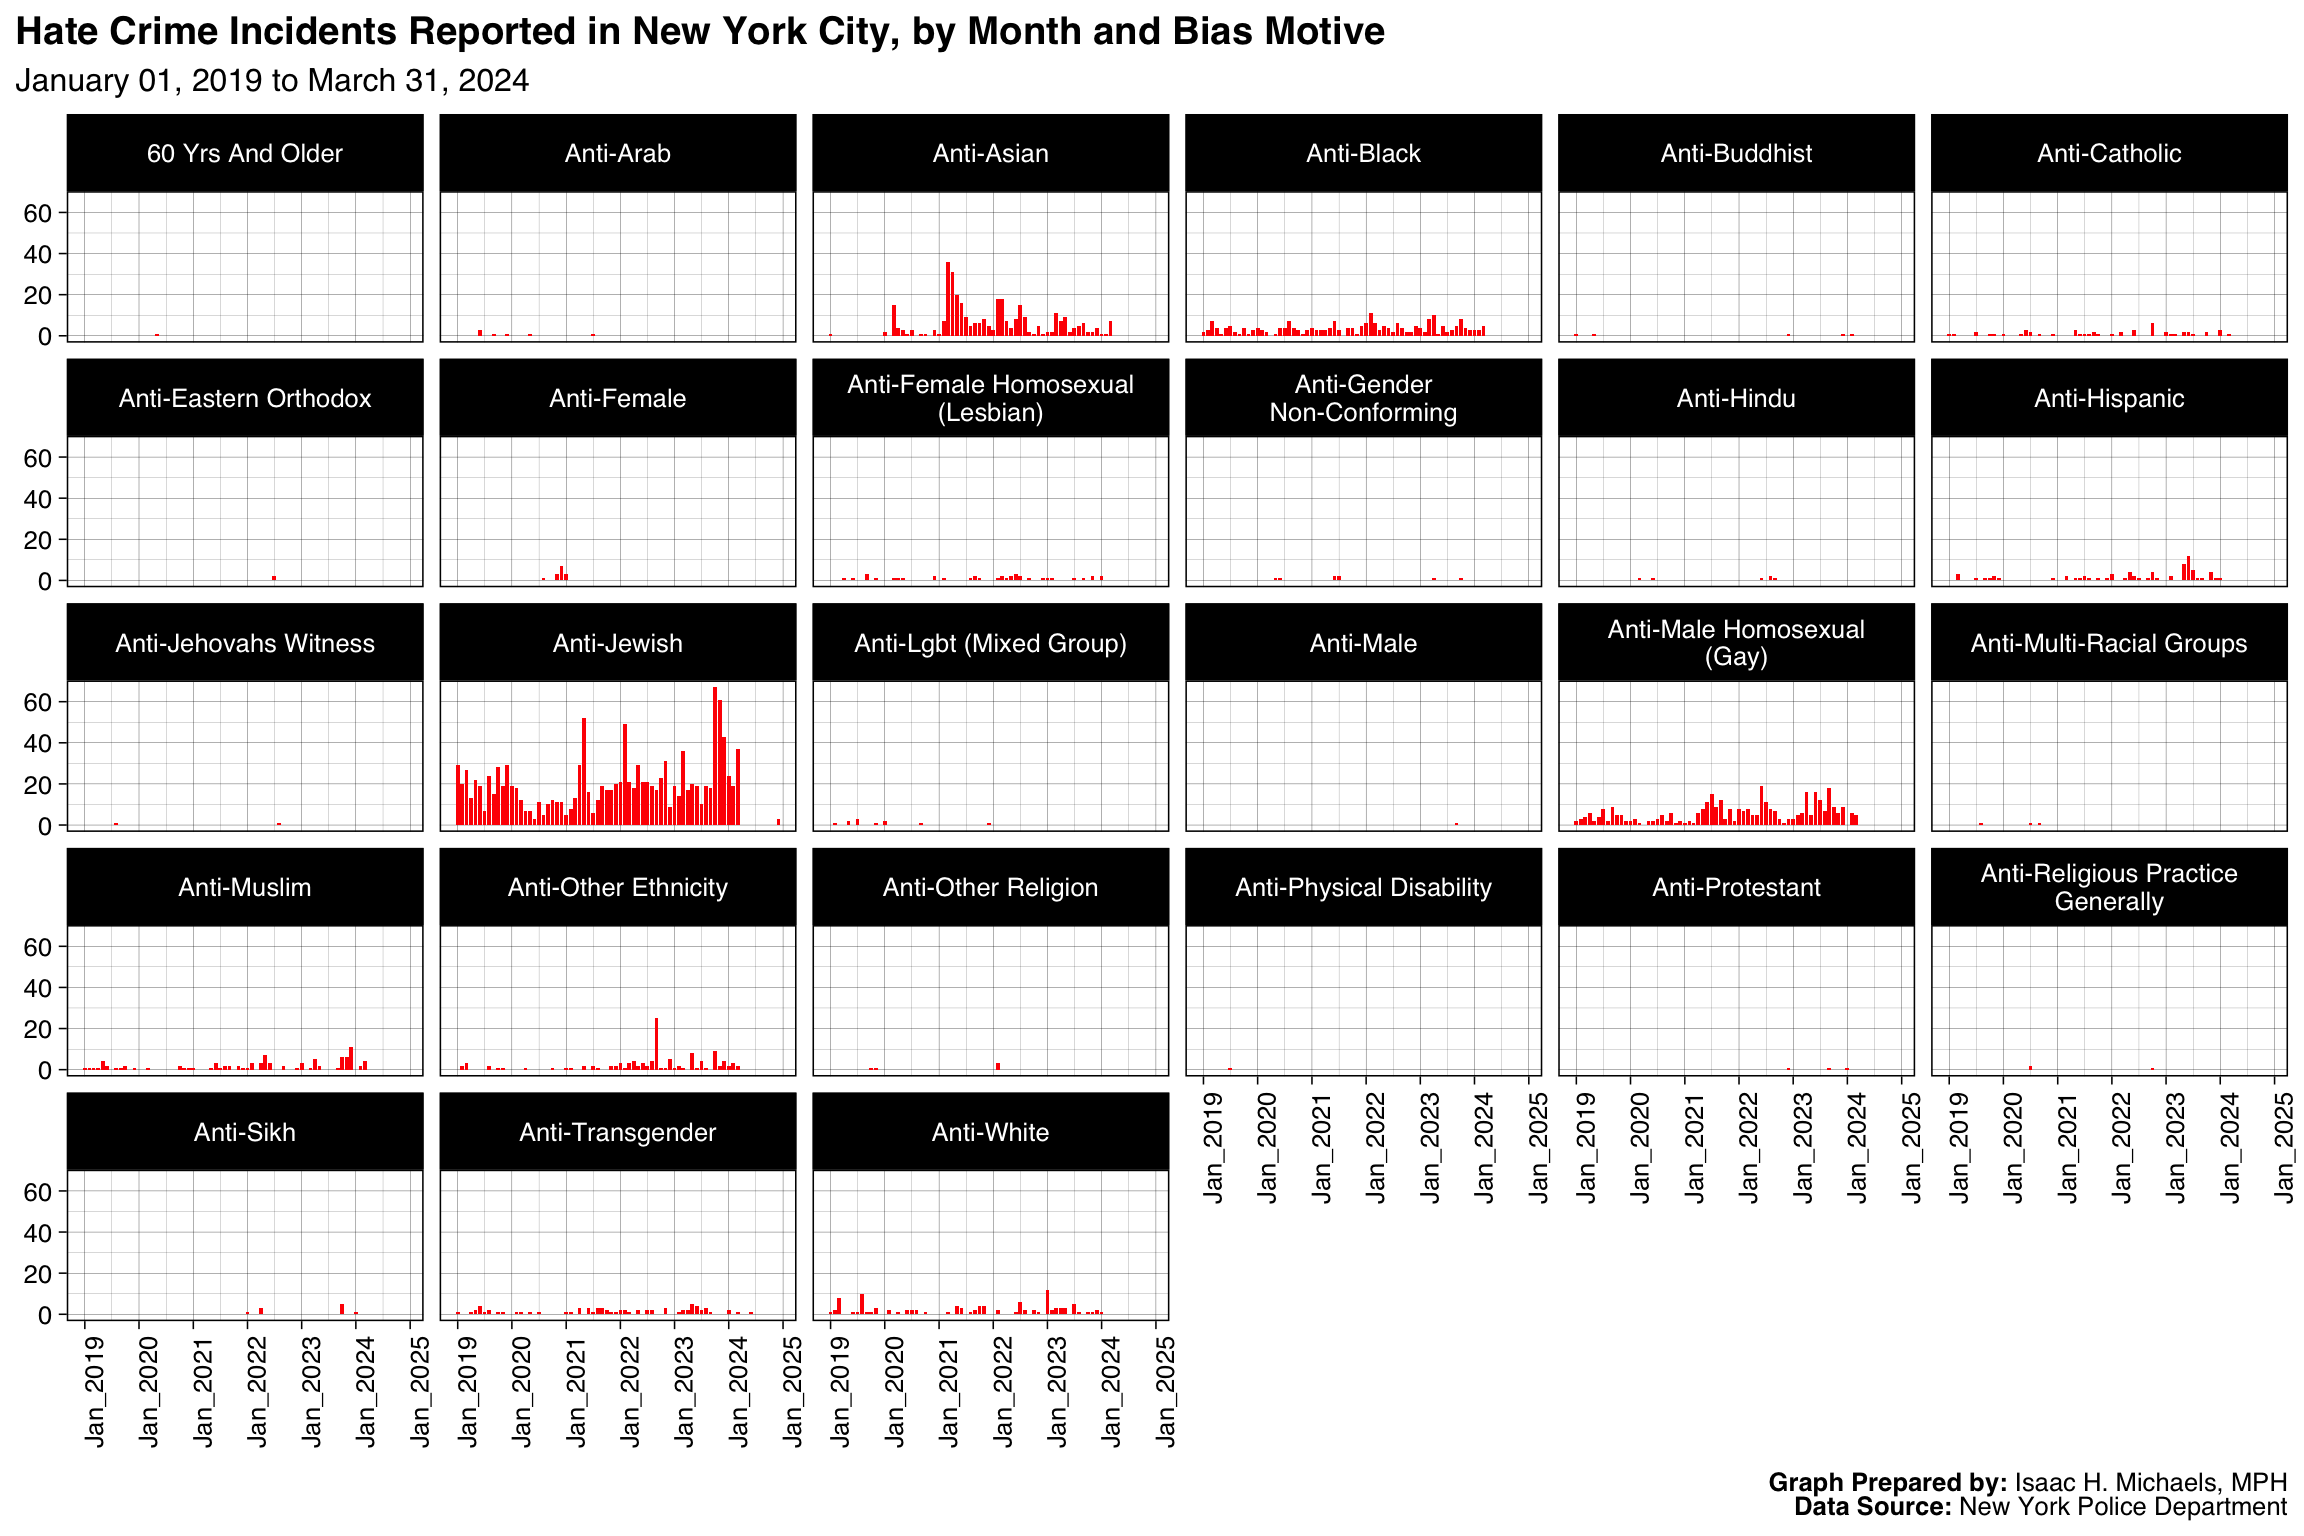
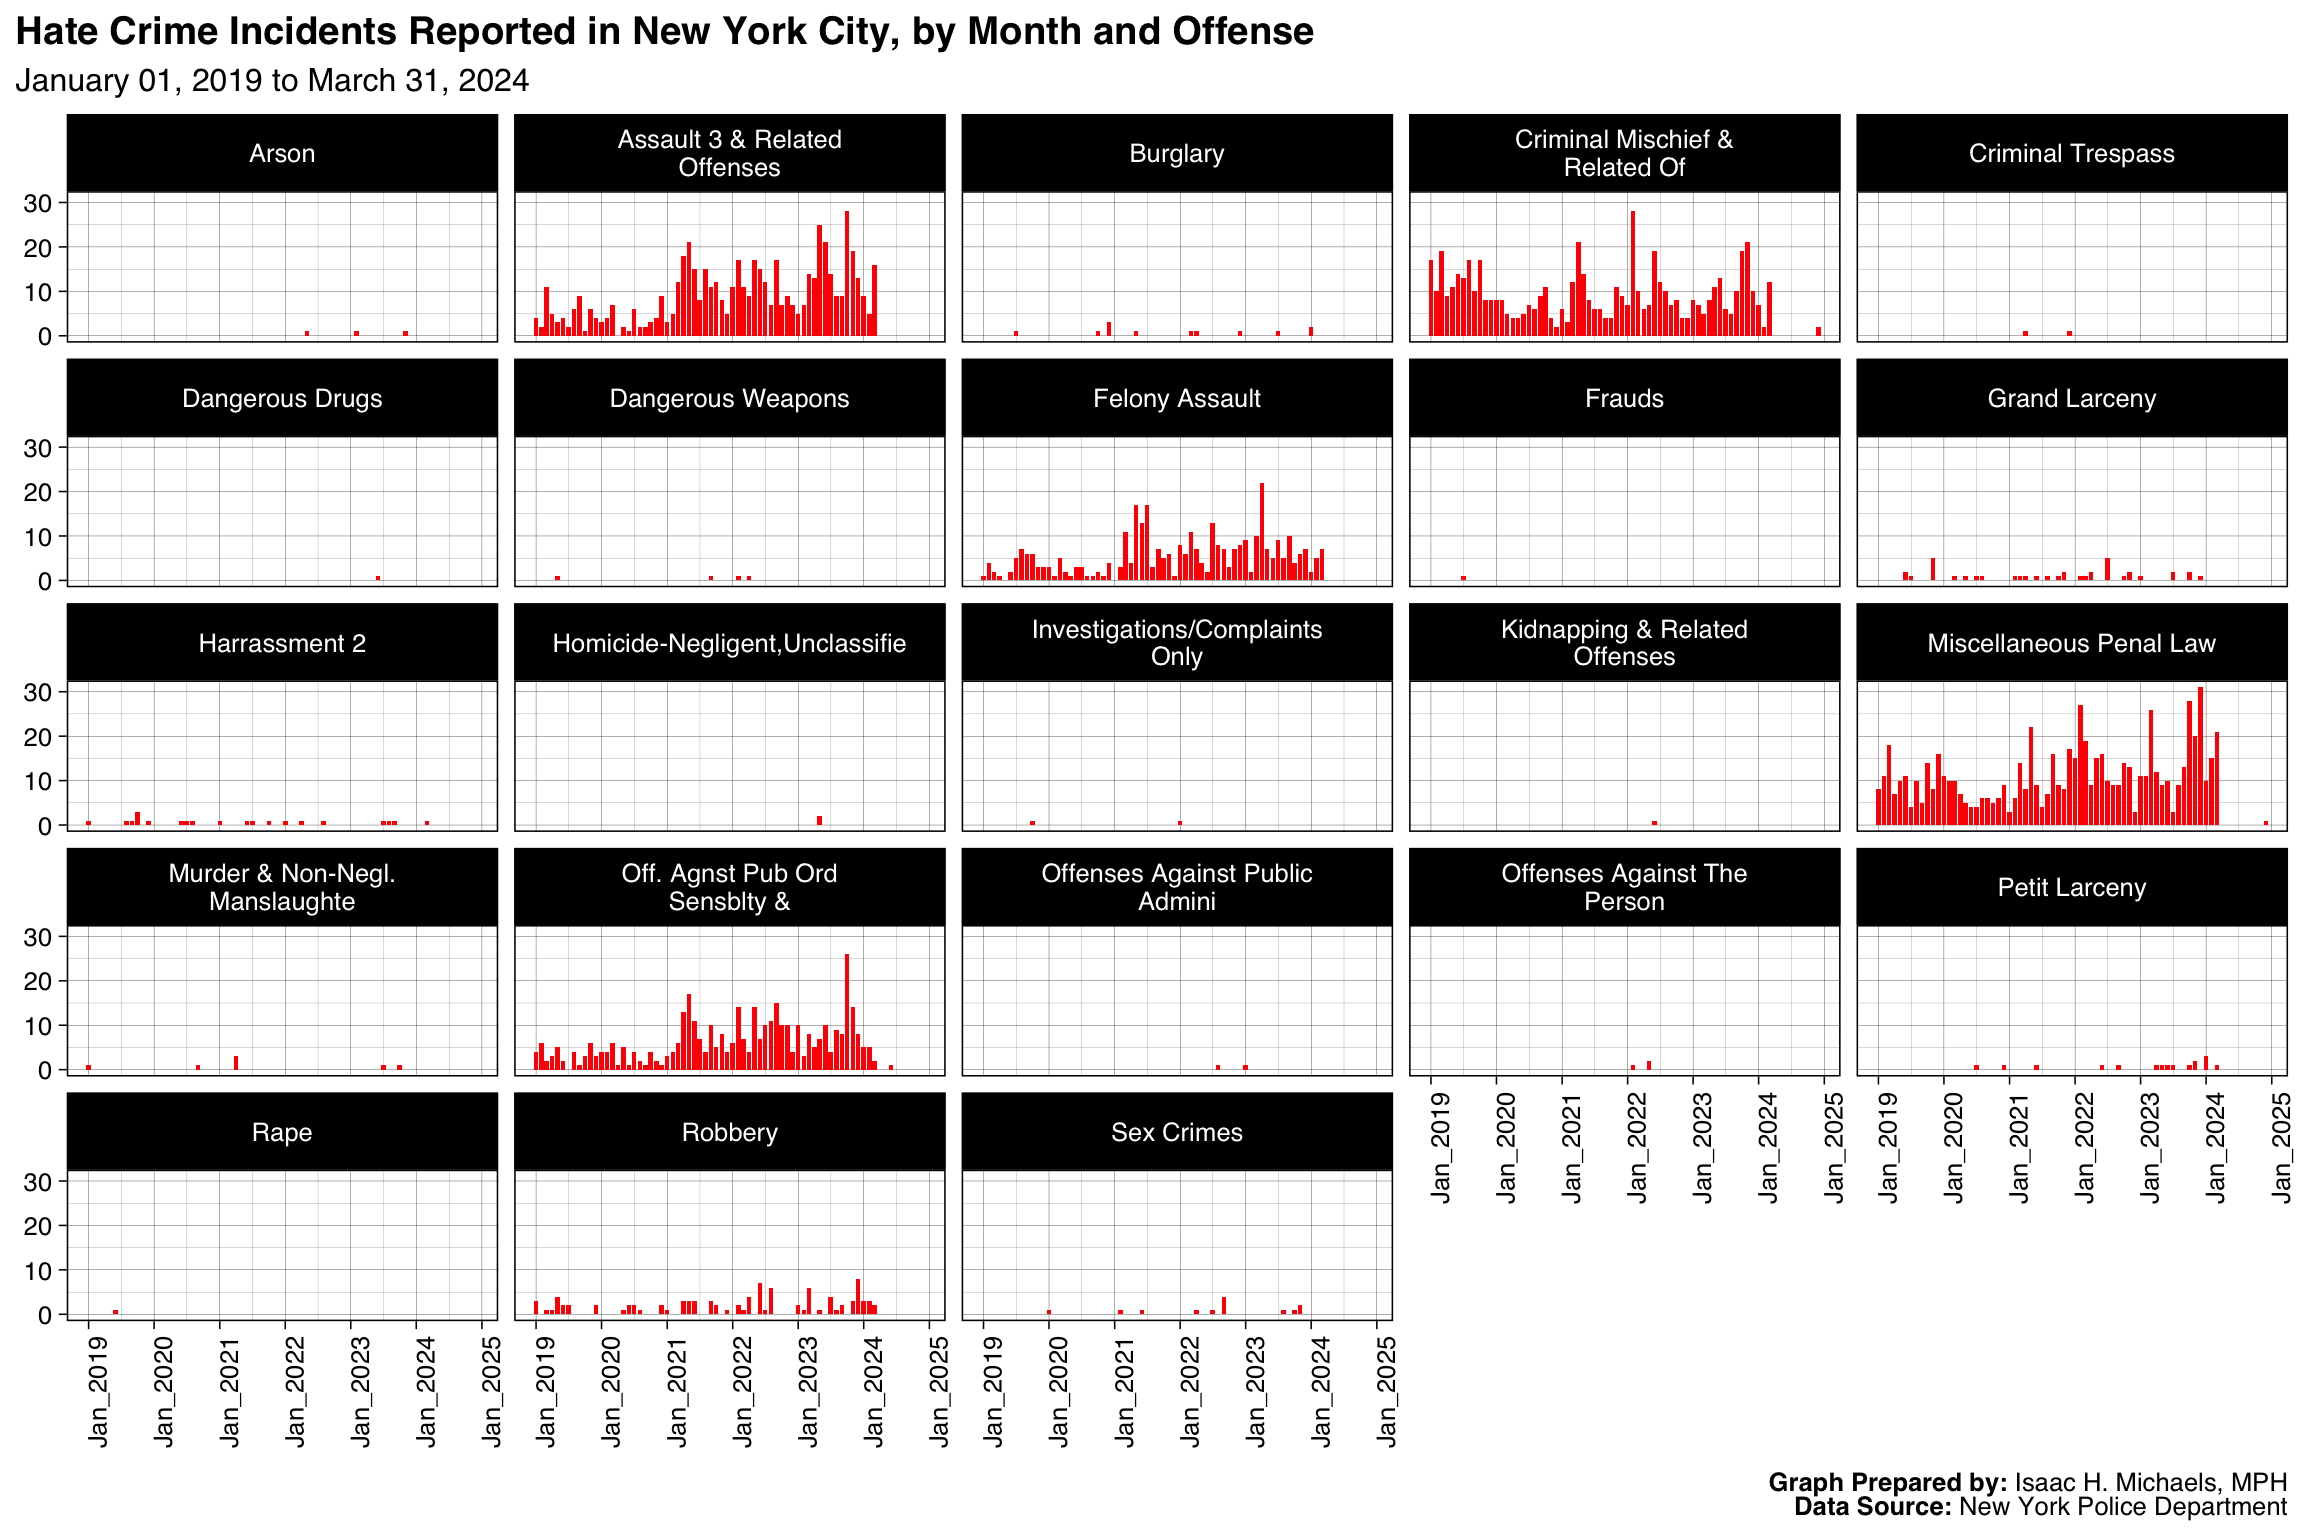
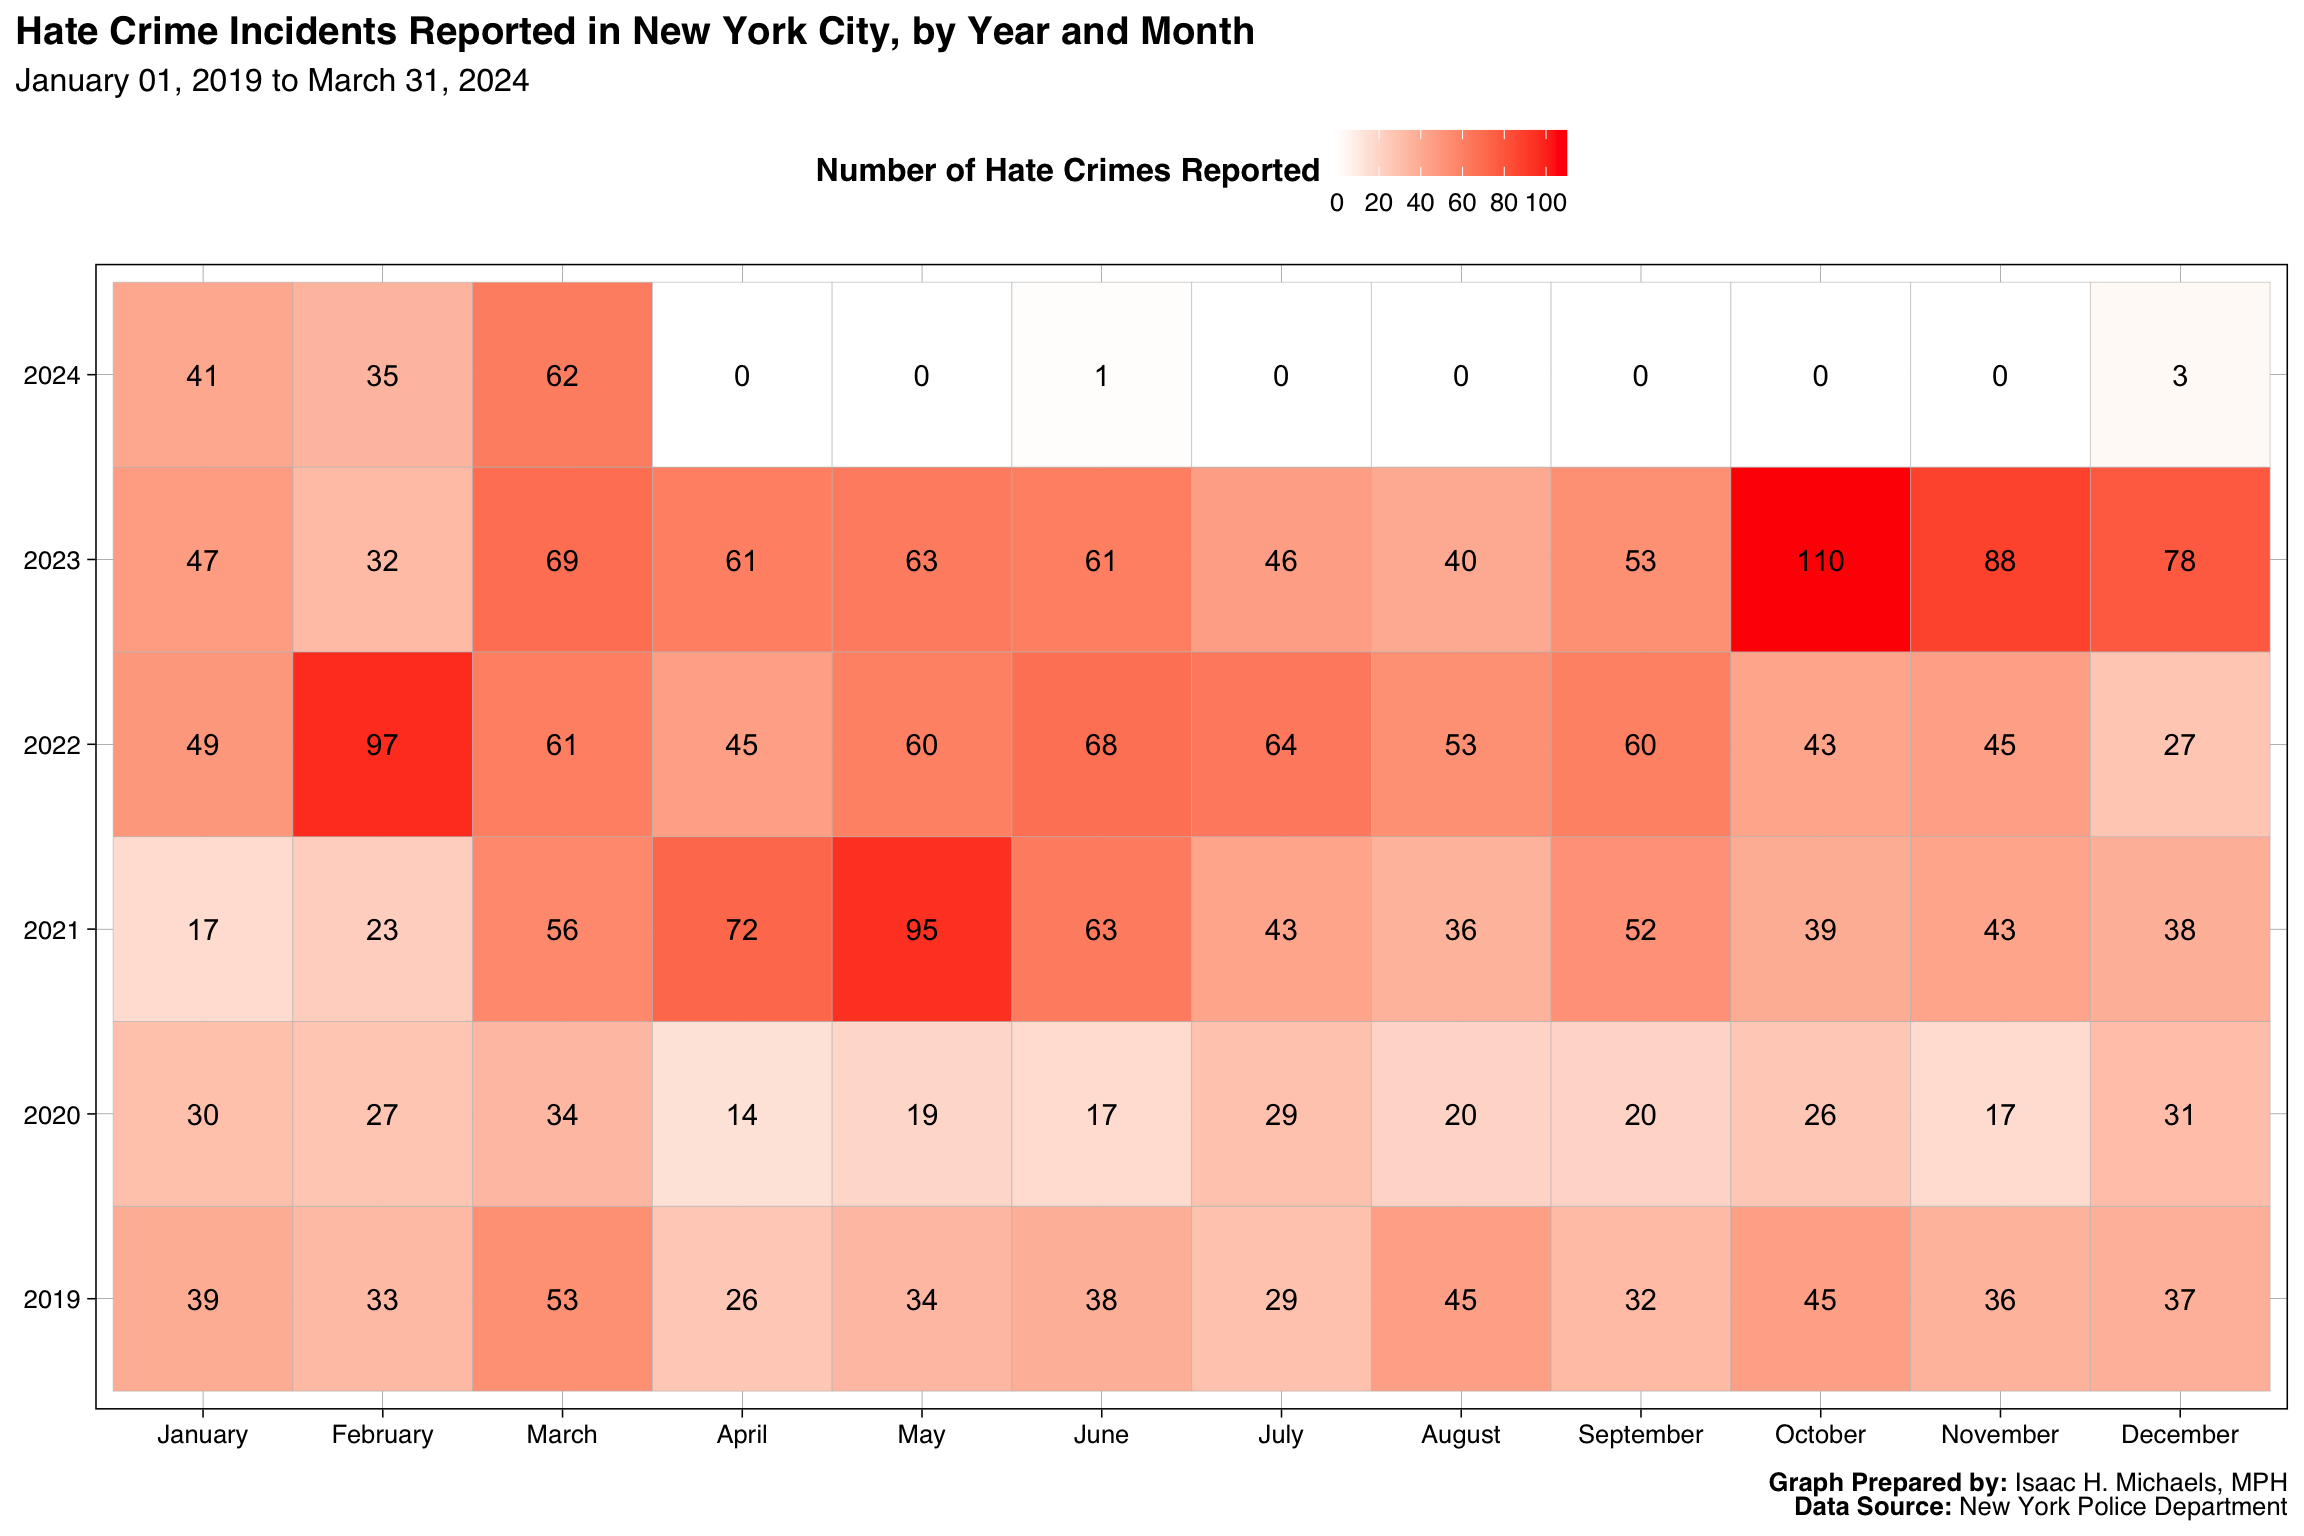
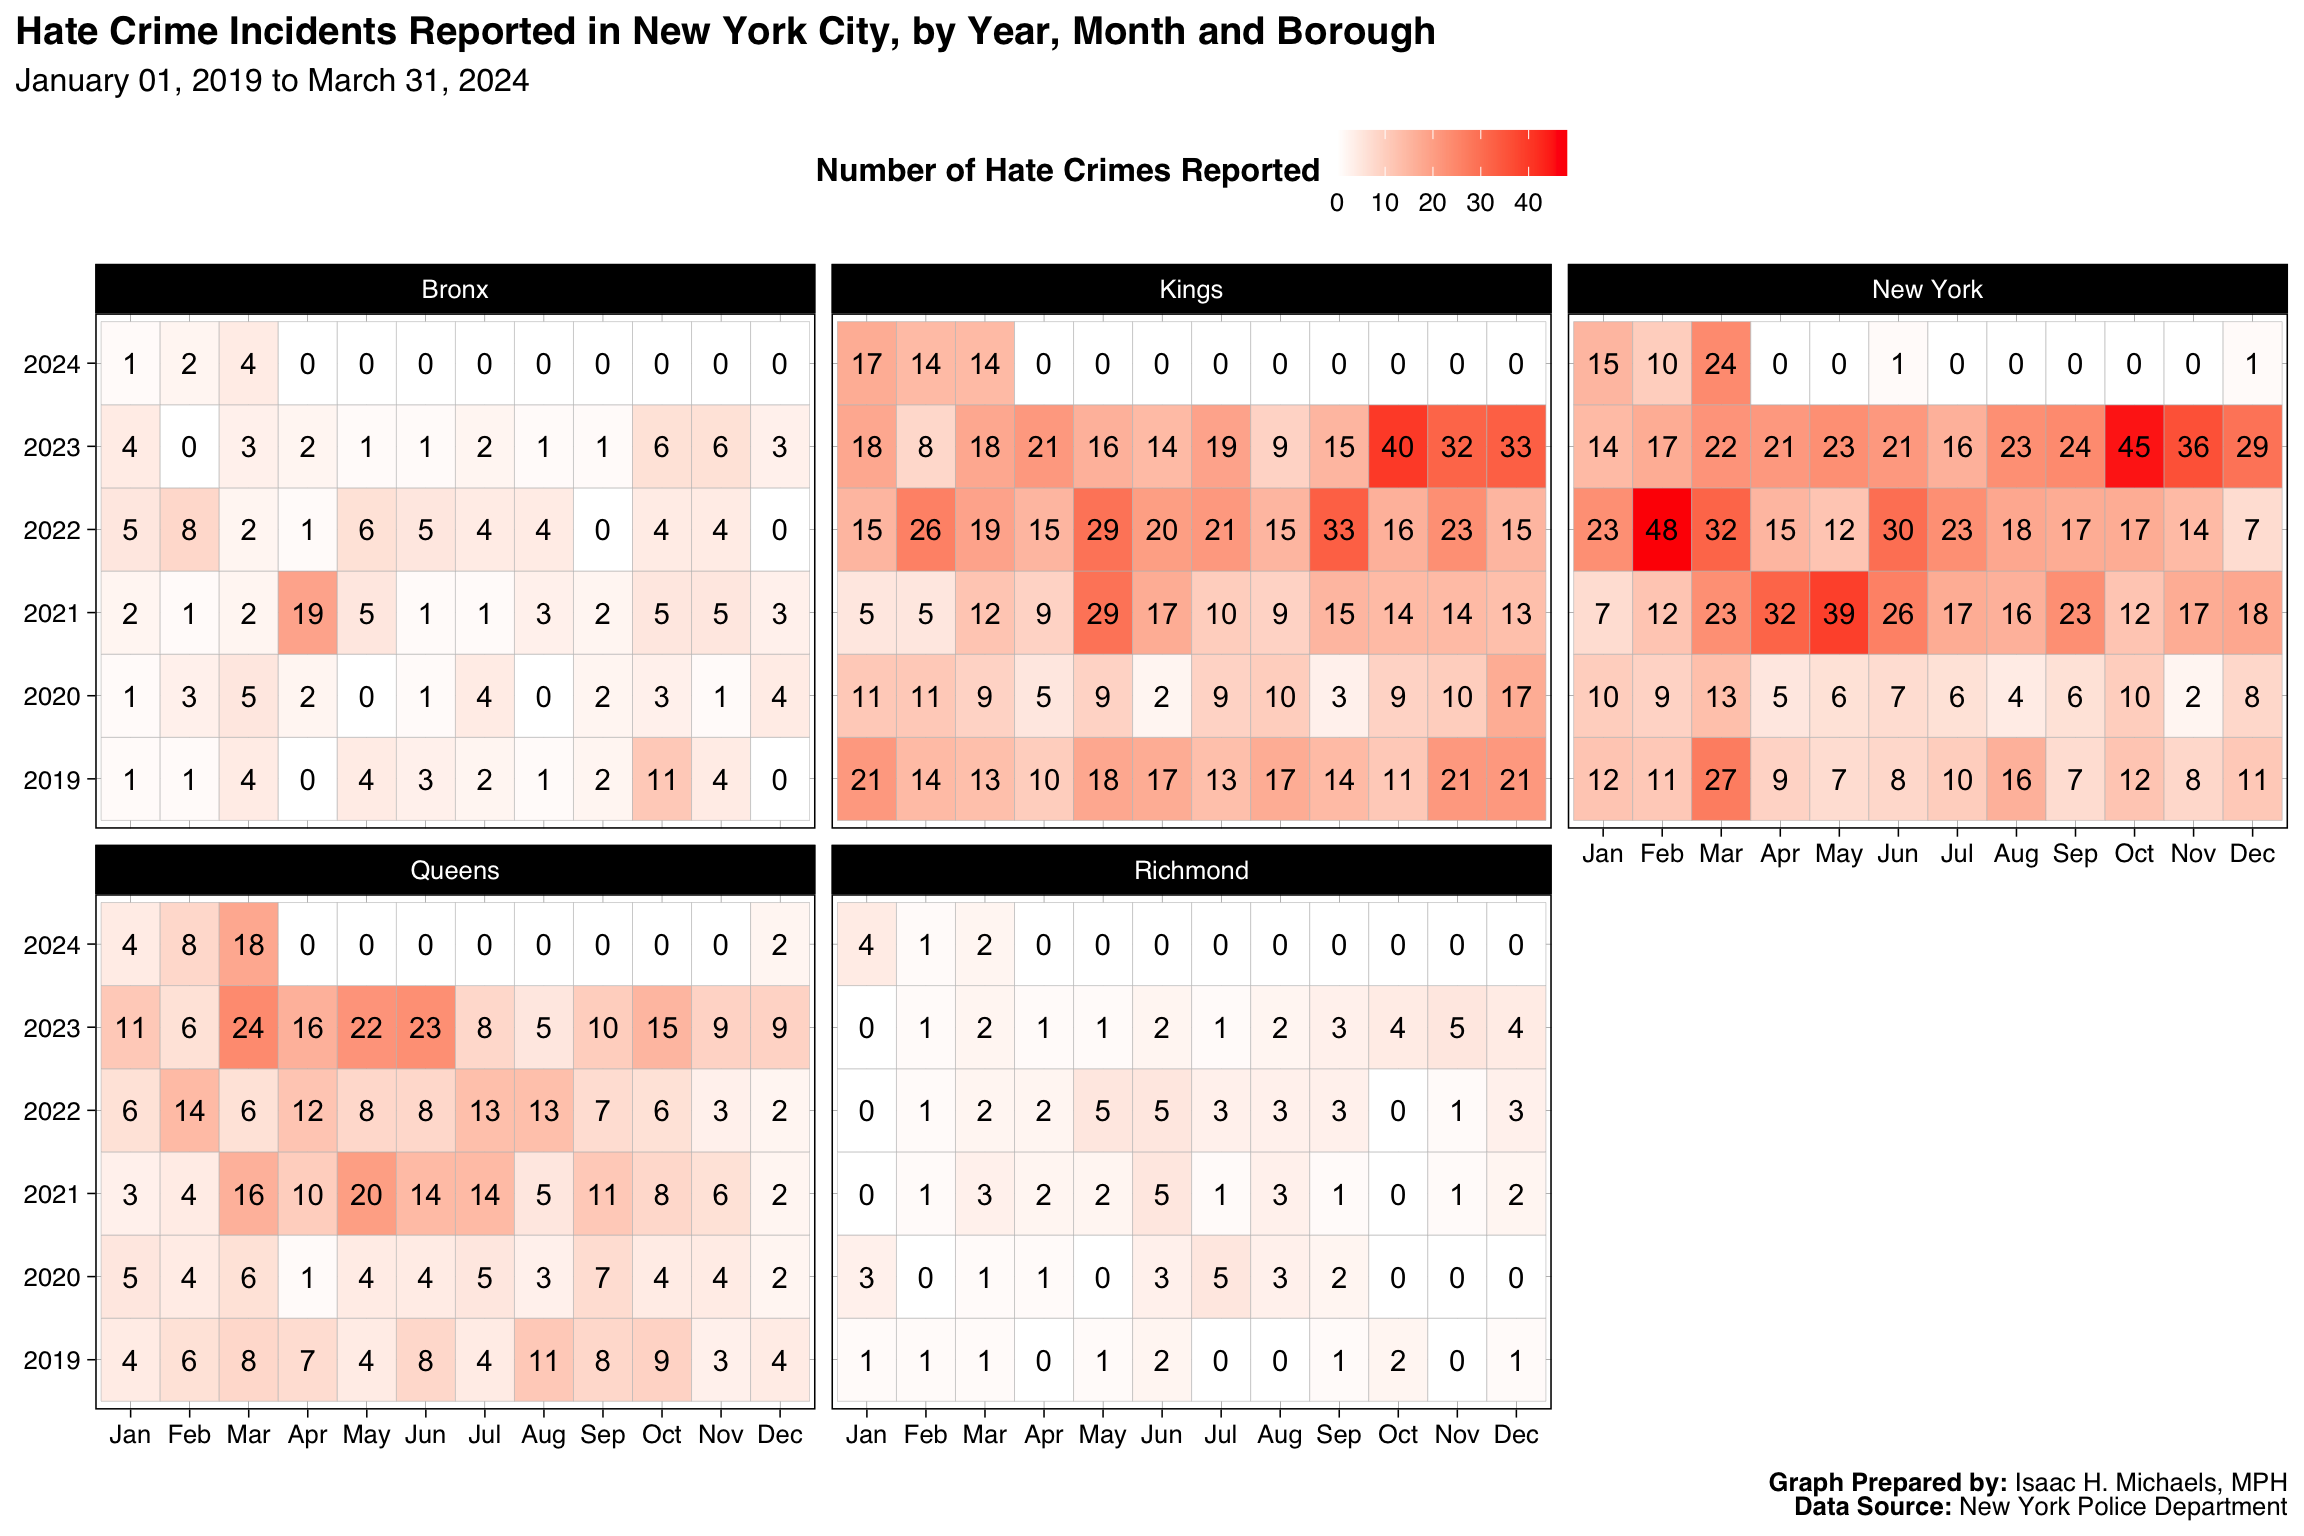
Monthly Trends
The Monthly Trends section features trend graphs and heat maps that show the overall and stratified trend of hate crimes by month in the state and city. These visualizations allow you to see how the number of hate crimes changes over the course of the year and to identify any seasonal patterns or trends. The trends are shown for overall hate crimes, as well as stratified by bias motive and offense type.
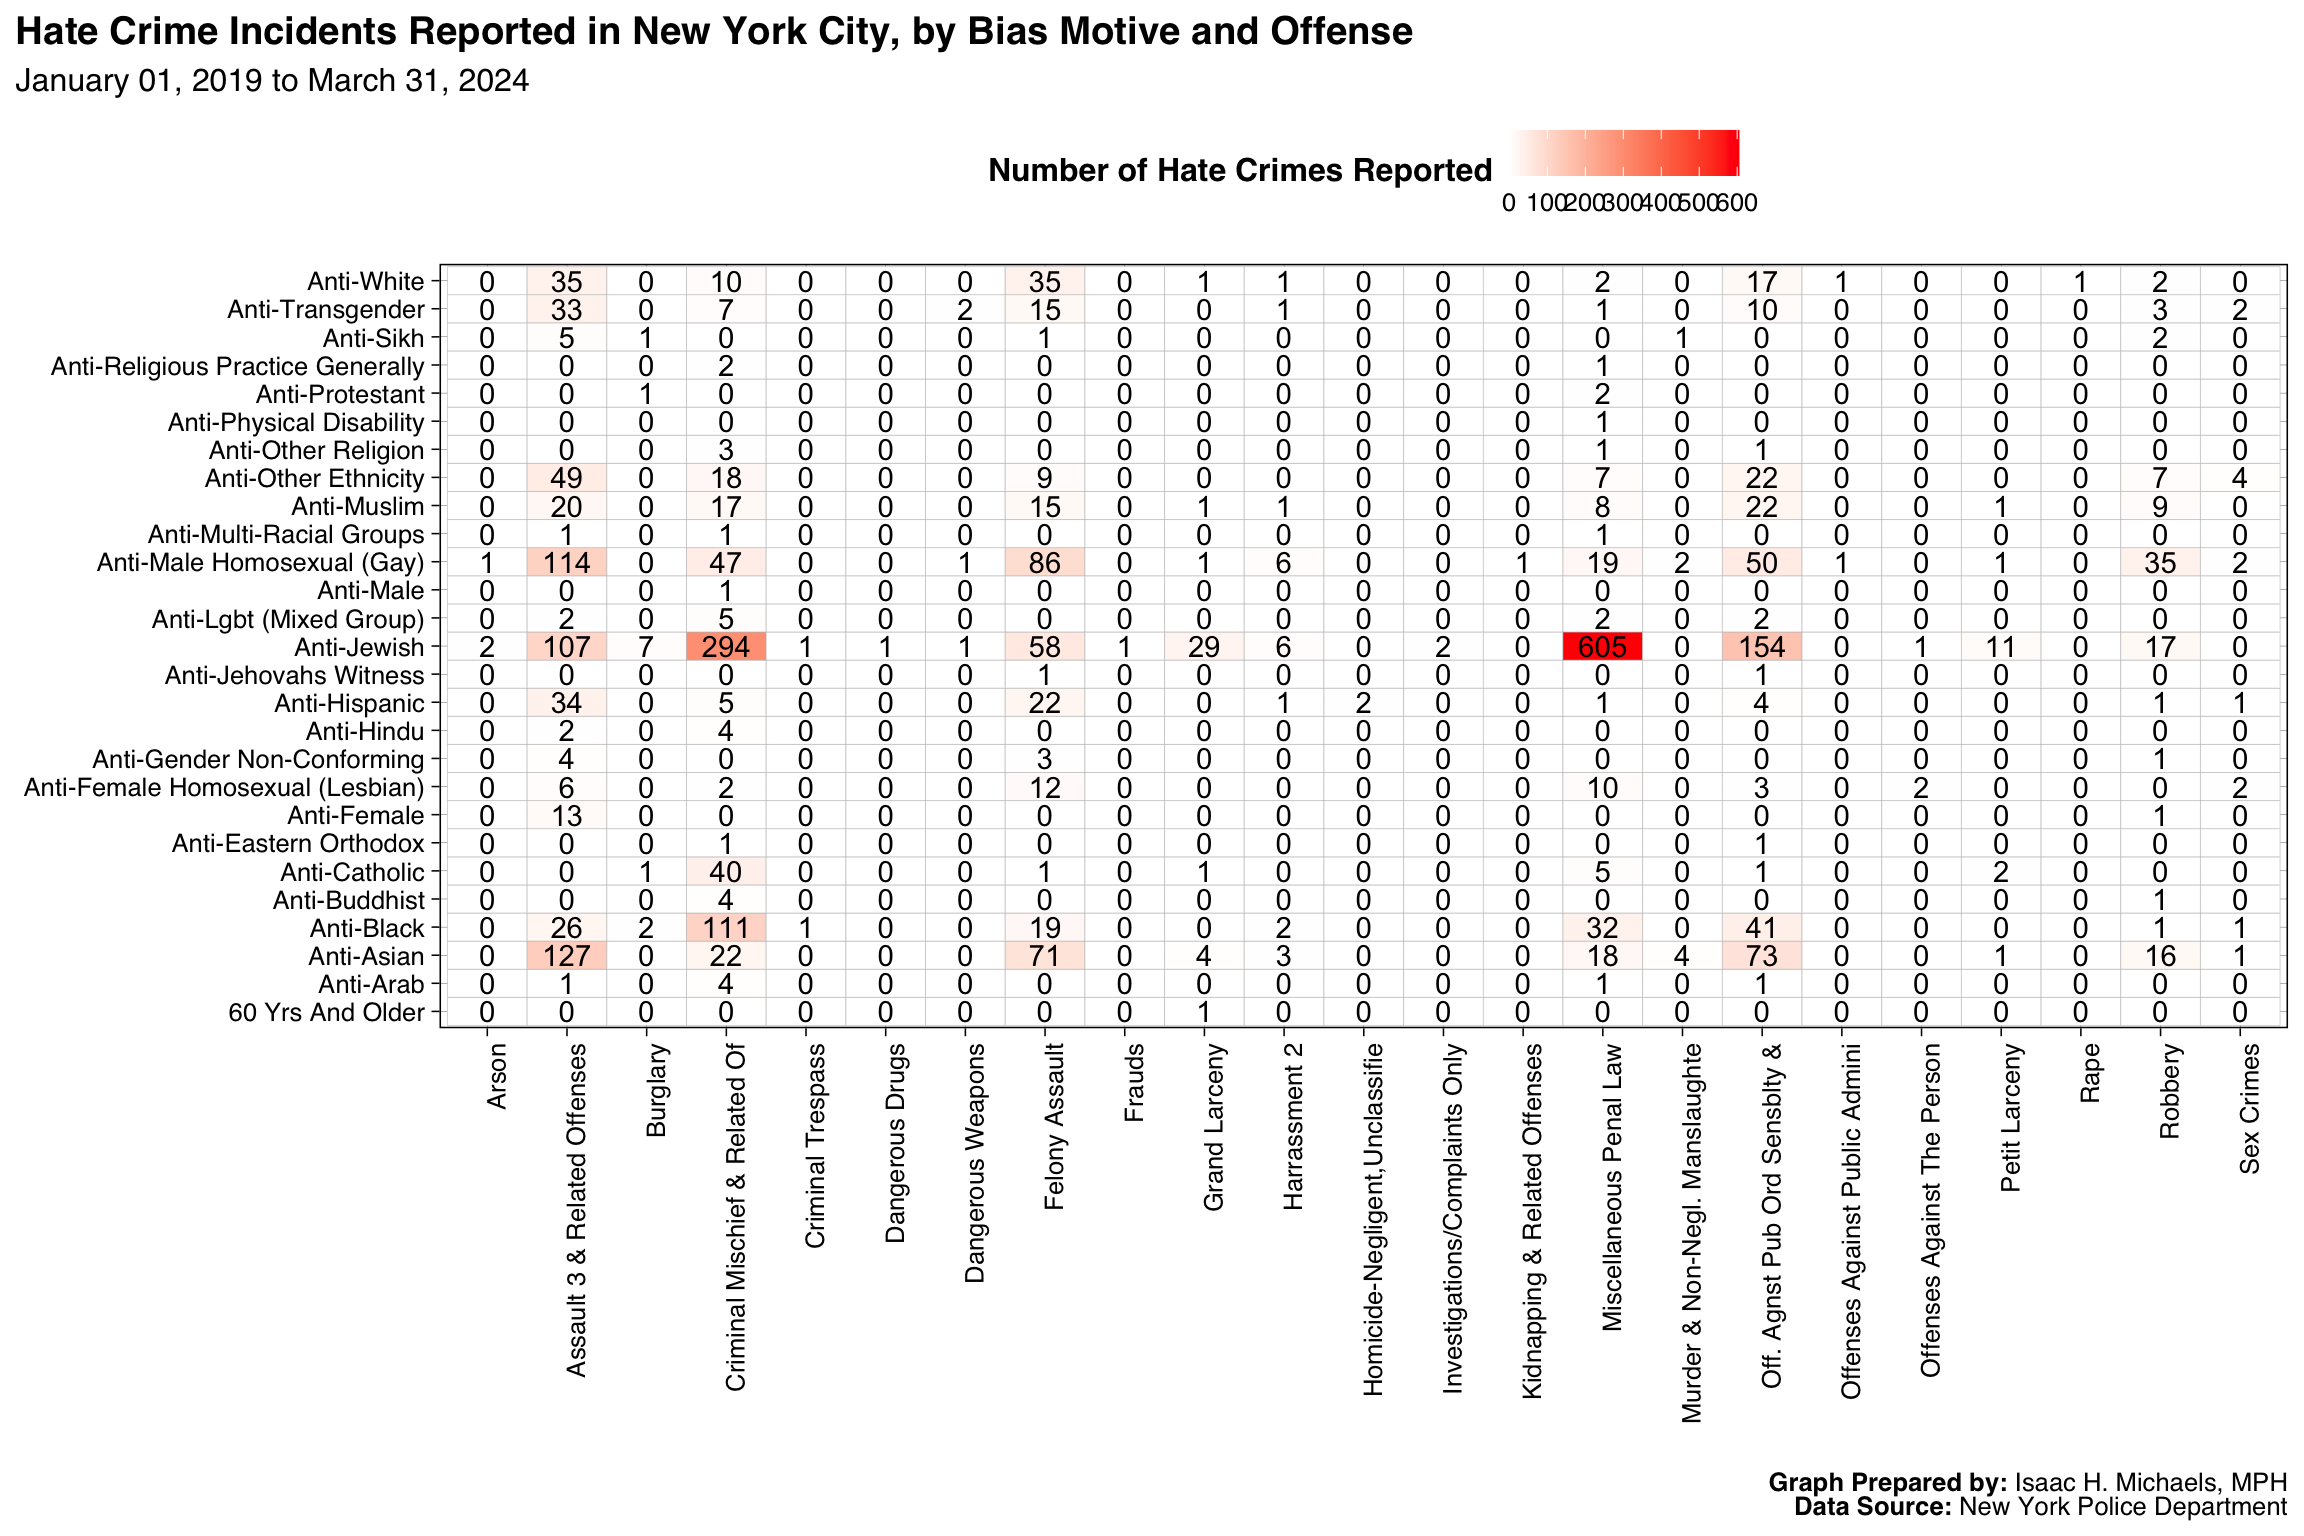
Heat Maps
Finally, the “Heat Maps” section contains a variety of heat maps that illustrate the distribution and trends of hate crimes by year, month, borough, offense, and bias motive. These heat maps allow you to see how hate crimes are distributed over time and by different factors, and to identify any patterns or trends that may exist.
Implications for Practice
The data visualizations on this page provide important insights into the distribution and trends of hate crimes in New York State and New York City. These insights can be useful for practitioners in the field in a number of ways.
First, the data can inform policies or programs to prevent hate crimes. For example, the data can help policymakers identify areas or groups that may be at higher risk of hate crimes, and develop targeted interventions to address these risks. The data can also be used to evaluate the effectiveness of different prevention strategies and to identify areas where additional resources may be needed.
Second, the data can help practitioners target resources or interventions to specific areas or groups. For example, the data can be used to identify areas or groups that have higher levels of hate crimes, and to prioritize resources or interventions in these areas. The data can also be used to identify any potential barriers or challenges that may be preventing interventions from being effective, and to develop strategies to address these barriers.
It is important to acknowledge that there may be limitations or challenges in using the data for practice. For example, the data may not capture all hate crimes that occur, or may not accurately reflect the true prevalence of hate crimes in a given area. It is also possible that the data may be subject to biases or errors that could affect its accuracy. To overcome these challenges, it may be necessary to use multiple data sources and to engage with local communities to gather additional information. By considering these limitations and challenges, practitioners can use the data more effectively to inform their work.
Maps
Statewide Trends
New York City
Monthly Trends
Heat Maps
Bias Motive by Year
Hate Crimes Reported in New York City, by Bias Motive and Year
| Bias Motive | 2019 | 2020 | 2021 | 2022 | 2023 | 2024 | 2025 |
|---|---|---|---|---|---|---|---|
| Anti-Jewish | 252 | 126 | 215 | 279 | 343 | 370 | 75 |
| Anti-Male Homosexual (Gay) | 52 | 29 | 78 | 85 | 116 | 86 | 5 |
| Anti-Black | 37 | 36 | 41 | 56 | 56 | 42 | 10 |
| Anti-White | 28 | 10 | 20 | 14 | 33 | 11 | 2 |
| Anti-Muslim | 15 | 5 | 13 | 20 | 35 | 43 | 5 |
| Anti-Transgender | 13 | 4 | 20 | 14 | 20 | 15 | 3 |
| Anti-Hispanic | 9 | 1 | 9 | 17 | 34 | 17 | 1 |
| Anti-Other Ethnicity | 9 | 2 | 11 | 54 | 33 | 38 | 8 |
| Anti-Lgbt (Mixed Group) | 7 | 3 | 1 | 0 | 0 | 0 | 0 |
| Anti-Catholic | 6 | 9 | 9 | 12 | 11 | 14 | 0 |
| Anti-Female Homosexual (Lesbian) | 6 | 5 | 5 | 13 | 7 | 6 | 2 |
| Anti-Arab | 5 | 1 | 1 | 0 | 0 | 1 | 0 |
| Anti-Buddhist | 2 | 0 | 0 | 1 | 1 | 1 | 7 |
| Anti-Other Religion | 2 | 0 | 0 | 3 | 0 | 1 | 0 |
| Anti-Asian | 1 | 33 | 150 | 91 | 60 | 42 | 6 |
| Anti-Jehovahs Witness | 1 | 0 | 0 | 1 | 0 | 0 | 0 |
| Anti-Multi-Racial Groups | 1 | 2 | 0 | 0 | 0 | 0 | 0 |
| Anti-Physical Disability | 1 | 0 | 0 | 0 | 0 | 0 | 0 |
| 60 Yrs And Older | 0 | 1 | 0 | 0 | 0 | 3 | 0 |
| Anti-Eastern Orthodox | 0 | 0 | 0 | 2 | 0 | 0 | 0 |
| Anti-Female | 0 | 11 | 3 | 0 | 0 | 11 | 0 |
| Anti-Gender Non-Conforming | 0 | 2 | 4 | 0 | 2 | 1 | 0 |
| Anti-Hindu | 0 | 2 | 0 | 4 | 0 | 0 | 0 |
| Anti-Male | 0 | 0 | 0 | 0 | 1 | 0 | 0 |
| Anti-Mormon | 0 | 0 | 0 | 0 | 0 | 2 | 0 |
| Anti-Protestant | 0 | 0 | 0 | 1 | 1 | 4 | 1 |
| Anti-Religious Practice Generally | 0 | 2 | 0 | 1 | 0 | 0 | 0 |
| Anti-Sikh | 0 | 0 | 0 | 4 | 5 | 1 | 0 |
Graph Prepared by: Isaac H. Michaels, MPH
Data Source: NYC Open Data
Bias Motive by Offense by Borough
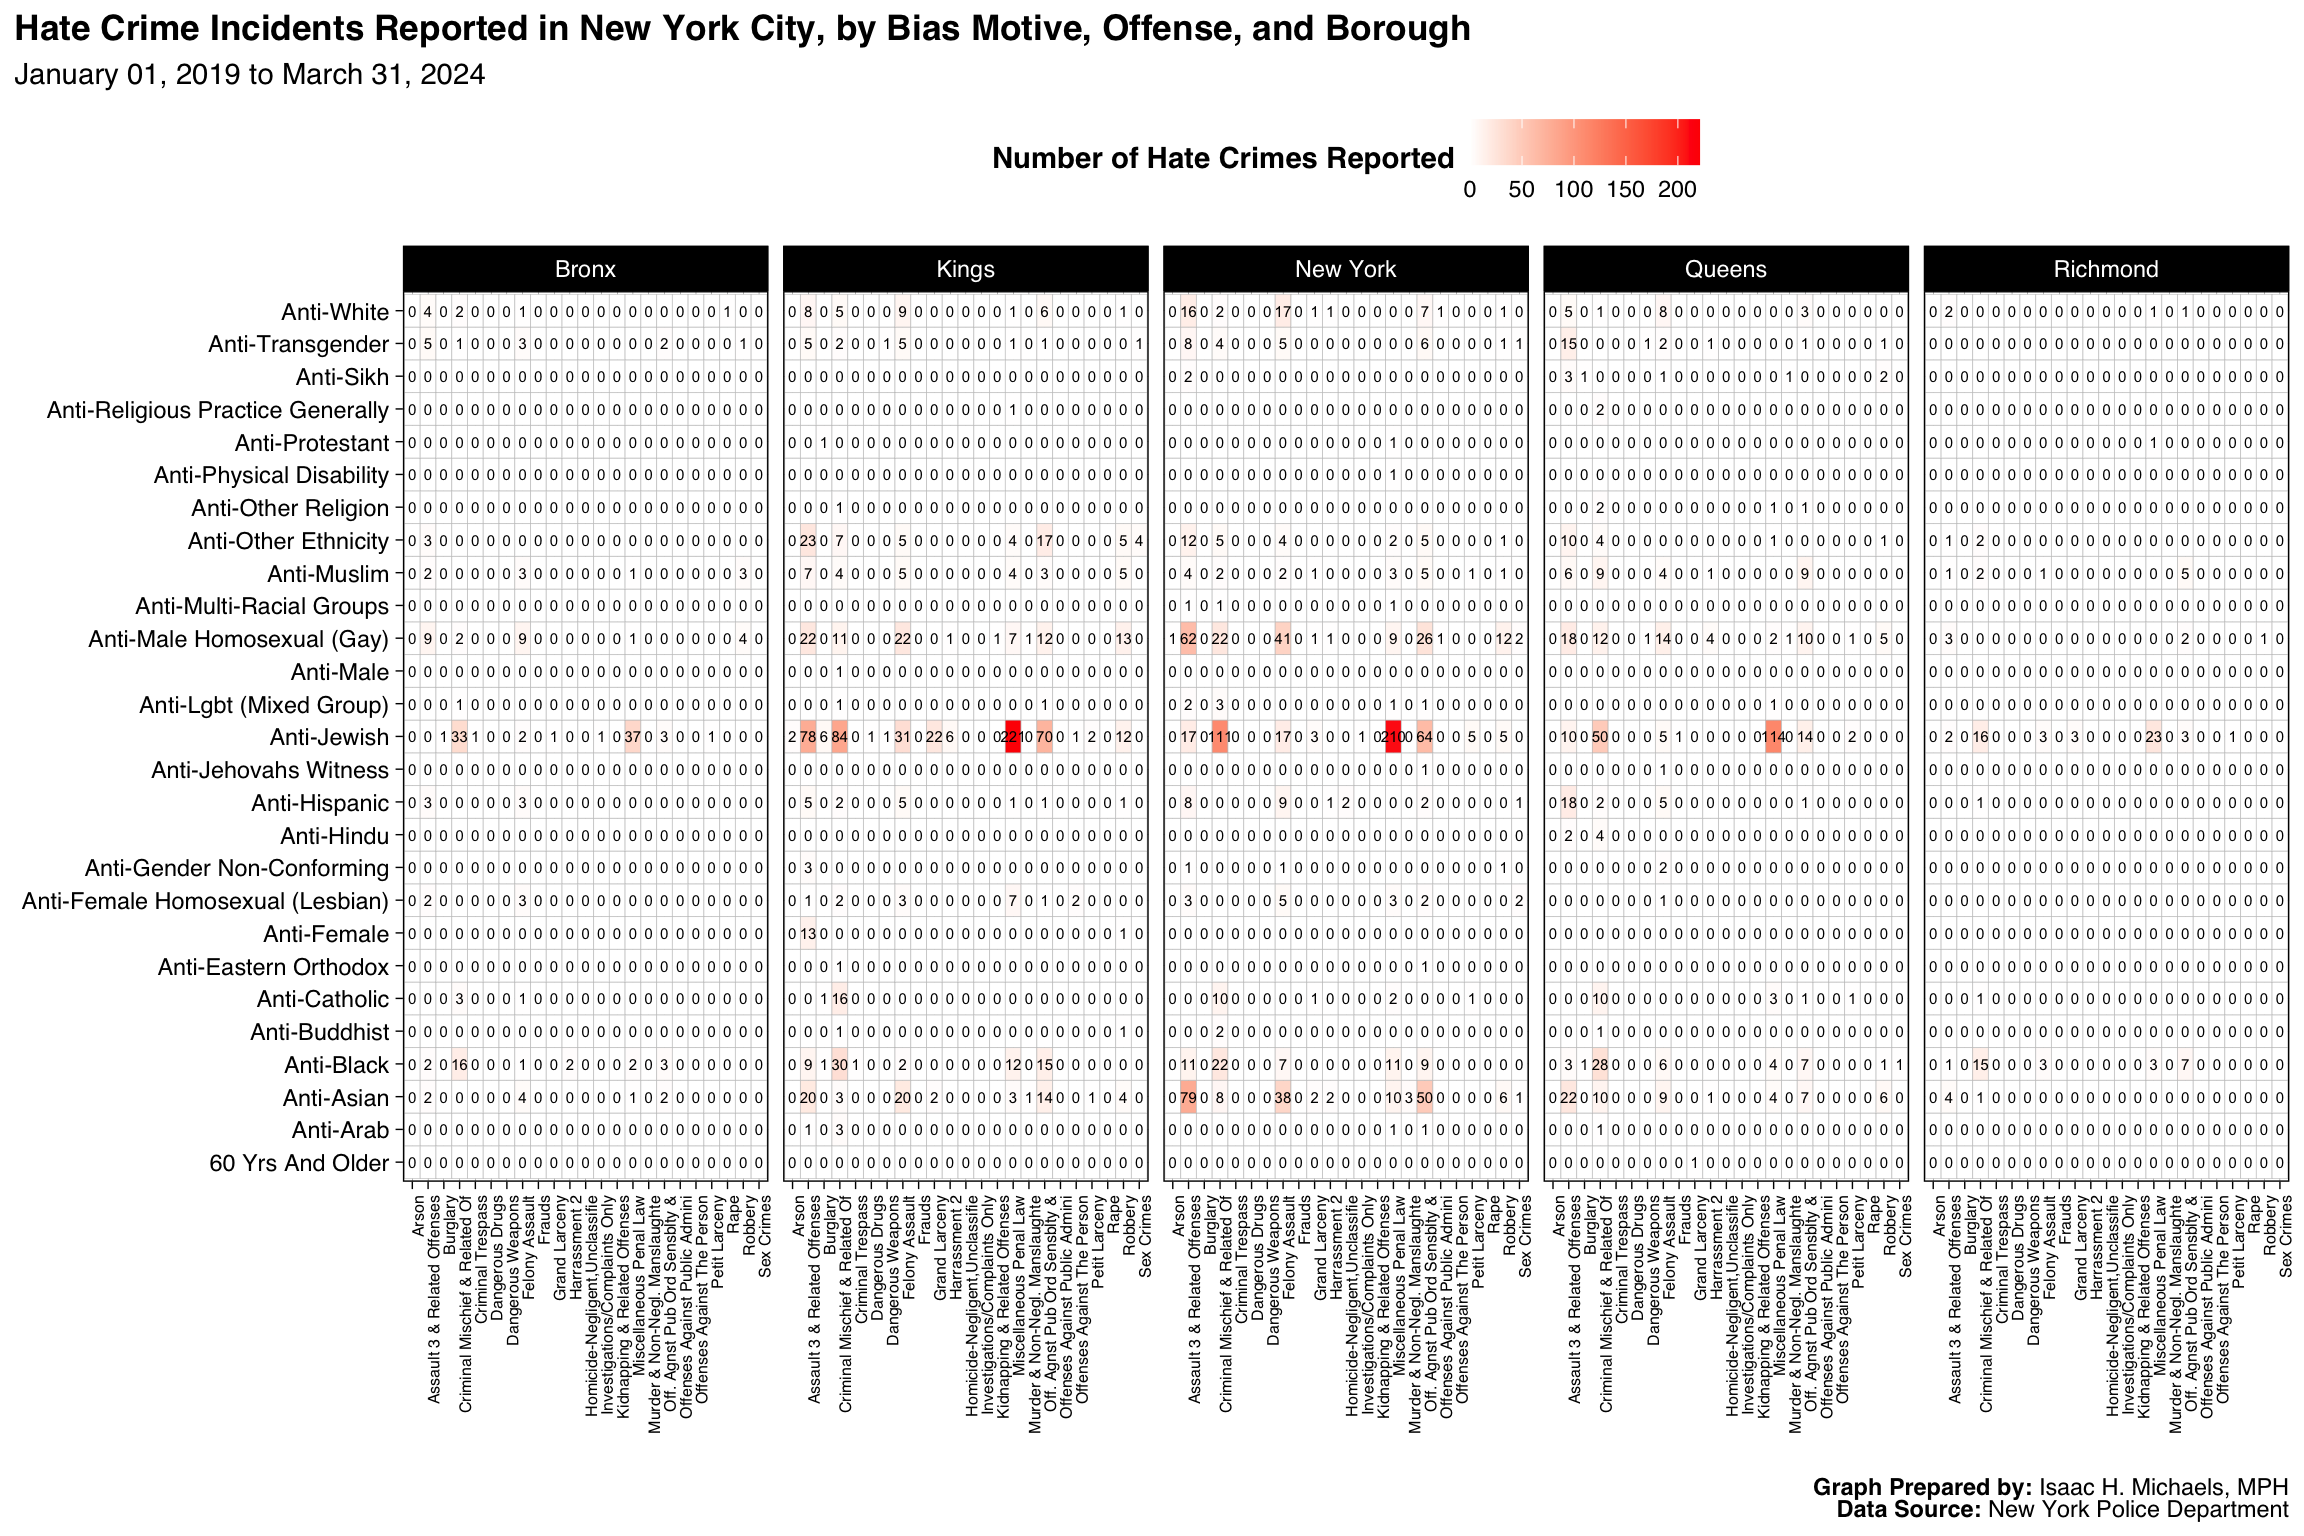
Graph Prepared by: Isaac H. Michaels, MPH
Data Source: NYC Open Data
About These Data
New York State Data
Description excerpted from https://data.ny.gov/api/views/6xda-q7ev/files/355bf2bb-4023-45fa-adbd-8ac01bfc2c2d?download=true&filename=DCJS_HateCrime_Overview.pdf:
Hate crime data is collected from more than 500 New York State police and sheriff’s departments. Each month, participating agencies summarize reported incidents that were motivated by a bias. This reported offense data is submitted to DCJS in either a standard electronic data file or a hard copy report form. These reports are reviewed by DCJS personnel for completeness and accuracy before being added to the statewide database and submitted to the FBI. While DCJS strongly encourages agencies to contribute to the UCR program, participation is not mandatory. To report a crime or charge an arrest, police agencies must document the elements of a crime. Hate crime is classified based on what motivated the crime, in addition to the elements of the crime. If the investigating officer does not identify a bias motivation, or does not reflect a bias motivation on the official incident report, the incident will not be reported to DCJS as a hate crime. Additionally, this dataset is limited to the crimes reported to police agencies and may not reflect the total crimes that occurred. Because hate crimes are relatively rare, many agencies receive no hate crime reports in a given month or year.
New York City Data
Dataset and meta data are available here: https://data.cityofnewyork.us/Public-Safety/NYPD-Hate-Crimes/bqiq-cu78