- Welcome
- Data Overview
- How to Use These Data
- Why are these data important?
- What do these data show?
- What do these data not show?
- What can you do to protect yourself and your community?
- Laboratory-Confirmed Cases of Influenza in New York State
- Syndromic Surveillance: Influenza-like Ilness (ILI) and/or Pneumonia in New York City
- Mortality
- Influenza Vaccination Coverage
Published: November 8, 2022
Updated: May 24, 2024 at 04:55PM
Welcome
Welcome to this data tracker on Influenza in New York State and New York City. This page is updated on a weekly basis and provides a comprehensive overview of the current state of influenza in both New York State and New York City.
Data Overview
Data on Laboratory-Confirmed Influenza Cases
- On this page, you will find trend graphs displaying the number of laboratory-confirmed influenza cases in New York State overall, by region, and by county.
- These graphs allow you to track the spread of influenza across the state and understand the impact it is having on different areas.
- The data are provided by the New York State Department of Health through the Health Data NY open data platform.
It includes weekly counts of laboratory-confirmed influenza cases by county and influenza type, beginning with the 2009-10 season.
- The cases reported in the data meet the New York State Department of Health’s standardized case definition, which includes positive results on various influenza laboratory tests such as rapid diagnostic tests, immunofluorescence assays, and reverse transcriptase polymerase chain reaction tests.
- The data are collected during the Centers for Disease Control and Prevention’s defined influenza surveillance season, which runs from week 40 through week 20 of the following calendar year (October through mid-May).
- Data Limitations:
- It is important to note that the data may be an undercount of the true number of influenza cases because it only includes cases where the patient seeks medical care, an appropriate specimen is collected for testing, the testing is performed in a clinical laboratory that reports results to the state, and the test results are positive.
- Additionally, certain tests such as rapid diagnostic tests may have limited accuracy and can produce false negative or false positive results.
Data on Emergency Department Visits and Hospitalizations for Influenza-Like Illness
- You will also find trend graphs displaying the number of emergency department visits and hospitalizations for influenza-like illness (ILI) in New York City.
- These graphs provide valuable insights into the severity of influenza in the city and can help inform public health decision-making.
- The data are provided by the New York City Department of Health and Mental Hygiene through the NYC Open Data platform.
- It includes the number of emergency department visits and hospitalizations for influenza-like illness on a weekly basis.
Influenza-like illness is defined as a fever of 100.4 degrees Fahrenheit or higher, cough, and/or sore throat, in the absence of a known cause other than influenza.
- The data may be collected from hospitals, emergency departments, or other healthcare facilities within the city.
Data on Flu Vaccination Coverage
- Finally, this page also provides trend graphs showing flu vaccination coverage in New York State, New York City, and New York State excluding New York City, broken down by age group.
- These graphs allow you to track vaccination rates in different parts of the state and city and understand which age groups are receiving the most vaccinations.
- The data are provided by the Centers for Disease Control and Prevention through the data.CDC.gov platform.
- It includes vaccination coverage data from the National Immunization Survey-Flu and the Behavioral Risk Factor Surveillance System for the general population at the national, regional, and state levels by age group and race/ethnicity.
- The data are collected on a yearly basis
Data on Influenza Mortality
- The mortality data displayed on this page provide a detailed look at the number of deaths due to influenza in New York State, by week, region, and age group.
- The data are collected and reported by the National Center for Health Statistics (NCHS) and are based on death certificates that have been reported to NCHS by week ending date, by state and HHS region, and age group.
- The data are updated on a weekly basis.
How to Use These Data
- The trend graphs on this page provide a visual representation of the current state of influenza in New York State and New York City.
- By tracking the number of laboratory-confirmed cases, emergency department visits and hospitalizations for influenza-like illness, and vaccination coverage rates over time, readers can gain a better understanding of the impact of influenza in these areas.
- The data displayed in the graphs on this page can be used to track the number of deaths due to influenza, pneumonia, and COVID-19 in New York State over time. The bar graph shows the number of deaths by week, while the grid of panels shows the number of deaths by region and age group. By comparing the number of deaths due to these conditions over time, users can gain insight into the overall impact of these diseases on the population.
- These data can be useful for individuals looking to protect themselves and their families from influenza by understanding the current level of activity in their region and taking appropriate precautions such as getting vaccinated.
- Public health officials and policymakers can also use these data to inform decision-making and allocate resources to address influenza outbreaks.
- It is important to keep in mind the limitations of these data when interpreting the trends and making decisions based on the information presented.
- Readers are encouraged to also consult other sources of information on influenza, such as the Centers for Disease Control and Prevention’s FluView data and recommendations, to get a more comprehensive understanding of the situation.
Why are these data important?
Influenza, commonly known as the flu, is a highly contagious respiratory illness that can lead to serious complications and even death. Each year, millions of people in the United States contract the flu, and it is estimated that the flu causes hundreds of thousands of hospitalizations and tens of thousands of deaths annually. Tracking and understanding the spread of influenza is important for several reasons:
- To protect public health: By monitoring the prevalence and severity of influenza, public health officials can identify outbreaks, implement prevention and control measures, and allocate resources to address the impact of influenza on communities.
- To inform vaccination efforts: Vaccination is the most effective way to prevent influenza and its complications. By tracking vaccination coverage rates and identifying any gaps in coverage, public health officials can target efforts to increase vaccination rates and reduce the burden of influenza.
- To support individual and community decision-making: By understanding the current level of influenza activity in their region, individuals and communities can make informed decisions about how to protect themselves and their loved ones from influenza. For example, individuals may choose to get vaccinated or take extra precautions to prevent the spread of the flu, such as washing their hands frequently or staying home when sick.
Overall, tracking and understanding influenza is crucial for protecting public health and minimizing the impact of this highly contagious and potentially serious illness.
What do these data show?
The data presented on this page provide insights into the prevalence and impact of influenza in New York State and New York City:
- Laboratory-confirmed influenza cases: These data show the number of laboratory-confirmed cases of influenza by county and region in New York State. These data can help to identify areas of higher influenza activity and inform public health efforts to address outbreaks.
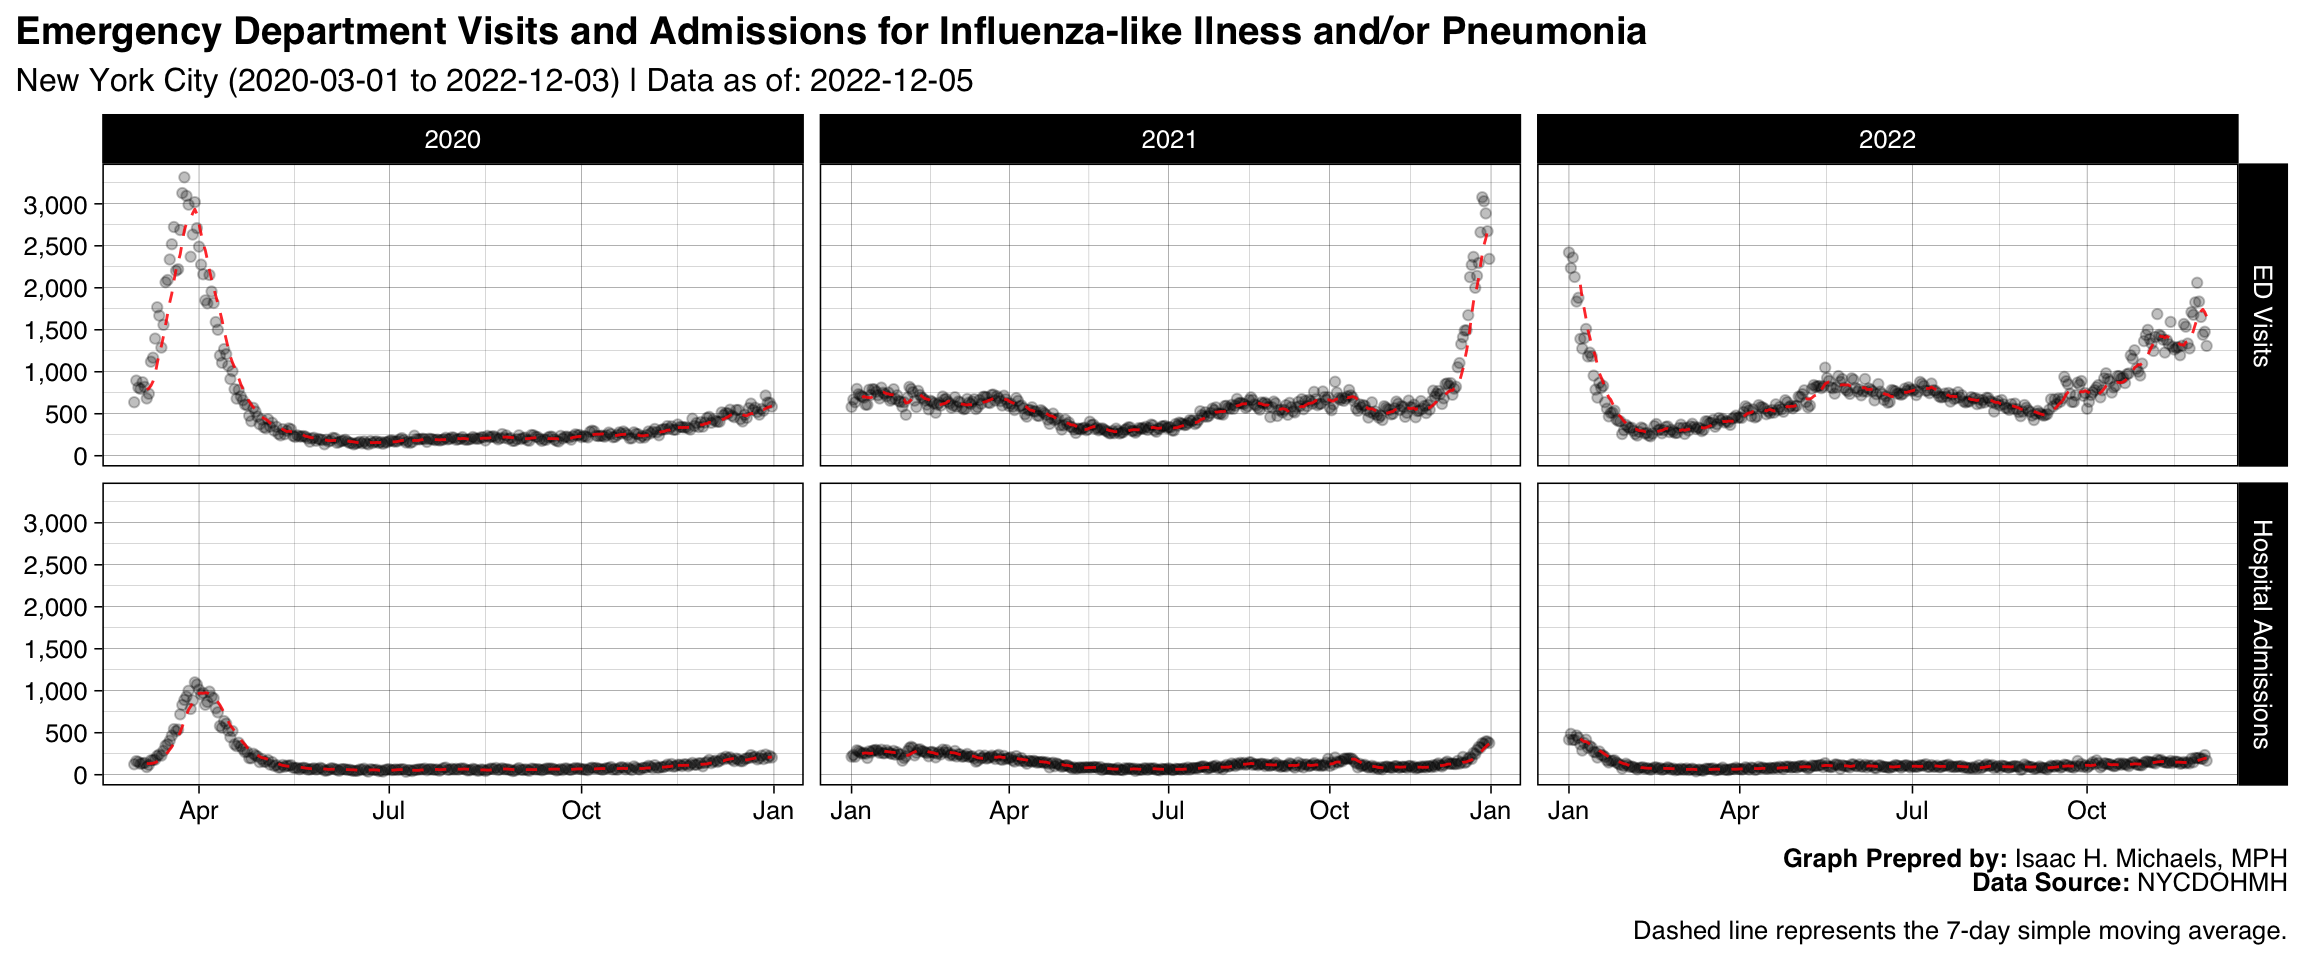
- ED visits and hospitalizations for influenza-like illness (ILI): These data show the number of emergency department visits and hospitalizations in New York City that are related to influenza-like illness. These data can help to understand the burden of influenza on the healthcare system and identify areas where additional resources may be needed.
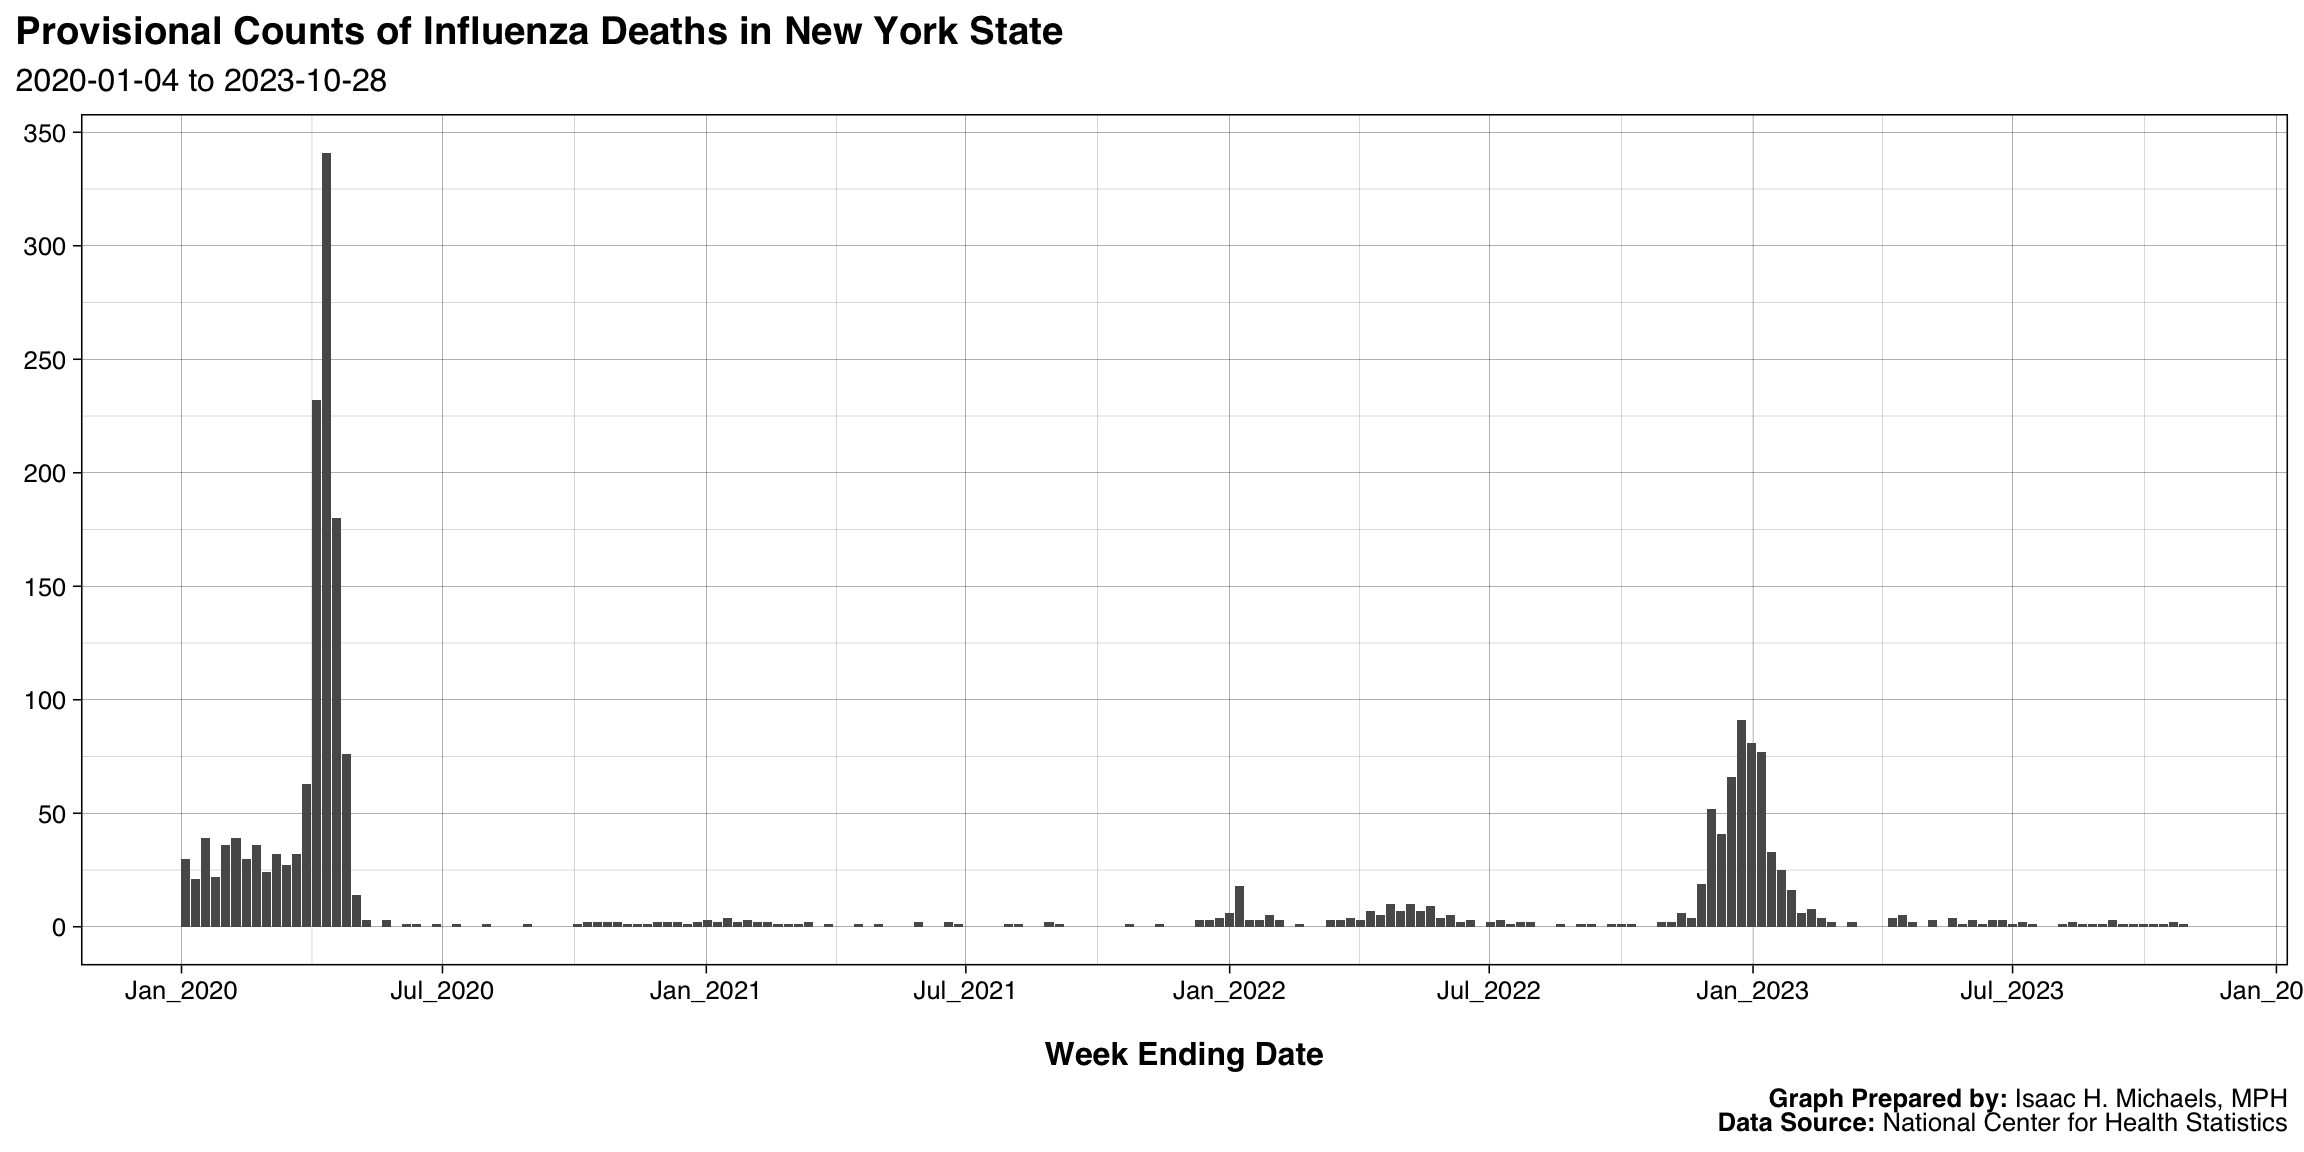
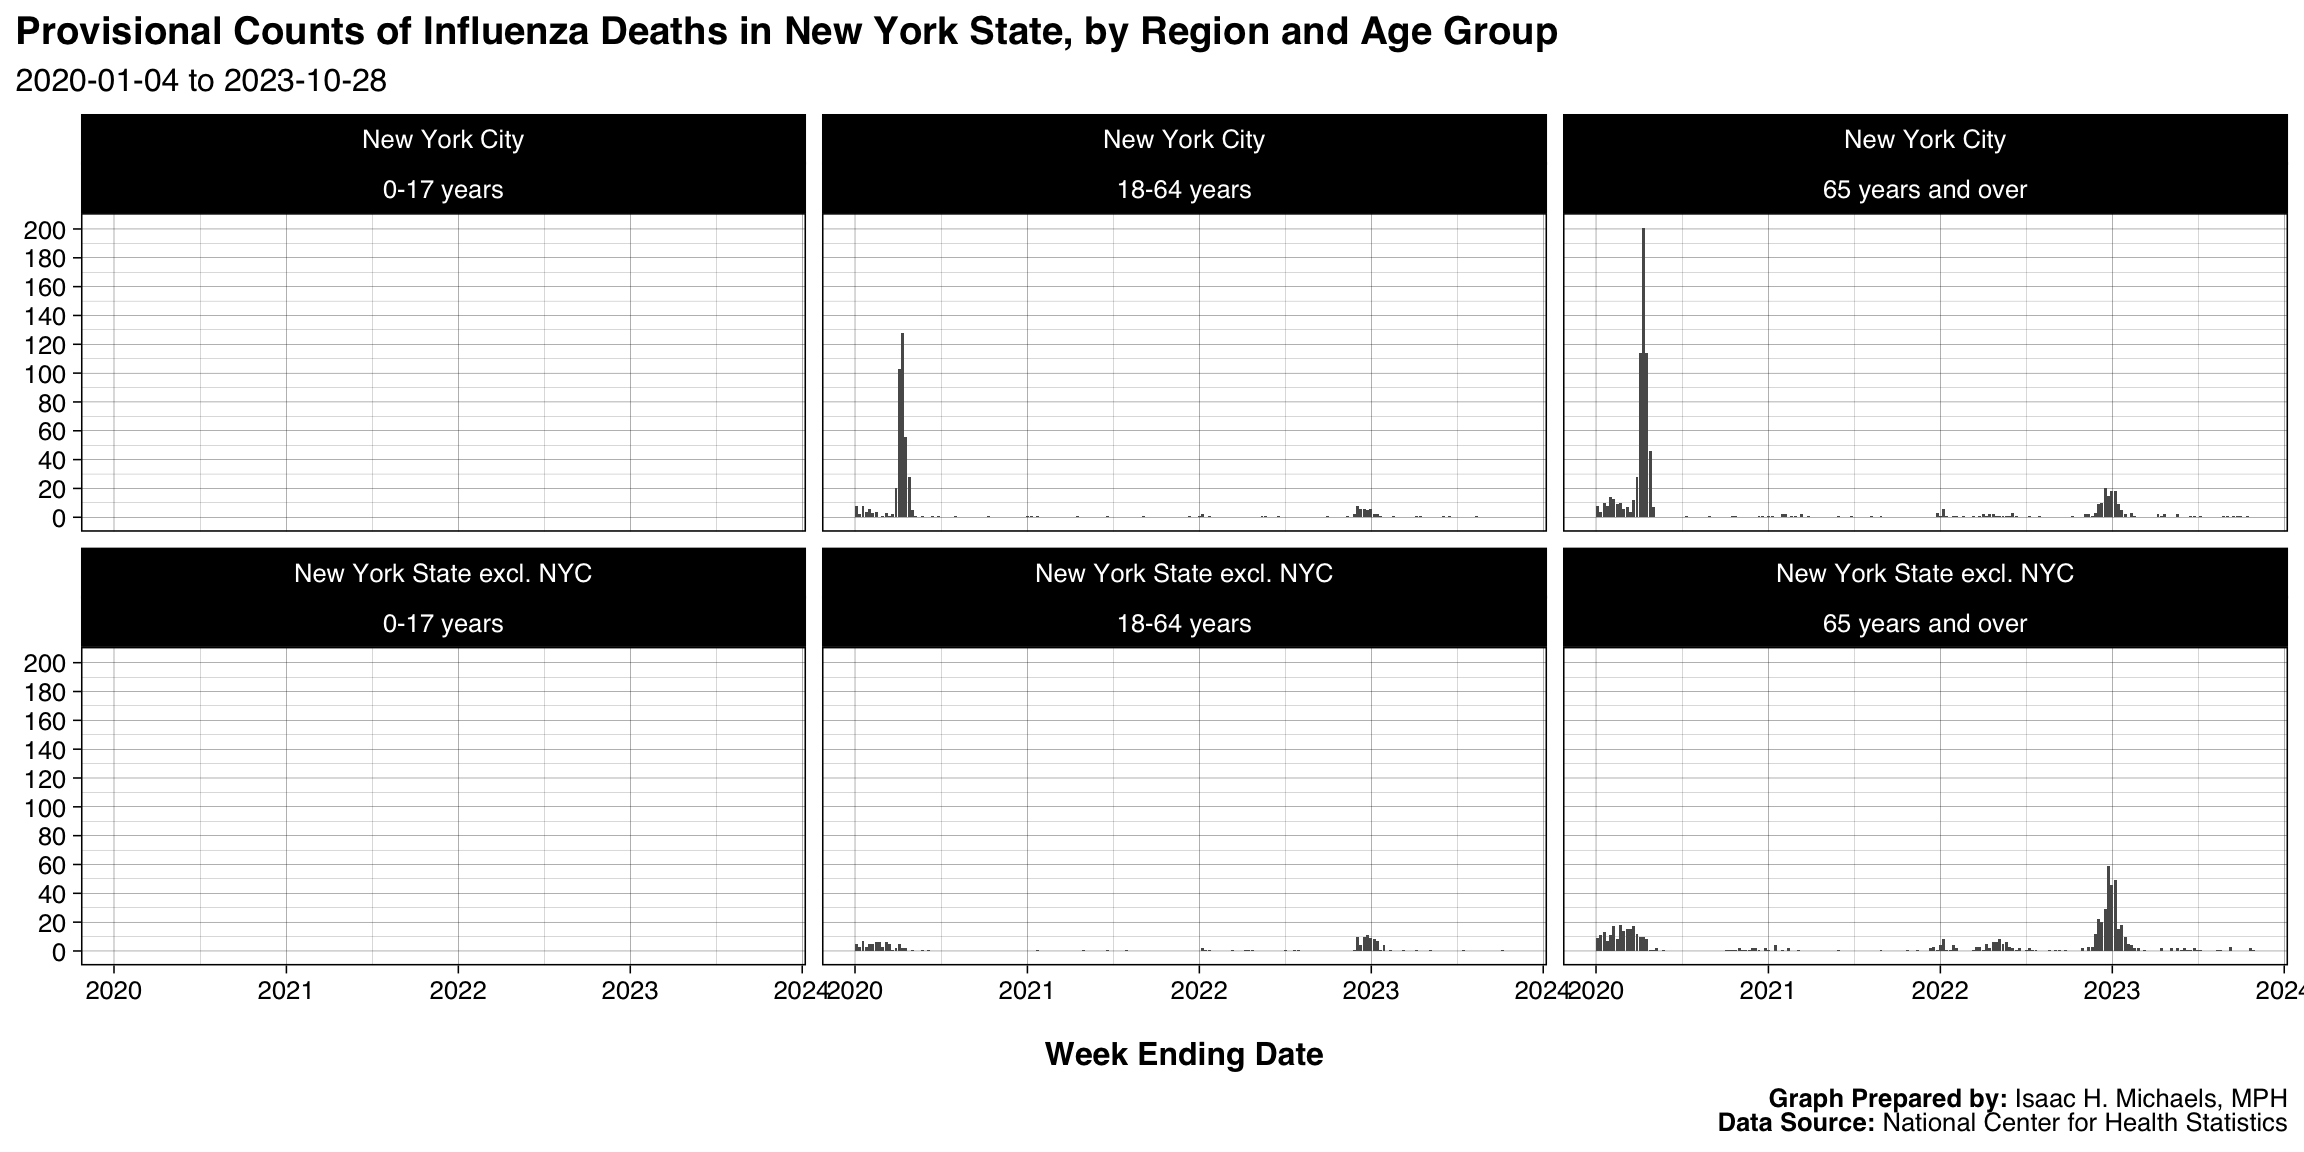
- Influenza mortality data: The data displayed in the graphs on this page show the number of deaths due to influenza, pneumonia, and COVID-19 in New York State over time. The bar graph shows the number of deaths by week, while the grid of panels shows the number of deaths by region and age group. By comparing the number of deaths due to these conditions over time, users can gain insight into the overall impact of these diseases on the population.
- Flu vaccination coverage: These data show the percentage of the population that has received a flu vaccination in New York State, New York City, and New York State excluding New York City. These data can help to identify any gaps in vaccination coverage and inform efforts to increase vaccination rates.
Overall, these data provide a snapshot of the current influenza situation in New York State and New York City, and can help to inform decision-making and public health efforts to reduce the impact of influenza.
What do these data not show?
It is important to note that the data presented on this page do not provide a complete picture of influenza in New York State and New York City. There are several limitations to consider when interpreting these data:
- Laboratory-confirmed cases: These data represent only those cases of influenza that have been confirmed through laboratory testing. It is likely that many more people have contracted influenza but have not been tested or reported. In addition, these data do not include cases of influenza that were not identified as such by healthcare providers, or cases that were not tested using a reliable assay.
- ED visits and hospitalizations: These data represent only those cases of influenza-like illness that resulted in a visit to the emergency department or hospitalization. It is likely that many more people have experienced influenza-like illness but have not sought medical care.
- While the data displayed in the graphs on this page provide a detailed look at the number of deaths due to influenza, pneumonia, and COVID-19 in New York State, they do not provide information on the underlying causes of these deaths or on other factors that may contribute to these deaths. Additionally, the data do not provide information on the number of people who have been infected with these diseases or on the number of people who have recovered from them.
- Flu vaccination coverage: These data represent self-reported vaccination status, and may not accurately reflect actual vaccination rates. In addition, these data do not include information on the effectiveness of the vaccines that were administered.
Overall, it is important to consider these limitations when interpreting the data presented on this page, and to use these data in conjunction with other sources of information to get a more complete understanding of the influenza situation in New York State and New York City.
What can you do to protect yourself and your community?
There are several steps that you can take to protect yourself and your community from influenza:
- Get vaccinated: The most effective way to prevent influenza is to get a flu vaccine. Flu vaccines are available from a variety of sources, including healthcare providers, pharmacies, and local health departments.
- Wash your hands frequently: Washing your hands with soap and water for at least 20 seconds is an effective way to reduce the spread of influenza and other respiratory illnesses.
- Avoid close contact with people who are sick: If you are feeling ill, it is important to stay home and avoid contact with others to prevent the spread of illness.
- Cover your mouth and nose when you cough or sneeze: Use a tissue to cover your mouth and nose when you cough or sneeze, and then throw the tissue away. If you don’t have a tissue, use your elbow or shoulder to cover your mouth and nose.
- Wear a mask: Wearing a mask can help to reduce the spread of respiratory illnesses, including influenza.
- Stay home when you are sick: If you are feeling ill, it is important to stay home and avoid contact with others to prevent the spread of illness.
By following these simple steps, you can help to protect yourself and your community from influenza and other respiratory illnesses.
Laboratory-Confirmed Cases of Influenza in New York State
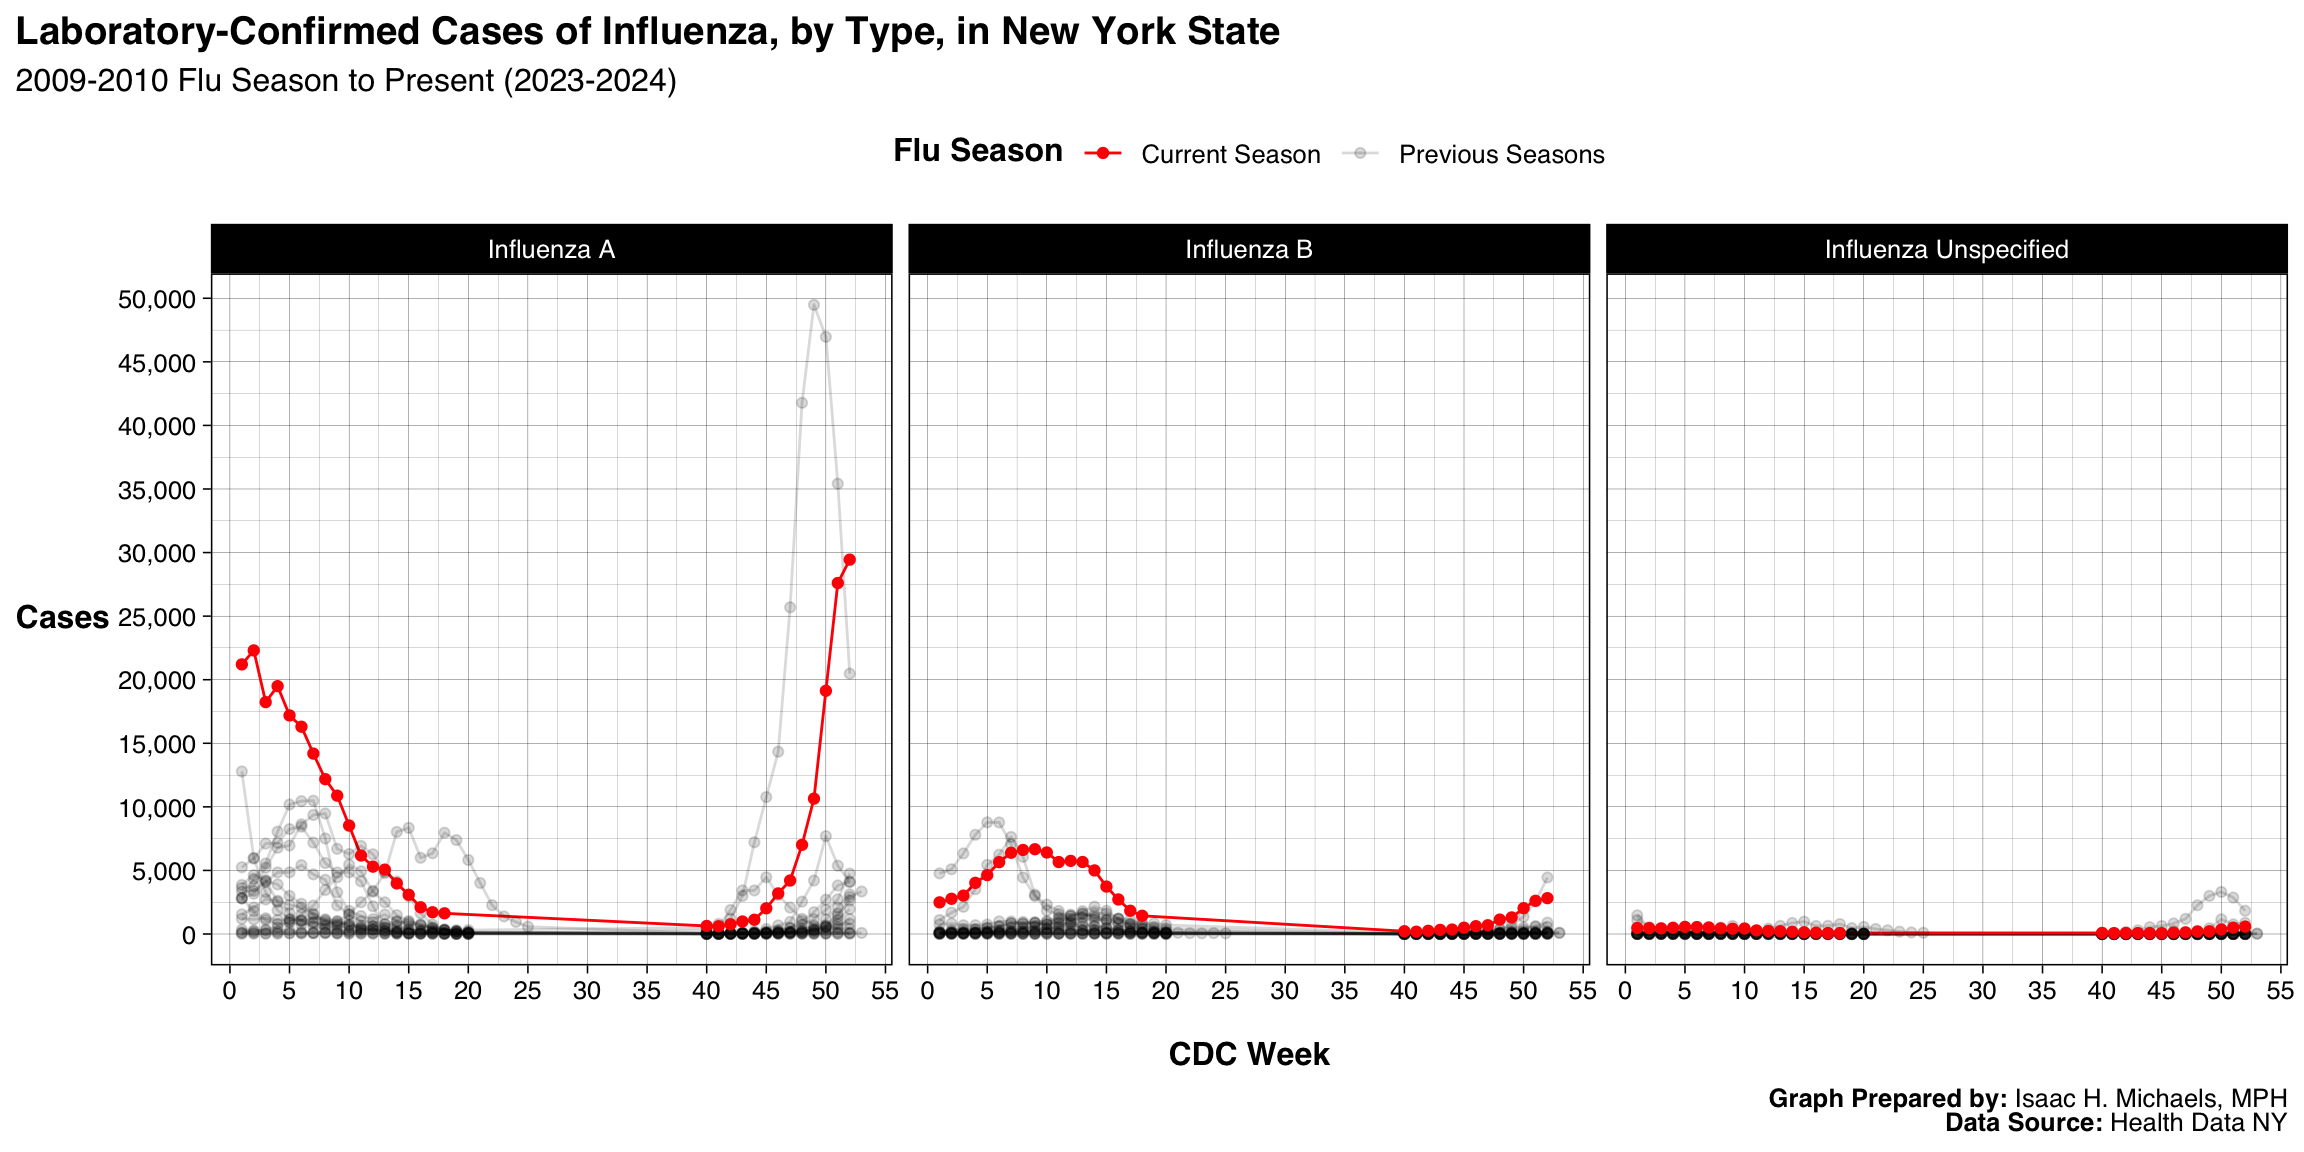 Graphs Prepared By:
 By Region
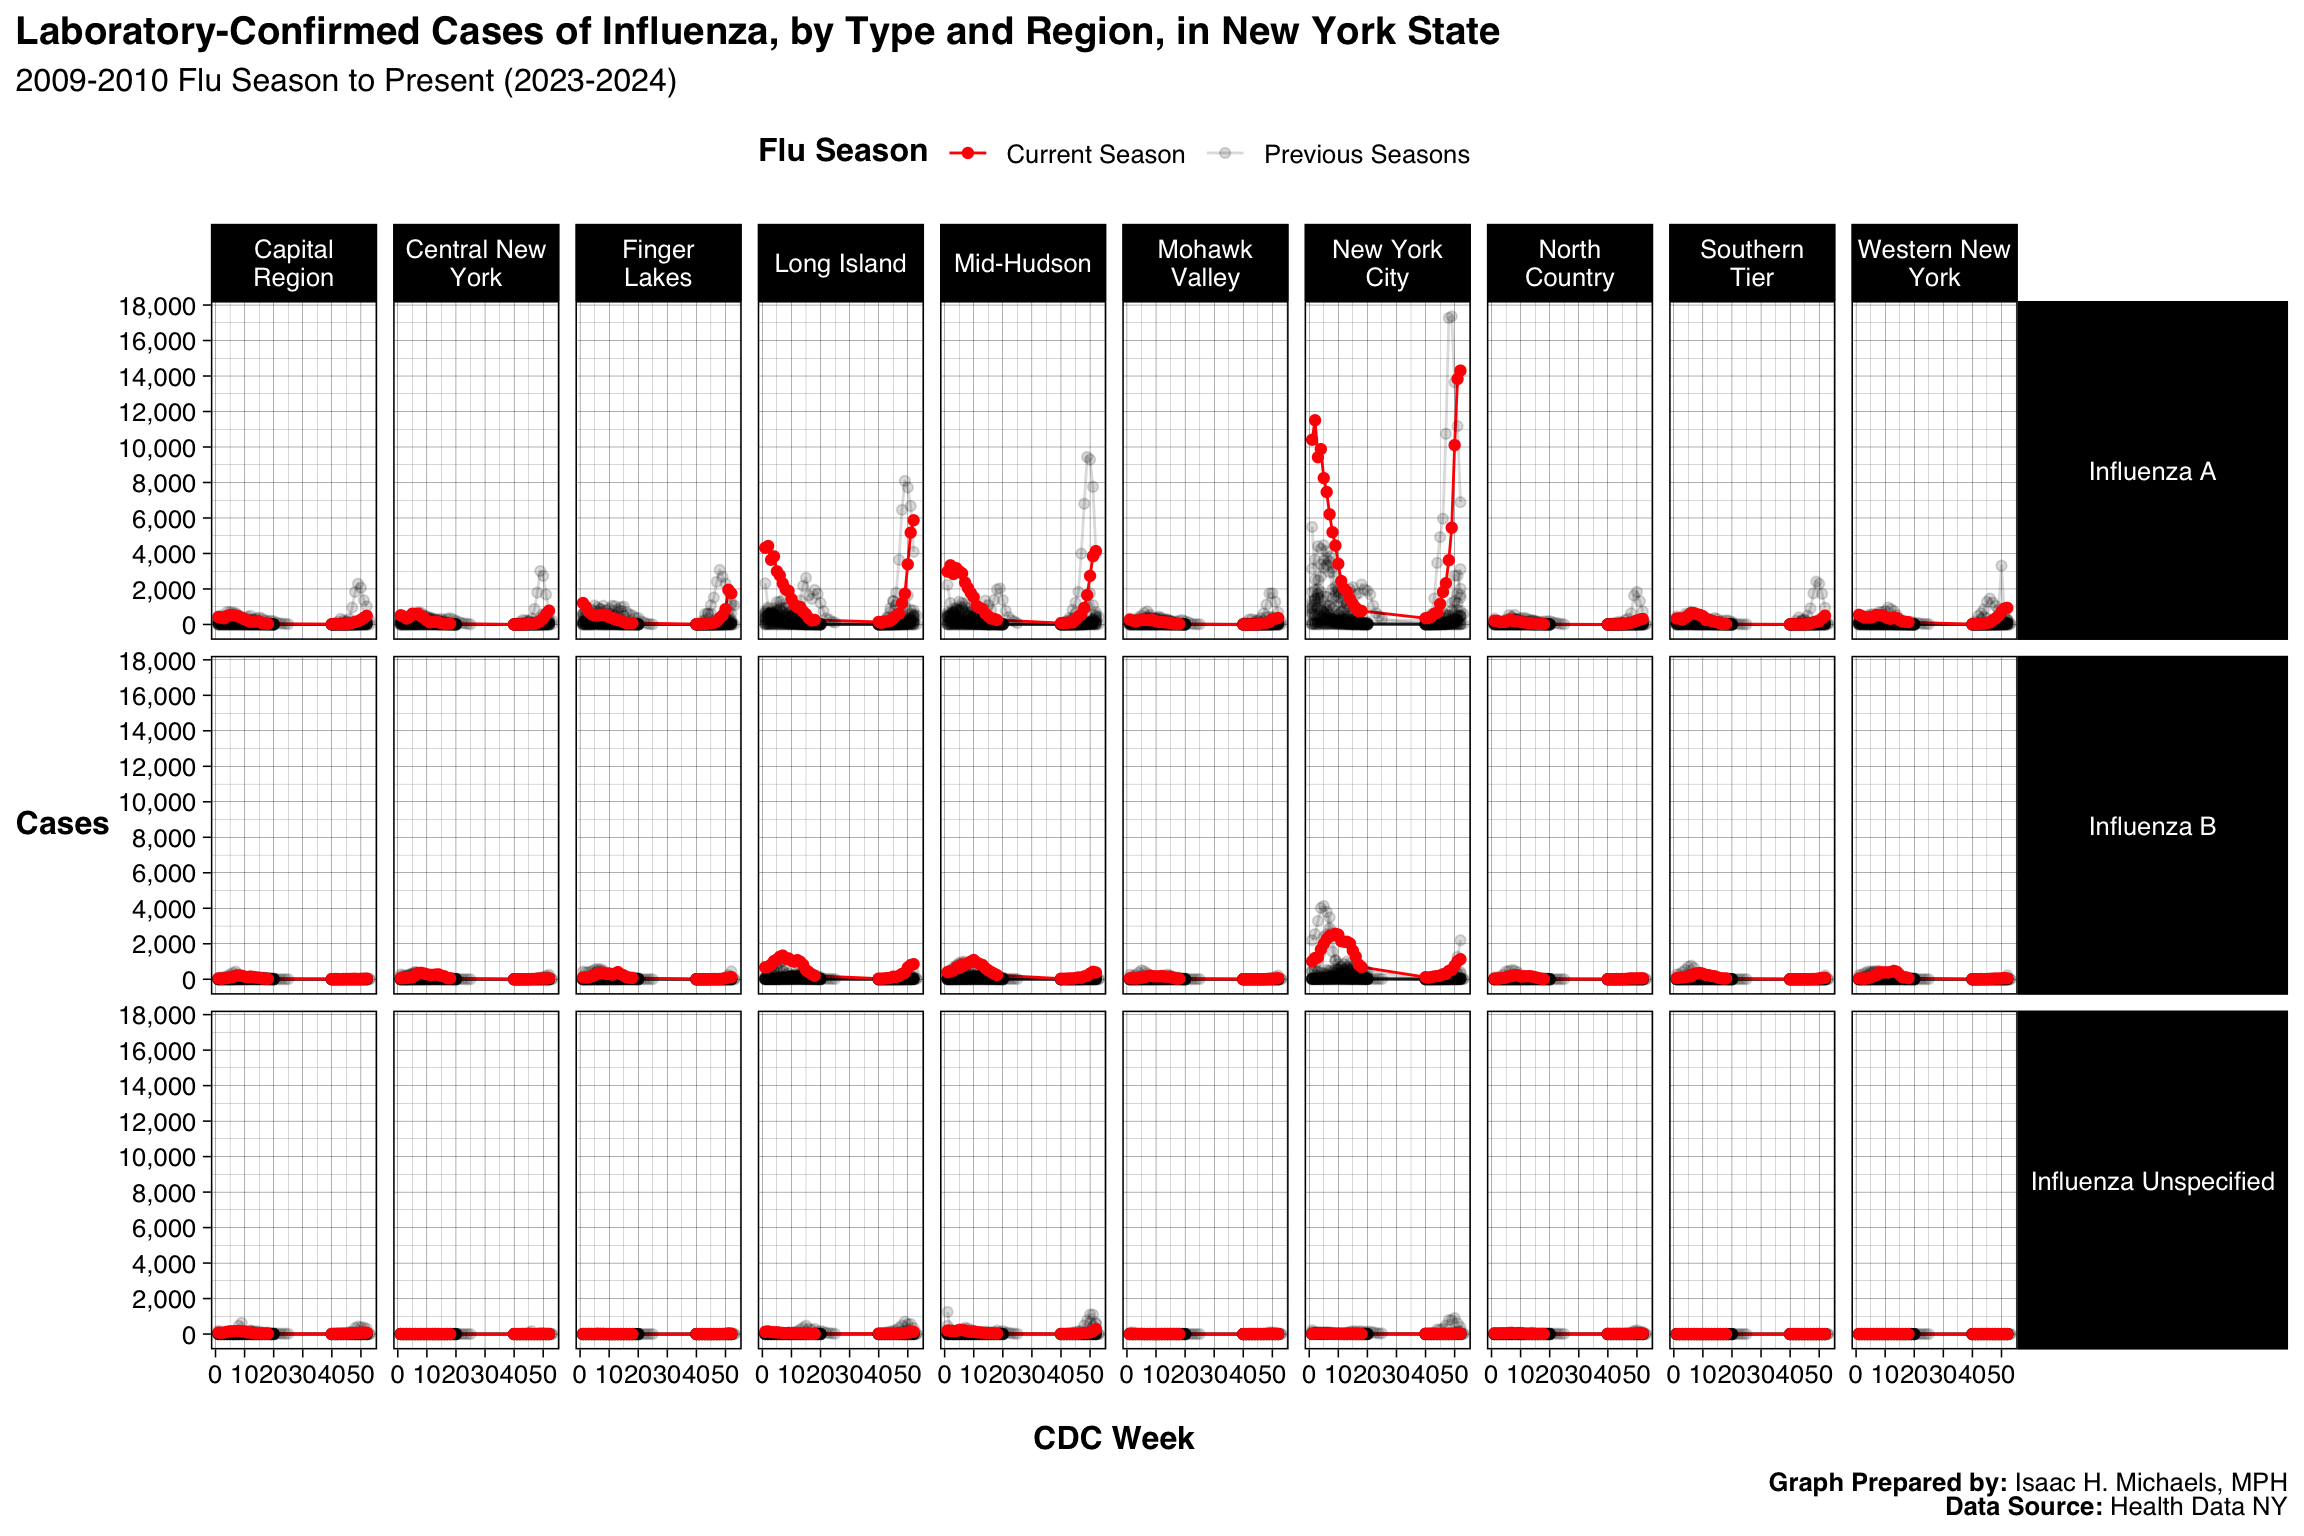 Graphs Prepared By: Isaac H. Michaels, MPH
Data Source: Health Data NY
Regions include the following counties:
Capital Region: Albany, Columbia, Greene, Saratoga, Schenectady, Rensselaer, Warren, Washington
Central New York: Cayuga, Cortland, Madison, Onondaga, Oswego
Finger Lakes: Genesee, Livingston, Monroe, Ontario, Orleans, Seneca, Wayne, Wyoming, Yates
Long Island: Nassau, Suffolk
Mid-Hudson: Dutchess, Orange, Putnam, Rockland, Sullivan, Ulster, Westchester
Mohawk Valley: Fulton, Herkimer, Montgomery, Oneida, Otsego, Schoharie
New York City: Bronx, Kings, New York, Richmond, Queens
North Country: Clinton, Essex, Franklin, Hamilton, Jefferson, Lewis, St. Lawrence
Southern Tier: Broome, Chemung, Chenango, Delaware, Schuyler, Steuben, Tioga, Tompkins
Western New York: Allegany, Cattaraugus, Chautauqua, Erie, Niagara
By County
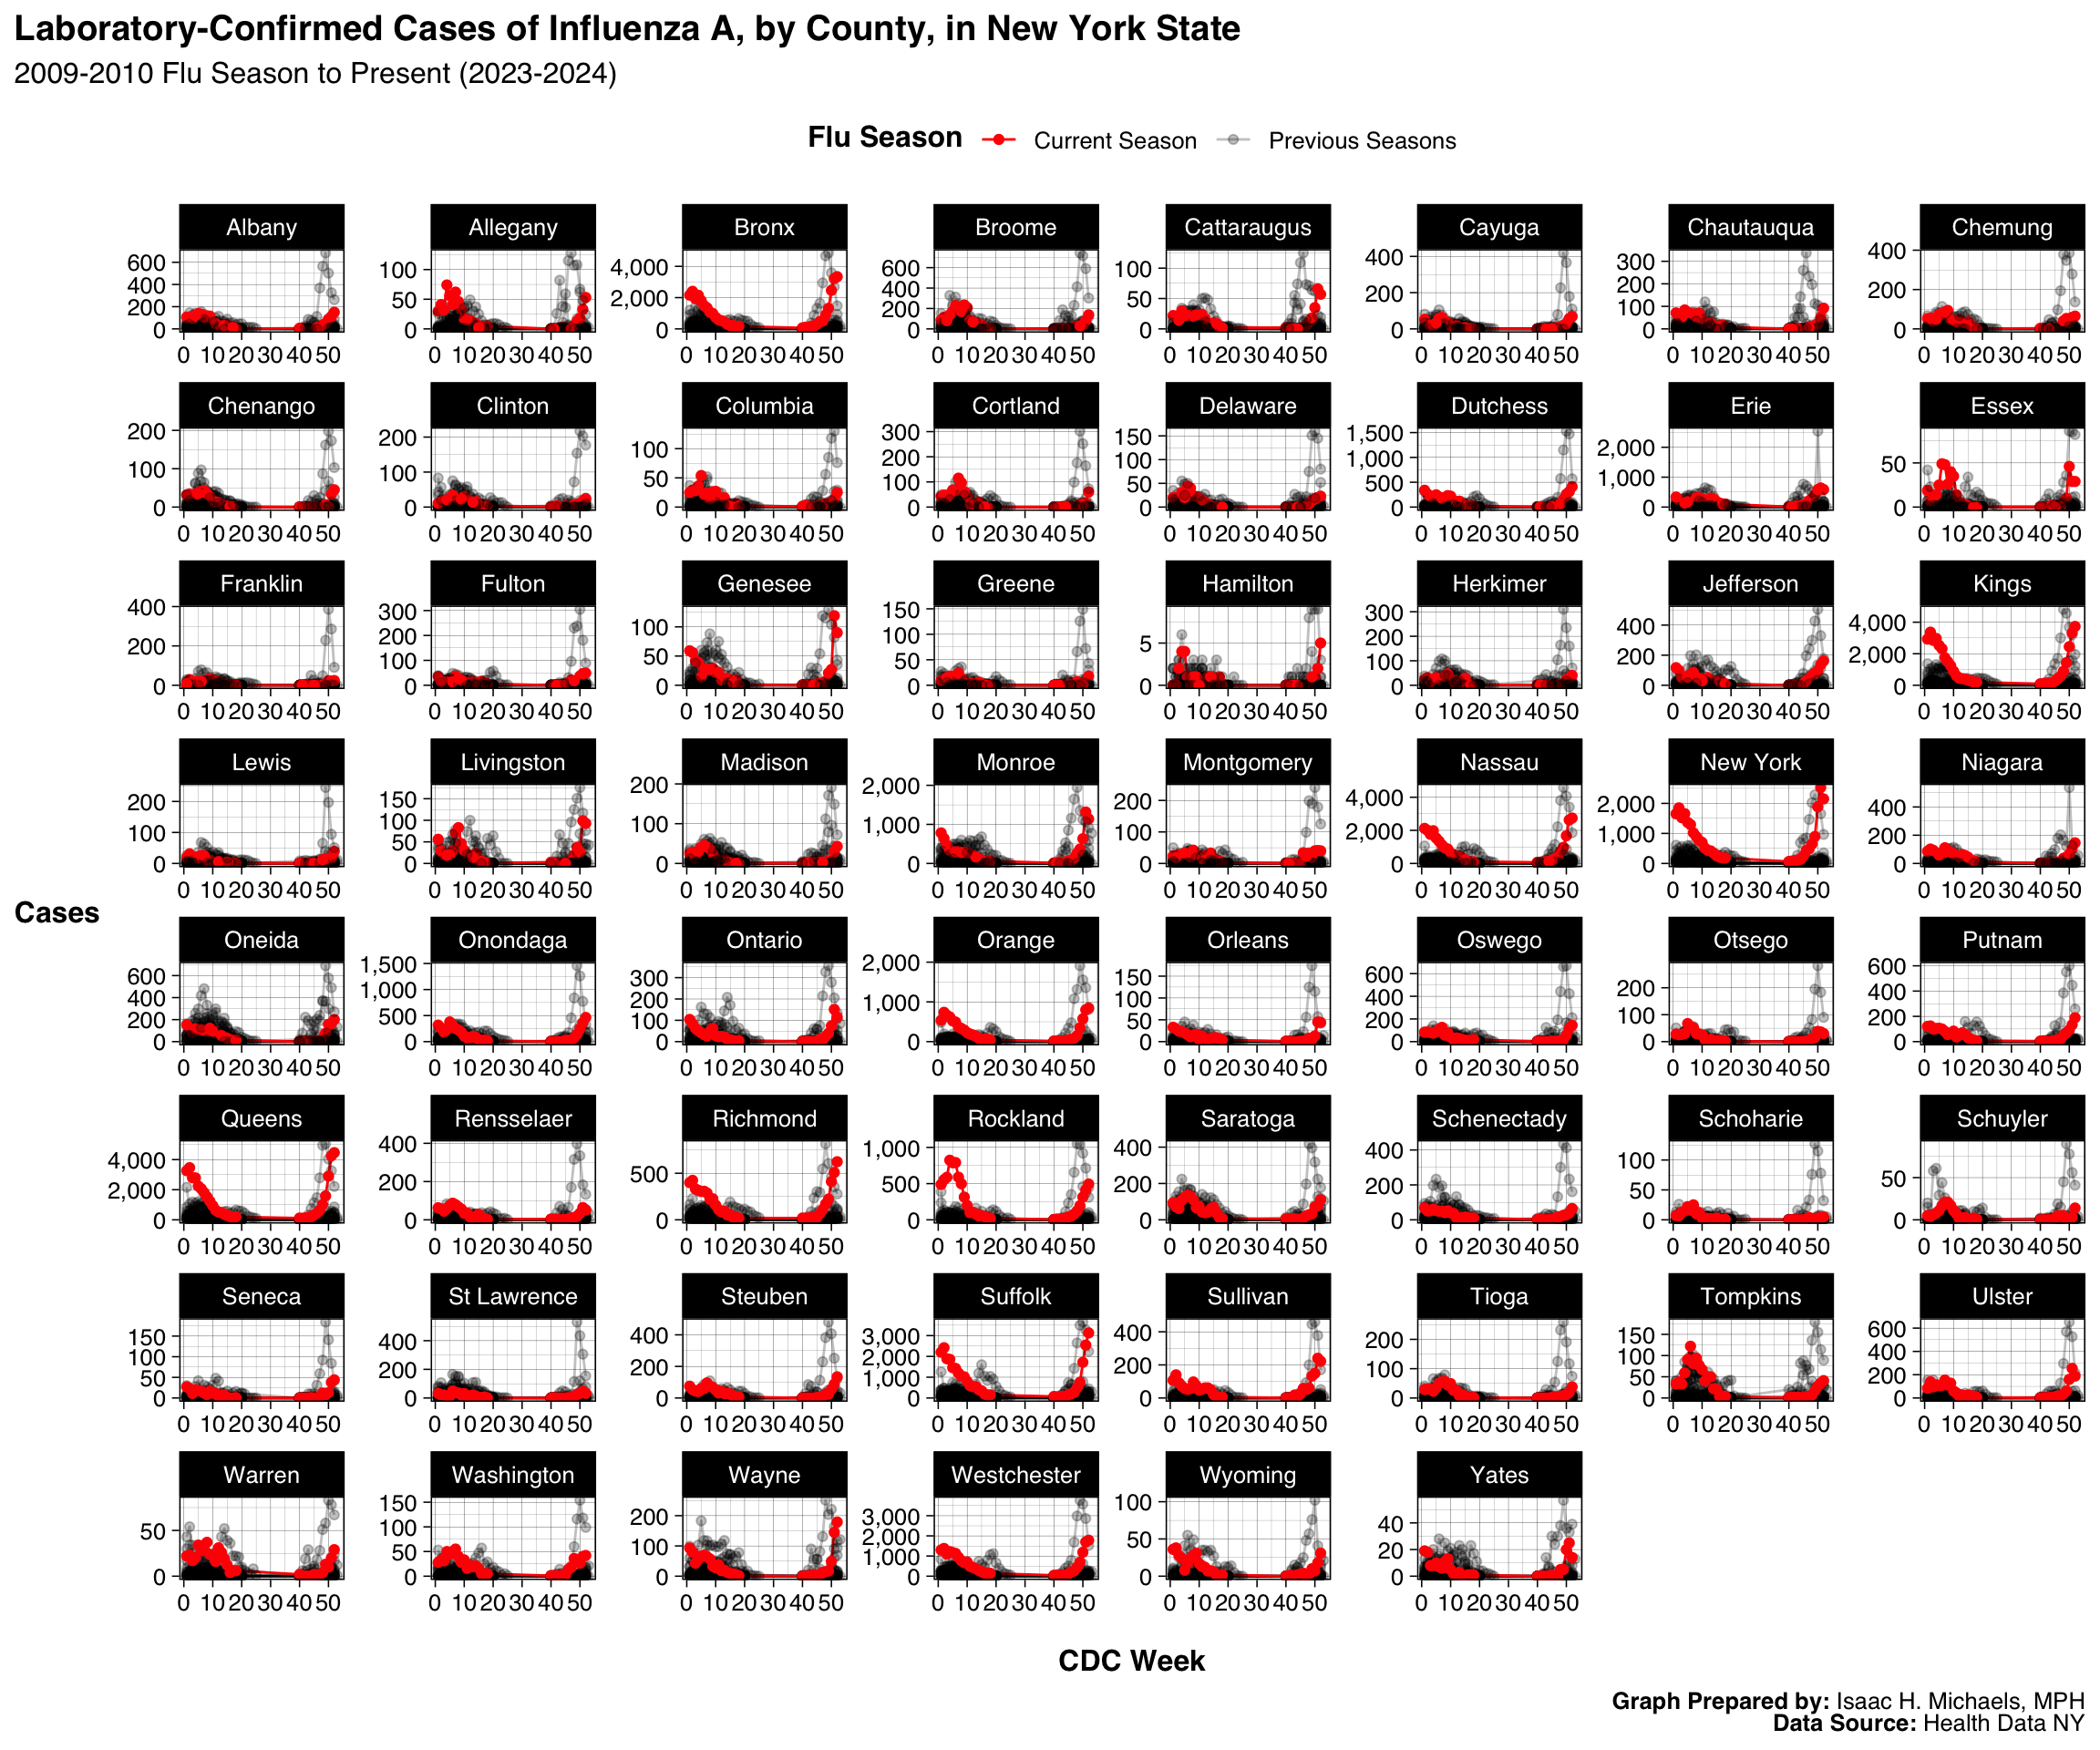 Graphs Prepared By:
 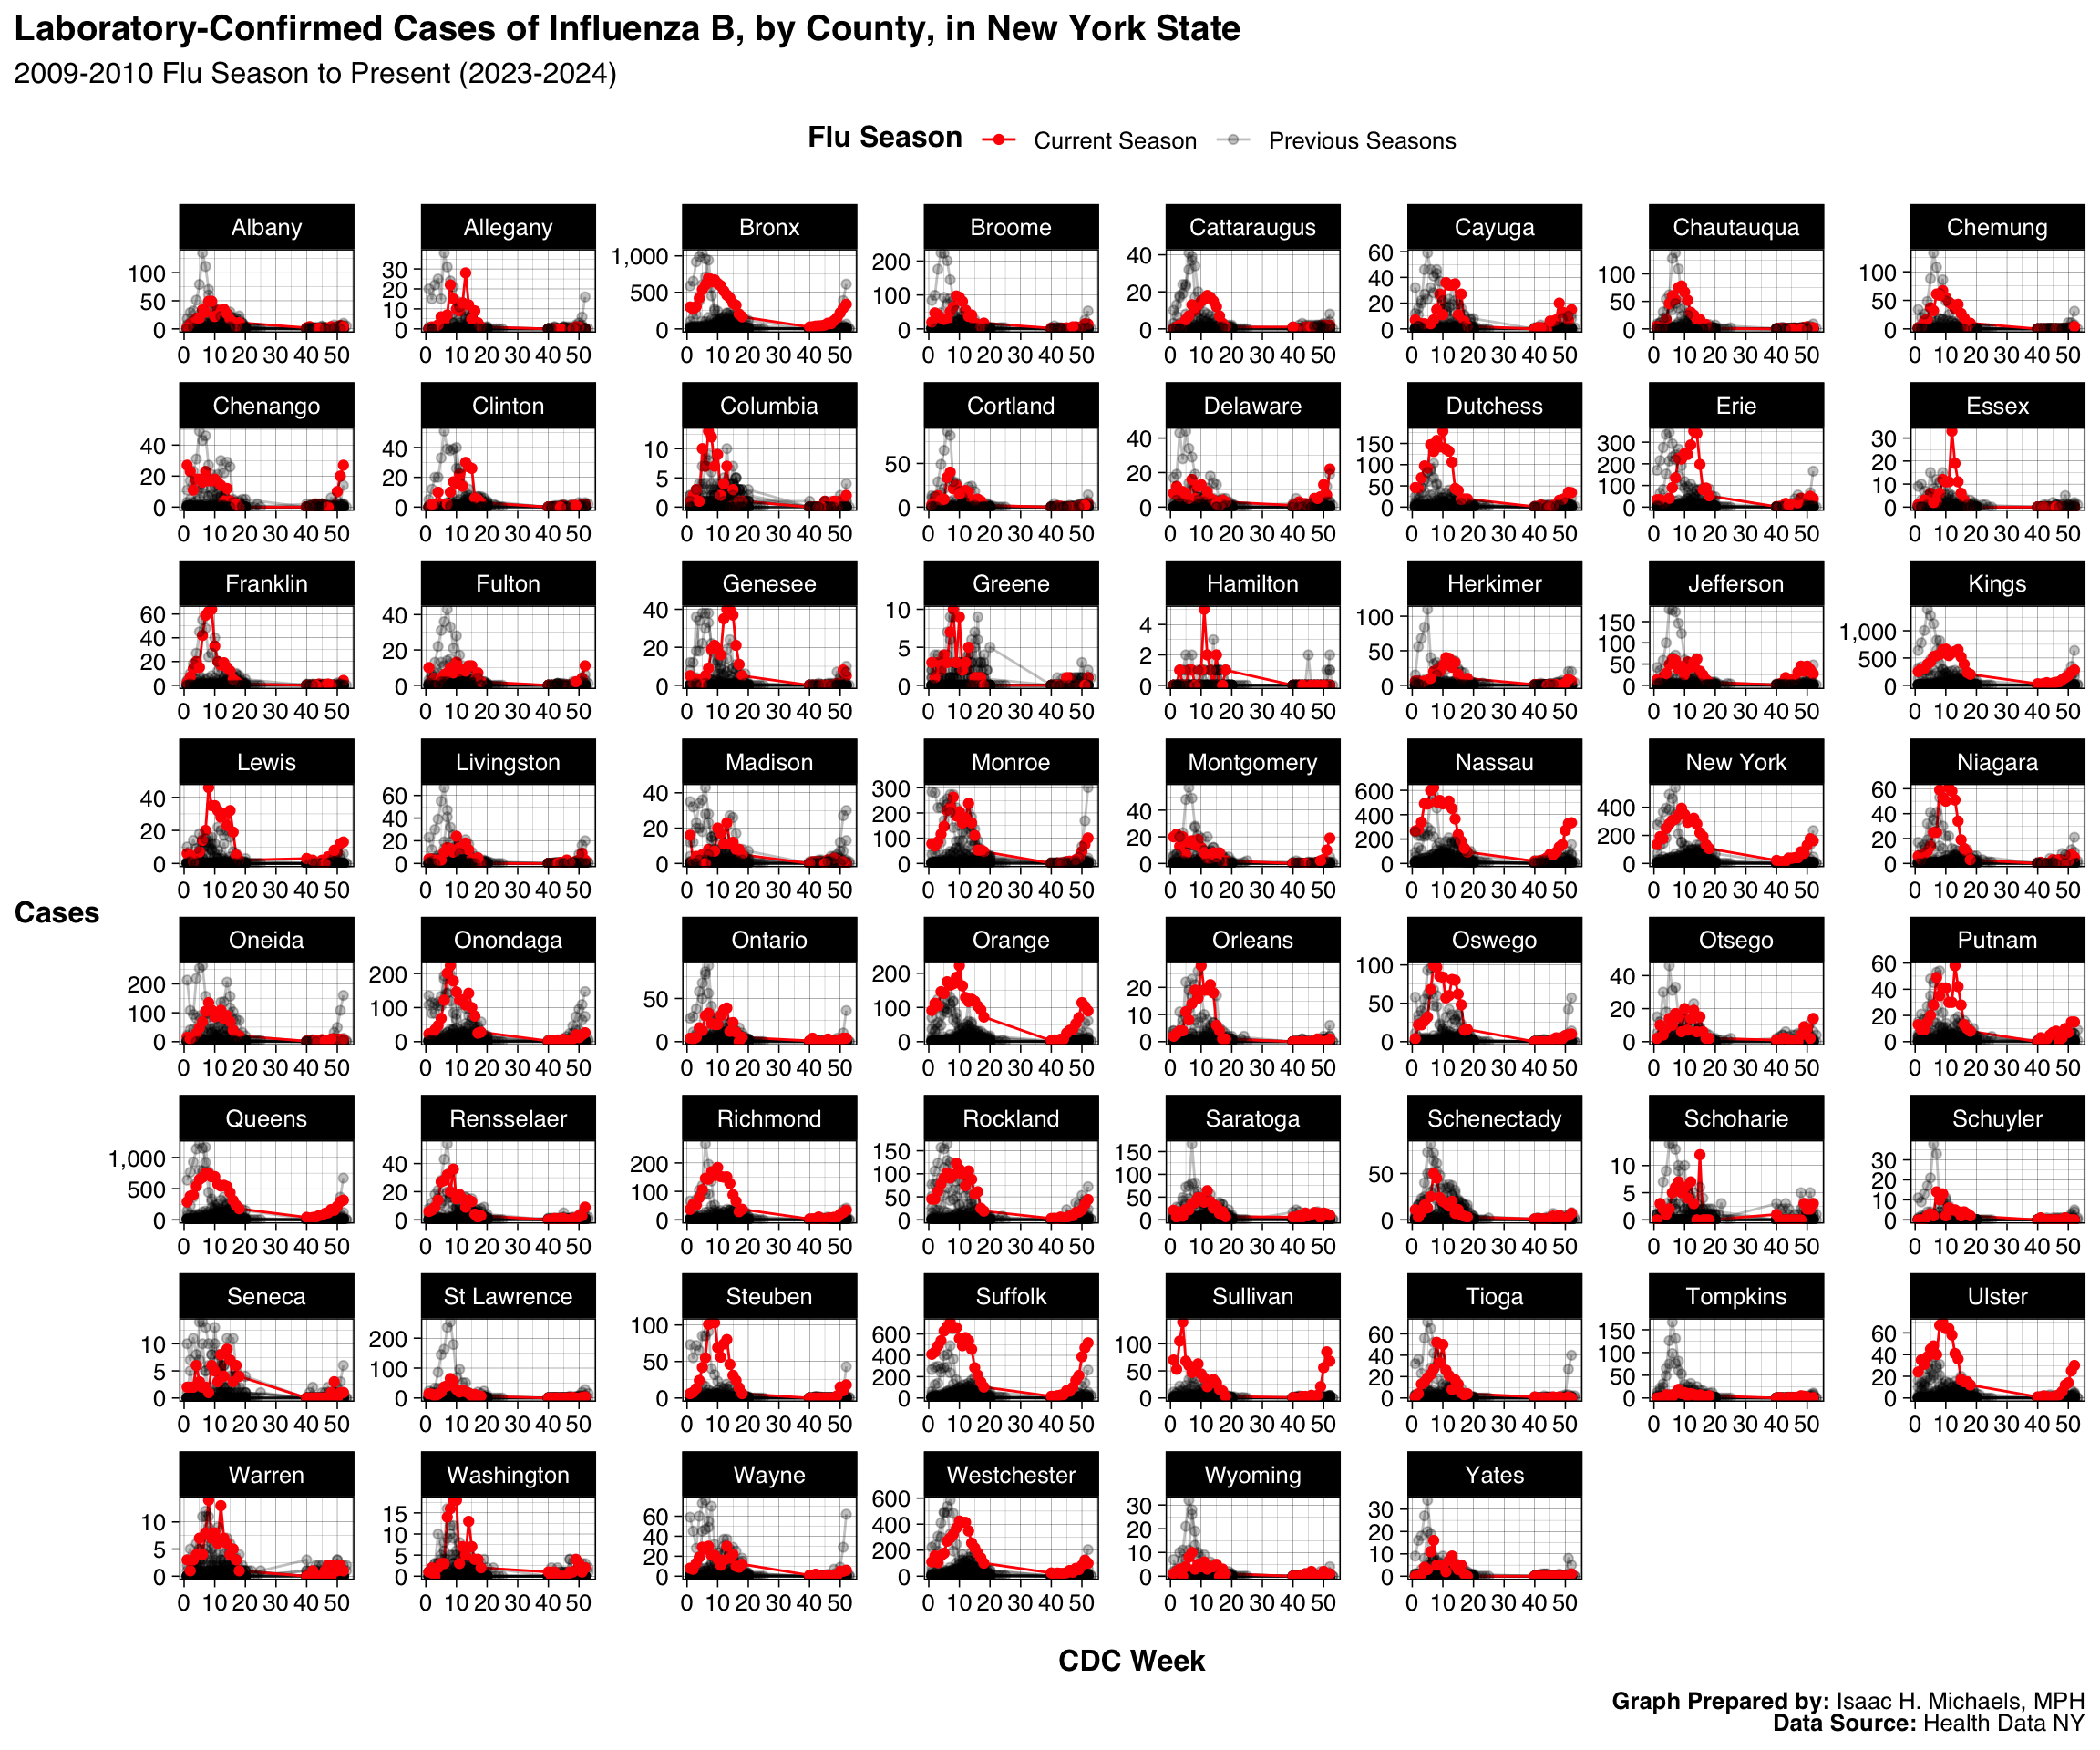 Graphs Prepared By:
 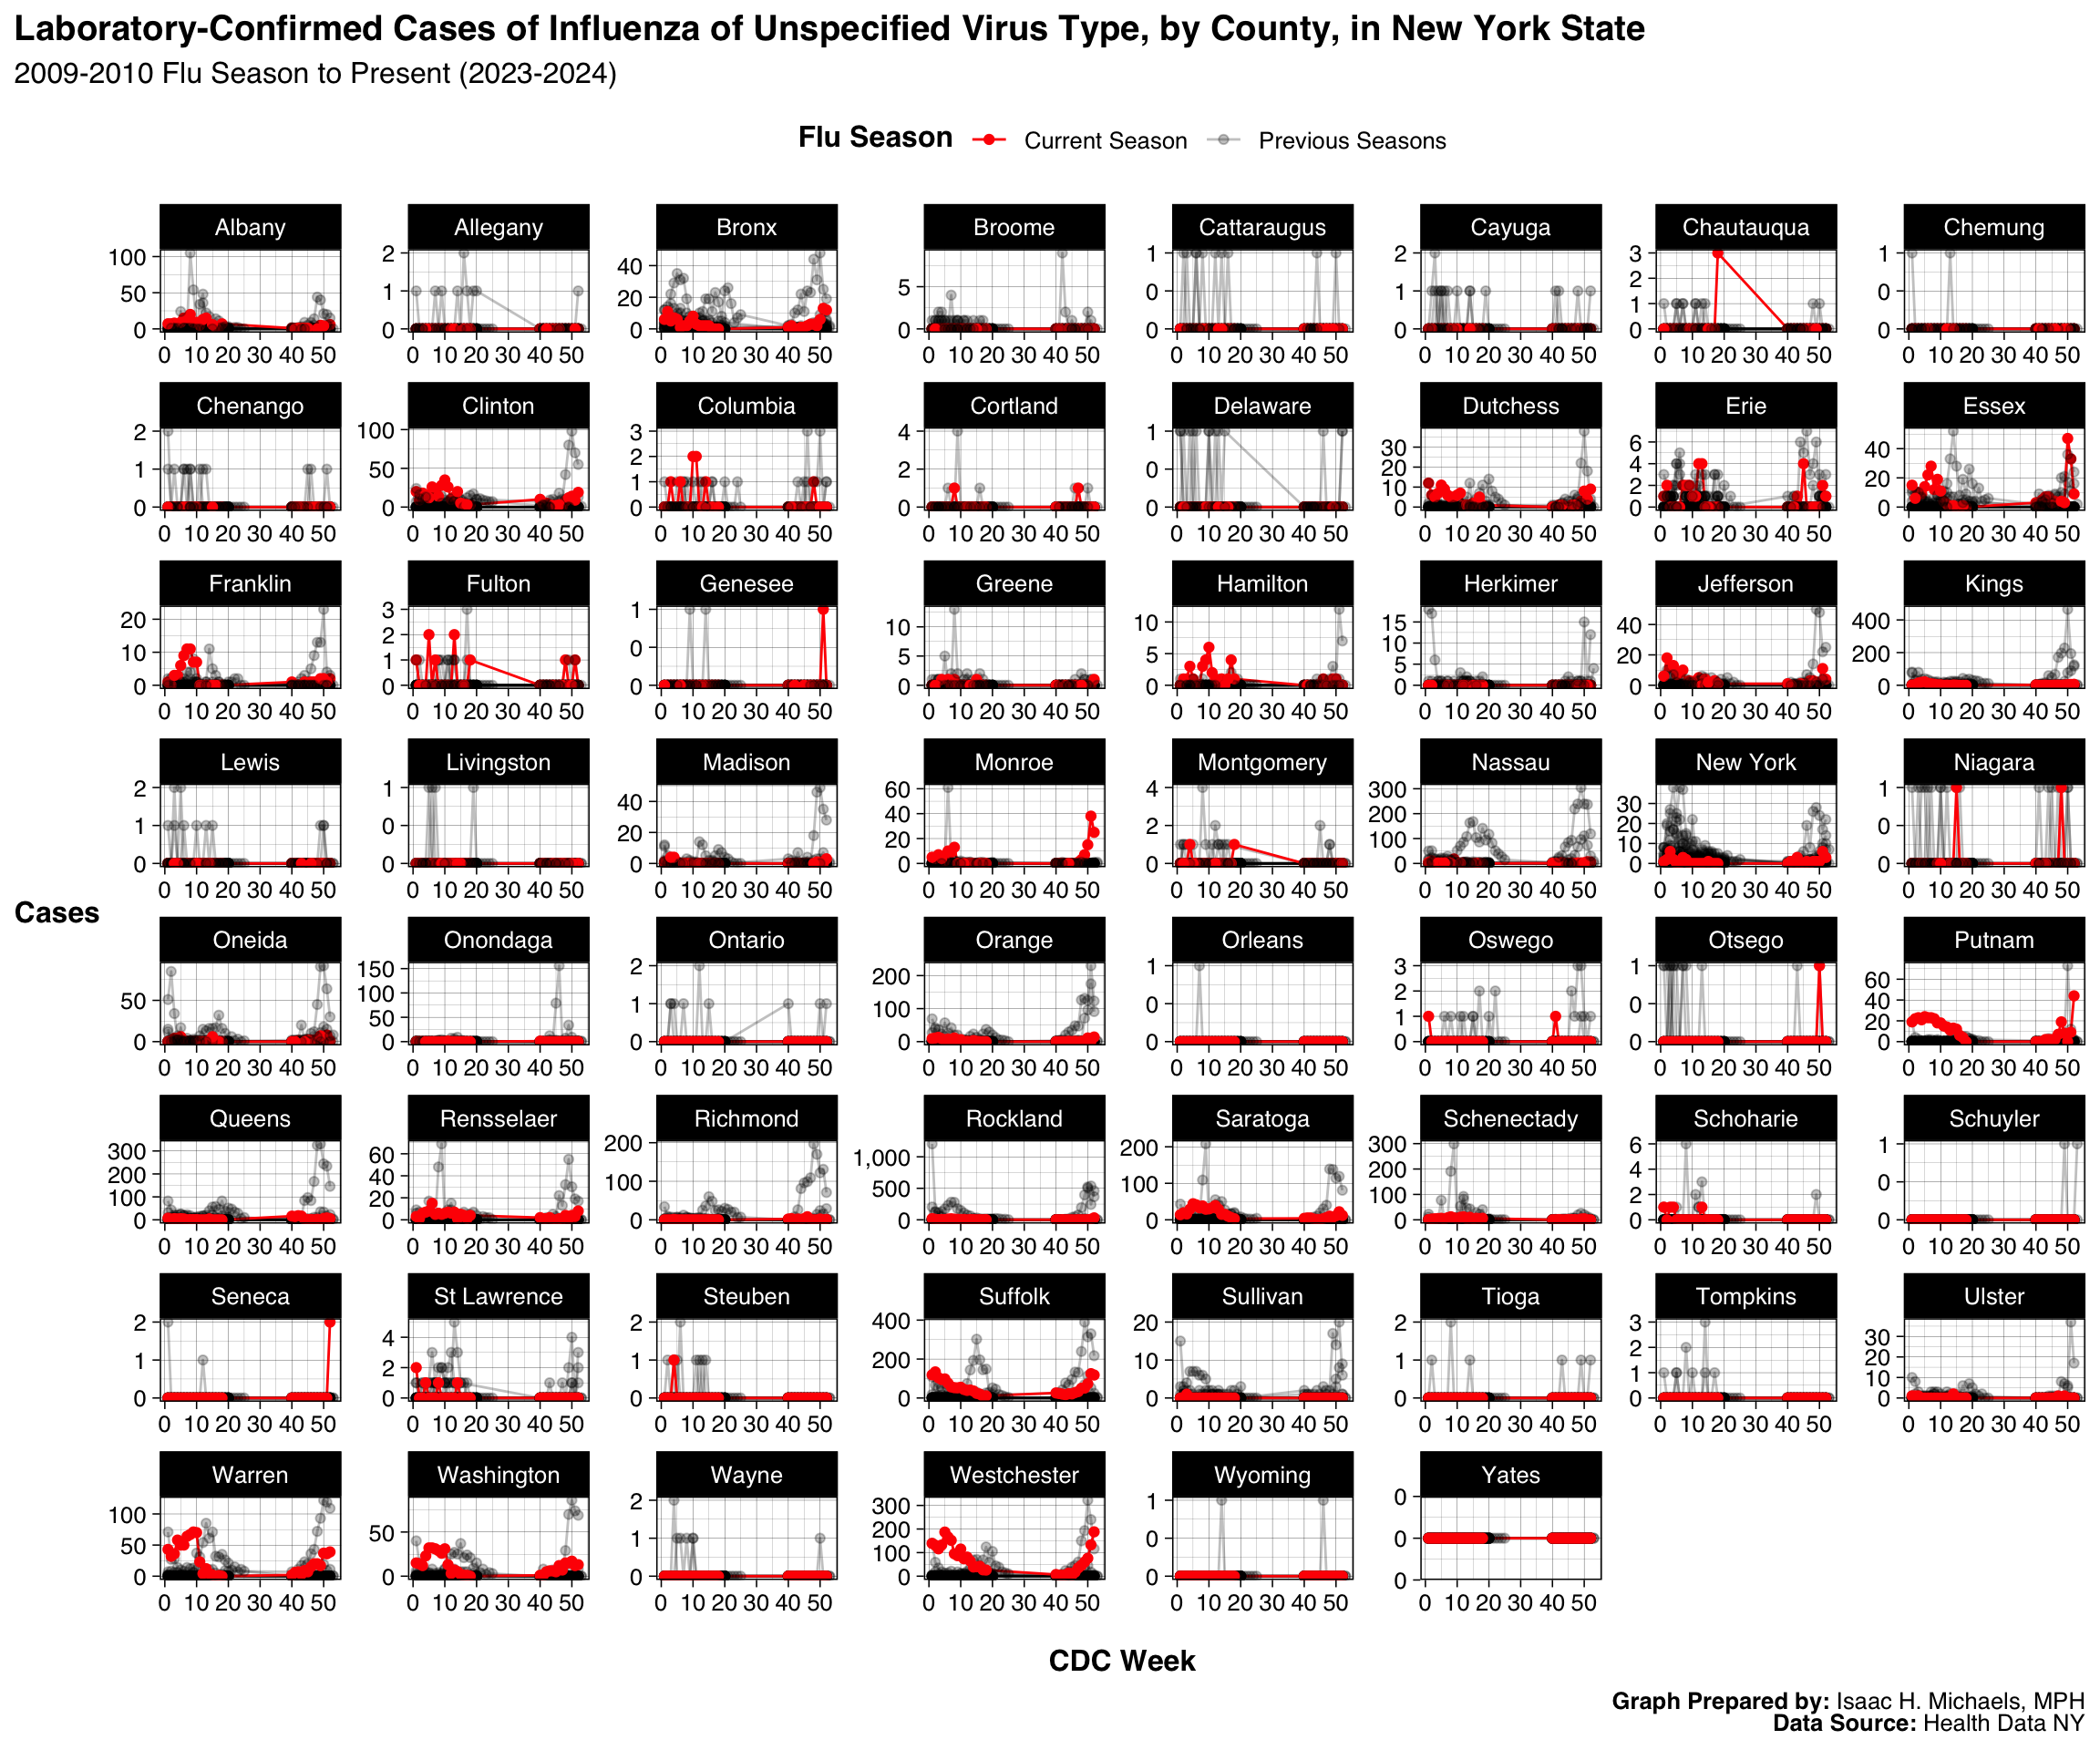 Graphs Prepared By:
 Syndromic Surveillance: Influenza-like Ilness (ILI) and/or Pneumonia in New York City
 Graphs Prepared By: Isaac H. Michaels, MPH
Data Source: NYC Open Data
Mortality
Overall
 Graphs Prepared By: Isaac H. Michaels, MPH
Data Source: National Center for Health Statistics
By Region and Age Group
 Graphs Prepared By: Isaac H. Michaels, MPH
Data Source: National Center for Health Statistics
Influenza Vaccination Coverage
New York State
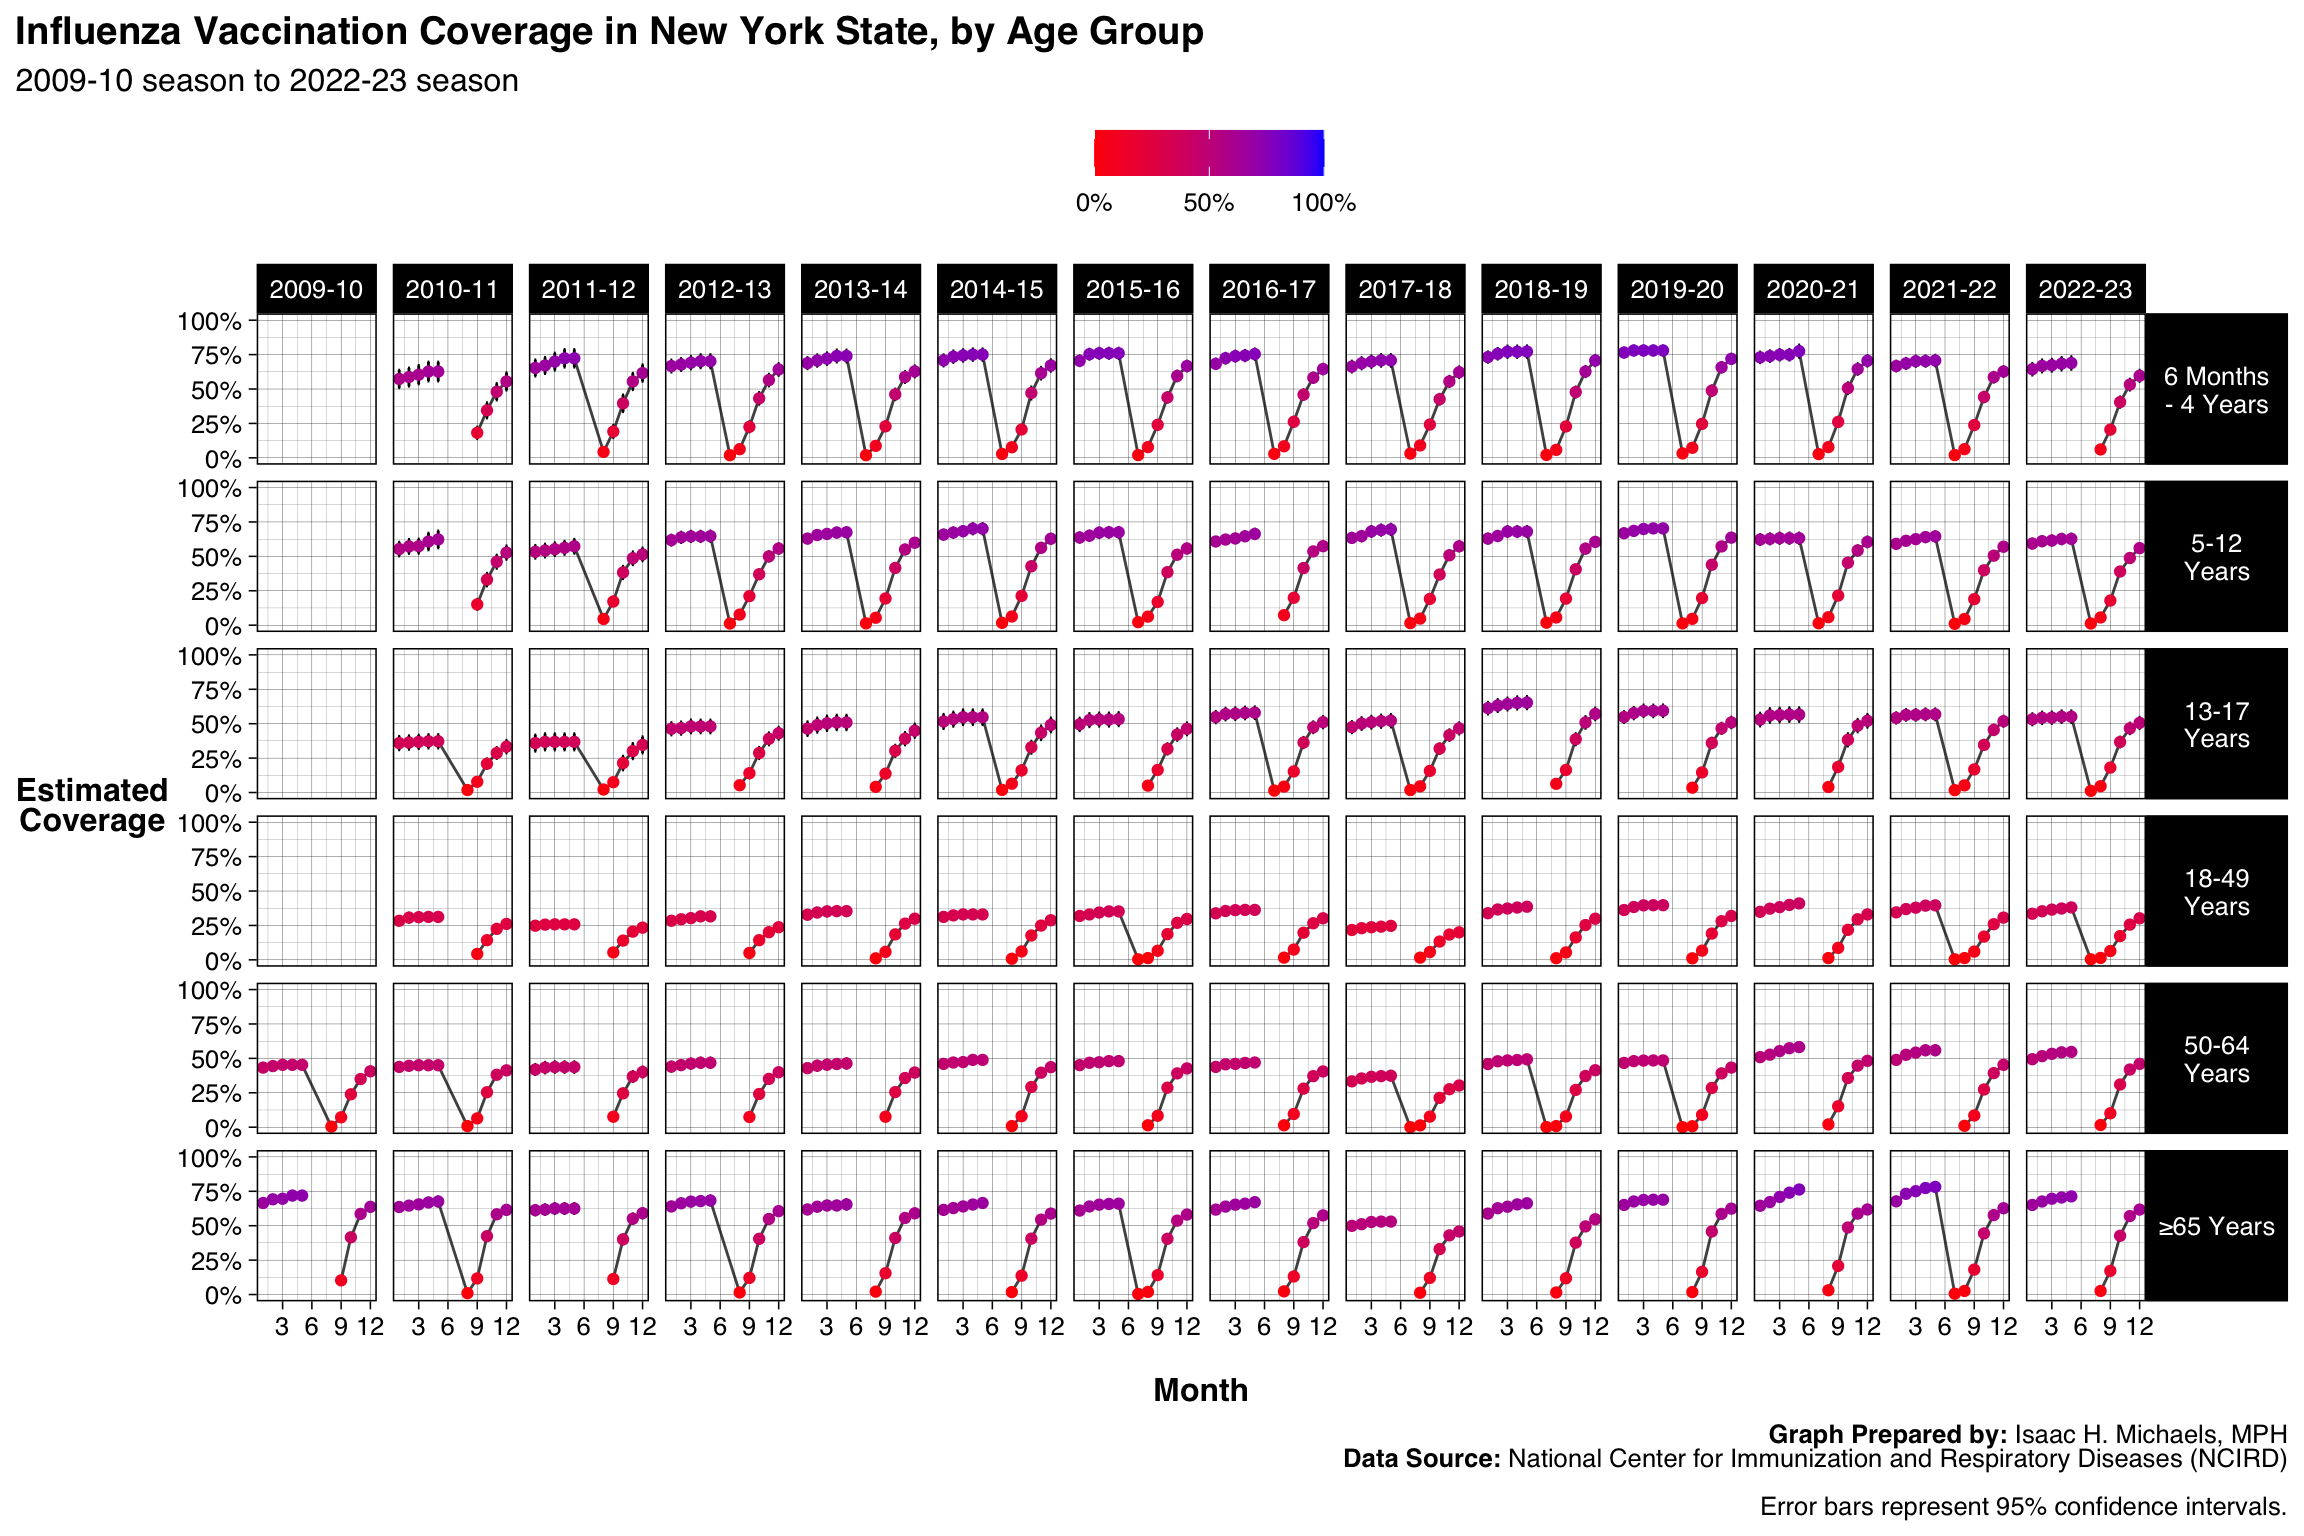 Graphs Prepared By: Isaac H. Michaels, MPH
Data Source: National Center for Immunization and Respiratory Diseases (NCIRD)
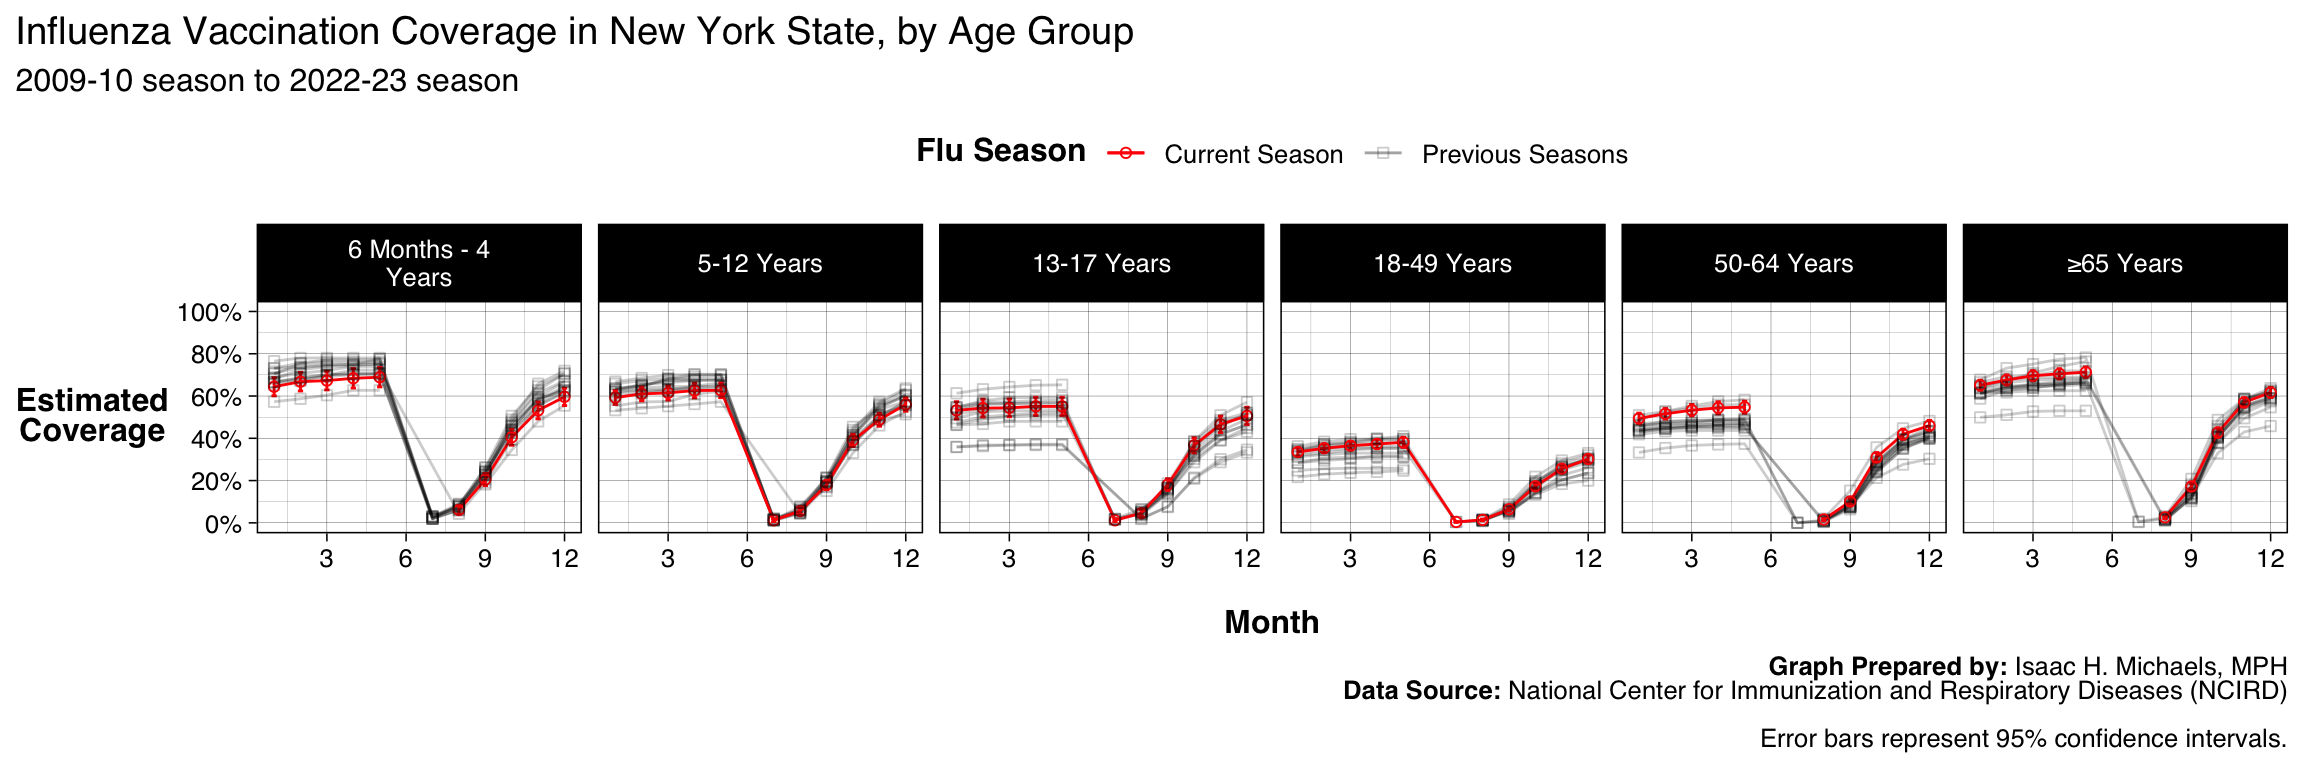 Graphs Prepared By: Isaac H. Michaels, MPH
Data Source: National Center for Immunization and Respiratory Diseases (NCIRD)
New York City
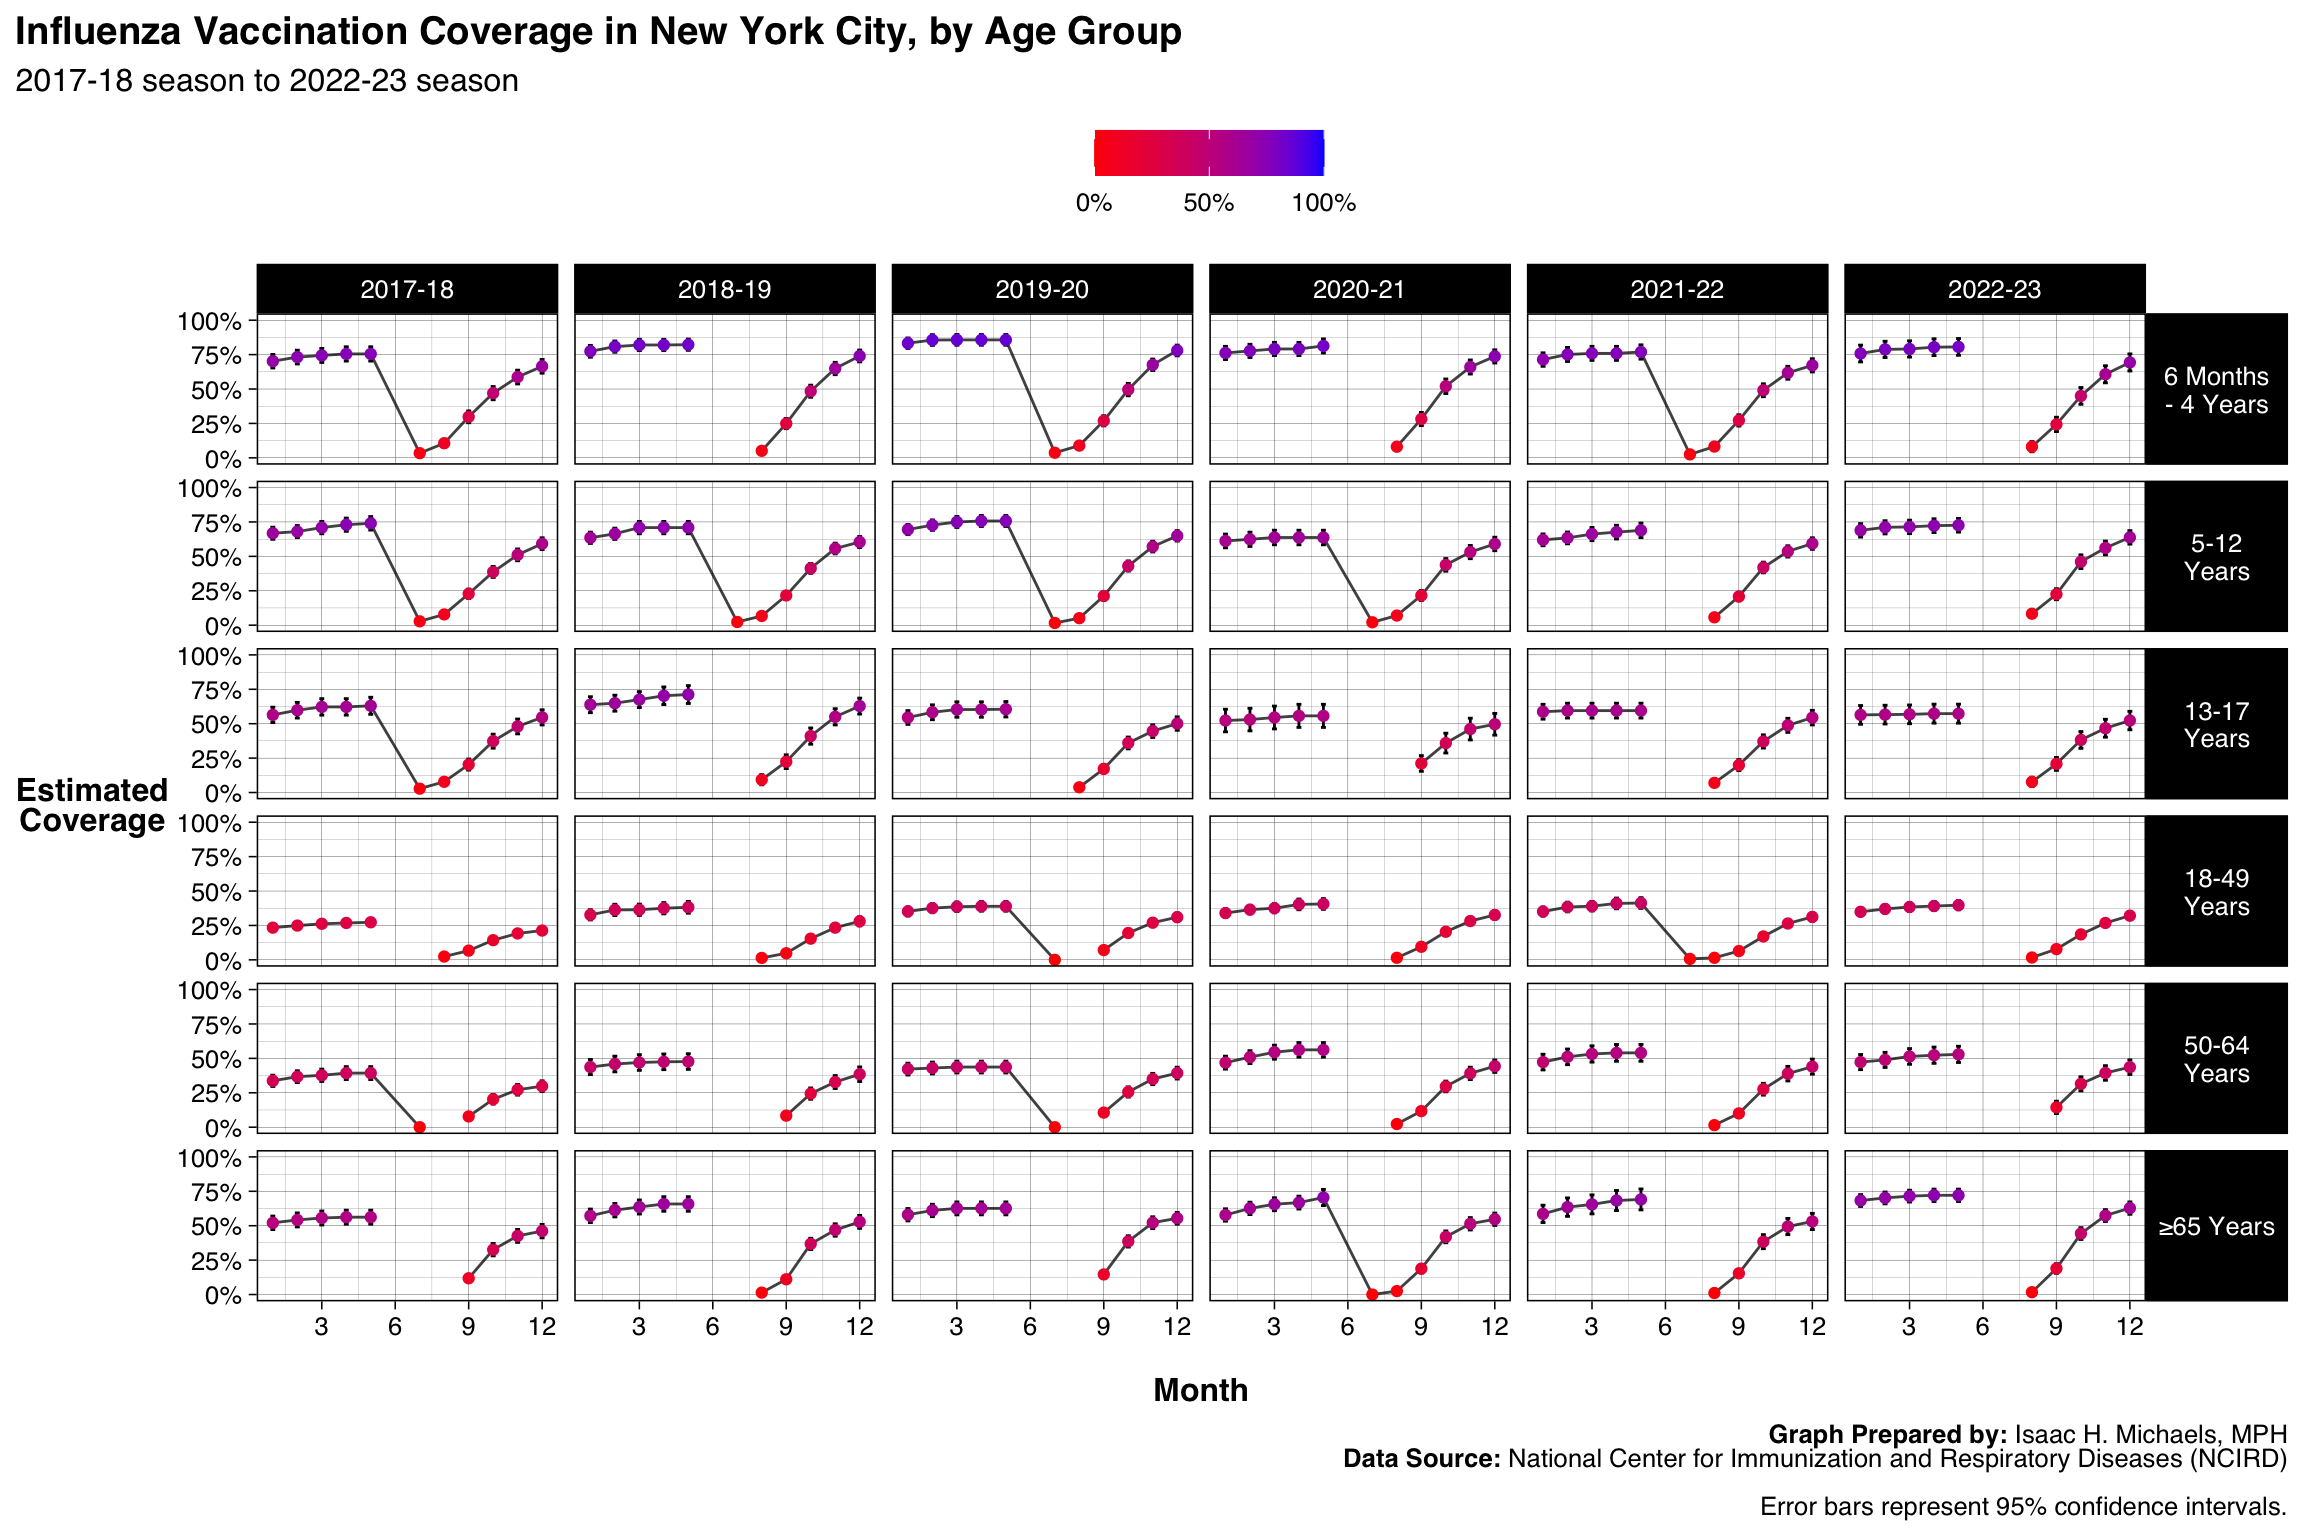 Graphs Prepared By: Isaac H. Michaels, MPH
Data Source: National Center for Immunization and Respiratory Diseases (NCIRD)
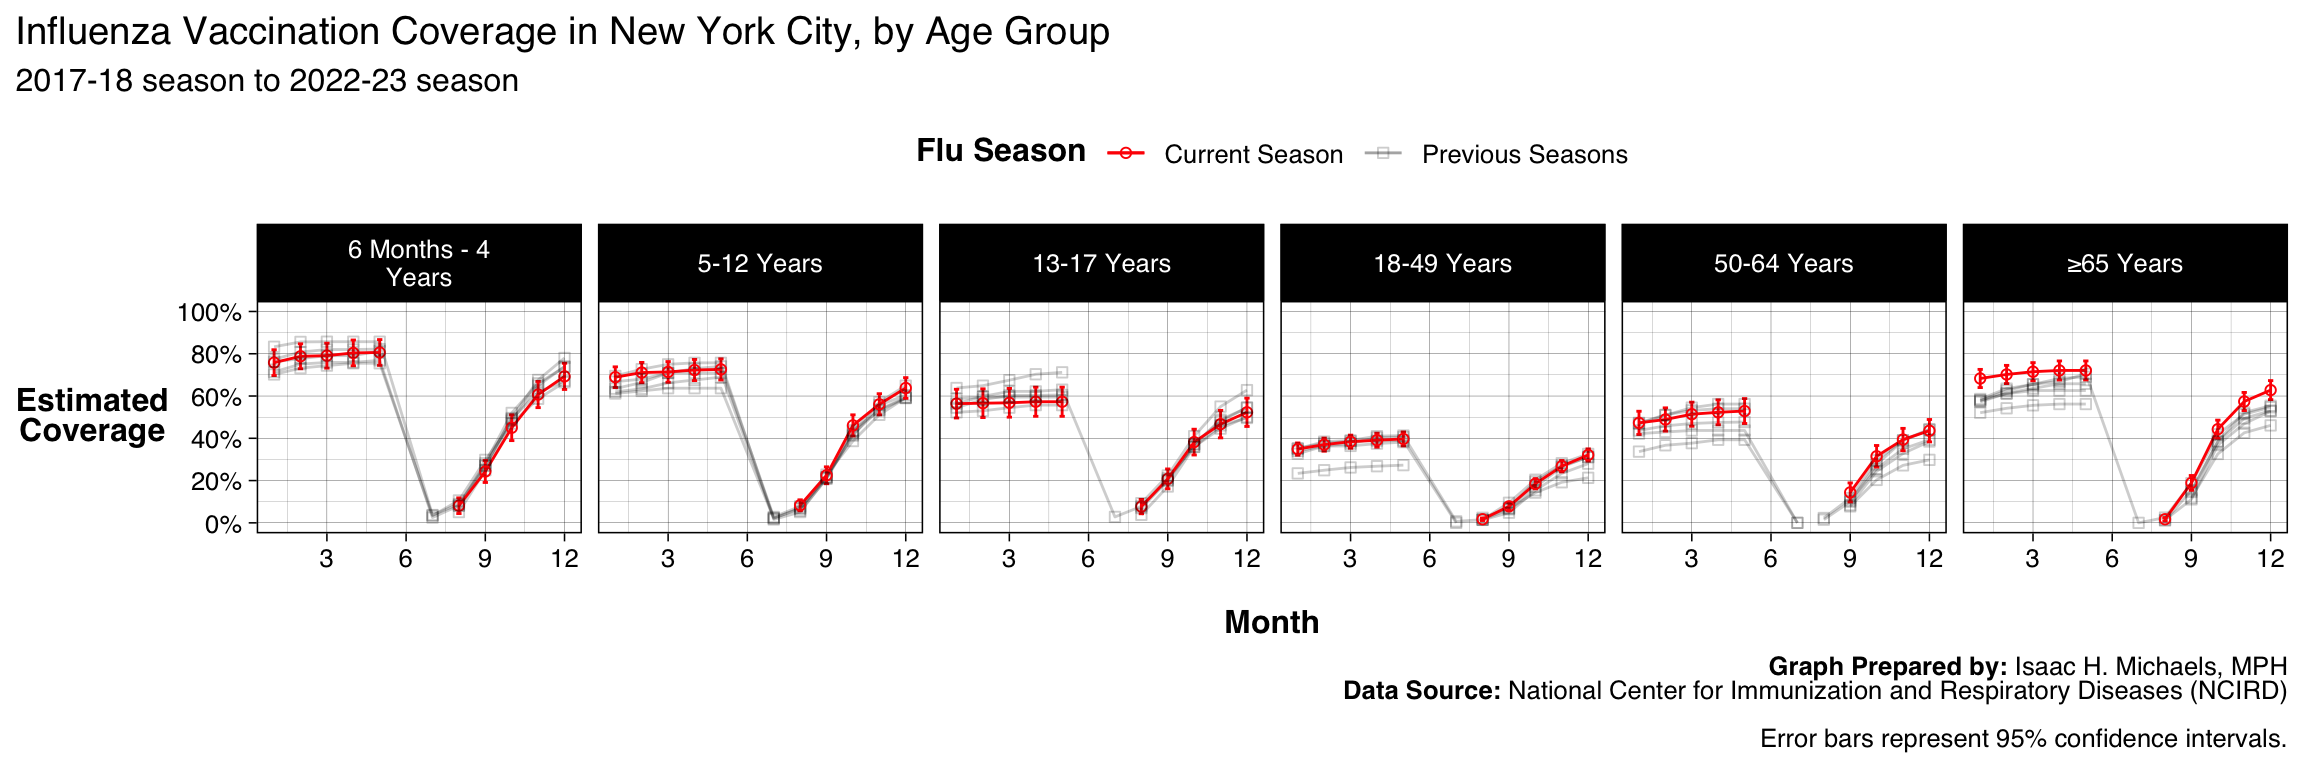 Graphs Prepared By: Isaac H. Michaels, MPH
Data Source: National Center for Immunization and Respiratory Diseases (NCIRD)
New York State excluding NYC
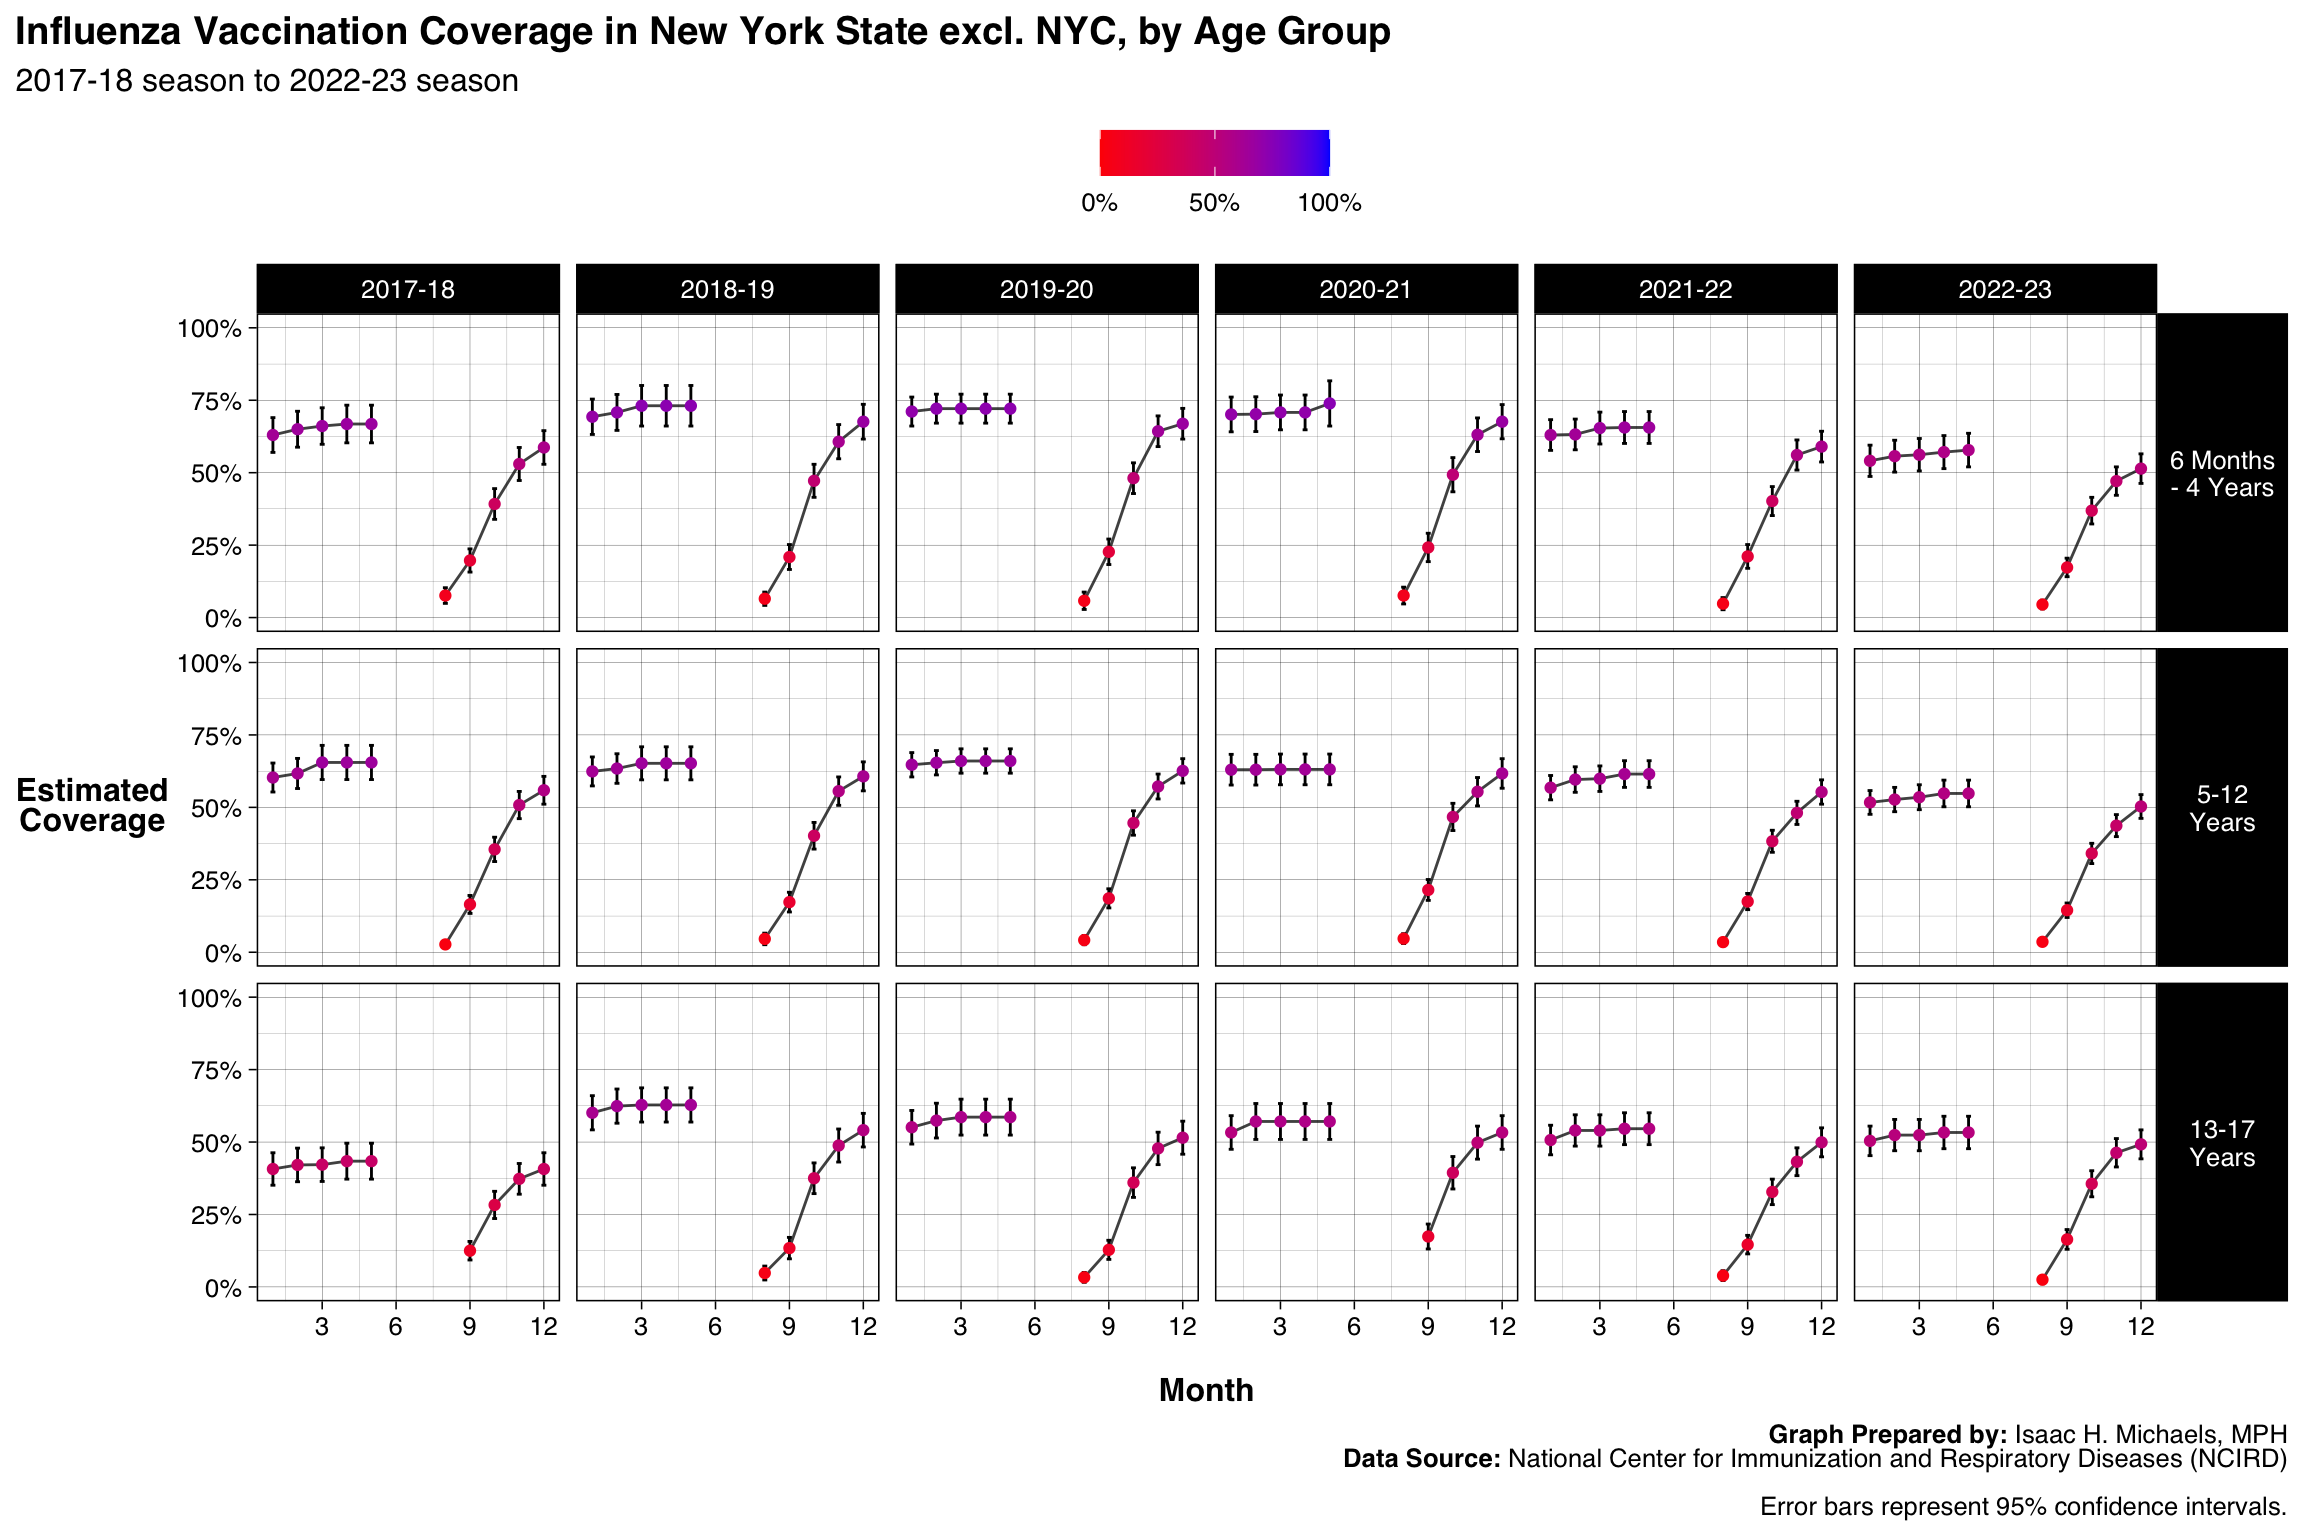 Graphs Prepared By: Isaac H. Michaels, MPH
Data Source: National Center for Immunization and Respiratory Diseases (NCIRD)
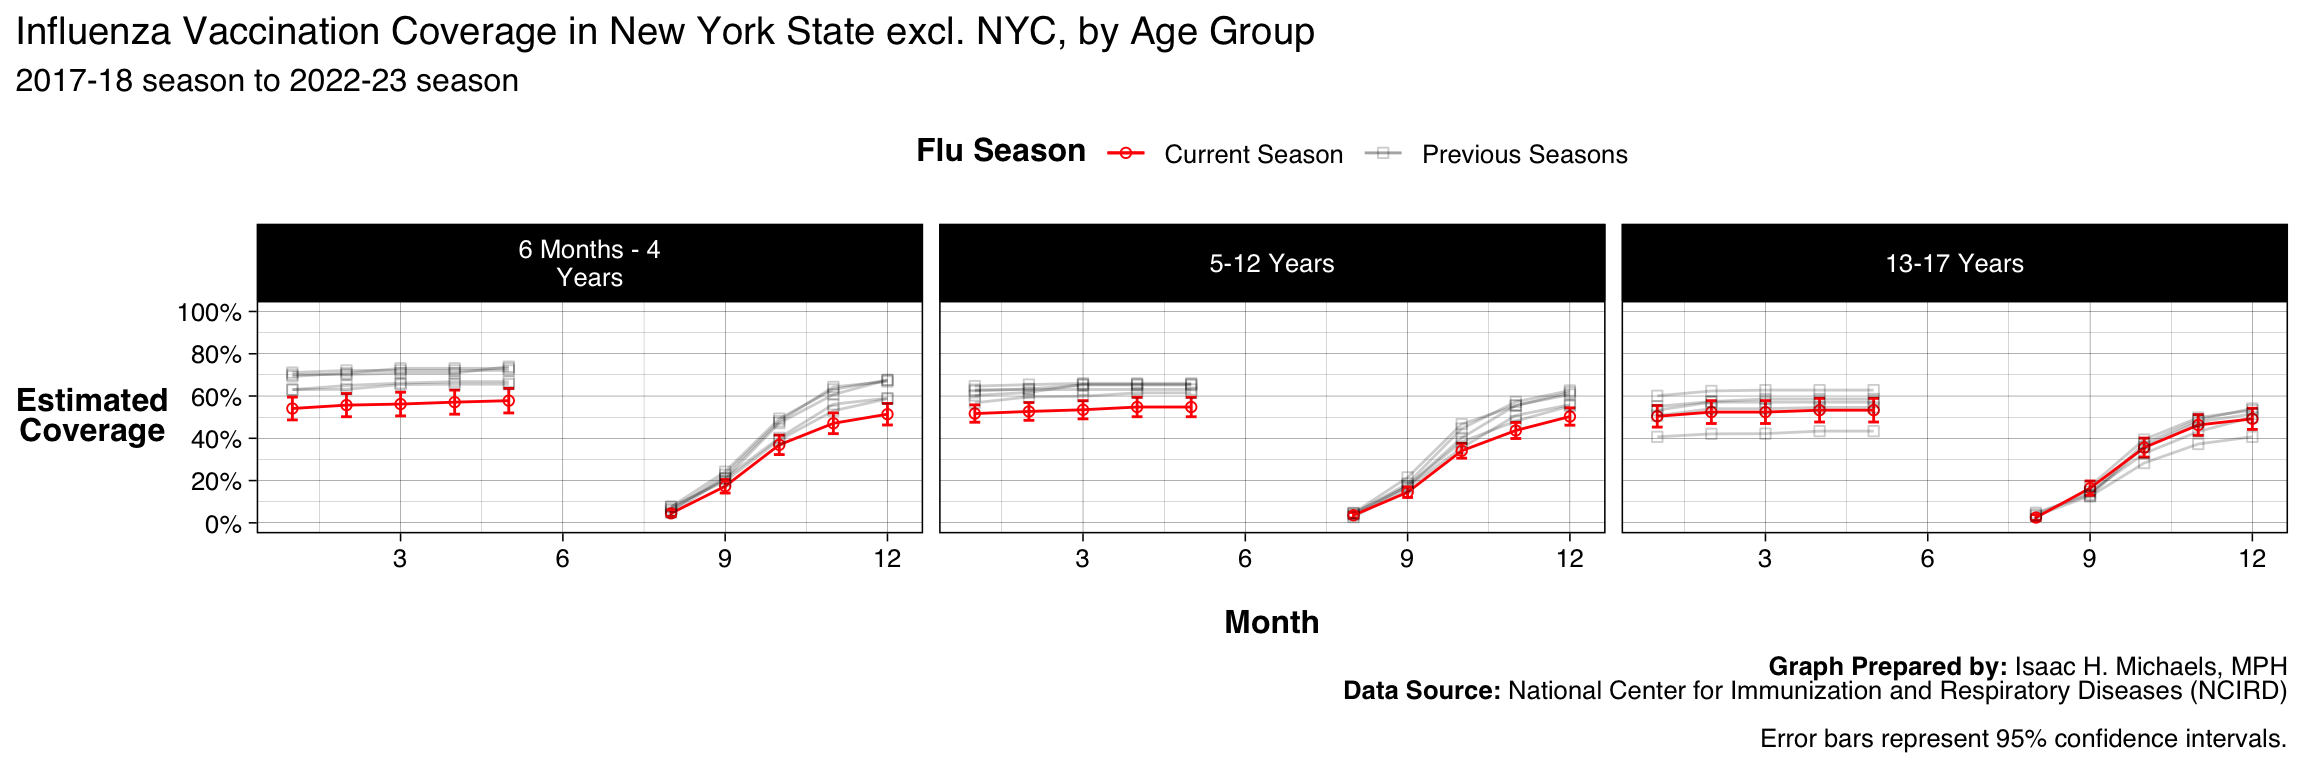 Graphs Prepared By: Isaac H. Michaels, MPH
Data Source: National Center for Immunization and Respiratory Diseases (NCIRD)