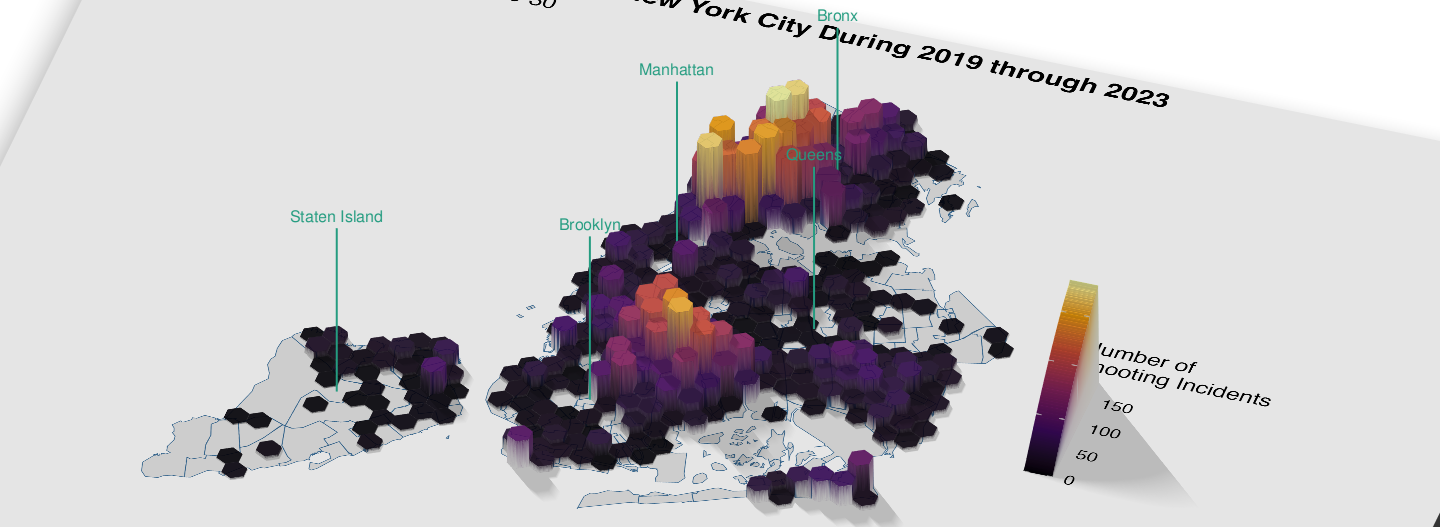
Using Three-Dimensional Mapping to Visualize Five Years of Shooting Incidents in New York City August 20, 2024 Gun Violence New York City Three-dimensional mapping Public Health GIS epidemiology