- Welcome
- Data Overview
- How to Use These Data
- Why Are These Data Important?
- What Do These Data Show?
- What Do These Data Not Show?
- Implications for Public Health Practice
- Executive Summary
- Daily EMS Call Volume
- Daily EMS Call Travel Times
- Call Times
- Spatial Distribution
- Final Call Types
- Overall
- By Type
- Sick
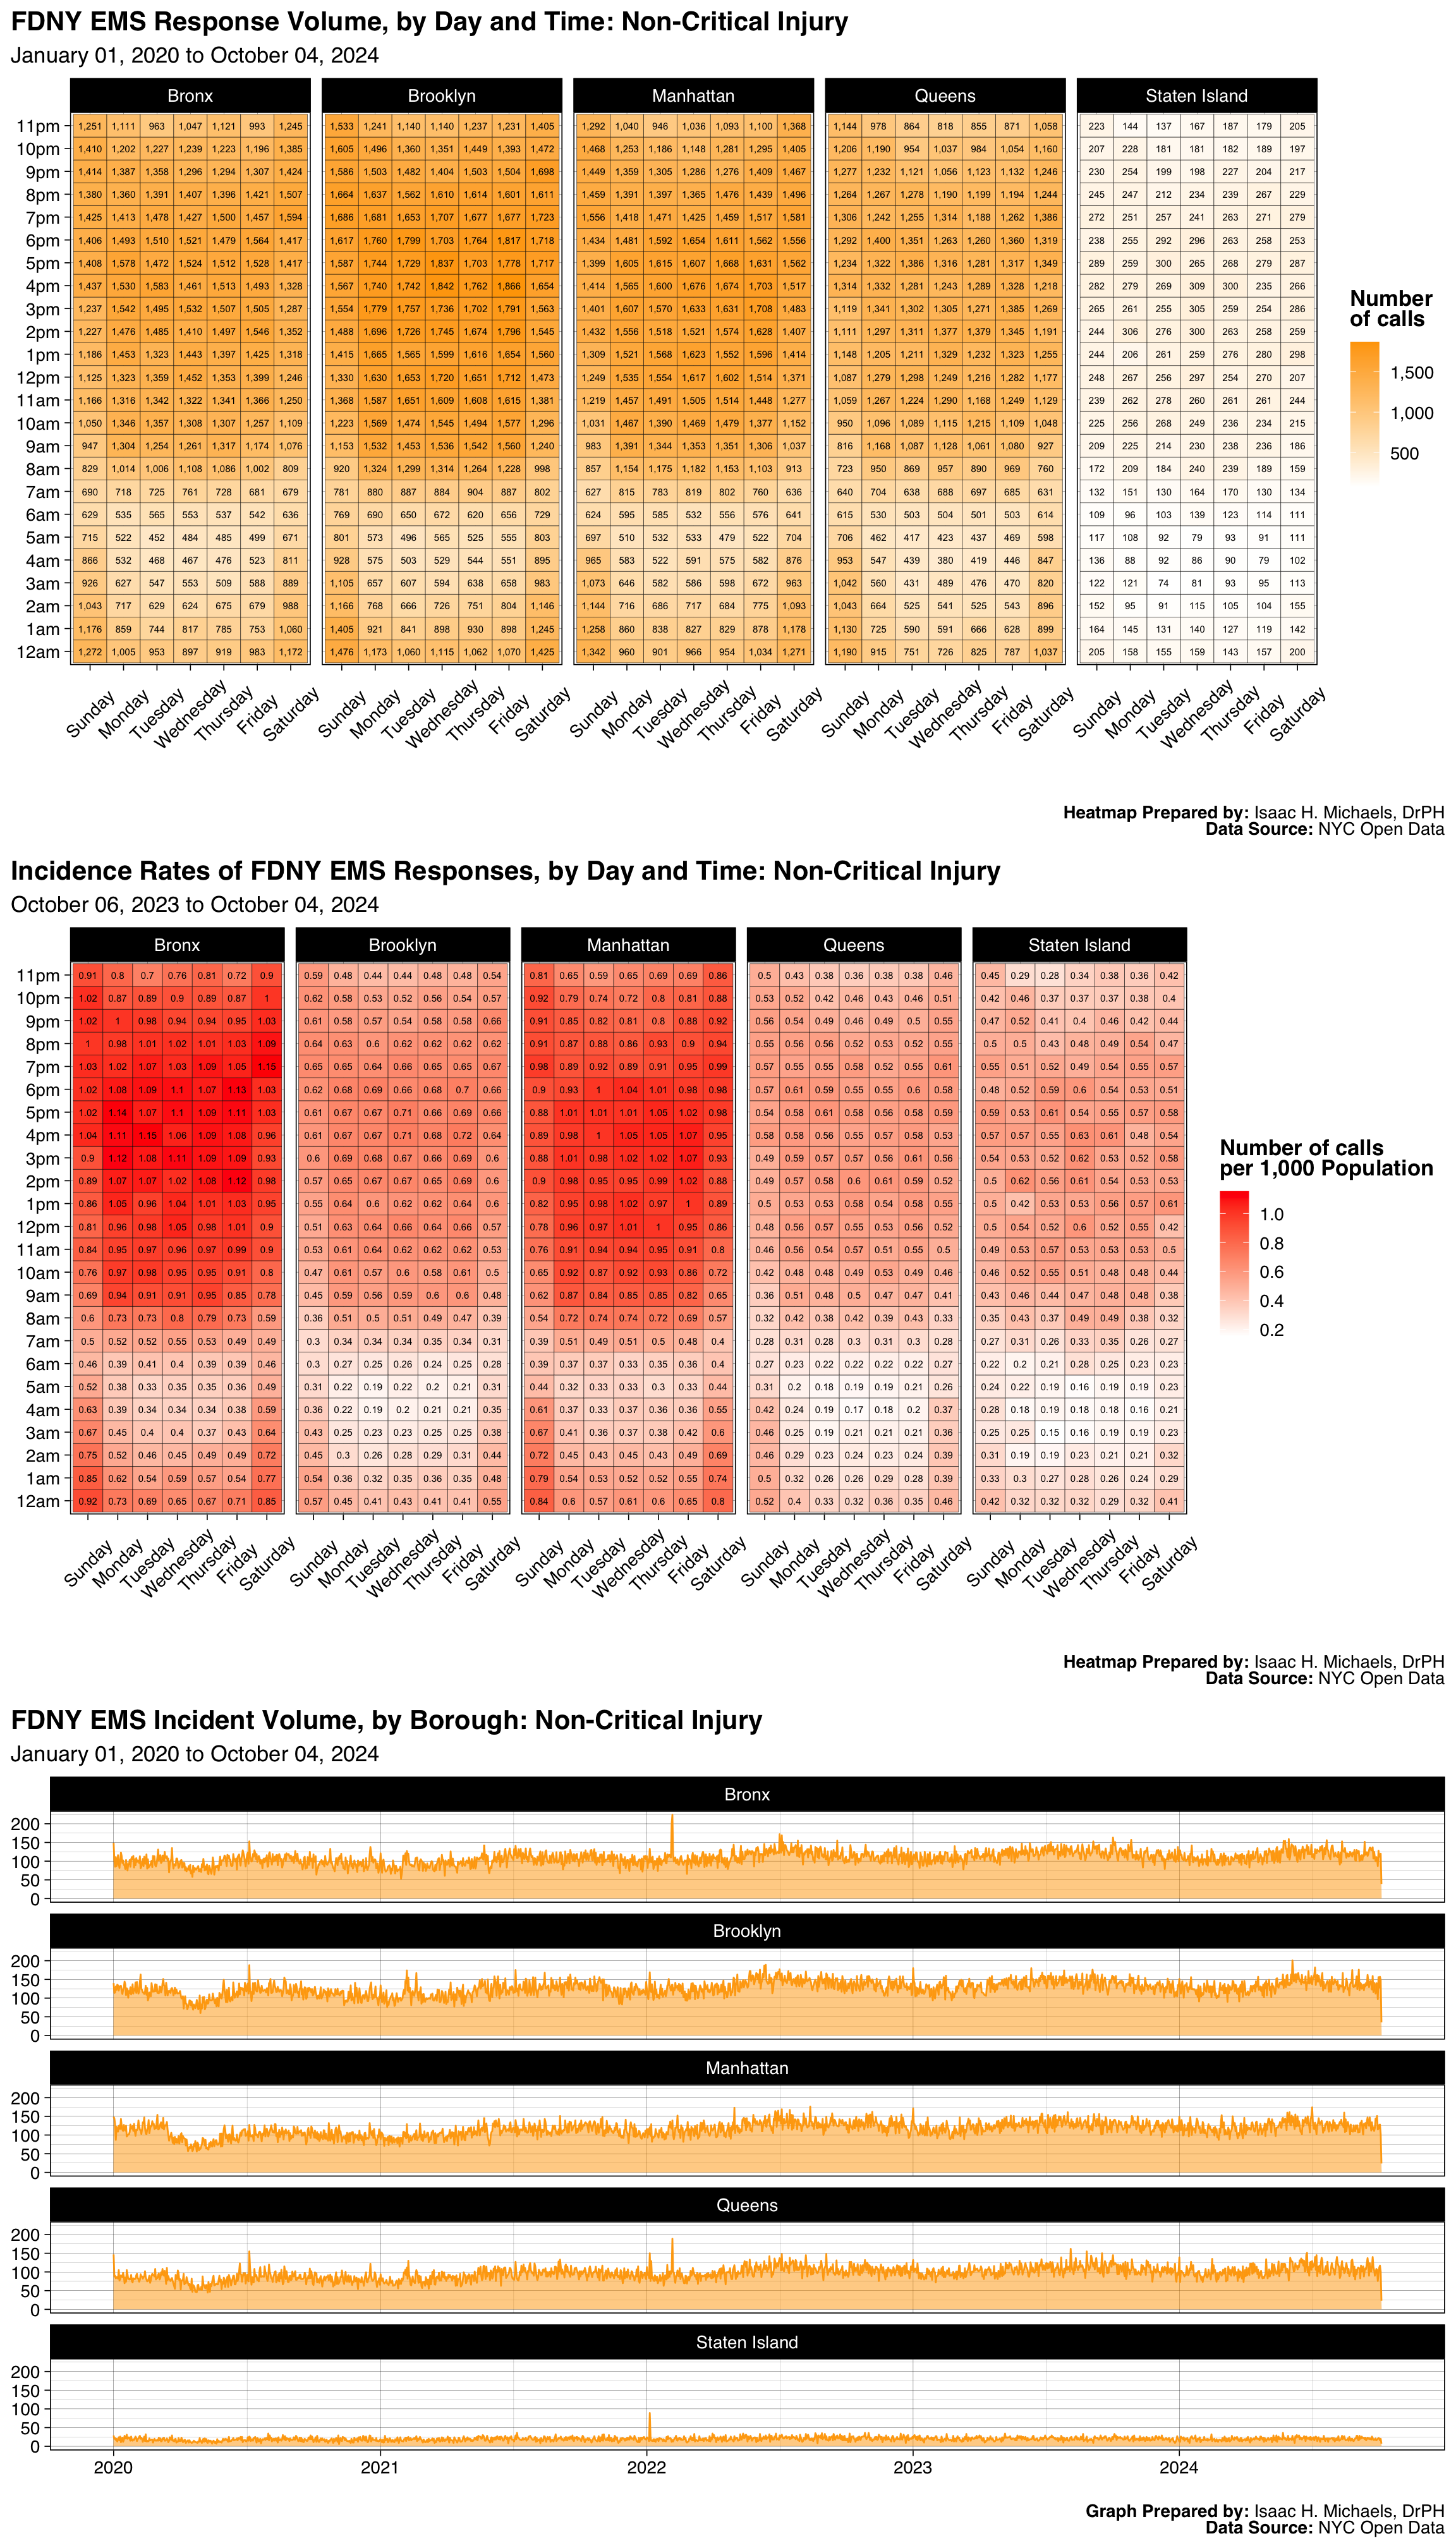
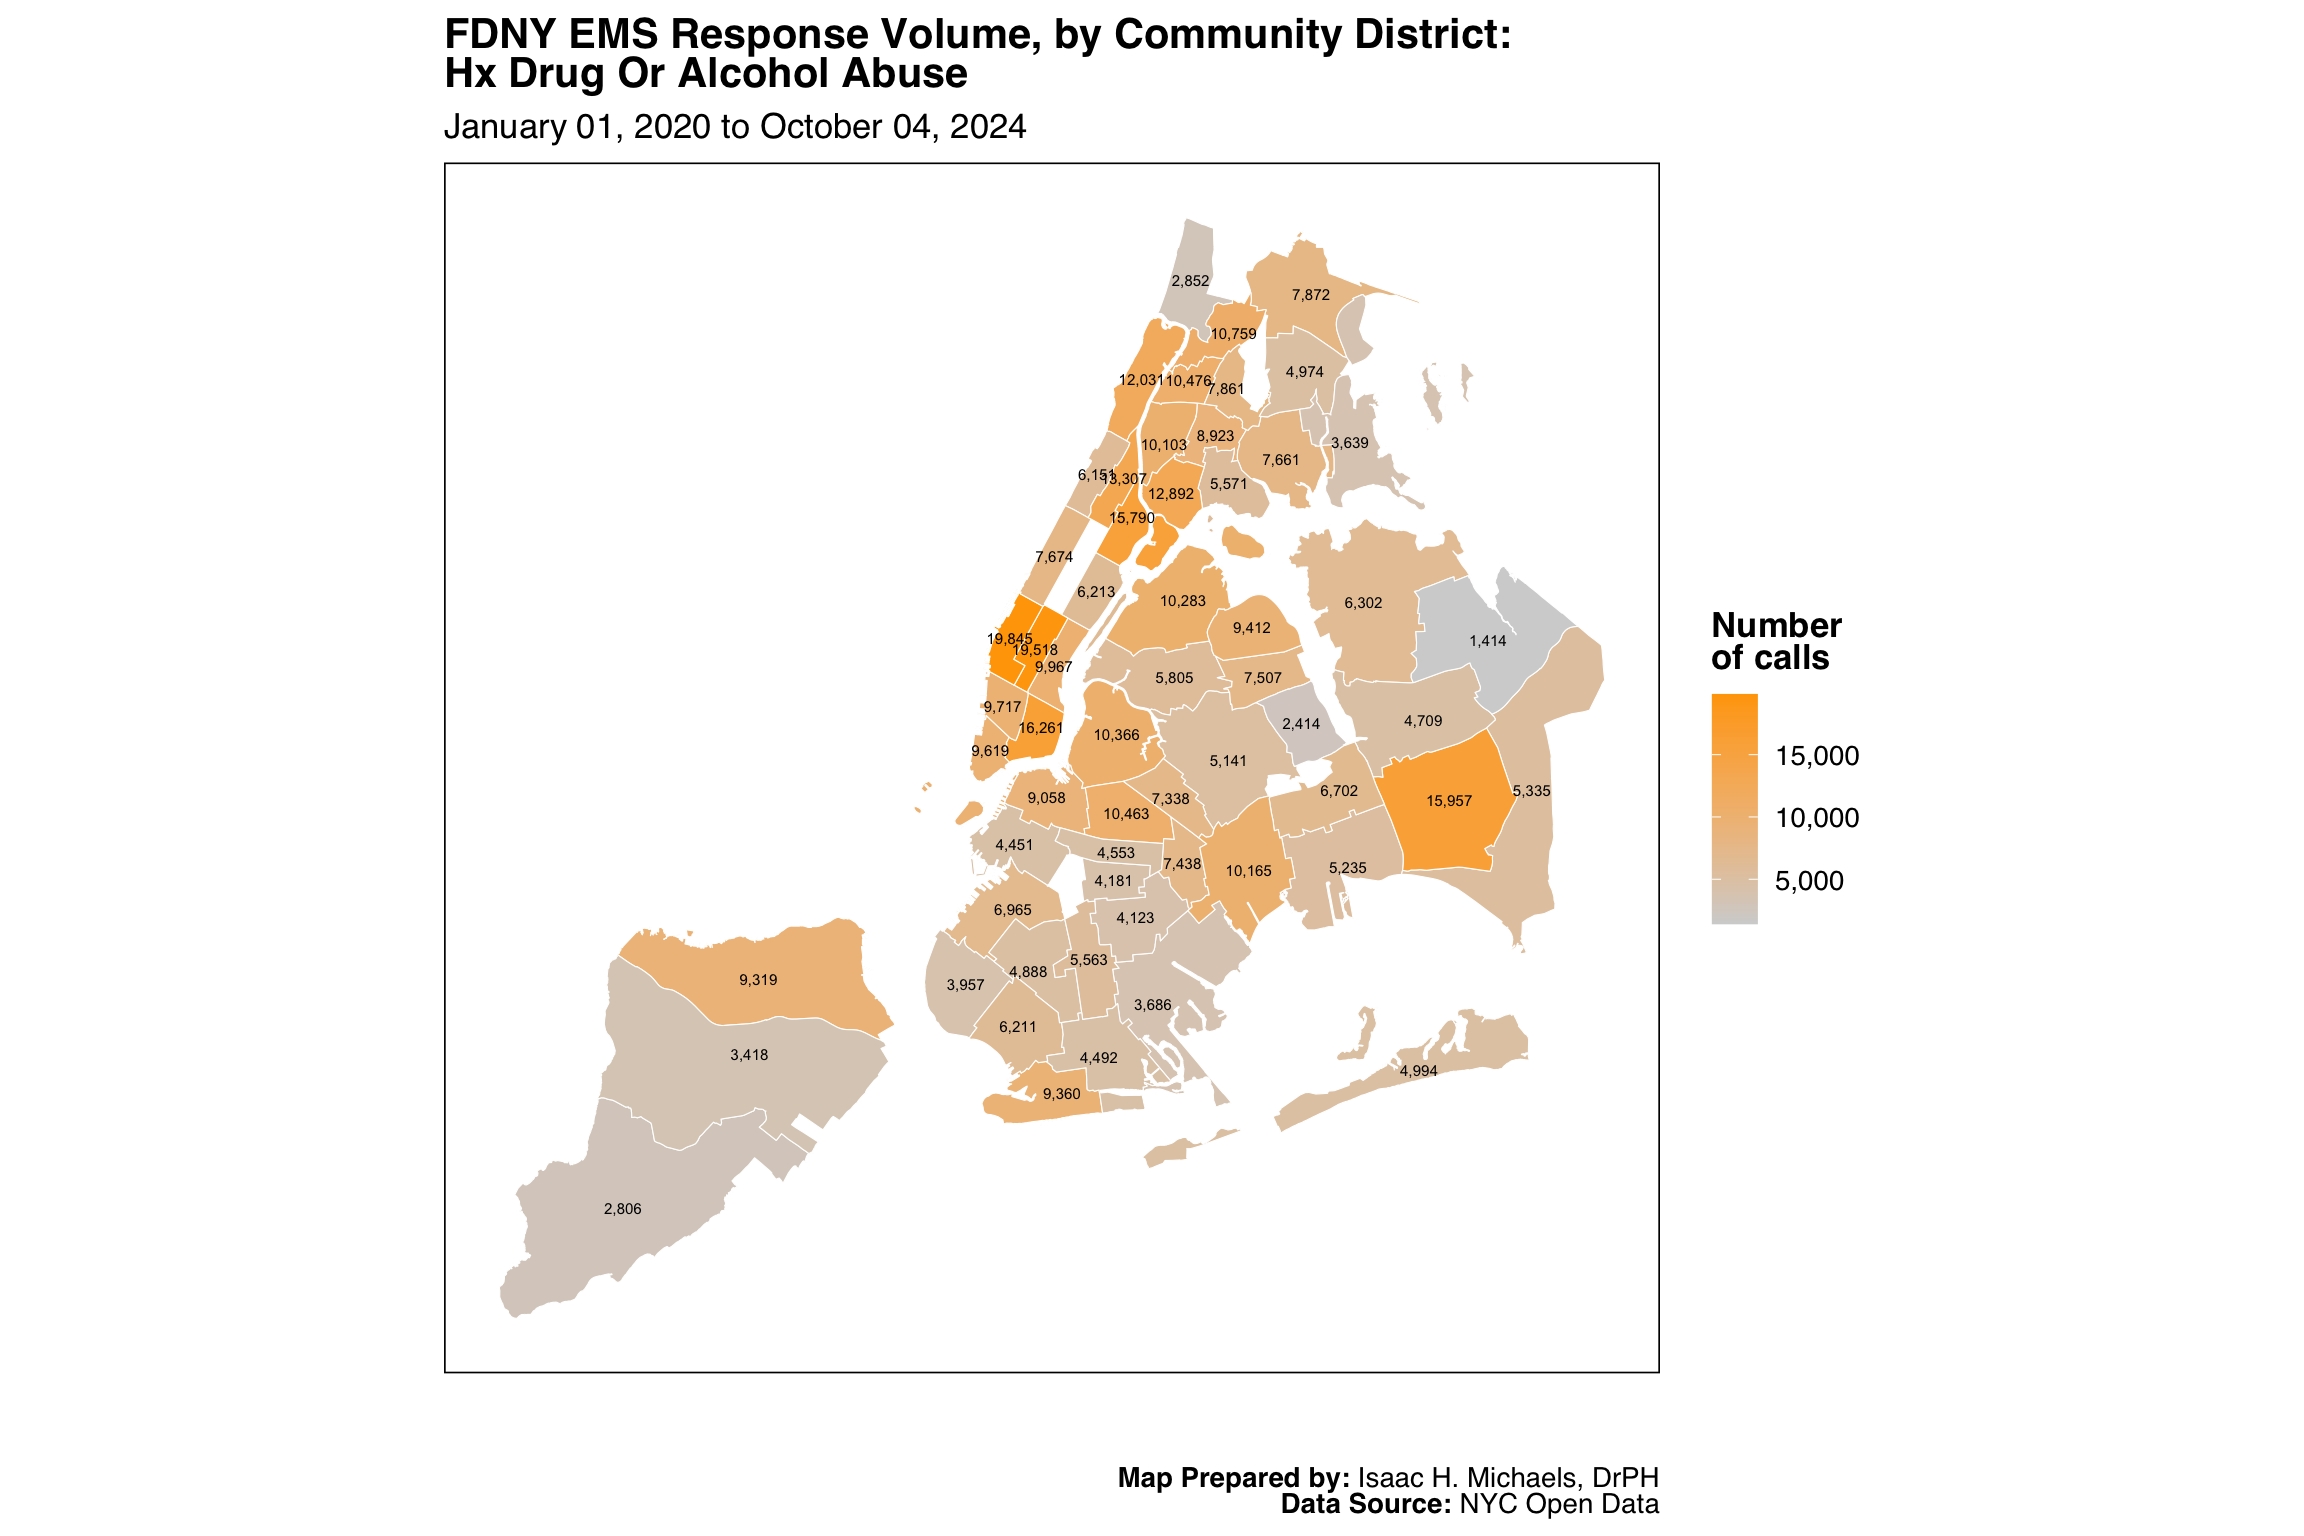
- Non-Critical Injury
- Unconscious Patient
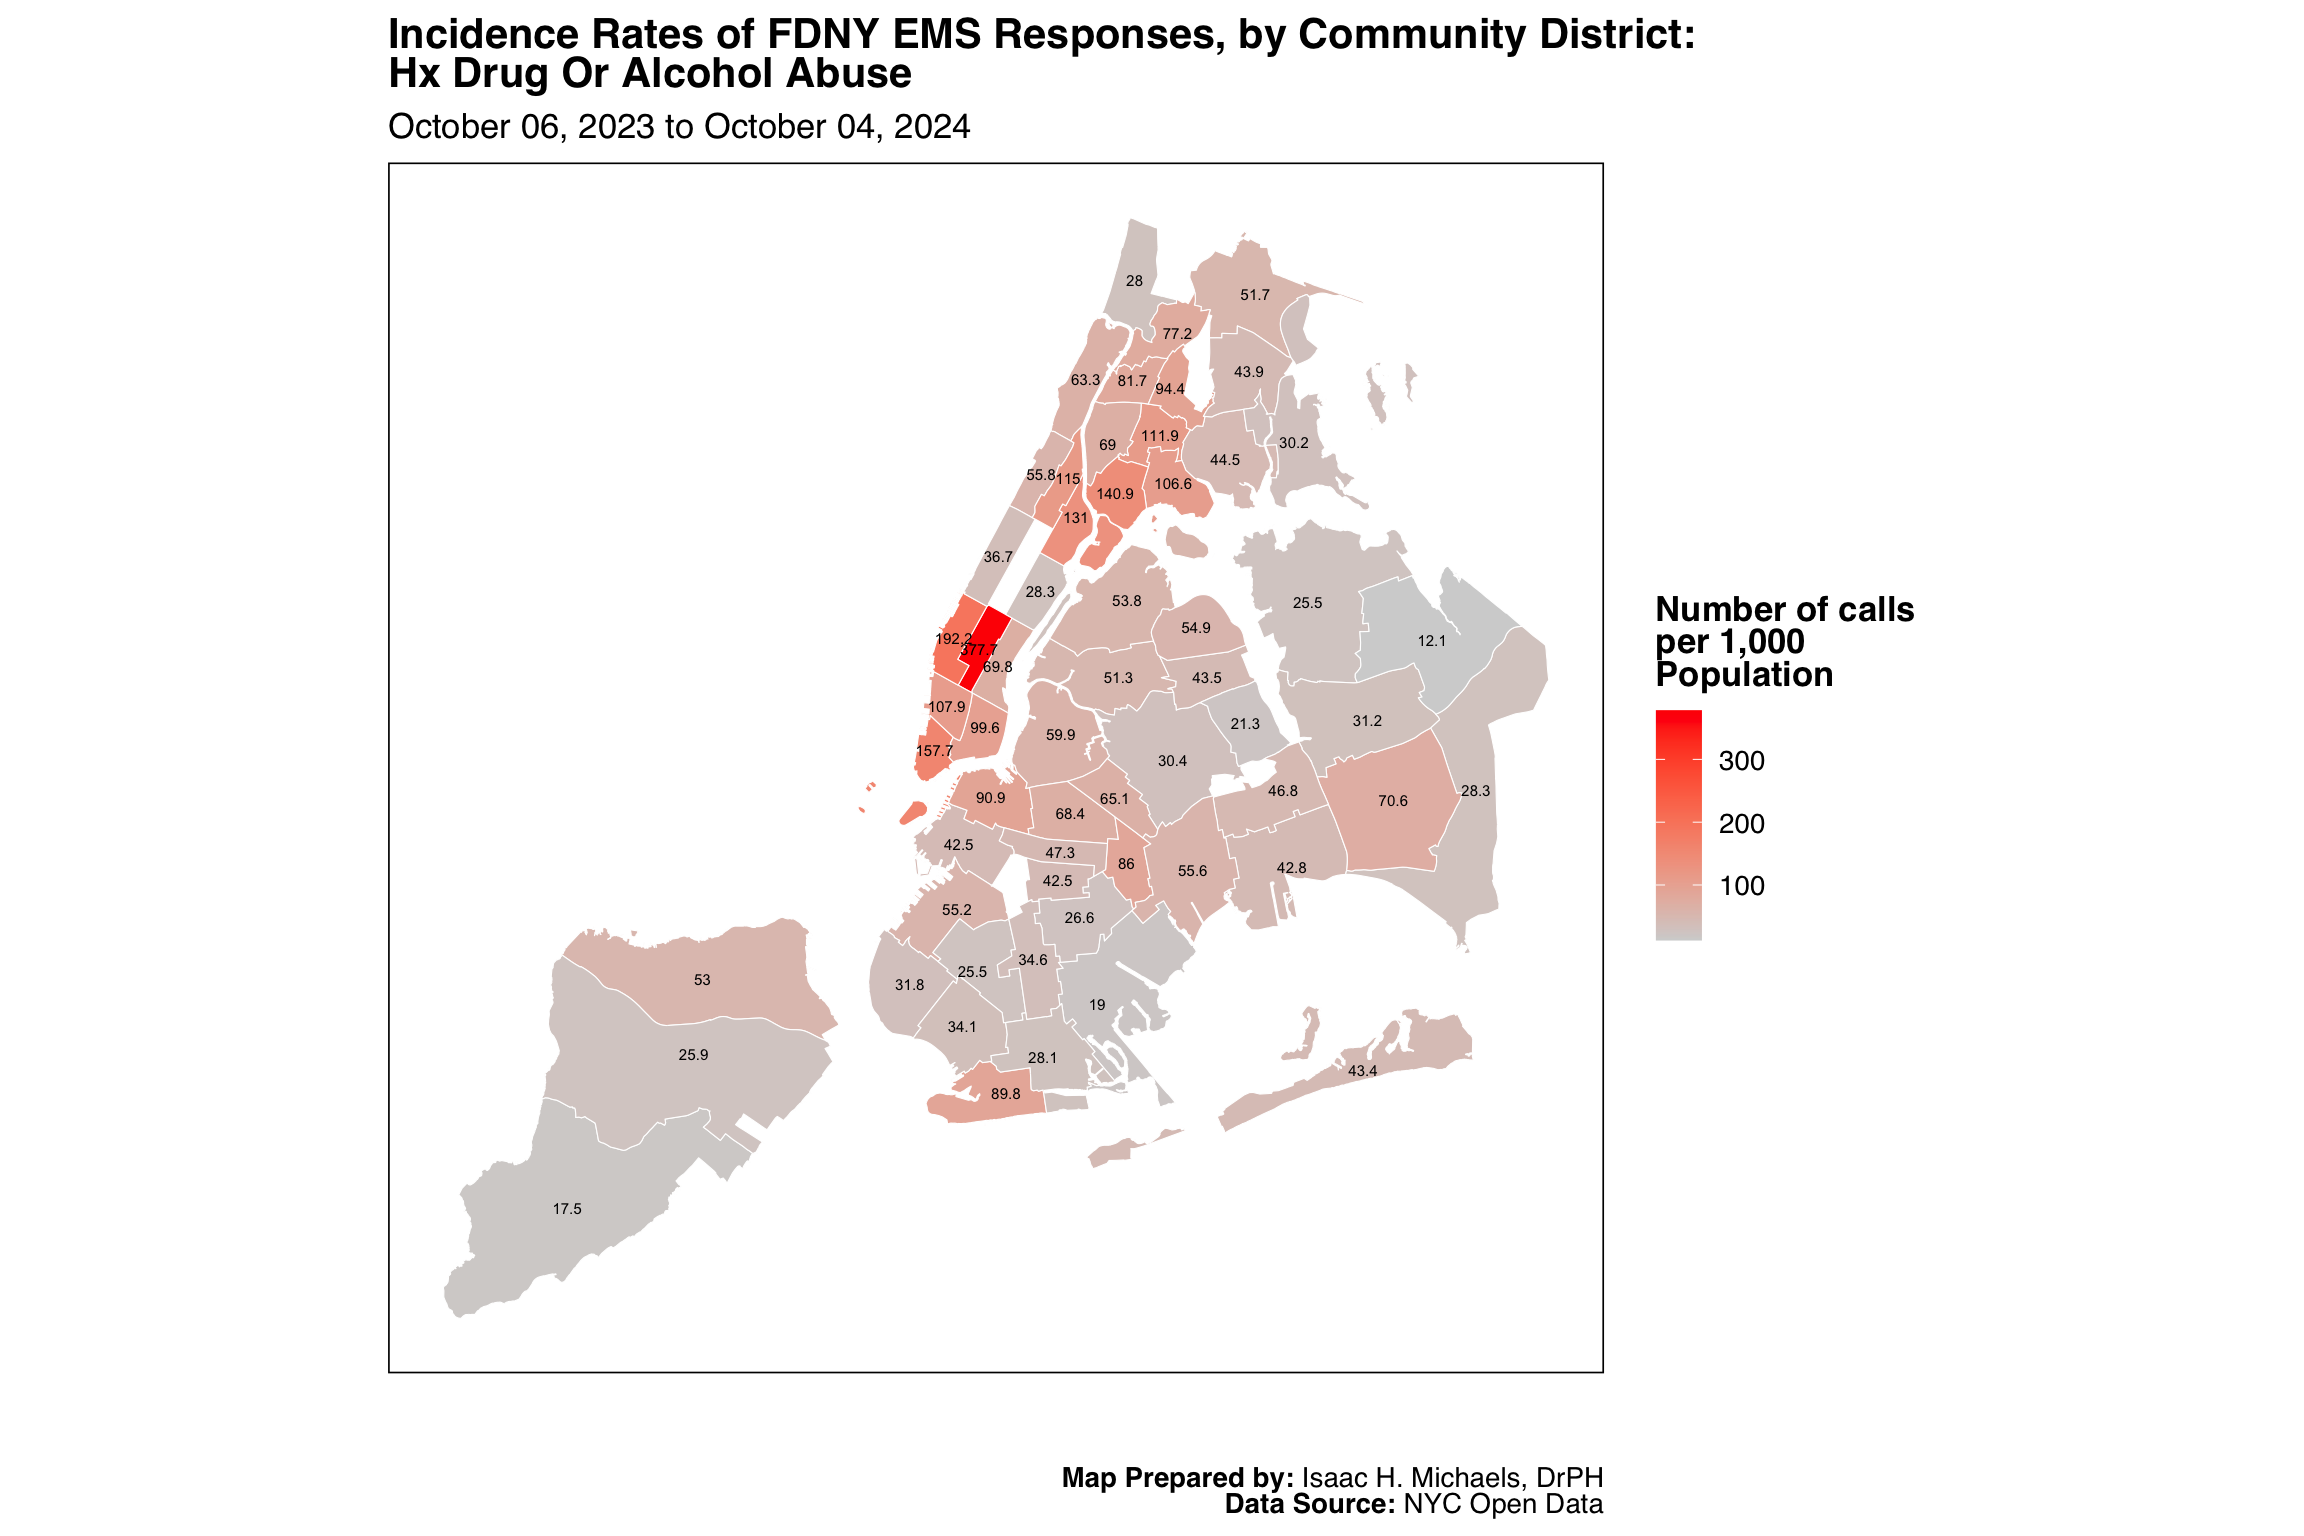
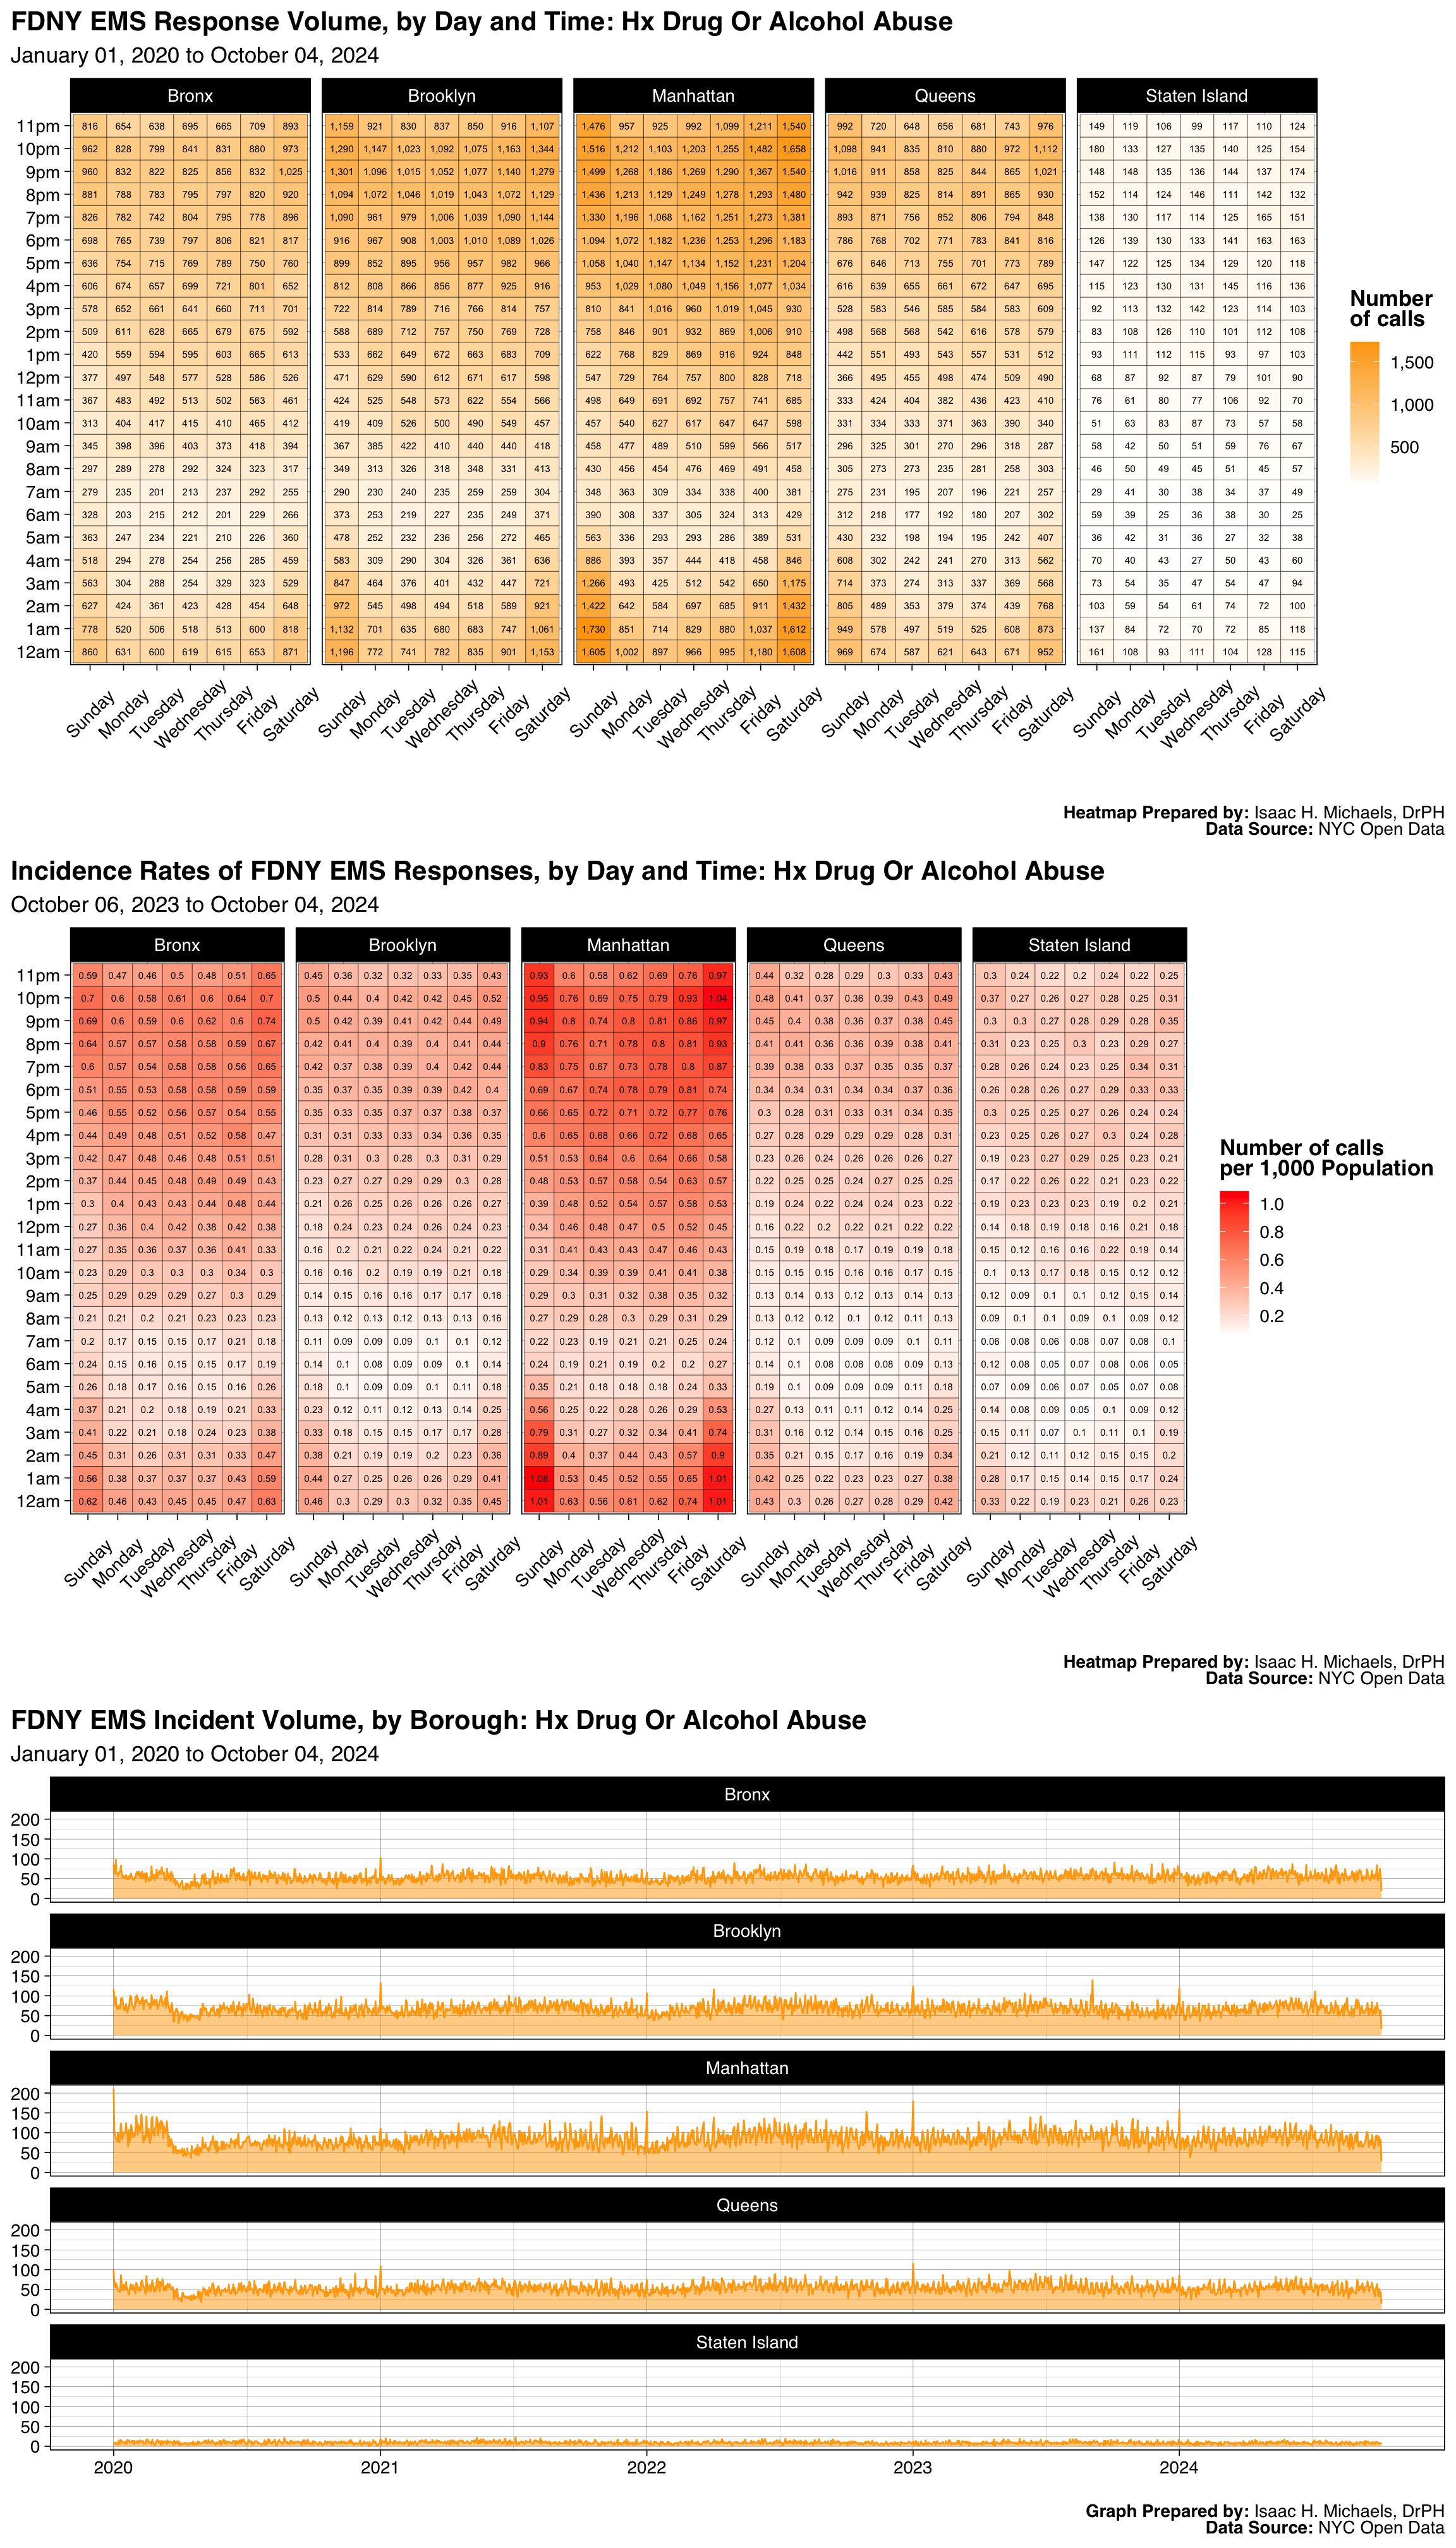
- Hx Drug Or Alcohol Abuse
- Cardiac Condition
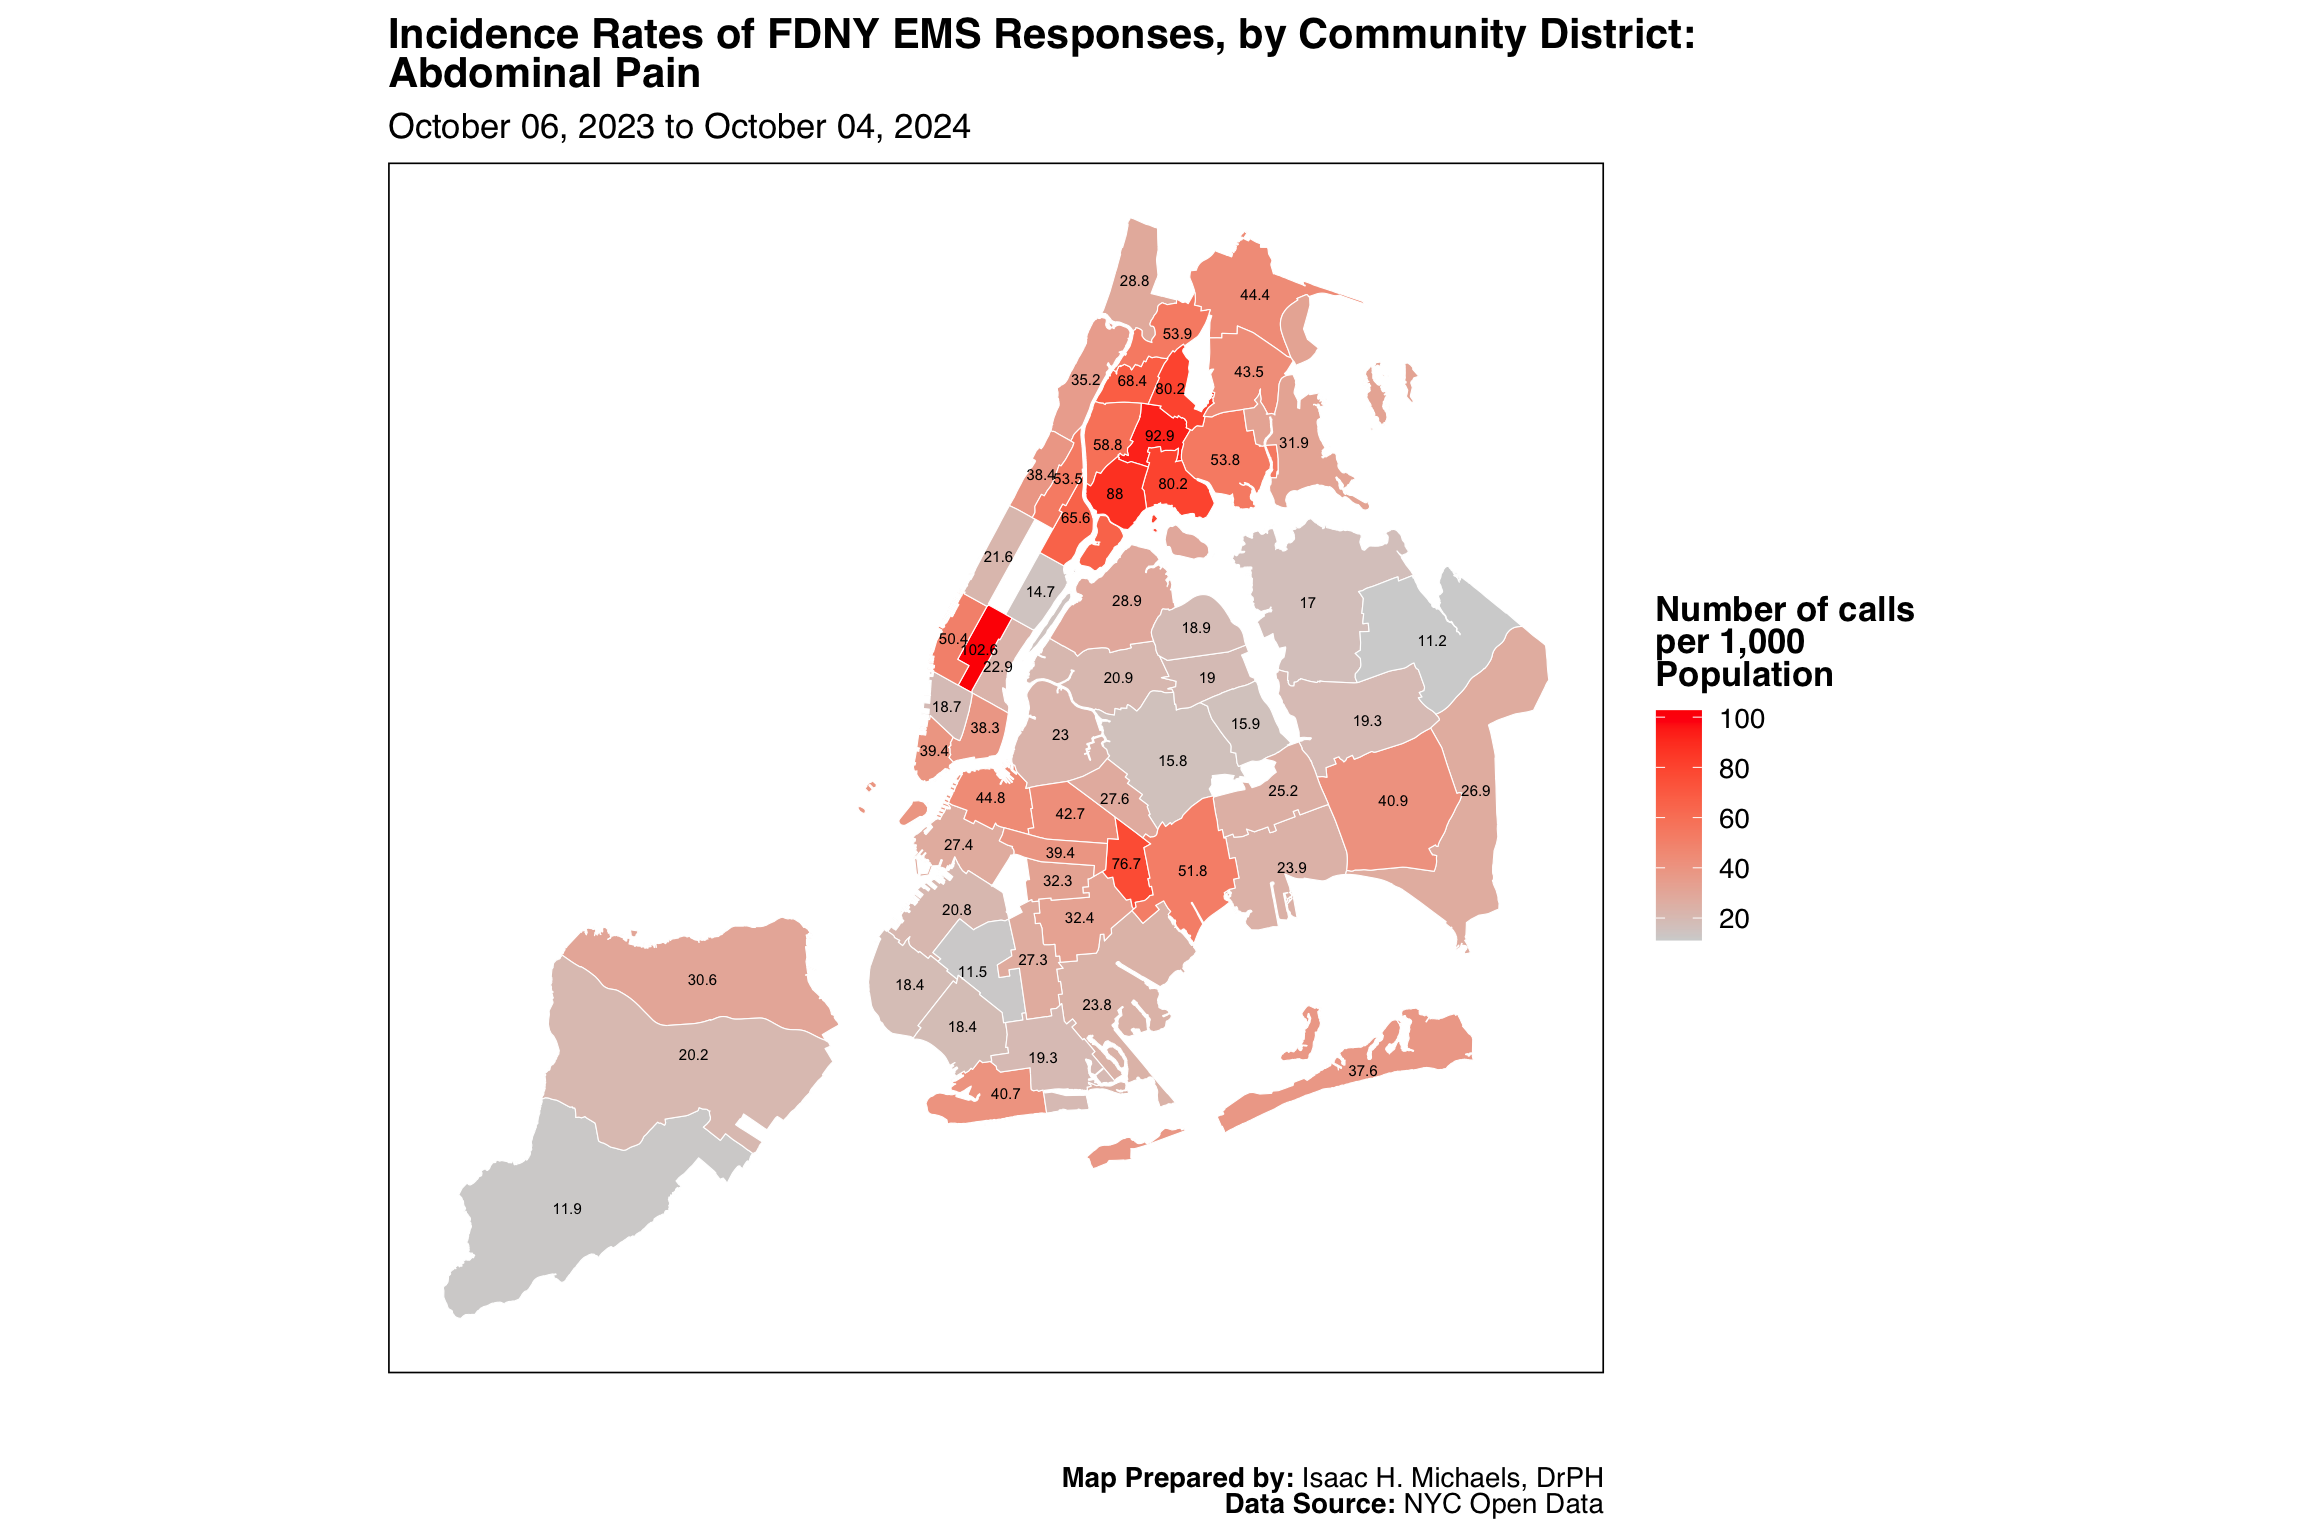
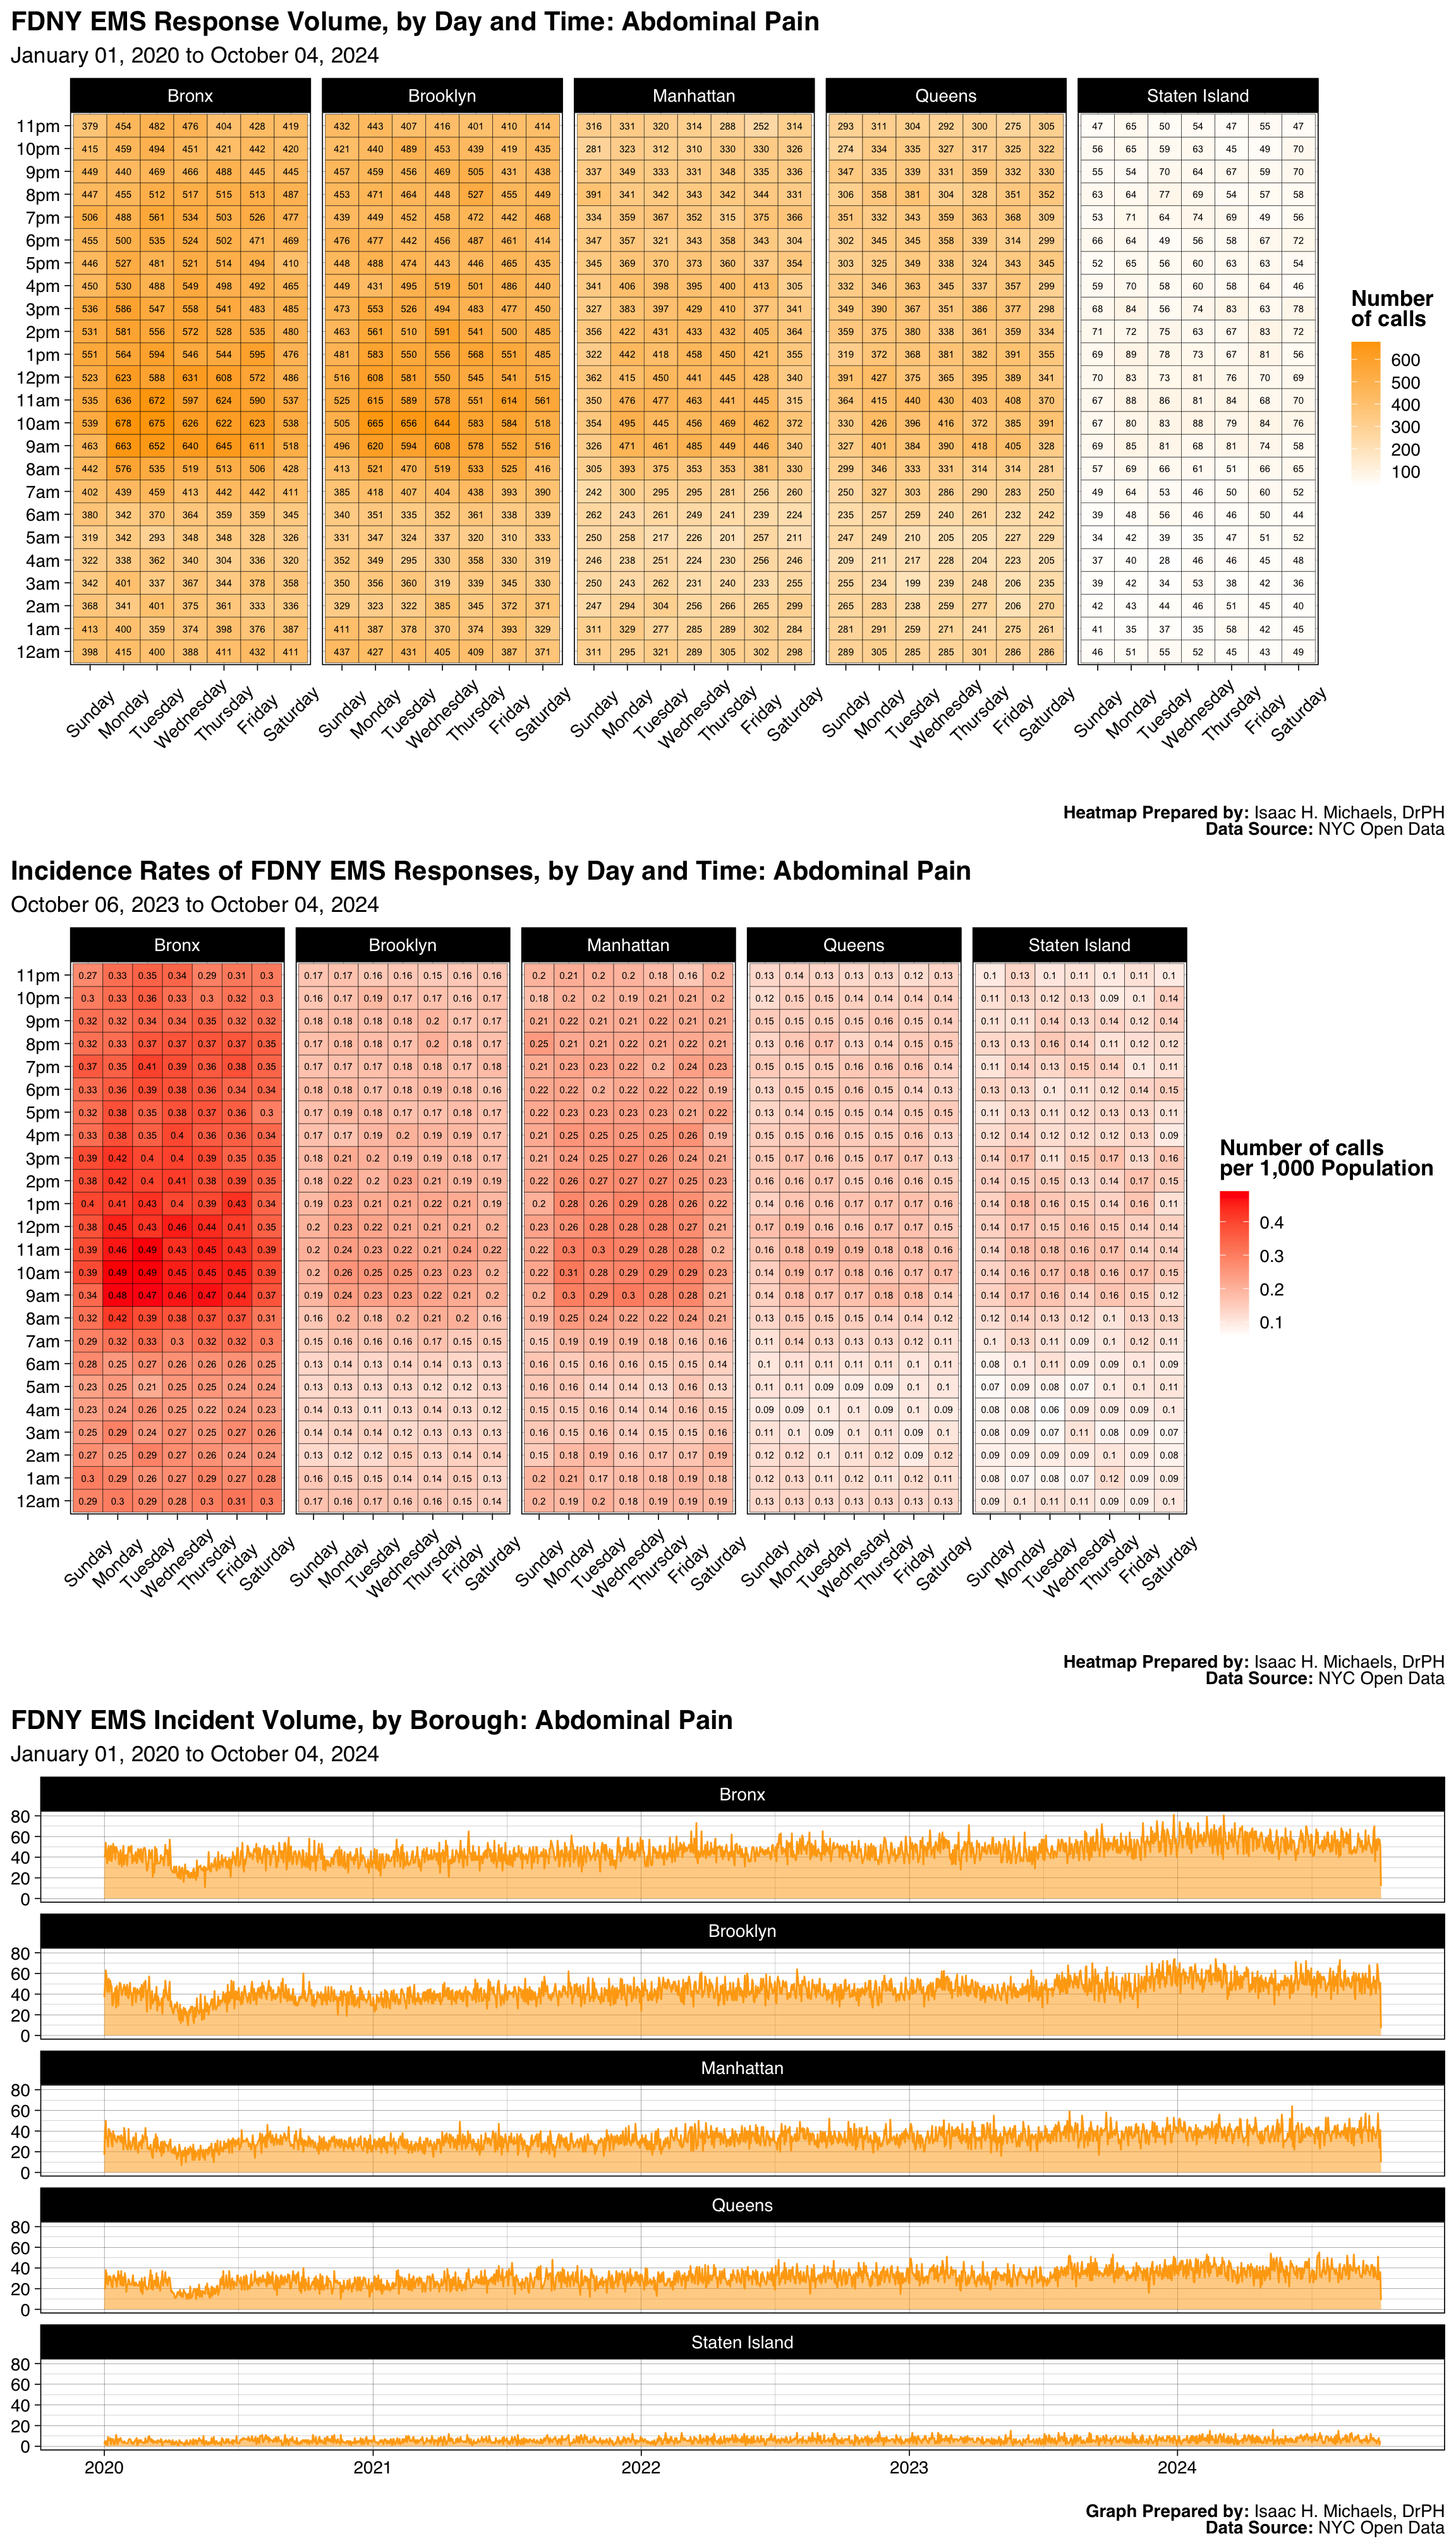
- Abdominal Pain
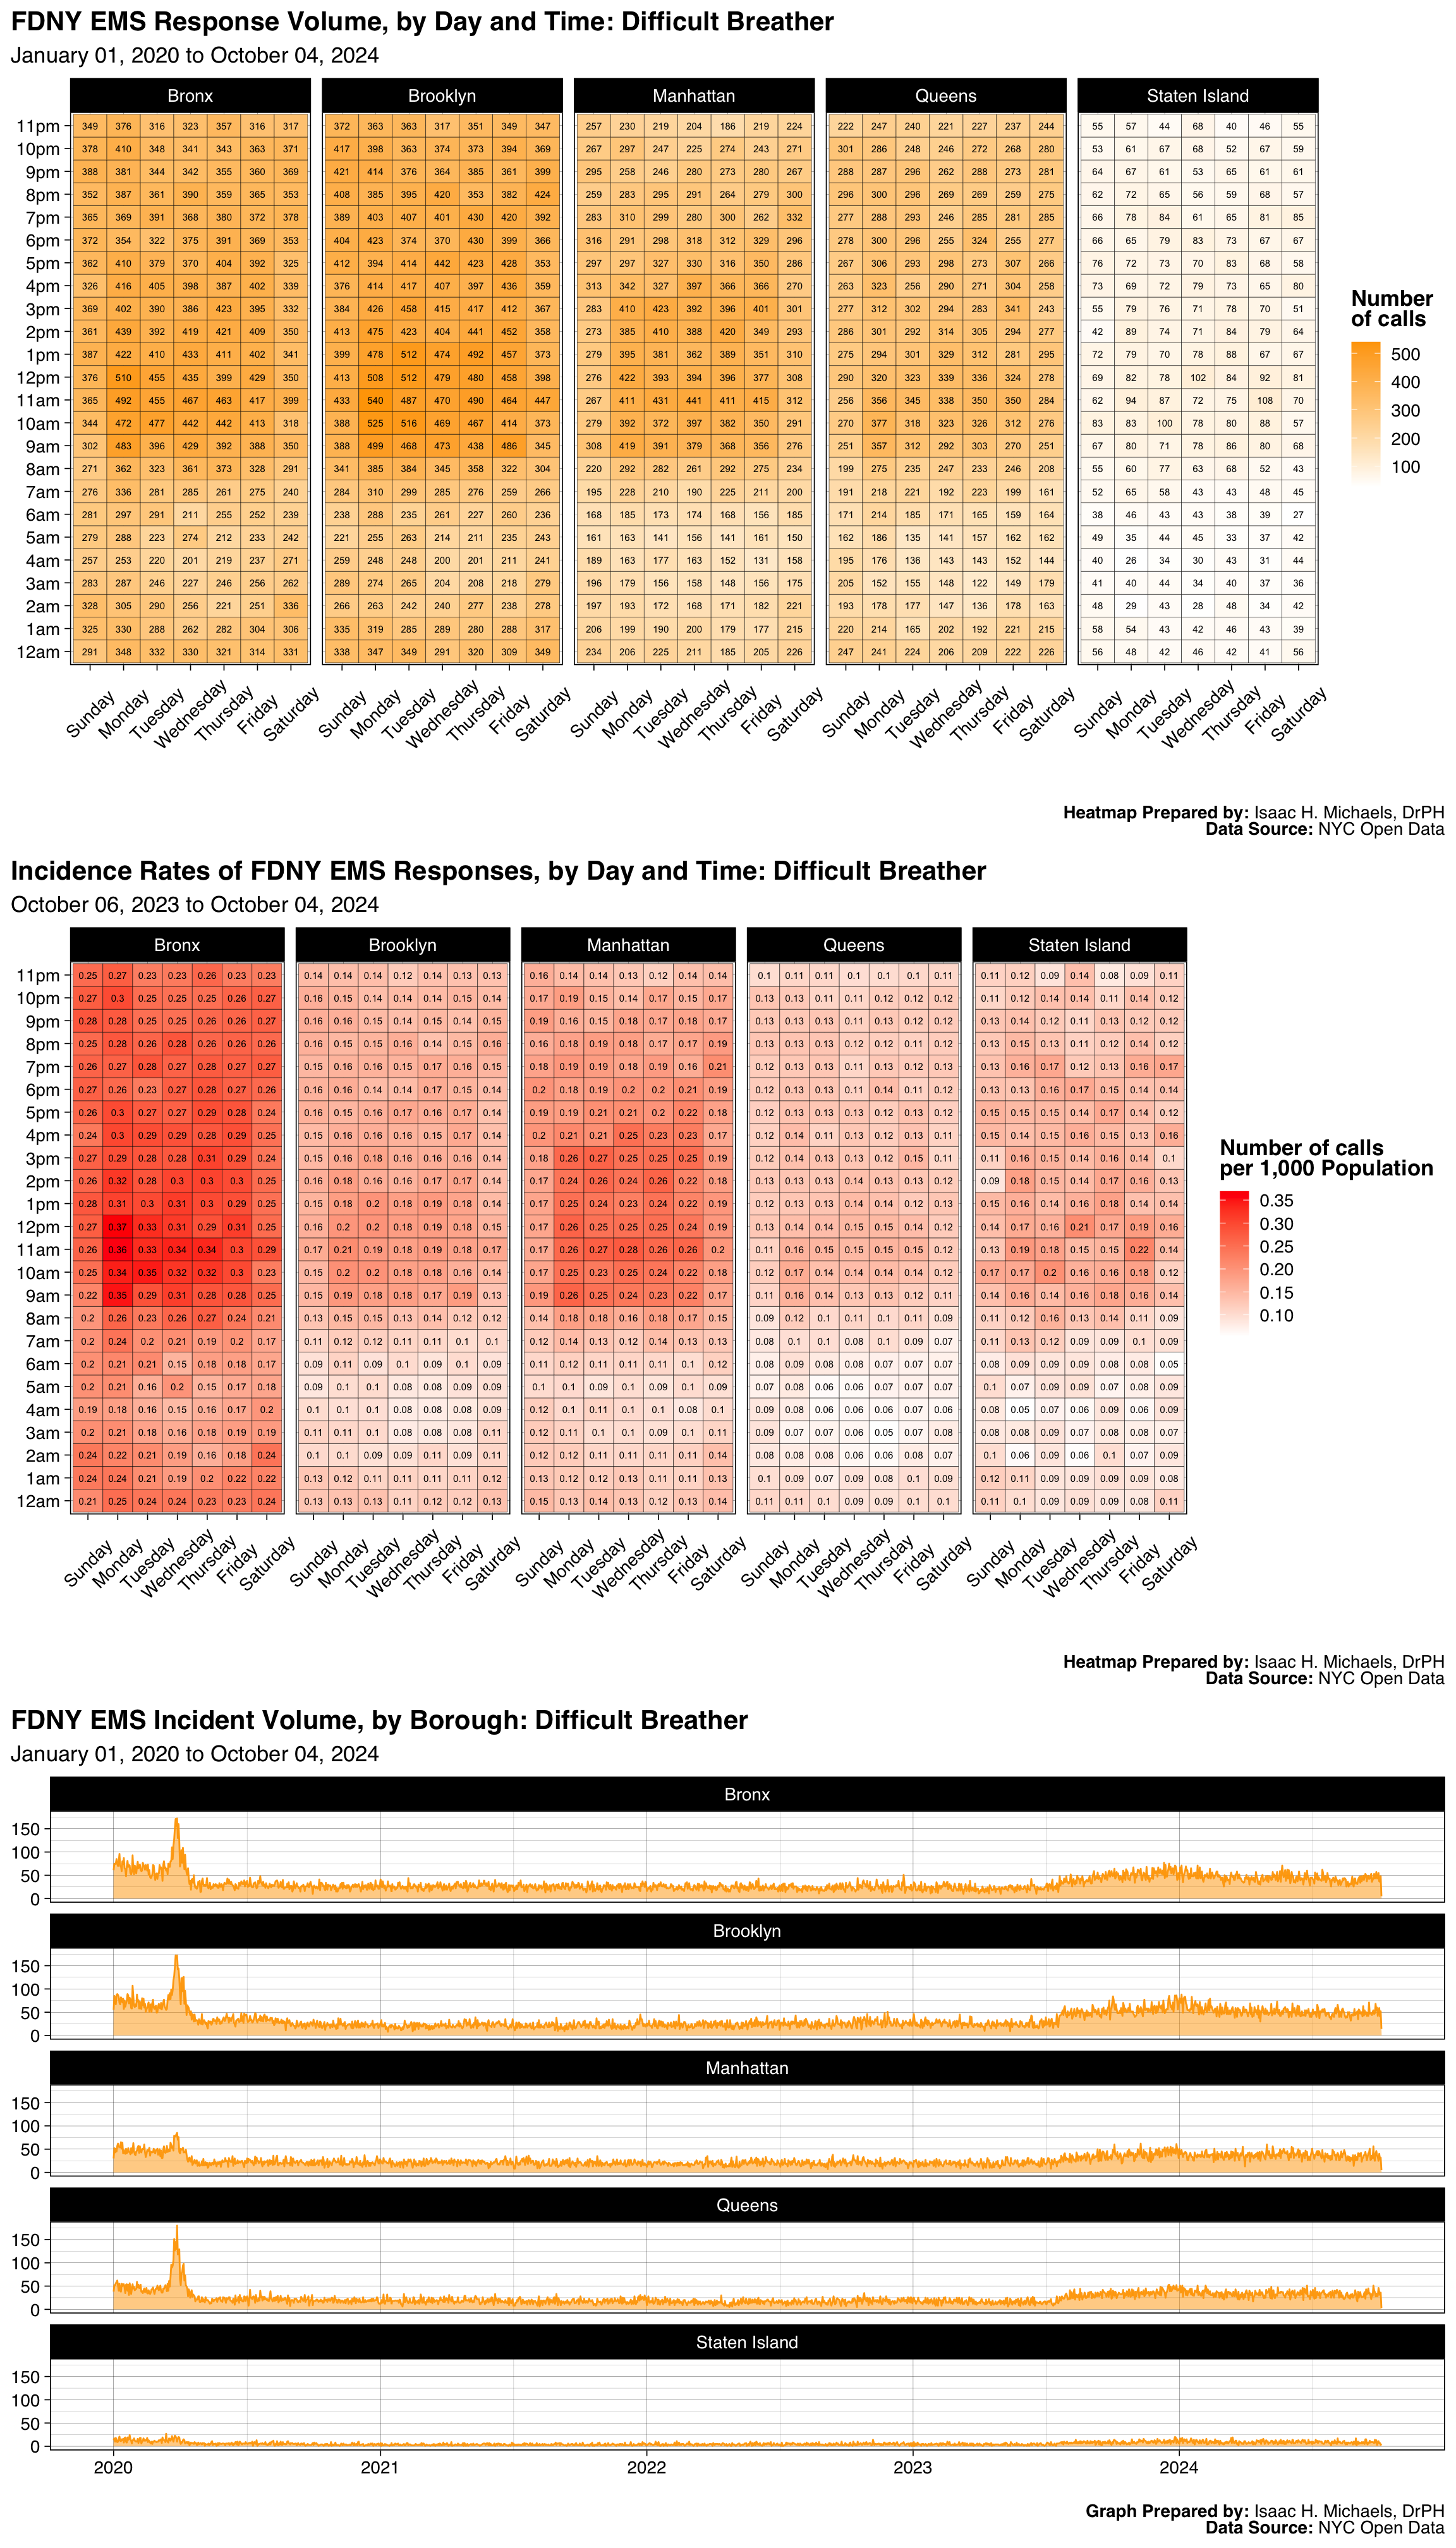
- Difficult Breather
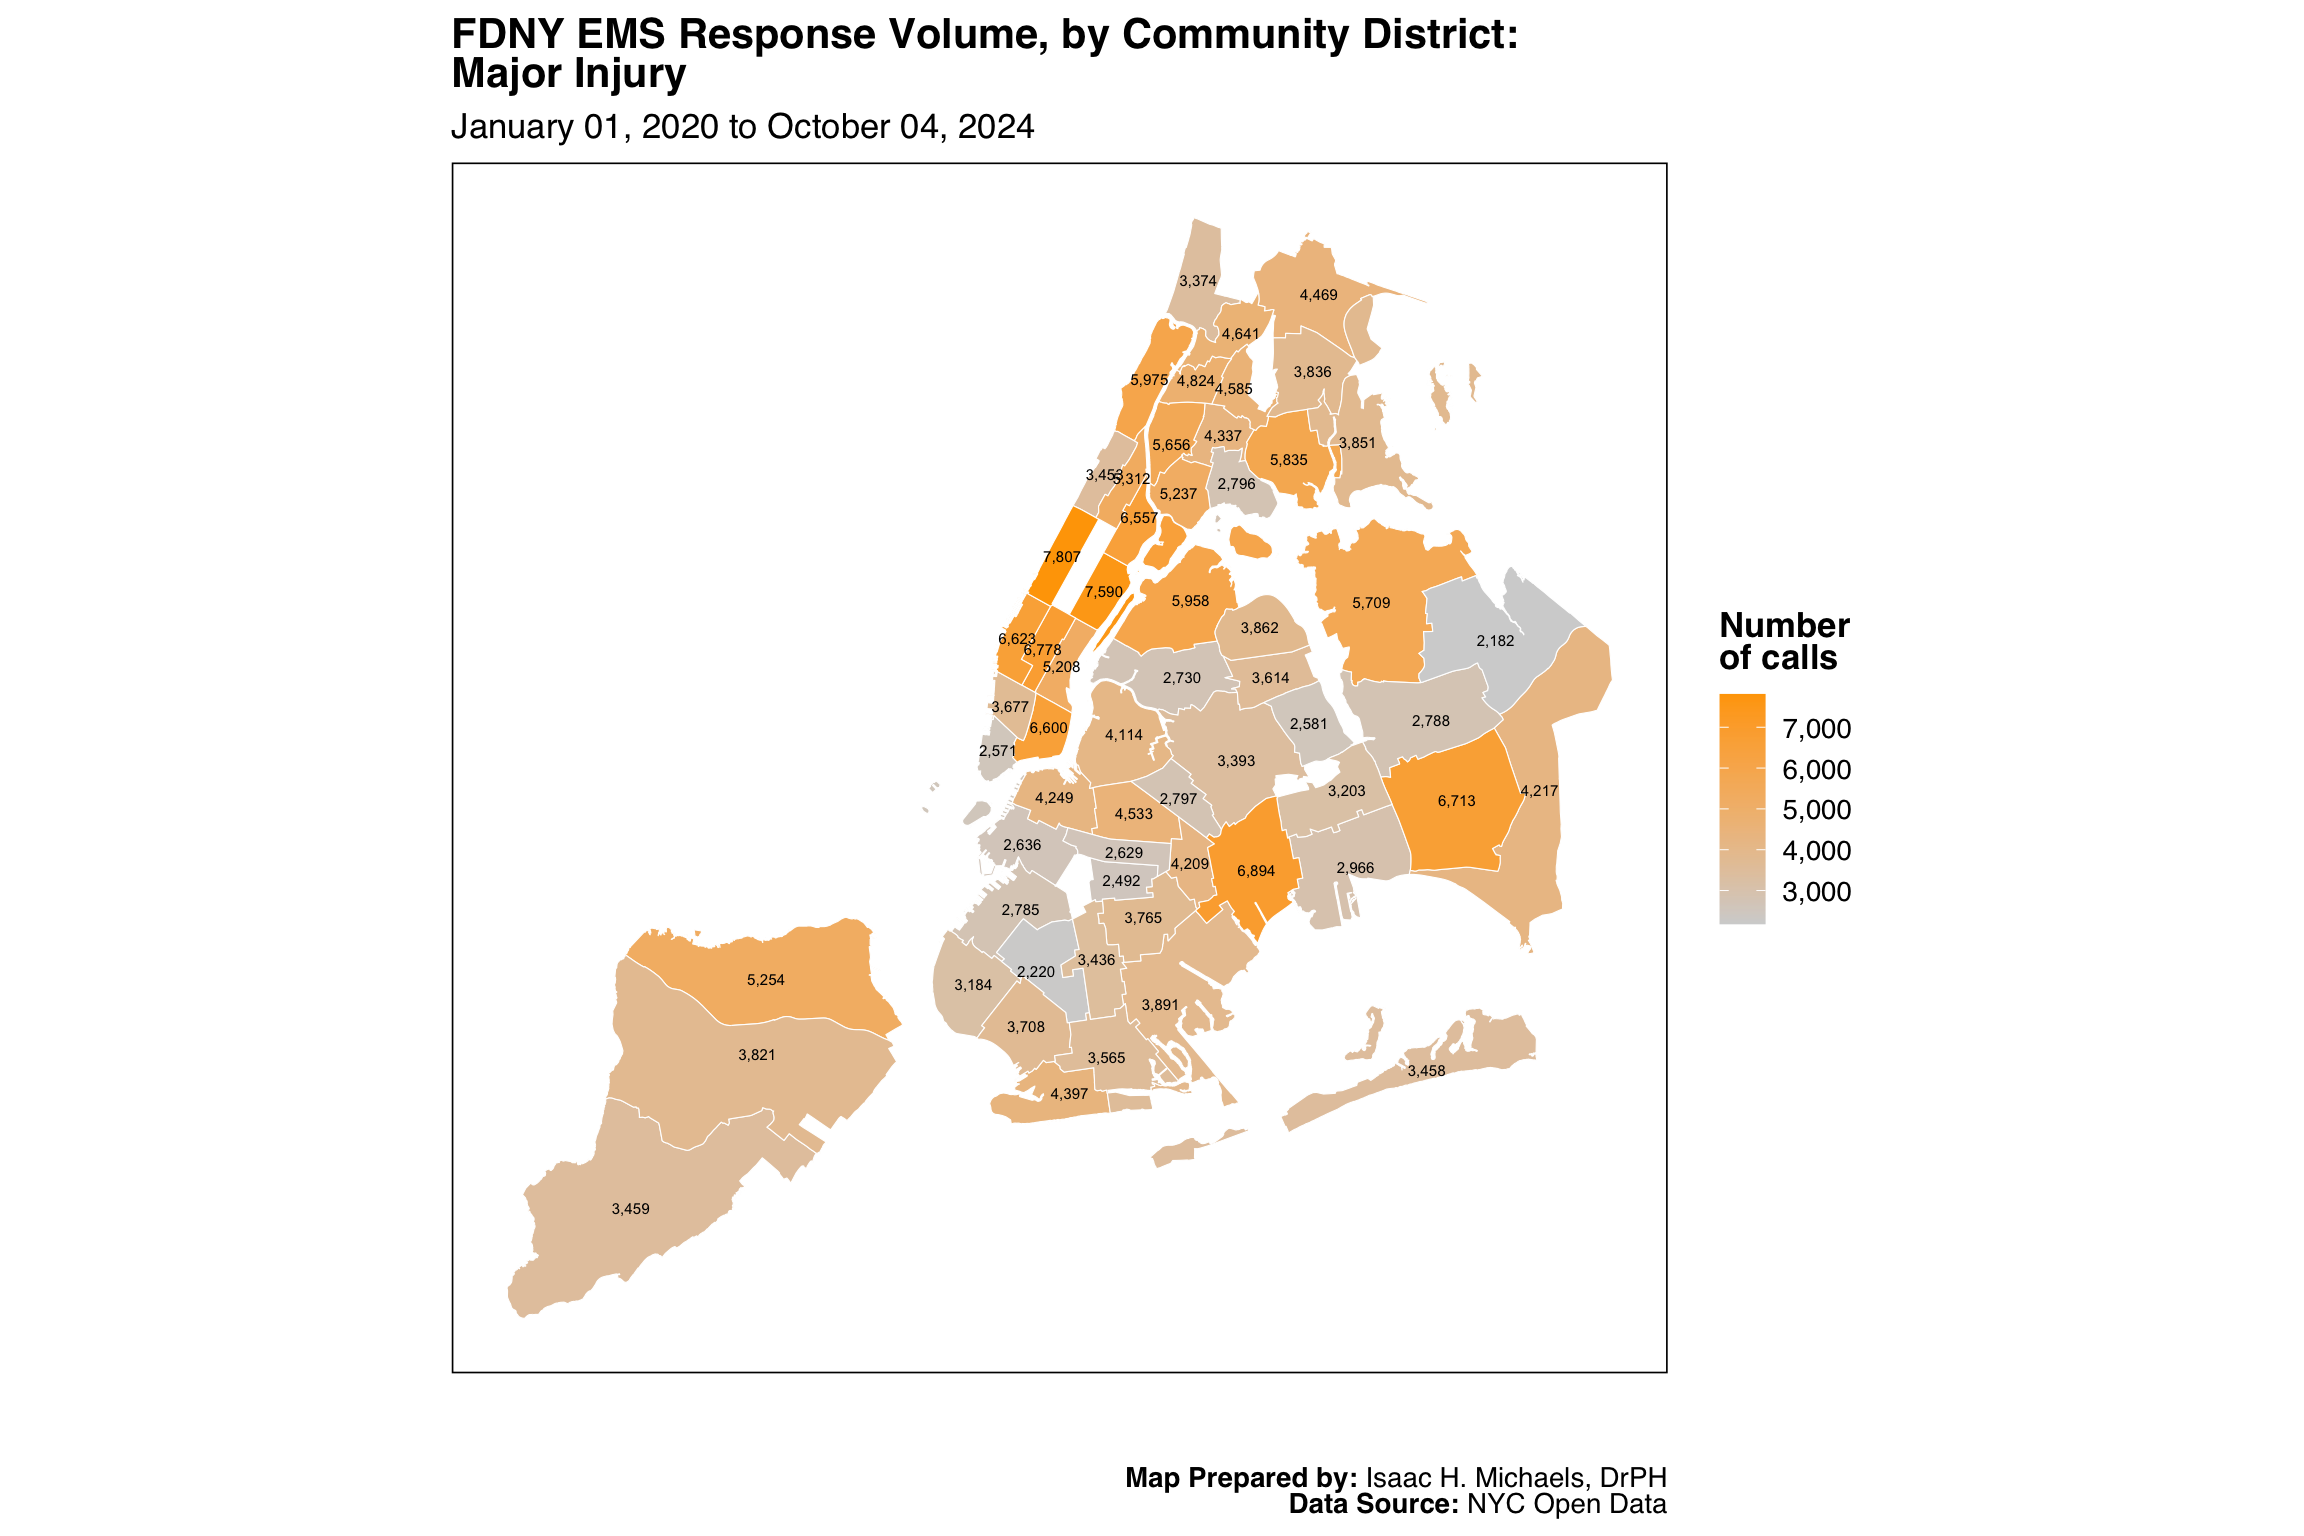
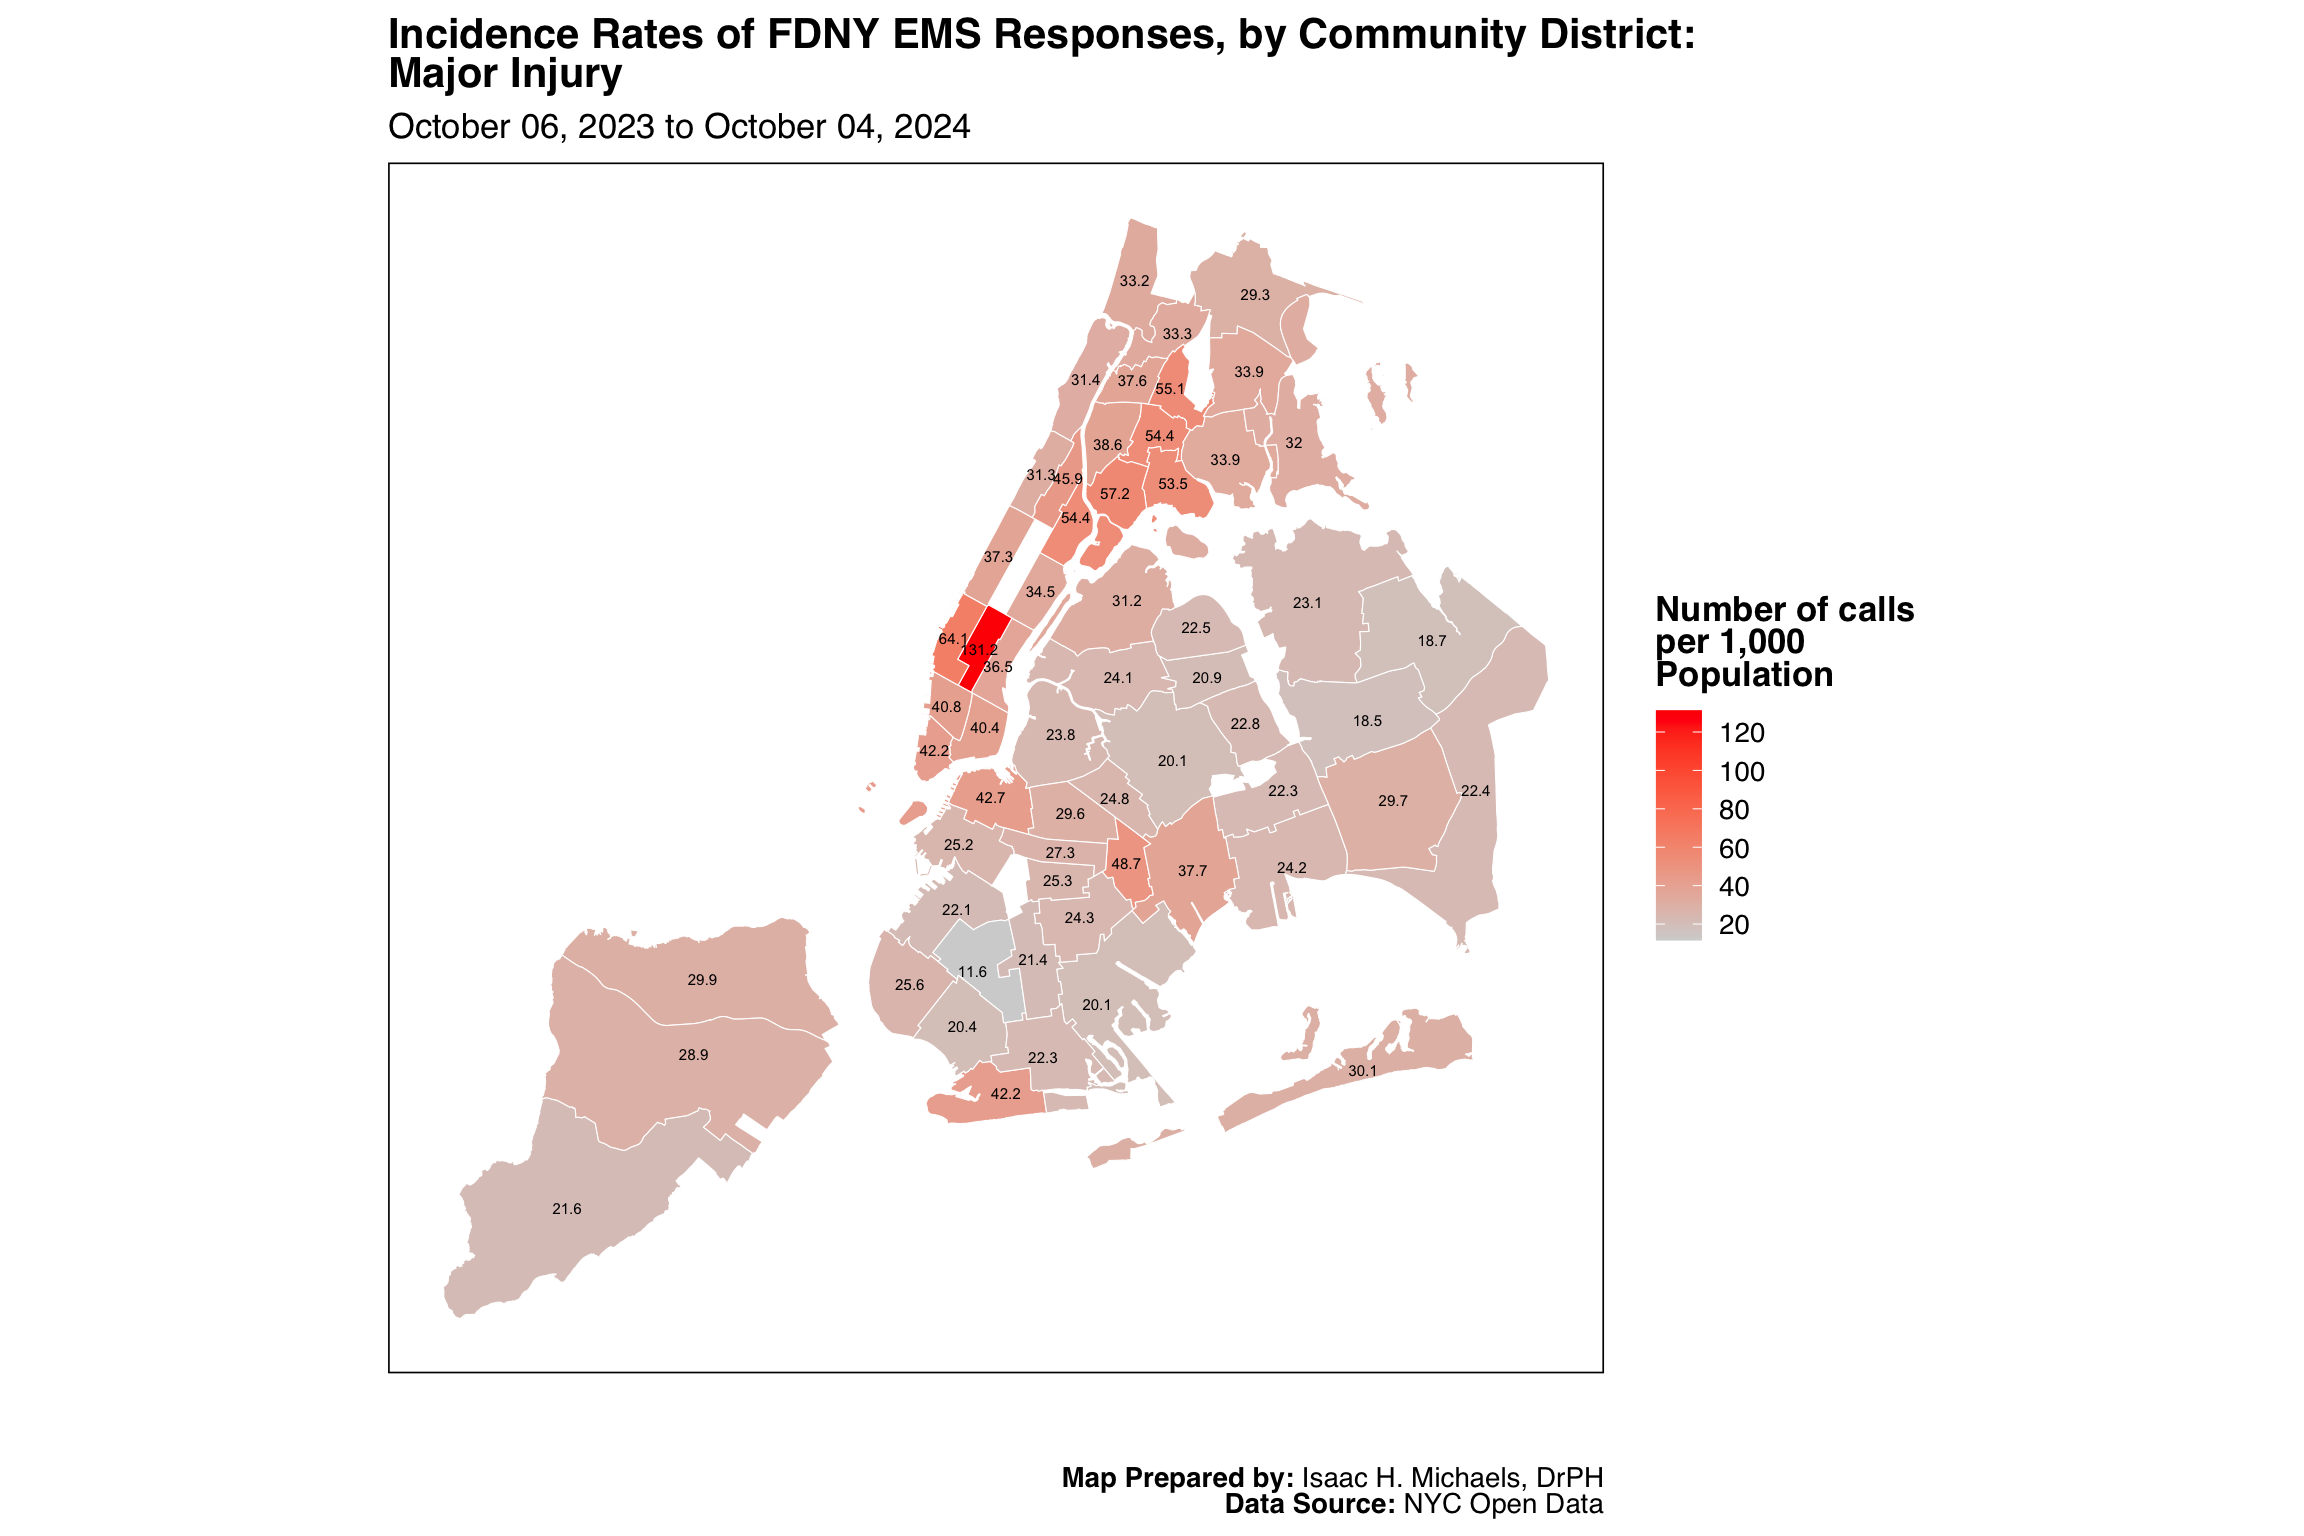
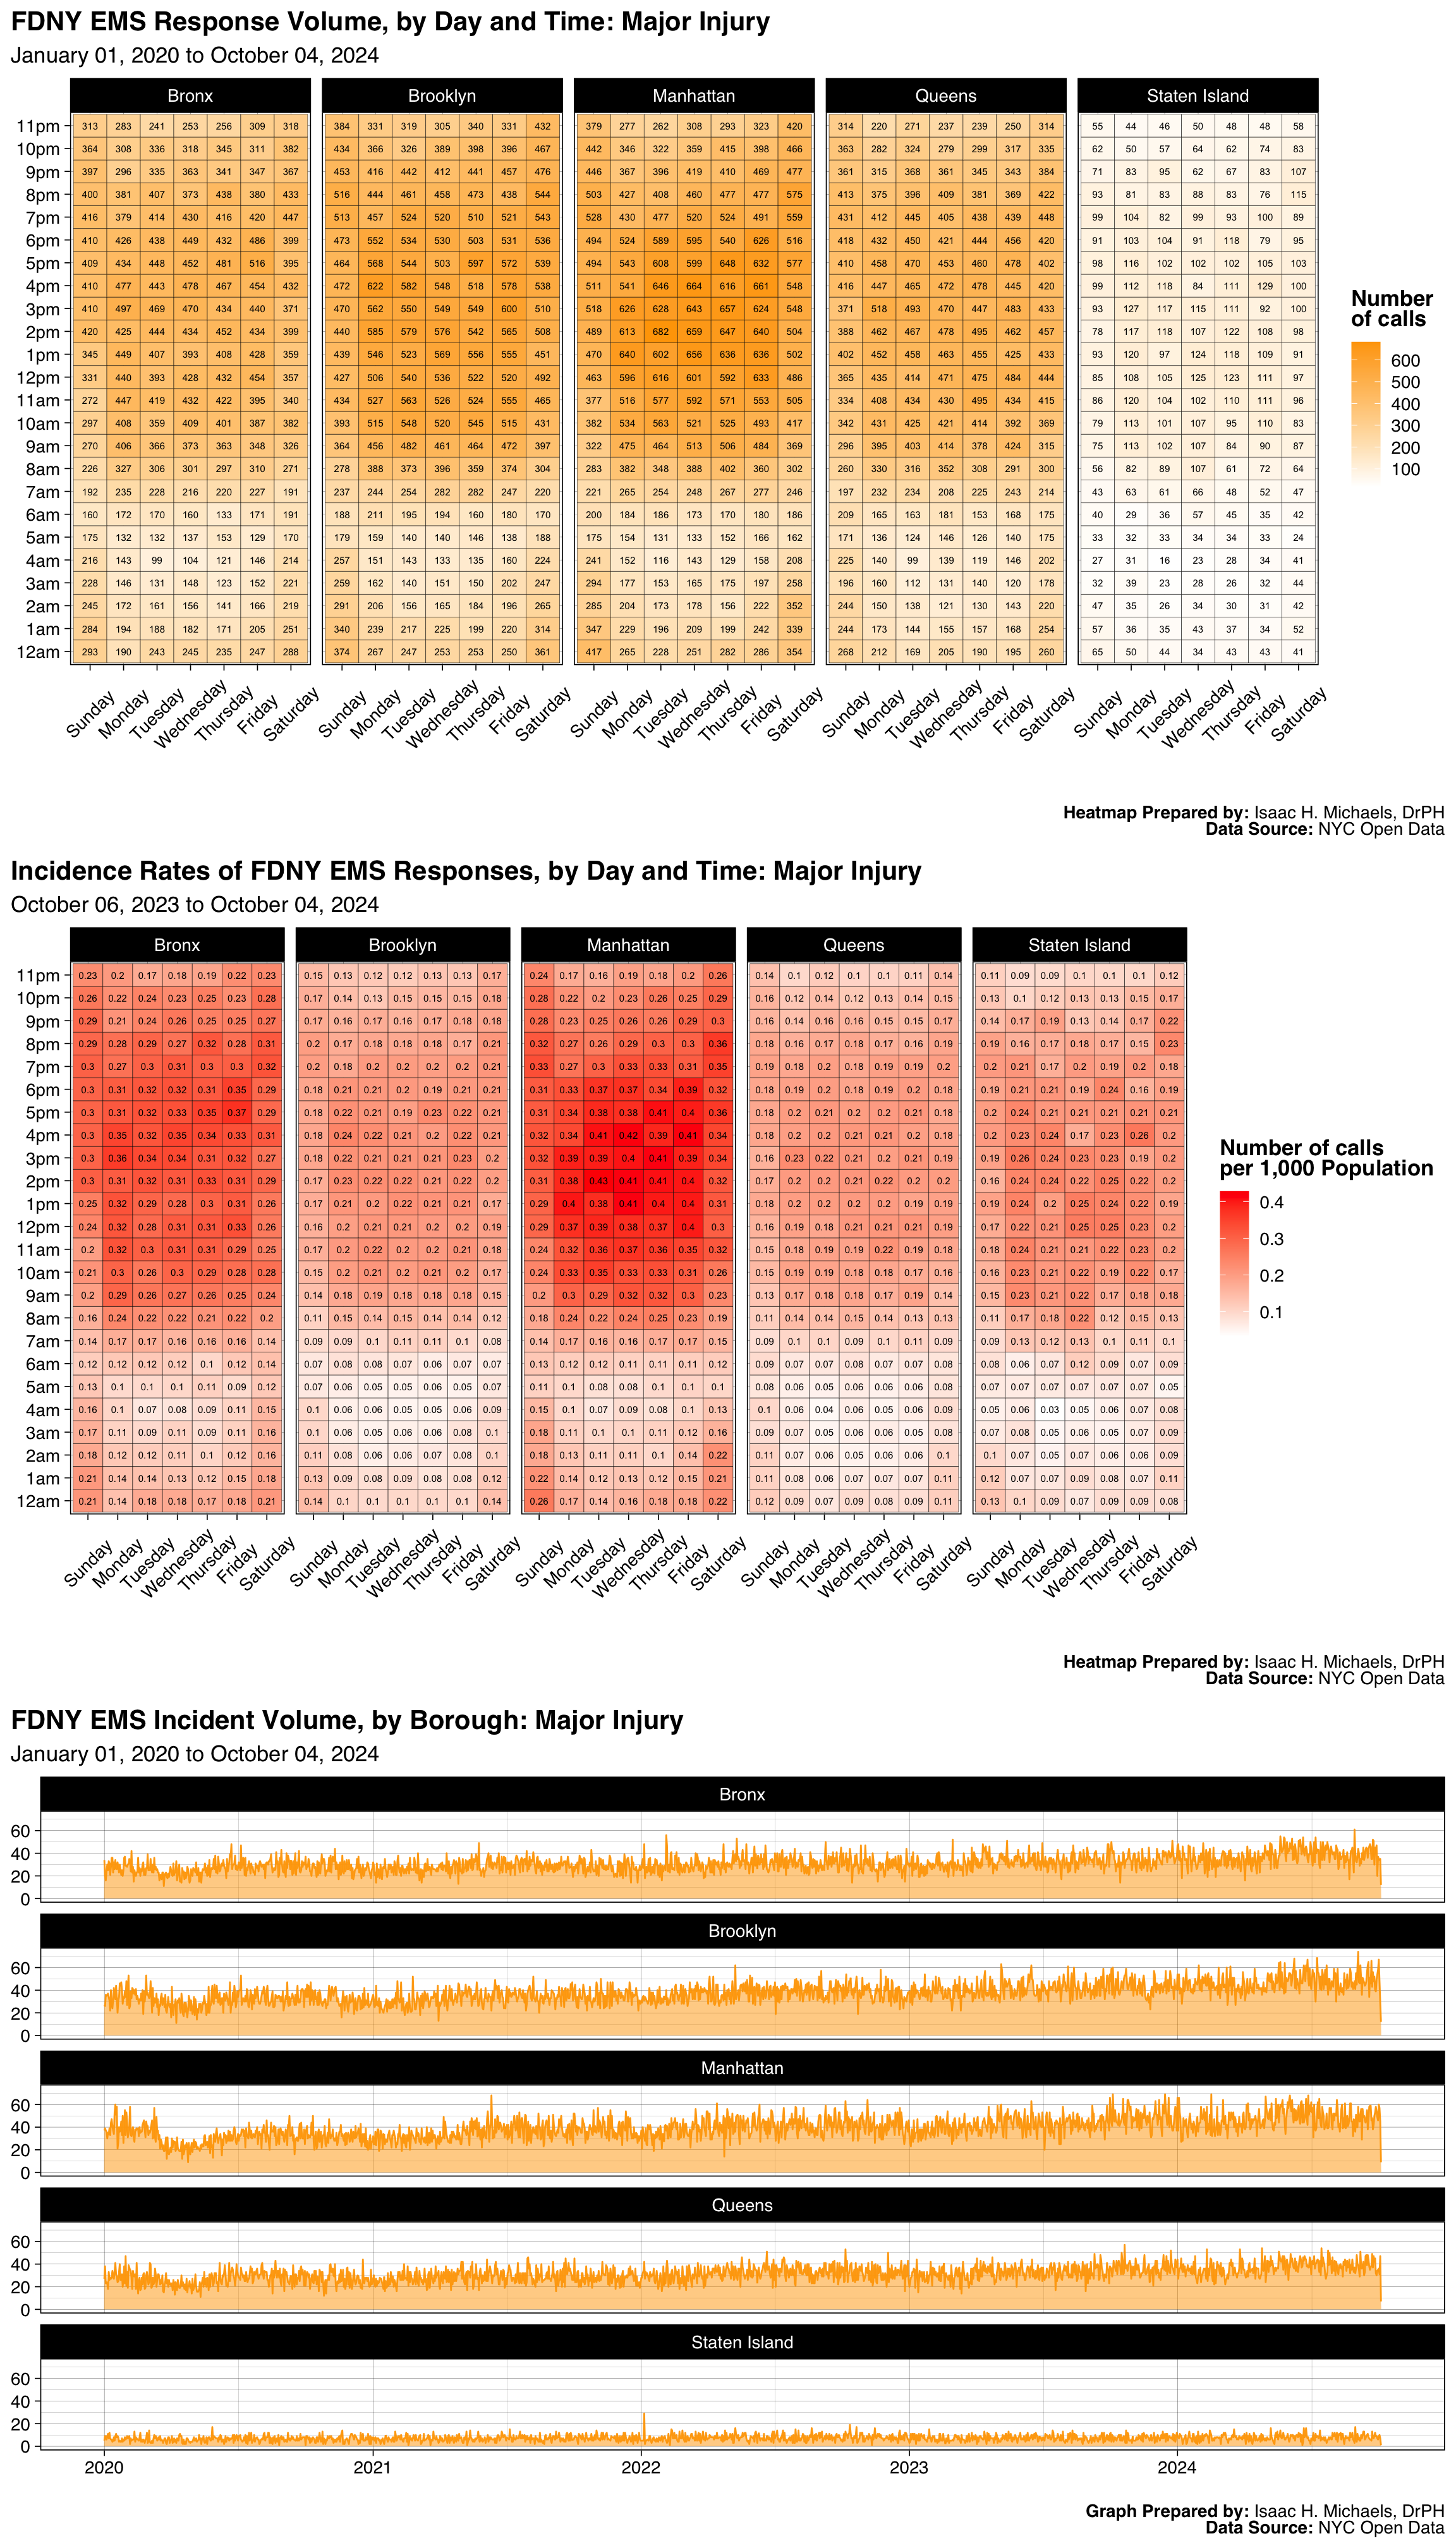
- Major Injury
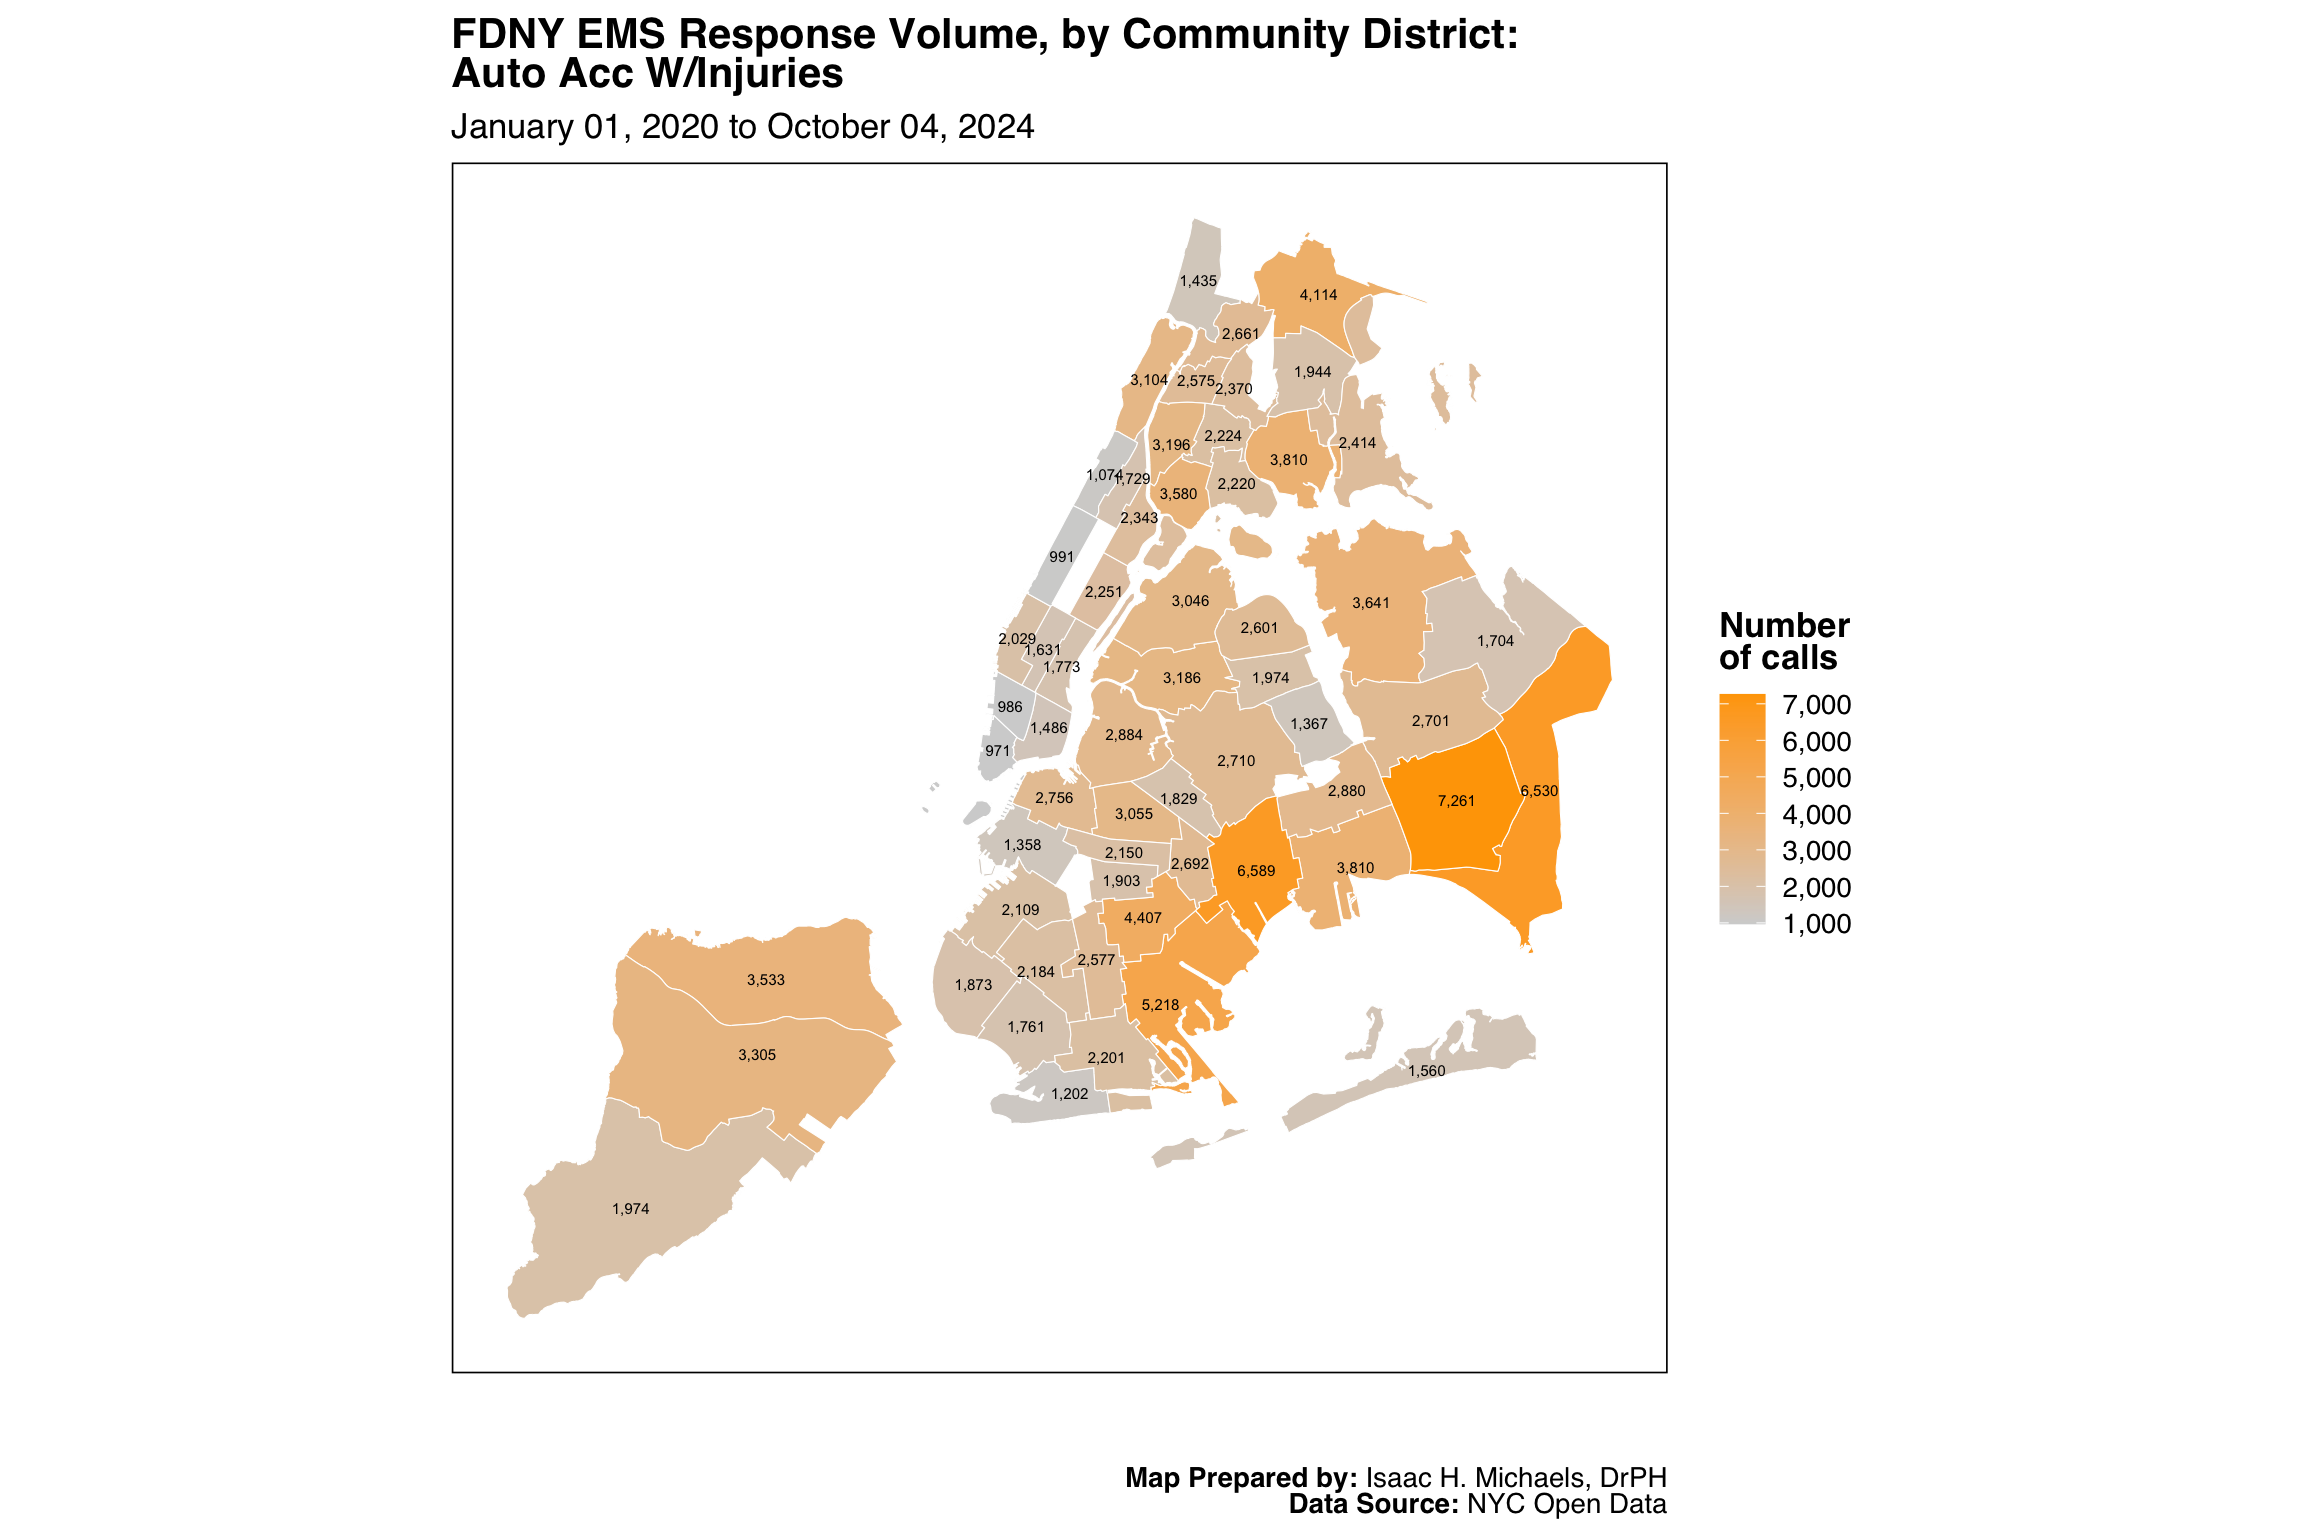
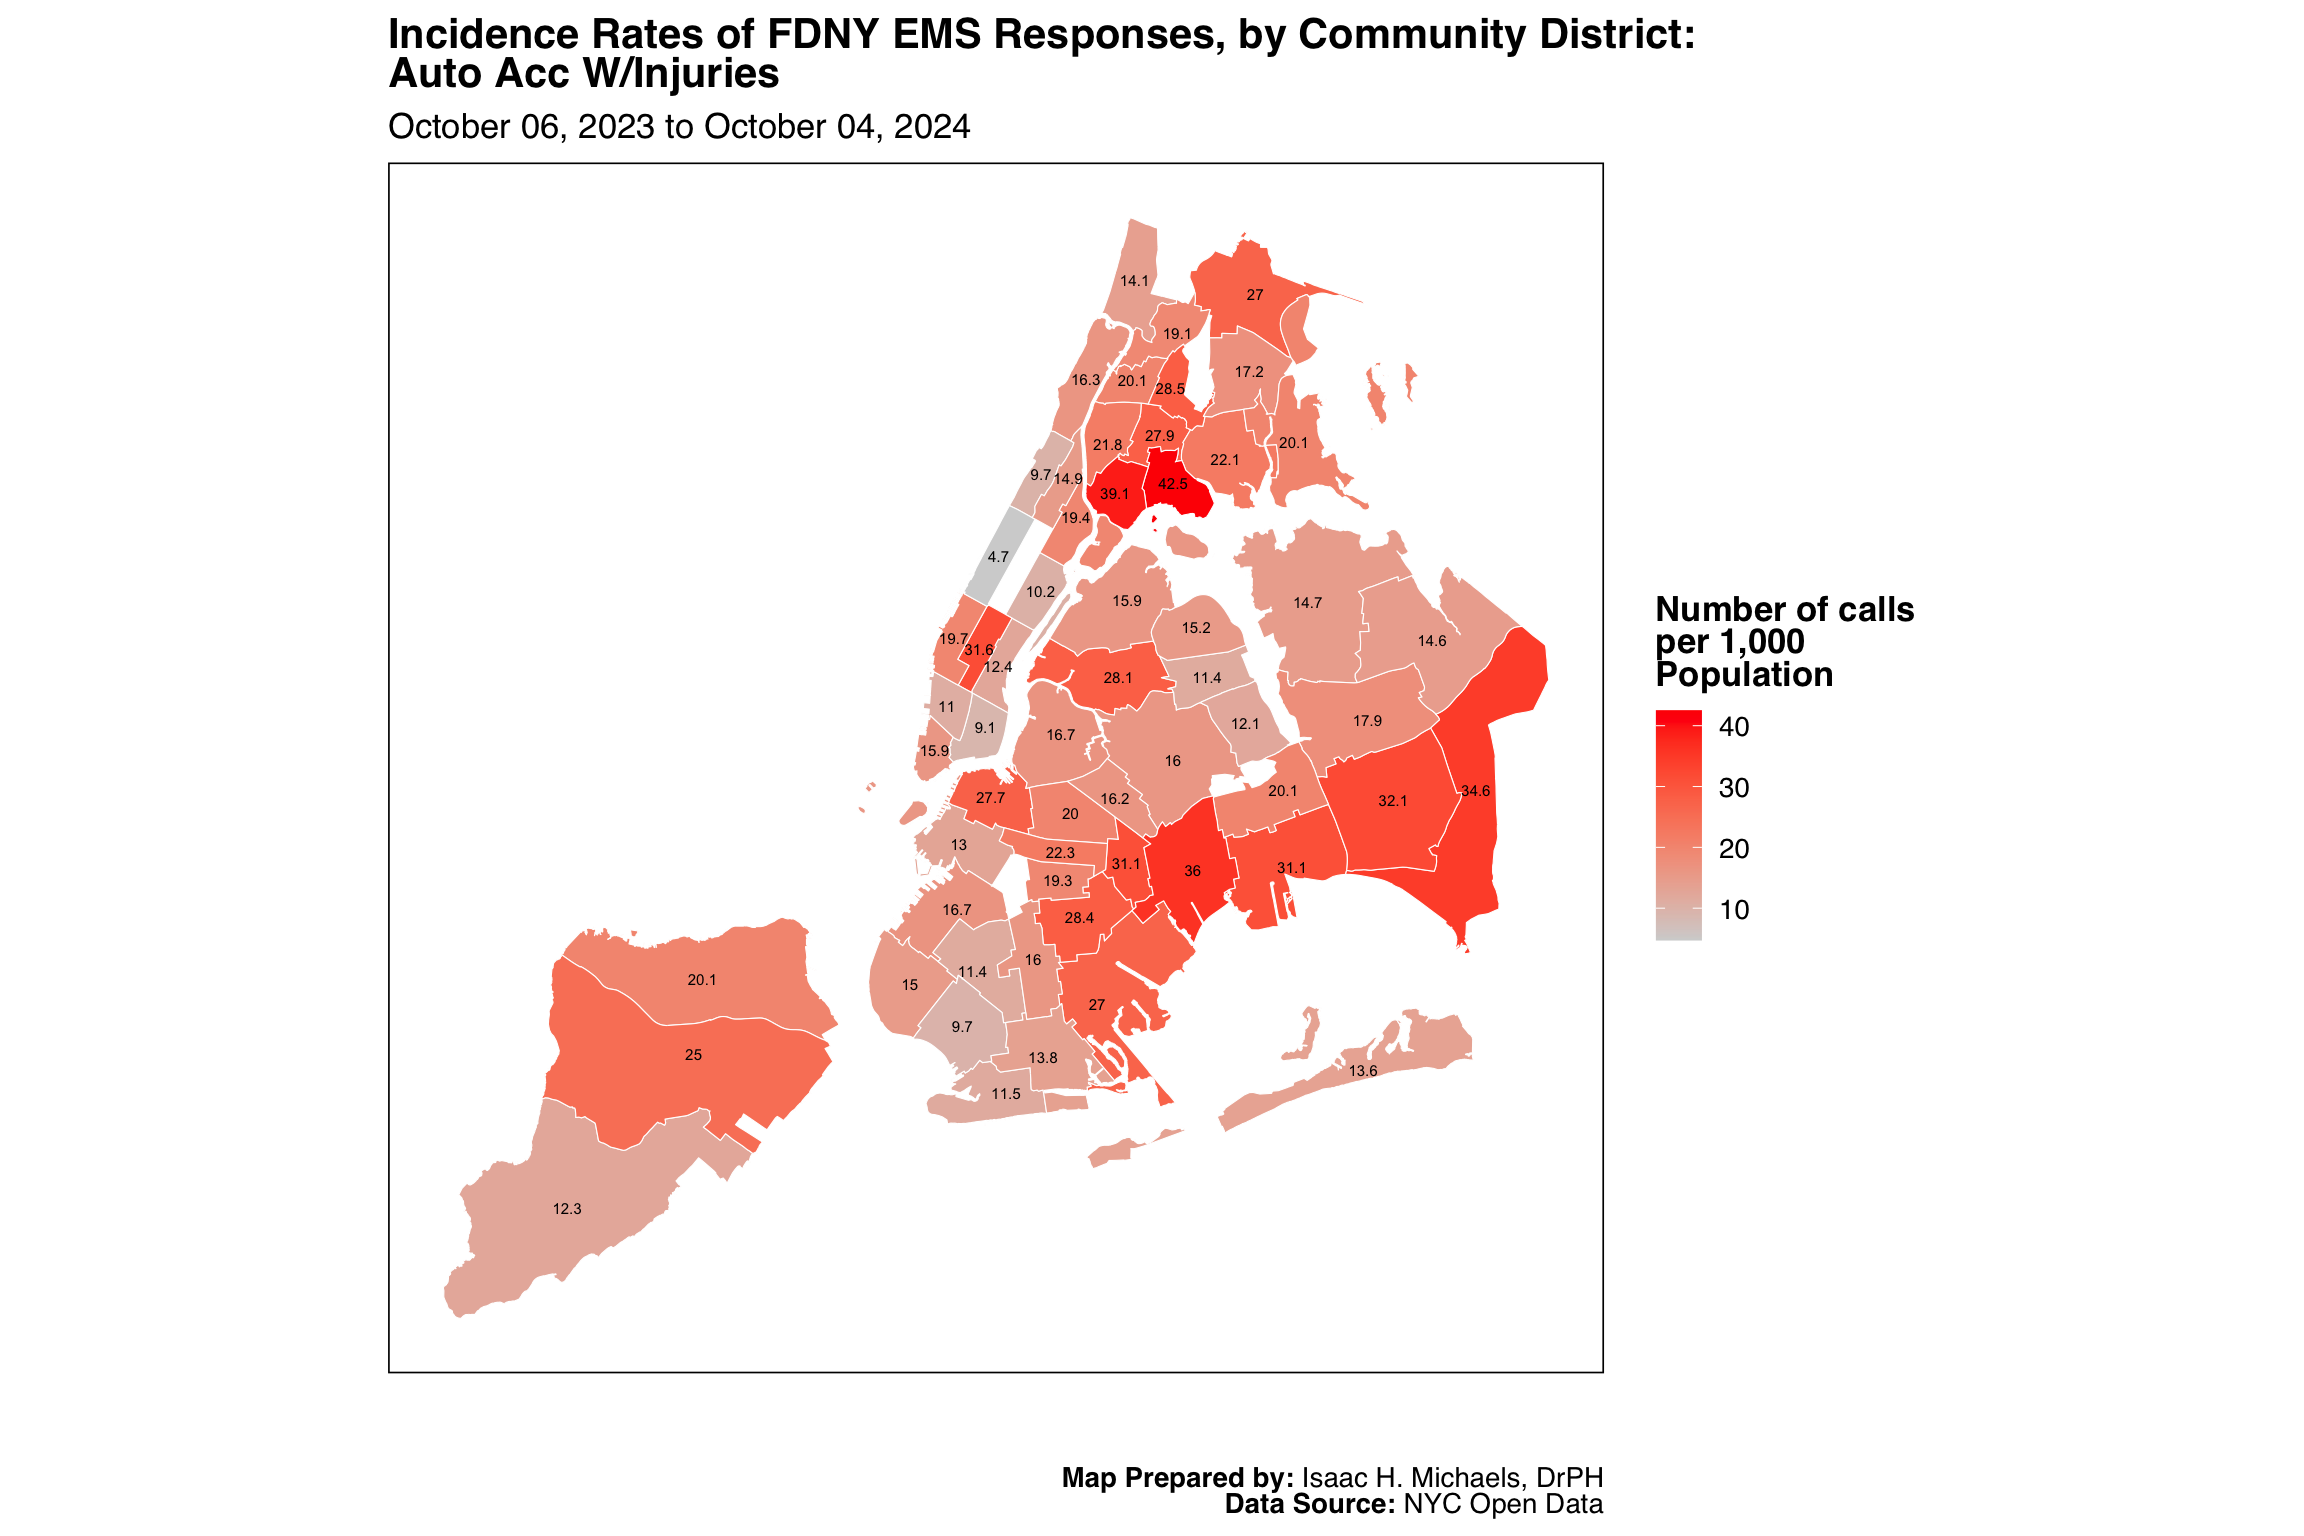
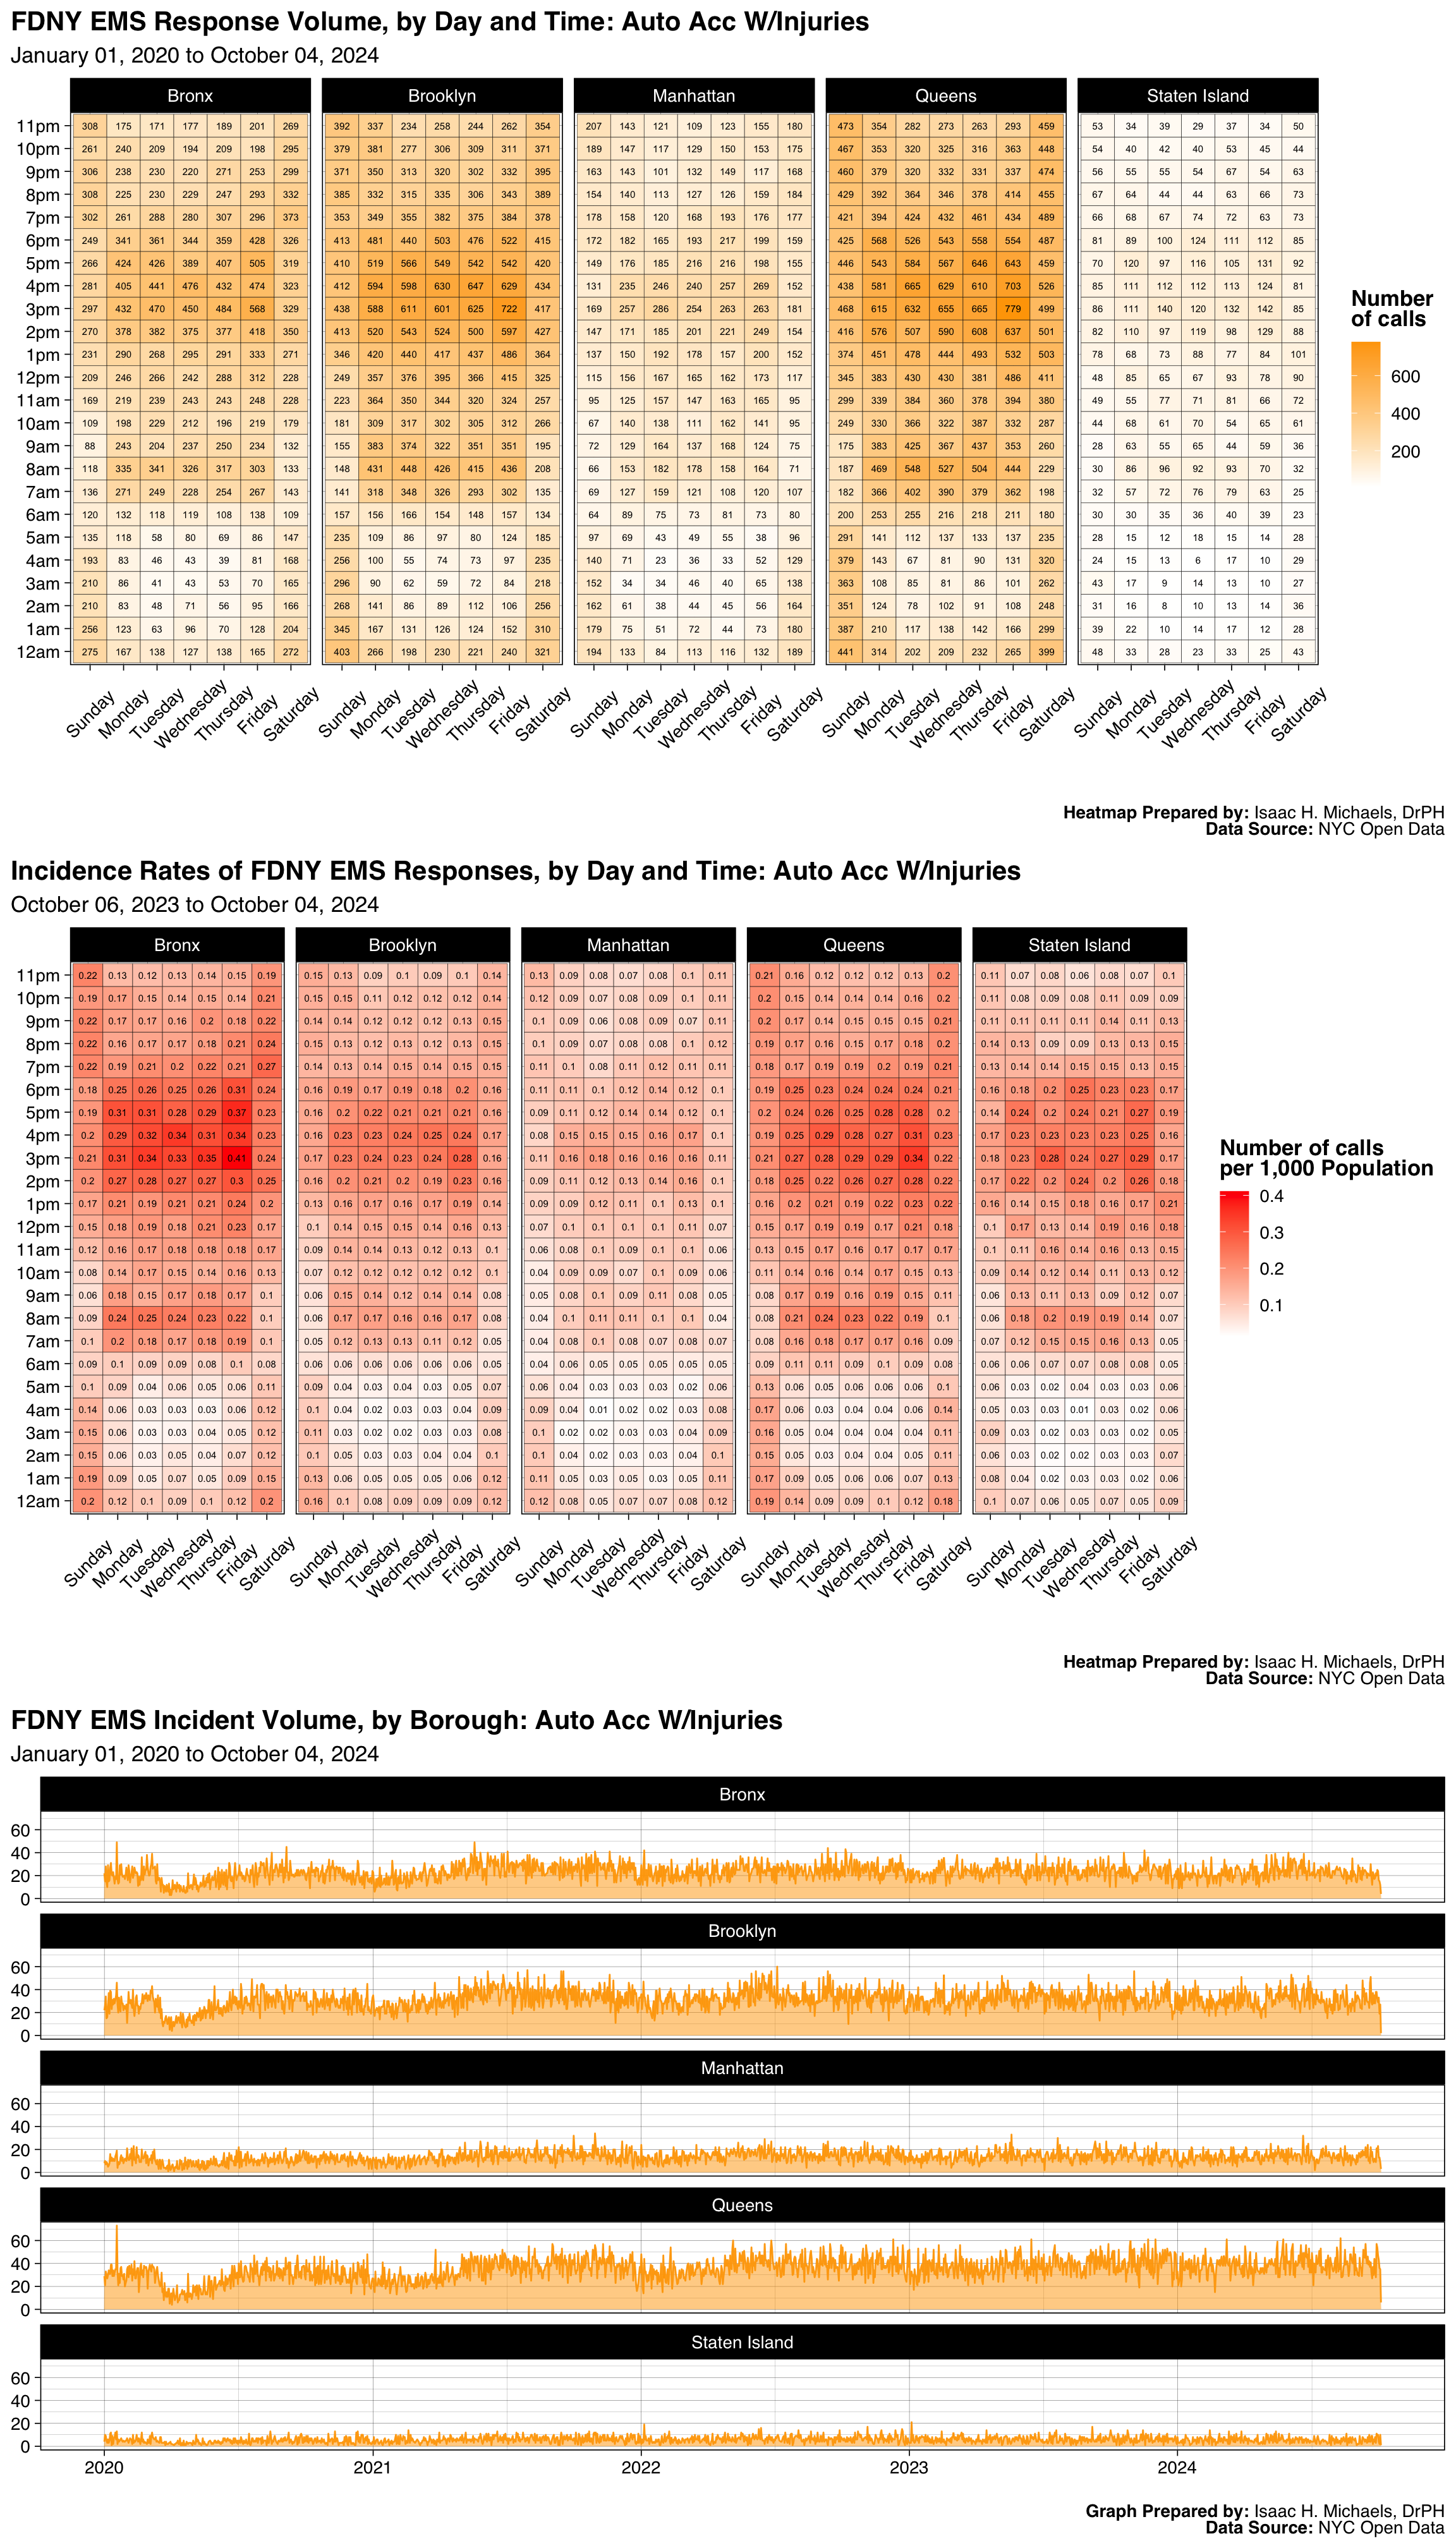
- Auto Acc W/Injuries
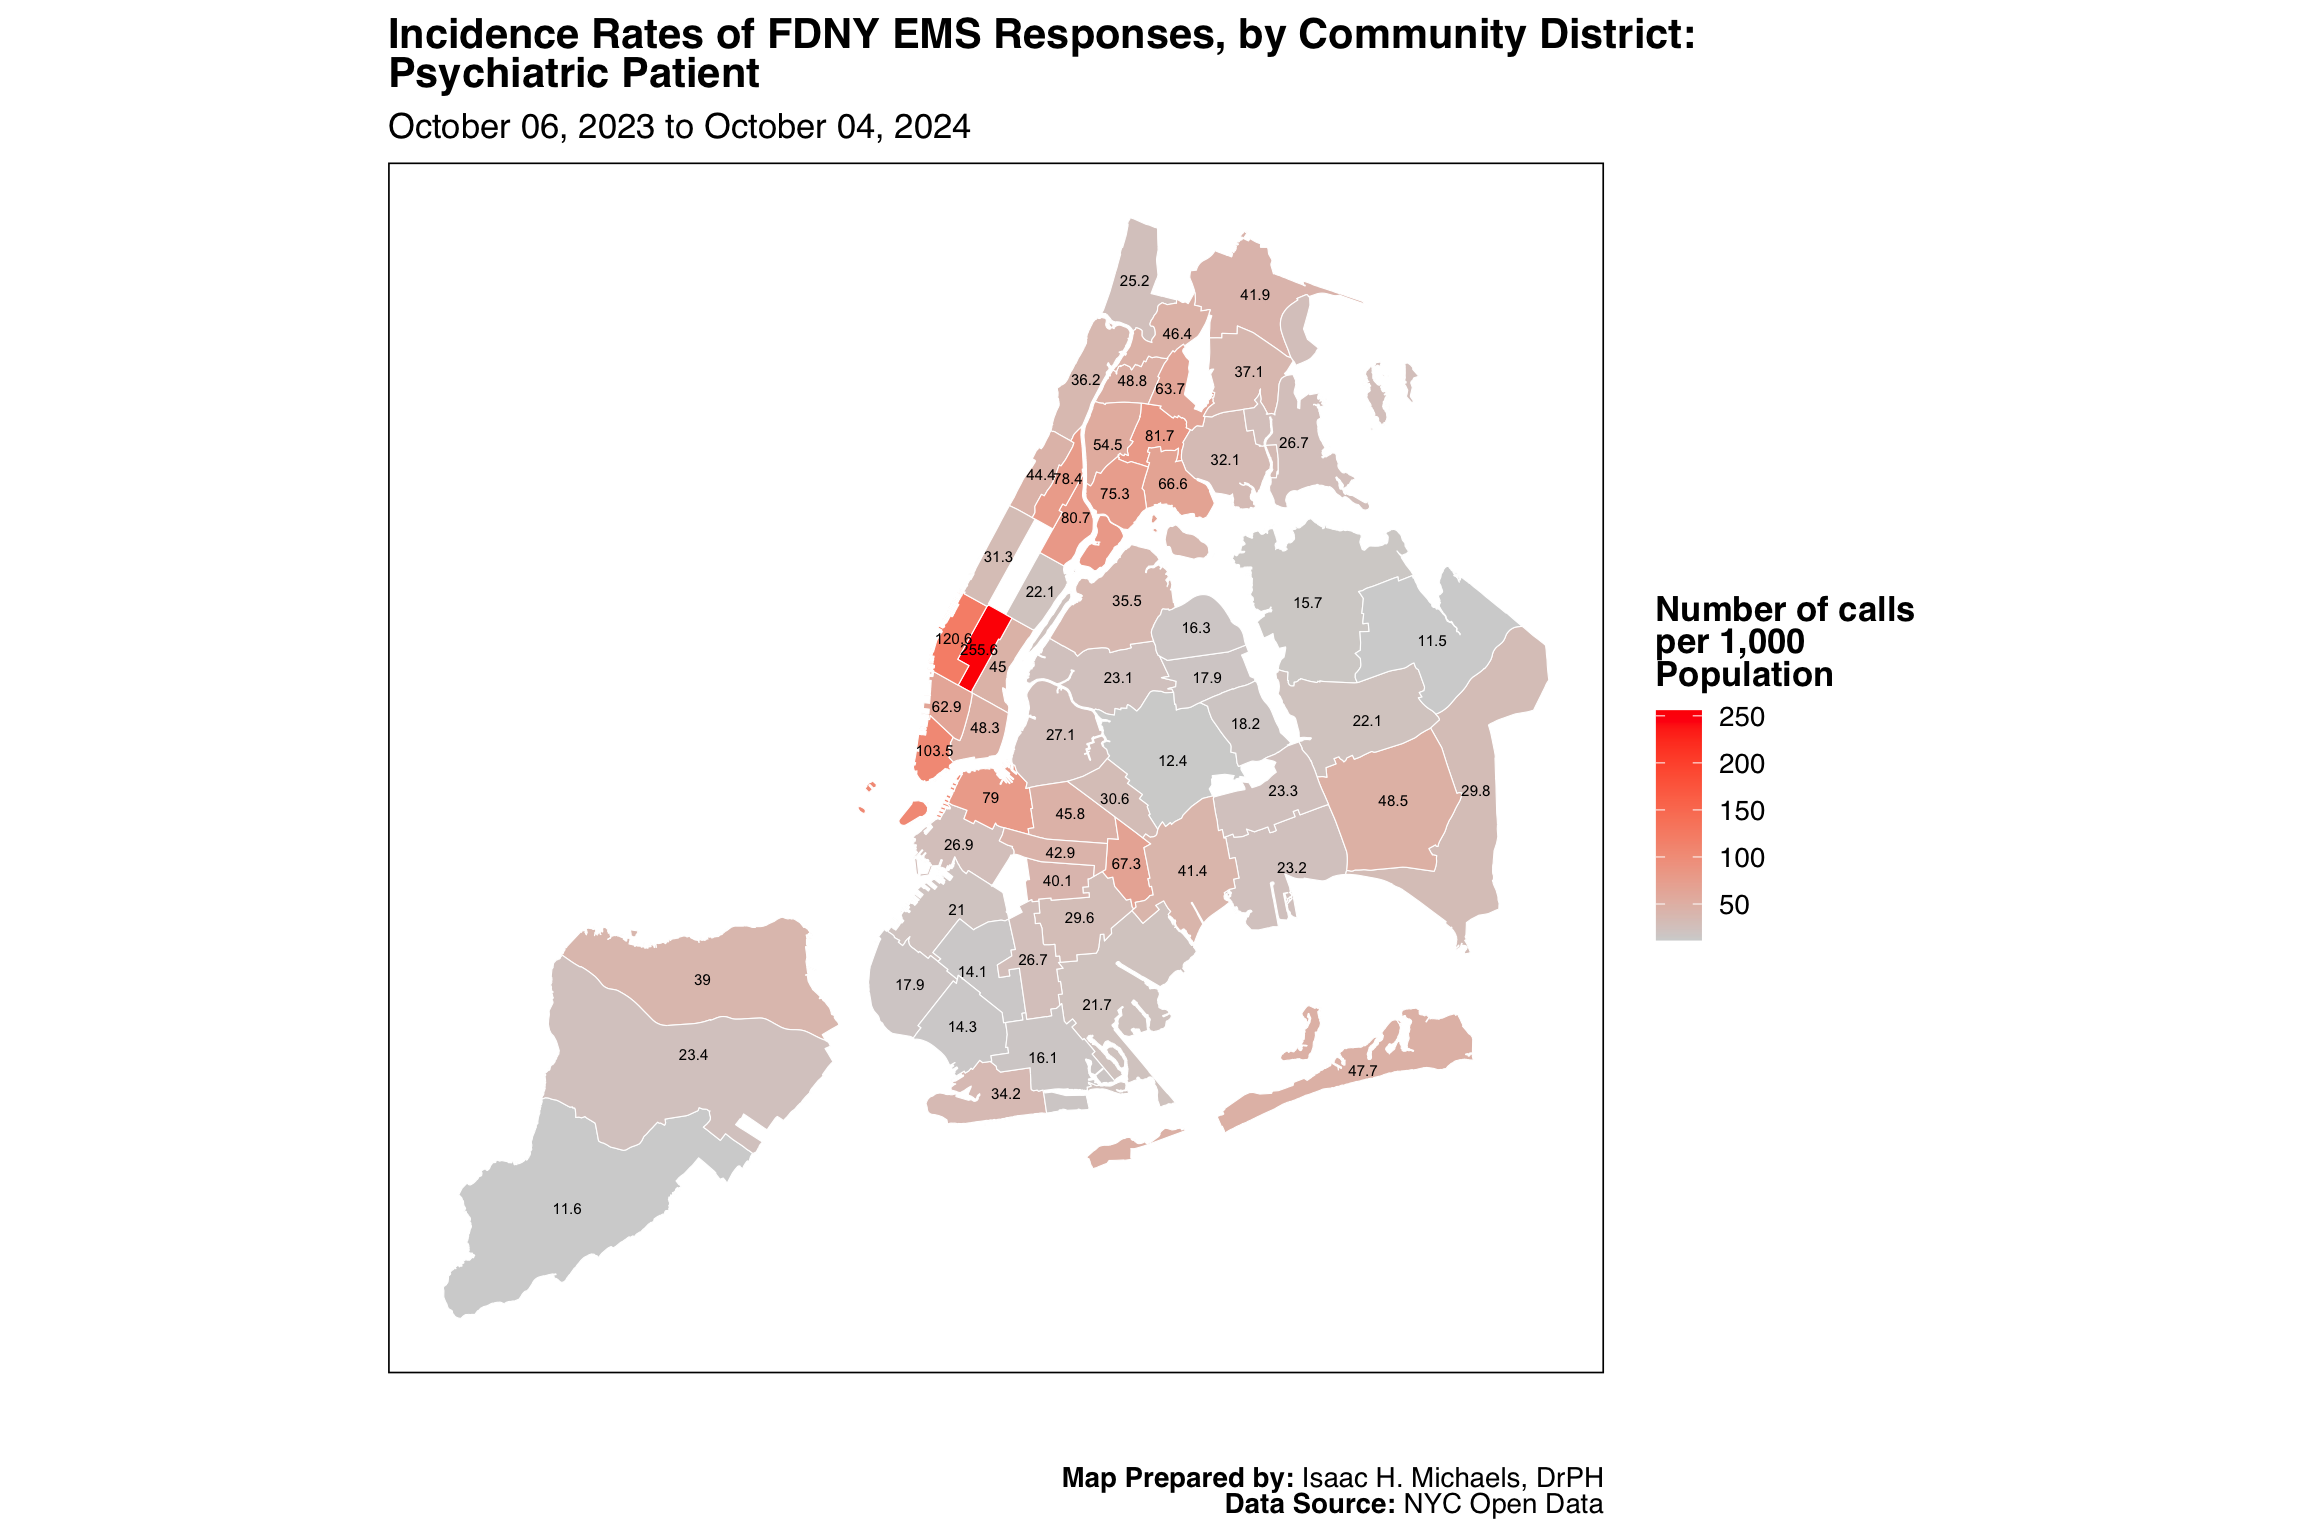
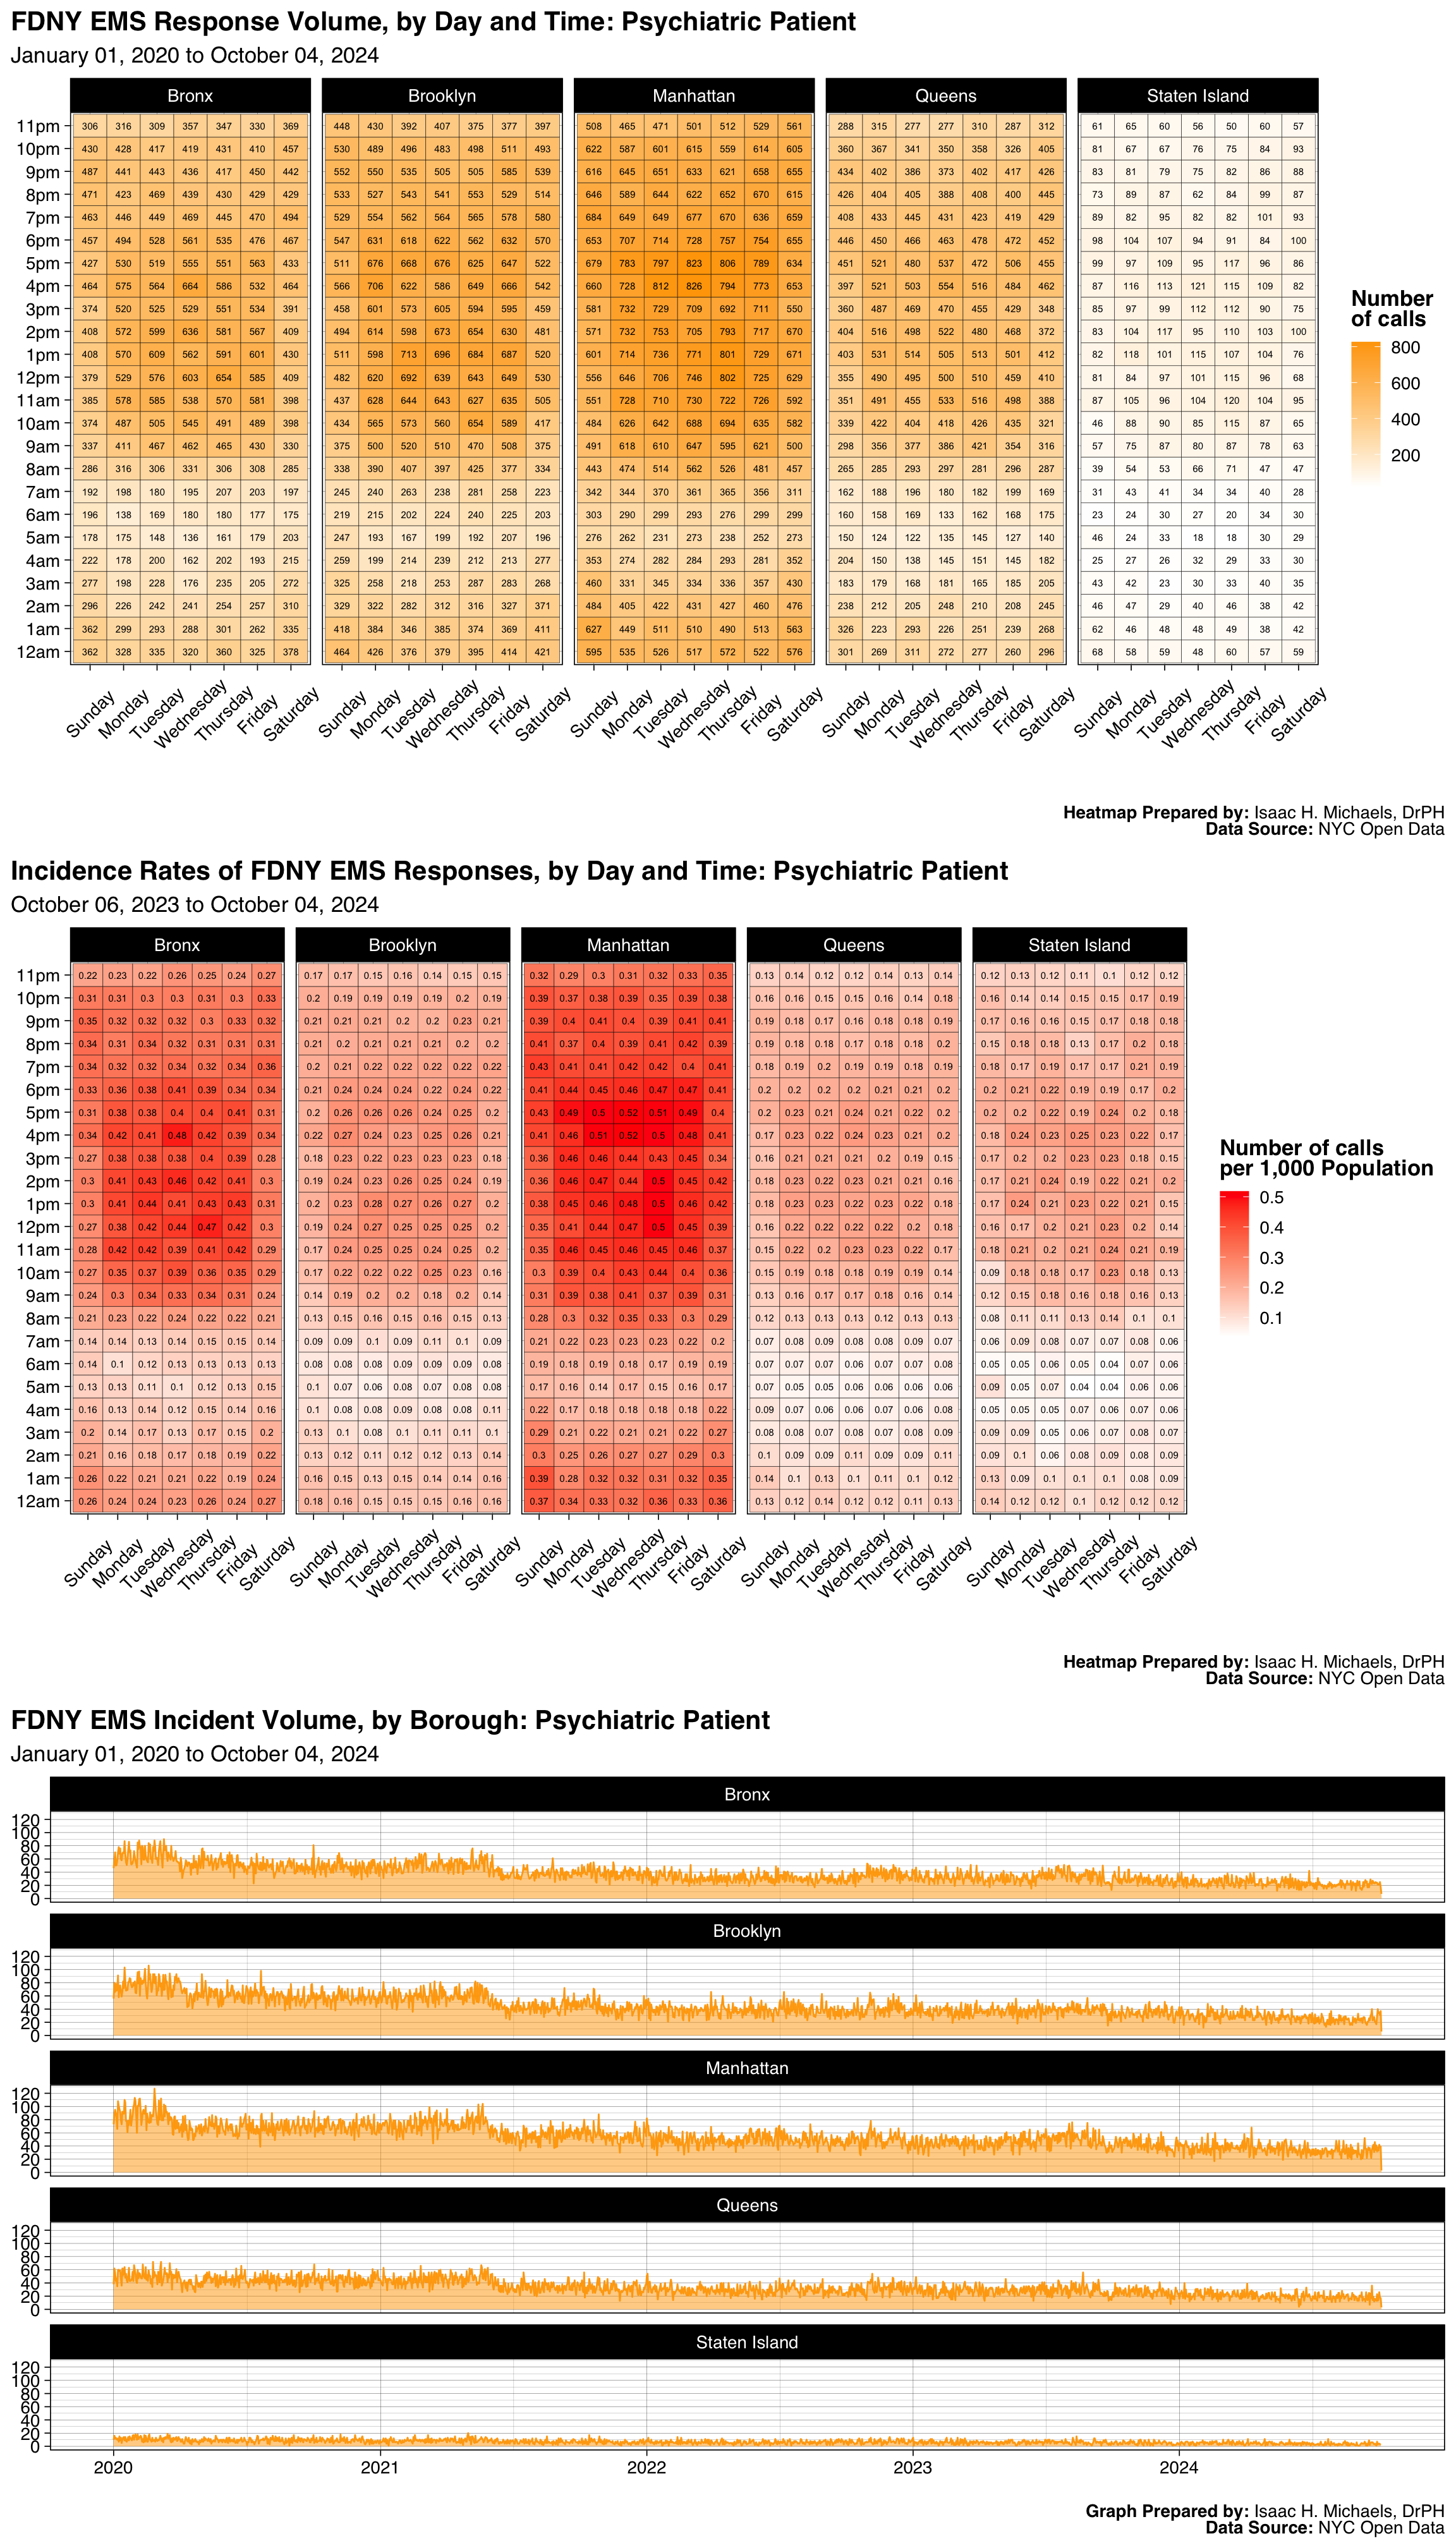
- Psychiatric Patient
- Altered Mental Status
- Status Epilepticus
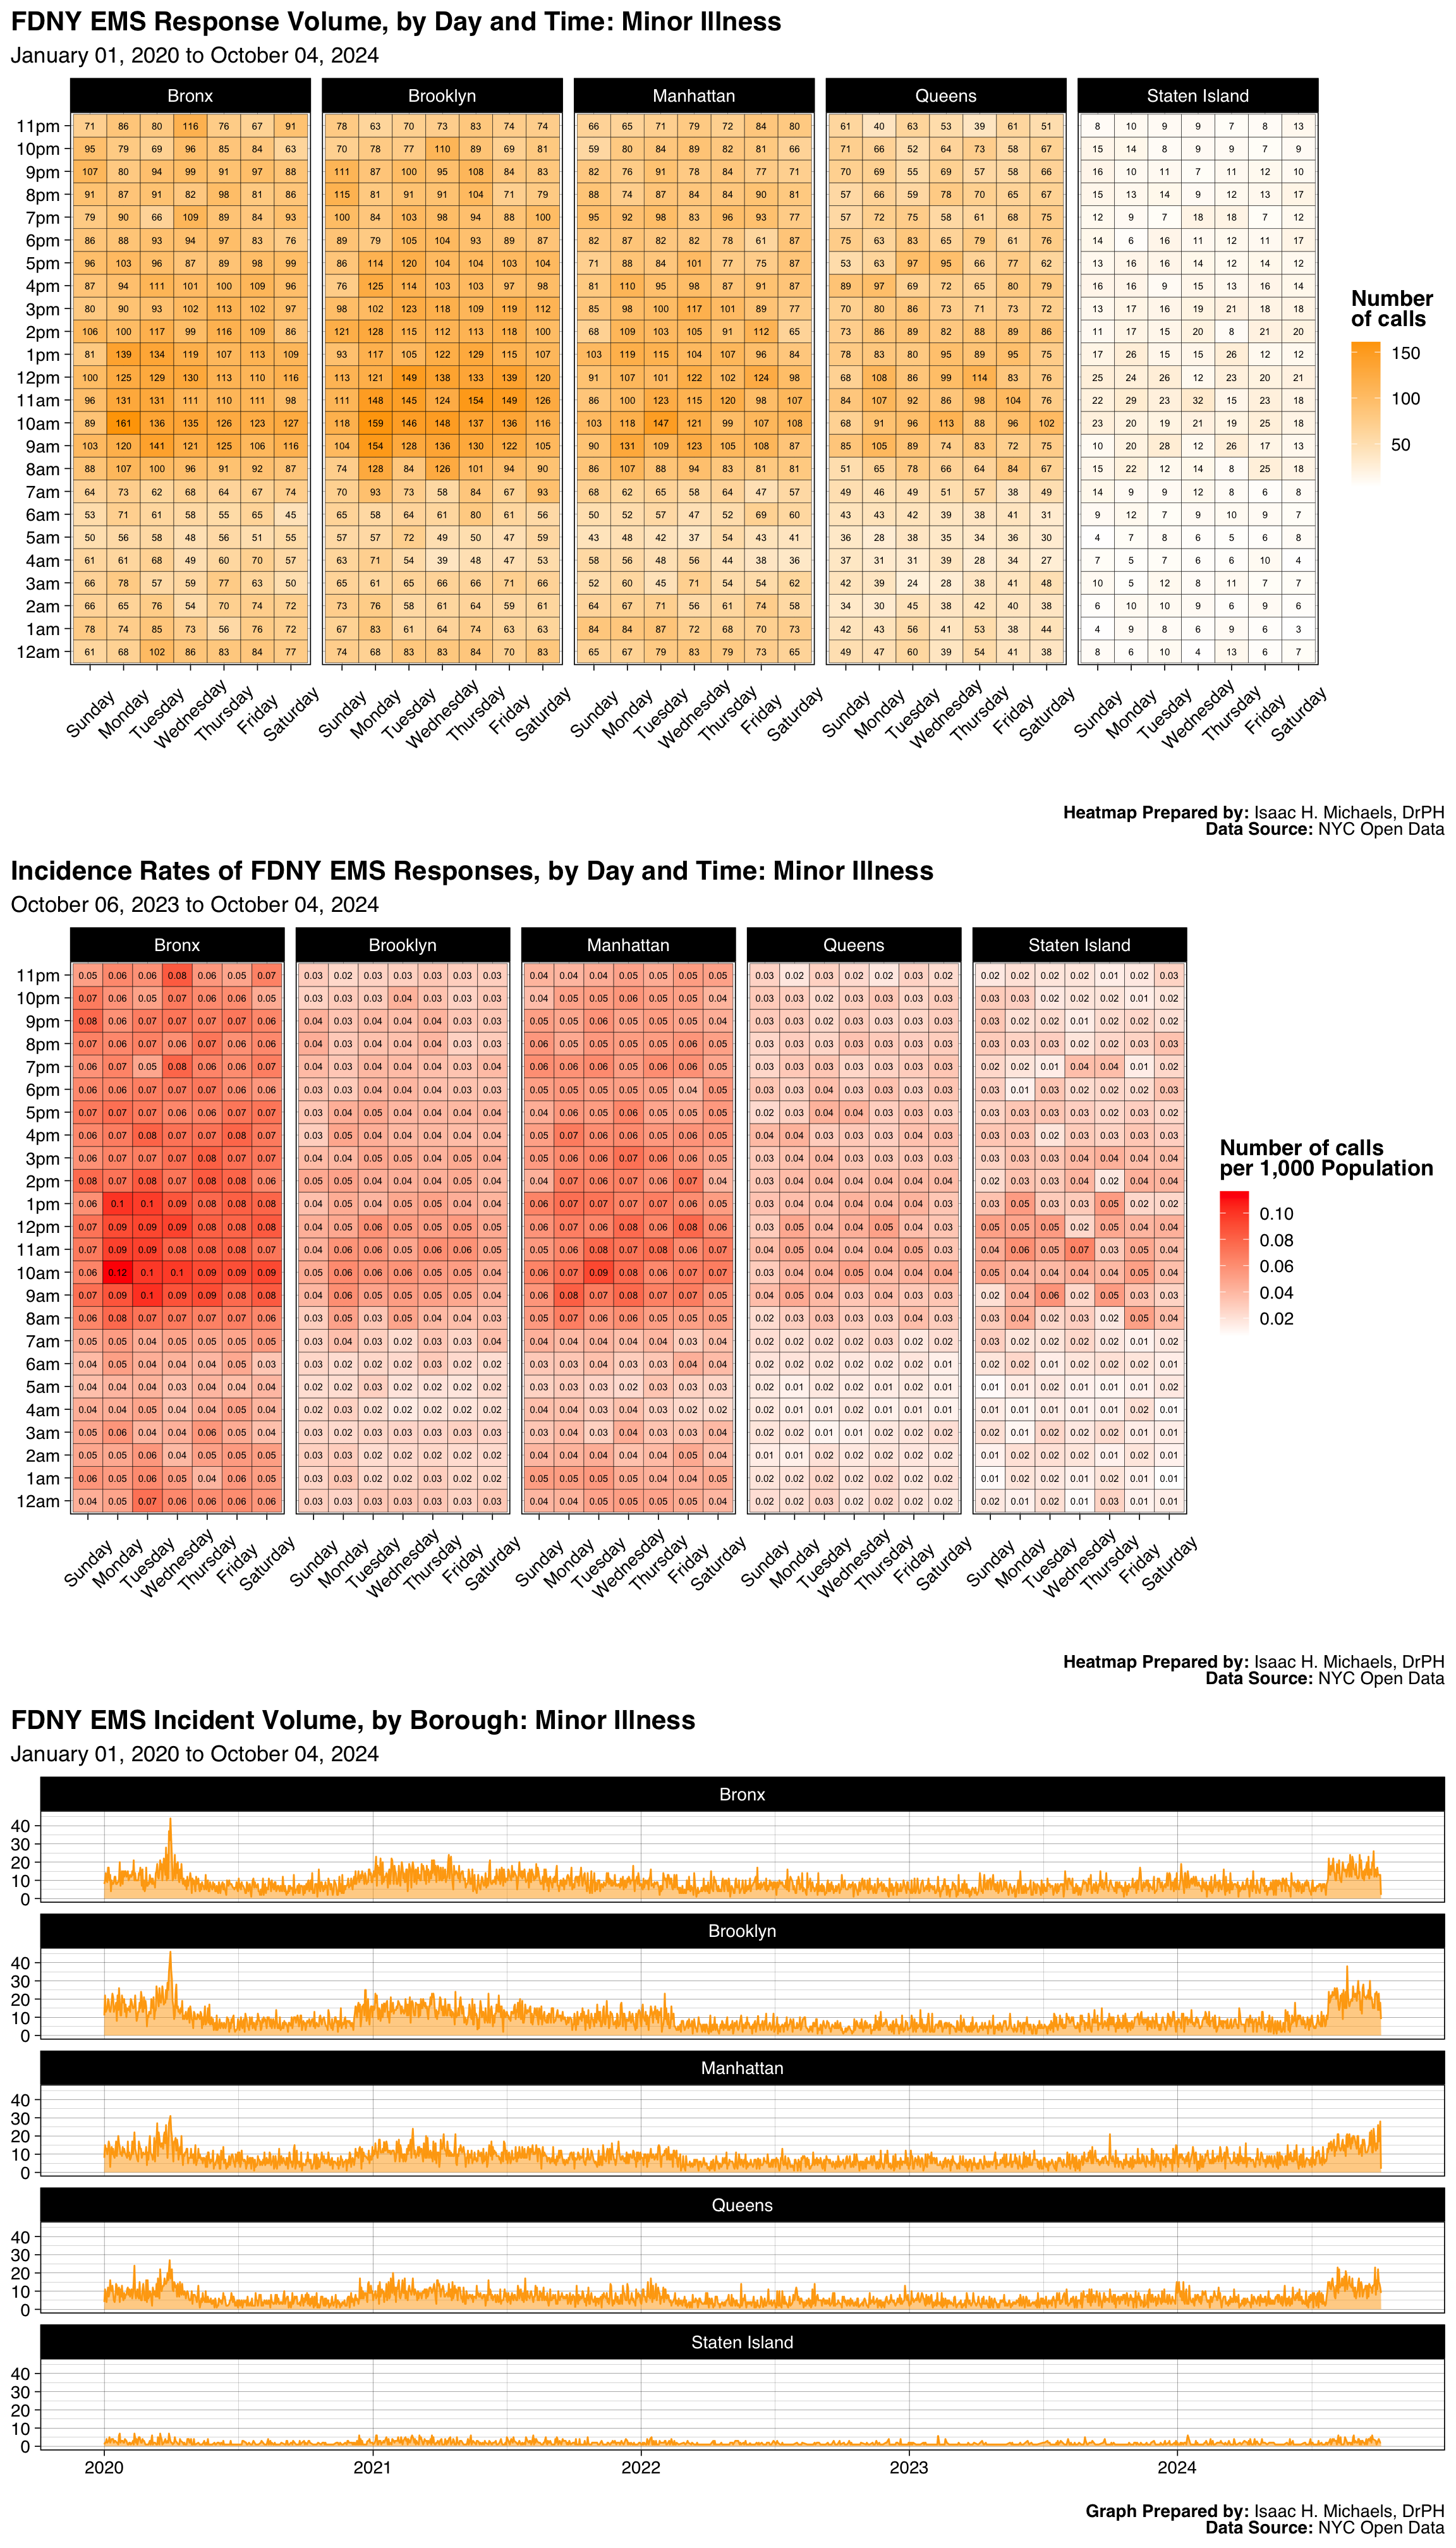
- Minor Illness
- Cardiac Arrest
- Pedestrian Struck
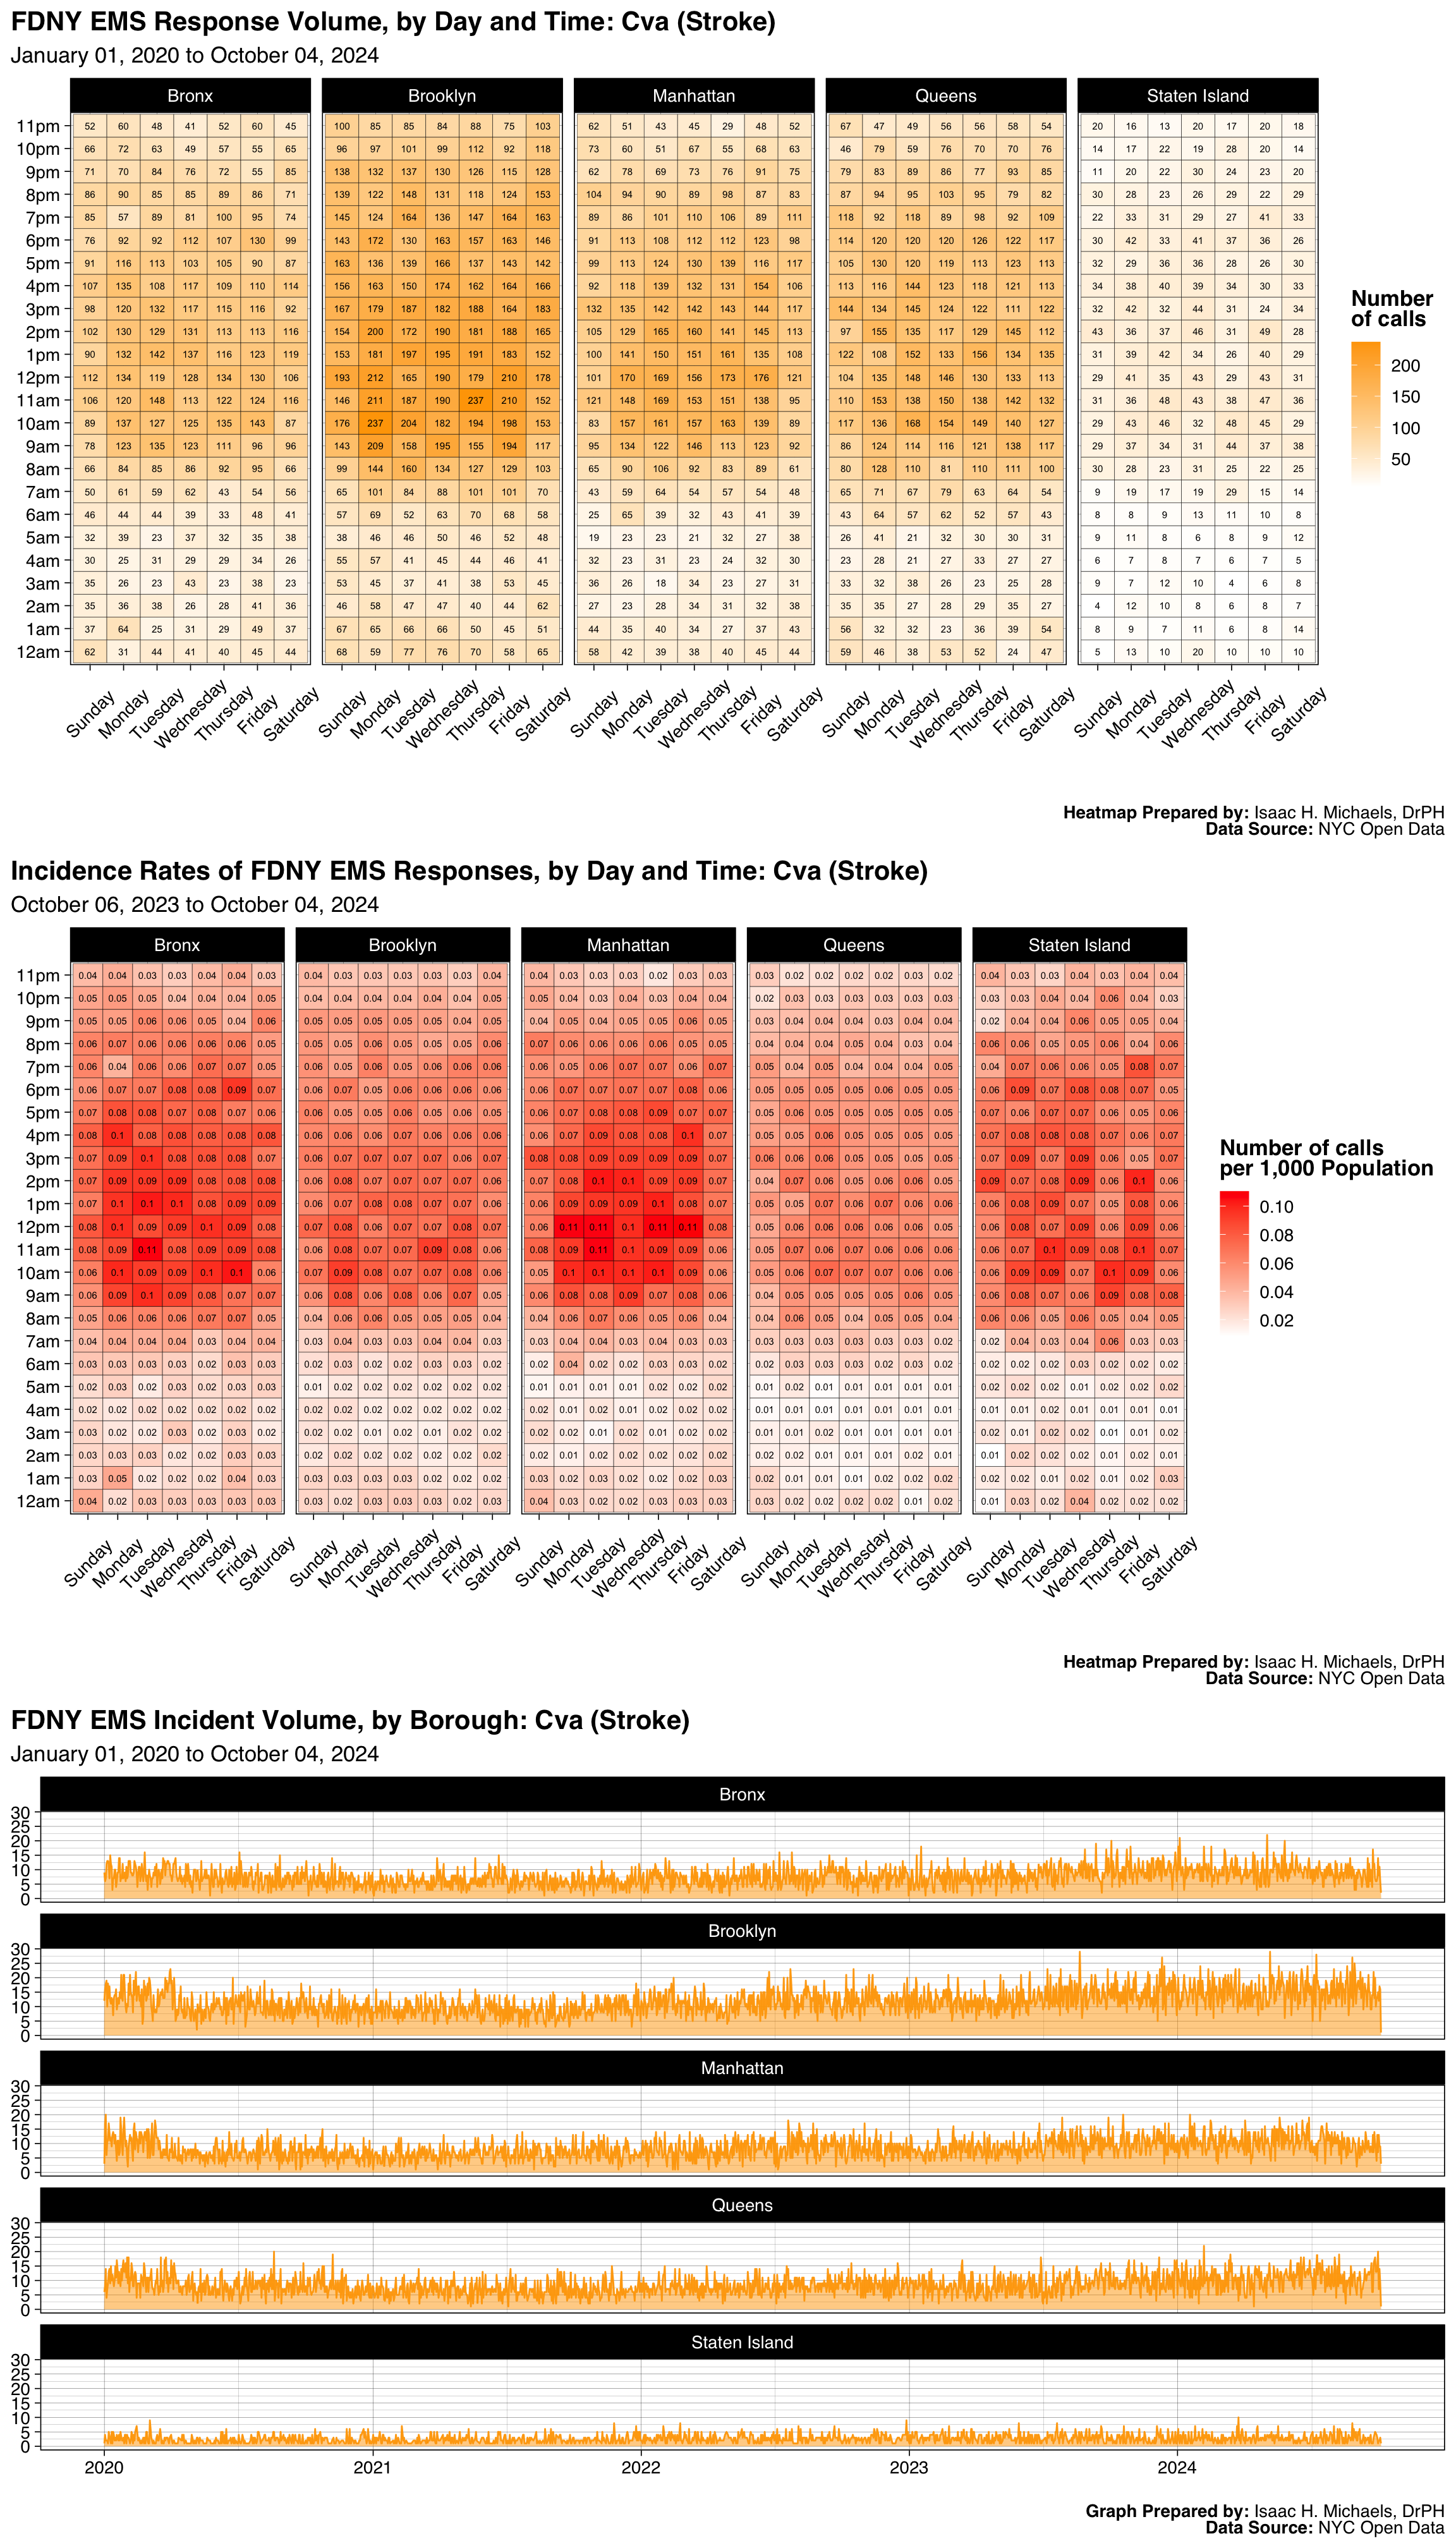
- Cva (Stroke)
- Minor Injury
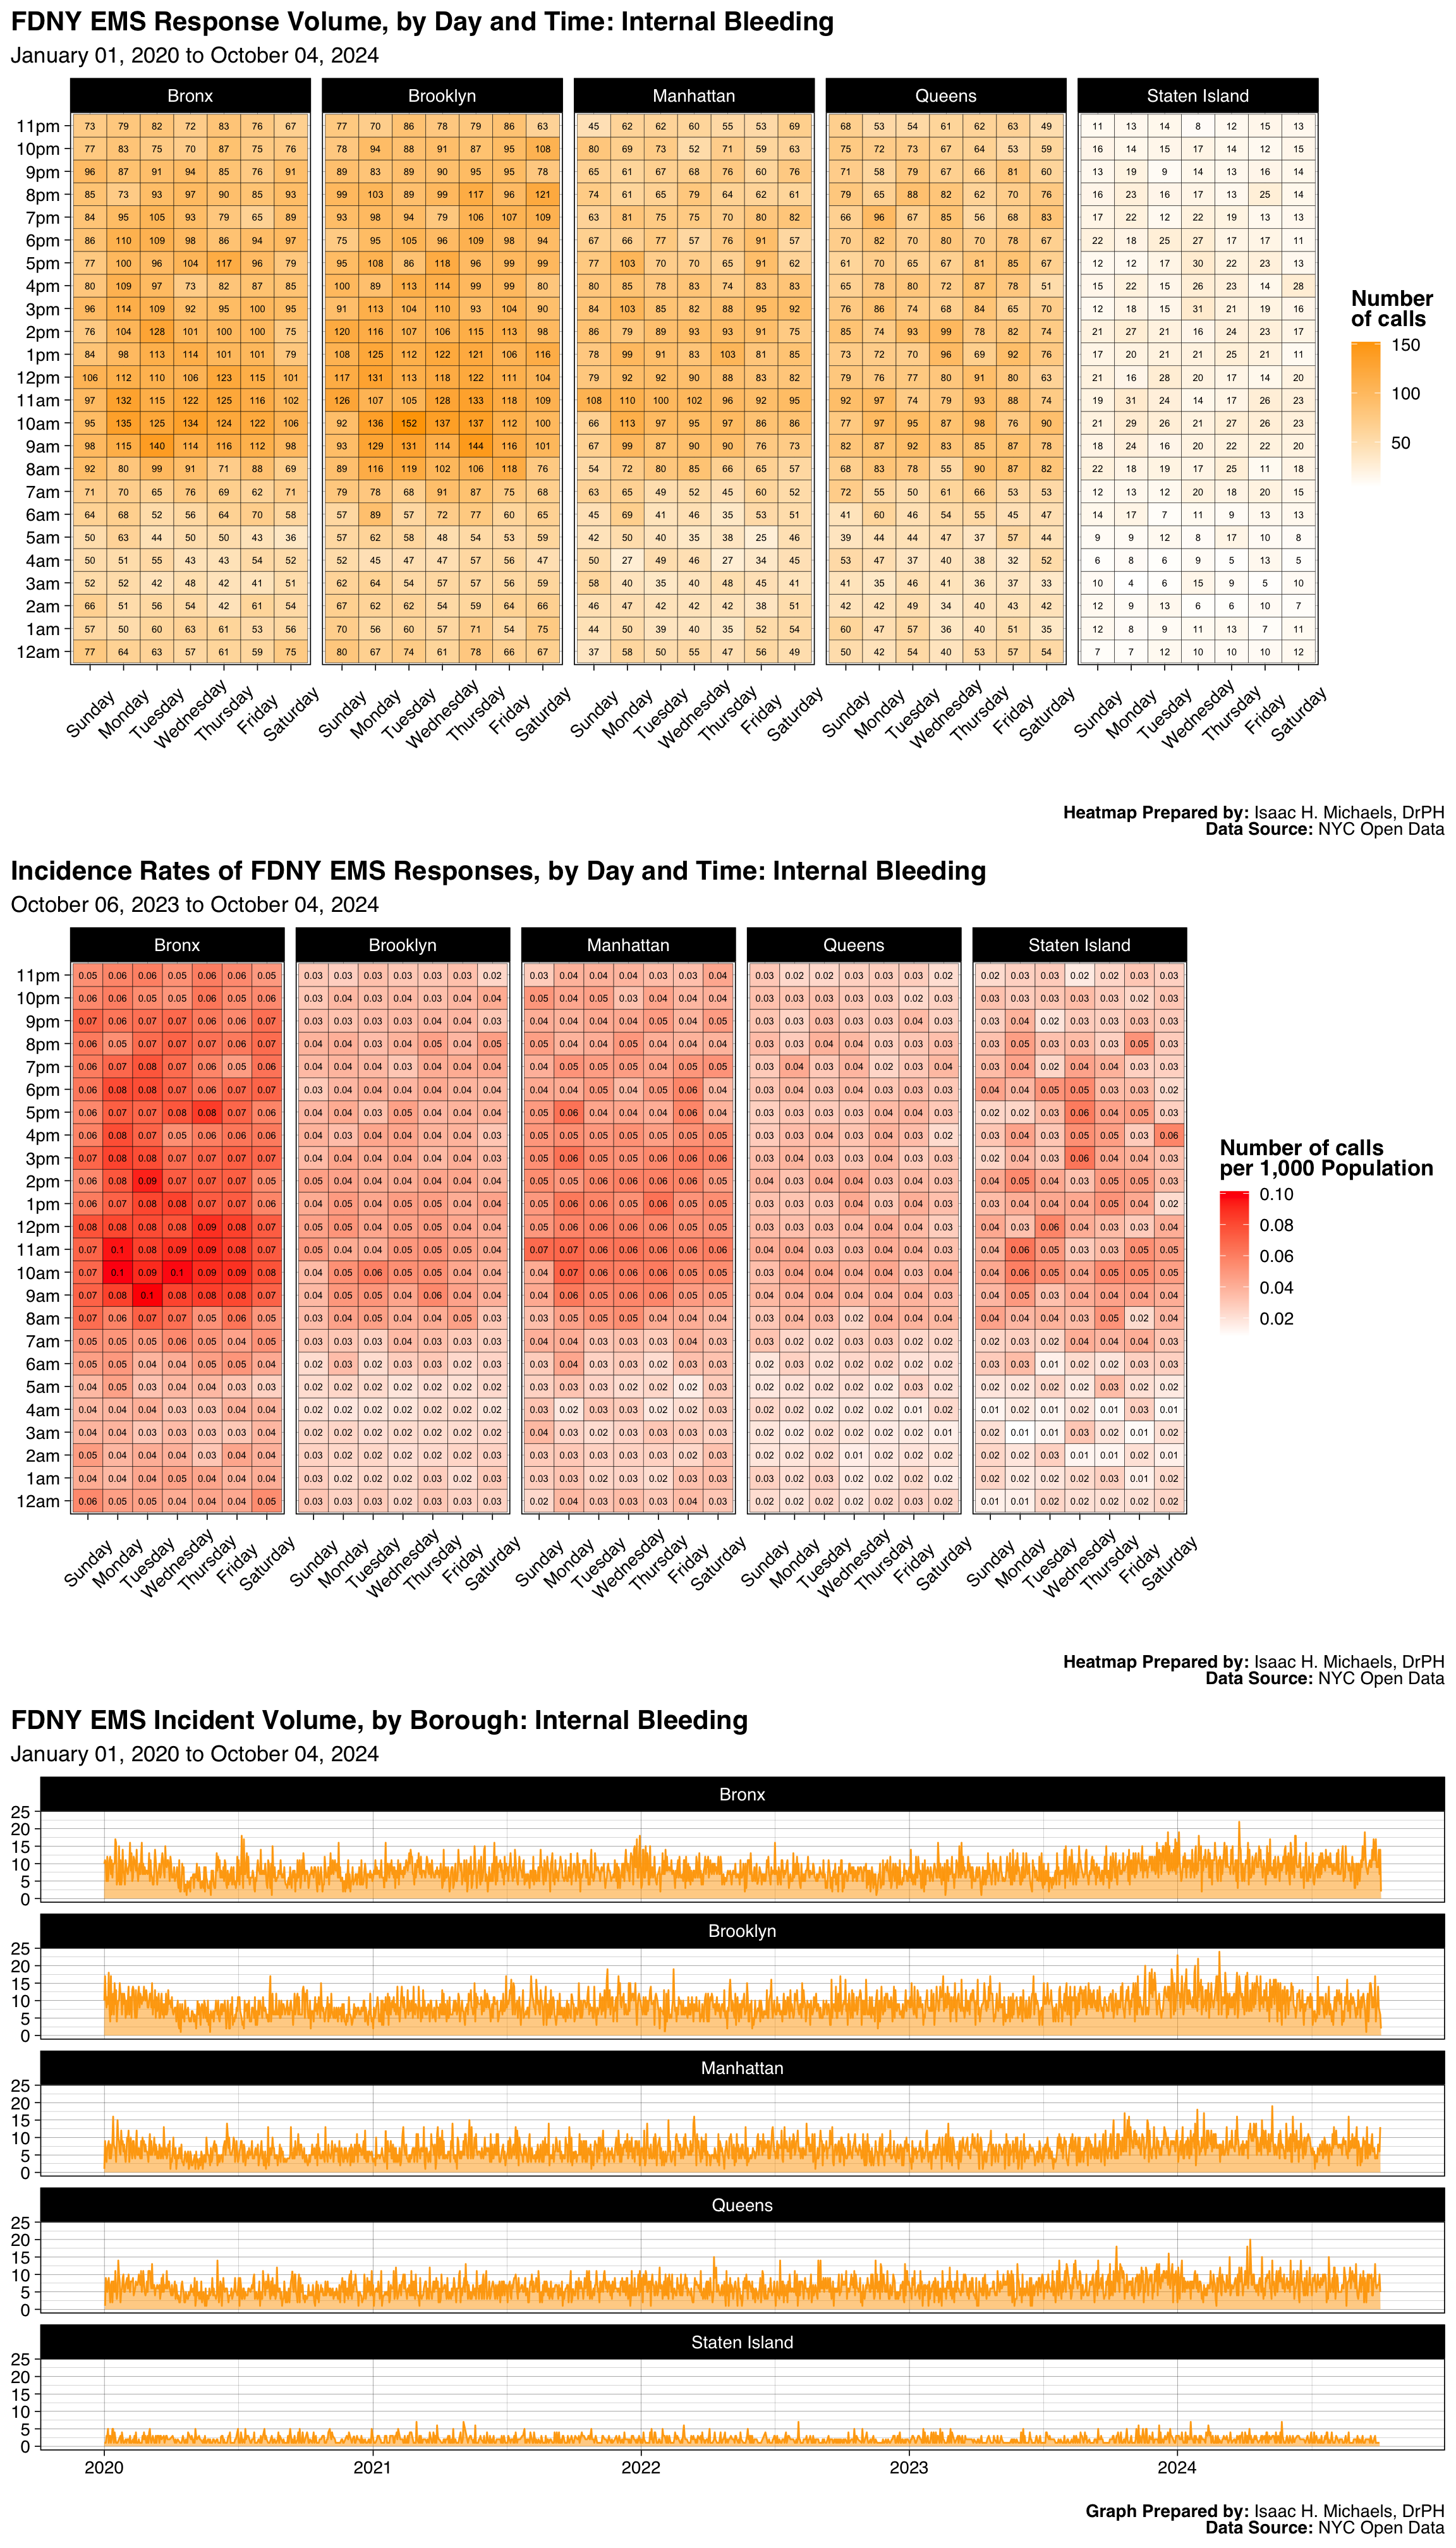
- Internal Bleeding
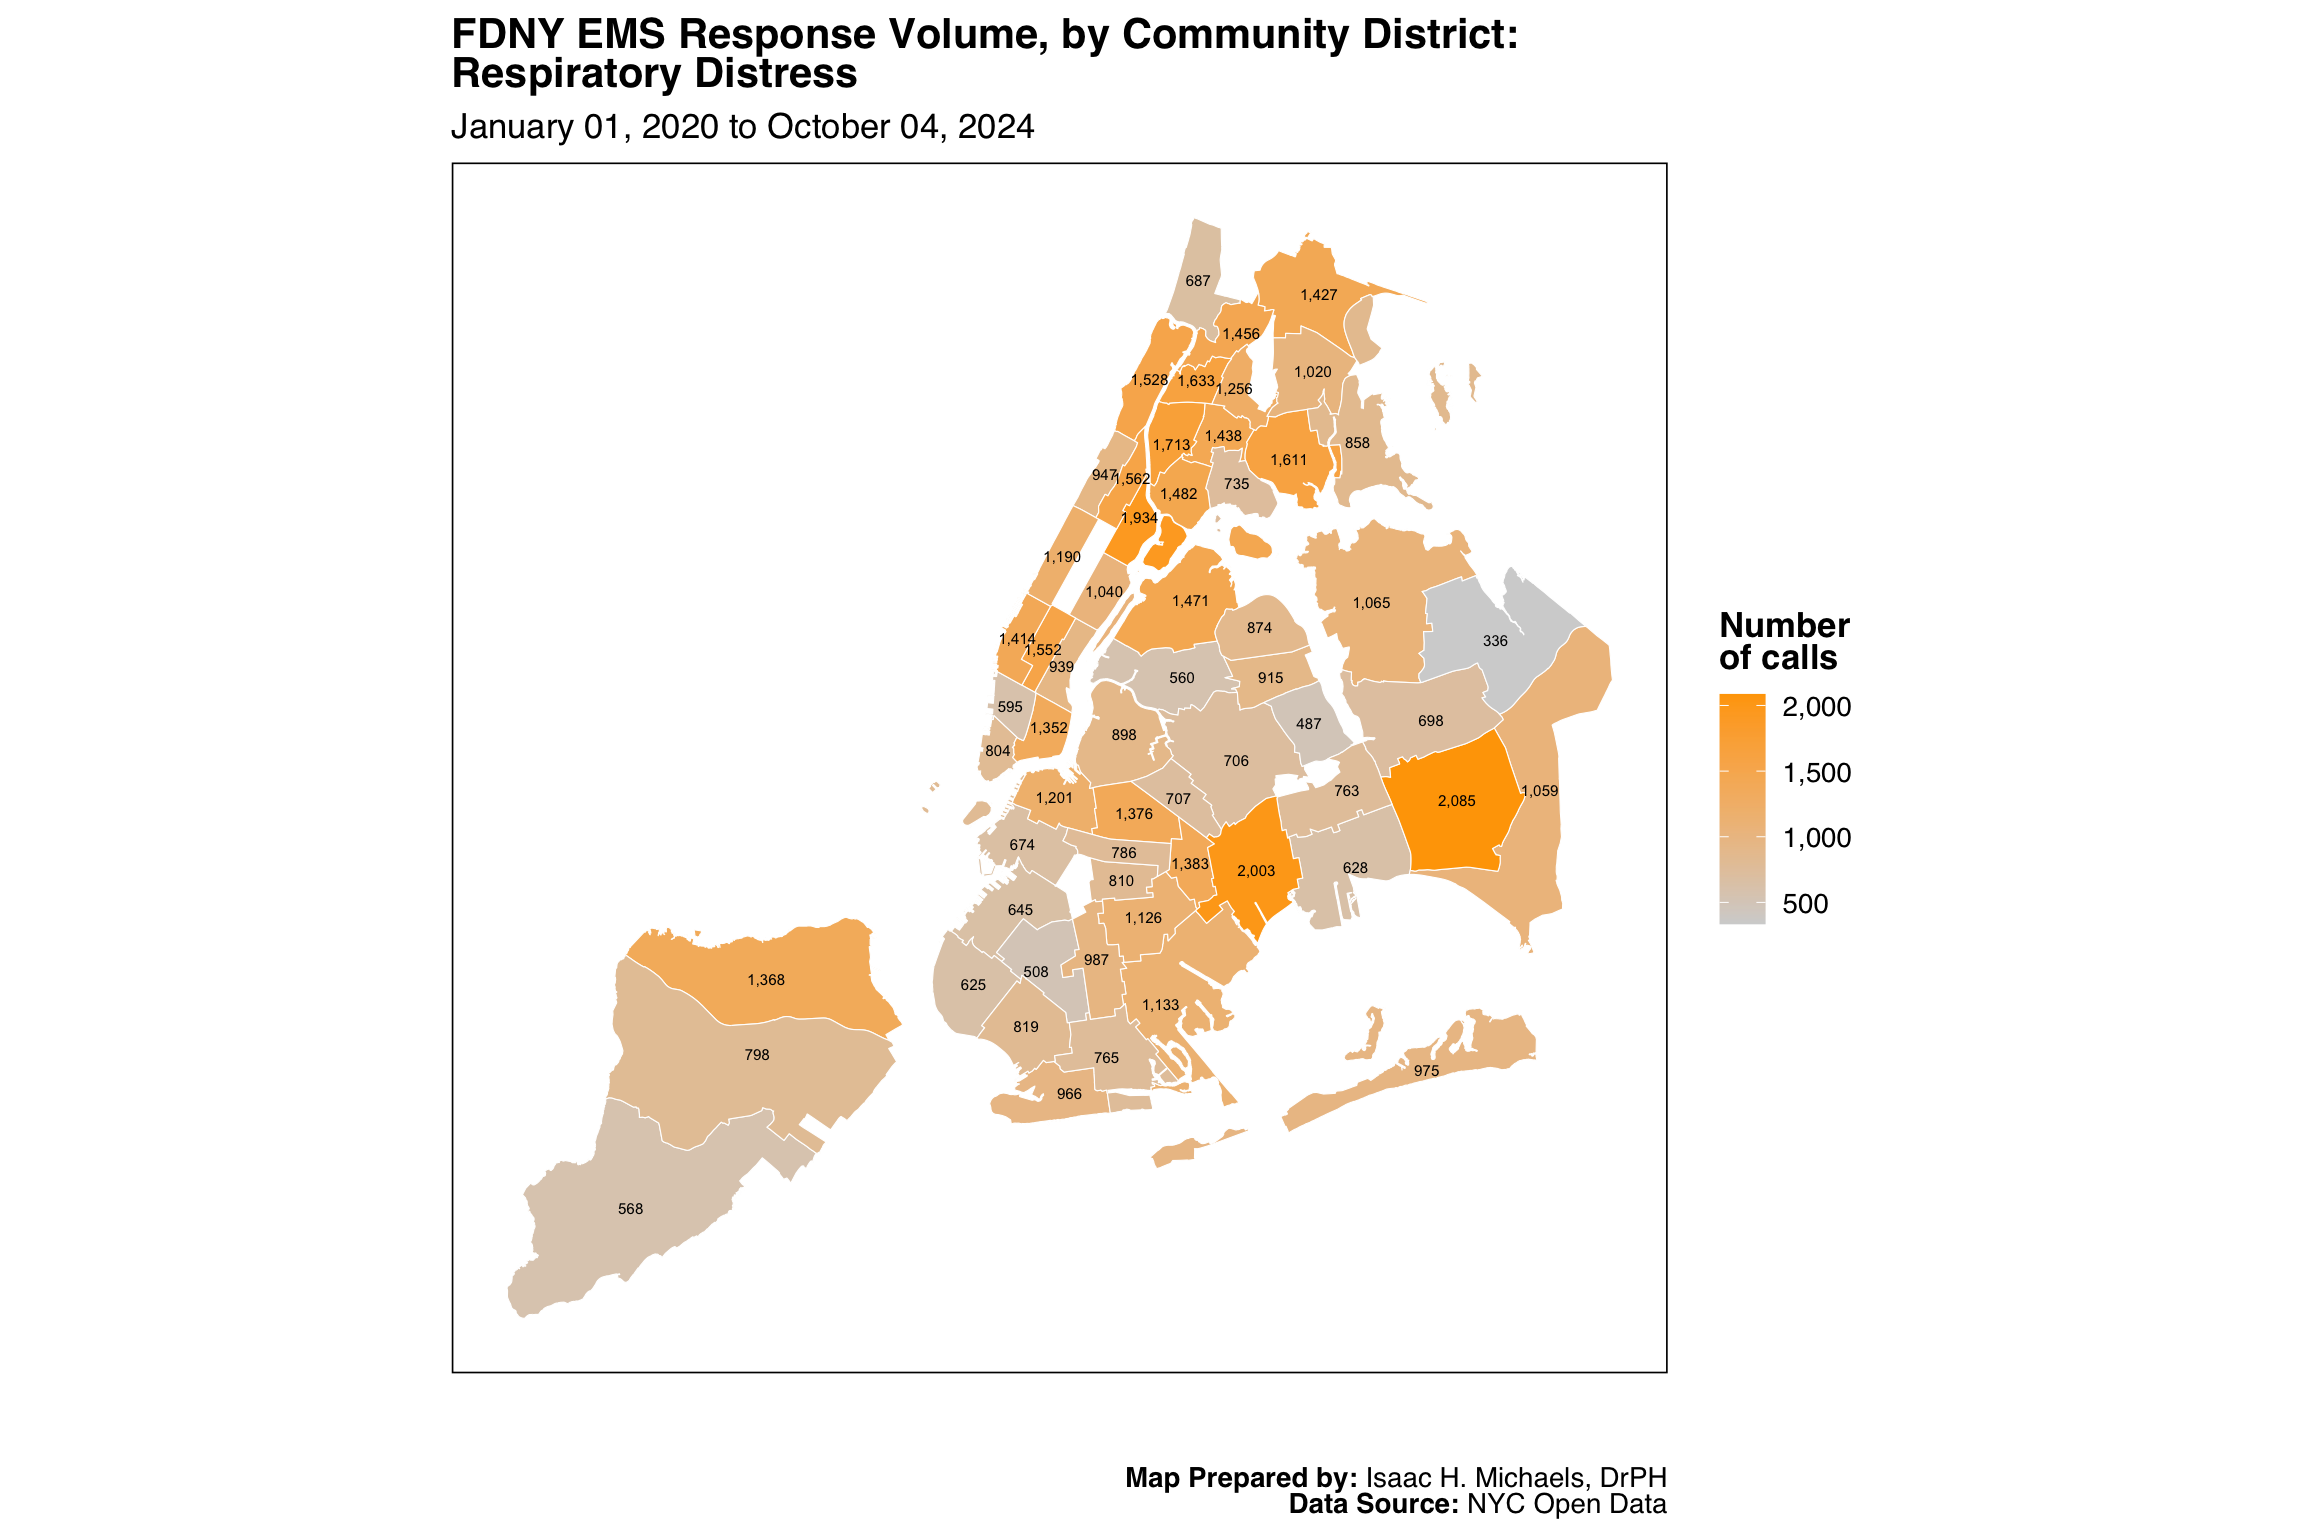
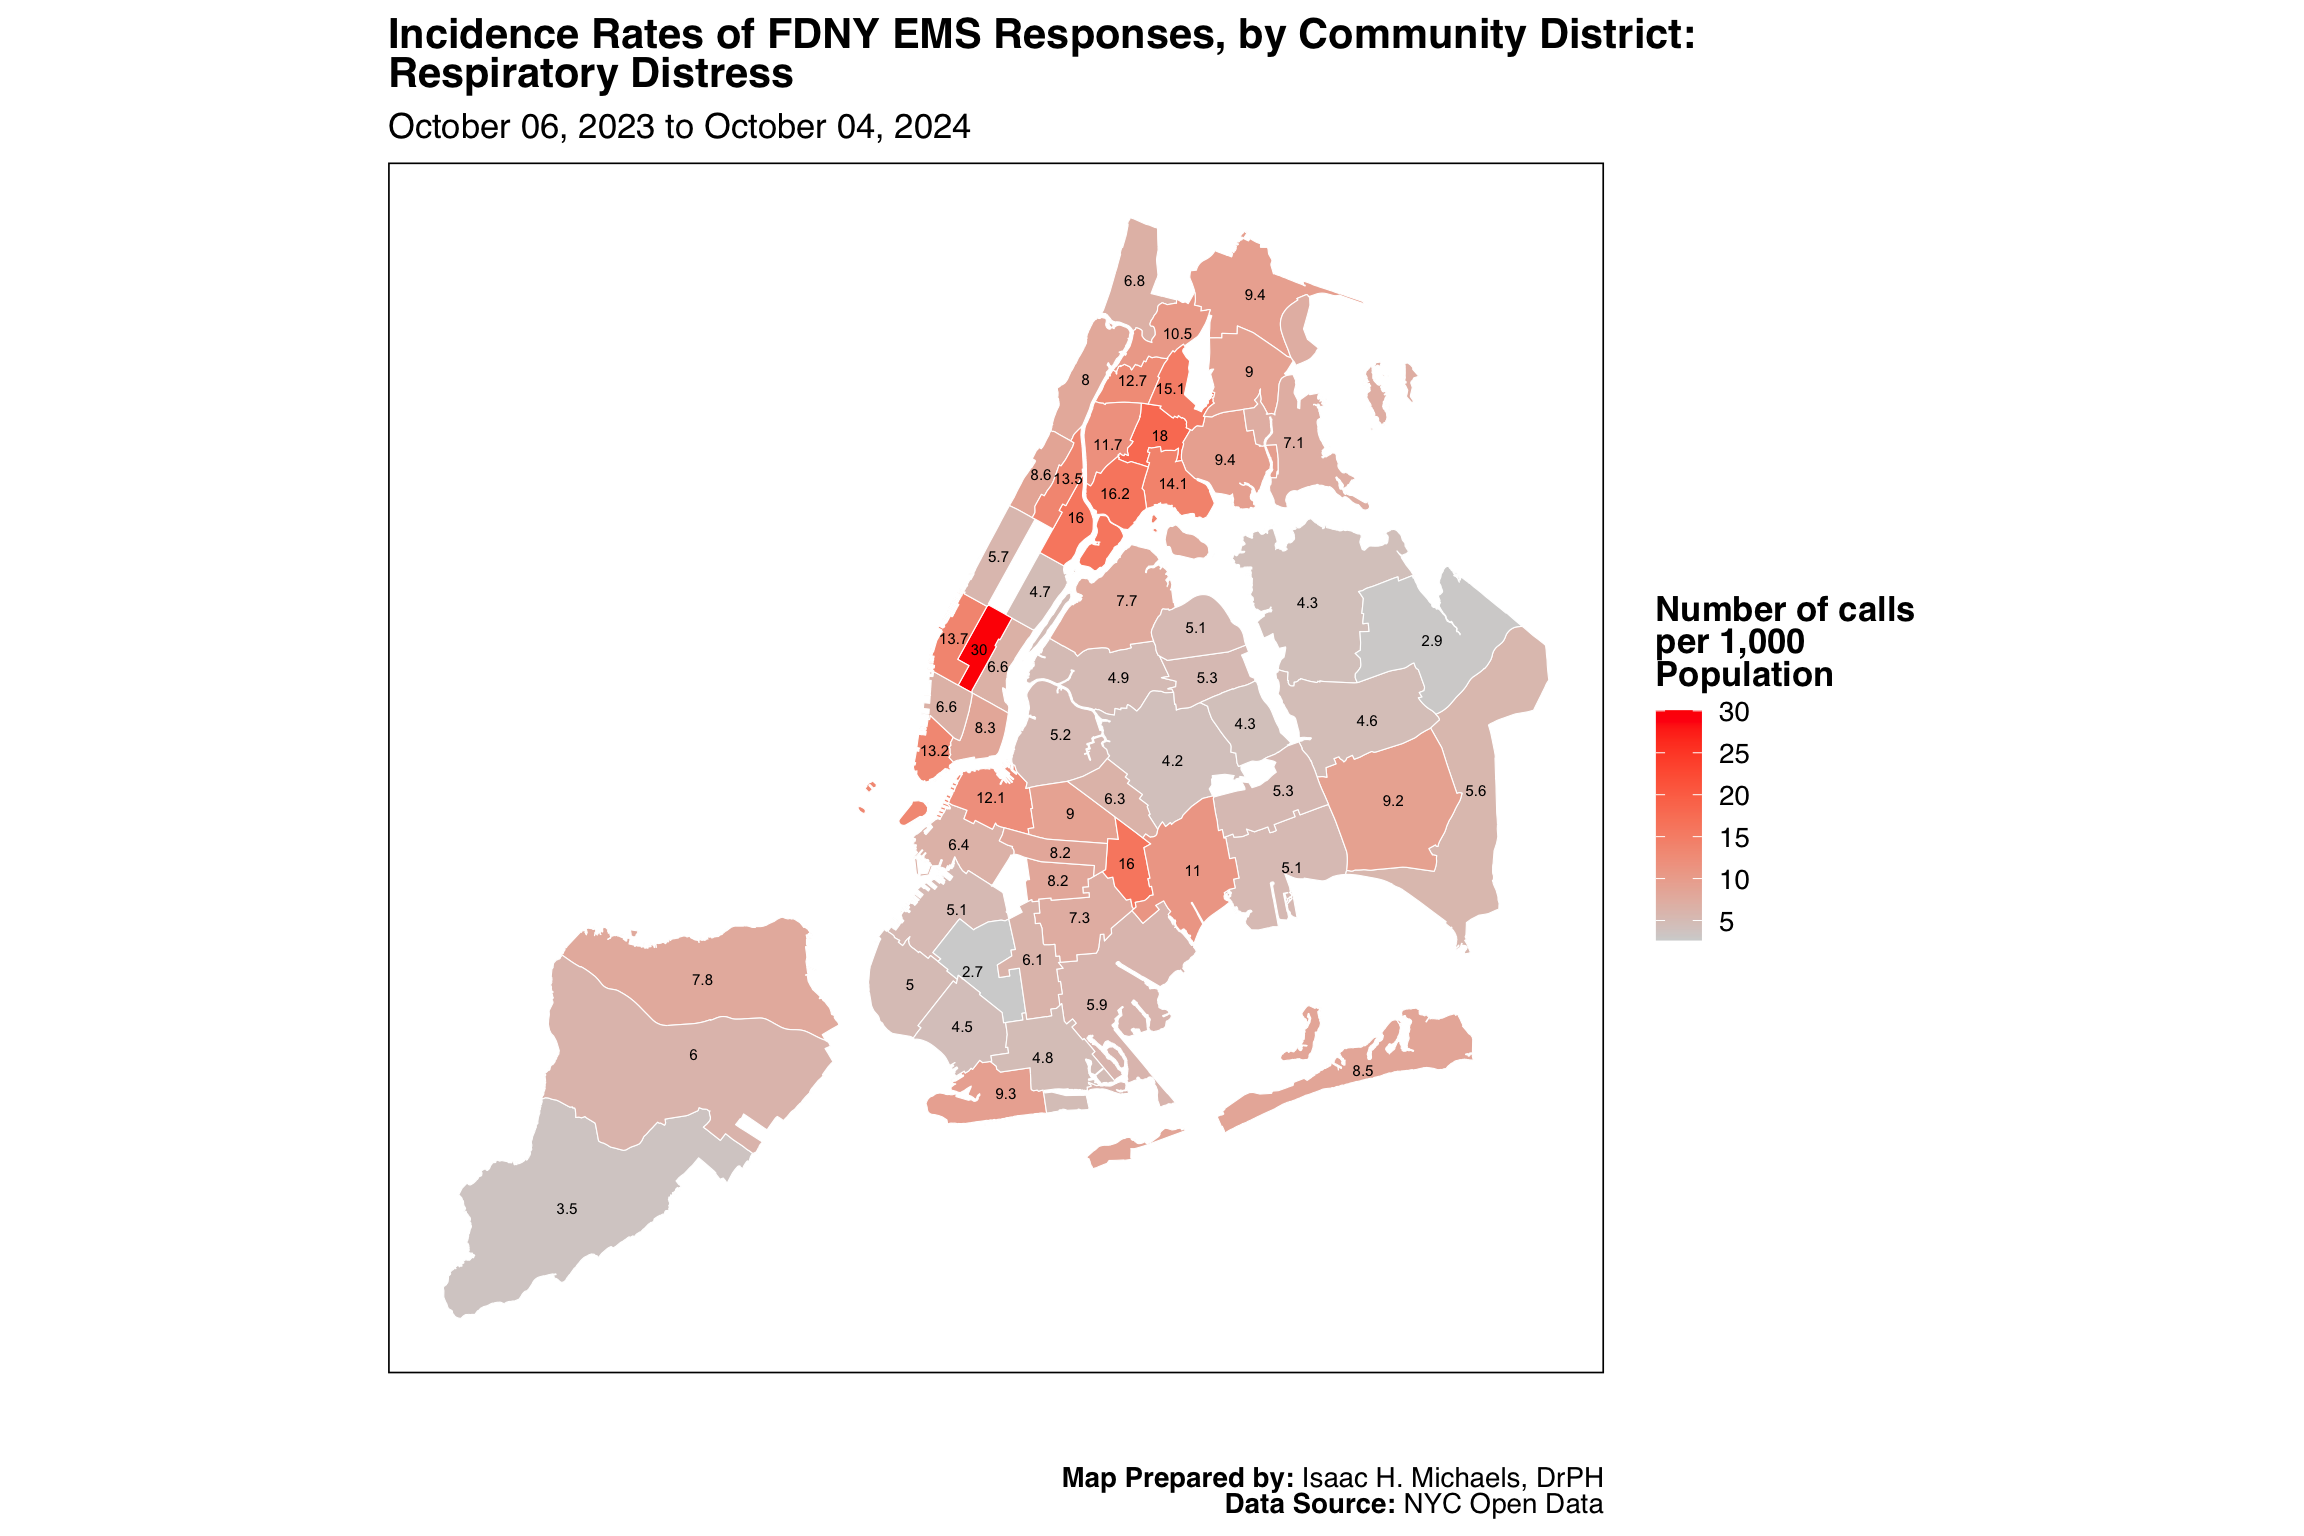
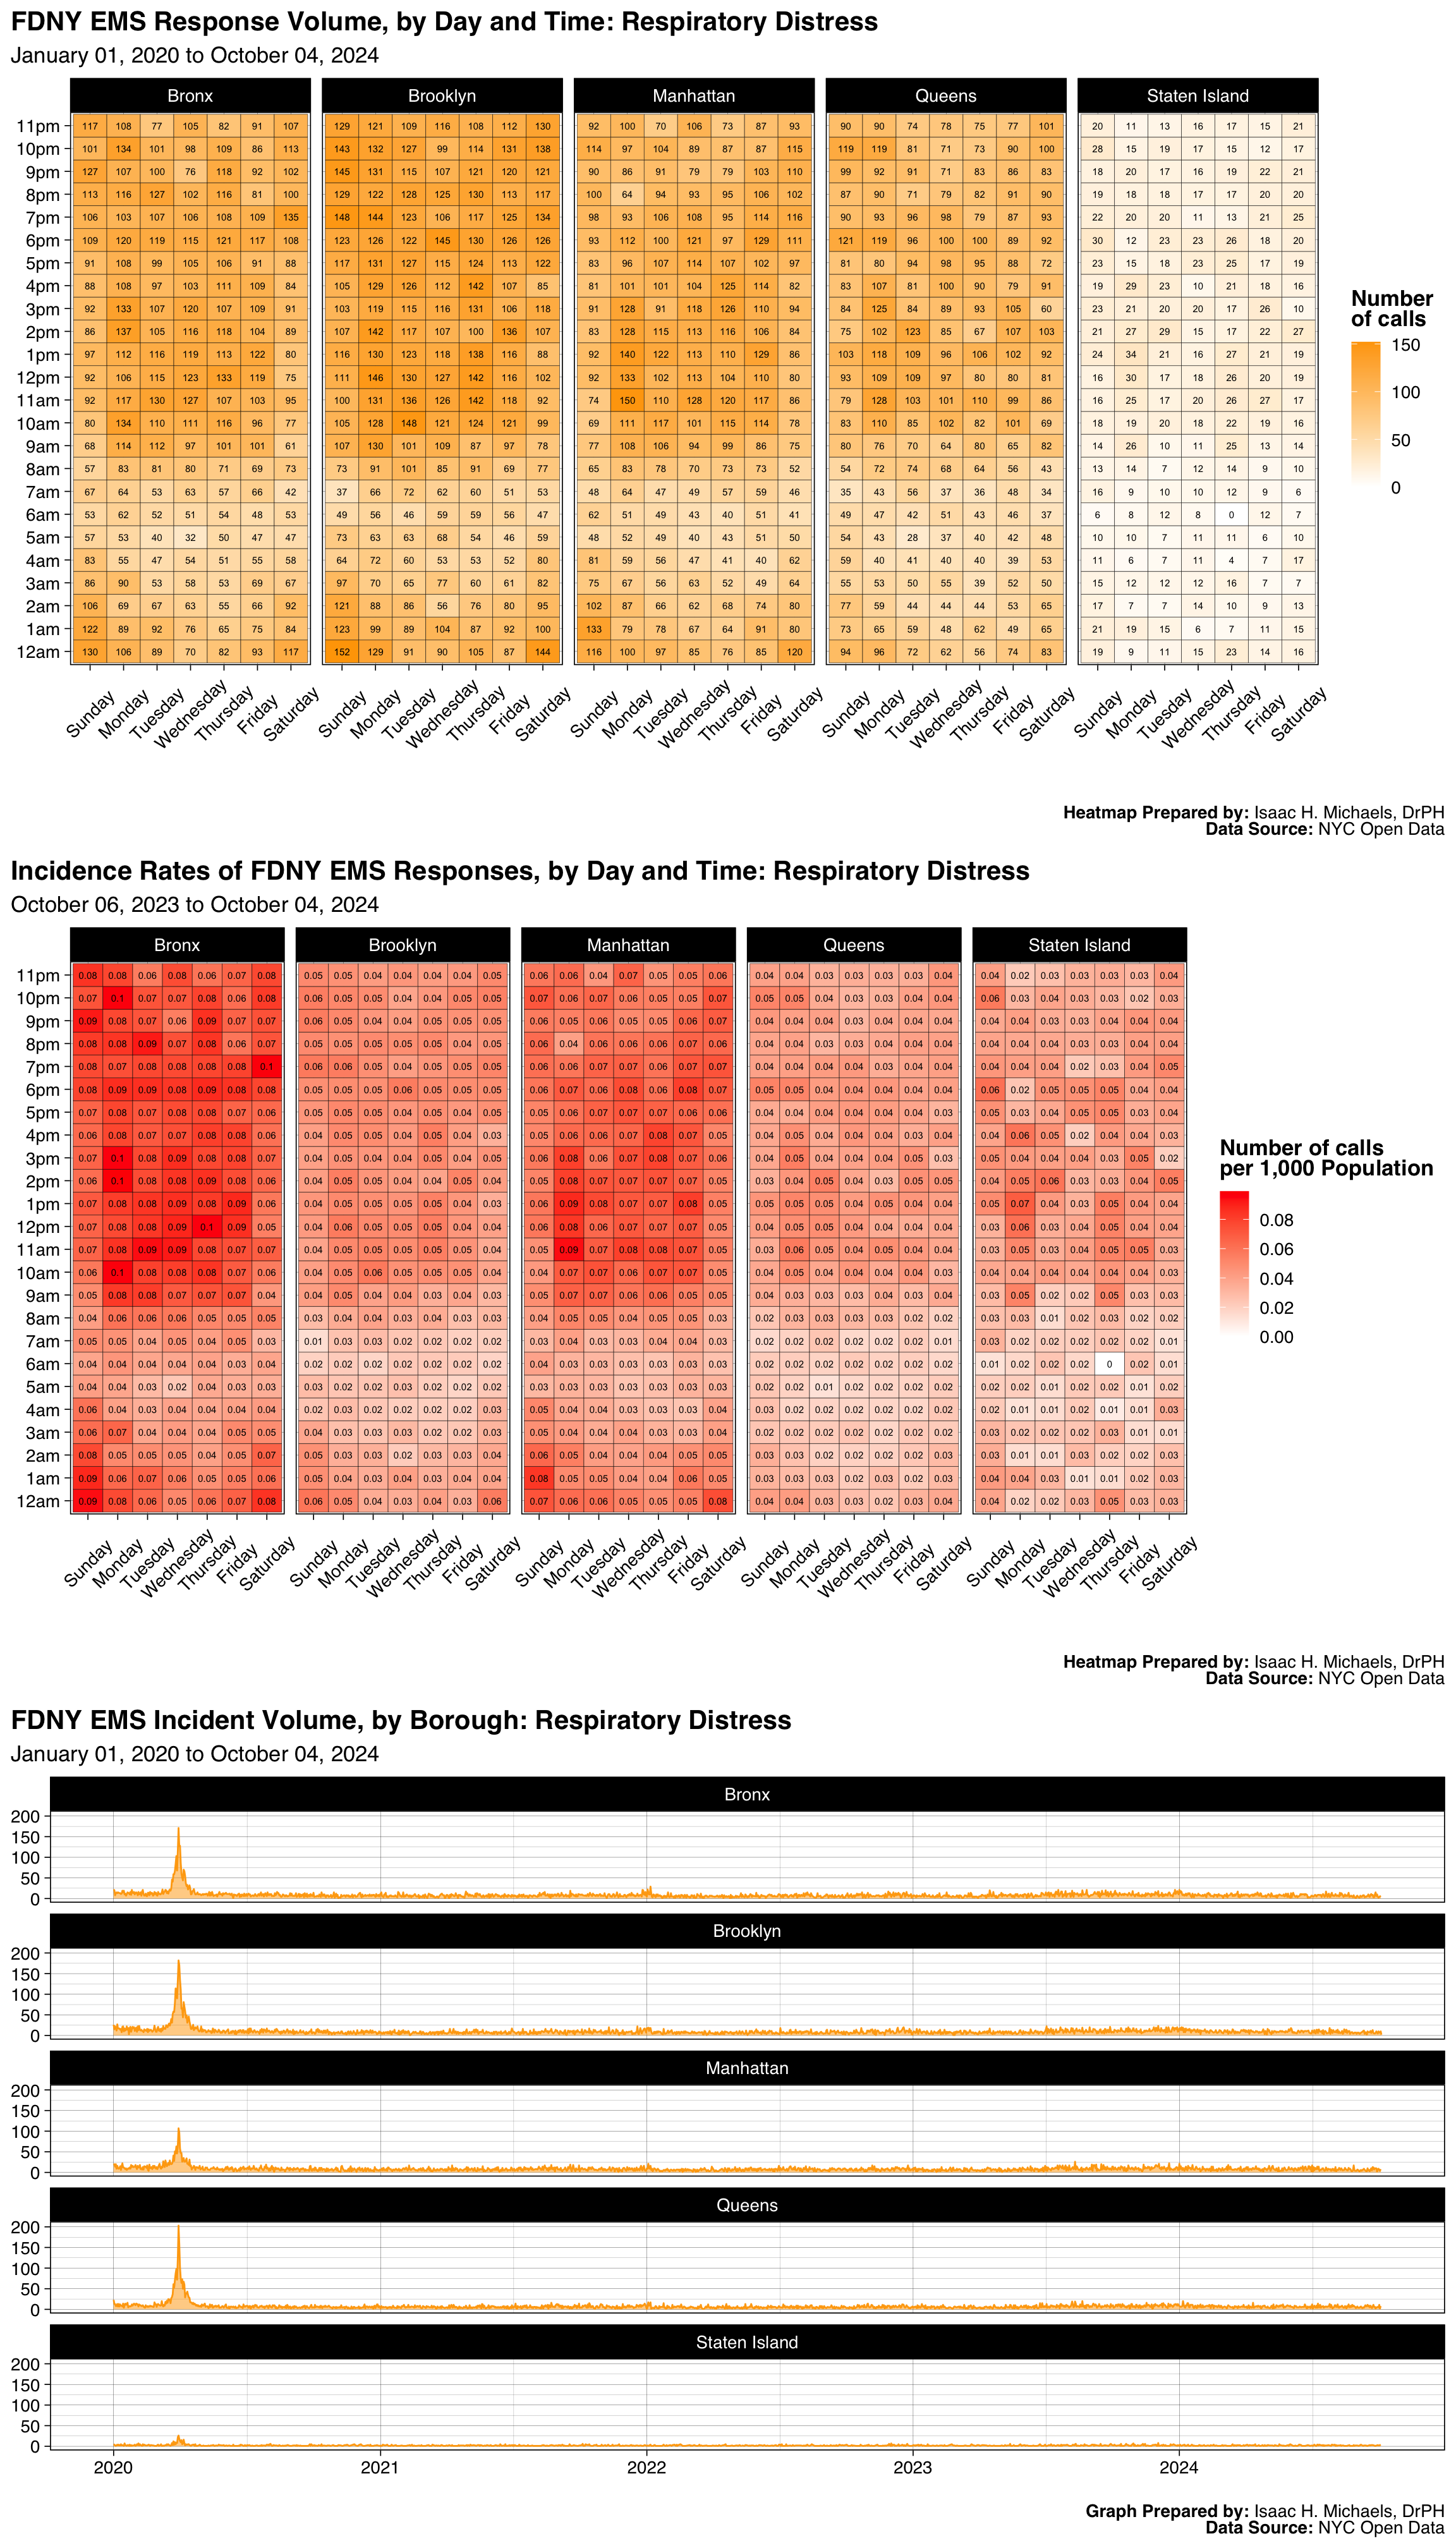
- Respiratory Distress
- Seizures
- Anaphylaxis
- Asthma Attack
- Hypothermia
- Stabbing
- Sick Pediatric, <5 Year Old
- Multiple Trauma Patient
- Police 10-13, Confirmed
- Request For Stand-By
- Female In Labor
- Gyn Bleeding/Pt Not Pregnant
- Major Obstetrical Complaint
- Stroke
- Reaction To Medication
- Gun Shot Wound
- Choking
- Gyn/Severe Pain/Bleeding
- Miscarriage
- Hypertension
- Inhalation Of Smoke
- One Alarm Fire
- Minor Burns <18% Adlt Or <10%
- Obstetric Complications
- Police 10-13, Unconfirmed
- Heat Exhaustion
- Major Burns 18% Adlt 10% Child
- Jumper Up
- Electrocution
- Jumper Down
- Drowning
- Hostage Situation / Barricaded
- Auto Accident, No Confirmd Inj
- Child Abuse
- Baby Out Or Imminent Birth
- Amputation, Fingers Or Toes
- Two Alarm Fire
- Amputation, Arm, Hand,Leg,Foot
- Ground Transport Incident
- Active Shooter
- Special Event
Published: July 18, 2019
Updated: July 15, 2026 at 11:49PM
Welcome
Welcome to my EMS incident dispatch data analysis for New York City. This page provides a comprehensive analysis of emergency medical service (EMS) calls handled by the Fire Department of New York (FDNY). EMS plays a crucial role in responding to medical emergencies, and understanding the patterns of these calls can help inform resource allocation, policy decisions, and public health interventions. The data presented here span from 2020 to the most recent reporting period, sourced from the NYC Open Data platform.
Data Overview
The dataset includes all EMS incidents dispatched by FDNY, capturing key details such as the date and time of the call, location, response time, and final call type. However, it does not include EMS responses from hospitals, private ambulance services, or other agencies operating in New York City. As a result, these data represent only a portion of the total EMS activity within the city. While FDNY is the largest EMS provider in New York City, the absence of data from other agencies should be considered when interpreting trends.
How to Use These Data
This page presents multiple visualizations to help users explore EMS call trends. The analyses include daily call volumes, response times, spatial distribution of incidents, cumulative and trend analyses for different call types, and incidence rate calculations. Users can examine citywide patterns or focus on specific boroughs, times of day, or types of medical emergencies. These insights can support emergency preparedness planning, operational adjustments, and policy development to improve response efficiency and public health outcomes.
Why Are These Data Important?
EMS data provide valuable insights into public health and emergency response systems. Monitoring trends in call volume, response times, and call types helps identify emerging health concerns, evaluate the efficiency of EMS services, and guide resource allocation. These data are particularly critical for understanding the ongoing impact of the COVID-19 pandemic, seasonal variations in medical emergencies, and disparities in access to emergency care across different neighborhoods.
What Do These Data Show?
These data illustrate key aspects of FDNY EMS response, including the frequency of calls by borough, time of day, and final call type. The visualizations highlight cumulative incidence rates and annualized incidence trends, allowing for the identification of shifts in EMS demand over time. Spatial analyses further reveal how EMS calls are distributed across the city, which can help pinpoint areas experiencing higher volumes of medical emergencies. Additionally, call response times are examined to assess potential delays in emergency care.
What Do These Data Not Show?
These data do not provide information on EMS incidents handled by non-FDNY agencies, which means they do not reflect the full scope of emergency medical responses in New York City. Additionally, they do not include patient outcomes, such as hospital admission status, treatment effectiveness, or survival rates. The dataset also lacks demographic details on patients, limiting the ability to analyze disparities in EMS utilization across different population groups. Finally, potential reporting inconsistencies or missing data should be considered when interpreting trends.
Implications for Public Health Practice
Understanding EMS call patterns can support strategic decision-making for emergency response and public health initiatives. Policymakers can use these data to identify areas with high call volumes and assess whether additional EMS resources or alternative healthcare services, such as urgent care centers, are needed. EMS administrators can analyze response time trends to optimize staffing and dispatch strategies, ensuring that emergency care is delivered as quickly as possible. Public health officials can examine call type distributions to detect emerging health threats, such as seasonal spikes in respiratory distress calls or clusters of opioid overdoses, allowing for timely interventions. By integrating these insights into broader health and emergency preparedness planning, stakeholders can enhance the effectiveness and equity of emergency medical services across New York City.
Executive Summary1
Date: July 15, 2026
Subject: FDNY EMS Dispatch Data Briefing: Trends from July 2025 to June 2026
This briefing summarizes trends from the New York City Fire Department’s (FDNY) Emergency Medical Service (EMS) Computer-Aided Dispatch system for the 12-month period of July 2025 through June 2026. Over the past year, citywide EMS incident volume remained relatively stable, with a total of 1,605,855 dispatches. Call volume in June 2026 (138,437 incidents) was nearly level with volume from June 2025 (139,743 incidents), representing a minor decrease of 1,306 calls (-0.9%). Throughout the reporting period, three call types consistently constituted the highest proportion of incidents: “Minor Illness” (averaging 15,836 calls per month), “Sick” (15,575 calls per month), and “Minor Injury” (8,220 calls per month). Together, these categories accounted for nearly one-third (31.9%) of all EMS responses in June 2026.
The most recent monthly data point to a substantial rise in calls for minor injuries. Between May and June 2026, incidents classified as “Minor Injury” climbed from 9,054 to 10,197, an increase of 1,143 incidents or 12.6%. This single-month increase is the most notable change among high-volume incident types. This pattern could indicate the beginning of a seasonal trend, as warmer weather and increased outdoor public activity often correlate with a higher incidence of minor trauma. It is important to note that these dispatch data are preliminary and reflect initial call information, not a final clinical diagnosis. Continued surveillance will be necessary to determine if this uptick is sustained through the summer months.
Analysis of the full 12-month period reveals a pronounced surge in pediatric calls during the past winter. Incidents classified as “Sick Pediatric, <5 Year Old” rose sharply from a baseline average of approximately 2,470 calls per month in late 2025. The volume began climbing in January 2026 (4,714 calls) and peaked in March 2026 with 5,290 incidents, a 114% increase over the previous six-month average. This pronounced seasonal curve may reflect a higher-than-usual circulation of respiratory viruses, such as influenza or RSV, affecting young children. By June 2026, the volume for this call type had returned to 2,638 incidents, which is within the expected baseline range.
It is important to acknowledge certain limitations within these data. Dispatch-level classifications are broad and serve operational purposes; they do not represent confirmed medical diagnoses and can be subject to revision upon patient contact. Furthermore, some lower-volume incident types show high month-to-month volatility that may reflect isolated events or data artifacts rather than broader public health trends, such as an anomalous spike in “Internal Bleeding” calls recorded in December 2025. These data, however, remain a critical tool for monitoring acute public health needs across the city in near real-time. Ongoing monitoring of injury patterns and pediatric illness will be valuable for resource planning.
Daily EMS Call Volume
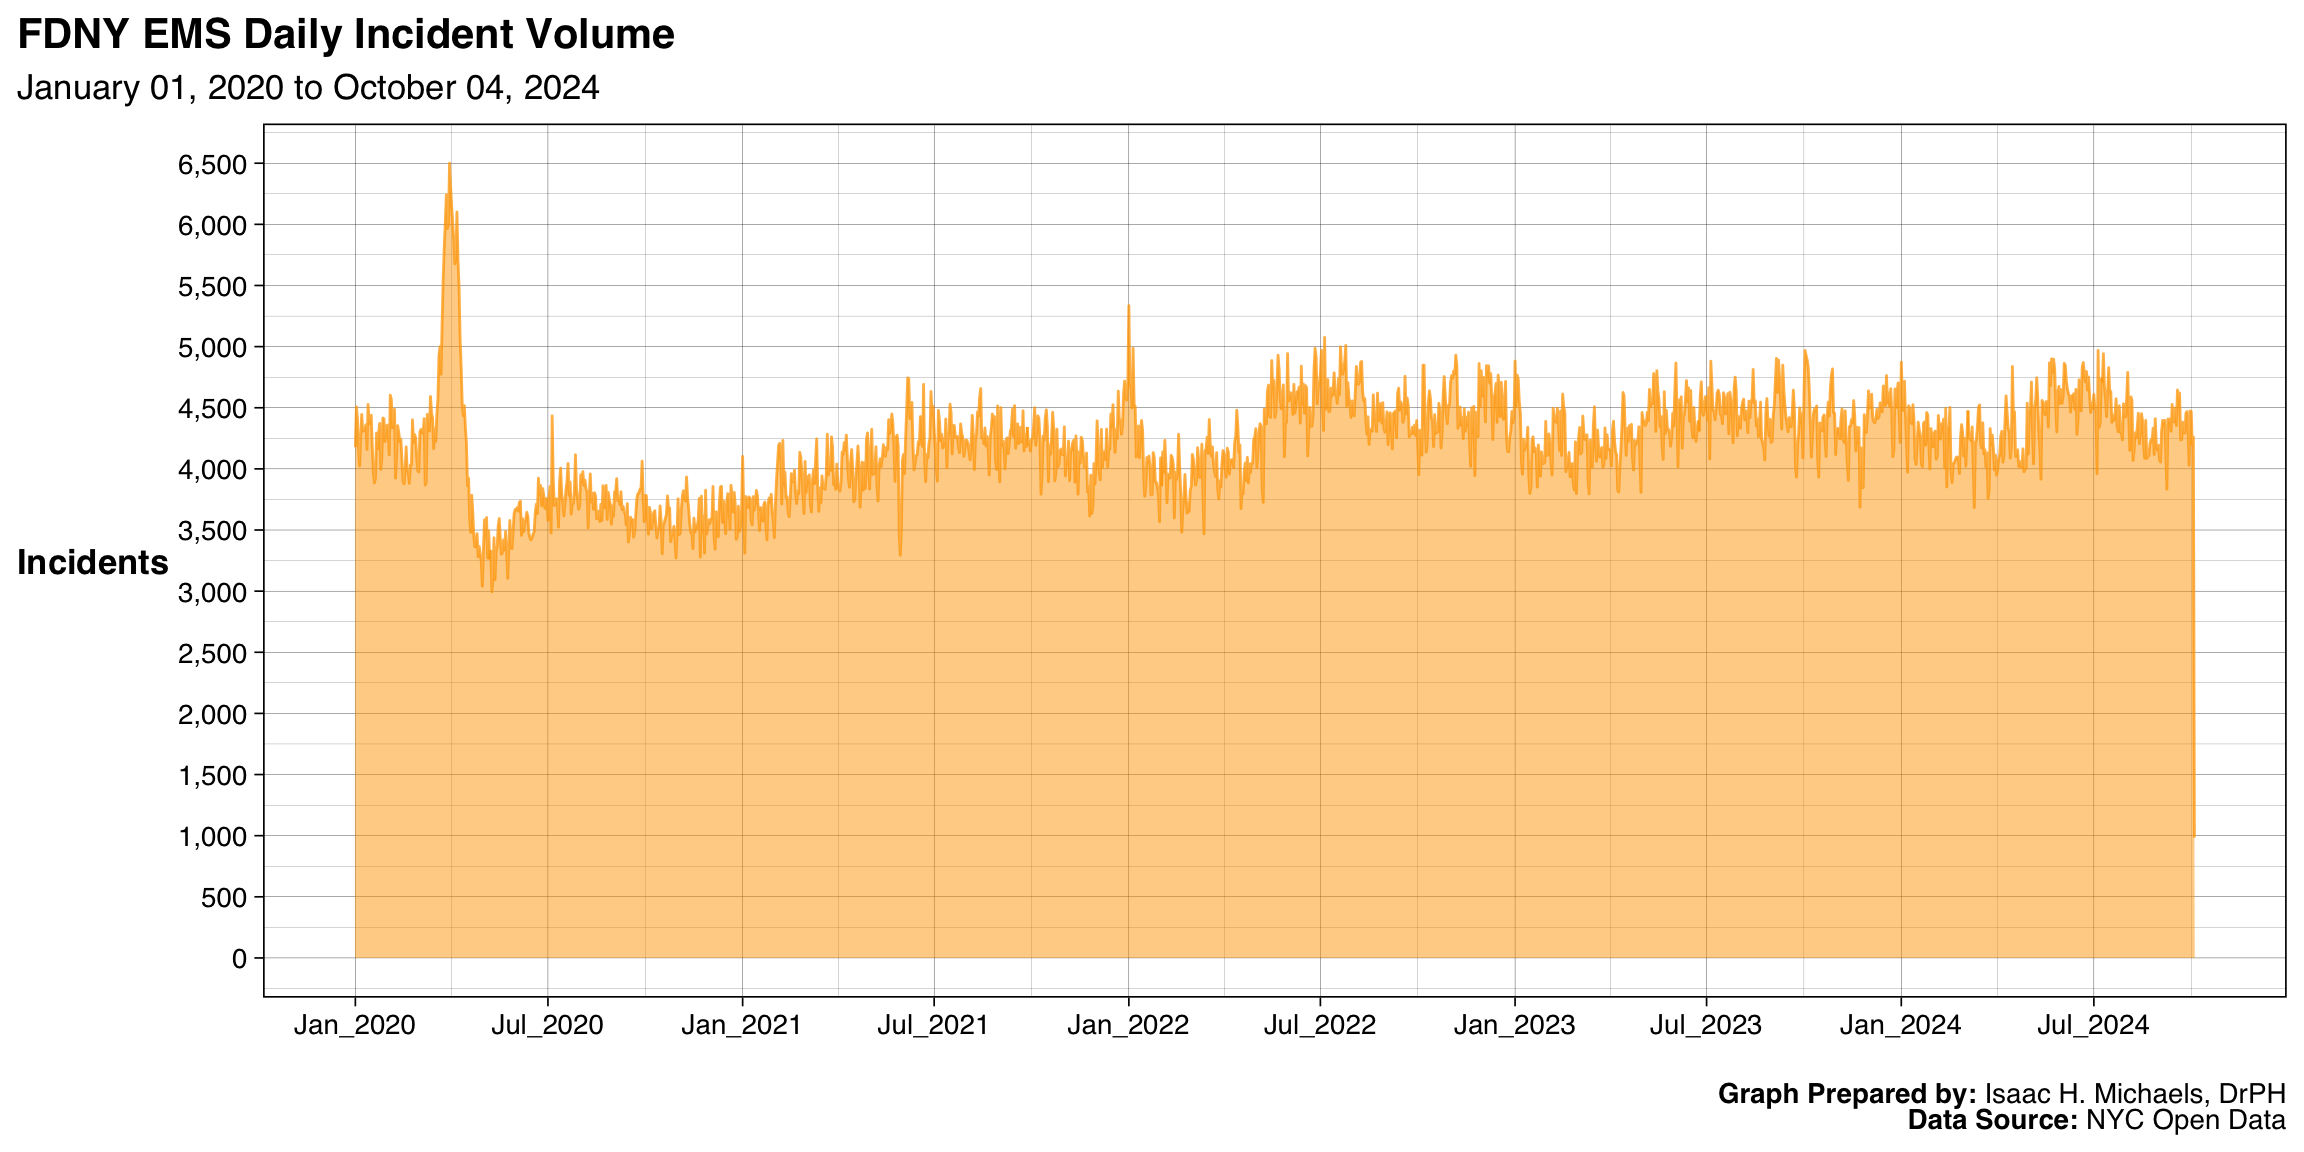
Overall
This figure shows the total number of emergency medical service (EMS) incidents recorded by the Fire Department of New York (FDNY) for each day during the selected timeframe. Each point along the curve represents the daily incident count, with the shaded area illustrating overall volume and highlighting fluctuations over time.
The pattern reveals how call volume varies by day, reflecting both predictable trends—such as weekly and seasonal cycles—and sudden spikes or drops that may correspond to public health events, weather conditions, or large-scale emergencies. This visualization helps contextualize the workload of New York City’s EMS system and underscores its responsiveness to both routine and extraordinary circumstances.
 Graph Prepared By: Isaac H. Michaels, DrPH
Data Source: NYC Open Data
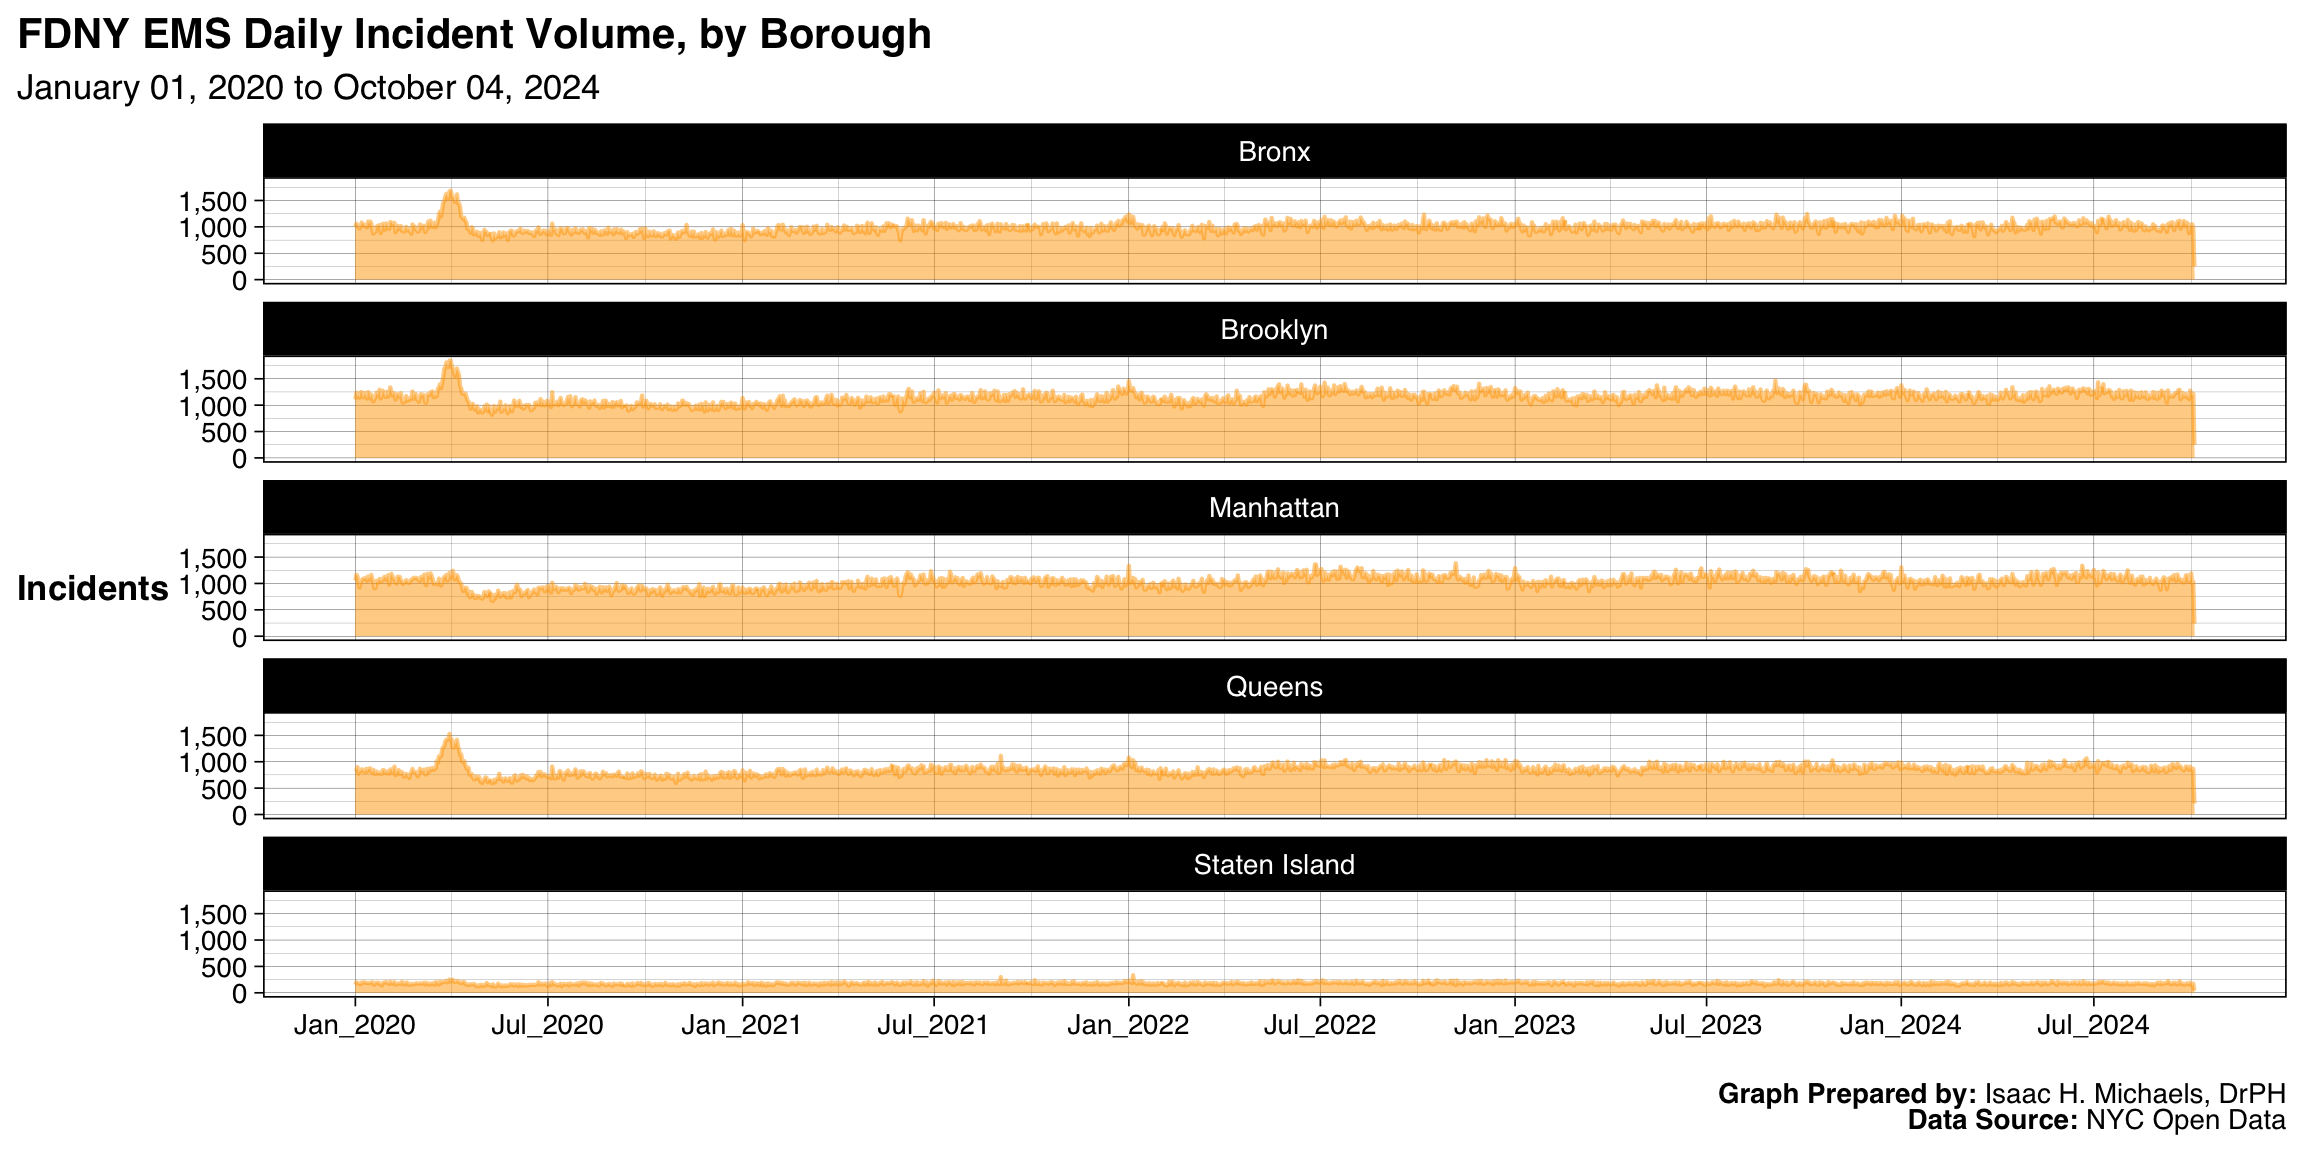
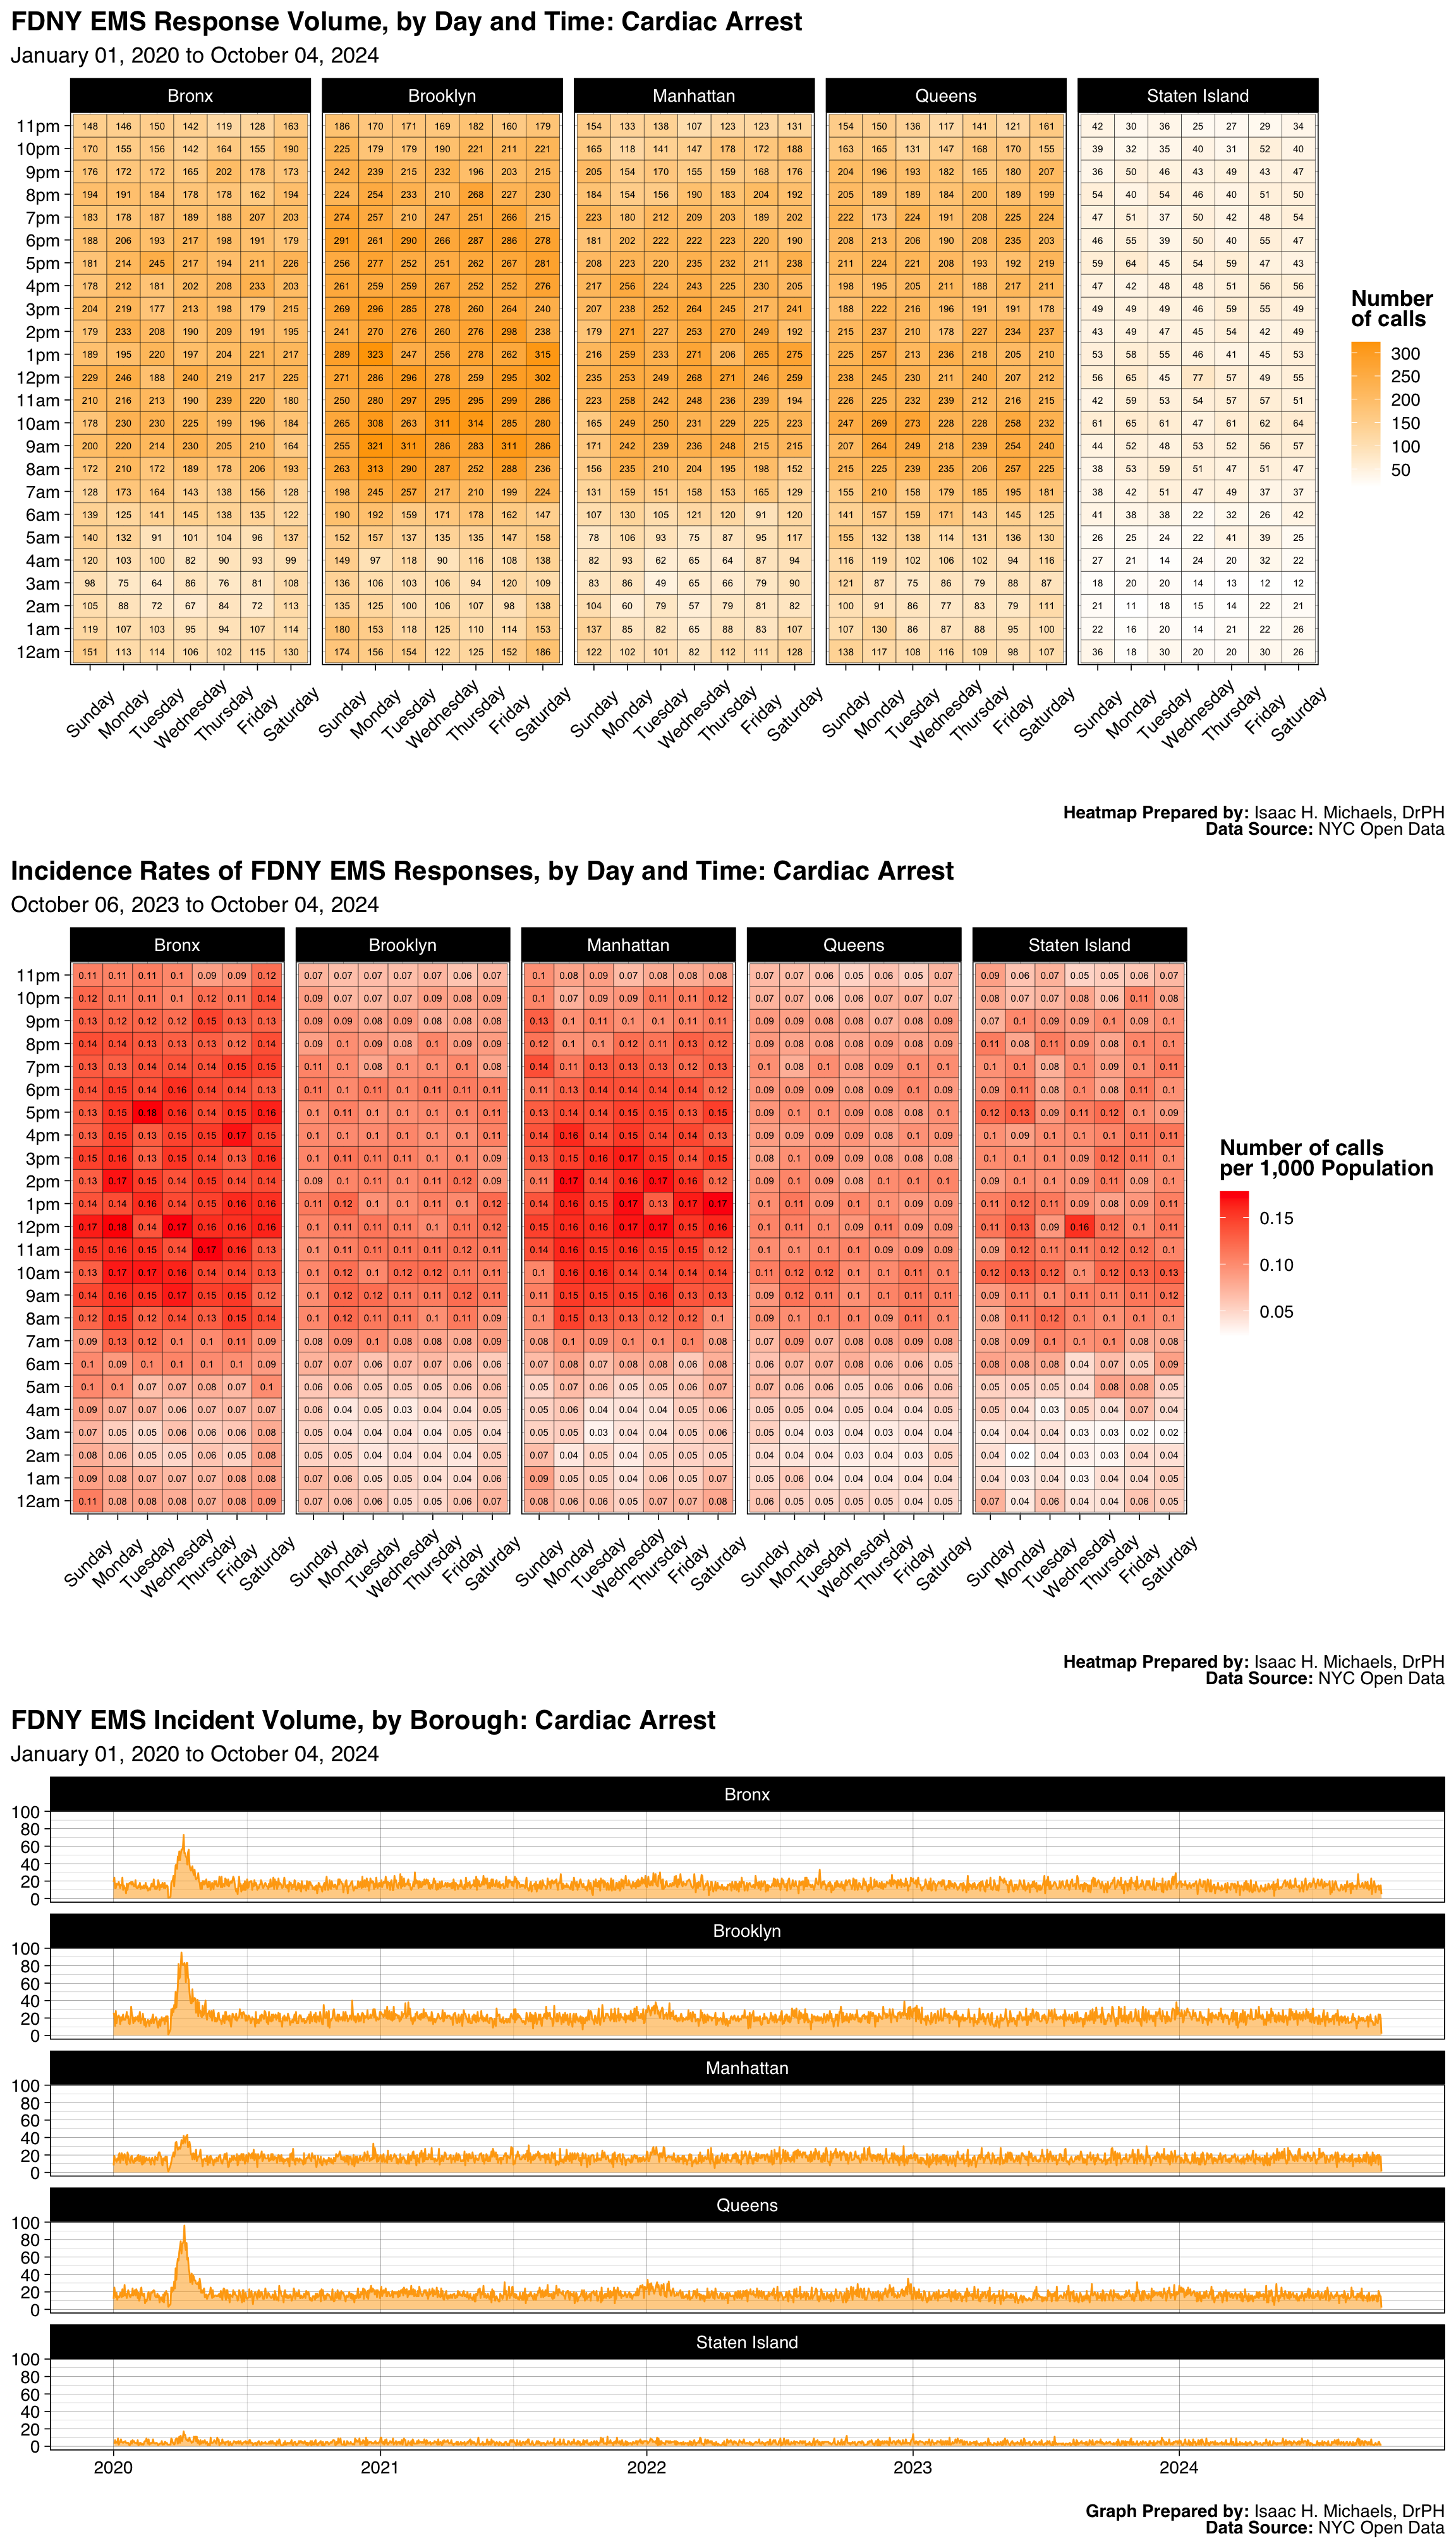
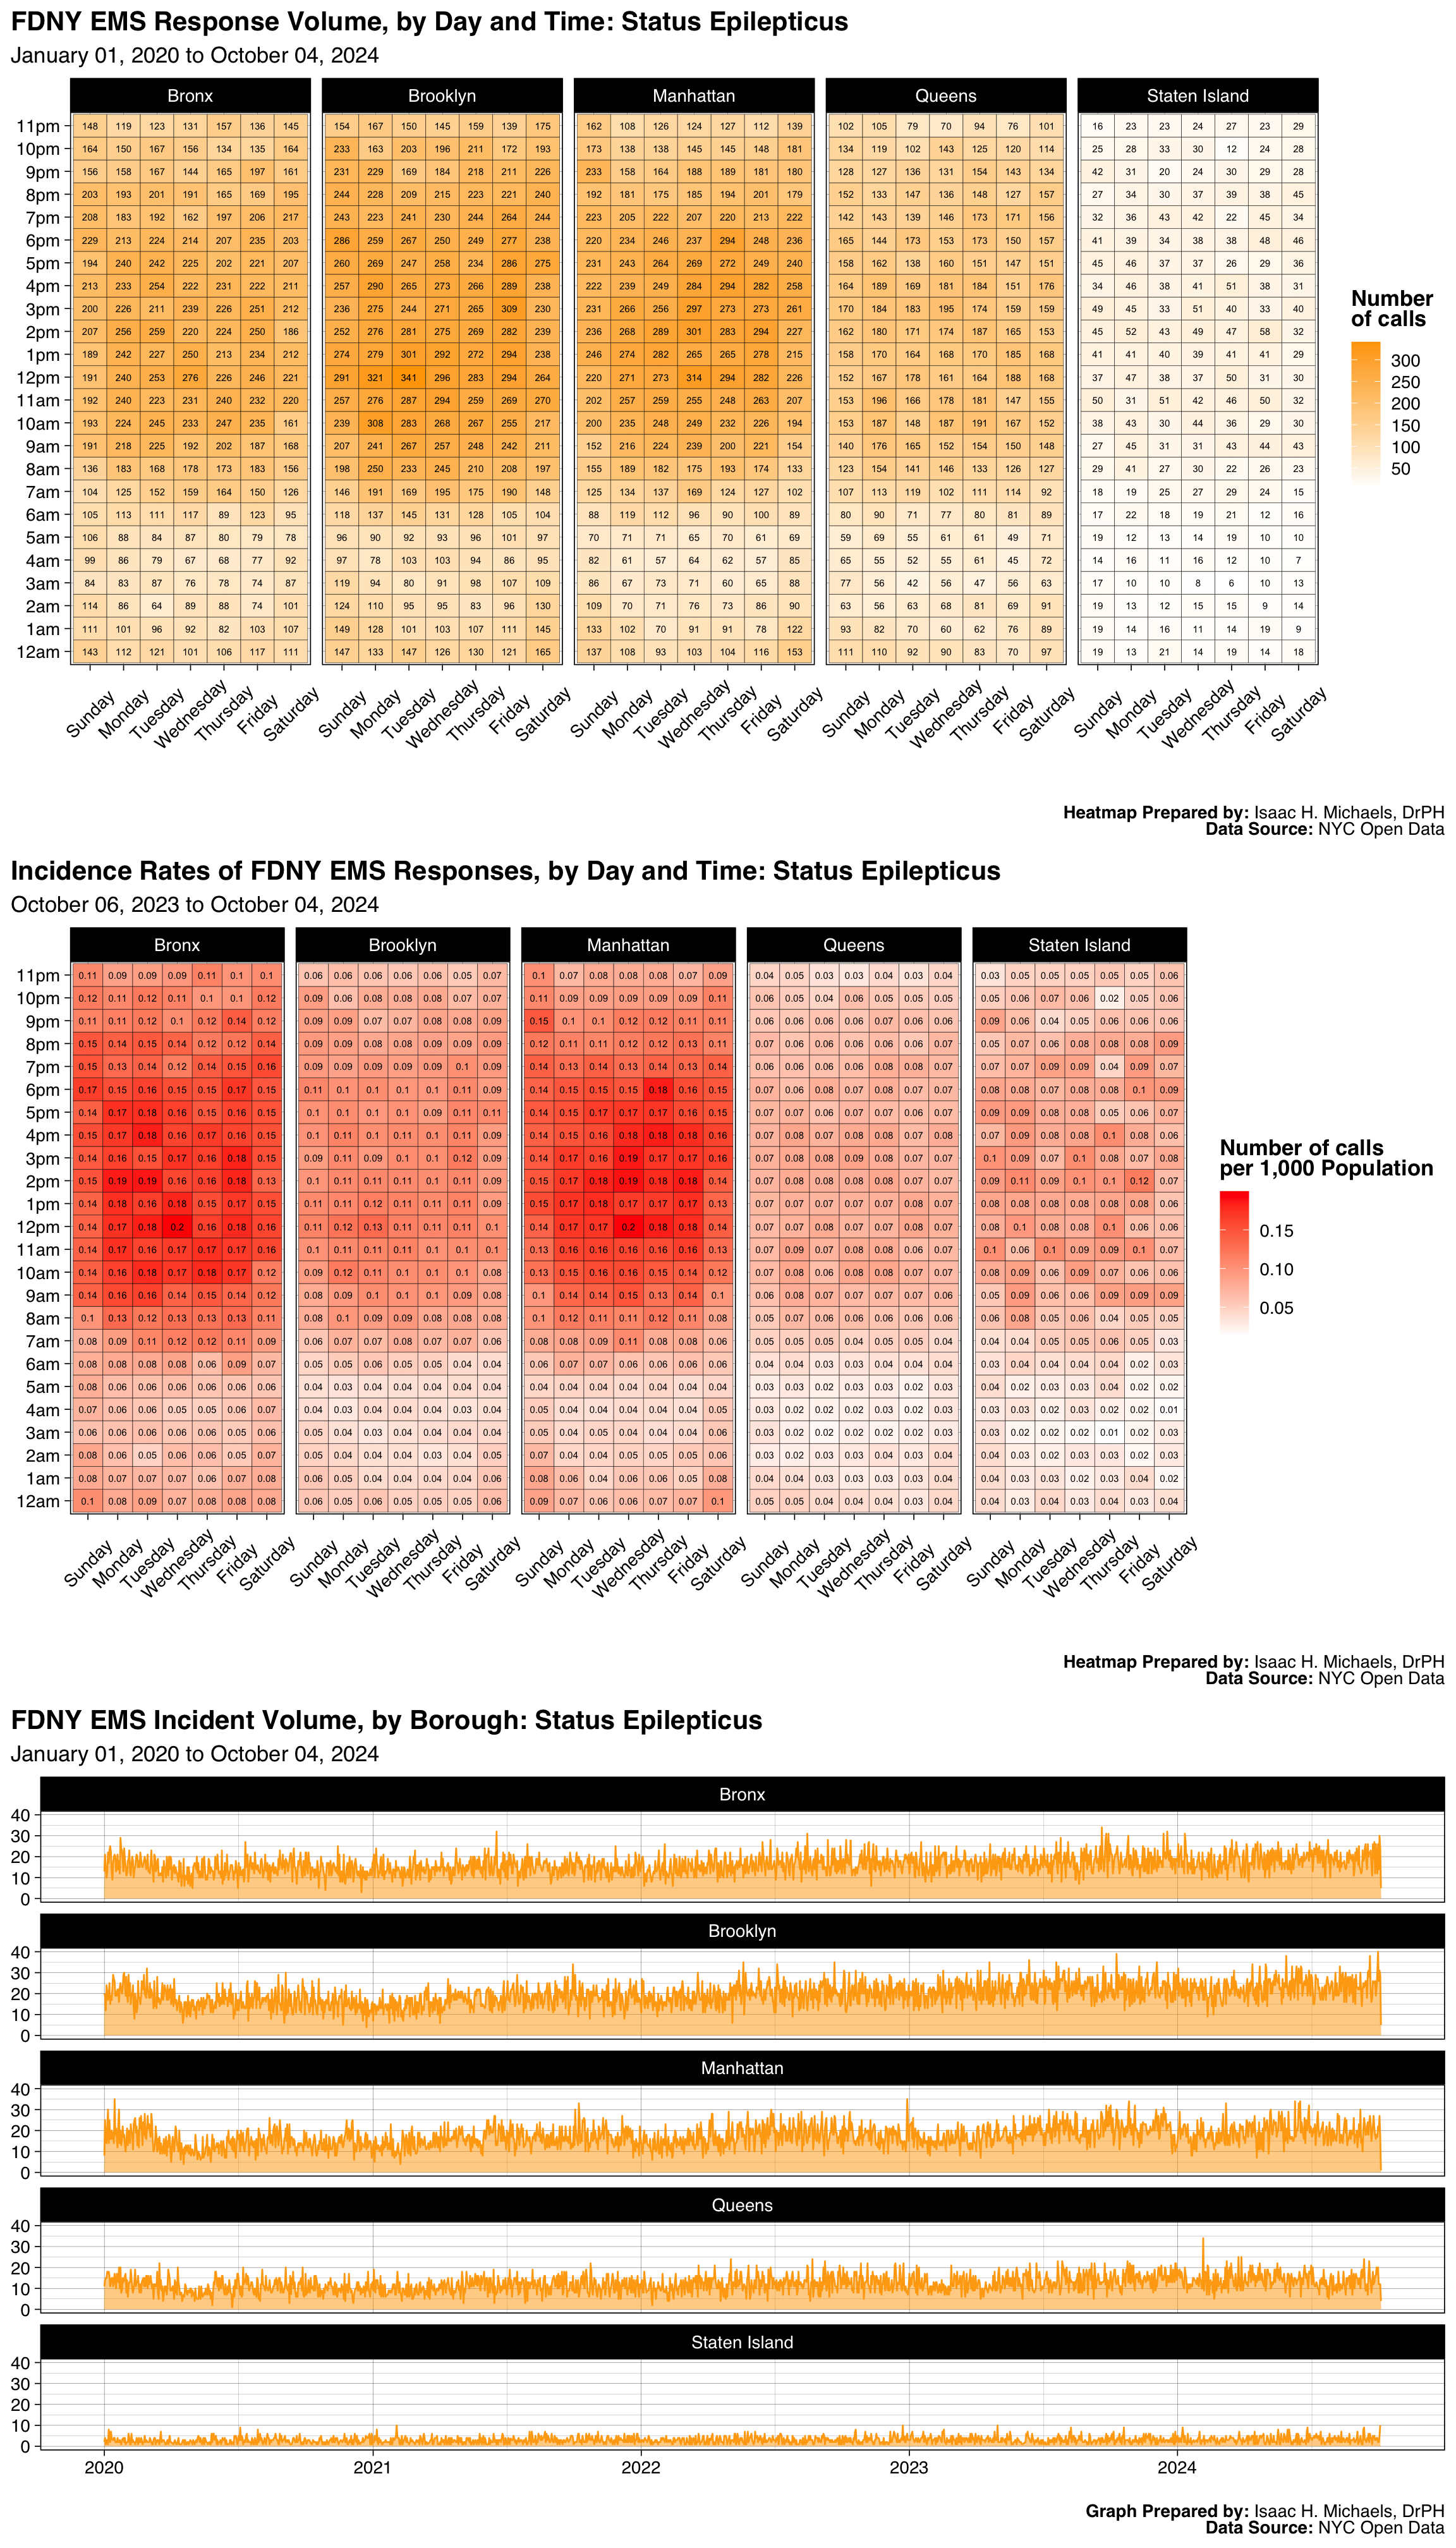
By Borough
This figure presents daily EMS incident volume by borough in New York City over the same period. Each panel represents a single borough, with the line and shaded area indicating the total number of EMS calls recorded on each day. The visualization allows for direct comparison of activity levels and temporal patterns across the five boroughs.
While overall trends generally move together—reflecting citywide influences such as weather, public events, or health emergencies—some differences are visible in the magnitude and variability of calls. These variations may reflect differences in population density, age distribution, neighborhood characteristics, and healthcare access. Examining call patterns by borough provides a more localized view of EMS demand and highlights geographic diversity in service utilization across the city.
 Graph Prepared By: Isaac H. Michaels, DrPH
Data Source: NYC Open Data
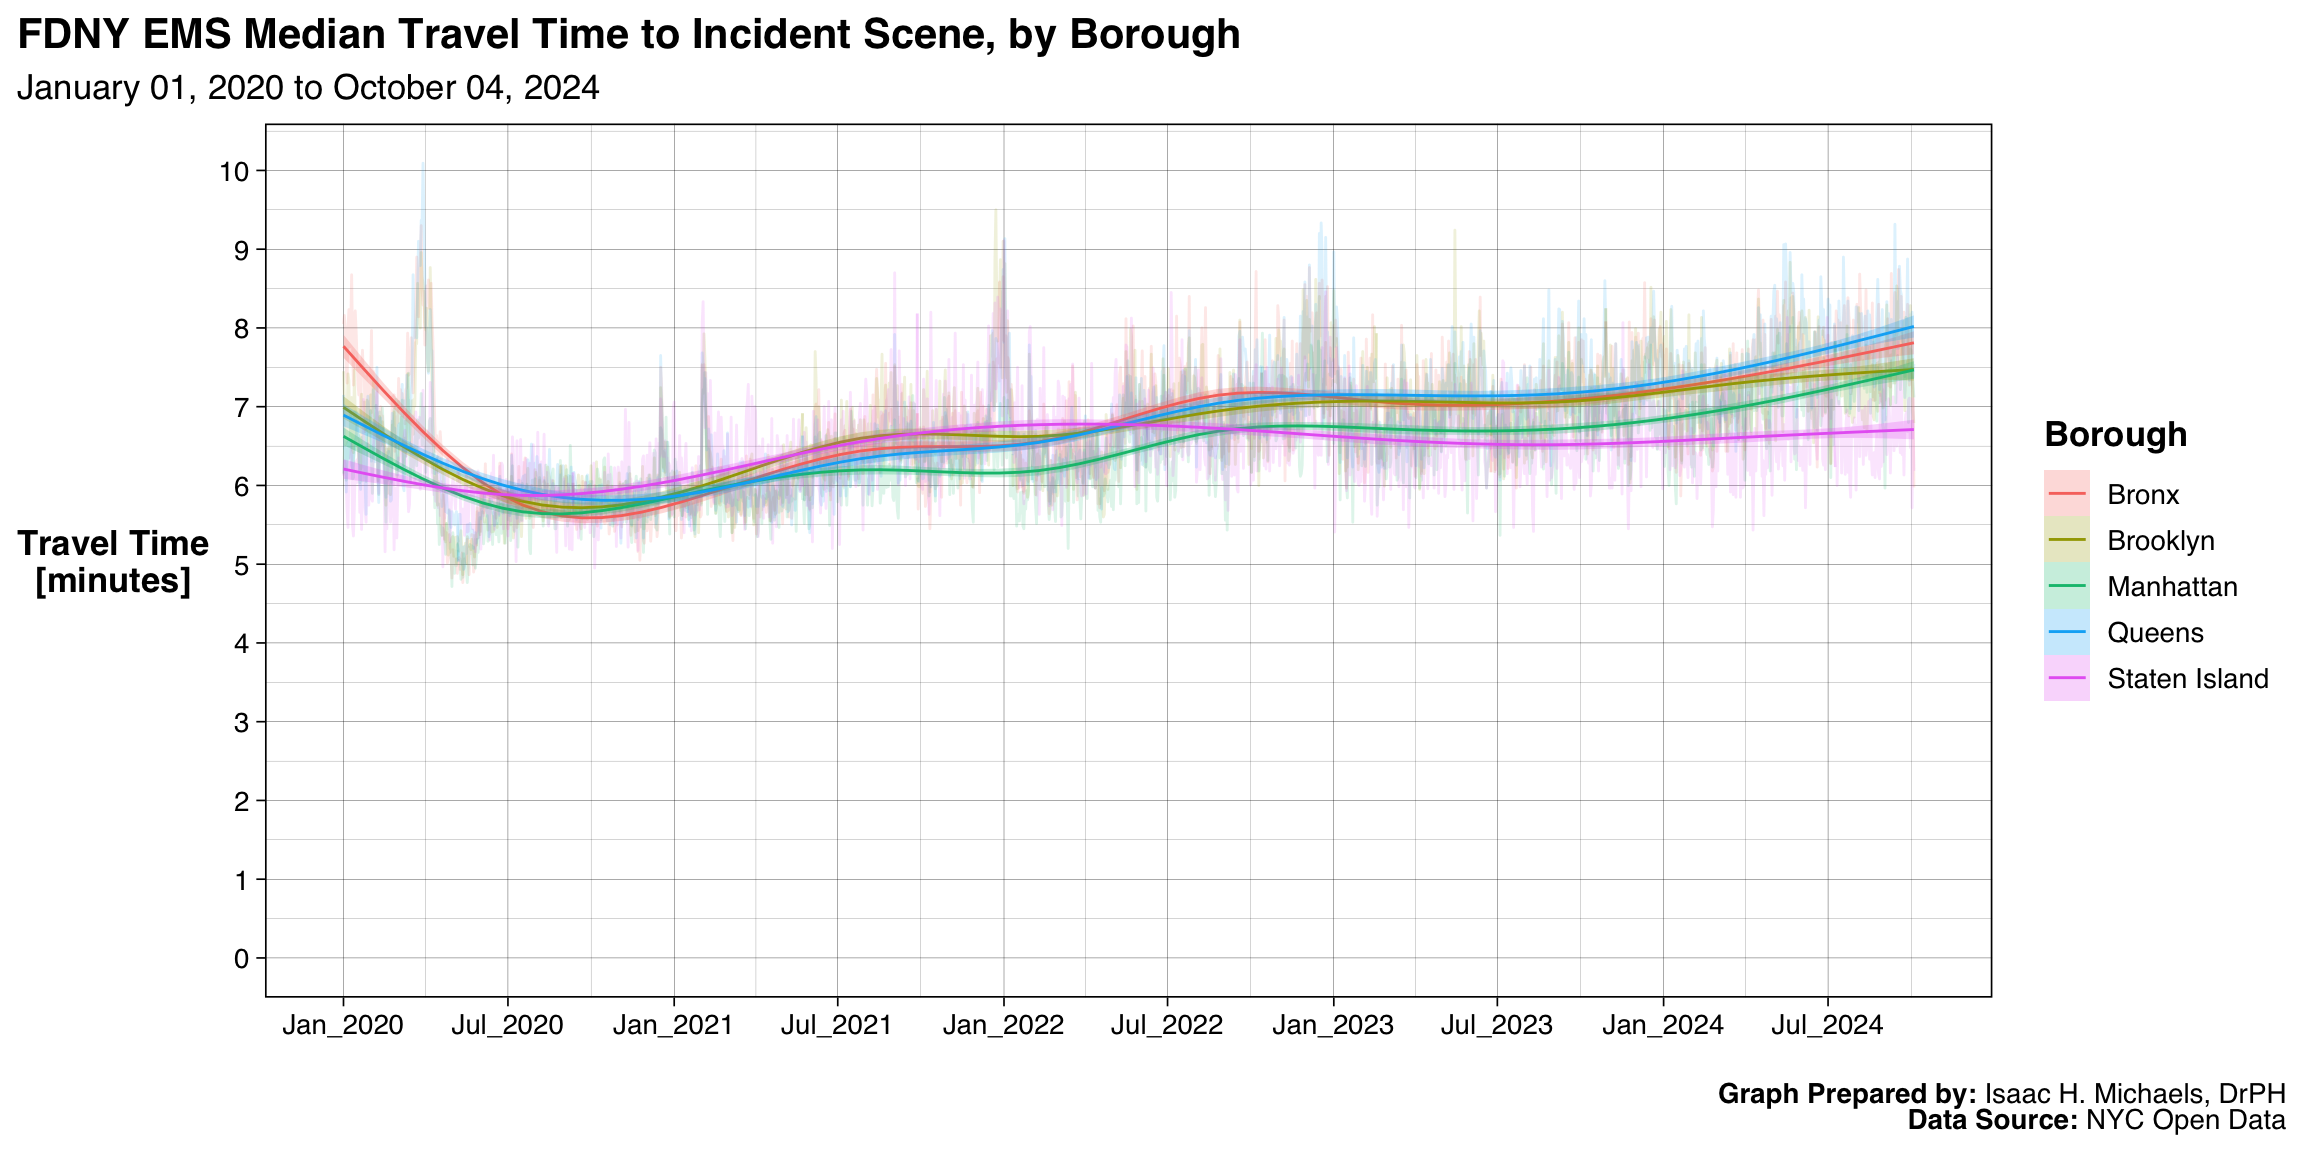
Daily EMS Call Travel Times
This figure displays median FDNY EMS travel times to incident scenes by borough across the observation period. Each line represents daily median travel time in minutes for a given borough, with smoothed trend lines showing longer-term movement over time. The visualization highlights both overall stability and subtle shifts in travel efficiency across the five boroughs.
Differences among boroughs may reflect variations in geography, traffic congestion, call density, and resource allocation. For example, longer travel times may occur in boroughs with greater distances between stations and incident locations, while shorter times may suggest more concentrated coverage or faster roadway access. Tracking these borough-level medians over time provides insight into the operational tempo and responsiveness of the city’s EMS system under varying conditions.
 Graph Prepared By: Isaac H. Michaels, DrPH
Data Source: NYC Open Data
Call Times
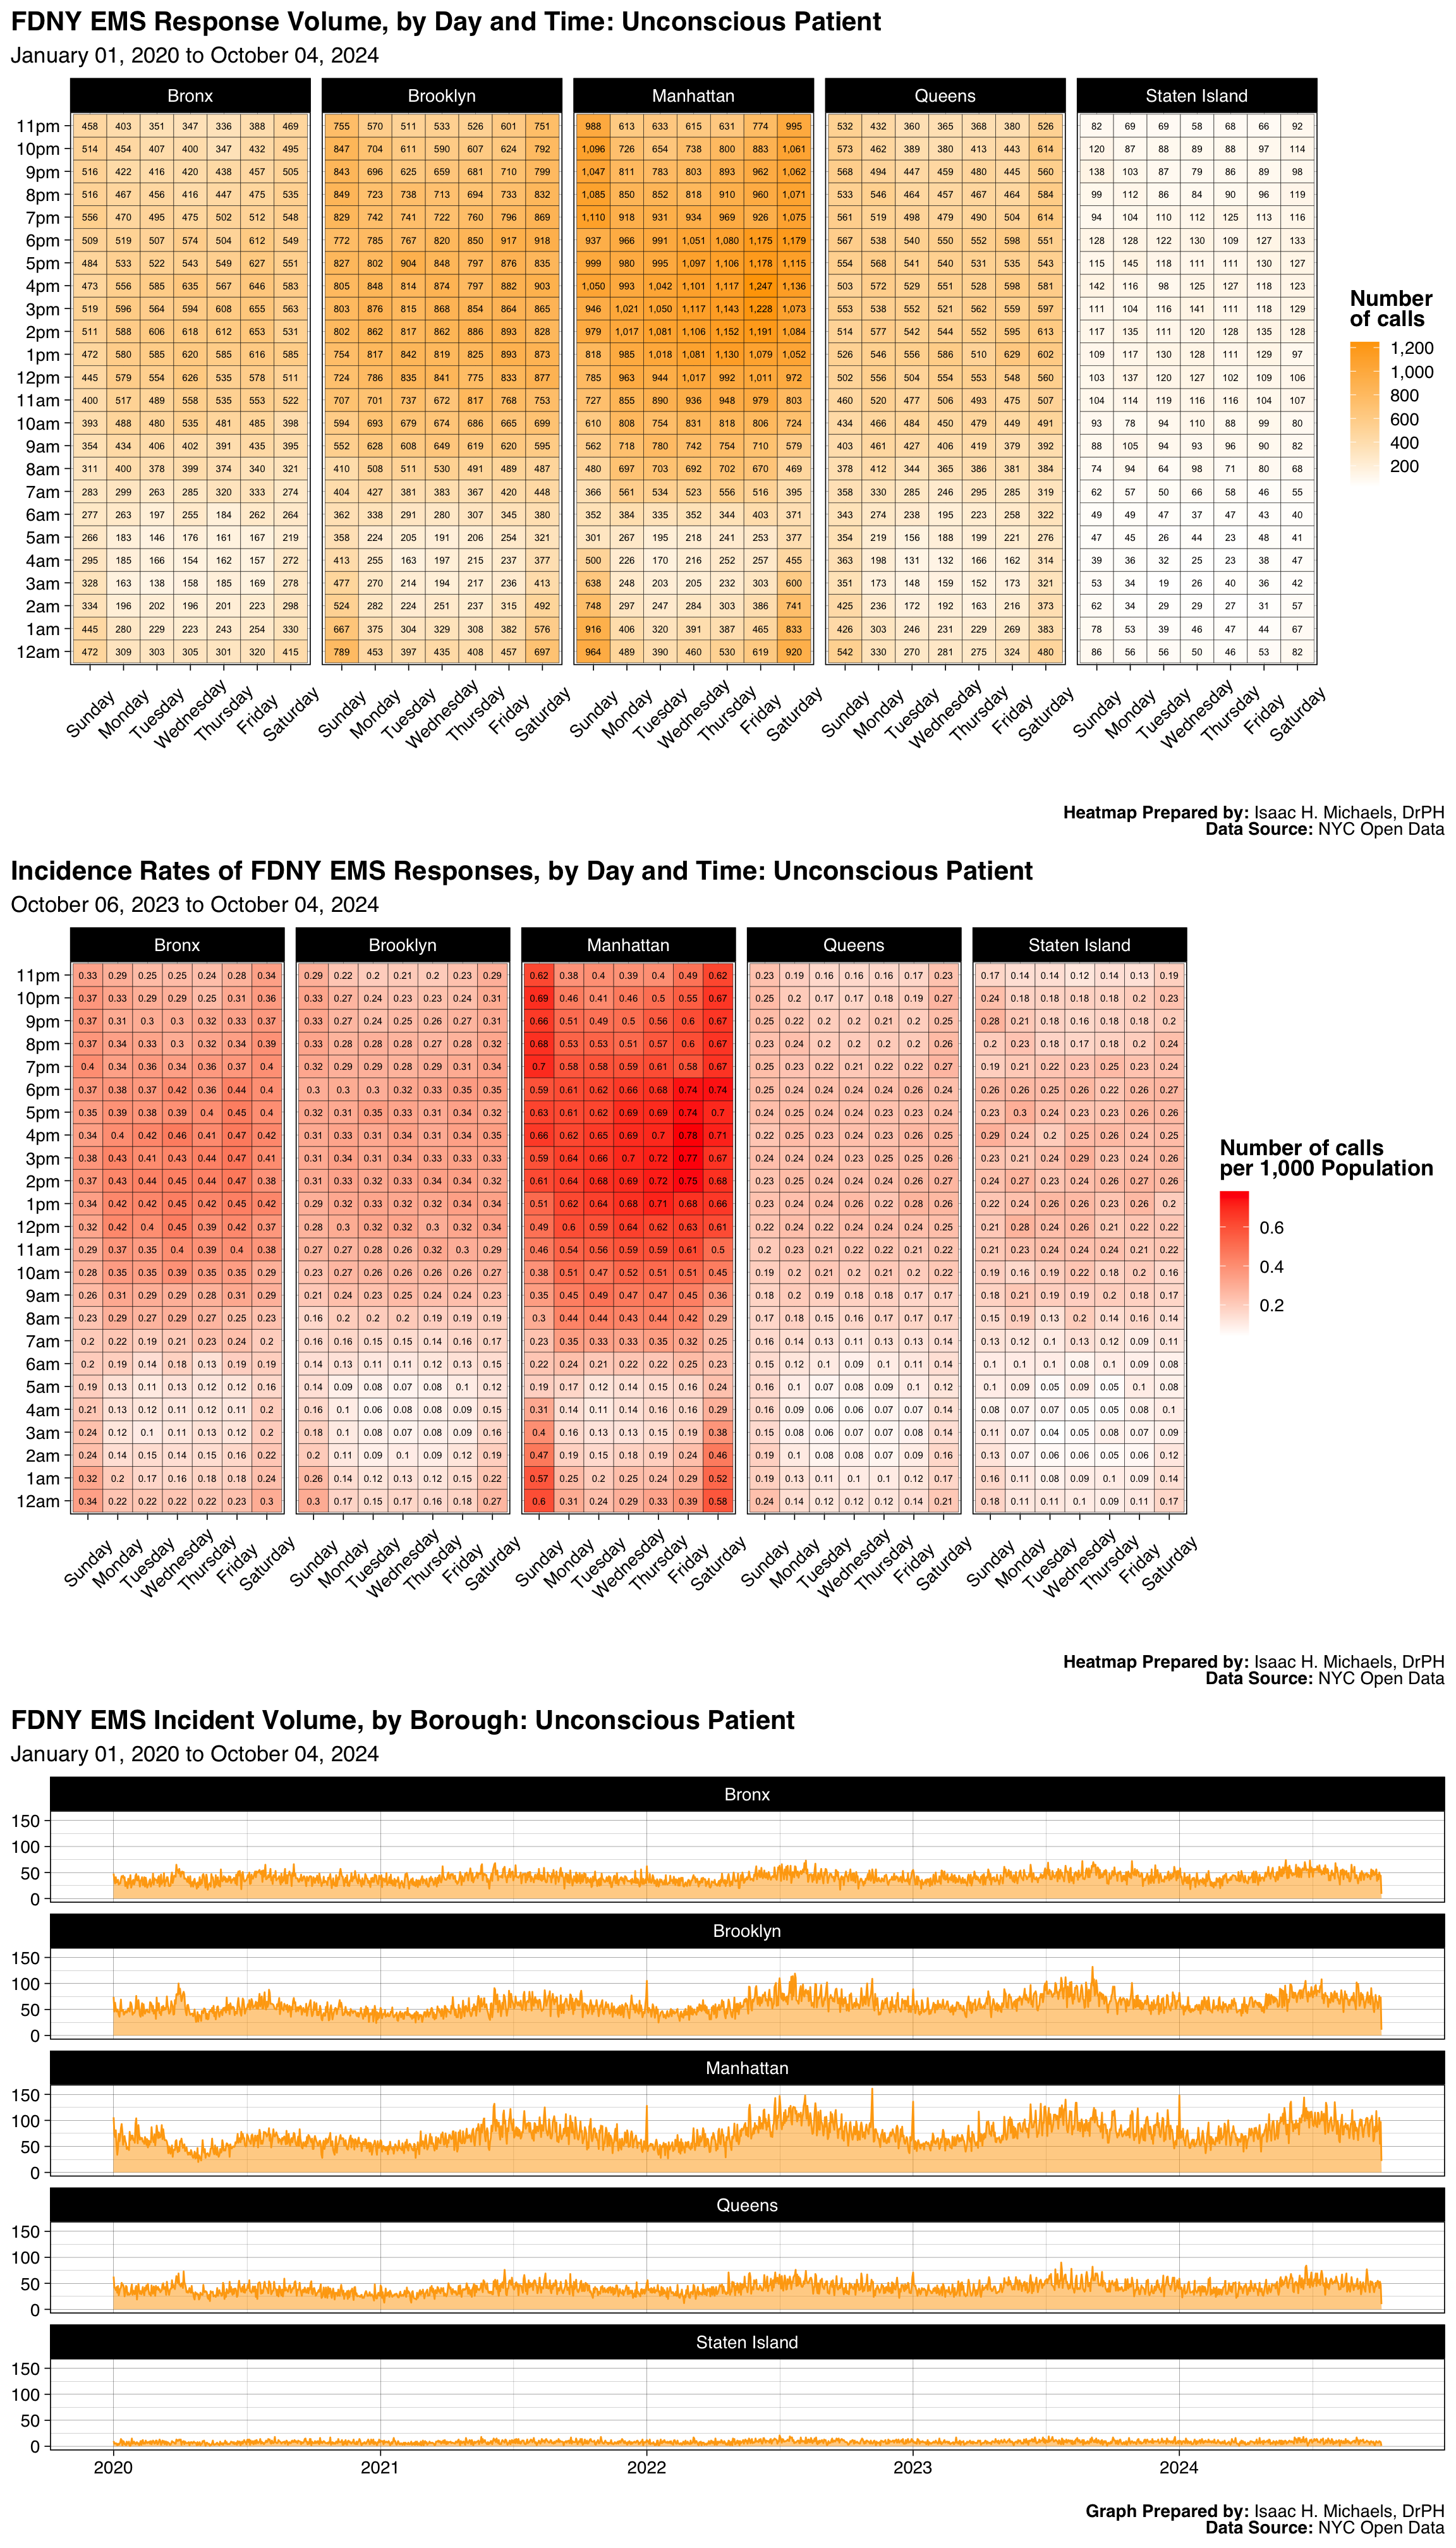
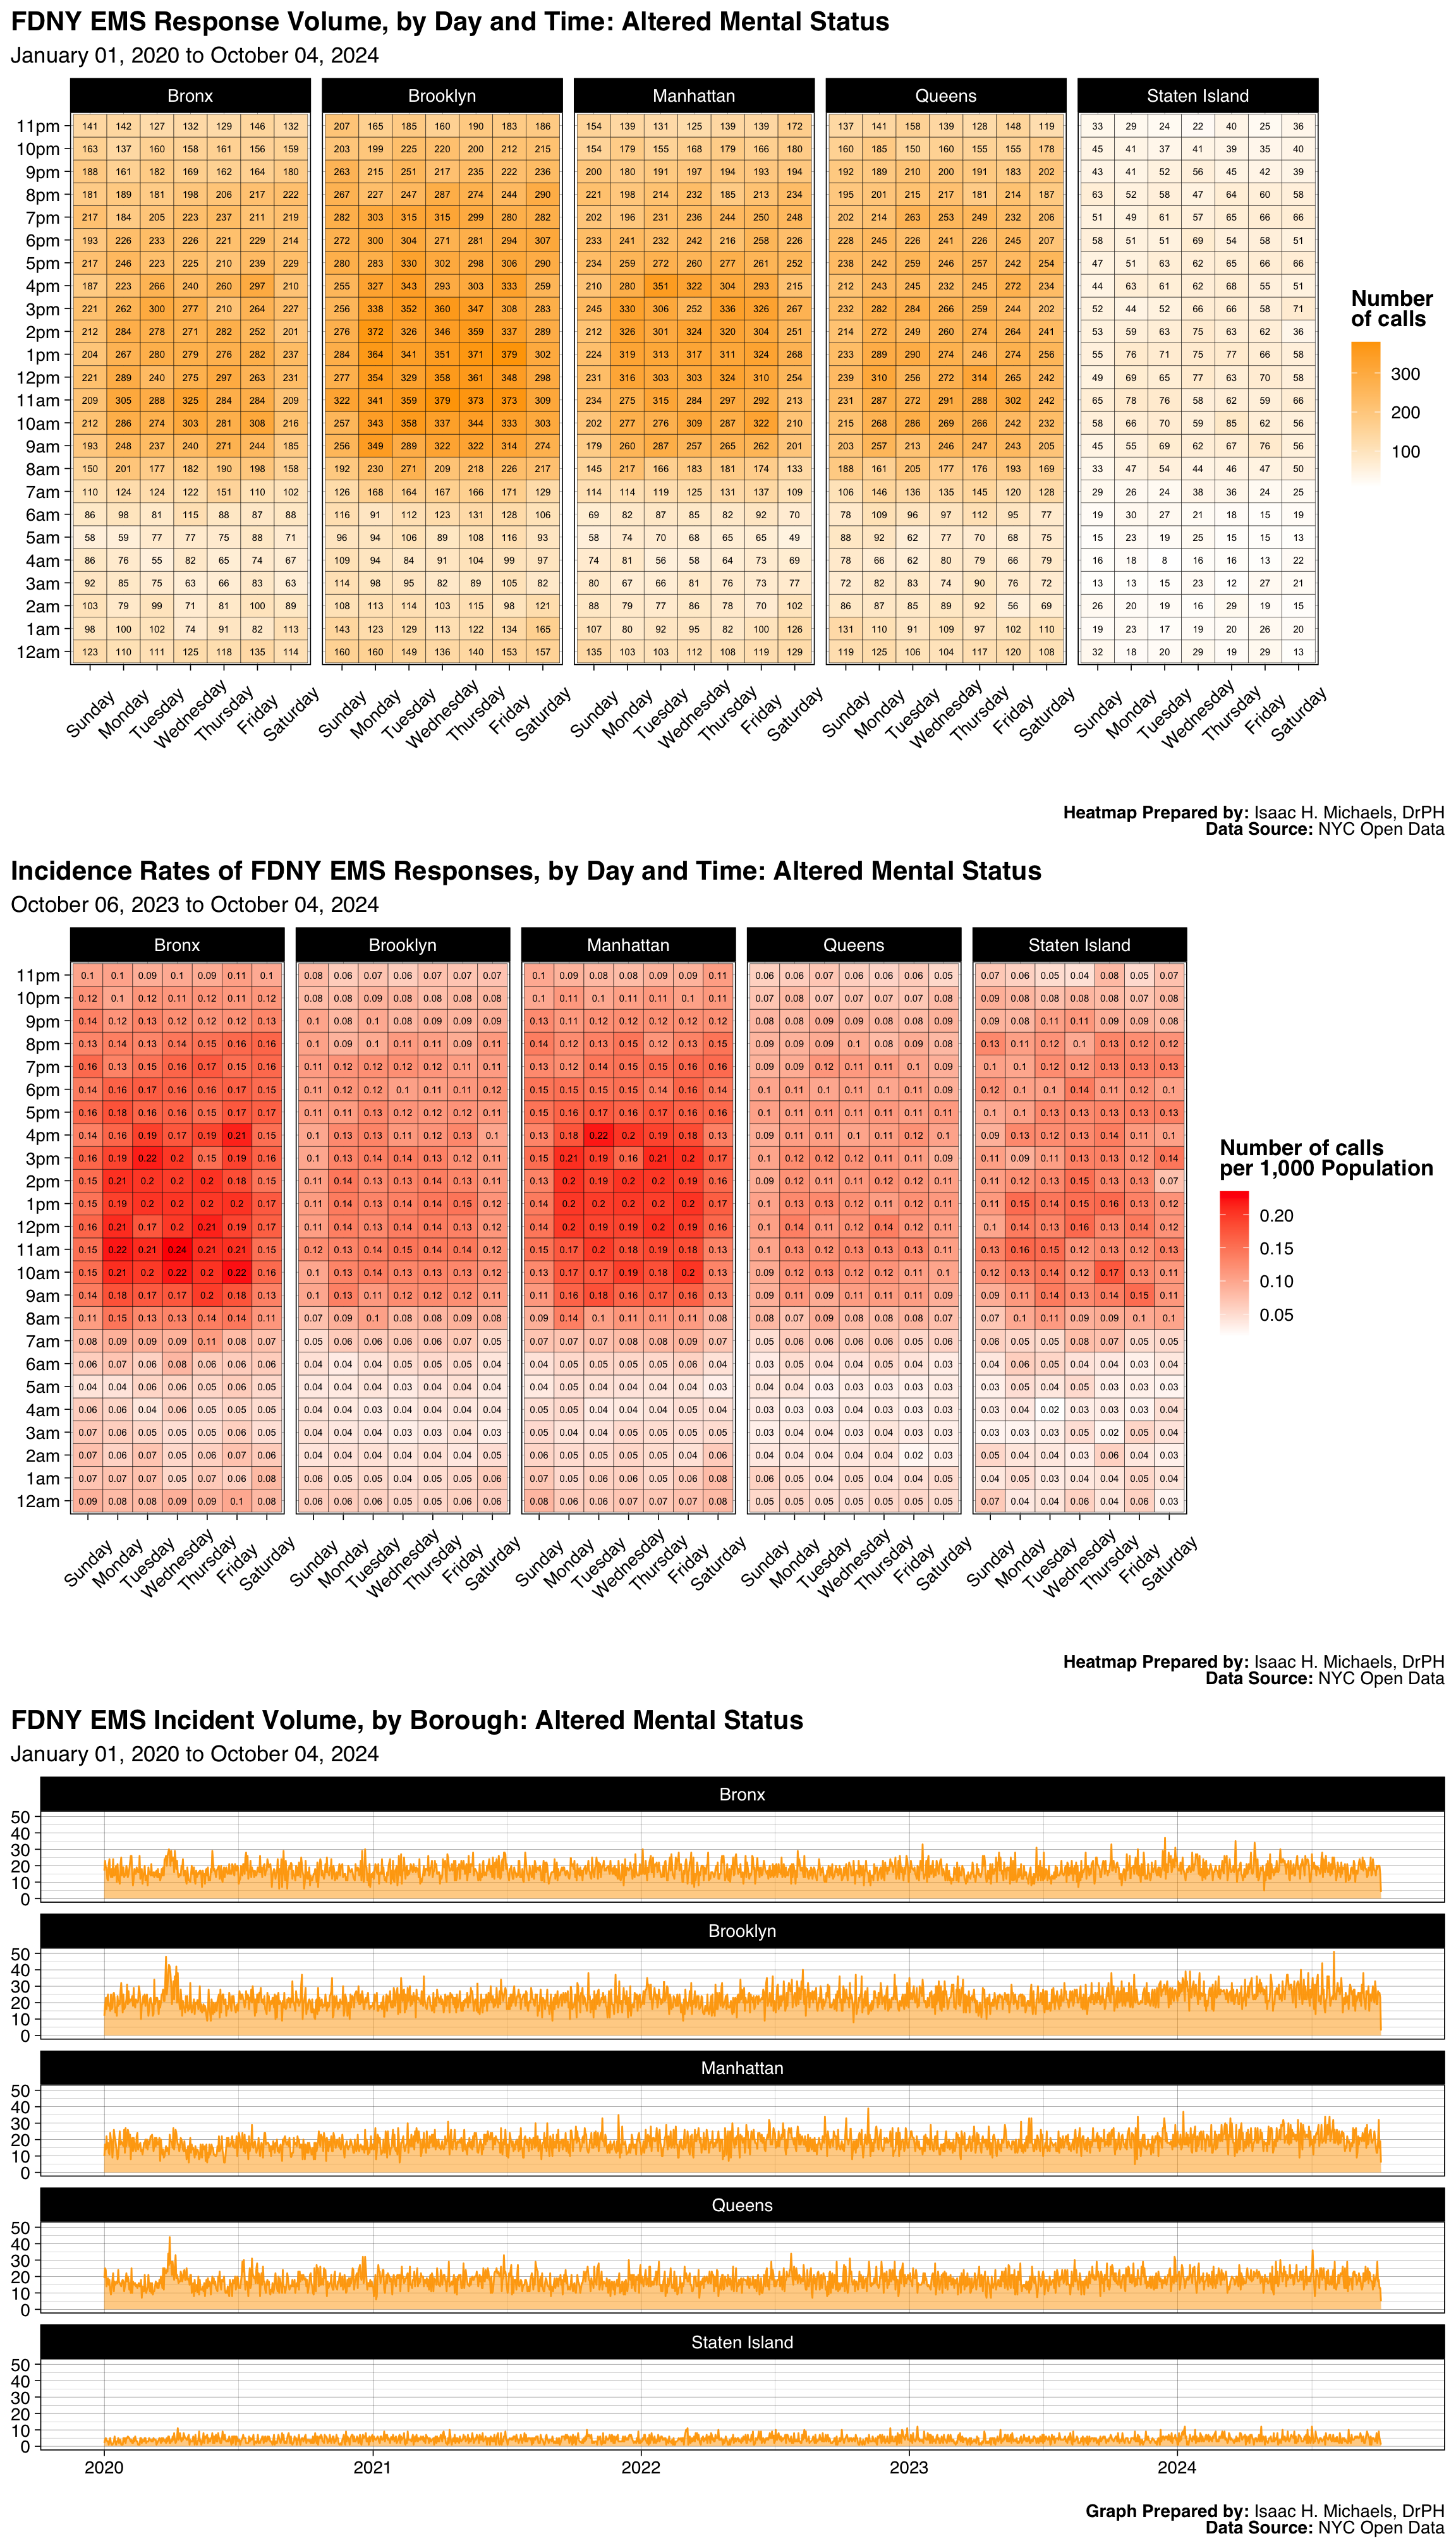
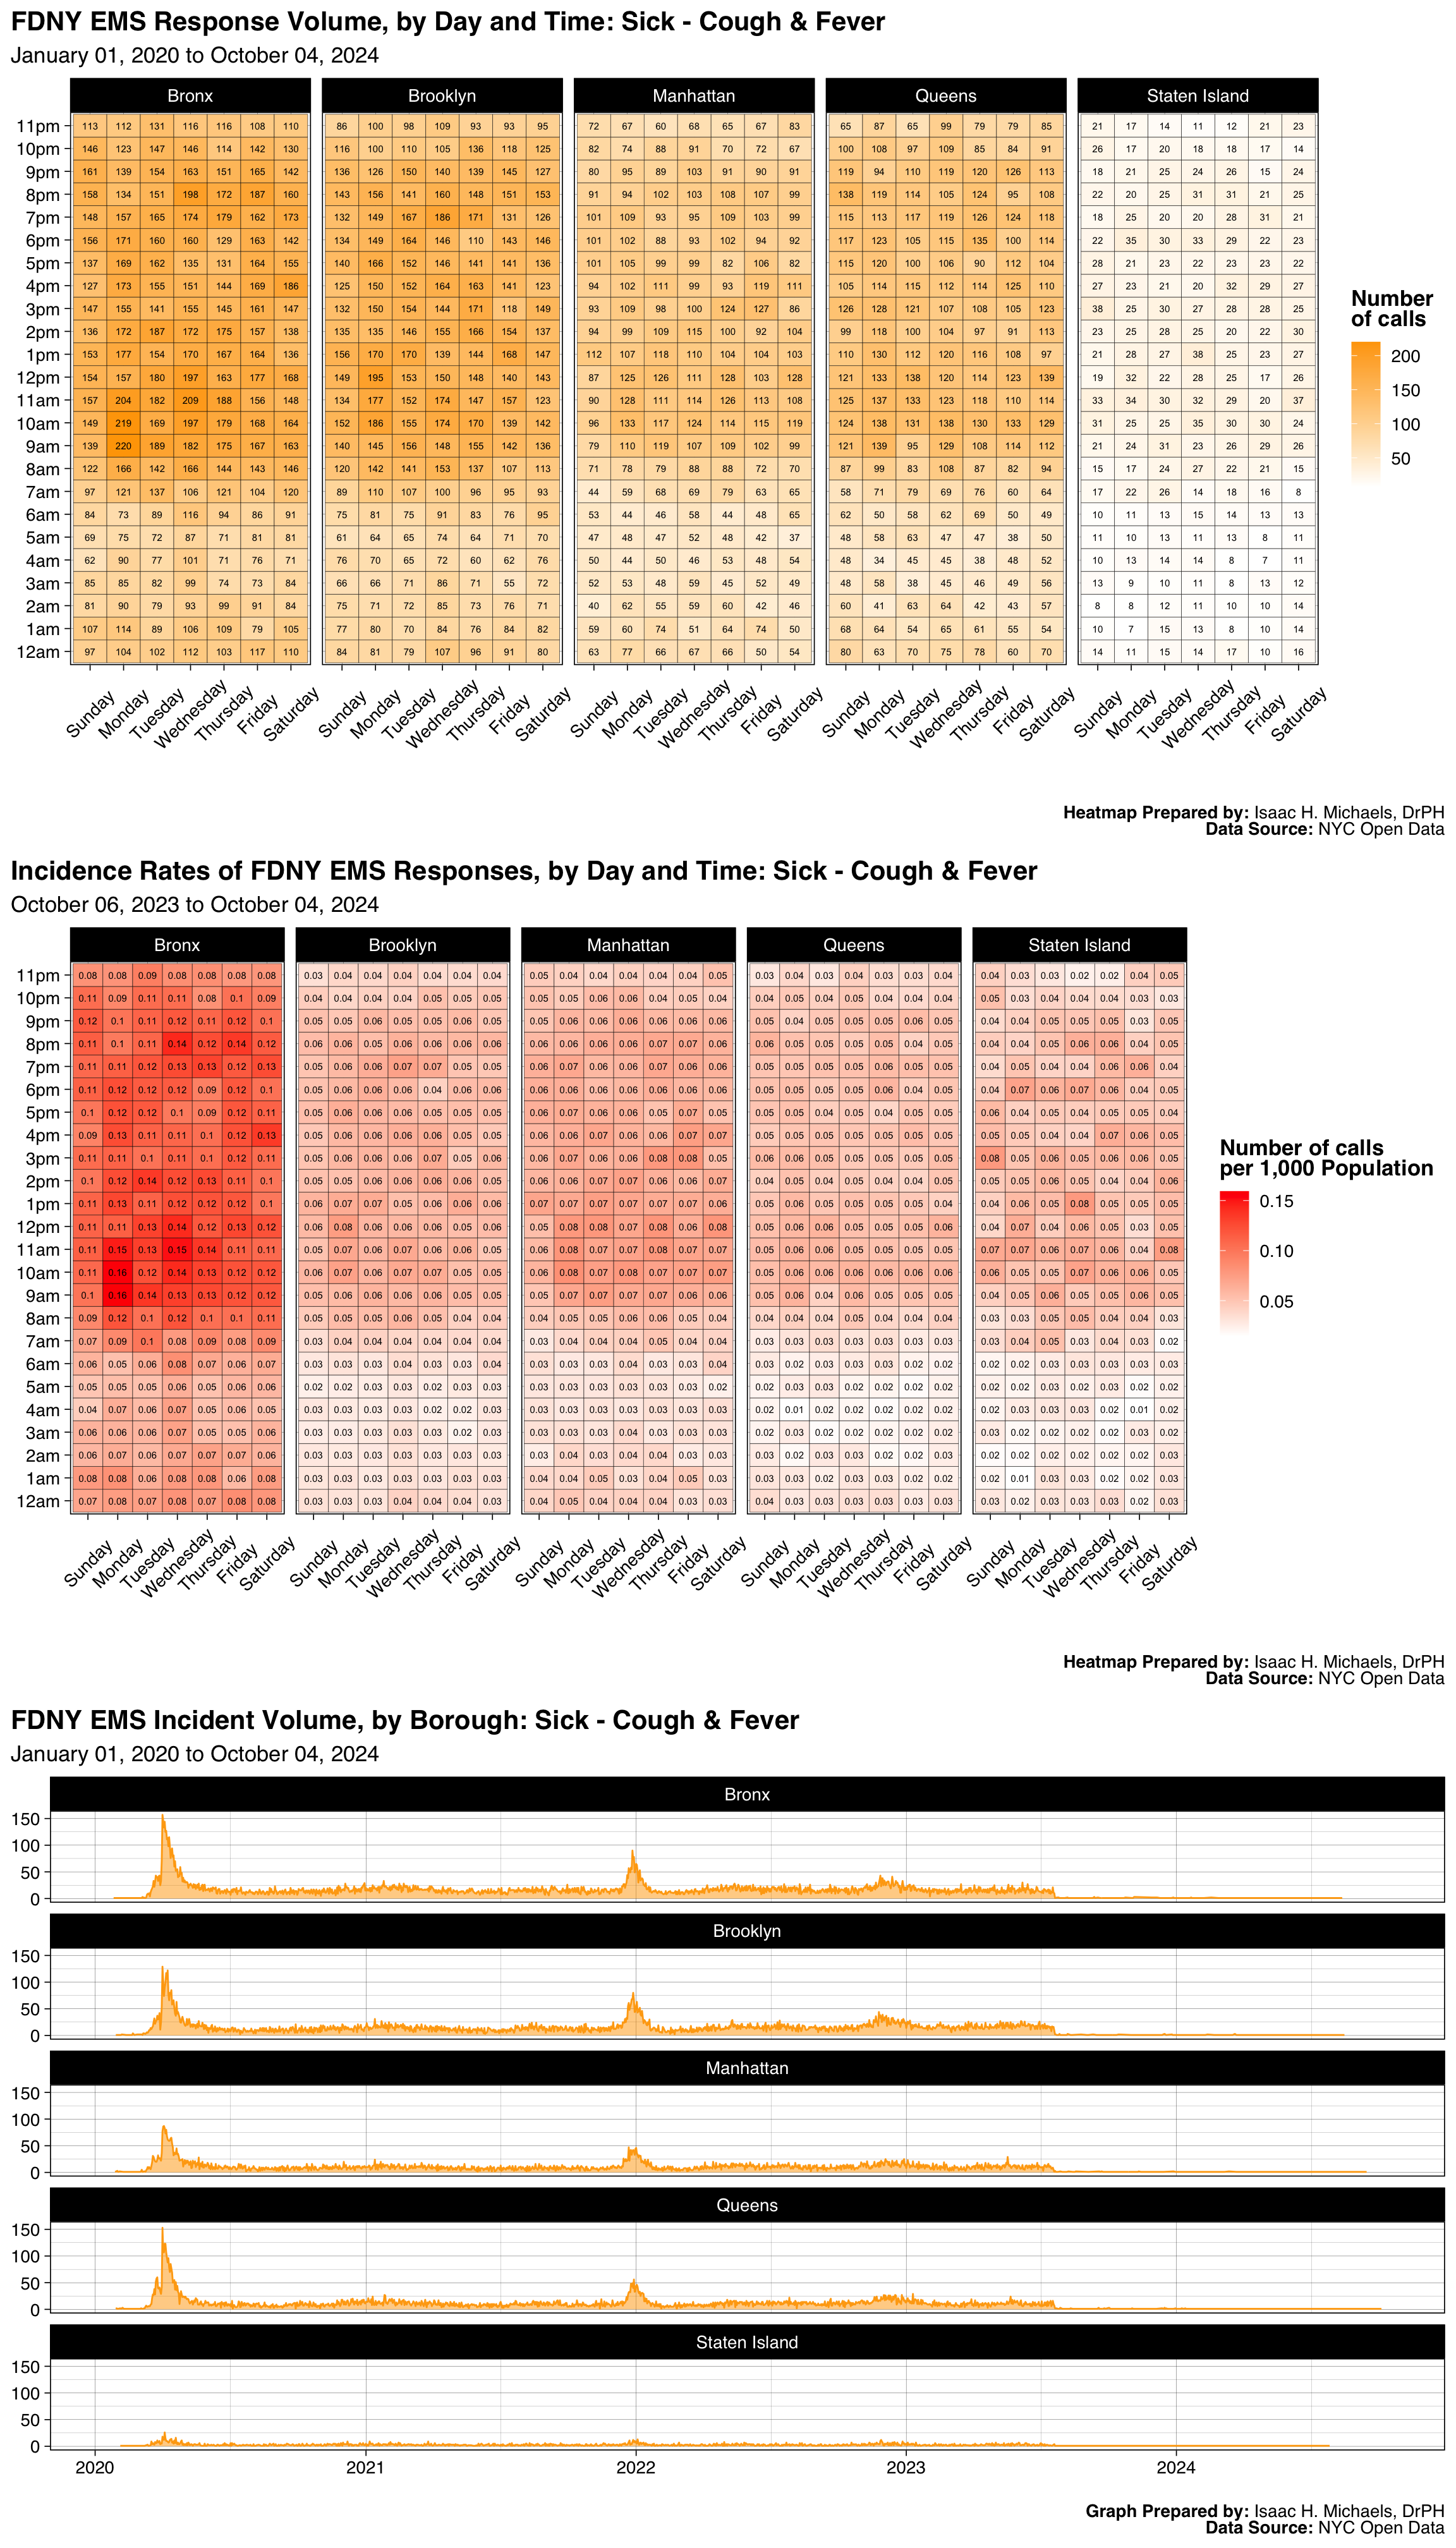
Volume
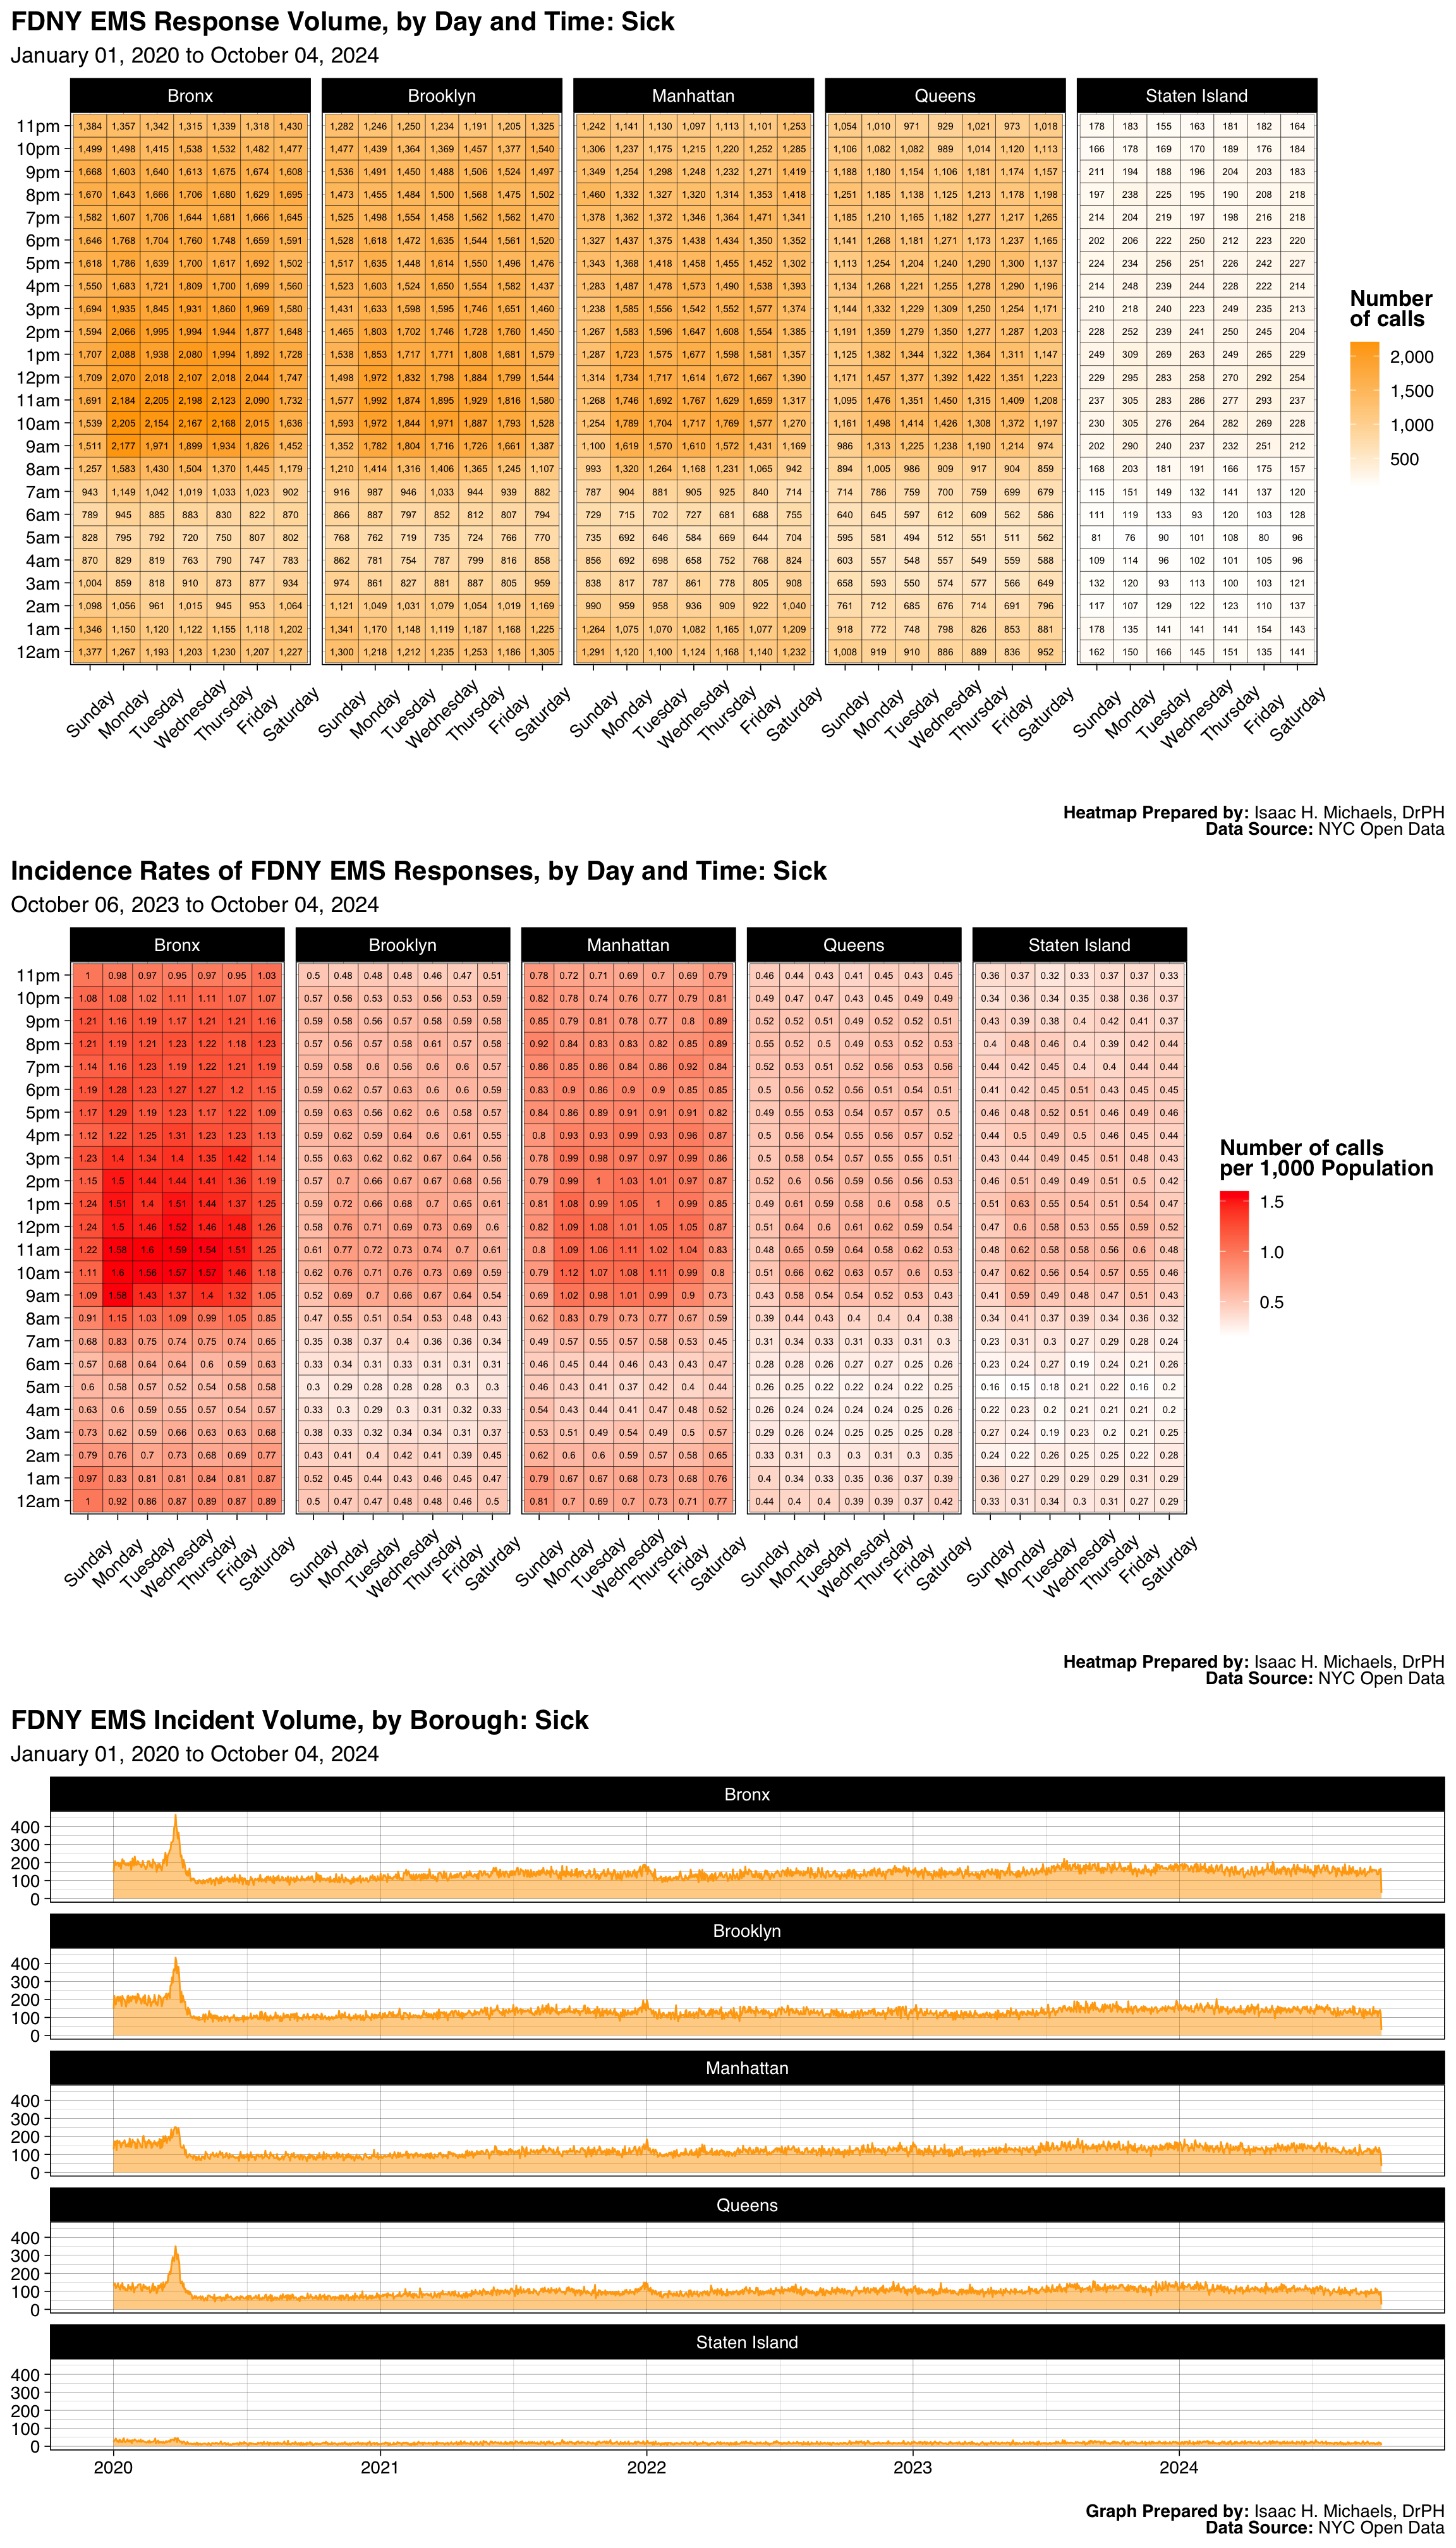
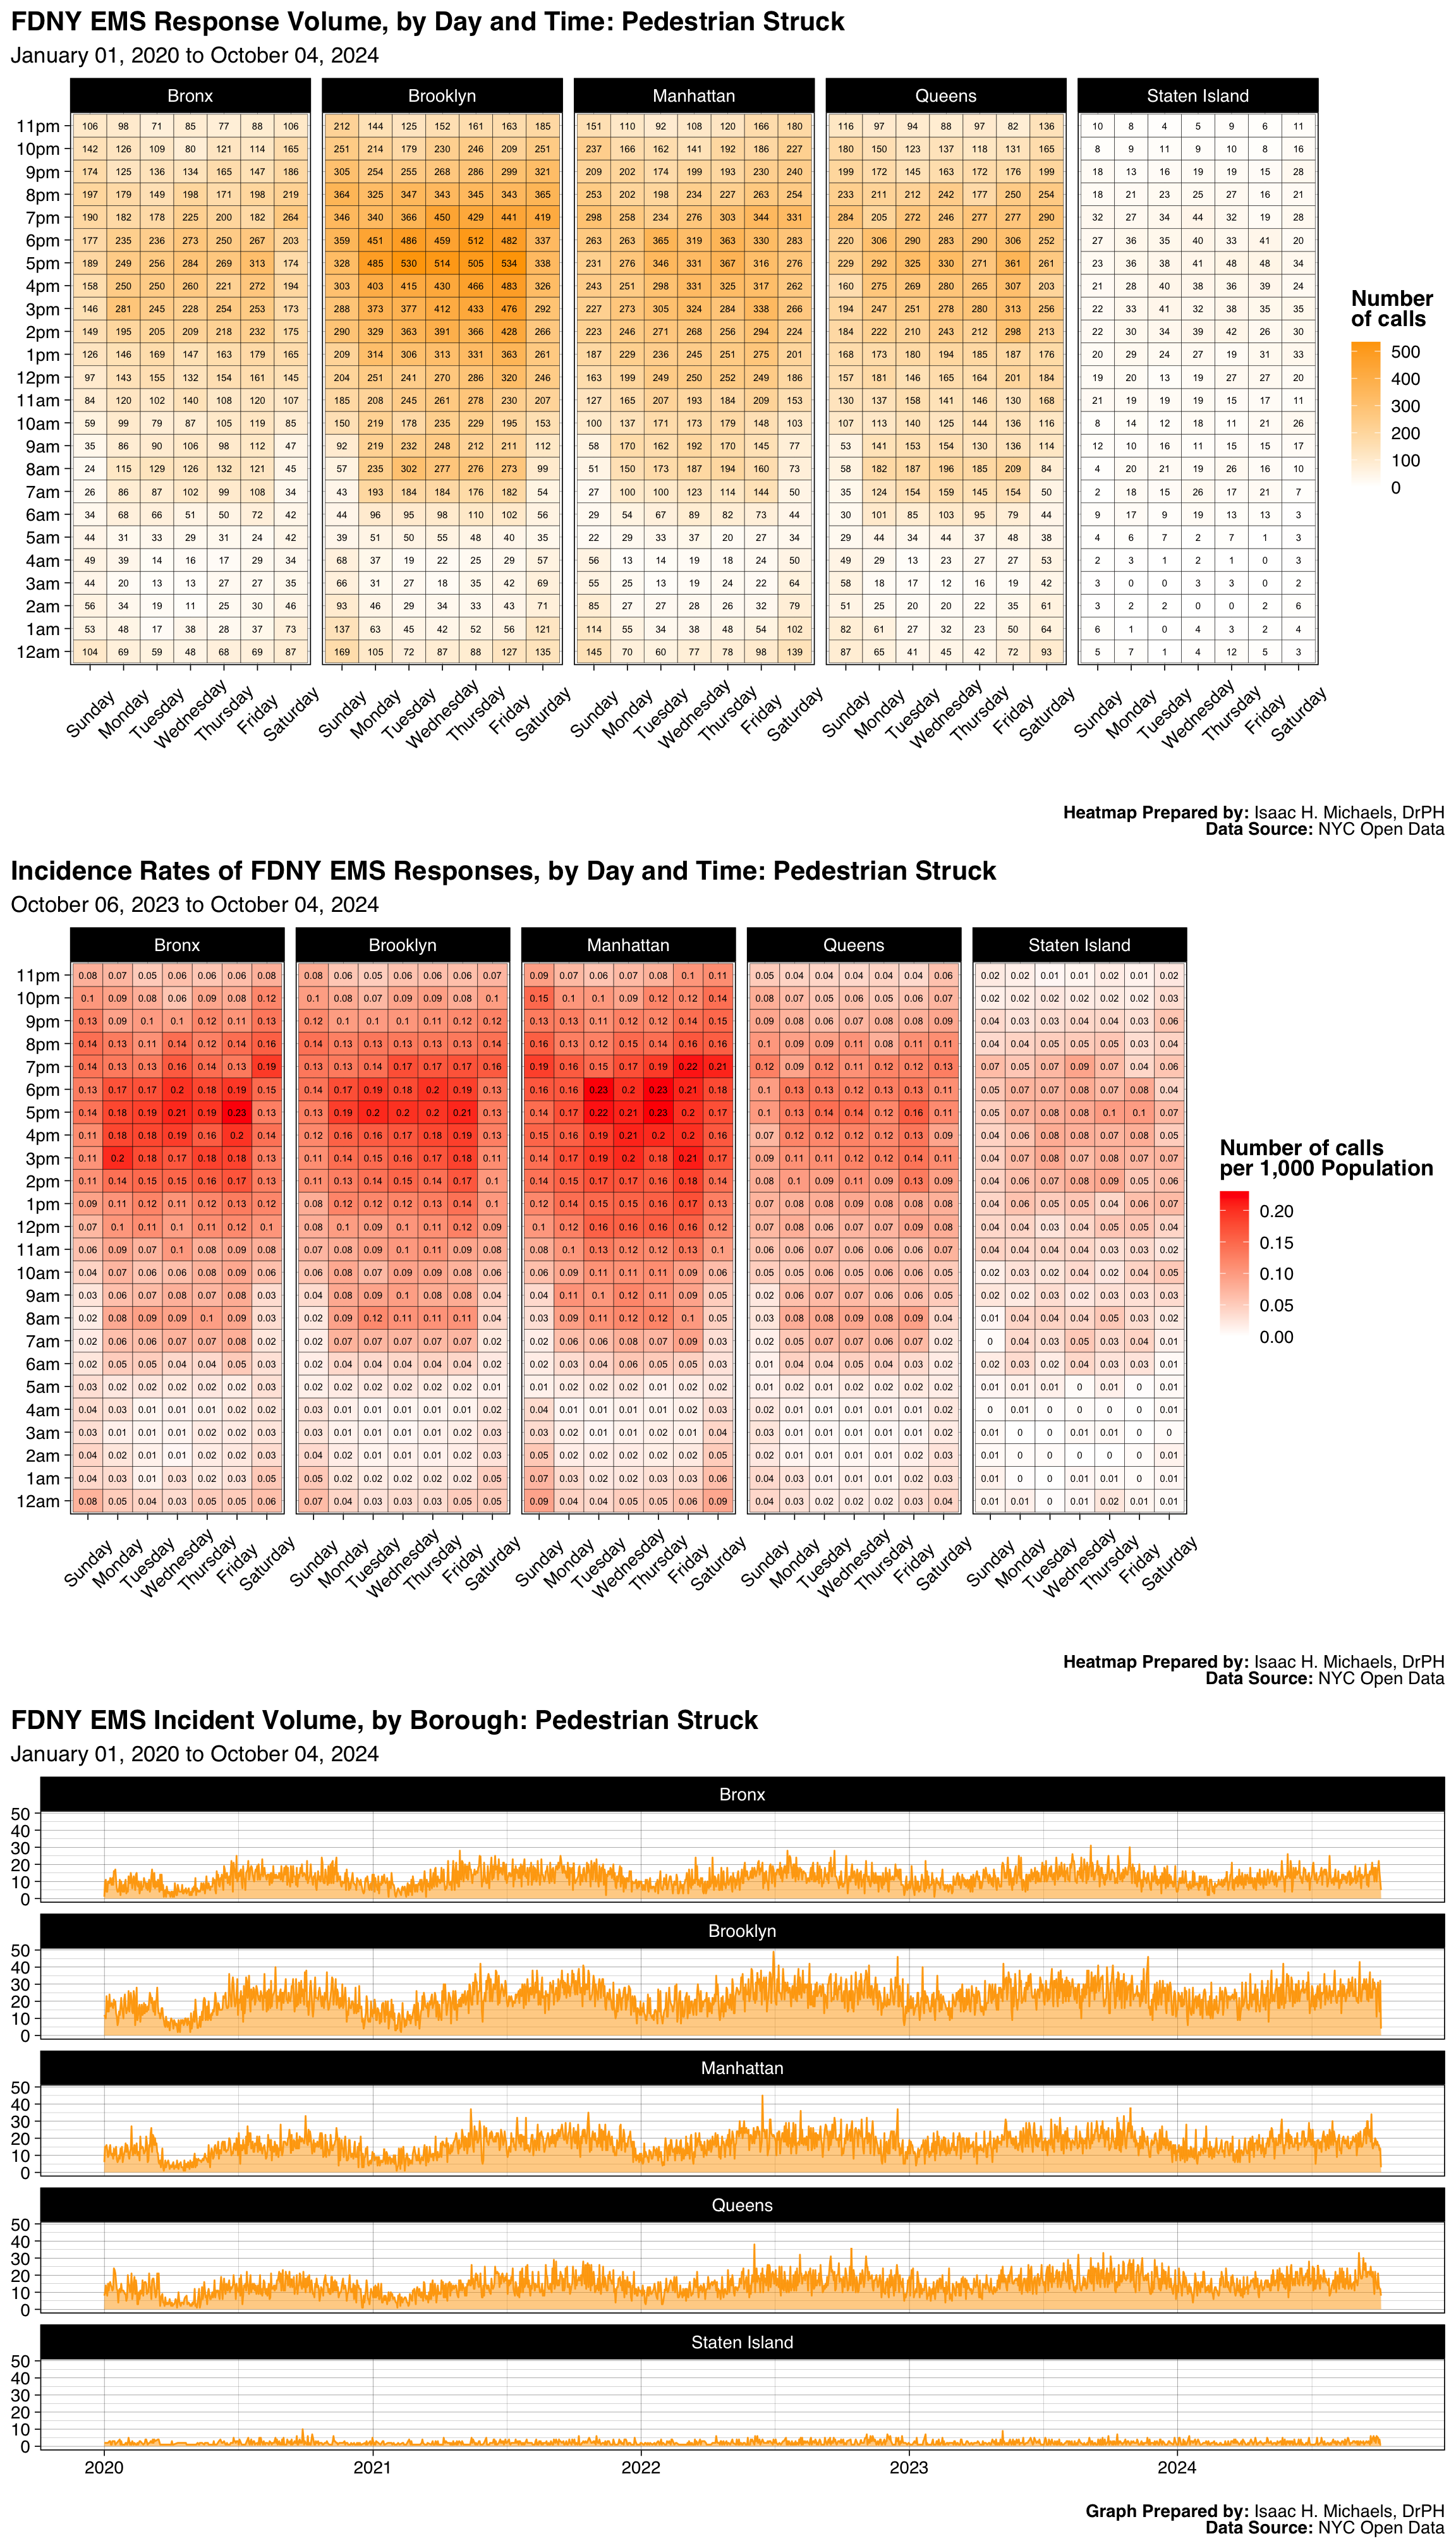
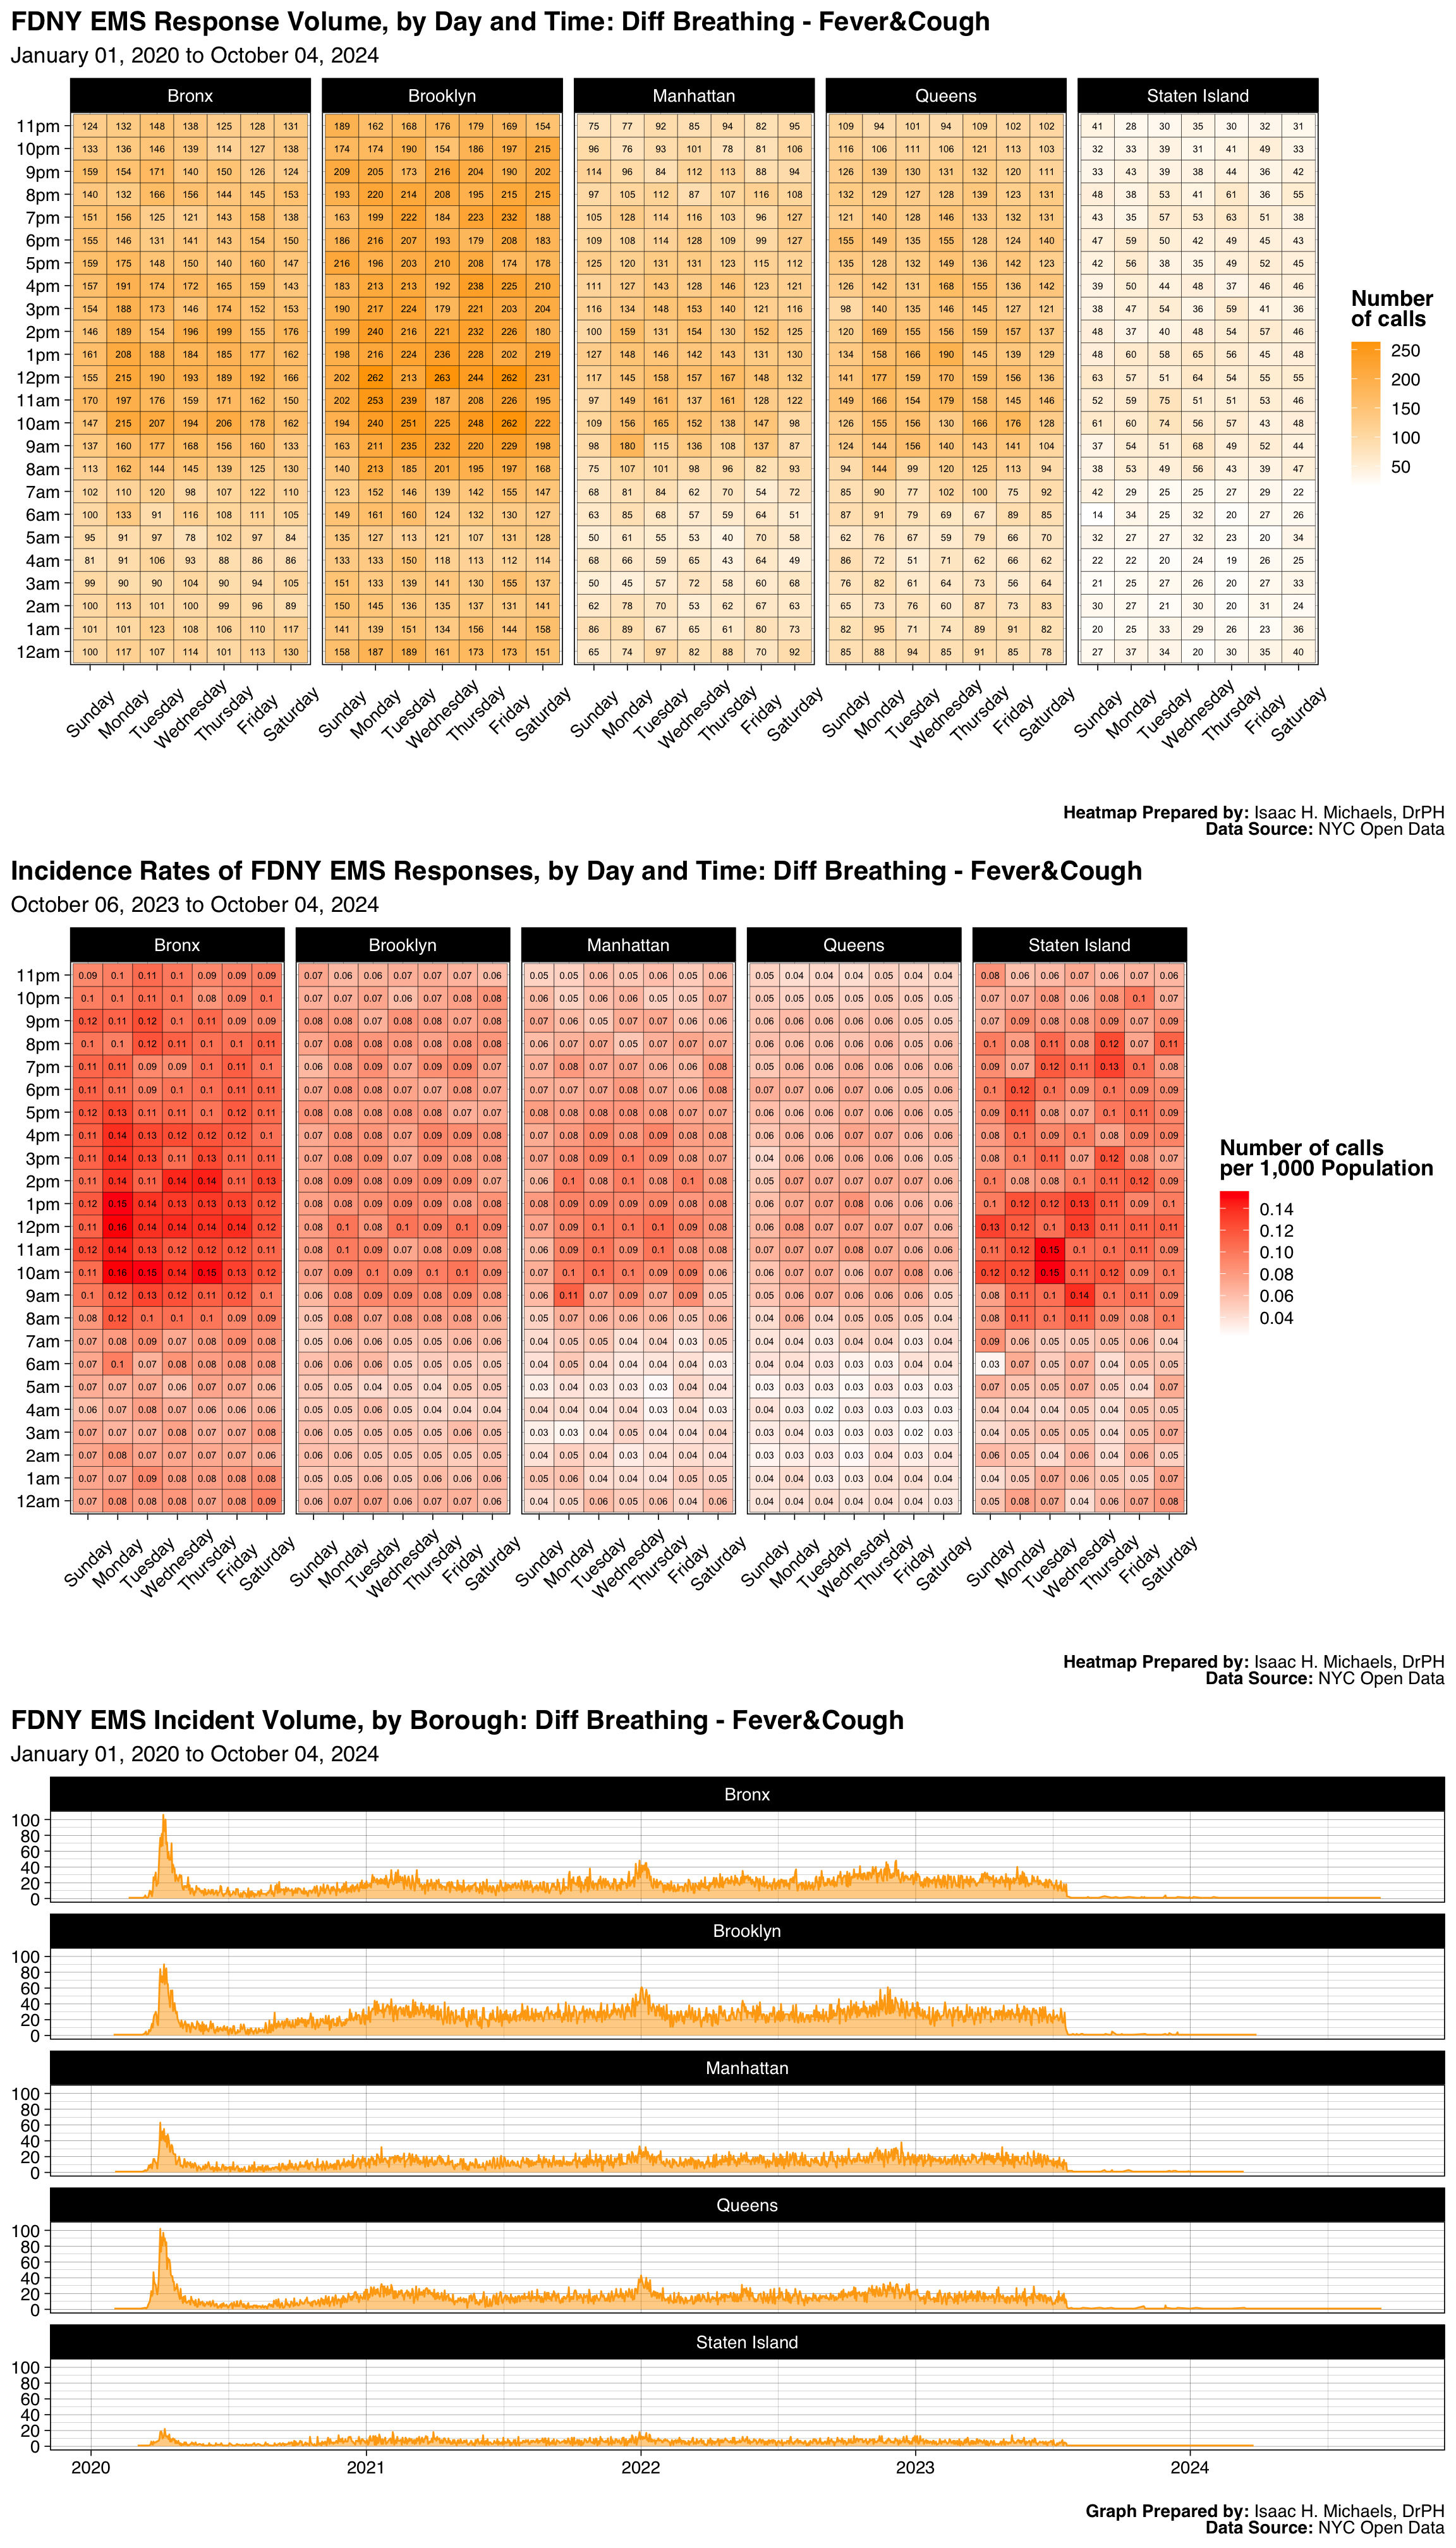
This figure presents a heatmap of FDNY EMS call volume across days of the week and hours of the day, shown separately for each borough. Darker orange tiles represent higher numbers of incidents, while lighter tiles indicate lower activity levels. Numbers within each tile display the exact count of incidents corresponding to that day–hour combination. The visualization highlights clear temporal patterns in EMS demand. Together, these borough-level heatmaps illustrate the rhythms of EMS activity across the city and underscore the importance of time-based resource planning and staffing alignment.
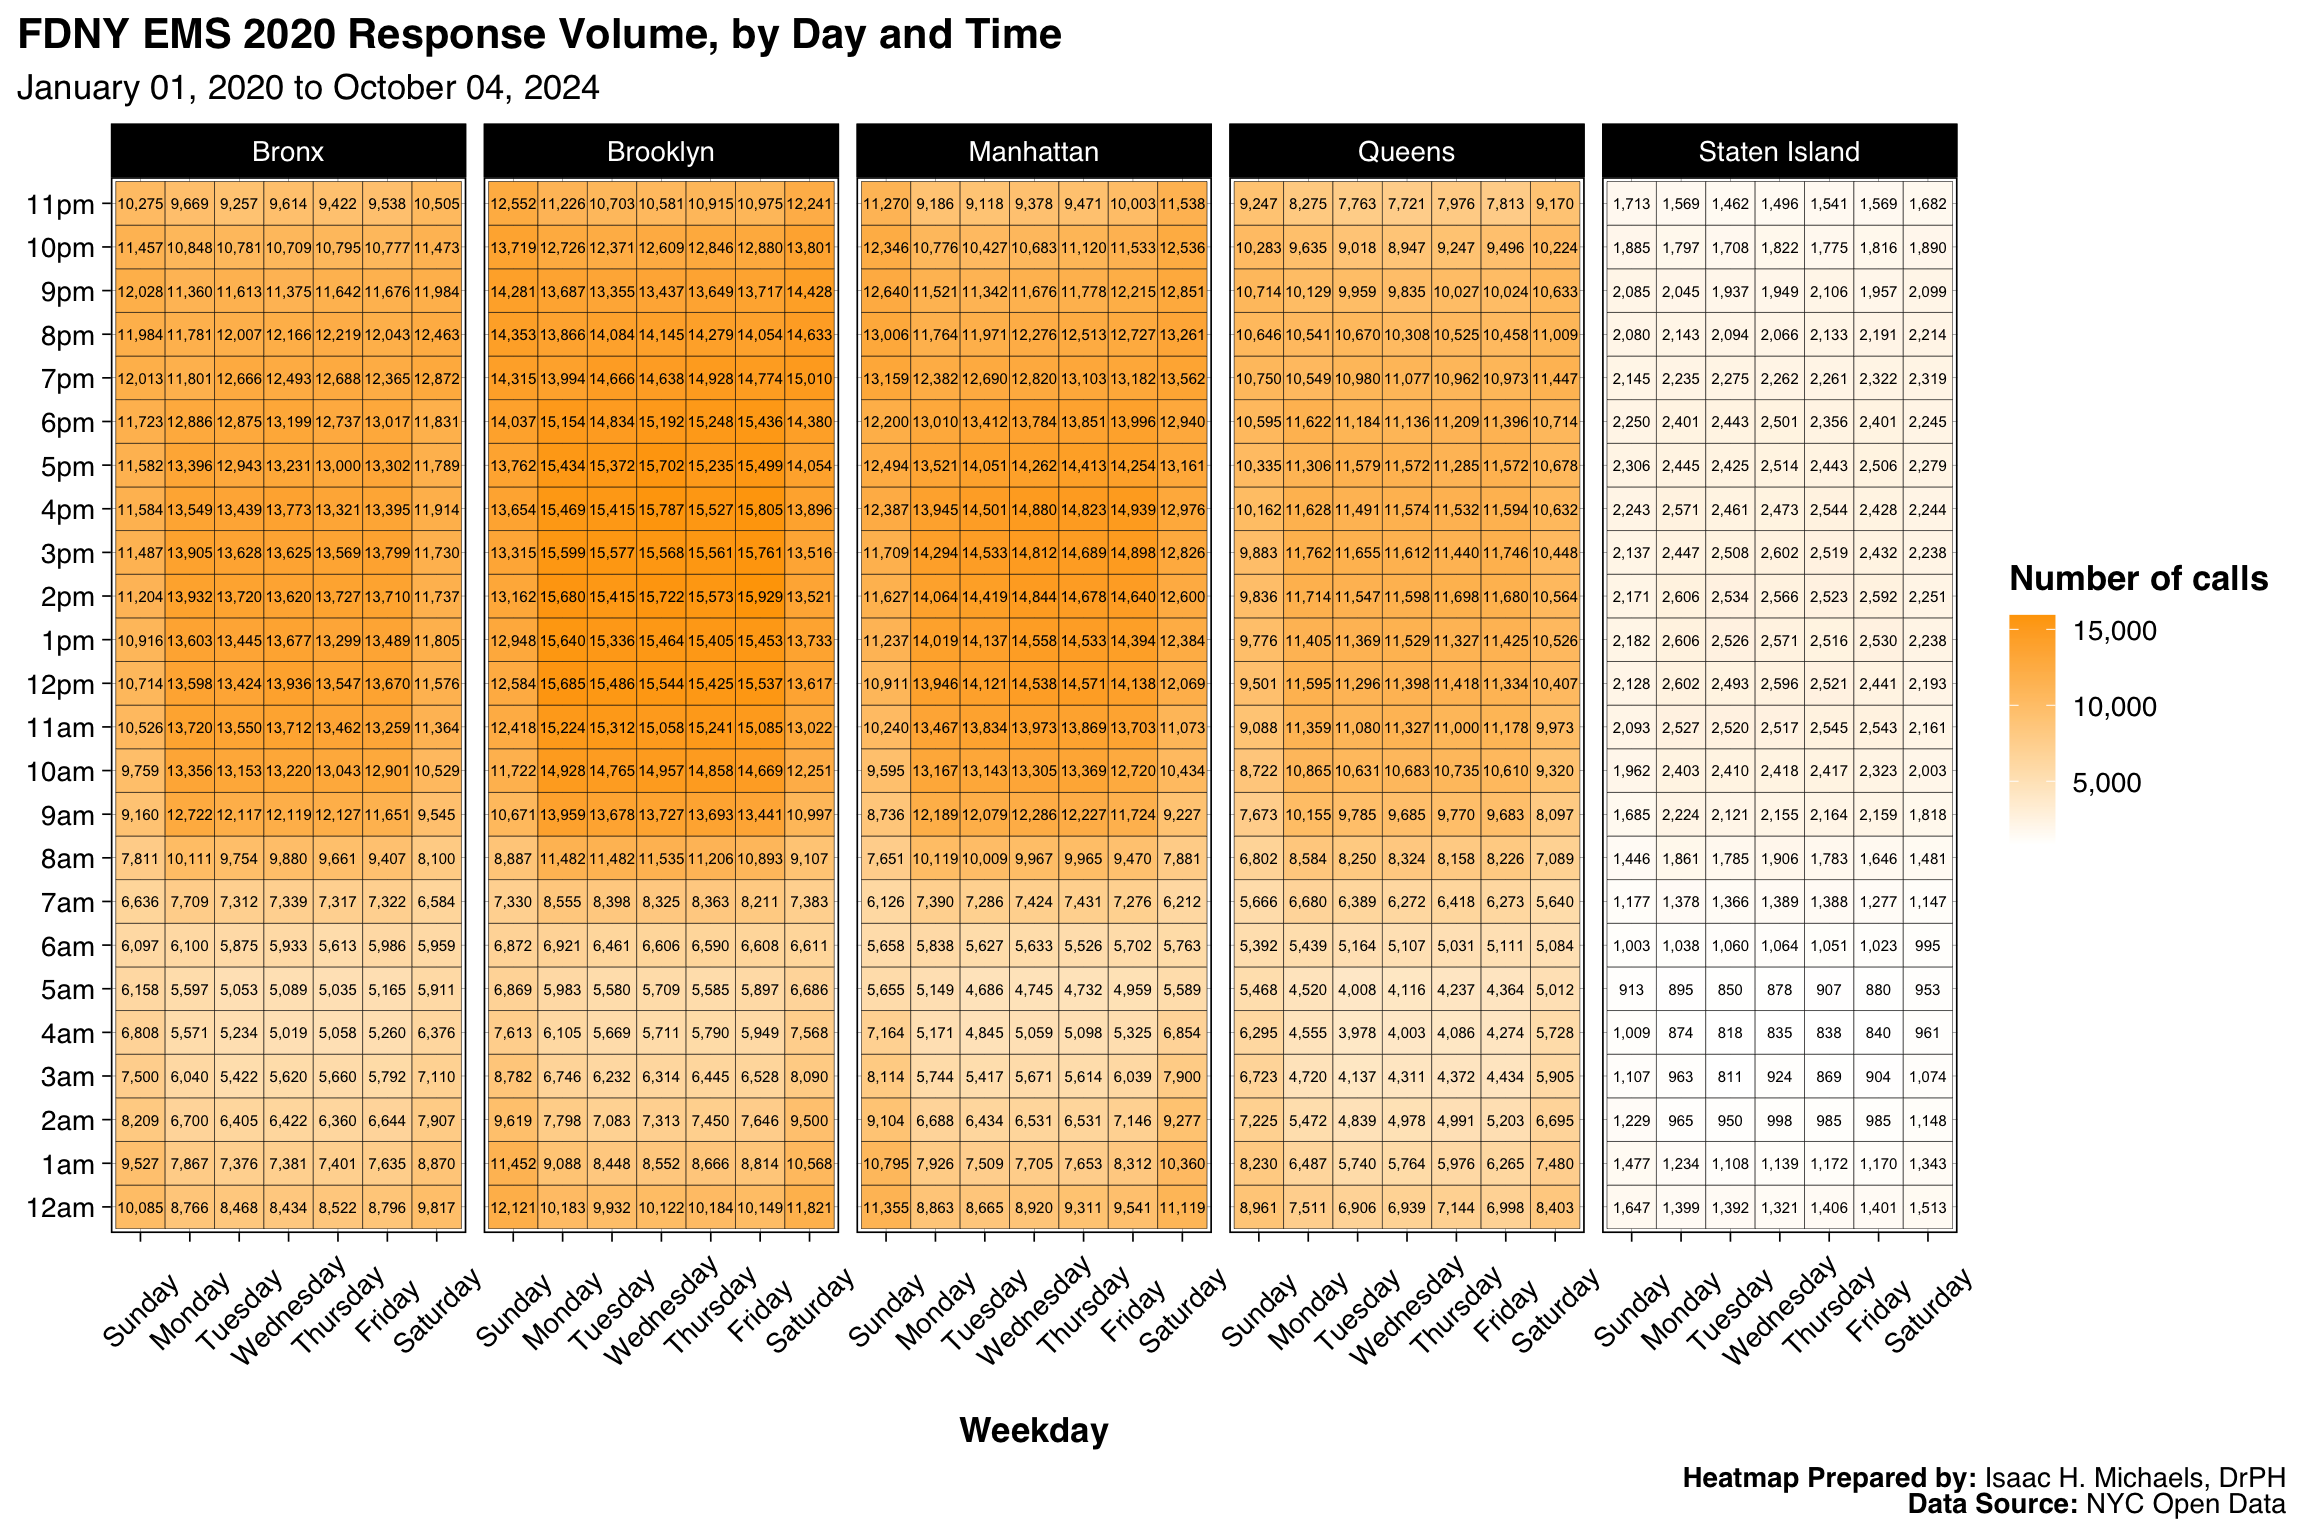 Graph Prepared By: Isaac H. Michaels, DrPH
Data Source: NYC Open Data
Incidence Rates
This figure displays the rate of FDNY EMS responses per 1,000 residents across days of the week and hours of the day, shown separately for each New York City borough. Unlike the previous heatmap, which showed raw call counts, this figure adjusts for population size, allowing for fairer comparisons between boroughs with different population densities.
Each tile’s color corresponds to the EMS call rate, with darker red indicating higher call rates. Text within each tile shows the precise rate rounded to two decimal places. The visualization reveals that even after adjusting for population, certain boroughs experience proportionally higher EMS demand during daytime and evening hours. These patterns can help identify periods of relatively high per-capita service need and support resource allocation decisions that reflect both volume and population context.
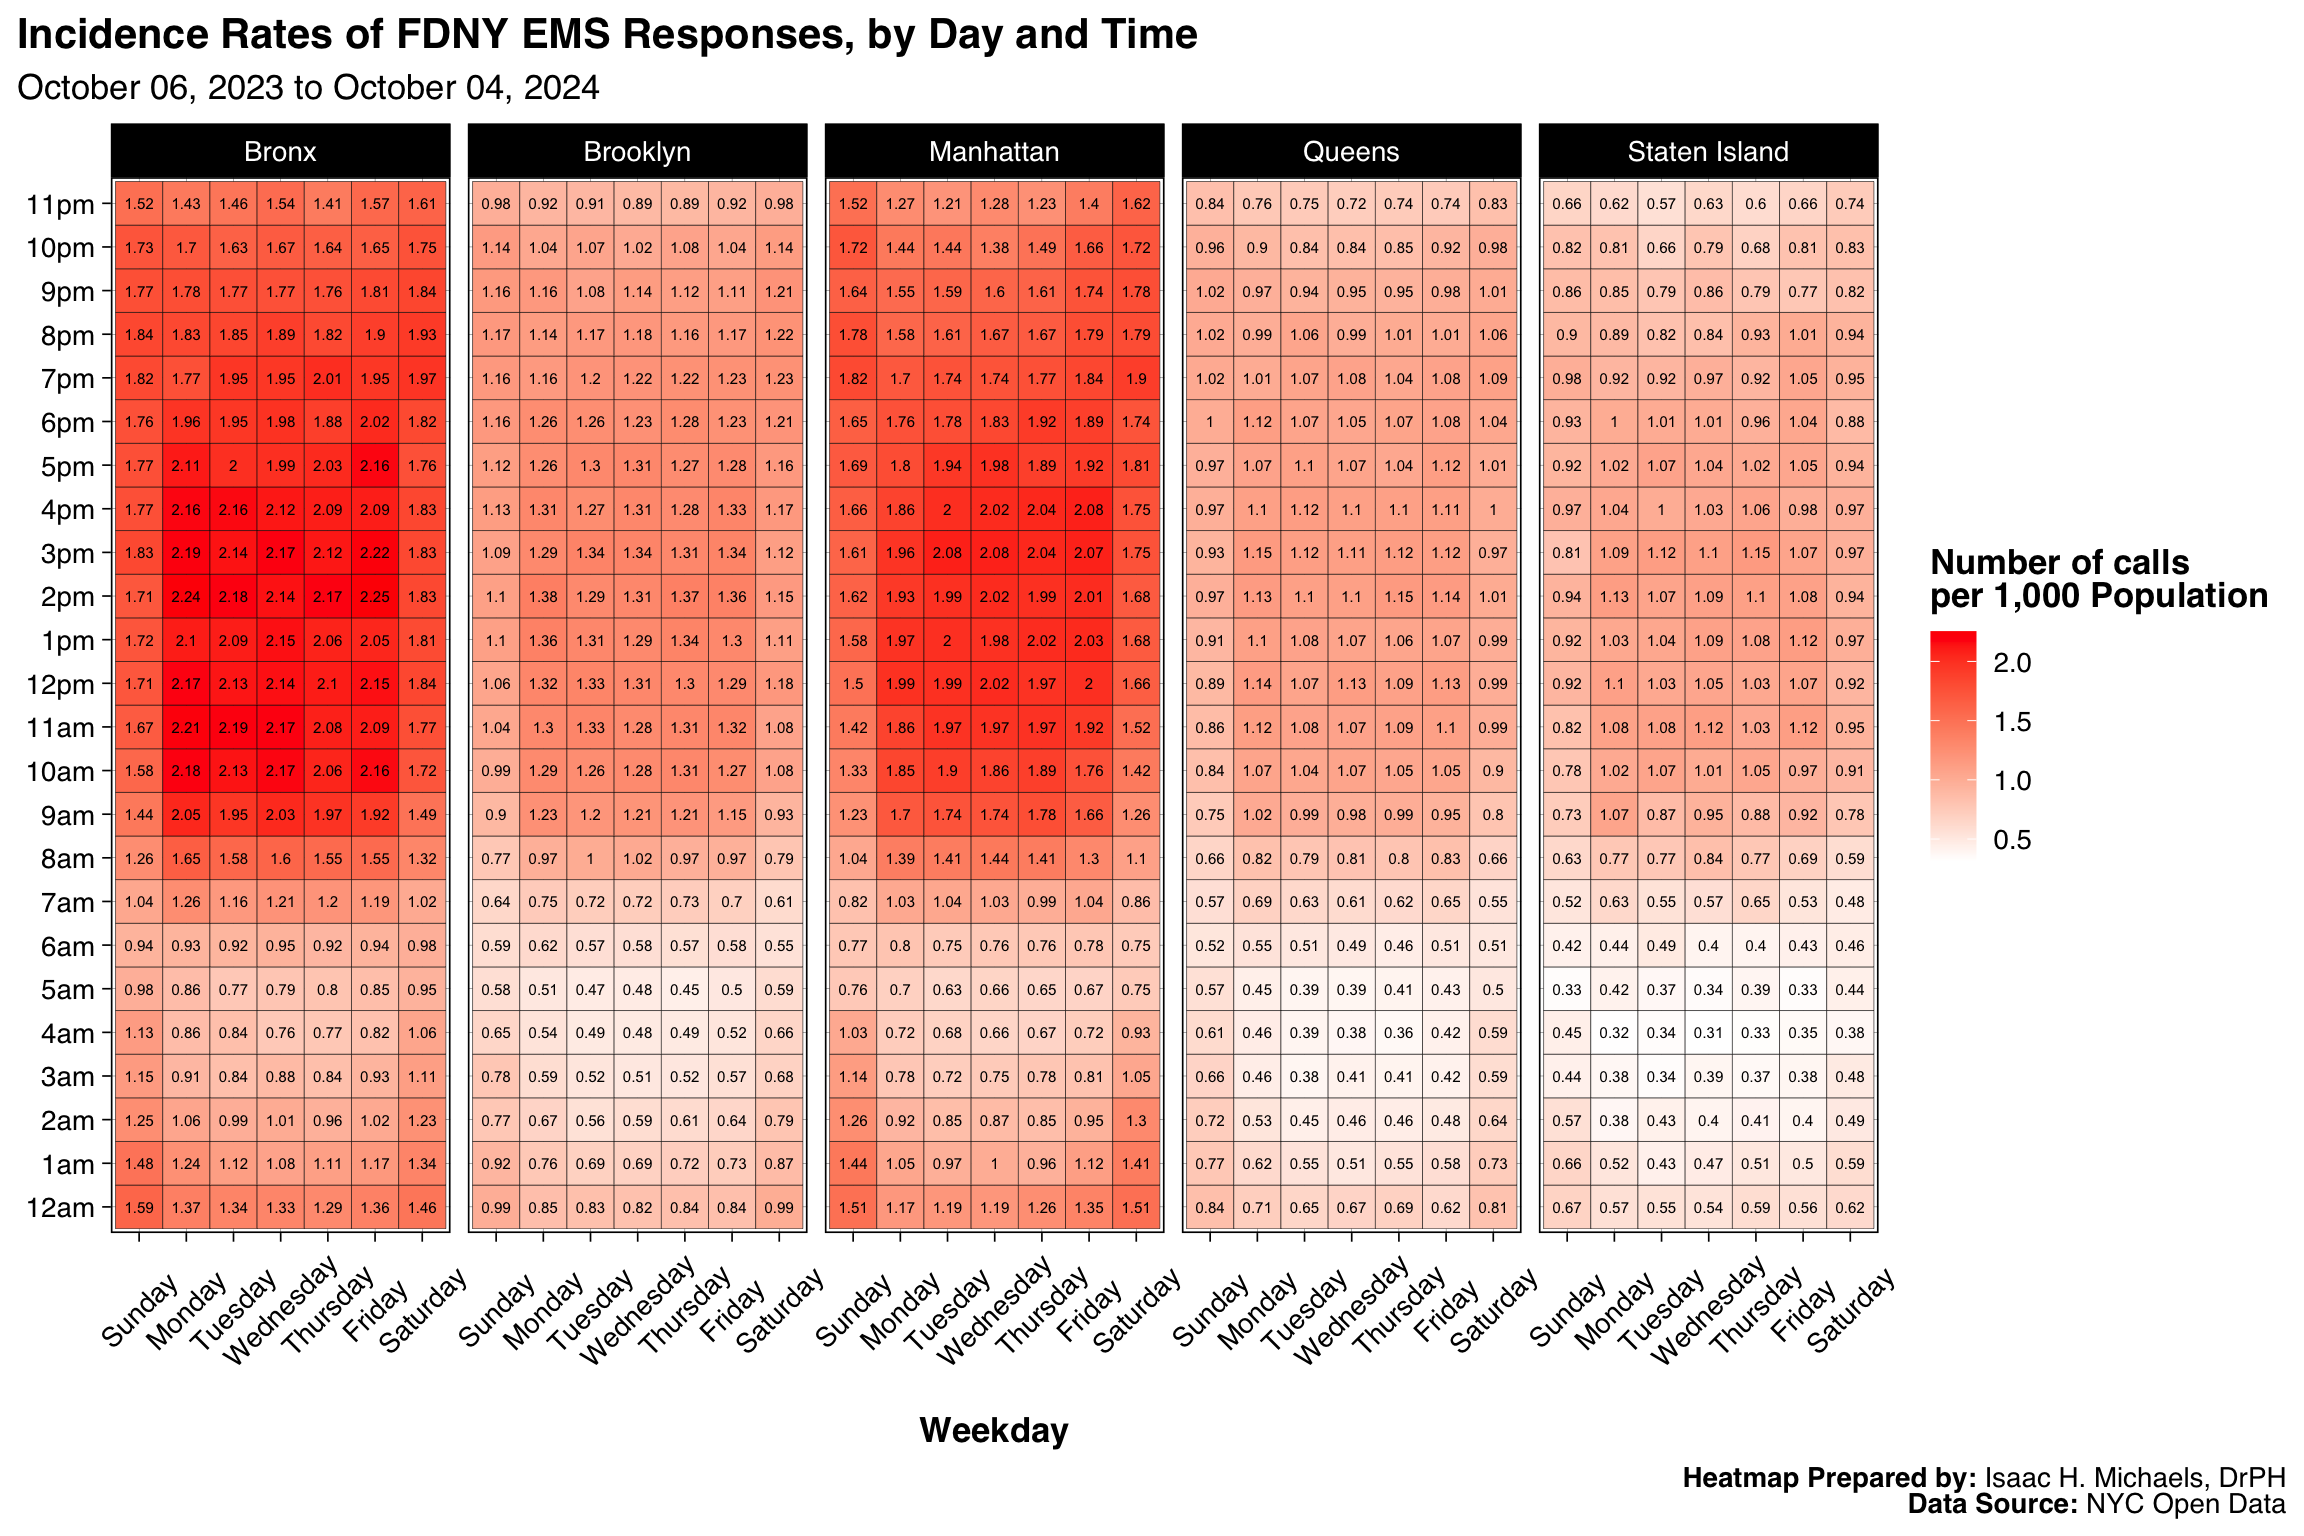 Graph Prepared By: Isaac H. Michaels, DrPH
Data Source: NYC Open Data
Population Data Source: Health Data NY
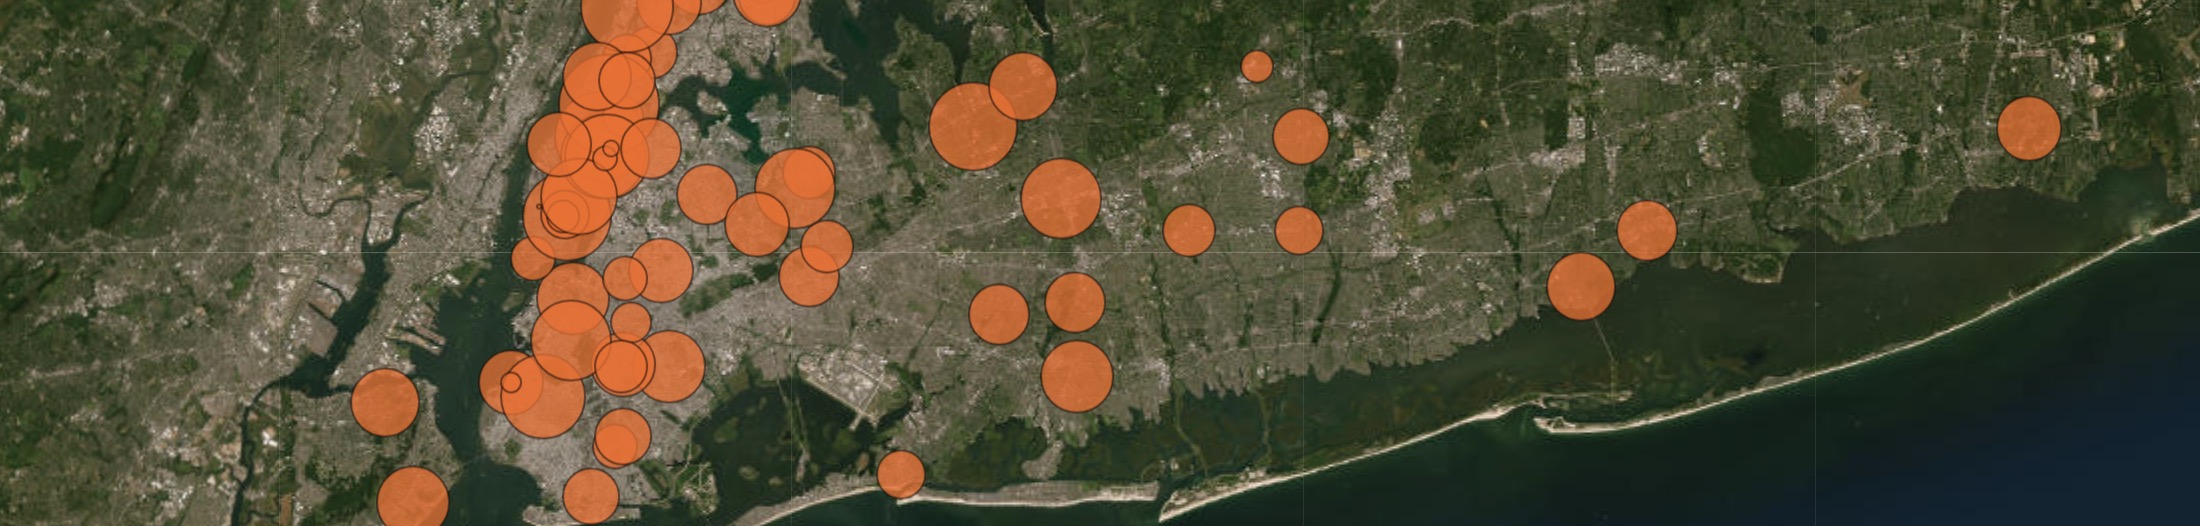
Spatial Distribution
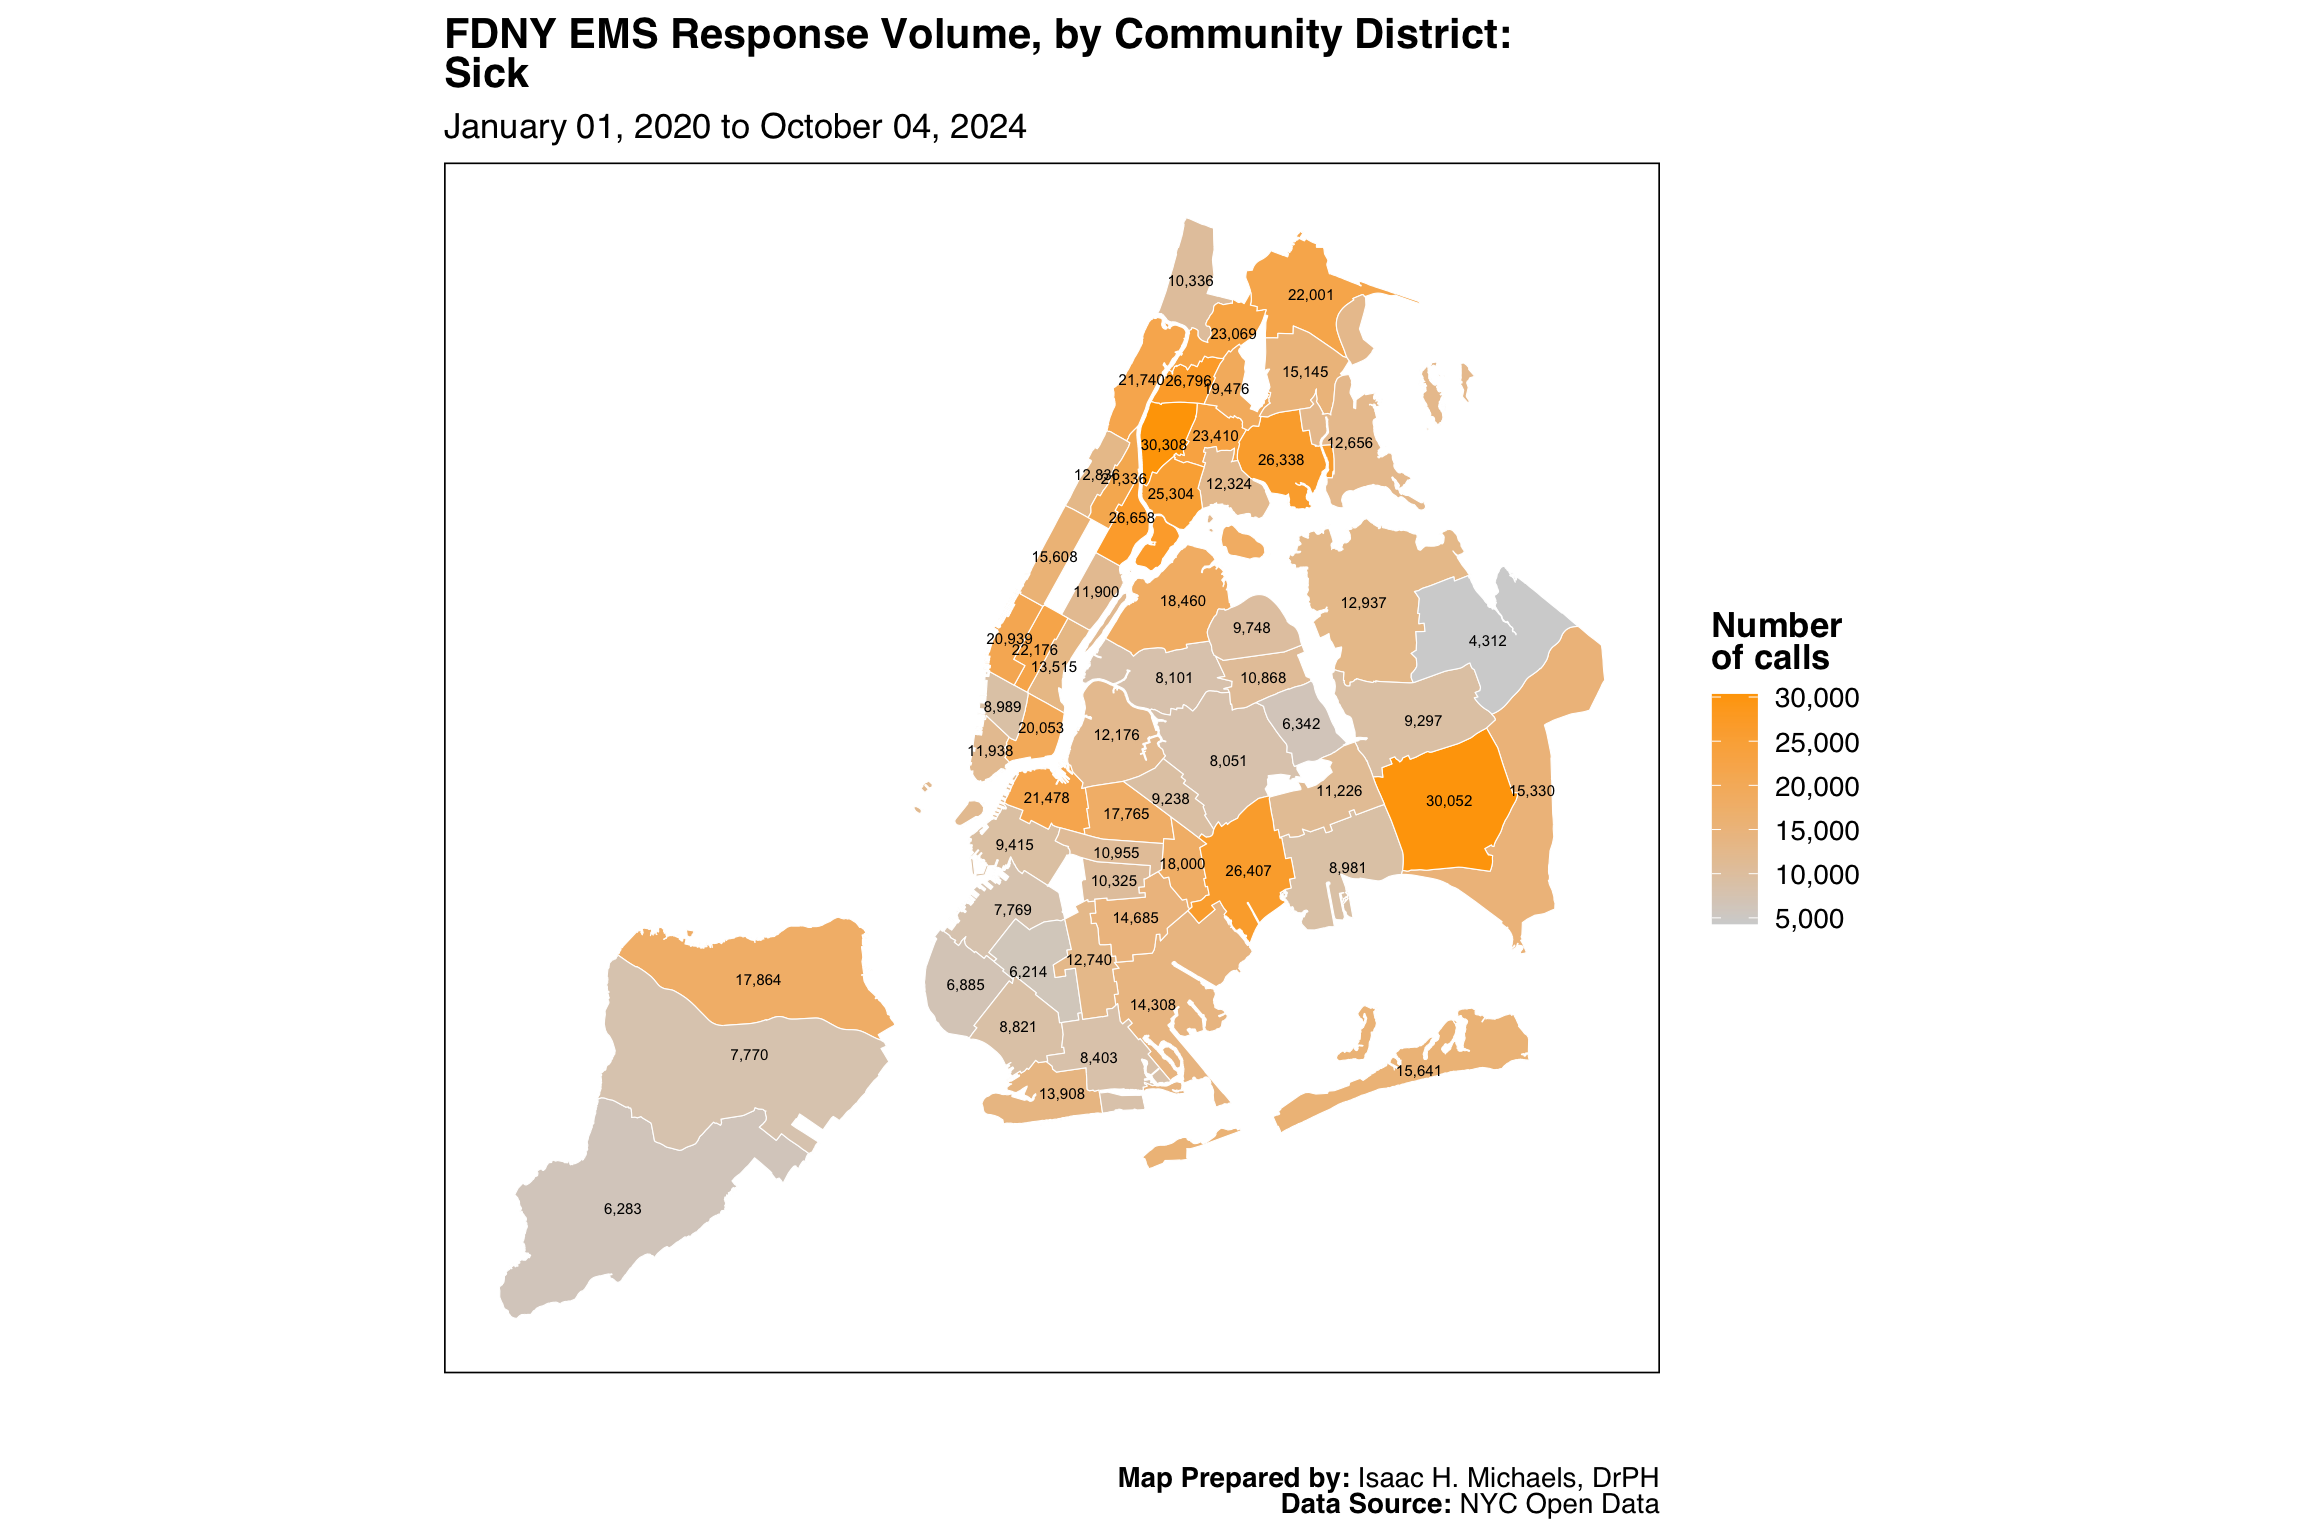
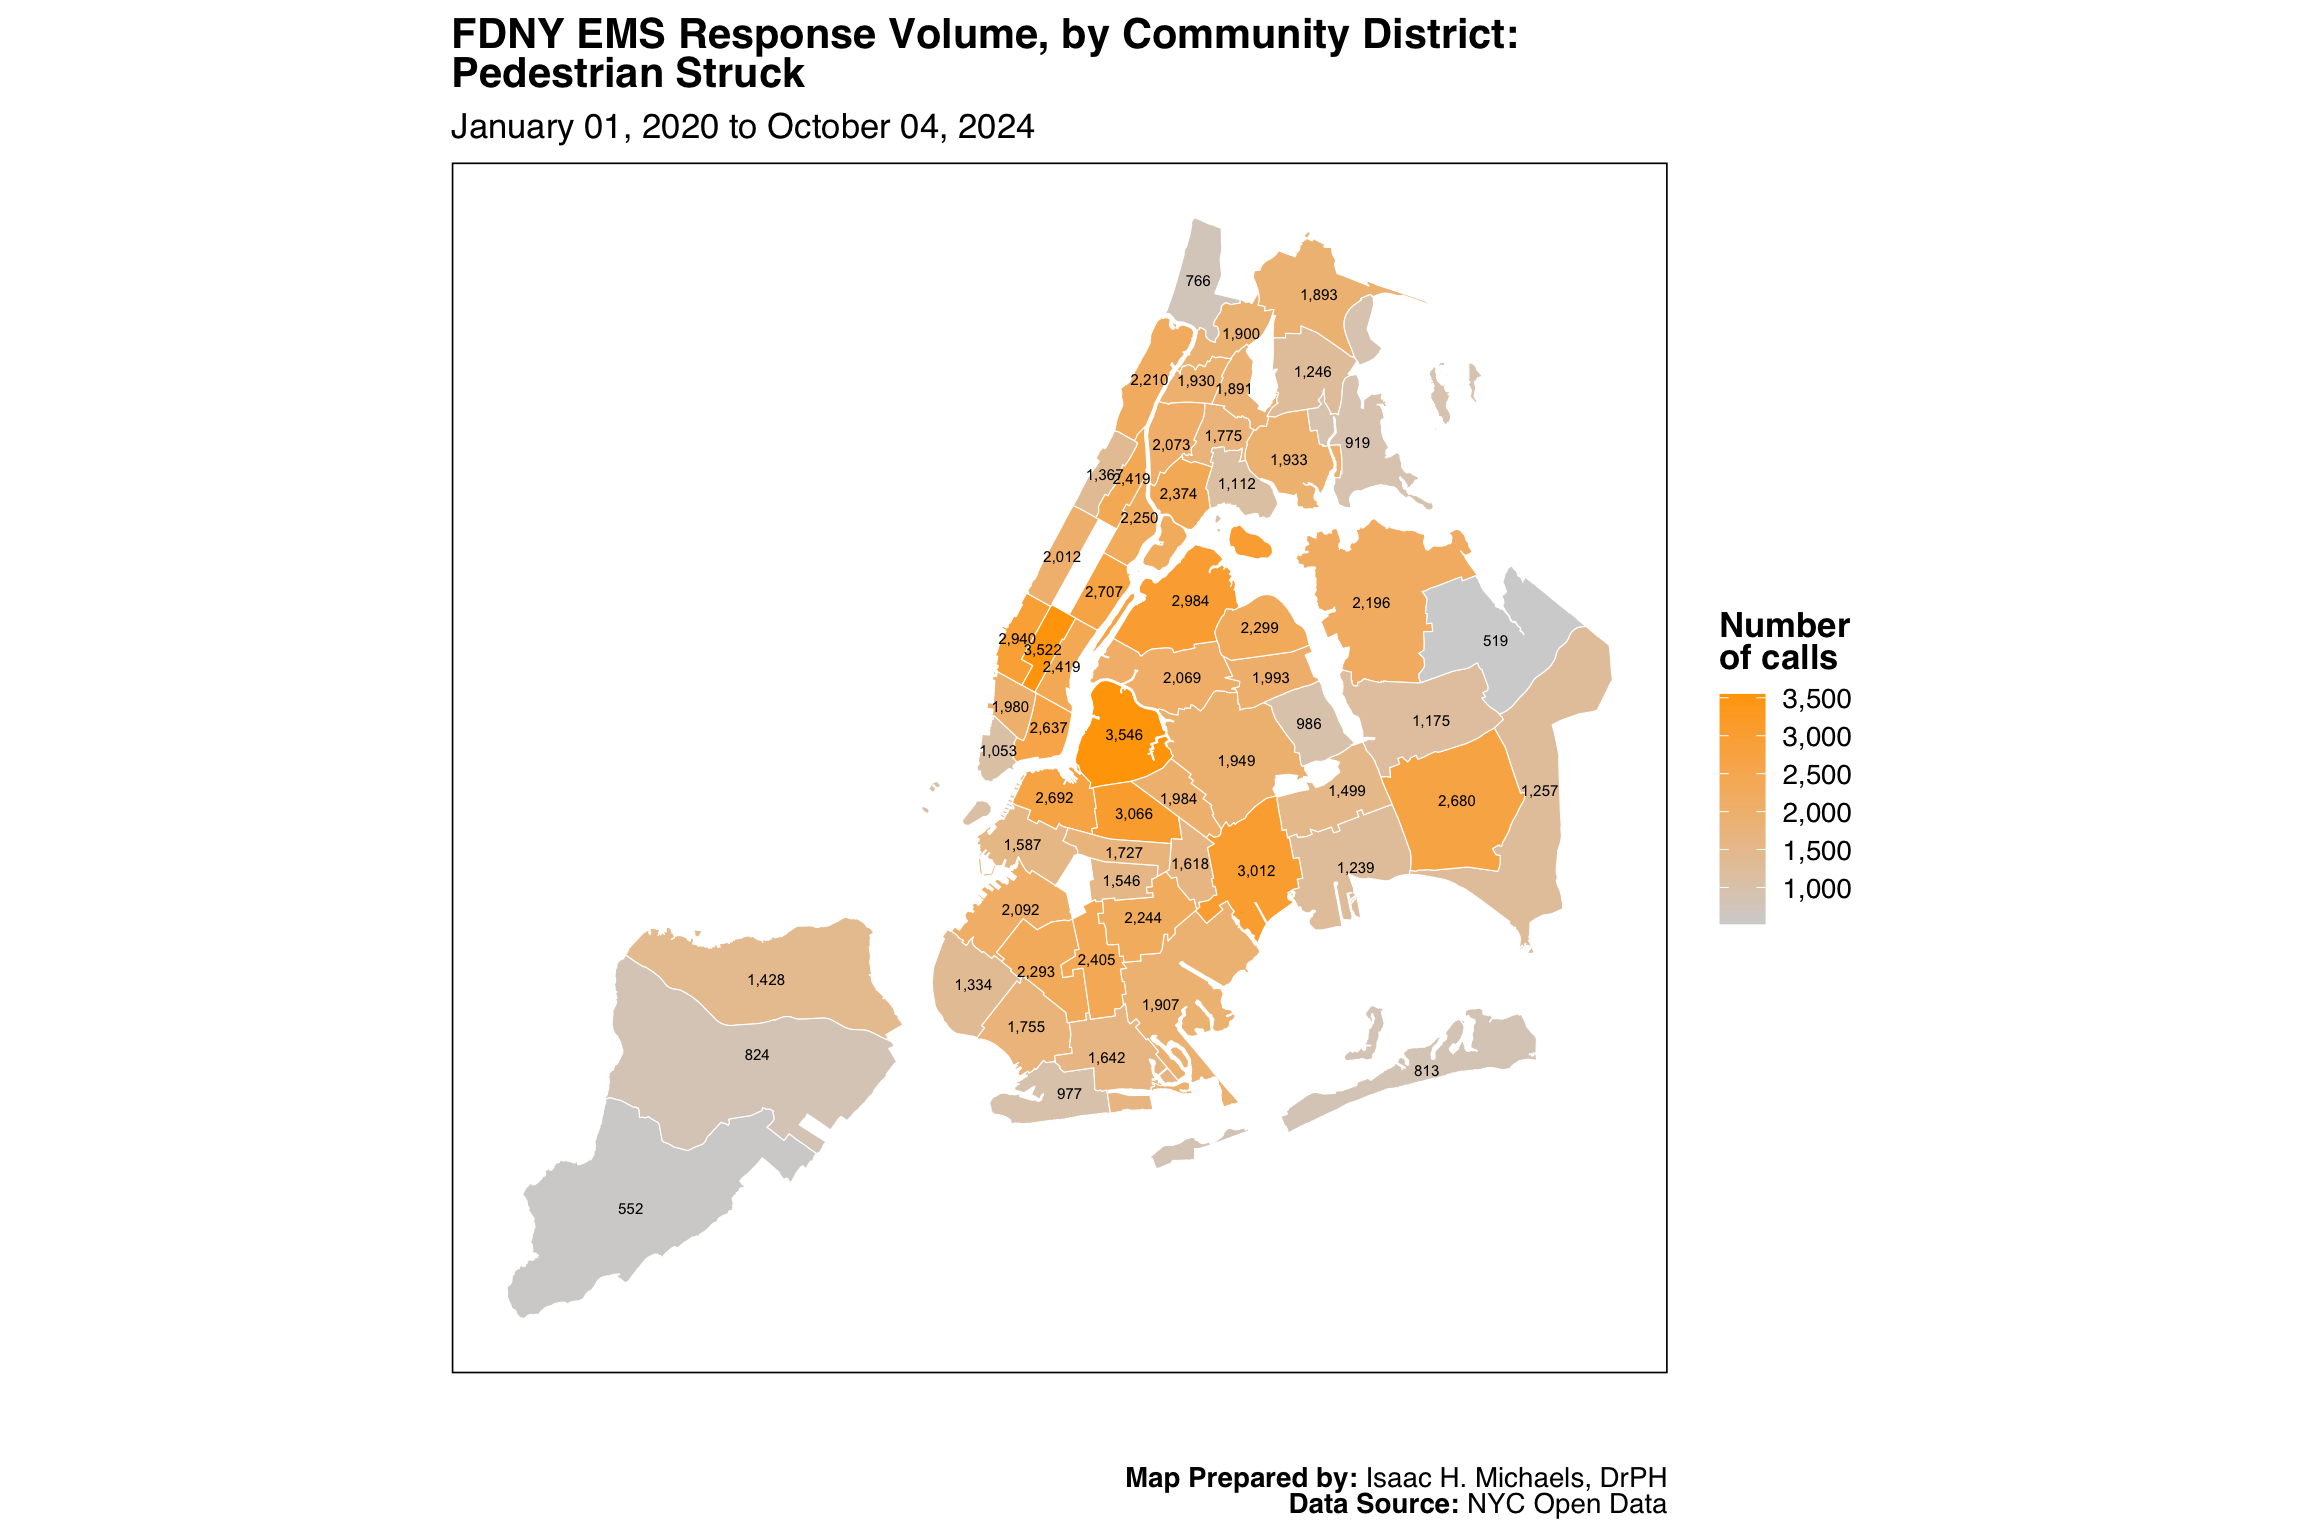
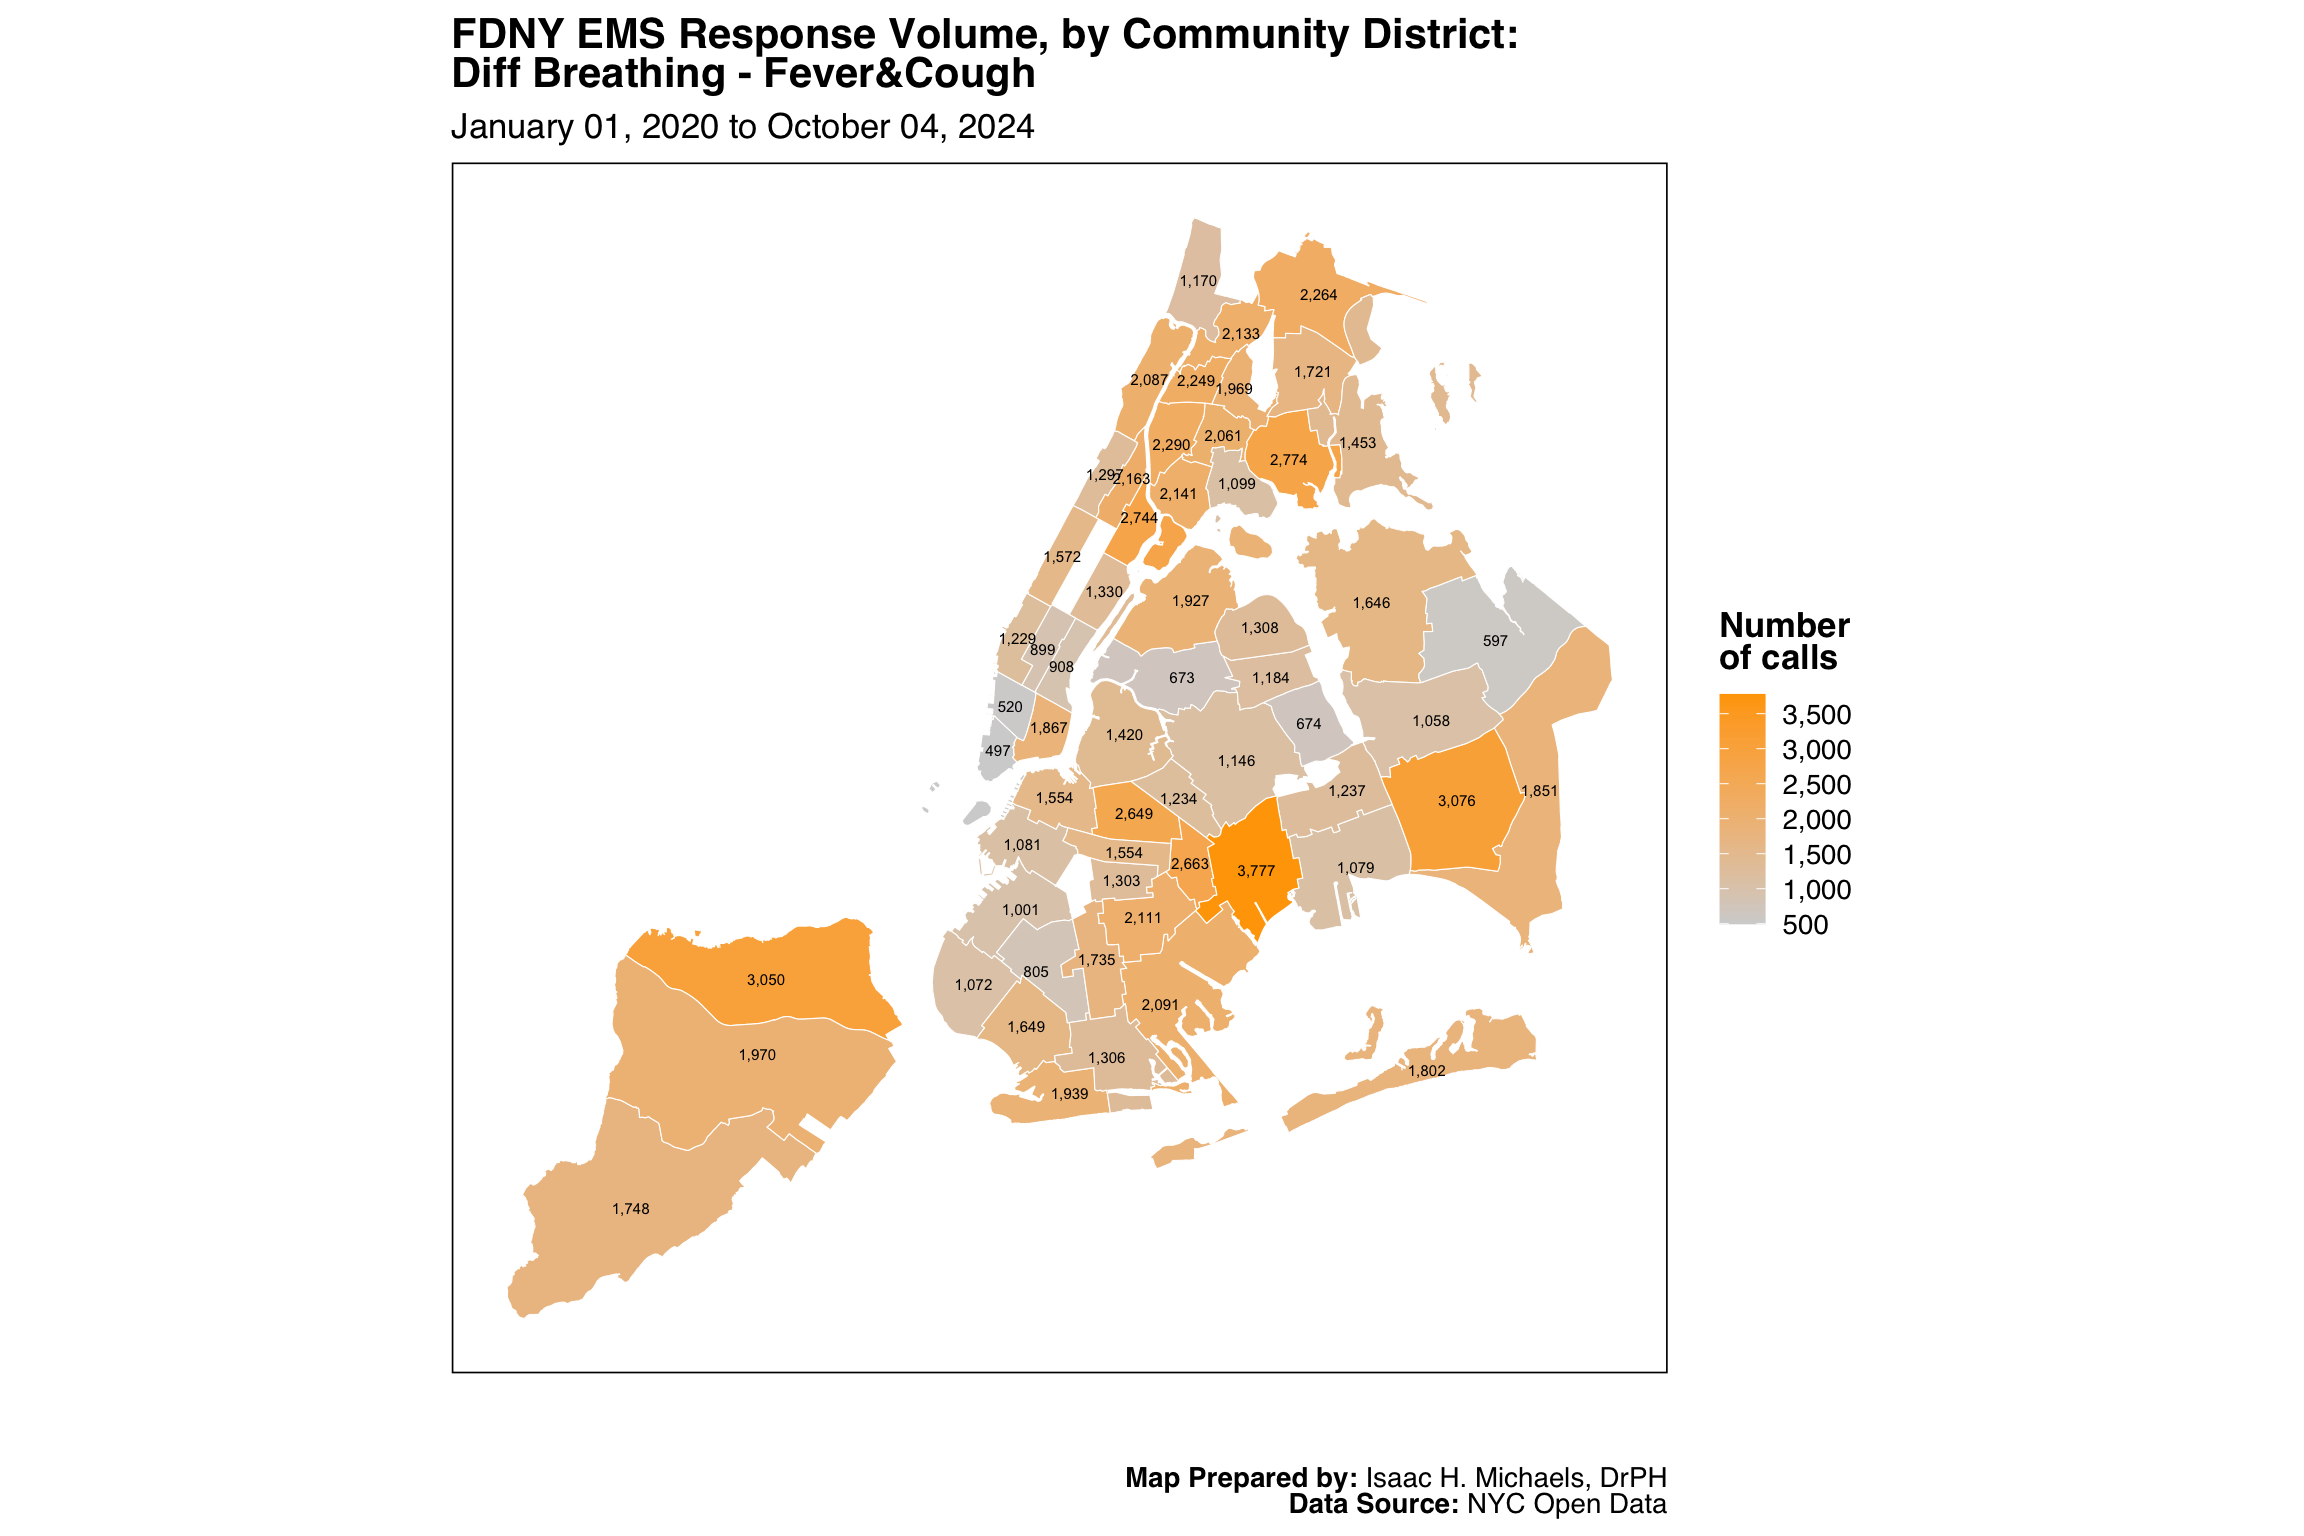
Volume
This map shows the total number of FDNY EMS responses across New York City community districts for all call types during the selected period. Each district is shaded according to its total incident volume, with darker orange areas indicating higher numbers of calls. Numeric labels on each district show call totals in thousands to provide an at-a-glance summary of EMS demand distribution.
The map highlights geographic variation in EMS response volume, with denser, higher-population districts and those with large medical or commercial centers tending to have more incidents. Viewing call activity at the community-district level helps identify areas with concentrated EMS demand and supports analysis of spatial service patterns within the city.
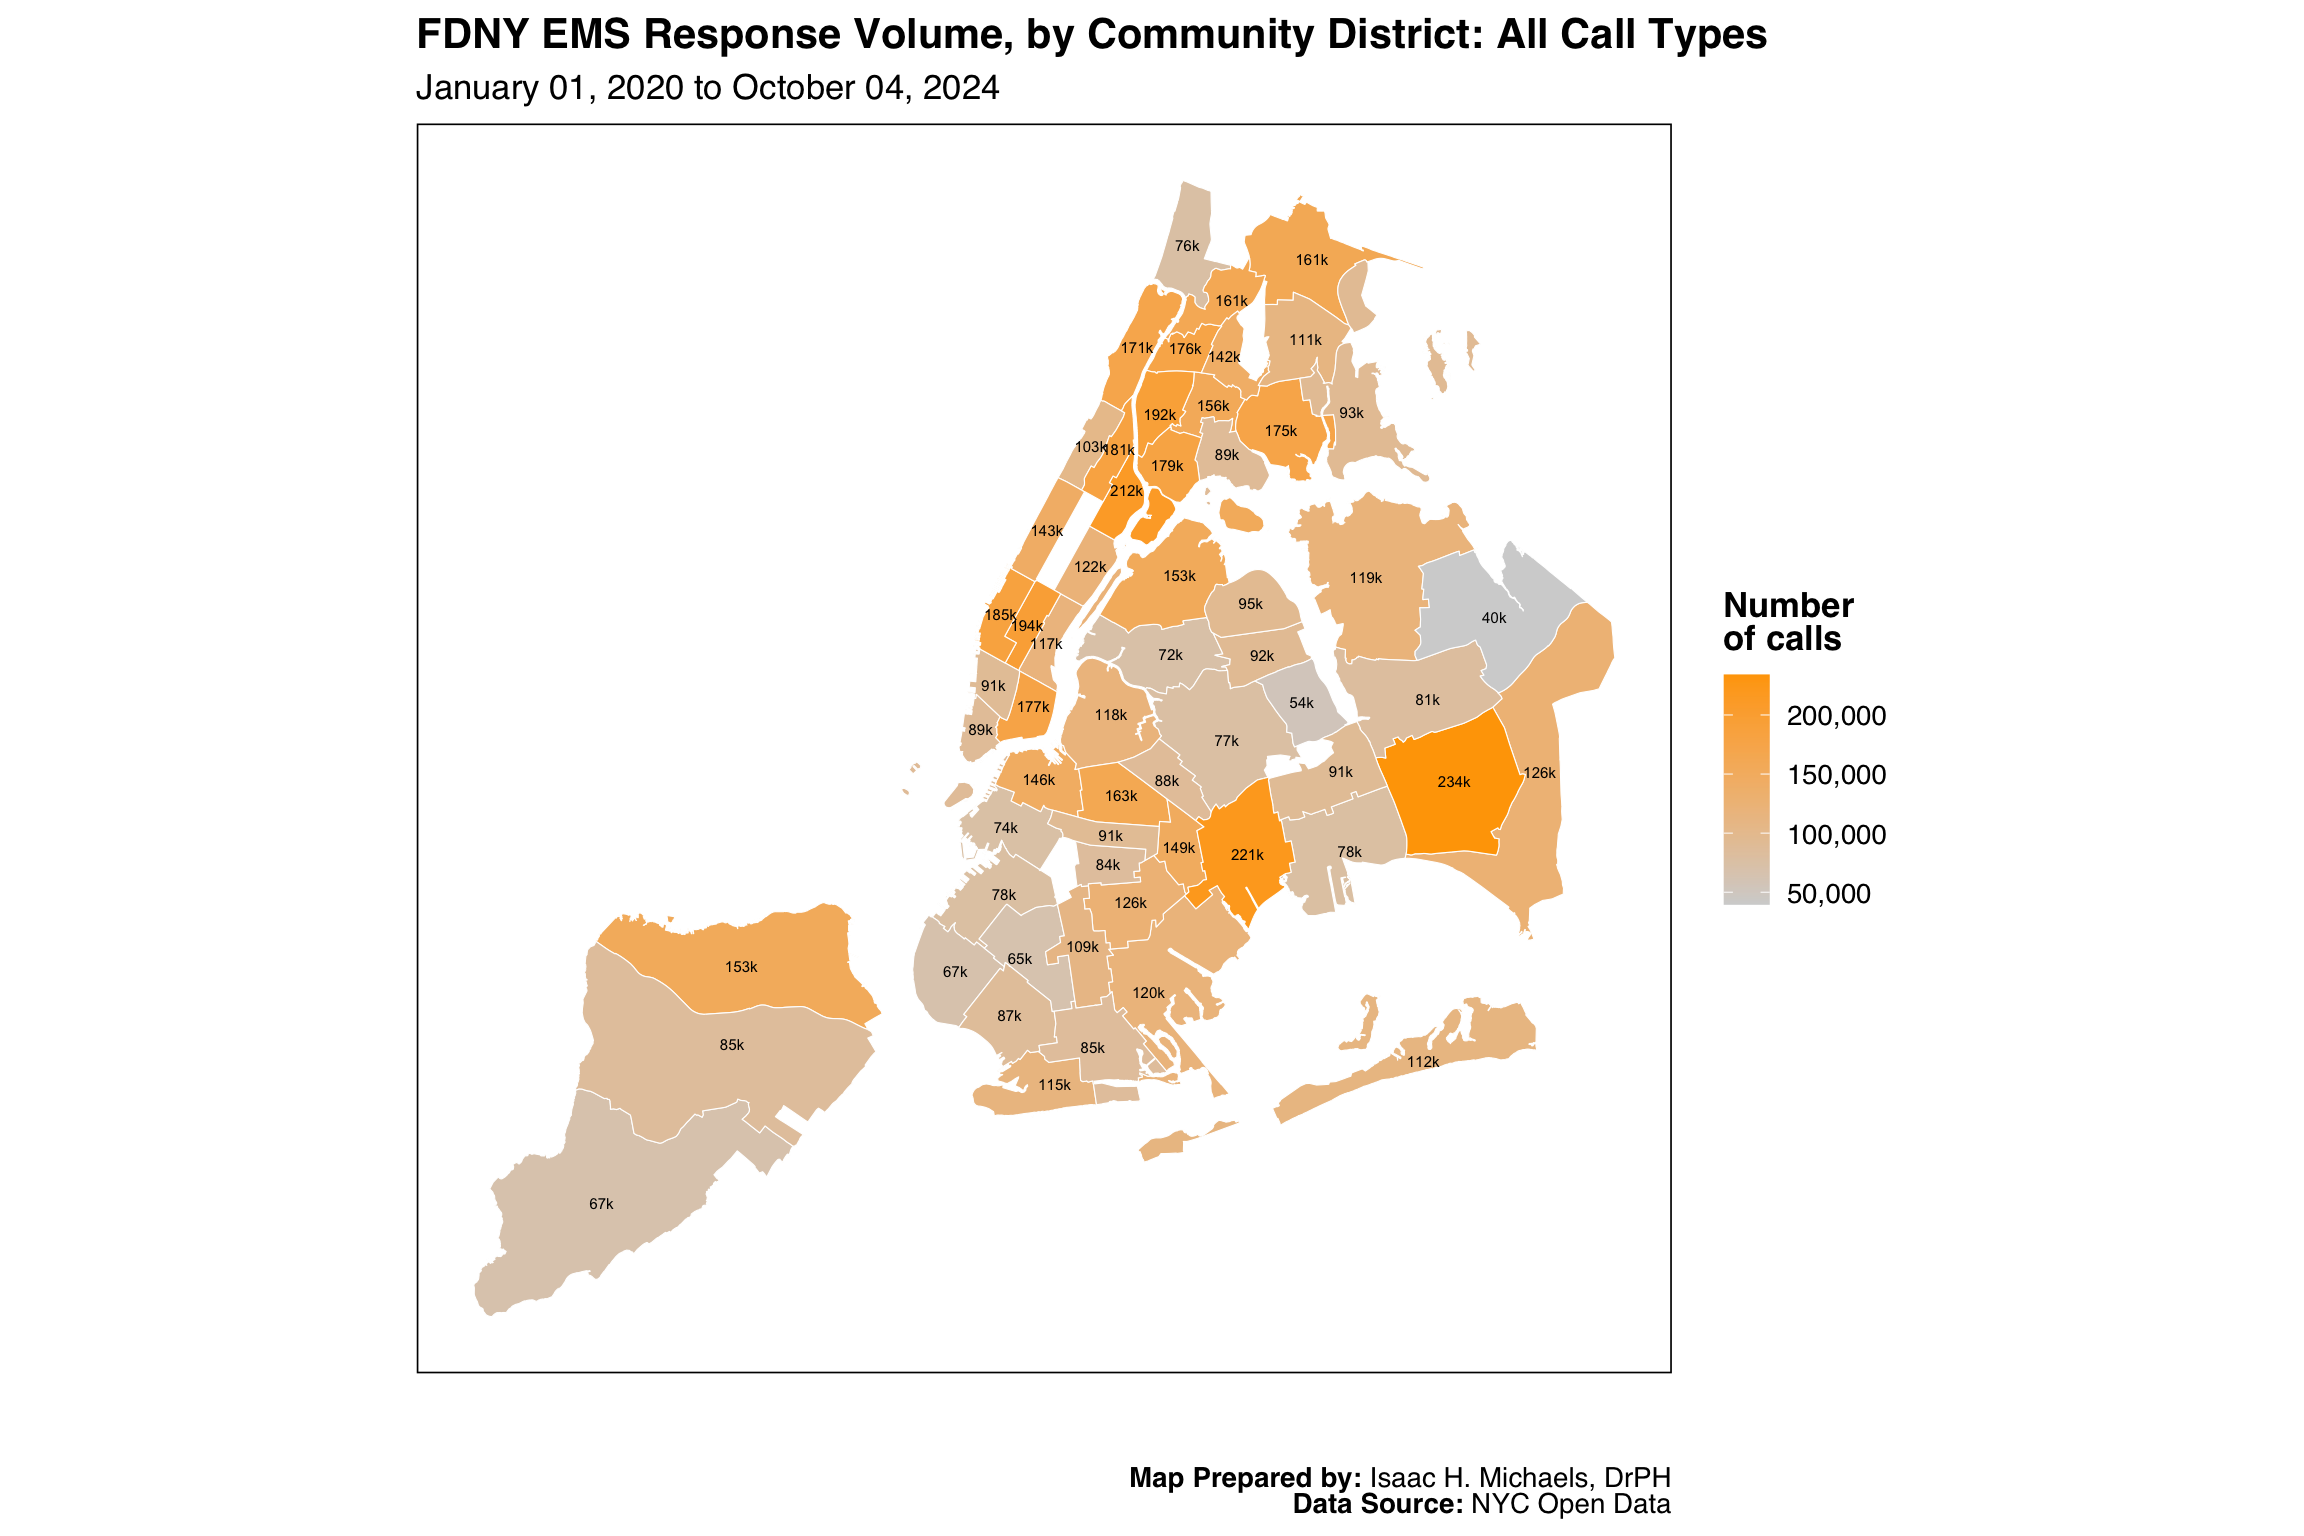 Map Prepared By: Isaac H. Michaels, DrPH
Data Source: NYC Open Data
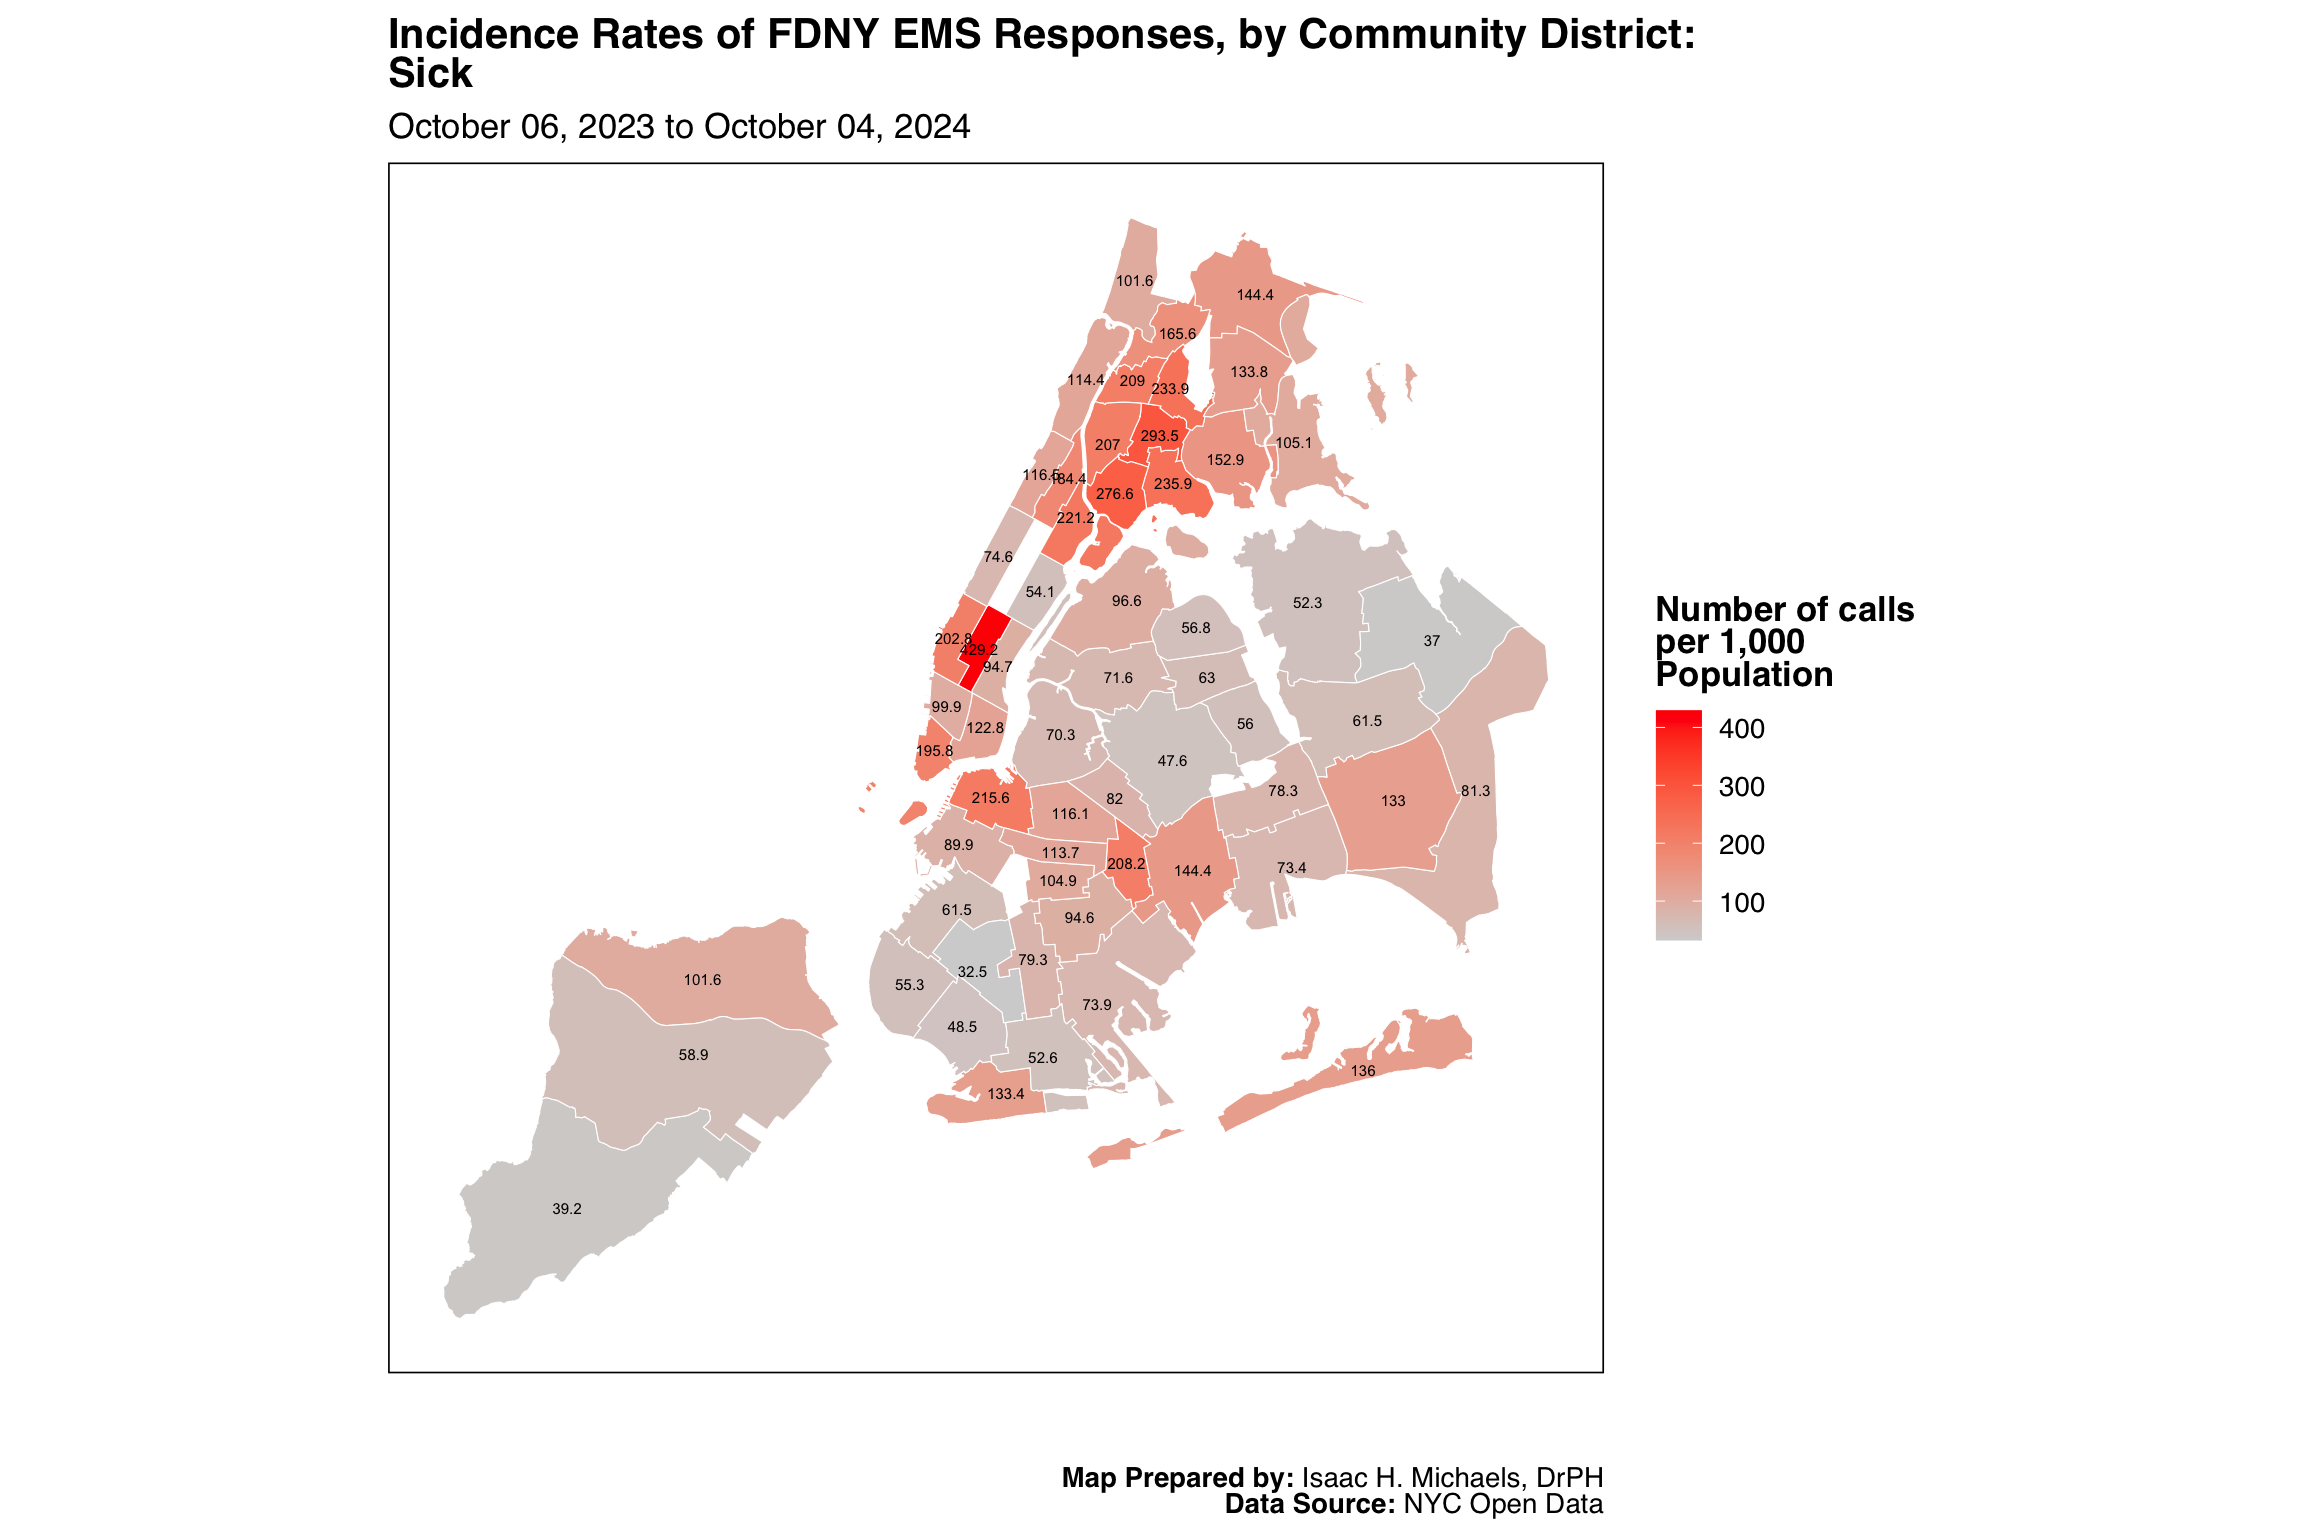
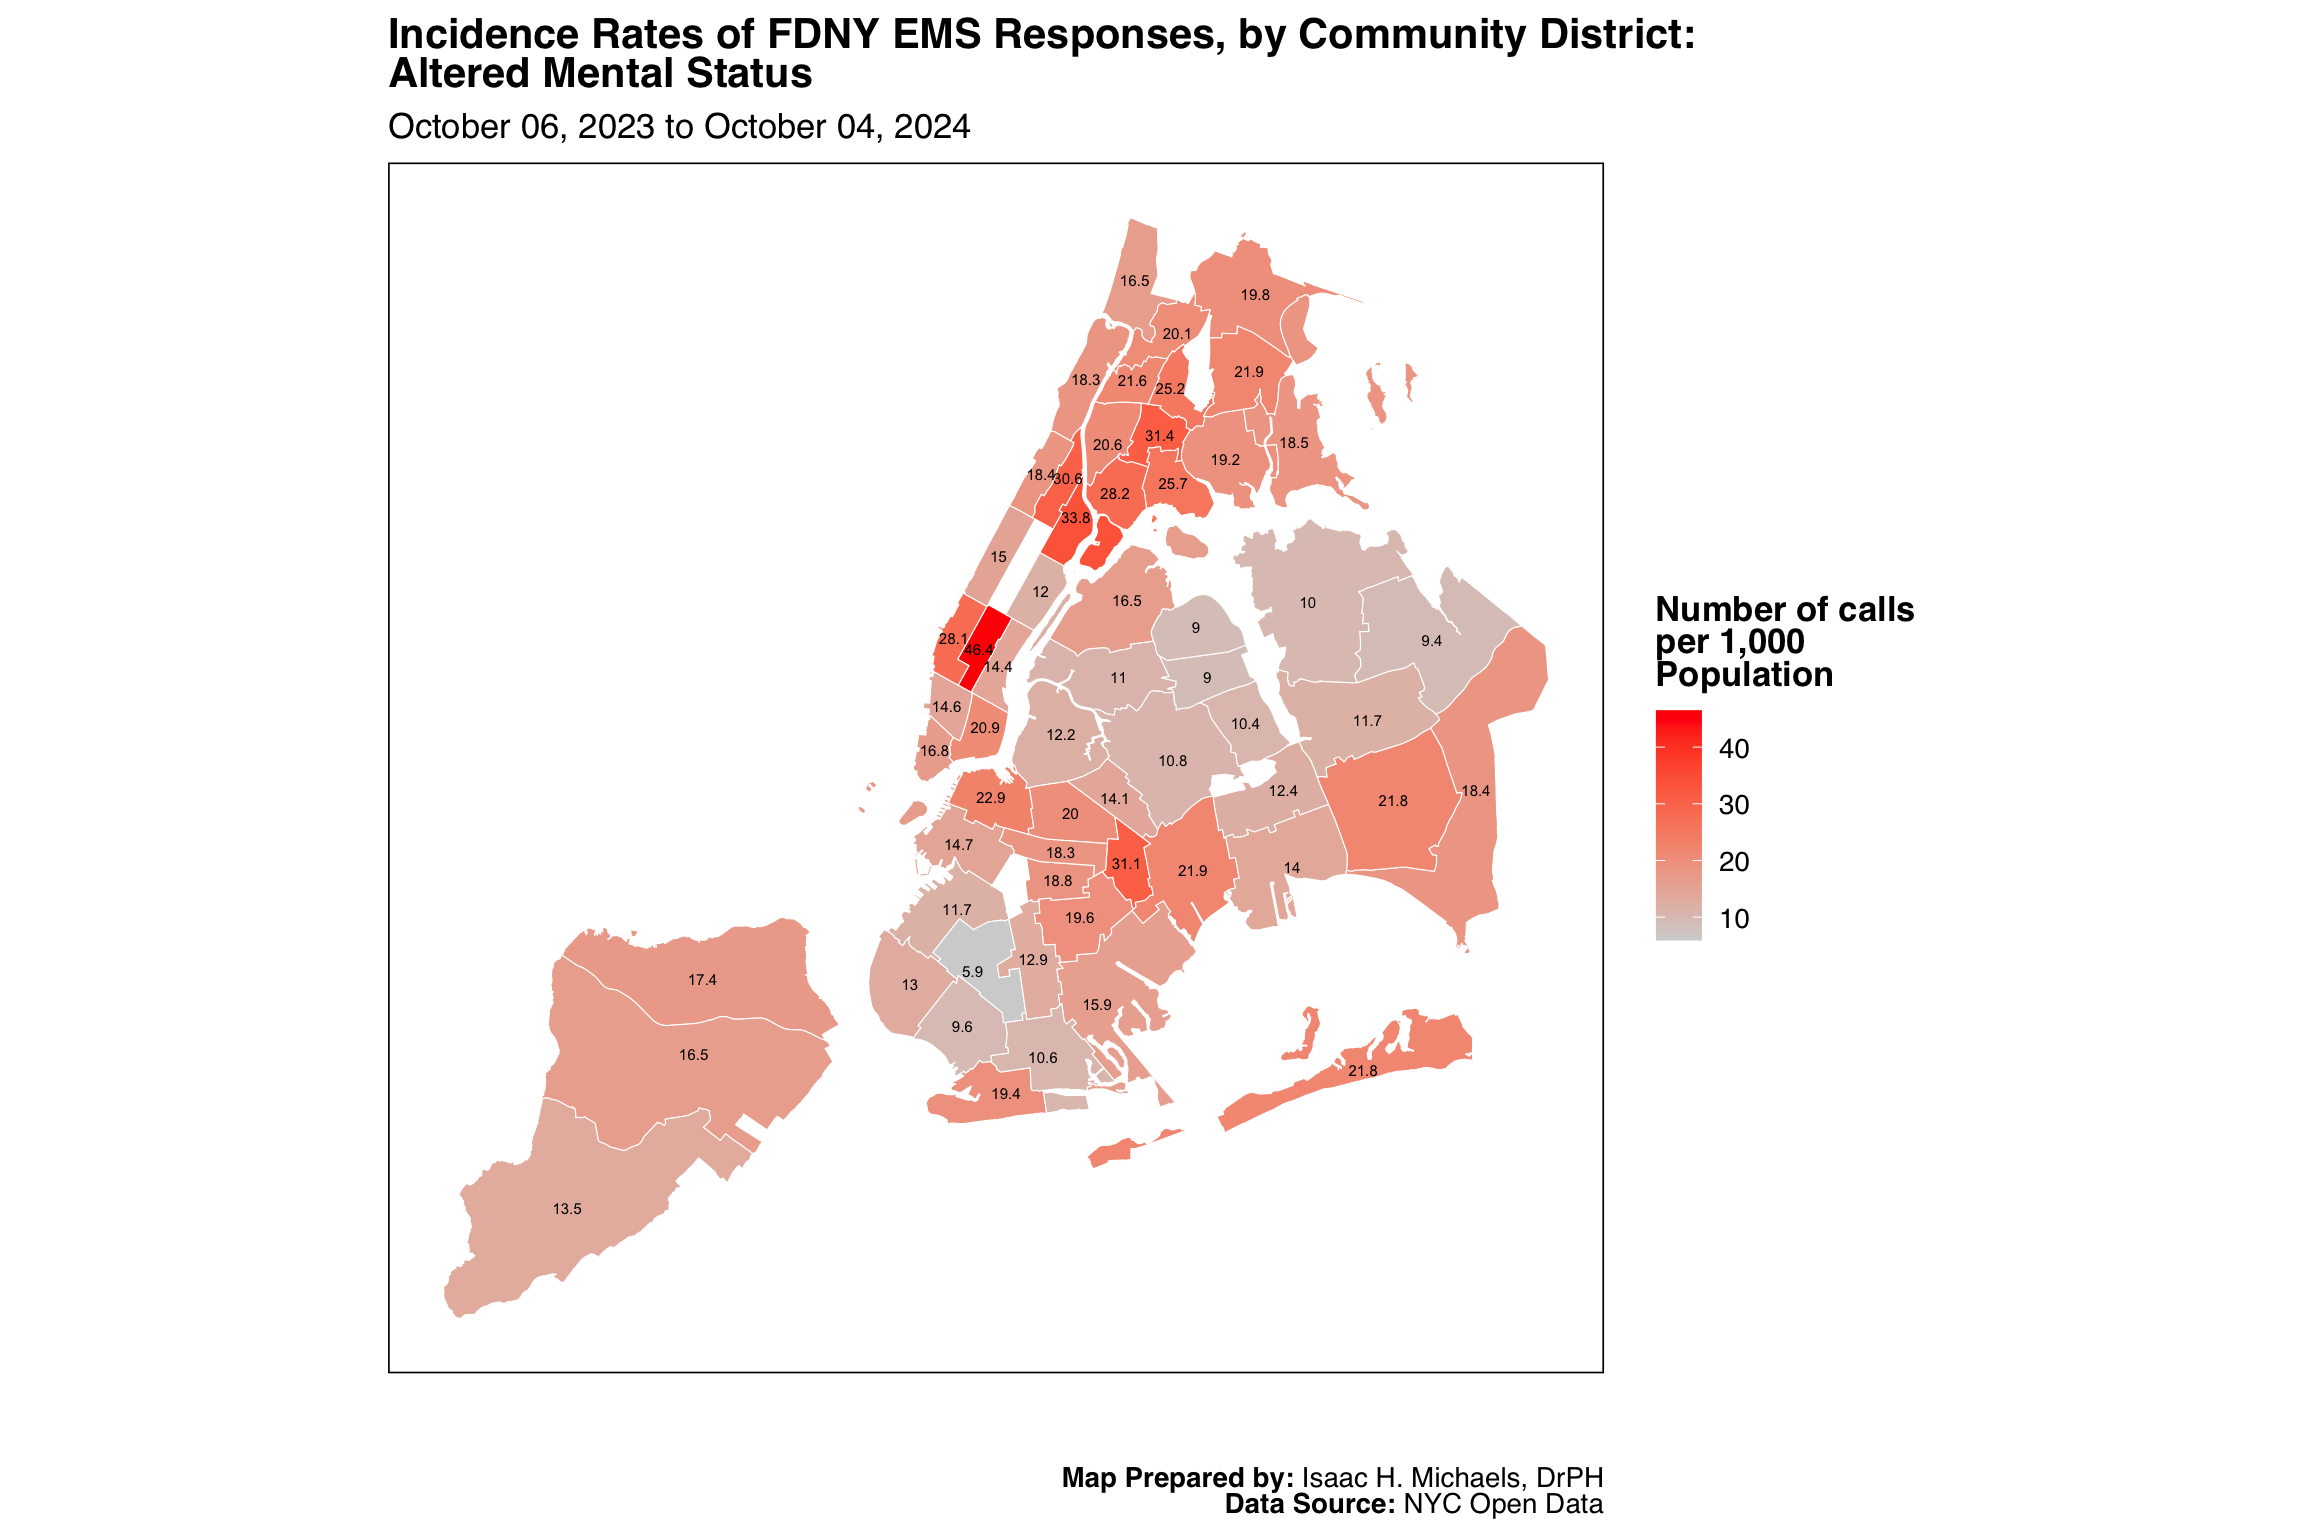
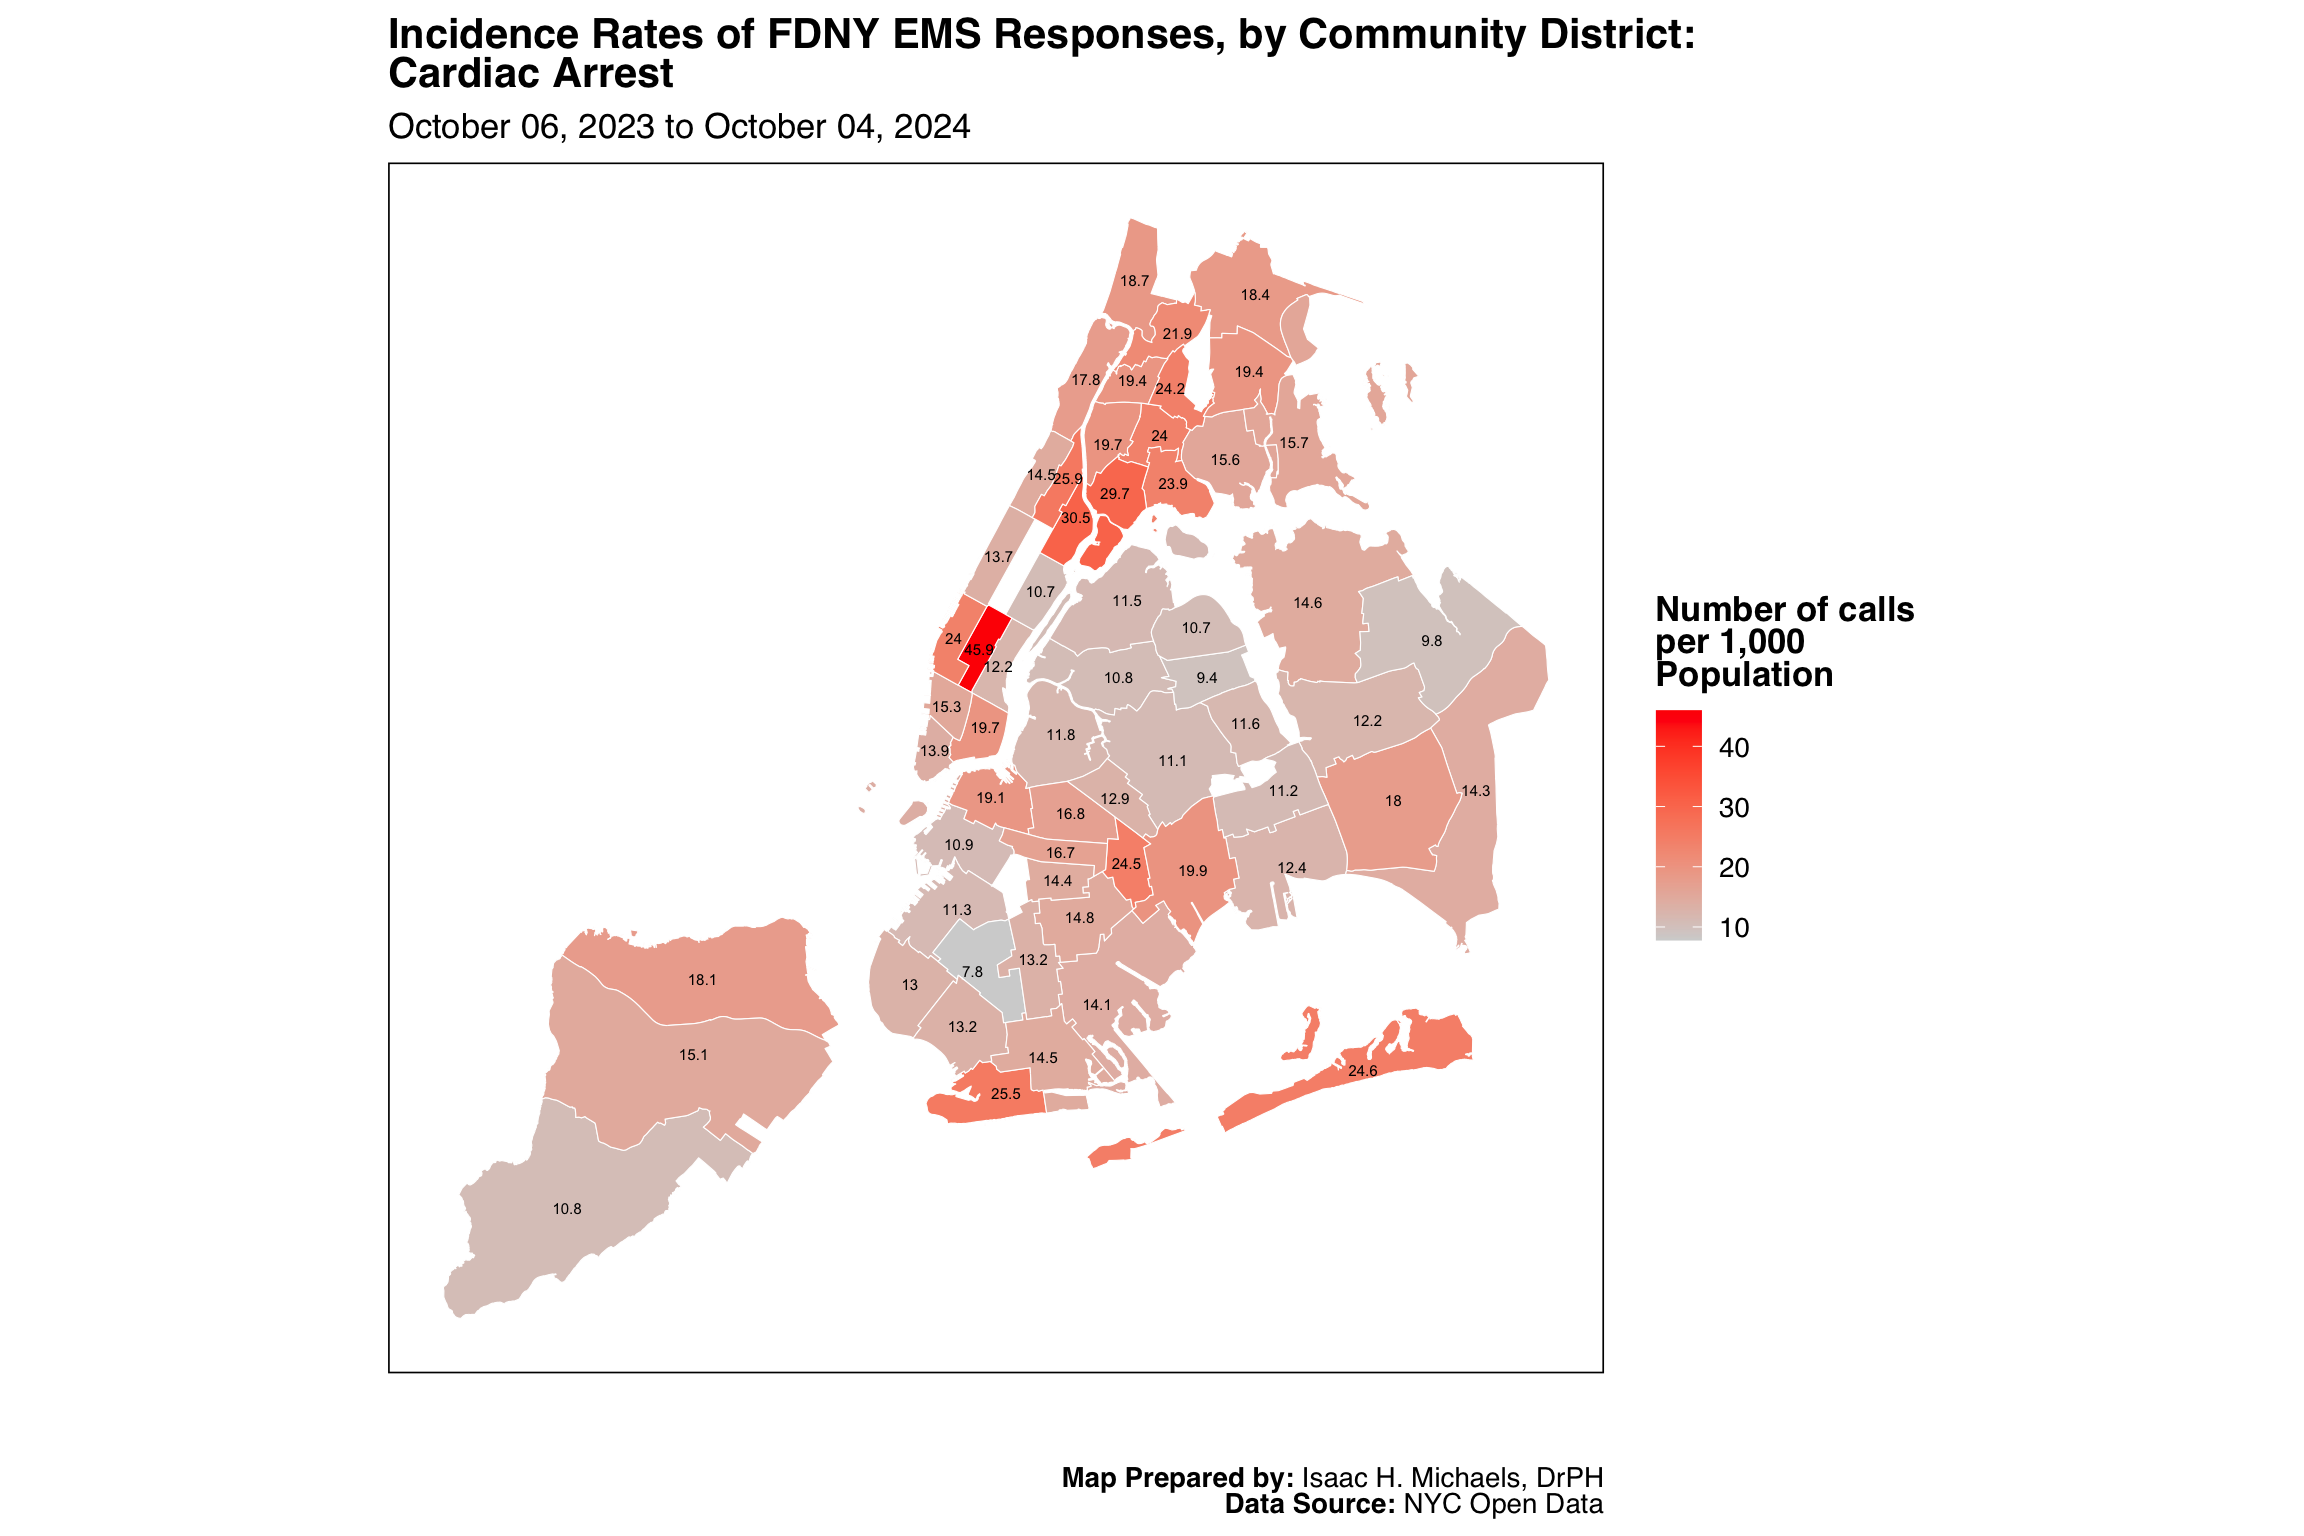
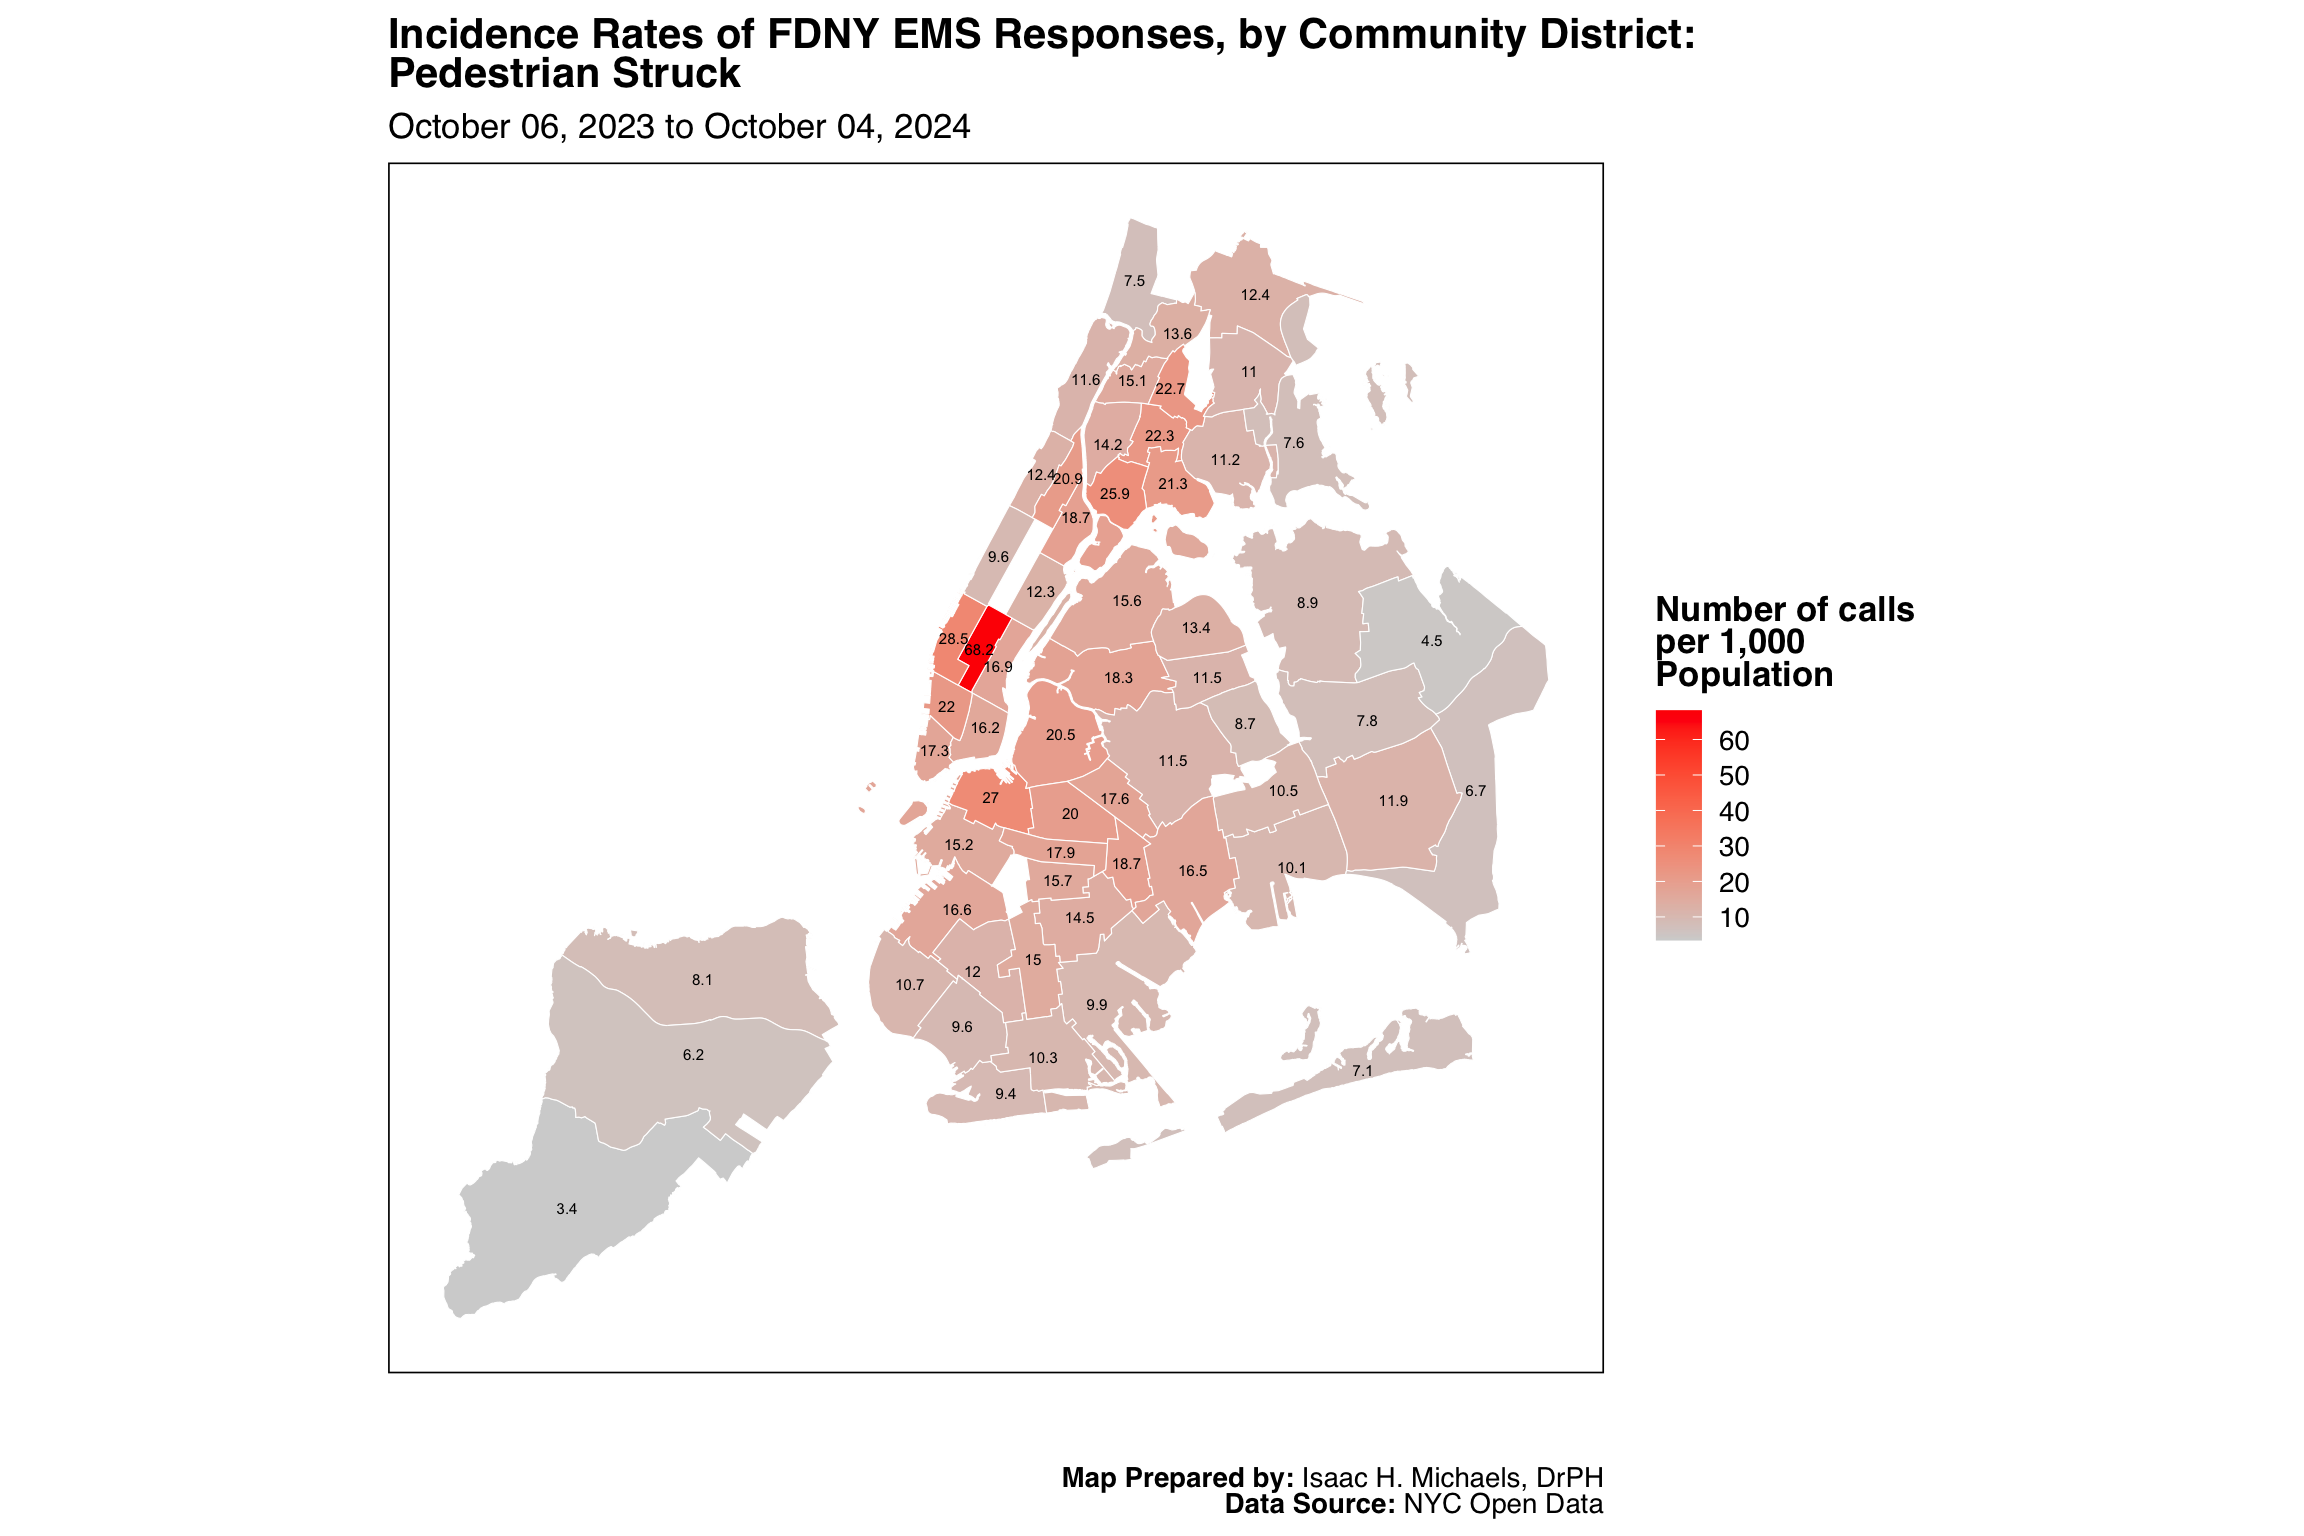
Incidence Rates
This map displays the annual incidence rate of FDNY EMS responses across New York City community districts, expressed as the number of calls per 1,000 residents. Each district is shaded according to its rate, with deeper red colors indicating higher call rates relative to population size. Labels within each district show the precise call rate rounded to one decimal place.
Unlike total call volume, this population-adjusted view reveals where EMS demand is proportionally highest, independent of district size. Areas with elevated rates may reflect a higher concentration of vulnerable residents, greater health or socioeconomic challenges, or local environmental factors influencing emergency call frequency. The map provides a clear geographic perspective on relative EMS burden across the city.
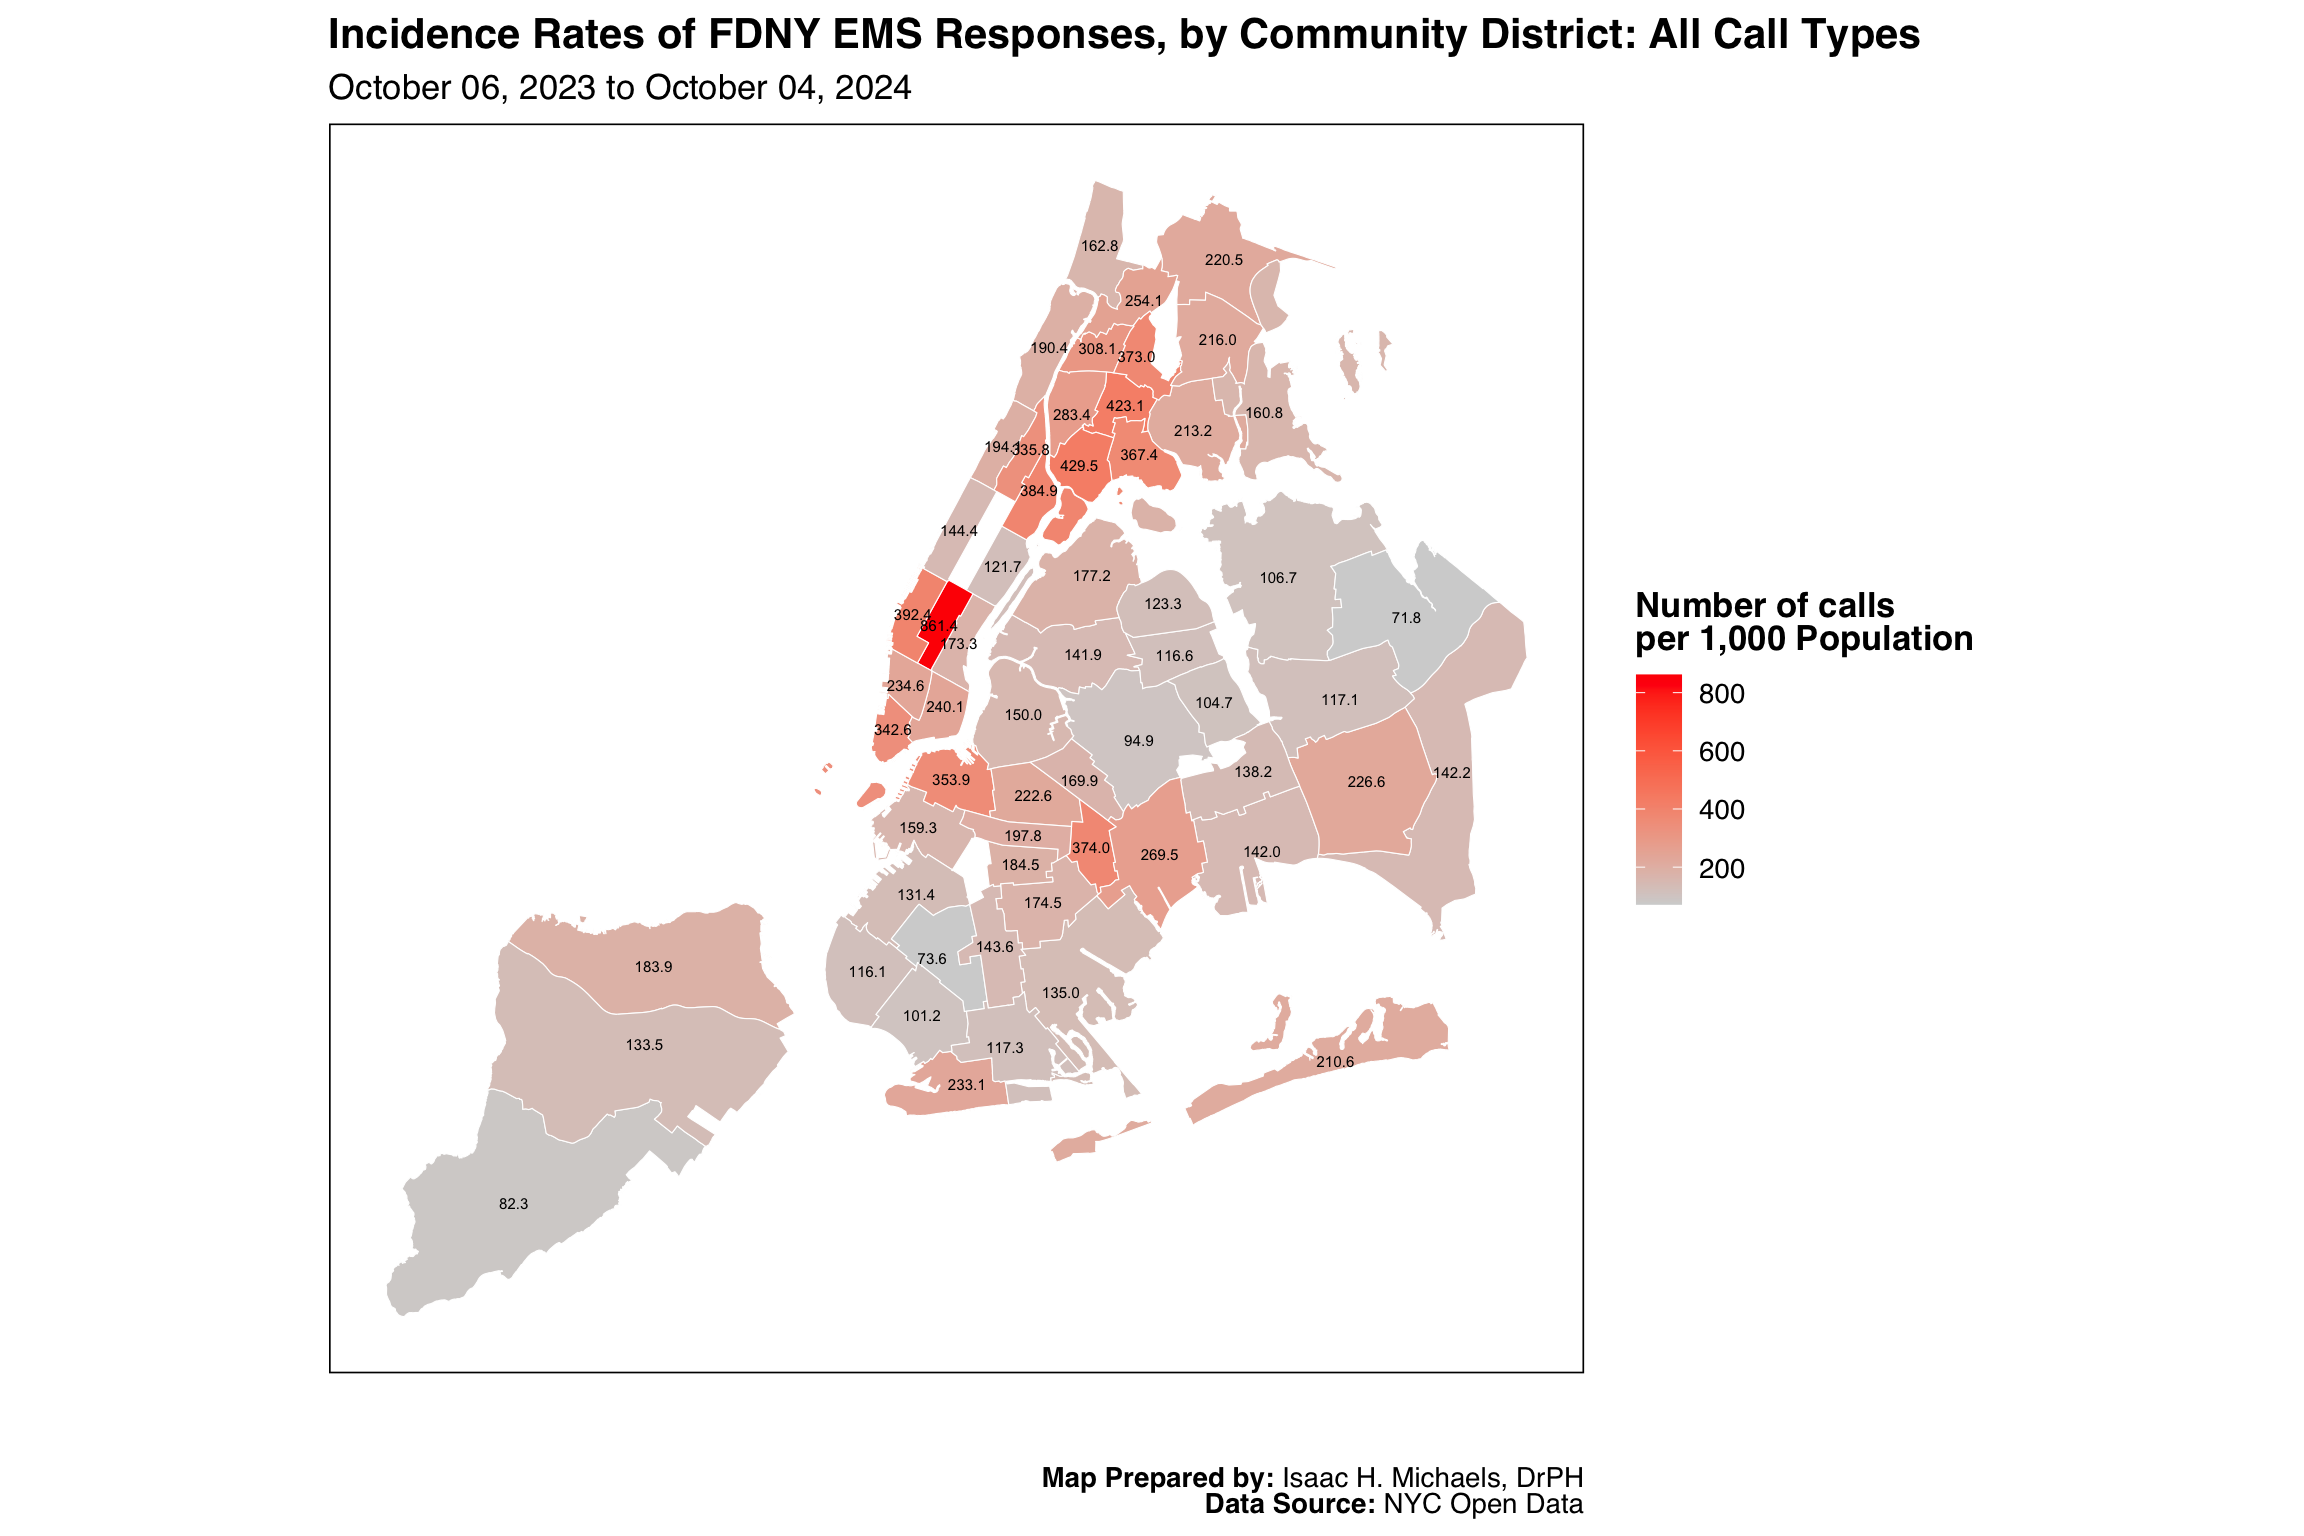 Map Prepared By: Isaac H. Michaels, DrPH
Data Source: NYC Open Data
Population Data Source: NYC Open Data
Final Call Types
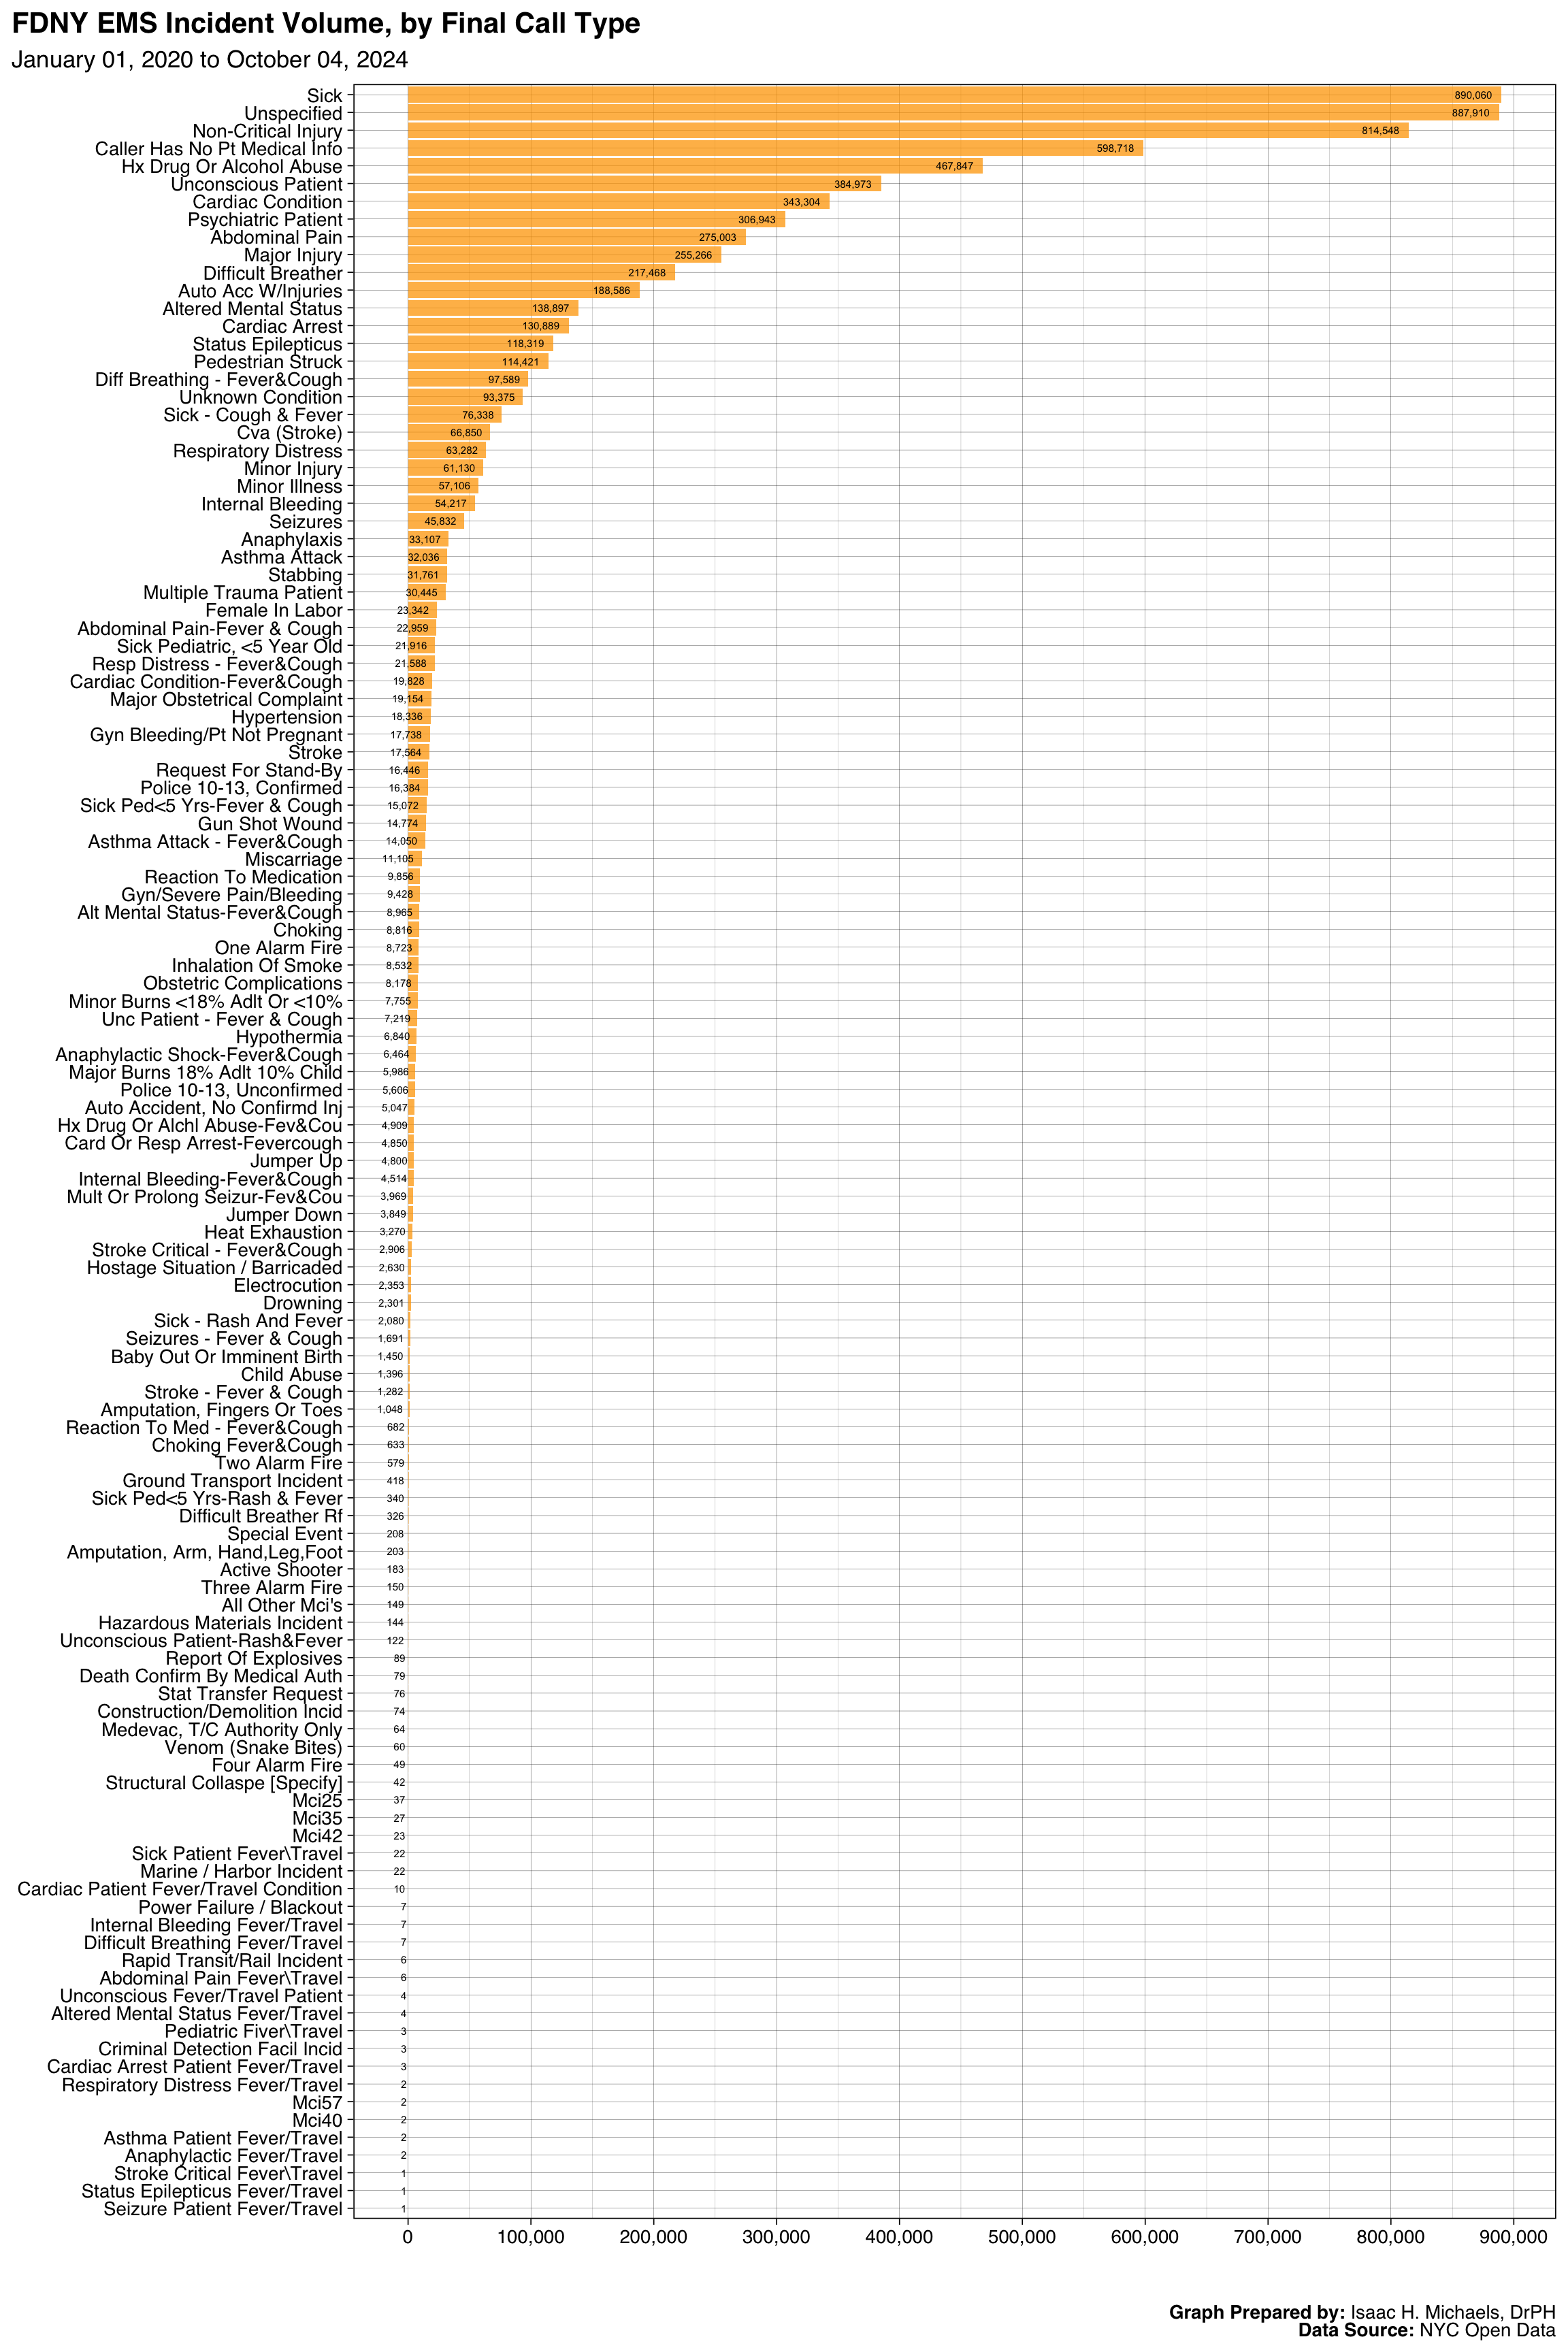
Overall
This bar chart shows the total number of FDNY EMS incidents by final call type across New York City during the study period. Each bar represents a distinct category of emergency response, such as medical, trauma, or cardiac events, with its length corresponding to the total number of calls of that type. Bars are ordered from most to fewest incidents, highlighting which emergencies most frequently require EMS attention.
The figure illustrates how service demand is distributed across call types, revealing dominant categories that drive EMS workload citywide. Understanding these patterns can inform resource allocation, training priorities, and community prevention efforts targeting the most common emergency types.
 Graph Prepared By: Isaac H. Michaels, DrPH
Data Source: NYC Open Data
By Type
This section presents a series of visualizations and tables that describe the spatial, temporal, and operational characteristics of FDNY Emergency Medical Services (EMS) responses in New York City. Each “call type” represents a broad category of emergency response—such as cardiac incidents, respiratory distress, or motor vehicle collisions—allowing for comparisons across different kinds of medical emergencies.
The first set of figures consists of choropleth maps showing EMS response volume and incidence rates by community district. The volume maps highlight areas with the greatest absolute number of responses, while the rate maps adjust for population size to reveal areas where demand is highest relative to local population. Together, these maps illustrate how emergency medical demand varies geographically, both in terms of concentration and intensity.
Following the maps, weekday-hour heatmaps show patterns of EMS activity across time, with separate panels for each borough. The volume heatmaps display when the most calls occur, while the rate heatmaps account for population differences to reveal when residents are most likely to require EMS response. These temporal visualizations help identify daily and weekly rhythms in EMS demand, which can inform staffing and readiness planning.
The final set of figures consists of borough-level trend graphs that track changes in EMS response volume over the study period. These trends provide context for understanding whether observed spatial or temporal patterns are stable, seasonal, or shifting over time. Together, the maps, heatmaps, and trend graphs offer complementary perspectives: the maps show where responses occur, the heatmaps show when they occur, and the trend graphs show how they evolve.
Accompanying tables summarize call volume, severity level, and incident disposition for each call type. These tabular summaries complement the visualizations by providing numerical detail and highlighting proportional differences across categories. Taken together, the visual and tabular materials provide a multidimensional view of EMS activity in New York City—helping identify geographic disparities, temporal surges, and operational pressures that can inform both public health planning and emergency service resource allocation.
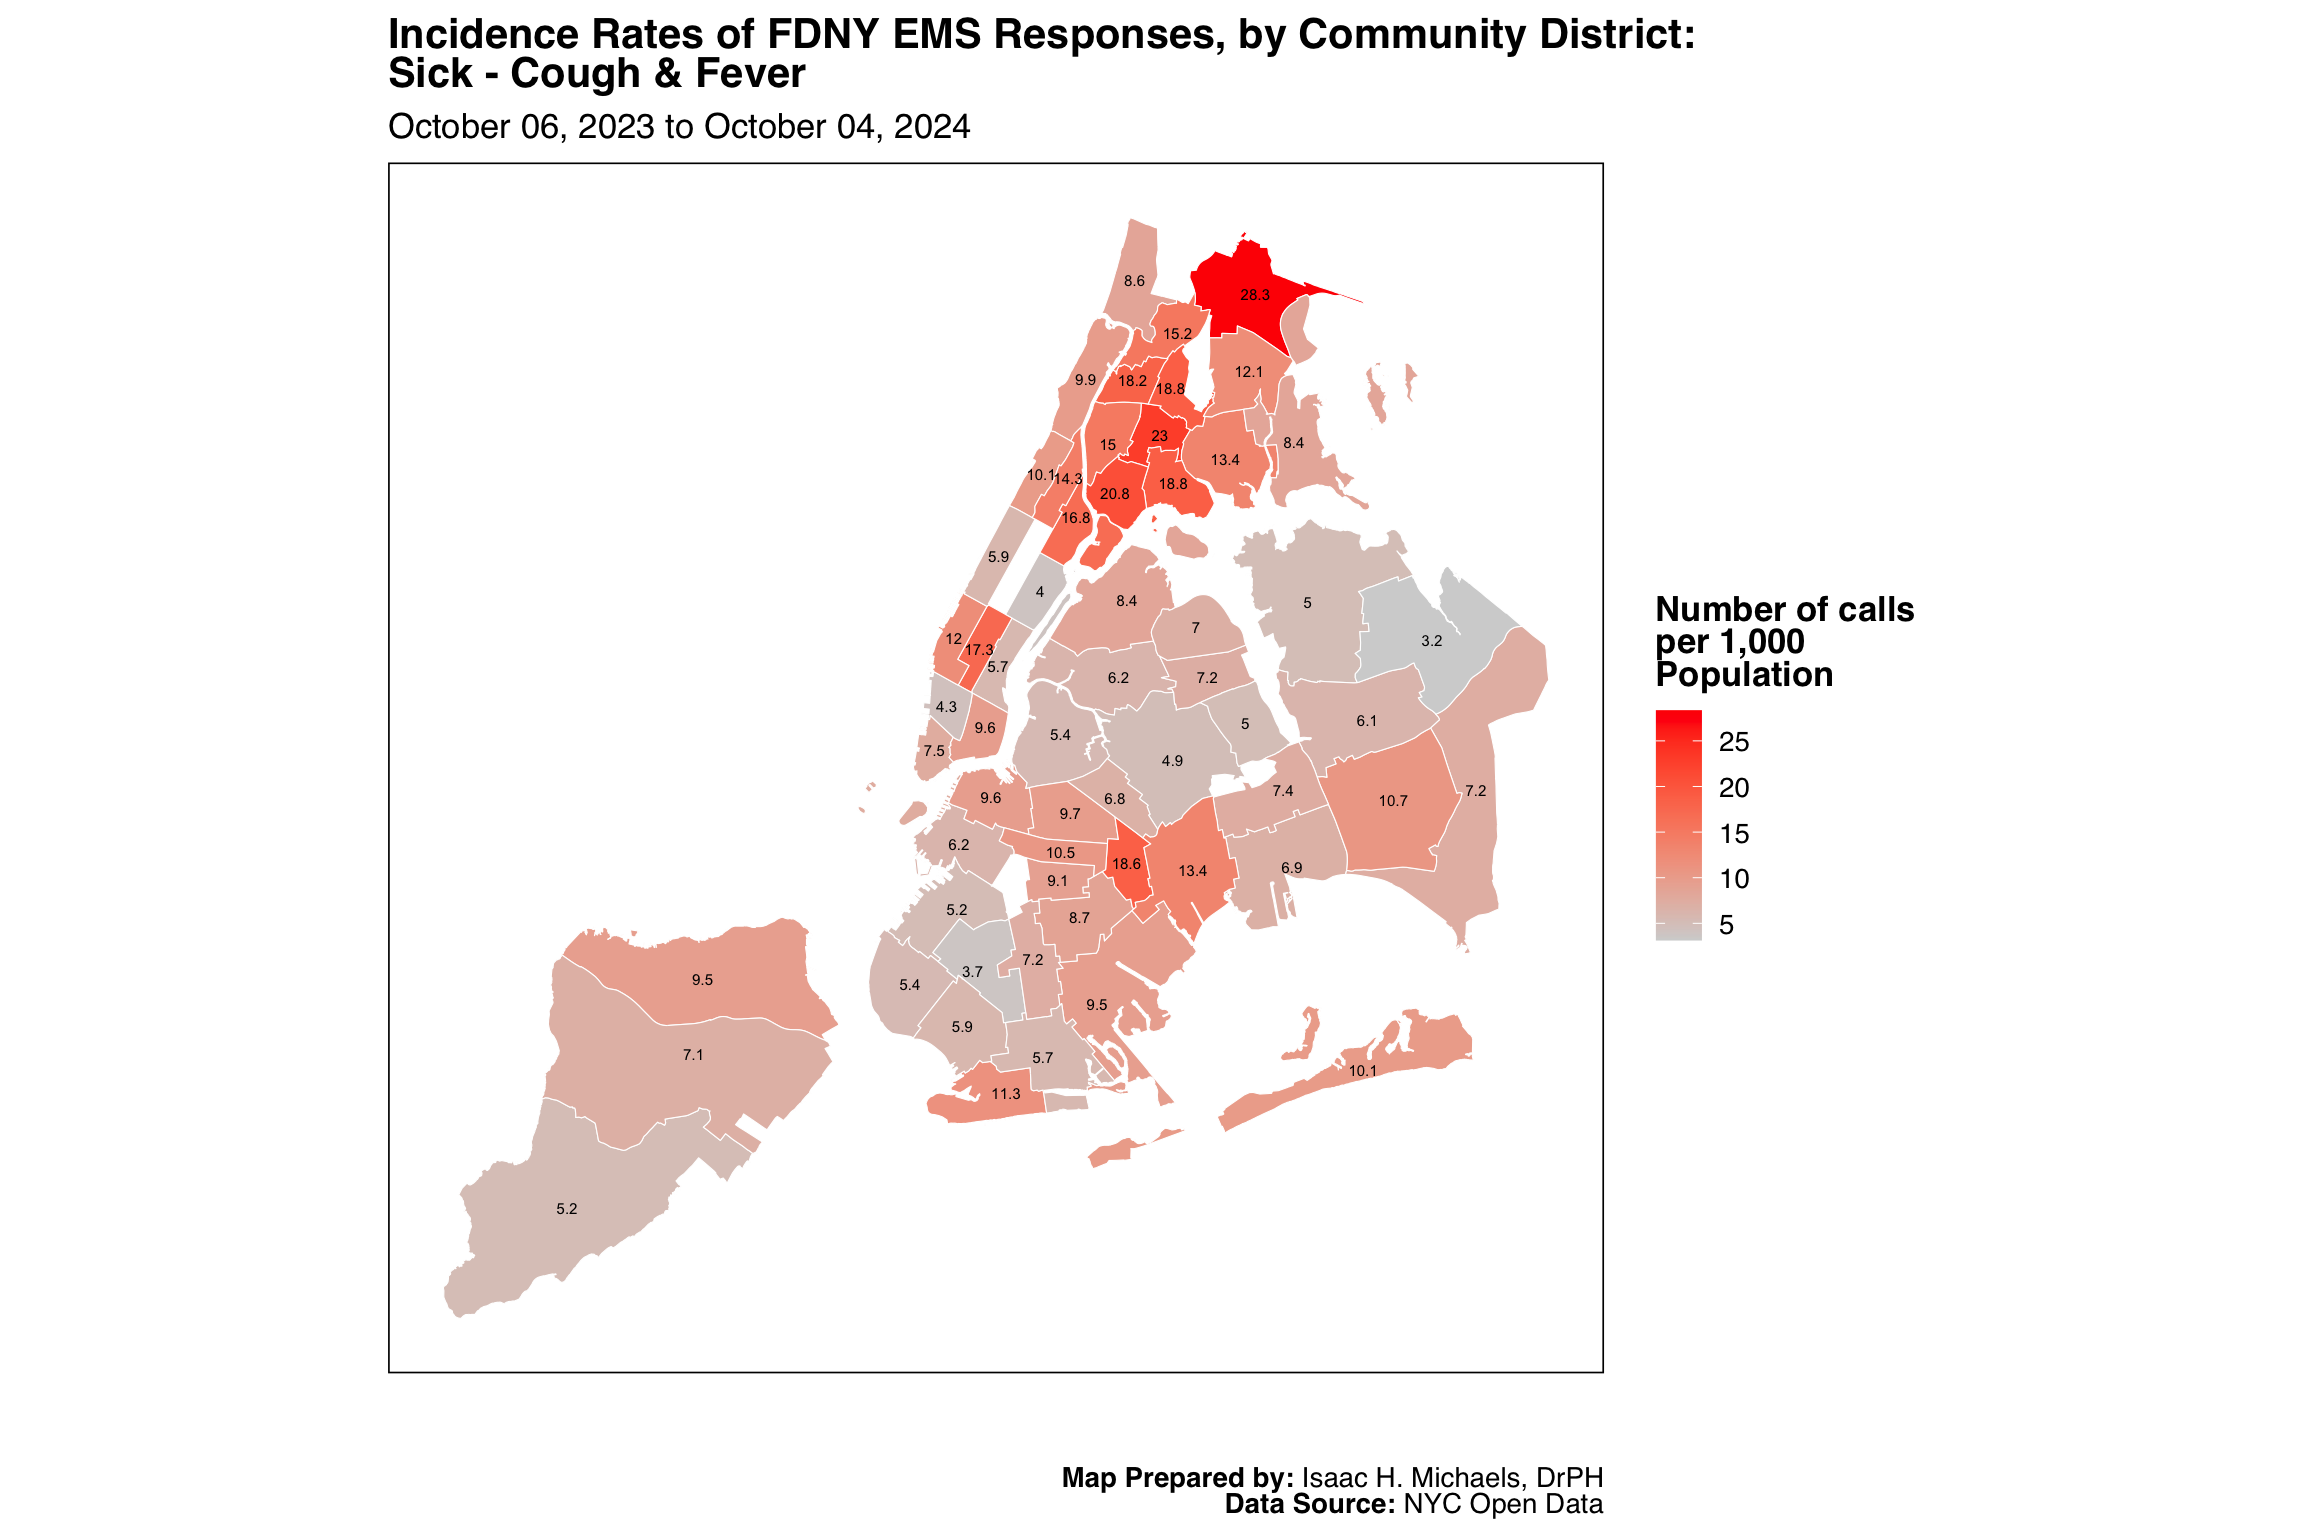
Sick
Map Prepared by: Isaac H. Michaels, DrPH
Data Source: NYC Open Data
Map Prepared by: Isaac H. Michaels, DrPH
EMS Data Source: NYC Open Data
Population Data Source: NYC Open Data
Graphs Prepared by: Isaac H. Michaels, DrPH
Data Source: NYC Open Data
| FDNY EMS Incident Volume, by Borough: Sick |
||||||
| January 01, 2025 to July 01, 2026 | ||||||
| Borough |
Latest Year: 2026
|
All Years: 2025-2026
|
||||
|---|---|---|---|---|---|---|
| Incidents | % | Rate per 1,000 Population | Total Incidents | % | Monthly Trend | |
| Bronx | 26,805 | 28% | 19.4 | 81,842 | 29% | |
| Brooklyn | 24,962 | 27% | 9.6 | 72,016 | 25% | |
| Manhattan | 21,112 | 22% | 13.2 | 64,835 | 23% | |
| Queens | 18,029 | 19% | 7.9 | 54,293 | 19% | |
| Staten Island | 3,208 | 3% | 6.5 | 10,016 | 4% | |
| Table Prepred by: Isaac H. Michaels, DrPH | ||||||
| Data Source: NYC Open Data | ||||||
Table Prepared by: Isaac H. Michaels, DrPH
EMS Data Source: NYC Open Data
Population Data Source: Health Data NY
| FDNY EMS Incident Volume, by Severity Level: Sick |
||||
| January 01, 2025 to July 01, 2026 | ||||
| Final Severity Level |
Latest Year: 2026
|
All Years: 2025-2026
|
||
|---|---|---|---|---|
| Incidents | % | Incidents | % | |
| 1 | 0 | 0% | 0 | 0% |
| 2 | 2 | 0% | 8 | 0% |
| 3 | 65 | 0% | 194 | 0% |
| 4 | 590 | 1% | 1,487 | 1% |
| 5 | 11 | 0% | 25 | 0% |
| 6 | 93,446 | 99% | 281,281 | 99% |
| 7 | 2 | 0% | 9 | 0% |
| 8 | 0 | 0% | 0 | 0% |
| Table Prepred by: Isaac H. Michaels, DrPH | ||||
| Data Source: NYC Open Data | ||||
Table Prepared by: Isaac H. Michaels, DrPH
Data Source: NYC Open Data
| FDNY EMS Incident Volume, by Disposition: Sick |
||||
| January 01, 2025 to July 01, 2026 | ||||
| Disposition |
Latest Year: 2026
|
All Years: 2025-2026
|
||
|---|---|---|---|---|
| Incidents | % | Incidents | % | |
| Cancelled | 1,655 | 2% | 4,078 | 1% |
| Condition Corrected | 525 | 1% | 1,315 | 0% |
| Patient Gone on Arrival | 3,126 | 3% | 8,034 | 3% |
| Patient Pronounced Dead | 9 | 0% | 23 | 0% |
| Refused Medical Aid | 20,054 | 21% | 60,737 | 21% |
| Transporting Patient | 60,441 | 64% | 189,902 | 67% |
| Treated Not Transported | 1 | 0% | 3 | 0% |
| Treated and Transported | 66 | 0% | 172 | 0% |
| Triaged at Scene No Transport | 16 | 0% | 39 | 0% |
| Unfounded | 4,068 | 4% | 10,961 | 4% |
| NA | 4,155 | 4% | 7,740 | 3% |
| Table Prepred by: Isaac H. Michaels, DrPH | ||||
| Data Source: NYC Open Data | ||||
Table Prepared by: Isaac H. Michaels, DrPH
Data Source: NYC Open Data
Back to top
Non-Critical Injury

Map Prepared by: Isaac H. Michaels, DrPH
Data Source: NYC Open Data

Map Prepared by: Isaac H. Michaels, DrPH
EMS Data Source: NYC Open Data
Population Data Source: NYC Open Data
Graphs Prepared by: Isaac H. Michaels, DrPH
Data Source: NYC Open Data
| FDNY EMS Incident Volume, by Borough: Non-Critical Injury |
||||||
| January 01, 2025 to July 01, 2026 | ||||||
| Borough |
Latest Year: 2026
|
All Years: 2025-2026
|
||||
|---|---|---|---|---|---|---|
| Incidents | % | Rate per 1,000 Population | Total Incidents | % | Monthly Trend | |
| Bronx | 22,694 | 24% | 16.4 | 66,266 | 24% | |
| Brooklyn | 25,621 | 27% | 9.9 | 75,649 | 27% | |
| Manhattan | 22,554 | 24% | 14.1 | 67,195 | 24% | |
| Queens | 19,262 | 20% | 8.5 | 58,283 | 21% | |
| Staten Island | 4,051 | 4% | 8.2 | 11,919 | 4% | |
| Table Prepred by: Isaac H. Michaels, DrPH | ||||||
| Data Source: NYC Open Data | ||||||
Table Prepared by: Isaac H. Michaels, DrPH
EMS Data Source: NYC Open Data
Population Data Source: Health Data NY
| FDNY EMS Incident Volume, by Severity Level: Non-Critical Injury |
||||
| January 01, 2025 to July 01, 2026 | ||||
| Final Severity Level |
Latest Year: 2026
|
All Years: 2025-2026
|
||
|---|---|---|---|---|
| Incidents | % | Incidents | % | |
| 1 | 0 | 0% | 0 | 0% |
| 2 | 17 | 0% | 35 | 0% |
| 3 | 161 | 0% | 454 | 0% |
| 4 | 2,735 | 3% | 7,678 | 3% |
| 5 | 91,268 | 97% | 271,145 | 97% |
| 6 | 0 | 0% | 0 | 0% |
| 7 | 1 | 0% | 1 | 0% |
| 8 | 0 | 0% | 0 | 0% |
| Table Prepred by: Isaac H. Michaels, DrPH | ||||
| Data Source: NYC Open Data | ||||
Table Prepared by: Isaac H. Michaels, DrPH
Data Source: NYC Open Data
| FDNY EMS Incident Volume, by Disposition: Non-Critical Injury |
||||
| January 01, 2025 to July 01, 2026 | ||||
| Disposition |
Latest Year: 2026
|
All Years: 2025-2026
|
||
|---|---|---|---|---|
| Incidents | % | Incidents | % | |
| Cancelled | 3,219 | 3% | 8,028 | 3% |
| Condition Corrected | 3,291 | 3% | 10,016 | 4% |
| Patient Gone on Arrival | 5,109 | 5% | 13,854 | 5% |
| Patient Pronounced Dead | 6 | 0% | 25 | 0% |
| Refused Medical Aid | 23,446 | 25% | 74,615 | 27% |
| Transporting Patient | 45,279 | 48% | 139,091 | 50% |
| Treated Not Transported | 3 | 0% | 4 | 0% |
| Treated and Transported | 78 | 0% | 220 | 0% |
| Triaged at Scene No Transport | 6 | 0% | 20 | 0% |
| Unfounded | 8,233 | 9% | 23,004 | 8% |
| NA | 5,512 | 6% | 10,436 | 4% |
| Table Prepred by: Isaac H. Michaels, DrPH | ||||
| Data Source: NYC Open Data | ||||
Table Prepared by: Isaac H. Michaels, DrPH
Data Source: NYC Open Data
Back to top
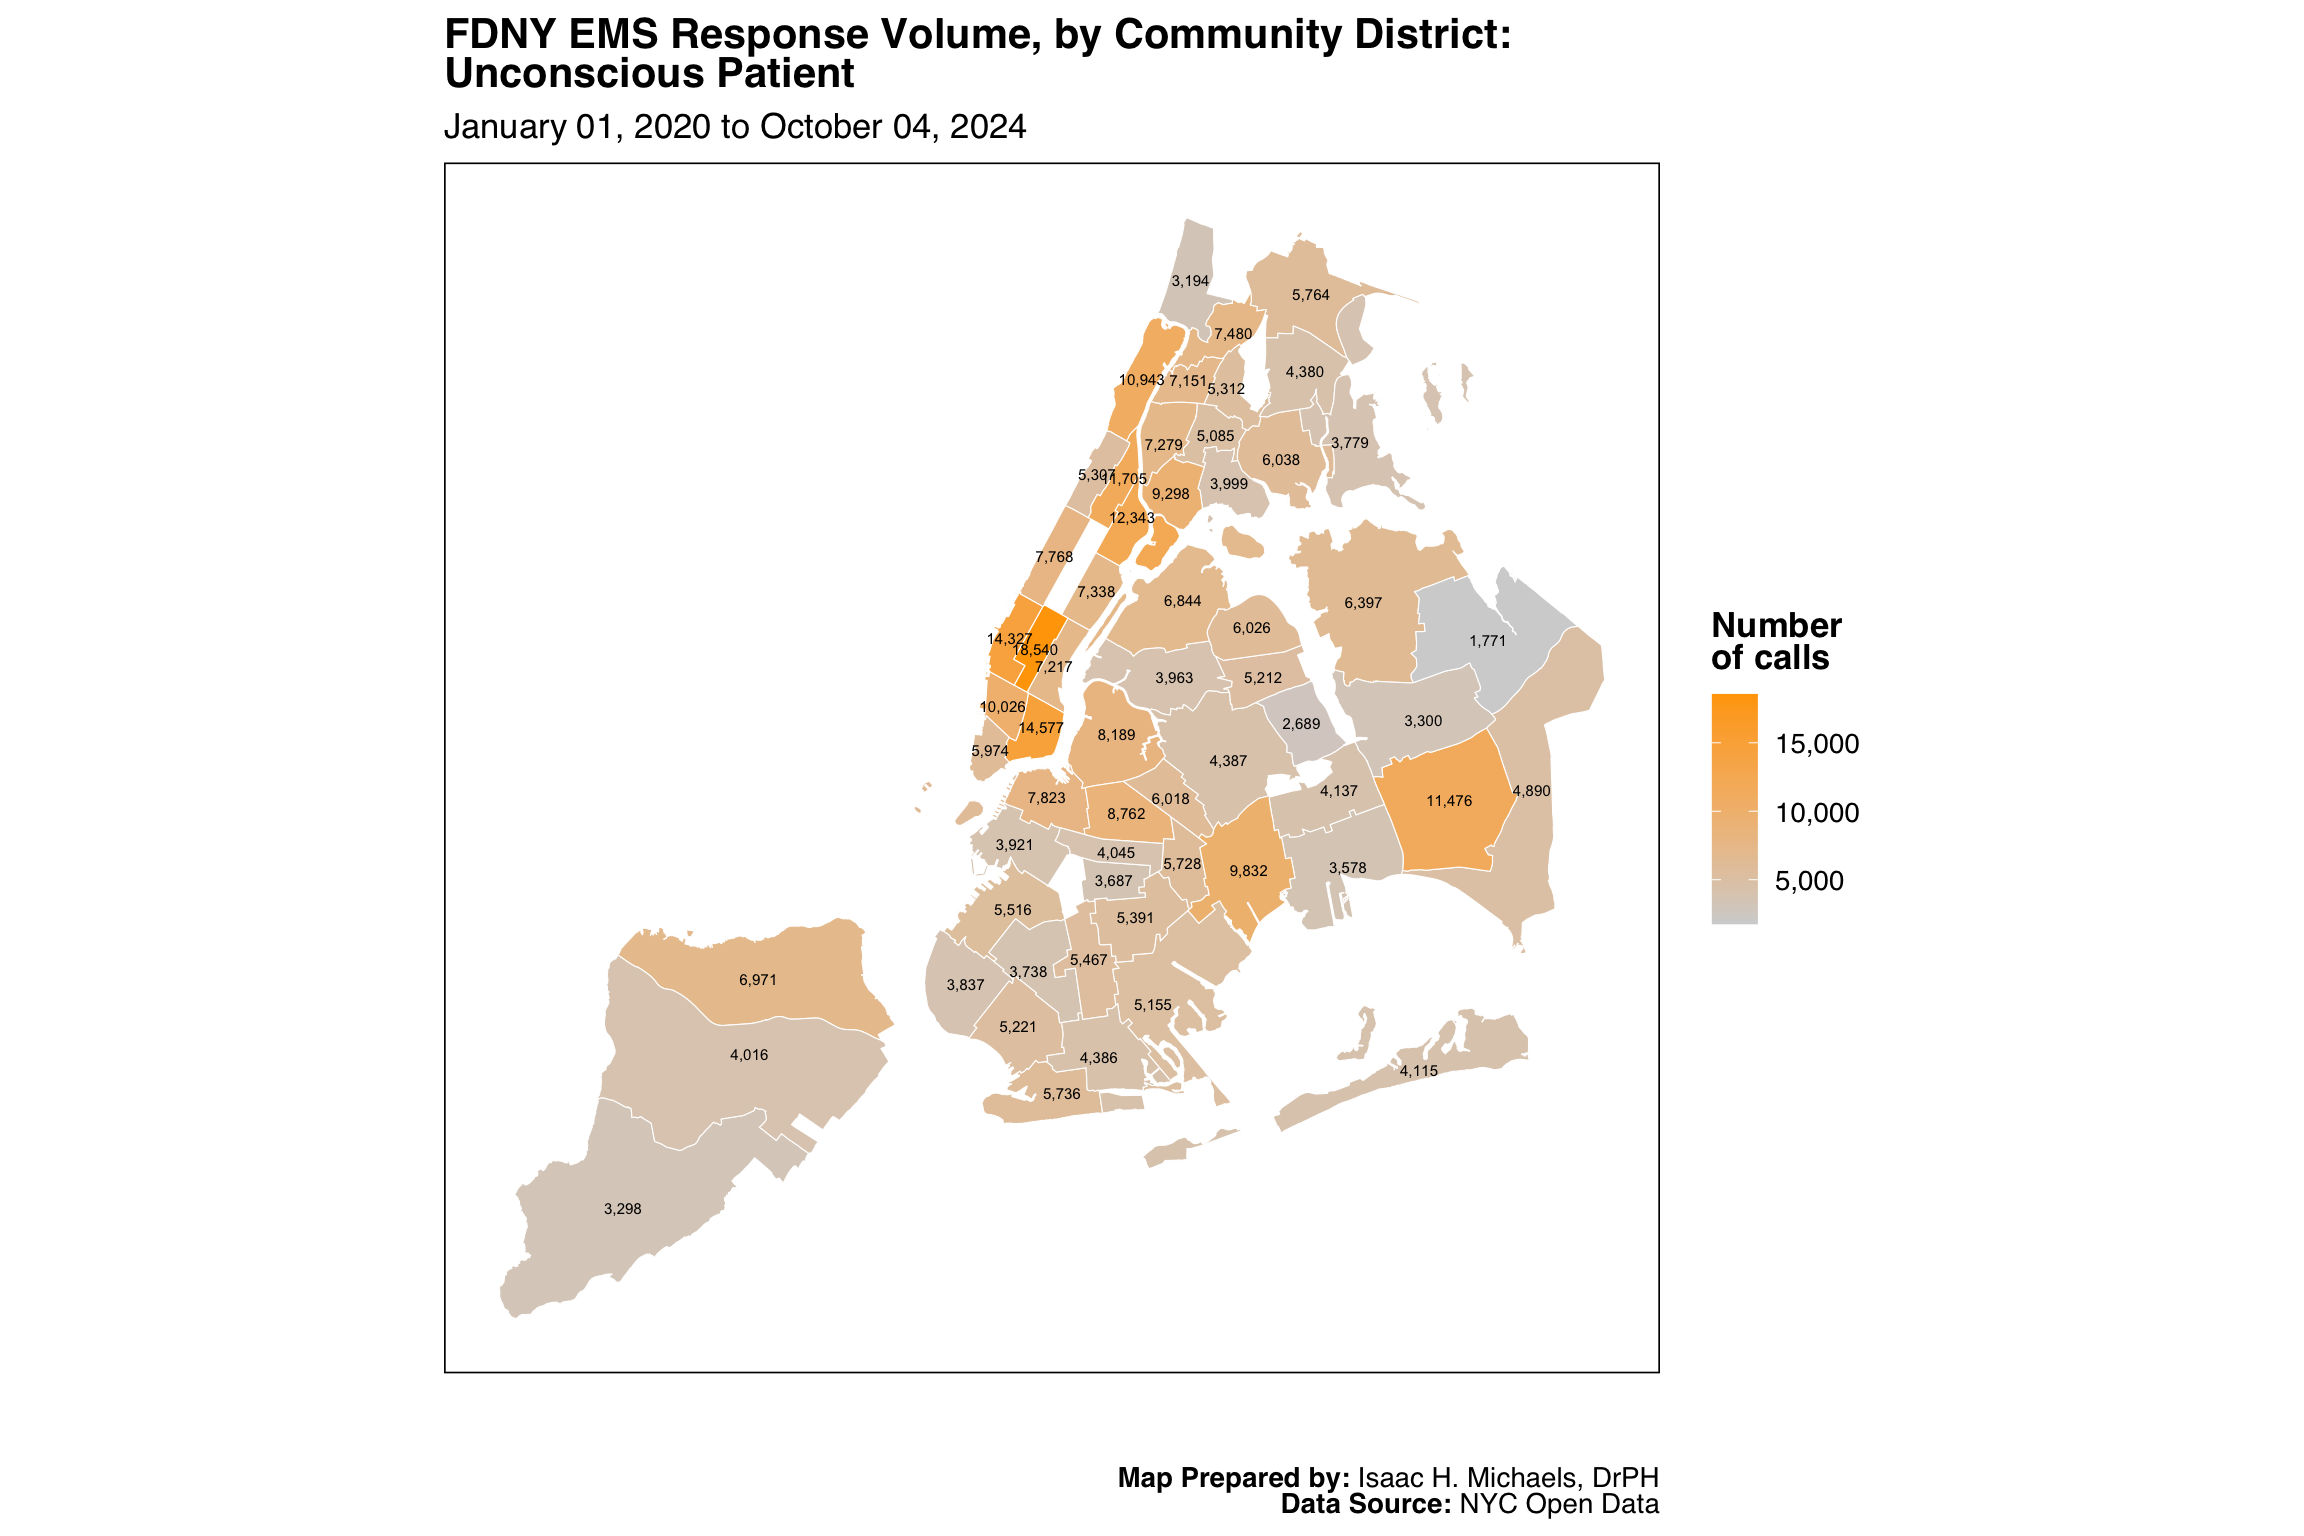
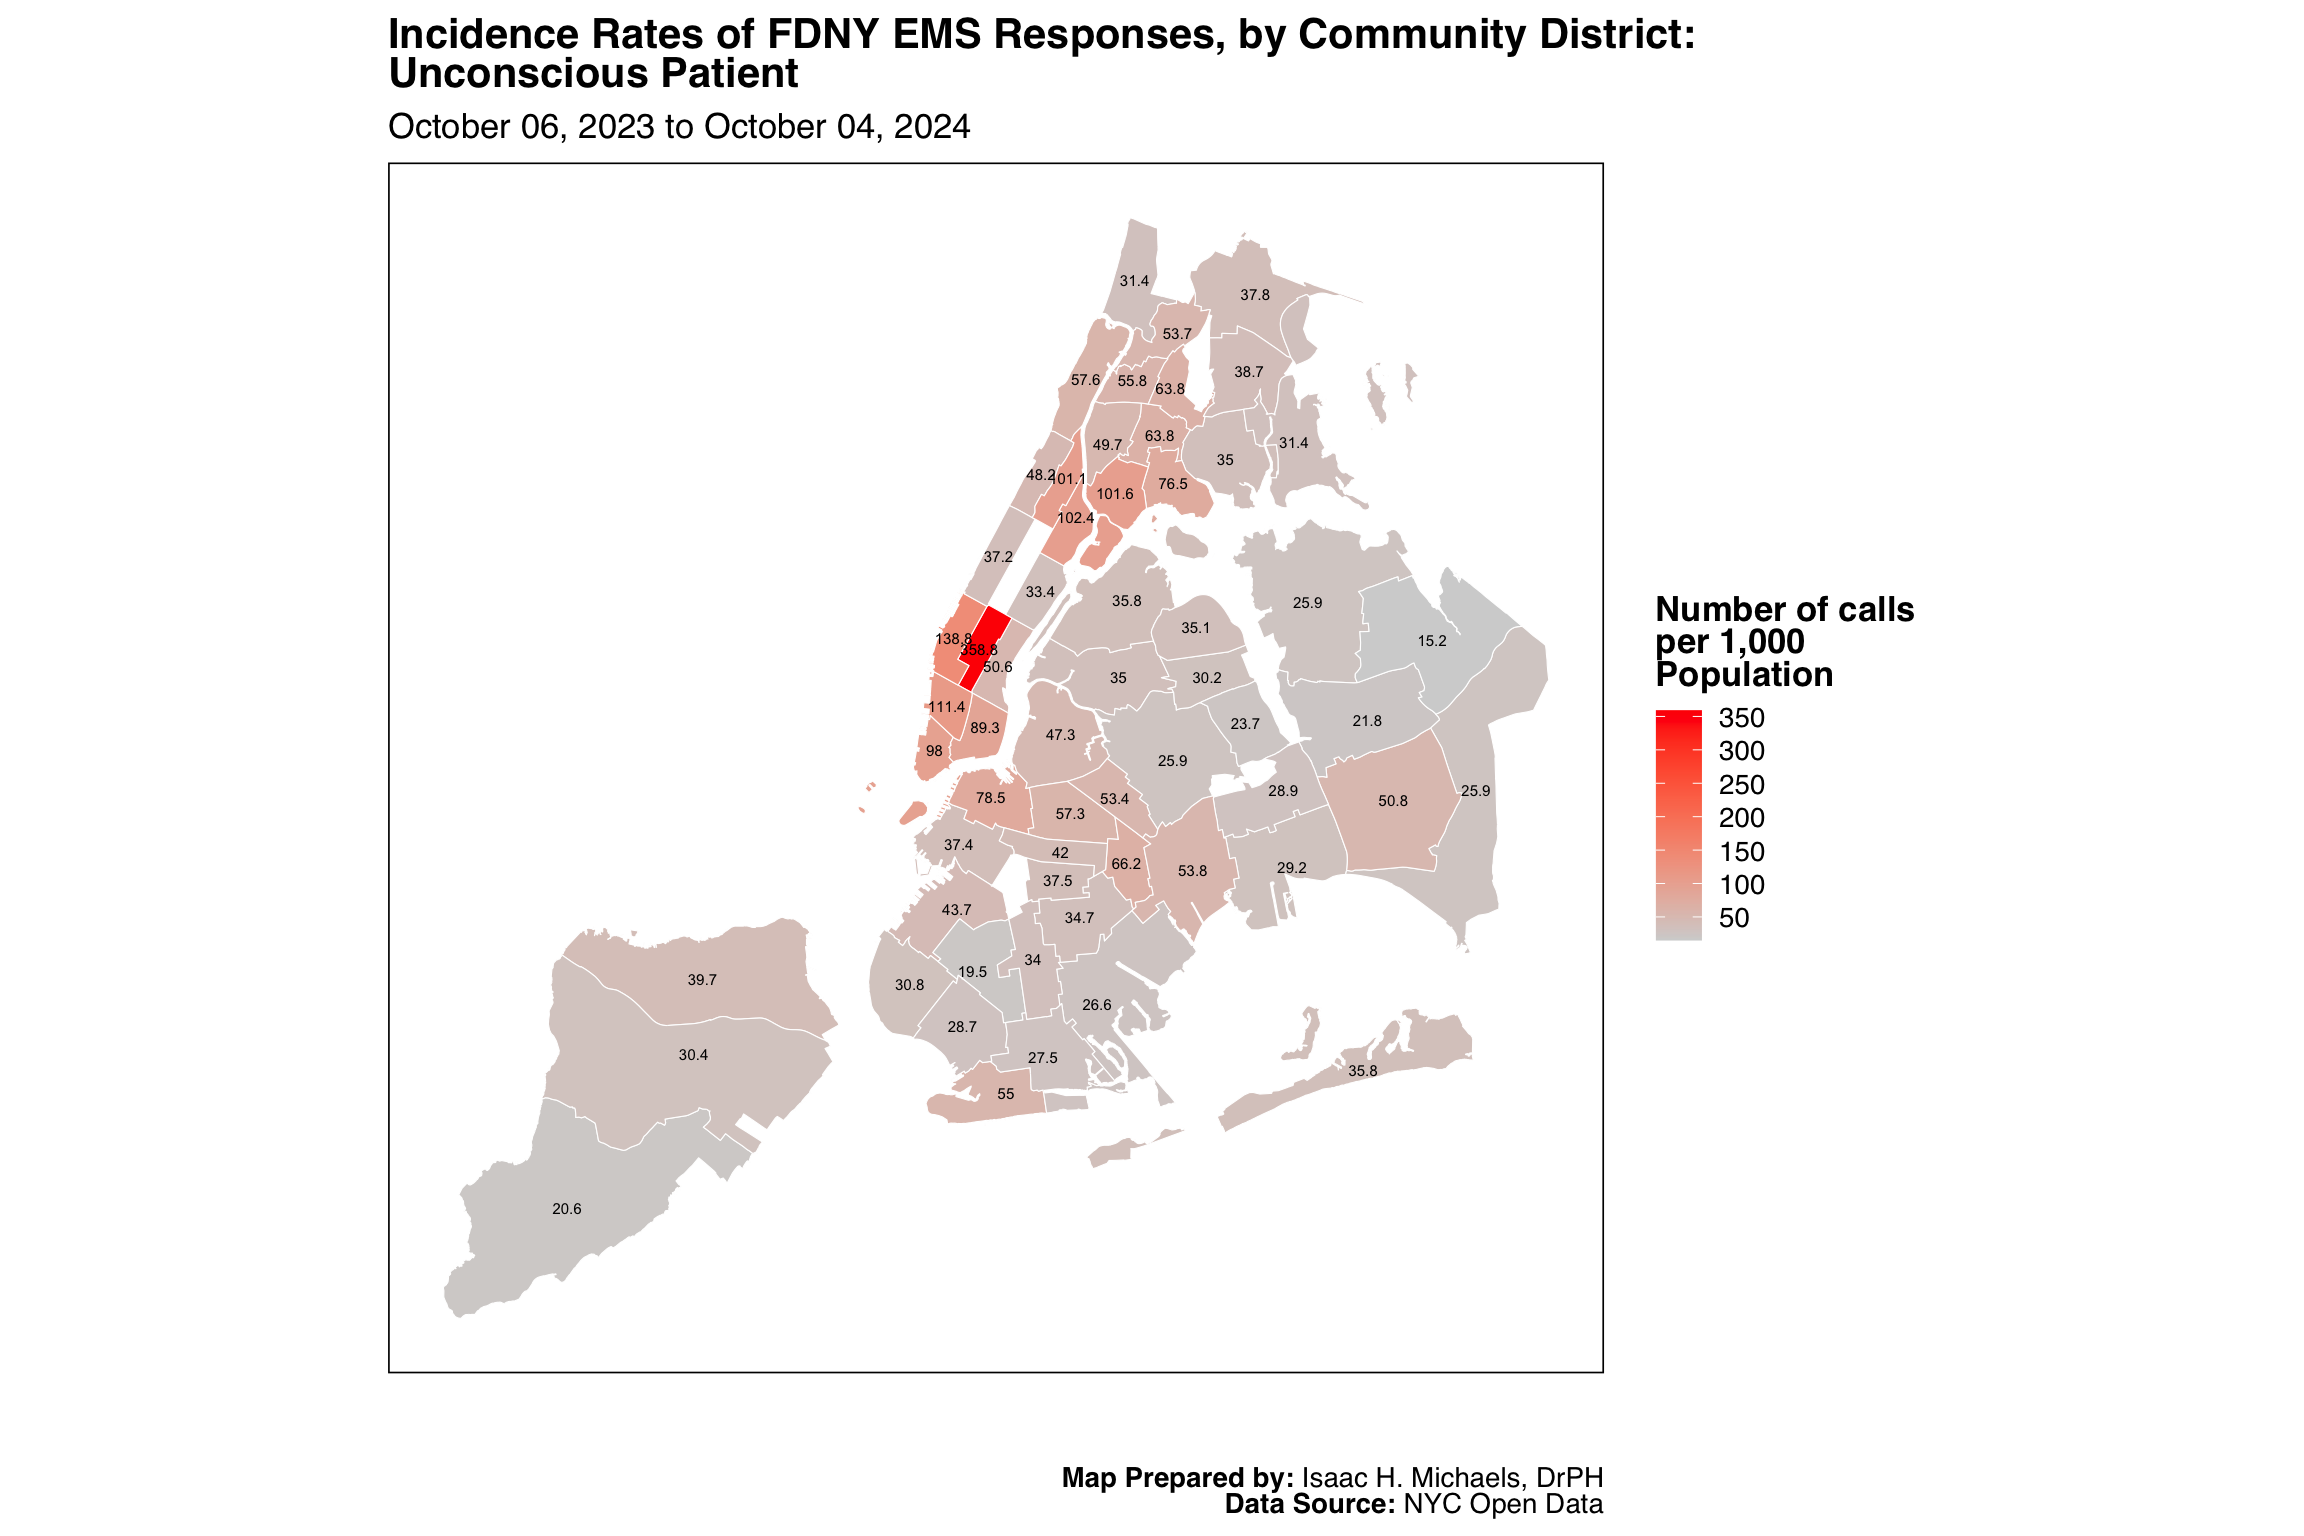
Unconscious Patient
Map Prepared by: Isaac H. Michaels, DrPH
Data Source: NYC Open Data
Map Prepared by: Isaac H. Michaels, DrPH
EMS Data Source: NYC Open Data
Population Data Source: NYC Open Data
Graphs Prepared by: Isaac H. Michaels, DrPH
Data Source: NYC Open Data
| FDNY EMS Incident Volume, by Borough: Unconscious Patient |
||||||
| January 01, 2025 to July 01, 2026 | ||||||
| Borough |
Latest Year: 2026
|
All Years: 2025-2026
|
||||
|---|---|---|---|---|---|---|
| Incidents | % | Rate per 1,000 Population | Total Incidents | % | Monthly Trend | |
| Bronx | 8,827 | 19% | 6.4 | 27,156 | 19% | |
| Brooklyn | 12,841 | 27% | 5.0 | 40,104 | 28% | |
| Manhattan | 14,784 | 31% | 9.3 | 46,032 | 32% | |
| Queens | 8,771 | 19% | 3.8 | 26,494 | 18% | |
| Staten Island | 1,723 | 4% | 3.5 | 5,208 | 4% | |
| Table Prepred by: Isaac H. Michaels, DrPH | ||||||
| Data Source: NYC Open Data | ||||||
Table Prepared by: Isaac H. Michaels, DrPH
EMS Data Source: NYC Open Data
Population Data Source: Health Data NY
| FDNY EMS Incident Volume, by Severity Level: Unconscious Patient |
||||
| January 01, 2025 to July 01, 2026 | ||||
| Final Severity Level |
Latest Year: 2026
|
All Years: 2025-2026
|
||
|---|---|---|---|---|
| Incidents | % | Incidents | % | |
| 1 | 13 | 0% | 46 | 0% |
| 2 | 46,926 | 100% | 144,928 | 100% |
| 3 | 1 | 0% | 5 | 0% |
| 4 | 5 | 0% | 13 | 0% |
| 5 | 0 | 0% | 1 | 0% |
| 6 | 1 | 0% | 1 | 0% |
| 7 | 0 | 0% | 0 | 0% |
| 8 | 0 | 0% | 0 | 0% |
| Table Prepred by: Isaac H. Michaels, DrPH | ||||
| Data Source: NYC Open Data | ||||
Table Prepared by: Isaac H. Michaels, DrPH
Data Source: NYC Open Data
| FDNY EMS Incident Volume, by Disposition: Unconscious Patient |
||||
| January 01, 2025 to July 01, 2026 | ||||
| Disposition |
Latest Year: 2026
|
All Years: 2025-2026
|
||
|---|---|---|---|---|
| Incidents | % | Incidents | % | |
| Cancelled | 1,154 | 2% | 2,955 | 2% |
| Condition Corrected | 471 | 1% | 1,499 | 1% |
| Patient Gone on Arrival | 3,974 | 8% | 11,899 | 8% |
| Patient Pronounced Dead | 459 | 1% | 1,256 | 1% |
| Refused Medical Aid | 9,107 | 19% | 28,009 | 19% |
| Transporting Patient | 24,578 | 52% | 75,750 | 52% |
| Treated and Transported | 43 | 0% | 146 | 0% |
| Triaged at Scene No Transport | 2 | 0% | 10 | 0% |
| Unfounded | 7,040 | 15% | 23,233 | 16% |
| NA | 118 | 0% | 235 | 0% |
| Table Prepred by: Isaac H. Michaels, DrPH | ||||
| Data Source: NYC Open Data | ||||
Table Prepared by: Isaac H. Michaels, DrPH
Data Source: NYC Open Data
Back to top
Hx Drug Or Alcohol Abuse
Map Prepared by: Isaac H. Michaels, DrPH
Data Source: NYC Open Data
Map Prepared by: Isaac H. Michaels, DrPH
EMS Data Source: NYC Open Data
Population Data Source: NYC Open Data
Graphs Prepared by: Isaac H. Michaels, DrPH
Data Source: NYC Open Data
| FDNY EMS Incident Volume, by Borough: Hx Drug Or Alcohol Abuse |
||||||
| January 01, 2025 to July 01, 2026 | ||||||
| Borough |
Latest Year: 2026
|
All Years: 2025-2026
|
||||
|---|---|---|---|---|---|---|
| Incidents | % | Rate per 1,000 Population | Total Incidents | % | Monthly Trend | |
| Bronx | 10,462 | 22% | 7.6 | 32,352 | 22% | |
| Brooklyn | 11,973 | 25% | 4.6 | 36,141 | 25% | |
| Manhattan | 14,167 | 30% | 8.9 | 43,994 | 30% | |
| Queens | 9,398 | 20% | 4.1 | 27,956 | 19% | |
| Staten Island | 1,311 | 3% | 2.7 | 4,105 | 3% | |
| Table Prepred by: Isaac H. Michaels, DrPH | ||||||
| Data Source: NYC Open Data | ||||||
Table Prepared by: Isaac H. Michaels, DrPH
EMS Data Source: NYC Open Data
Population Data Source: Health Data NY
| FDNY EMS Incident Volume, by Severity Level: Hx Drug Or Alcohol Abuse |
||||
| January 01, 2025 to July 01, 2026 | ||||
| Final Severity Level |
Latest Year: 2026
|
All Years: 2025-2026
|
||
|---|---|---|---|---|
| Incidents | % | Incidents | % | |
| 1 | 0 | 0% | 0 | 0% |
| 2 | 3 | 0% | 5 | 0% |
| 3 | 57 | 0% | 183 | 0% |
| 4 | 102 | 0% | 302 | 0% |
| 5 | 47,148 | 100% | 144,057 | 100% |
| 6 | 0 | 0% | 0 | 0% |
| 7 | 1 | 0% | 1 | 0% |
| 8 | 0 | 0% | 0 | 0% |
| Table Prepred by: Isaac H. Michaels, DrPH | ||||
| Data Source: NYC Open Data | ||||
Table Prepared by: Isaac H. Michaels, DrPH
Data Source: NYC Open Data
| FDNY EMS Incident Volume, by Disposition: Hx Drug Or Alcohol Abuse |
||||
| January 01, 2025 to July 01, 2026 | ||||
| Disposition |
Latest Year: 2026
|
All Years: 2025-2026
|
||
|---|---|---|---|---|
| Incidents | % | Incidents | % | |
| Cancelled | 1,755 | 4% | 4,773 | 3% |
| Condition Corrected | 1,278 | 3% | 4,150 | 3% |
| Patient Gone on Arrival | 3,787 | 8% | 11,743 | 8% |
| Patient Pronounced Dead | 2 | 0% | 8 | 0% |
| Refused Medical Aid | 8,022 | 17% | 25,166 | 17% |
| Transporting Patient | 24,648 | 52% | 78,028 | 54% |
| Treated Not Transported | 1 | 0% | 2 | 0% |
| Treated and Transported | 12 | 0% | 48 | 0% |
| Triaged at Scene No Transport | 14 | 0% | 42 | 0% |
| Unfounded | 4,782 | 10% | 14,494 | 10% |
| NA | 3,010 | 6% | 6,094 | 4% |
| Table Prepred by: Isaac H. Michaels, DrPH | ||||
| Data Source: NYC Open Data | ||||
Table Prepared by: Isaac H. Michaels, DrPH
Data Source: NYC Open Data
Back to top
Cardiac Condition
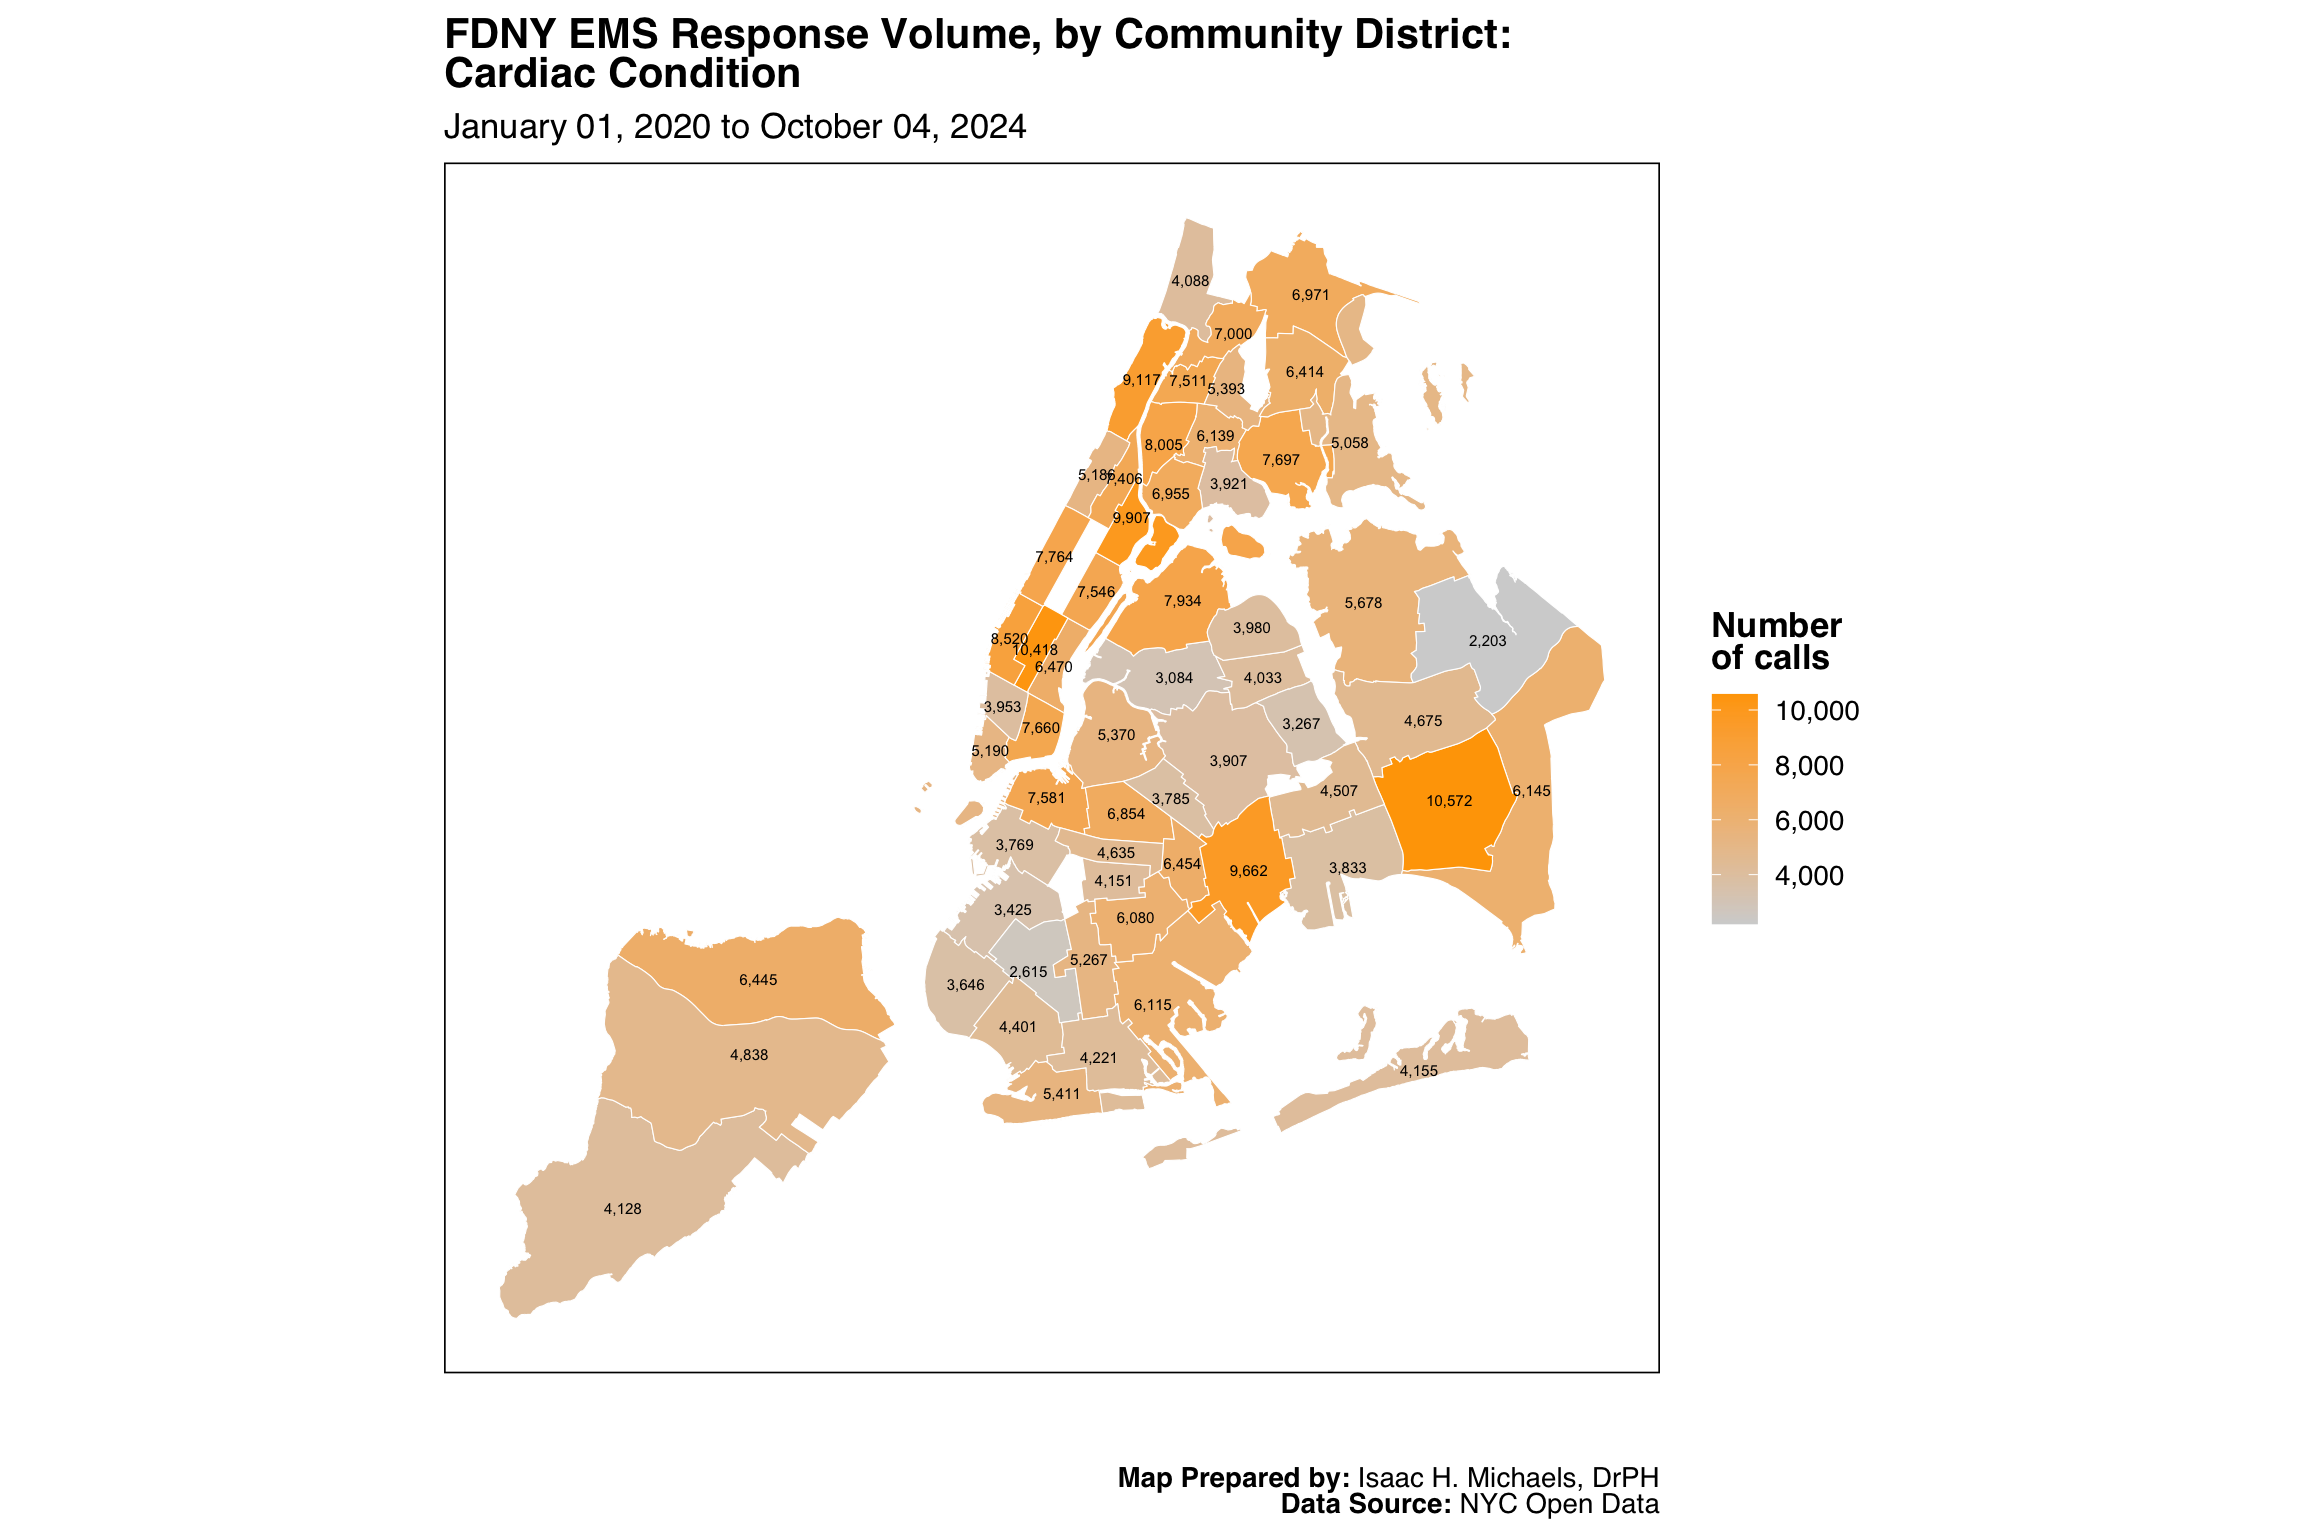
Map Prepared by: Isaac H. Michaels, DrPH
Data Source: NYC Open Data

Map Prepared by: Isaac H. Michaels, DrPH
EMS Data Source: NYC Open Data
Population Data Source: NYC Open Data
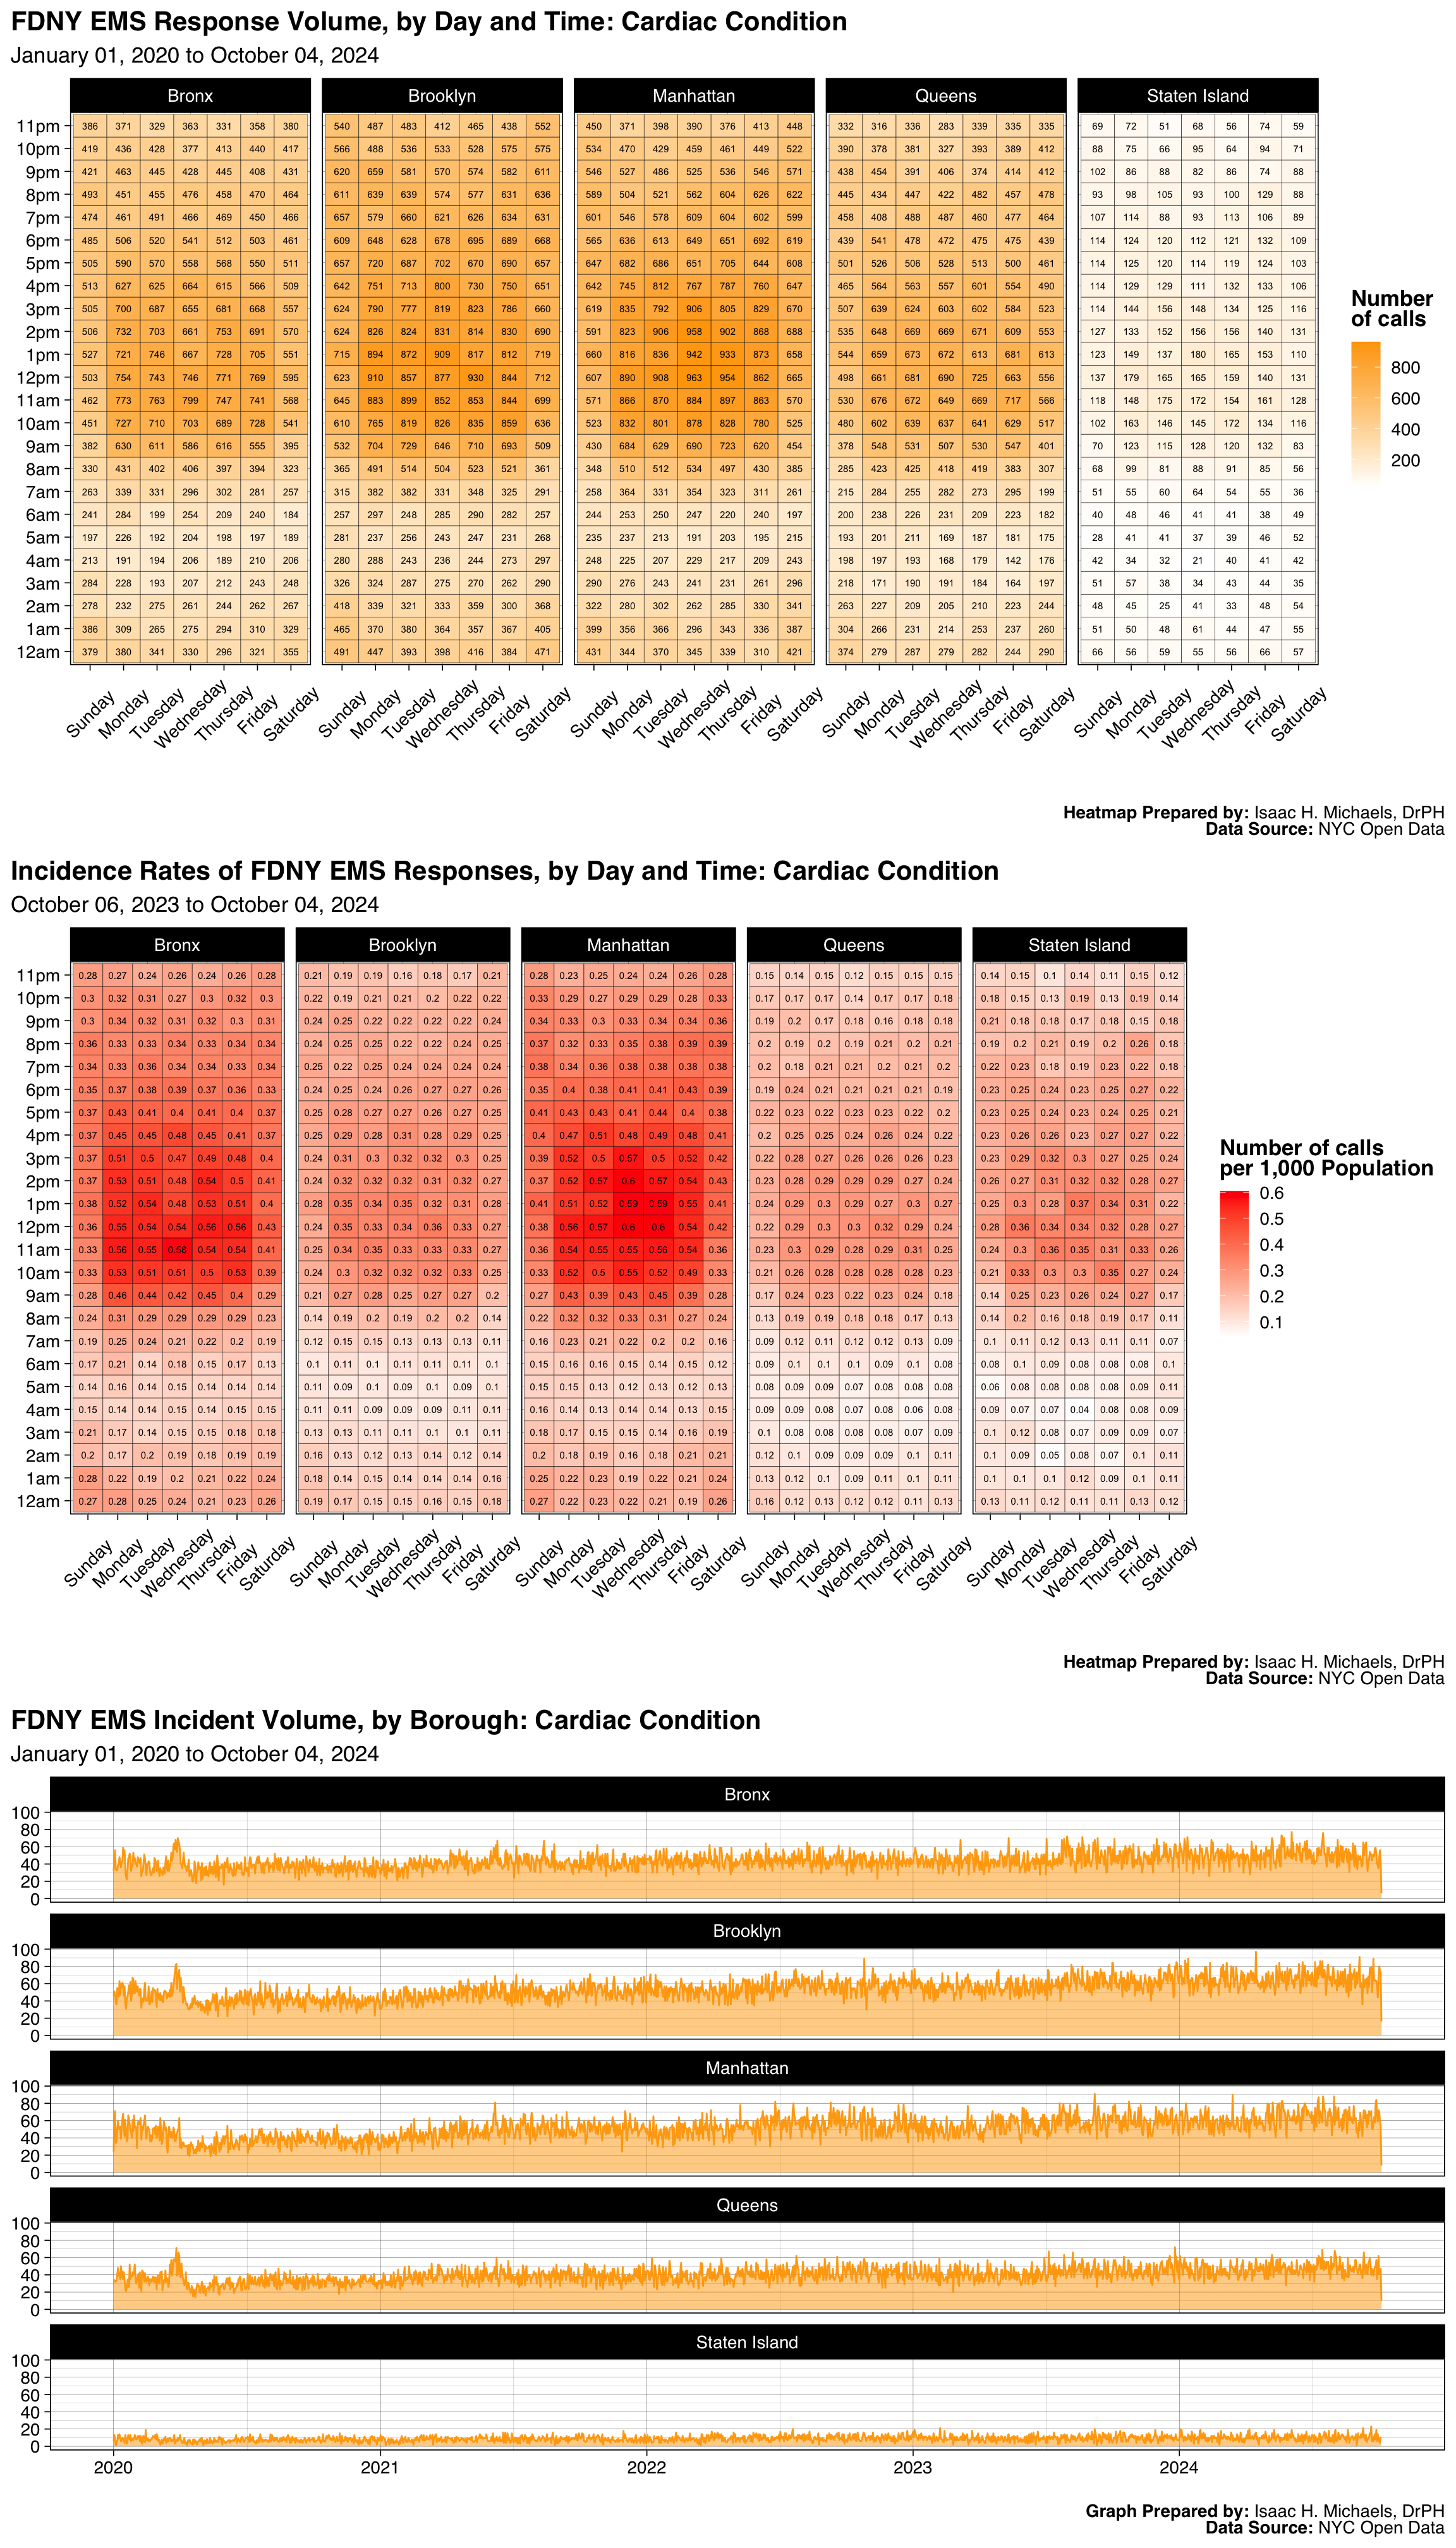
Graphs Prepared by: Isaac H. Michaels, DrPH
Data Source: NYC Open Data
| FDNY EMS Incident Volume, by Borough: Cardiac Condition |
||||||
| January 01, 2025 to July 01, 2026 | ||||||
| Borough |
Latest Year: 2026
|
All Years: 2025-2026
|
||||
|---|---|---|---|---|---|---|
| Incidents | % | Rate per 1,000 Population | Total Incidents | % | Monthly Trend | |
| Bronx | 10,209 | 23% | 7.4 | 28,995 | 22% | |
| Brooklyn | 12,224 | 27% | 4.7 | 36,460 | 27% | |
| Manhattan | 11,479 | 25% | 7.2 | 34,324 | 26% | |
| Queens | 9,321 | 21% | 4.1 | 27,525 | 21% | |
| Staten Island | 2,065 | 5% | 4.2 | 6,134 | 5% | |
| Table Prepred by: Isaac H. Michaels, DrPH | ||||||
| Data Source: NYC Open Data | ||||||
Table Prepared by: Isaac H. Michaels, DrPH
EMS Data Source: NYC Open Data
Population Data Source: Health Data NY
| FDNY EMS Incident Volume, by Severity Level: Cardiac Condition |
||||
| January 01, 2025 to July 01, 2026 | ||||
| Final Severity Level |
Latest Year: 2026
|
All Years: 2025-2026
|
||
|---|---|---|---|---|
| Incidents | % | Incidents | % | |
| 1 | 0 | 0% | 0 | 0% |
| 2 | 5 | 0% | 15 | 0% |
| 3 | 45,286 | 100% | 133,407 | 100% |
| 4 | 6 | 0% | 10 | 0% |
| 5 | 0 | 0% | 1 | 0% |
| 6 | 1 | 0% | 4 | 0% |
| 7 | 0 | 0% | 1 | 0% |
| 8 | 0 | 0% | 0 | 0% |
| Table Prepred by: Isaac H. Michaels, DrPH | ||||
| Data Source: NYC Open Data | ||||
Table Prepared by: Isaac H. Michaels, DrPH
Data Source: NYC Open Data
| FDNY EMS Incident Volume, by Disposition: Cardiac Condition |
||||
| January 01, 2025 to July 01, 2026 | ||||
| Disposition |
Latest Year: 2026
|
All Years: 2025-2026
|
||
|---|---|---|---|---|
| Incidents | % | Incidents | % | |
| Cancelled | 525 | 1% | 1,338 | 1% |
| Condition Corrected | 82 | 0% | 261 | 0% |
| Patient Gone on Arrival | 922 | 2% | 2,569 | 2% |
| Patient Pronounced Dead | 9 | 0% | 19 | 0% |
| Refused Medical Aid | 7,920 | 17% | 24,155 | 18% |
| Transporting Patient | 34,463 | 76% | 101,203 | 76% |
| Treated and Transported | 64 | 0% | 198 | 0% |
| Triaged at Scene No Transport | 8 | 0% | 30 | 0% |
| Unfounded | 1,247 | 3% | 3,528 | 3% |
| NA | 58 | 0% | 137 | 0% |
| Table Prepred by: Isaac H. Michaels, DrPH | ||||
| Data Source: NYC Open Data | ||||
Table Prepared by: Isaac H. Michaels, DrPH
Data Source: NYC Open Data
Back to top
Abdominal Pain

Map Prepared by: Isaac H. Michaels, DrPH
Data Source: NYC Open Data
Map Prepared by: Isaac H. Michaels, DrPH
EMS Data Source: NYC Open Data
Population Data Source: NYC Open Data
Graphs Prepared by: Isaac H. Michaels, DrPH
Data Source: NYC Open Data
| FDNY EMS Incident Volume, by Borough: Abdominal Pain |
||||||
| January 01, 2025 to July 01, 2026 | ||||||
| Borough |
Latest Year: 2026
|
All Years: 2025-2026
|
||||
|---|---|---|---|---|---|---|
| Incidents | % | Rate per 1,000 Population | Total Incidents | % | Monthly Trend | |
| Bronx | 9,442 | 29% | 6.8 | 29,086 | 29% | |
| Brooklyn | 8,893 | 27% | 3.4 | 28,024 | 28% | |
| Manhattan | 6,747 | 20% | 4.2 | 20,268 | 20% | |
| Queens | 6,490 | 20% | 2.8 | 20,200 | 20% | |
| Staten Island | 1,342 | 4% | 2.7 | 4,009 | 4% | |
| Table Prepred by: Isaac H. Michaels, DrPH | ||||||
| Data Source: NYC Open Data | ||||||
Table Prepared by: Isaac H. Michaels, DrPH
EMS Data Source: NYC Open Data
Population Data Source: Health Data NY
| FDNY EMS Incident Volume, by Severity Level: Abdominal Pain |
||||
| January 01, 2025 to July 01, 2026 | ||||
| Final Severity Level |
Latest Year: 2026
|
All Years: 2025-2026
|
||
|---|---|---|---|---|
| Incidents | % | Incidents | % | |
| 1 | 0 | 0% | 0 | 0% |
| 2 | 0 | 0% | 1 | 0% |
| 3 | 18 | 0% | 48 | 0% |
| 4 | 494 | 2% | 1,416 | 1% |
| 5 | 32,402 | 98% | 100,122 | 99% |
| 6 | 0 | 0% | 0 | 0% |
| 7 | 0 | 0% | 0 | 0% |
| 8 | 0 | 0% | 0 | 0% |
| Table Prepred by: Isaac H. Michaels, DrPH | ||||
| Data Source: NYC Open Data | ||||
Table Prepared by: Isaac H. Michaels, DrPH
Data Source: NYC Open Data
| FDNY EMS Incident Volume, by Disposition: Abdominal Pain |
||||
| January 01, 2025 to July 01, 2026 | ||||
| Disposition |
Latest Year: 2026
|
All Years: 2025-2026
|
||
|---|---|---|---|---|
| Incidents | % | Incidents | % | |
| Cancelled | 520 | 2% | 1,218 | 1% |
| Condition Corrected | 114 | 0% | 243 | 0% |
| Patient Gone on Arrival | 1,251 | 4% | 2,966 | 3% |
| Refused Medical Aid | 3,360 | 10% | 10,790 | 11% |
| Transporting Patient | 25,692 | 78% | 81,793 | 81% |
| Treated and Transported | 13 | 0% | 45 | 0% |
| Triaged at Scene No Transport | 5 | 0% | 10 | 0% |
| Unfounded | 1,109 | 3% | 2,936 | 3% |
| NA | 850 | 3% | 1,583 | 2% |
| Table Prepred by: Isaac H. Michaels, DrPH | ||||
| Data Source: NYC Open Data | ||||
Table Prepared by: Isaac H. Michaels, DrPH
Data Source: NYC Open Data
Back to top
Difficult Breather

Map Prepared by: Isaac H. Michaels, DrPH
Data Source: NYC Open Data
Map Prepared by: Isaac H. Michaels, DrPH
EMS Data Source: NYC Open Data
Population Data Source: NYC Open Data
Graphs Prepared by: Isaac H. Michaels, DrPH
Data Source: NYC Open Data
| FDNY EMS Incident Volume, by Borough: Difficult Breather |
||||||
| January 01, 2025 to July 01, 2026 | ||||||
| Borough |
Latest Year: 2026
|
All Years: 2025-2026
|
||||
|---|---|---|---|---|---|---|
| Incidents | % | Rate per 1,000 Population | Total Incidents | % | Monthly Trend | |
| Bronx | 7,968 | 25% | 5.8 | 24,429 | 25% | |
| Brooklyn | 9,489 | 30% | 3.7 | 29,829 | 30% | |
| Manhattan | 6,227 | 20% | 3.9 | 19,533 | 20% | |
| Queens | 6,313 | 20% | 2.8 | 19,343 | 20% | |
| Staten Island | 1,881 | 6% | 3.8 | 5,307 | 5% | |
| Table Prepred by: Isaac H. Michaels, DrPH | ||||||
| Data Source: NYC Open Data | ||||||
Table Prepared by: Isaac H. Michaels, DrPH
EMS Data Source: NYC Open Data
Population Data Source: Health Data NY
| FDNY EMS Incident Volume, by Severity Level: Difficult Breather |
||||
| January 01, 2025 to July 01, 2026 | ||||
| Final Severity Level |
Latest Year: 2026
|
All Years: 2025-2026
|
||
|---|---|---|---|---|
| Incidents | % | Incidents | % | |
| 1 | 0 | 0% | 0 | 0% |
| 2 | 31,863 | 100% | 98,399 | 100% |
| 3 | 5 | 0% | 12 | 0% |
| 4 | 10 | 0% | 30 | 0% |
| 5 | 0 | 0% | 0 | 0% |
| 6 | 0 | 0% | 0 | 0% |
| 7 | 0 | 0% | 0 | 0% |
| 8 | 0 | 0% | 0 | 0% |
| Table Prepred by: Isaac H. Michaels, DrPH | ||||
| Data Source: NYC Open Data | ||||
Table Prepared by: Isaac H. Michaels, DrPH
Data Source: NYC Open Data
| FDNY EMS Incident Volume, by Disposition: Difficult Breather |
||||
| January 01, 2025 to July 01, 2026 | ||||
| Disposition |
Latest Year: 2026
|
All Years: 2025-2026
|
||
|---|---|---|---|---|
| Incidents | % | Incidents | % | |
| Cancelled | 303 | 1% | 765 | 1% |
| Condition Corrected | 165 | 1% | 513 | 1% |
| Patient Gone on Arrival | 446 | 1% | 1,233 | 1% |
| Patient Pronounced Dead | 20 | 0% | 71 | 0% |
| Refused Medical Aid | 4,688 | 15% | 15,325 | 16% |
| Transporting Patient | 25,289 | 79% | 77,636 | 79% |
| Treated and Transported | 68 | 0% | 180 | 0% |
| Triaged at Scene No Transport | 3 | 0% | 8 | 0% |
| Unfounded | 854 | 3% | 2,616 | 3% |
| NA | 42 | 0% | 94 | 0% |
| Table Prepred by: Isaac H. Michaels, DrPH | ||||
| Data Source: NYC Open Data | ||||
Table Prepared by: Isaac H. Michaels, DrPH
Data Source: NYC Open Data
Back to top
Major Injury
Map Prepared by: Isaac H. Michaels, DrPH
Data Source: NYC Open Data
Map Prepared by: Isaac H. Michaels, DrPH
EMS Data Source: NYC Open Data
Population Data Source: NYC Open Data
Graphs Prepared by: Isaac H. Michaels, DrPH
Data Source: NYC Open Data
| FDNY EMS Incident Volume, by Borough: Major Injury |
||||||
| January 01, 2025 to July 01, 2026 | ||||||
| Borough |
Latest Year: 2026
|
All Years: 2025-2026
|
||||
|---|---|---|---|---|---|---|
| Incidents | % | Rate per 1,000 Population | Total Incidents | % | Monthly Trend | |
| Bronx | 6,684 | 22% | 4.8 | 19,943 | 21% | |
| Brooklyn | 8,037 | 26% | 3.1 | 25,510 | 26% | |
| Manhattan | 8,000 | 26% | 5.0 | 25,049 | 26% | |
| Queens | 6,708 | 22% | 2.9 | 21,186 | 22% | |
| Staten Island | 1,592 | 5% | 3.2 | 4,928 | 5% | |
| Table Prepred by: Isaac H. Michaels, DrPH | ||||||
| Data Source: NYC Open Data | ||||||
Table Prepared by: Isaac H. Michaels, DrPH
EMS Data Source: NYC Open Data
Population Data Source: Health Data NY
| FDNY EMS Incident Volume, by Severity Level: Major Injury |
||||
| January 01, 2025 to July 01, 2026 | ||||
| Final Severity Level |
Latest Year: 2026
|
All Years: 2025-2026
|
||
|---|---|---|---|---|
| Incidents | % | Incidents | % | |
| 1 | 0 | 0% | 1 | 0% |
| 2 | 1 | 0% | 7 | 0% |
| 3 | 30,946 | 100% | 96,398 | 100% |
| 4 | 73 | 0% | 206 | 0% |
| 5 | 1 | 0% | 3 | 0% |
| 6 | 0 | 0% | 0 | 0% |
| 7 | 0 | 0% | 1 | 0% |
| 8 | 0 | 0% | 0 | 0% |
| Table Prepred by: Isaac H. Michaels, DrPH | ||||
| Data Source: NYC Open Data | ||||
Table Prepared by: Isaac H. Michaels, DrPH
Data Source: NYC Open Data
| FDNY EMS Incident Volume, by Disposition: Major Injury |
||||
| January 01, 2025 to July 01, 2026 | ||||
| Disposition |
Latest Year: 2026
|
All Years: 2025-2026
|
||
|---|---|---|---|---|
| Incidents | % | Incidents | % | |
| Cancelled | 376 | 1% | 1,071 | 1% |
| Condition Corrected | 301 | 1% | 994 | 1% |
| Patient Gone on Arrival | 861 | 3% | 2,688 | 3% |
| Patient Pronounced Dead | 5 | 0% | 11 | 0% |
| Refused Medical Aid | 4,372 | 14% | 14,529 | 15% |
| Transporting Patient | 23,865 | 77% | 73,596 | 76% |
| Treated and Transported | 51 | 0% | 124 | 0% |
| Unfounded | 1,131 | 4% | 3,458 | 4% |
| NA | 59 | 0% | 142 | 0% |
| Table Prepred by: Isaac H. Michaels, DrPH | ||||
| Data Source: NYC Open Data | ||||
Table Prepared by: Isaac H. Michaels, DrPH
Data Source: NYC Open Data
Back to top
Auto Acc W/Injuries

Map Prepared by: Isaac H. Michaels, DrPH
Data Source: NYC Open Data

Map Prepared by: Isaac H. Michaels, DrPH
EMS Data Source: NYC Open Data
Population Data Source: NYC Open Data
Graphs Prepared by: Isaac H. Michaels, DrPH
Data Source: NYC Open Data
| FDNY EMS Incident Volume, by Borough: Auto Acc W/Injuries |
||||||
| January 01, 2025 to July 01, 2026 | ||||||
| Borough |
Latest Year: 2026
|
All Years: 2025-2026
|
||||
|---|---|---|---|---|---|---|
| Incidents | % | Rate per 1,000 Population | Total Incidents | % | Monthly Trend | |
| Bronx | 4,485 | 22% | 3.2 | 12,827 | 21% | |
| Brooklyn | 5,558 | 27% | 2.1 | 16,857 | 28% | |
| Manhattan | 2,404 | 12% | 1.5 | 7,133 | 12% | |
| Queens | 6,776 | 33% | 3.0 | 20,327 | 34% | |
| Staten Island | 1,115 | 5% | 2.3 | 3,473 | 6% | |
| NA | 1 | 0% | NA | 2 | 0% | |
| Table Prepred by: Isaac H. Michaels, DrPH | ||||||
| Data Source: NYC Open Data | ||||||
Table Prepared by: Isaac H. Michaels, DrPH
EMS Data Source: NYC Open Data
Population Data Source: Health Data NY
| FDNY EMS Incident Volume, by Severity Level: Auto Acc W/Injuries |
||||
| January 01, 2025 to July 01, 2026 | ||||
| Final Severity Level |
Latest Year: 2026
|
All Years: 2025-2026
|
||
|---|---|---|---|---|
| Incidents | % | Incidents | % | |
| 1 | 0 | 0% | 0 | 0% |
| 2 | 14 | 0% | 26 | 0% |
| 3 | 13 | 0% | 49 | 0% |
| 4 | 364 | 2% | 1,200 | 2% |
| 5 | 19,948 | 98% | 59,344 | 98% |
| 6 | 0 | 0% | 0 | 0% |
| 7 | 0 | 0% | 0 | 0% |
| 8 | 0 | 0% | 0 | 0% |
| Table Prepred by: Isaac H. Michaels, DrPH | ||||
| Data Source: NYC Open Data | ||||
Table Prepared by: Isaac H. Michaels, DrPH
Data Source: NYC Open Data
| FDNY EMS Incident Volume, by Disposition: Auto Acc W/Injuries |
||||
| January 01, 2025 to July 01, 2026 | ||||
| Disposition |
Latest Year: 2026
|
All Years: 2025-2026
|
||
|---|---|---|---|---|
| Incidents | % | Incidents | % | |
| Cancelled | 1,063 | 5% | 2,671 | 4% |
| Condition Corrected | 2,692 | 13% | 8,289 | 14% |
| Patient Gone on Arrival | 907 | 4% | 2,493 | 4% |
| Patient Pronounced Dead | 1 | 0% | 1 | 0% |
| Refused Medical Aid | 4,745 | 23% | 15,908 | 26% |
| Transporting Patient | 7,096 | 35% | 22,022 | 36% |
| Treated and Transported | 11 | 0% | 40 | 0% |
| Triaged at Scene No Transport | 1 | 0% | 2 | 0% |
| Unfounded | 2,484 | 12% | 6,804 | 11% |
| NA | 1,339 | 7% | 2,389 | 4% |
| Table Prepred by: Isaac H. Michaels, DrPH | ||||
| Data Source: NYC Open Data | ||||
Table Prepared by: Isaac H. Michaels, DrPH
Data Source: NYC Open Data
Back to top
Psychiatric Patient
Map Prepared by: Isaac H. Michaels, DrPH
Data Source: NYC Open Data
Map Prepared by: Isaac H. Michaels, DrPH
EMS Data Source: NYC Open Data
Population Data Source: NYC Open Data
Graphs Prepared by: Isaac H. Michaels, DrPH
Data Source: NYC Open Data
| FDNY EMS Incident Volume, by Borough: Psychiatric Patient |
||||||
| January 01, 2025 to July 01, 2026 | ||||||
| Borough |
Latest Year: 2026
|
All Years: 2025-2026
|
||||
|---|---|---|---|---|---|---|
| Incidents | % | Rate per 1,000 Population | Total Incidents | % | Monthly Trend | |
| Bronx | 4,270 | 22% | 3.1 | 12,713 | 22% | |
| Brooklyn | 4,629 | 24% | 1.8 | 13,330 | 24% | |
| Manhattan | 5,938 | 31% | 3.7 | 17,839 | 32% | |
| Queens | 3,645 | 19% | 1.6 | 10,526 | 19% | |
| Staten Island | 707 | 4% | 1.4 | 2,125 | 4% | |
| Table Prepred by: Isaac H. Michaels, DrPH | ||||||
| Data Source: NYC Open Data | ||||||
Table Prepared by: Isaac H. Michaels, DrPH
EMS Data Source: NYC Open Data
Population Data Source: Health Data NY
| FDNY EMS Incident Volume, by Severity Level: Psychiatric Patient |
||||
| January 01, 2025 to July 01, 2026 | ||||
| Final Severity Level |
Latest Year: 2026
|
All Years: 2025-2026
|
||
|---|---|---|---|---|
| Incidents | % | Incidents | % | |
| 1 | 0 | 0% | 0 | 0% |
| 2 | 1 | 0% | 4 | 0% |
| 3 | 62 | 0% | 183 | 0% |
| 4 | 6 | 0% | 28 | 0% |
| 5 | 1 | 0% | 4 | 0% |
| 6 | 1 | 0% | 1 | 0% |
| 7 | 19,118 | 100% | 56,313 | 100% |
| 8 | 0 | 0% | 0 | 0% |
| Table Prepred by: Isaac H. Michaels, DrPH | ||||
| Data Source: NYC Open Data | ||||
Table Prepared by: Isaac H. Michaels, DrPH
Data Source: NYC Open Data
| FDNY EMS Incident Volume, by Disposition: Psychiatric Patient |
||||
| January 01, 2025 to July 01, 2026 | ||||
| Disposition |
Latest Year: 2026
|
All Years: 2025-2026
|
||
|---|---|---|---|---|
| Incidents | % | Incidents | % | |
| Cancelled | 1,455 | 8% | 4,198 | 7% |
| Condition Corrected | 880 | 5% | 2,946 | 5% |
| Patient Gone on Arrival | 1,130 | 6% | 3,510 | 6% |
| Patient Pronounced Dead | 5 | 0% | 13 | 0% |
| Refused Medical Aid | 1,187 | 6% | 3,823 | 7% |
| Transporting Patient | 7,529 | 39% | 25,319 | 45% |
| Treated and Transported | 9 | 0% | 39 | 0% |
| Triaged at Scene No Transport | 2 | 0% | 5 | 0% |
| Unfounded | 1,976 | 10% | 6,103 | 11% |
| NA | 5,016 | 26% | 10,577 | 19% |
| Table Prepred by: Isaac H. Michaels, DrPH | ||||
| Data Source: NYC Open Data | ||||
Table Prepared by: Isaac H. Michaels, DrPH
Data Source: NYC Open Data
Back to top
Altered Mental Status
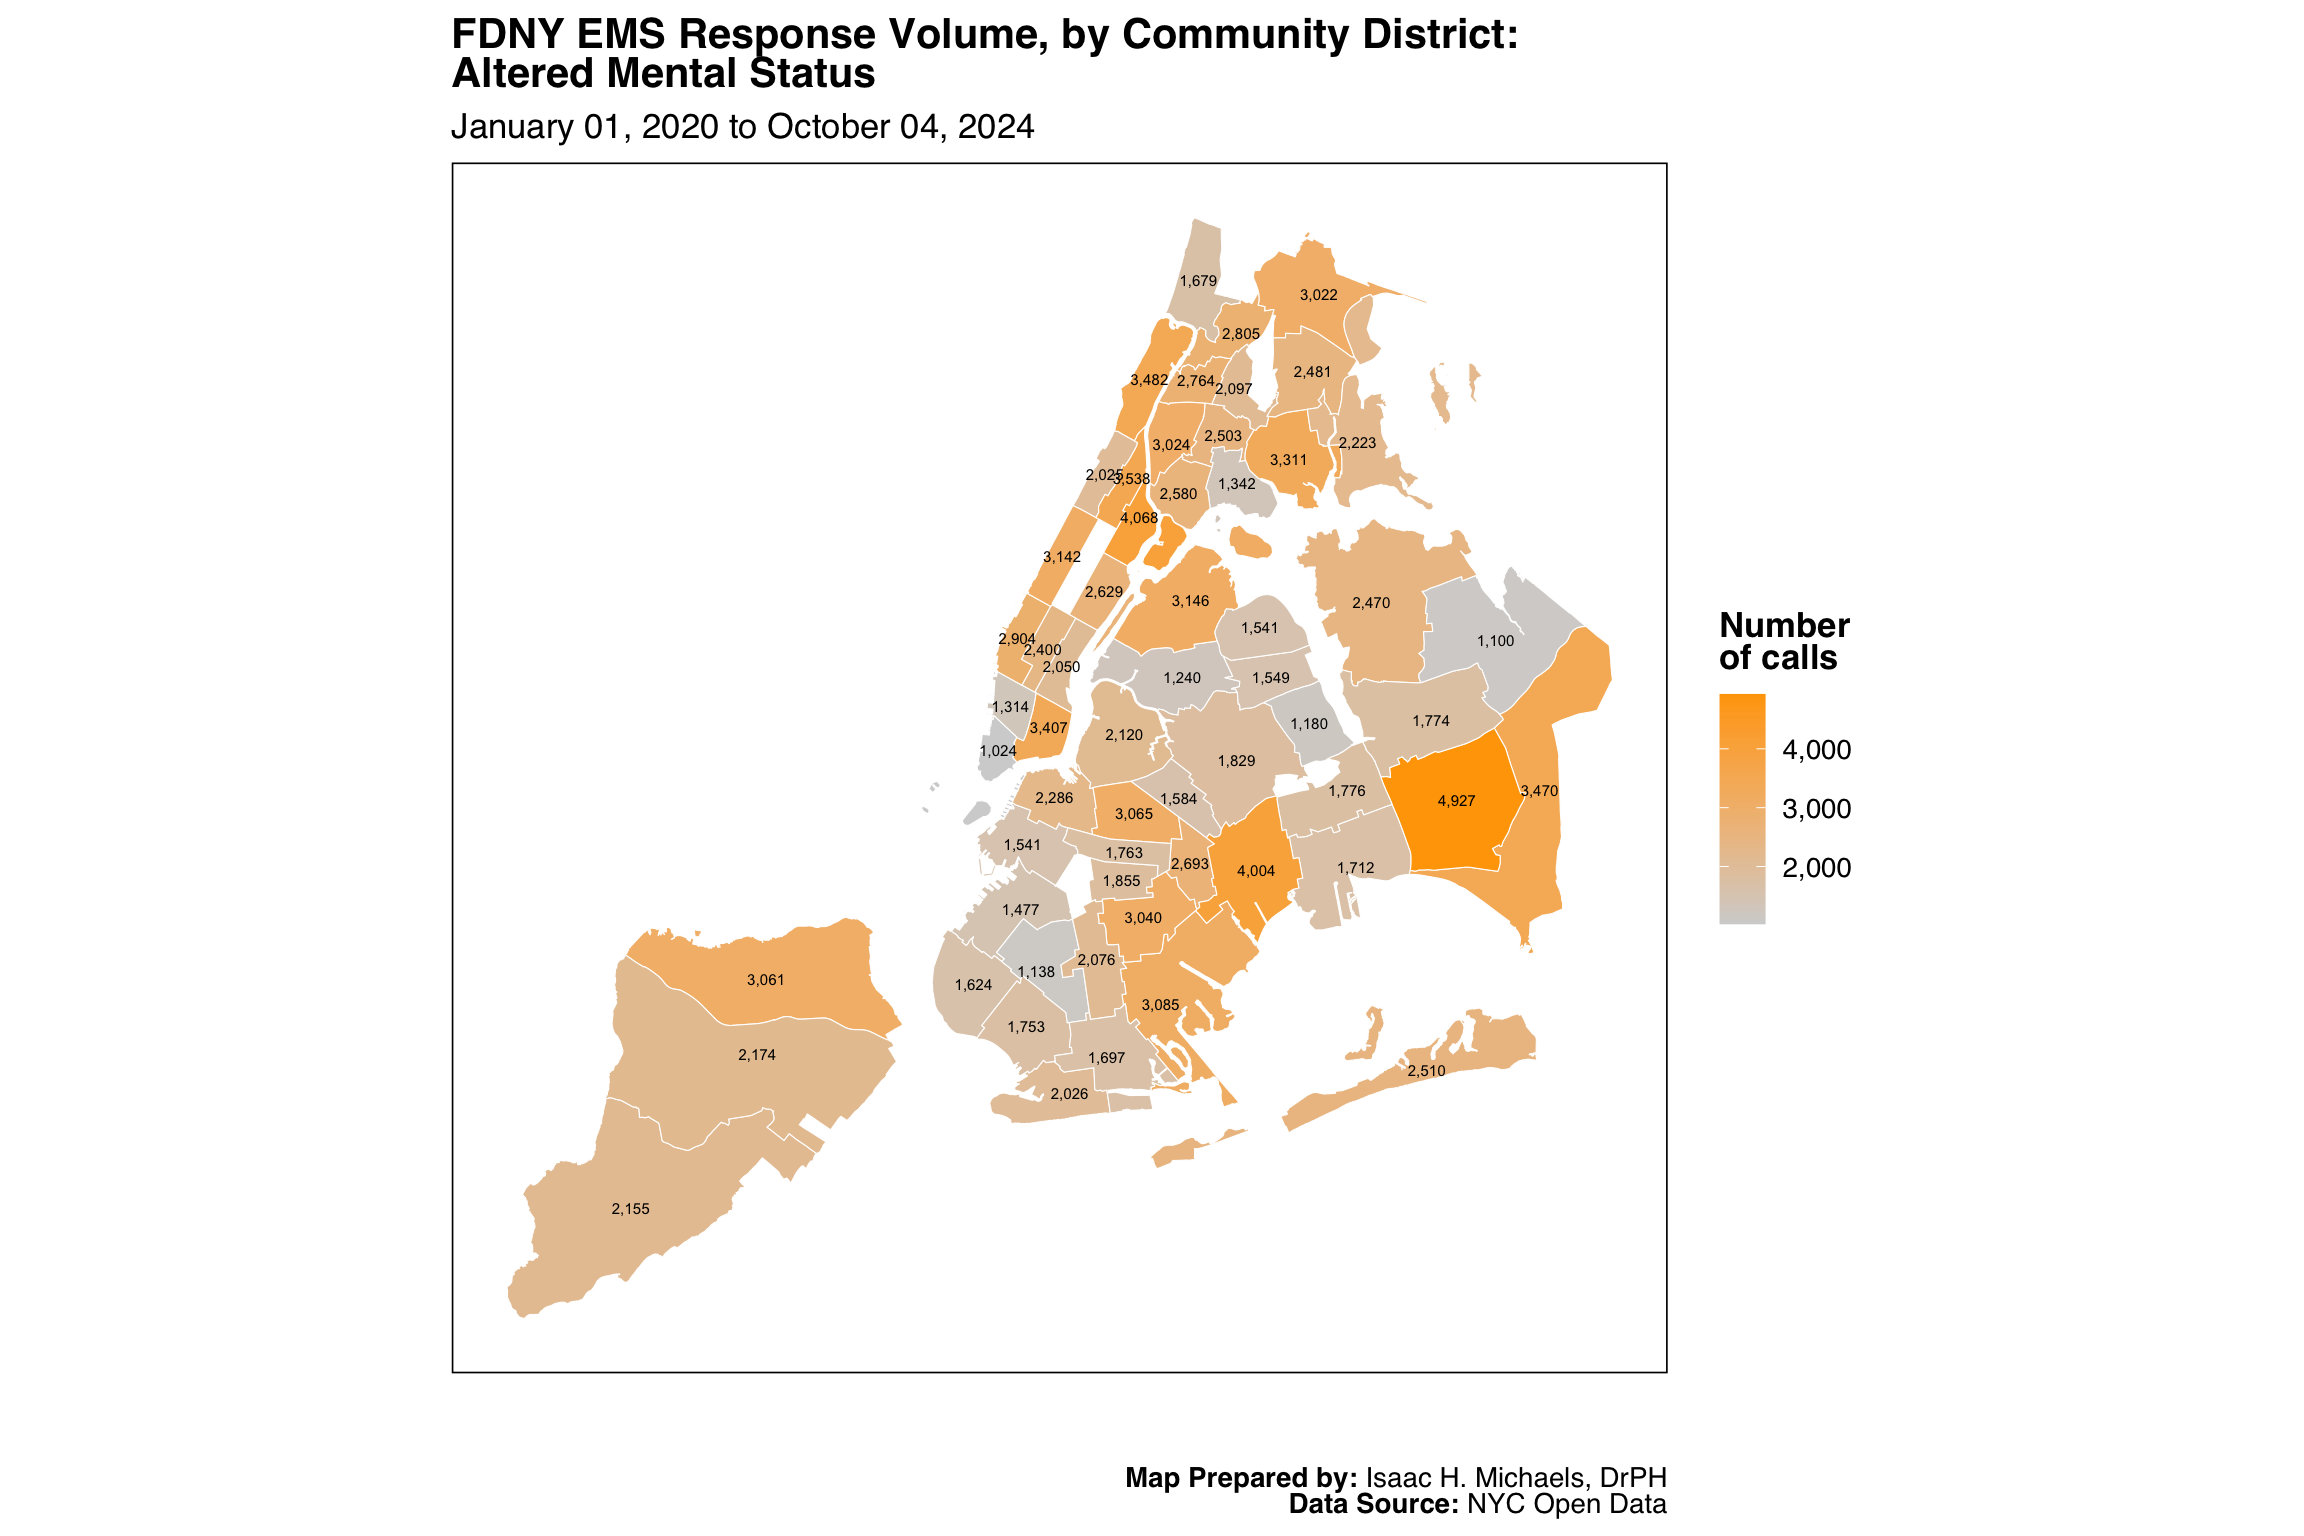
Map Prepared by: Isaac H. Michaels, DrPH
Data Source: NYC Open Data
Map Prepared by: Isaac H. Michaels, DrPH
EMS Data Source: NYC Open Data
Population Data Source: NYC Open Data
Graphs Prepared by: Isaac H. Michaels, DrPH
Data Source: NYC Open Data
| FDNY EMS Incident Volume, by Borough: Altered Mental Status |
||||||
| January 01, 2025 to July 01, 2026 | ||||||
| Borough |
Latest Year: 2026
|
All Years: 2025-2026
|
||||
|---|---|---|---|---|---|---|
| Incidents | % | Rate per 1,000 Population | Total Incidents | % | Monthly Trend | |
| Bronx | 3,567 | 22% | 2.6 | 10,952 | 22% | |
| Brooklyn | 4,711 | 28% | 1.8 | 14,543 | 29% | |
| Manhattan | 3,659 | 22% | 2.3 | 11,318 | 22% | |
| Queens | 3,627 | 22% | 1.6 | 10,936 | 22% | |
| Staten Island | 967 | 6% | 2.0 | 2,906 | 6% | |
| Table Prepred by: Isaac H. Michaels, DrPH | ||||||
| Data Source: NYC Open Data | ||||||
Table Prepared by: Isaac H. Michaels, DrPH
EMS Data Source: NYC Open Data
Population Data Source: Health Data NY
| FDNY EMS Incident Volume, by Severity Level: Altered Mental Status |
||||
| January 01, 2025 to July 01, 2026 | ||||
| Final Severity Level |
Latest Year: 2026
|
All Years: 2025-2026
|
||
|---|---|---|---|---|
| Incidents | % | Incidents | % | |
| 1 | 0 | 0% | 0 | 0% |
| 2 | 5 | 0% | 8 | 0% |
| 3 | 16,525 | 100% | 50,643 | 100% |
| 4 | 1 | 0% | 4 | 0% |
| 5 | 0 | 0% | 0 | 0% |
| 6 | 0 | 0% | 0 | 0% |
| 7 | 0 | 0% | 0 | 0% |
| 8 | 0 | 0% | 0 | 0% |
| Table Prepred by: Isaac H. Michaels, DrPH | ||||
| Data Source: NYC Open Data | ||||
Table Prepared by: Isaac H. Michaels, DrPH
Data Source: NYC Open Data
| FDNY EMS Incident Volume, by Disposition: Altered Mental Status |
||||
| January 01, 2025 to July 01, 2026 | ||||
| Disposition |
Latest Year: 2026
|
All Years: 2025-2026
|
||
|---|---|---|---|---|
| Incidents | % | Incidents | % | |
| Cancelled | 149 | 1% | 407 | 1% |
| Condition Corrected | 89 | 1% | 297 | 1% |
| Patient Gone on Arrival | 350 | 2% | 973 | 2% |
| Patient Pronounced Dead | 4 | 0% | 25 | 0% |
| Refused Medical Aid | 2,574 | 16% | 8,210 | 16% |
| Transporting Patient | 12,784 | 77% | 38,990 | 77% |
| Treated Not Transported | 1 | 0% | 1 | 0% |
| Treated and Transported | 29 | 0% | 87 | 0% |
| Triaged at Scene No Transport | 1 | 0% | 6 | 0% |
| Unfounded | 540 | 3% | 1,630 | 3% |
| NA | 10 | 0% | 29 | 0% |
| Table Prepred by: Isaac H. Michaels, DrPH | ||||
| Data Source: NYC Open Data | ||||
Table Prepared by: Isaac H. Michaels, DrPH
Data Source: NYC Open Data
Back to top
Status Epilepticus
Map Prepared by: Isaac H. Michaels, DrPH
Data Source: NYC Open Data
Map Prepared by: Isaac H. Michaels, DrPH
EMS Data Source: NYC Open Data
Population Data Source: NYC Open Data
Graphs Prepared by: Isaac H. Michaels, DrPH
Data Source: NYC Open Data
| FDNY EMS Incident Volume, by Borough: Status Epilepticus |
||||||
| January 01, 2025 to July 01, 2026 | ||||||
| Borough |
Latest Year: 2026
|
All Years: 2025-2026
|
||||
|---|---|---|---|---|---|---|
| Incidents | % | Rate per 1,000 Population | Total Incidents | % | Monthly Trend | |
| Bronx | 3,493 | 24% | 2.5 | 10,512 | 24% | |
| Brooklyn | 4,136 | 29% | 1.6 | 12,708 | 29% | |
| Manhattan | 3,435 | 24% | 2.2 | 10,505 | 24% | |
| Queens | 2,768 | 19% | 1.2 | 8,506 | 19% | |
| Staten Island | 572 | 4% | 1.2 | 1,718 | 4% | |
| Table Prepred by: Isaac H. Michaels, DrPH | ||||||
| Data Source: NYC Open Data | ||||||
Table Prepared by: Isaac H. Michaels, DrPH
EMS Data Source: NYC Open Data
Population Data Source: Health Data NY
| FDNY EMS Incident Volume, by Severity Level: Status Epilepticus |
||||
| January 01, 2025 to July 01, 2026 | ||||
| Final Severity Level |
Latest Year: 2026
|
All Years: 2025-2026
|
||
|---|---|---|---|---|
| Incidents | % | Incidents | % | |
| 1 | 7 | 0% | 24 | 0% |
| 2 | 14,396 | 100% | 43,921 | 100% |
| 3 | 0 | 0% | 3 | 0% |
| 4 | 1 | 0% | 1 | 0% |
| 5 | 0 | 0% | 0 | 0% |
| 6 | 0 | 0% | 0 | 0% |
| 7 | 0 | 0% | 0 | 0% |
| 8 | 0 | 0% | 0 | 0% |
| Table Prepred by: Isaac H. Michaels, DrPH | ||||
| Data Source: NYC Open Data | ||||
Table Prepared by: Isaac H. Michaels, DrPH
Data Source: NYC Open Data
| FDNY EMS Incident Volume, by Disposition: Status Epilepticus |
||||
| January 01, 2025 to July 01, 2026 | ||||
| Disposition |
Latest Year: 2026
|
All Years: 2025-2026
|
||
|---|---|---|---|---|
| Incidents | % | Incidents | % | |
| Cancelled | 196 | 1% | 510 | 1% |
| Condition Corrected | 30 | 0% | 79 | 0% |
| Patient Gone on Arrival | 463 | 3% | 1,275 | 3% |
| Patient Pronounced Dead | 2 | 0% | 7 | 0% |
| Refused Medical Aid | 1,870 | 13% | 6,070 | 14% |
| Transporting Patient | 11,263 | 78% | 34,262 | 78% |
| Treated and Transported | 22 | 0% | 63 | 0% |
| Triaged at Scene No Transport | 1 | 0% | 3 | 0% |
| Unfounded | 529 | 4% | 1,615 | 4% |
| NA | 28 | 0% | 65 | 0% |
| Table Prepred by: Isaac H. Michaels, DrPH | ||||
| Data Source: NYC Open Data | ||||
Table Prepared by: Isaac H. Michaels, DrPH
Data Source: NYC Open Data
Back to top
Minor Illness

Map Prepared by: Isaac H. Michaels, DrPH
Data Source: NYC Open Data

Map Prepared by: Isaac H. Michaels, DrPH
EMS Data Source: NYC Open Data
Population Data Source: NYC Open Data
Graphs Prepared by: Isaac H. Michaels, DrPH
Data Source: NYC Open Data
| FDNY EMS Incident Volume, by Borough: Minor Illness |
||||||
| January 01, 2025 to July 01, 2026 | ||||||
| Borough |
Latest Year: 2026
|
All Years: 2025-2026
|
||||
|---|---|---|---|---|---|---|
| Incidents | % | Rate per 1,000 Population | Total Incidents | % | Monthly Trend | |
| Bronx | 2,430 | 24% | 1.8 | 9,099 | 23% | |
| Brooklyn | 3,027 | 30% | 1.2 | 11,934 | 30% | |
| Manhattan | 2,444 | 24% | 1.5 | 9,474 | 24% | |
| Queens | 1,800 | 18% | 0.8 | 7,234 | 18% | |
| Staten Island | 417 | 4% | 0.8 | 1,497 | 4% | |
| Table Prepred by: Isaac H. Michaels, DrPH | ||||||
| Data Source: NYC Open Data | ||||||
Table Prepared by: Isaac H. Michaels, DrPH
EMS Data Source: NYC Open Data
Population Data Source: Health Data NY
| FDNY EMS Incident Volume, by Severity Level: Minor Illness |
||||
| January 01, 2025 to July 01, 2026 | ||||
| Final Severity Level |
Latest Year: 2026
|
All Years: 2025-2026
|
||
|---|---|---|---|---|
| Incidents | % | Incidents | % | |
| 1 | 0 | 0% | 0 | 0% |
| 2 | 0 | 0% | 1 | 0% |
| 3 | 6 | 0% | 27 | 0% |
| 4 | 128 | 1% | 149 | 0% |
| 5 | 1 | 0% | 1 | 0% |
| 6 | 1 | 0% | 3 | 0% |
| 7 | 9,981 | 99% | 39,056 | 100% |
| 8 | 1 | 0% | 1 | 0% |
| Table Prepred by: Isaac H. Michaels, DrPH | ||||
| Data Source: NYC Open Data | ||||
Table Prepared by: Isaac H. Michaels, DrPH
Data Source: NYC Open Data
| FDNY EMS Incident Volume, by Disposition: Minor Illness |
||||
| January 01, 2025 to July 01, 2026 | ||||
| Disposition |
Latest Year: 2026
|
All Years: 2025-2026
|
||
|---|---|---|---|---|
| Incidents | % | Incidents | % | |
| Cancelled | 196 | 2% | 775 | 2% |
| Condition Corrected | 68 | 1% | 245 | 1% |
| Patient Gone on Arrival | 390 | 4% | 1,566 | 4% |
| Refused Medical Aid | 1,977 | 20% | 7,275 | 19% |
| Transporting Patient | 6,301 | 62% | 25,130 | 64% |
| Treated and Transported | 4 | 0% | 24 | 0% |
| Unfounded | 502 | 5% | 2,169 | 6% |
| NA | 680 | 7% | 2,042 | 5% |
| Table Prepred by: Isaac H. Michaels, DrPH | ||||
| Data Source: NYC Open Data | ||||
Table Prepared by: Isaac H. Michaels, DrPH
Data Source: NYC Open Data
Back to top
Cardiac Arrest
Map Prepared by: Isaac H. Michaels, DrPH
Data Source: NYC Open Data
Map Prepared by: Isaac H. Michaels, DrPH
EMS Data Source: NYC Open Data
Population Data Source: NYC Open Data
Graphs Prepared by: Isaac H. Michaels, DrPH
Data Source: NYC Open Data
| FDNY EMS Incident Volume, by Borough: Cardiac Arrest |
||||||
| January 01, 2025 to July 01, 2026 | ||||||
| Borough |
Latest Year: 2026
|
All Years: 2025-2026
|
||||
|---|---|---|---|---|---|---|
| Incidents | % | Rate per 1,000 Population | Total Incidents | % | Monthly Trend | |
| Bronx | 2,616 | 21% | 1.9 | 8,074 | 21% | |
| Brooklyn | 3,523 | 29% | 1.4 | 11,049 | 29% | |
| Manhattan | 2,485 | 20% | 1.6 | 7,884 | 21% | |
| Queens | 2,956 | 24% | 1.3 | 8,836 | 23% | |
| Staten Island | 667 | 5% | 1.4 | 2,050 | 5% | |
| Table Prepred by: Isaac H. Michaels, DrPH | ||||||
| Data Source: NYC Open Data | ||||||
Table Prepared by: Isaac H. Michaels, DrPH
EMS Data Source: NYC Open Data
Population Data Source: Health Data NY
| FDNY EMS Incident Volume, by Severity Level: Cardiac Arrest |
||||
| January 01, 2025 to July 01, 2026 | ||||
| Final Severity Level |
Latest Year: 2026
|
All Years: 2025-2026
|
||
|---|---|---|---|---|
| Incidents | % | Incidents | % | |
| 1 | 12,243 | 100% | 37,886 | 100% |
| 2 | 2 | 0% | 3 | 0% |
| 3 | 1 | 0% | 2 | 0% |
| 4 | 1 | 0% | 1 | 0% |
| 5 | 0 | 0% | 1 | 0% |
| 6 | 0 | 0% | 0 | 0% |
| 7 | 0 | 0% | 0 | 0% |
| 8 | 0 | 0% | 0 | 0% |
| Table Prepred by: Isaac H. Michaels, DrPH | ||||
| Data Source: NYC Open Data | ||||
Table Prepared by: Isaac H. Michaels, DrPH
Data Source: NYC Open Data
| FDNY EMS Incident Volume, by Disposition: Cardiac Arrest |
||||
| January 01, 2025 to July 01, 2026 | ||||
| Disposition |
Latest Year: 2026
|
All Years: 2025-2026
|
||
|---|---|---|---|---|
| Incidents | % | Incidents | % | |
| Cancelled | 242 | 2% | 692 | 2% |
| Condition Corrected | 39 | 0% | 108 | 0% |
| Patient Gone on Arrival | 240 | 2% | 772 | 2% |
| Patient Pronounced Dead | 5,192 | 42% | 15,693 | 41% |
| Refused Medical Aid | 557 | 5% | 1,763 | 5% |
| Transporting Patient | 5,180 | 42% | 16,237 | 43% |
| Treated and Transported | 15 | 0% | 51 | 0% |
| Unfounded | 762 | 6% | 2,522 | 7% |
| NA | 20 | 0% | 55 | 0% |
| Table Prepred by: Isaac H. Michaels, DrPH | ||||
| Data Source: NYC Open Data | ||||
Table Prepared by: Isaac H. Michaels, DrPH
Data Source: NYC Open Data
Back to top
Pedestrian Struck
Map Prepared by: Isaac H. Michaels, DrPH
Data Source: NYC Open Data

Map Prepared by: Isaac H. Michaels, DrPH
EMS Data Source: NYC Open Data
Population Data Source: NYC Open Data
Graphs Prepared by: Isaac H. Michaels, DrPH
Data Source: NYC Open Data
| FDNY EMS Incident Volume, by Borough: Pedestrian Struck |
||||||
| January 01, 2025 to July 01, 2026 | ||||||
| Borough |
Latest Year: 2026
|
All Years: 2025-2026
|
||||
|---|---|---|---|---|---|---|
| Incidents | % | Rate per 1,000 Population | Total Incidents | % | Monthly Trend | |
| Bronx | 1,852 | 17% | 1.3 | 5,783 | 17% | |
| Brooklyn | 3,501 | 33% | 1.4 | 11,655 | 33% | |
| Manhattan | 2,454 | 23% | 1.5 | 7,997 | 23% | |
| Queens | 2,628 | 24% | 1.2 | 8,565 | 24% | |
| Staten Island | 314 | 3% | 0.6 | 1,033 | 3% | |
| Table Prepred by: Isaac H. Michaels, DrPH | ||||||
| Data Source: NYC Open Data | ||||||
Table Prepared by: Isaac H. Michaels, DrPH
EMS Data Source: NYC Open Data
Population Data Source: Health Data NY
| FDNY EMS Incident Volume, by Severity Level: Pedestrian Struck |
||||
| January 01, 2025 to July 01, 2026 | ||||
| Final Severity Level |
Latest Year: 2026
|
All Years: 2025-2026
|
||
|---|---|---|---|---|
| Incidents | % | Incidents | % | |
| 1 | 1 | 0% | 1 | 0% |
| 2 | 1 | 0% | 3 | 0% |
| 3 | 10,744 | 100% | 35,020 | 100% |
| 4 | 3 | 0% | 8 | 0% |
| 5 | 0 | 0% | 1 | 0% |
| 6 | 0 | 0% | 0 | 0% |
| 7 | 0 | 0% | 0 | 0% |
| 8 | 0 | 0% | 0 | 0% |
| Table Prepred by: Isaac H. Michaels, DrPH | ||||
| Data Source: NYC Open Data | ||||
Table Prepared by: Isaac H. Michaels, DrPH
Data Source: NYC Open Data
| FDNY EMS Incident Volume, by Disposition: Pedestrian Struck |
||||
| January 01, 2025 to July 01, 2026 | ||||
| Disposition |
Latest Year: 2026
|
All Years: 2025-2026
|
||
|---|---|---|---|---|
| Incidents | % | Incidents | % | |
| Cancelled | 423 | 4% | 1,253 | 4% |
| Condition Corrected | 434 | 4% | 1,405 | 4% |
| Patient Gone on Arrival | 589 | 5% | 1,894 | 5% |
| Refused Medical Aid | 2,346 | 22% | 7,643 | 22% |
| Transporting Patient | 6,172 | 57% | 20,254 | 58% |
| Treated and Transported | 16 | 0% | 49 | 0% |
| Triaged at Scene No Transport | 1 | 0% | 1 | 0% |
| Unfounded | 723 | 7% | 2,407 | 7% |
| NA | 45 | 0% | 124 | 0% |
| Table Prepred by: Isaac H. Michaels, DrPH | ||||
| Data Source: NYC Open Data | ||||
Table Prepared by: Isaac H. Michaels, DrPH
Data Source: NYC Open Data
Back to top
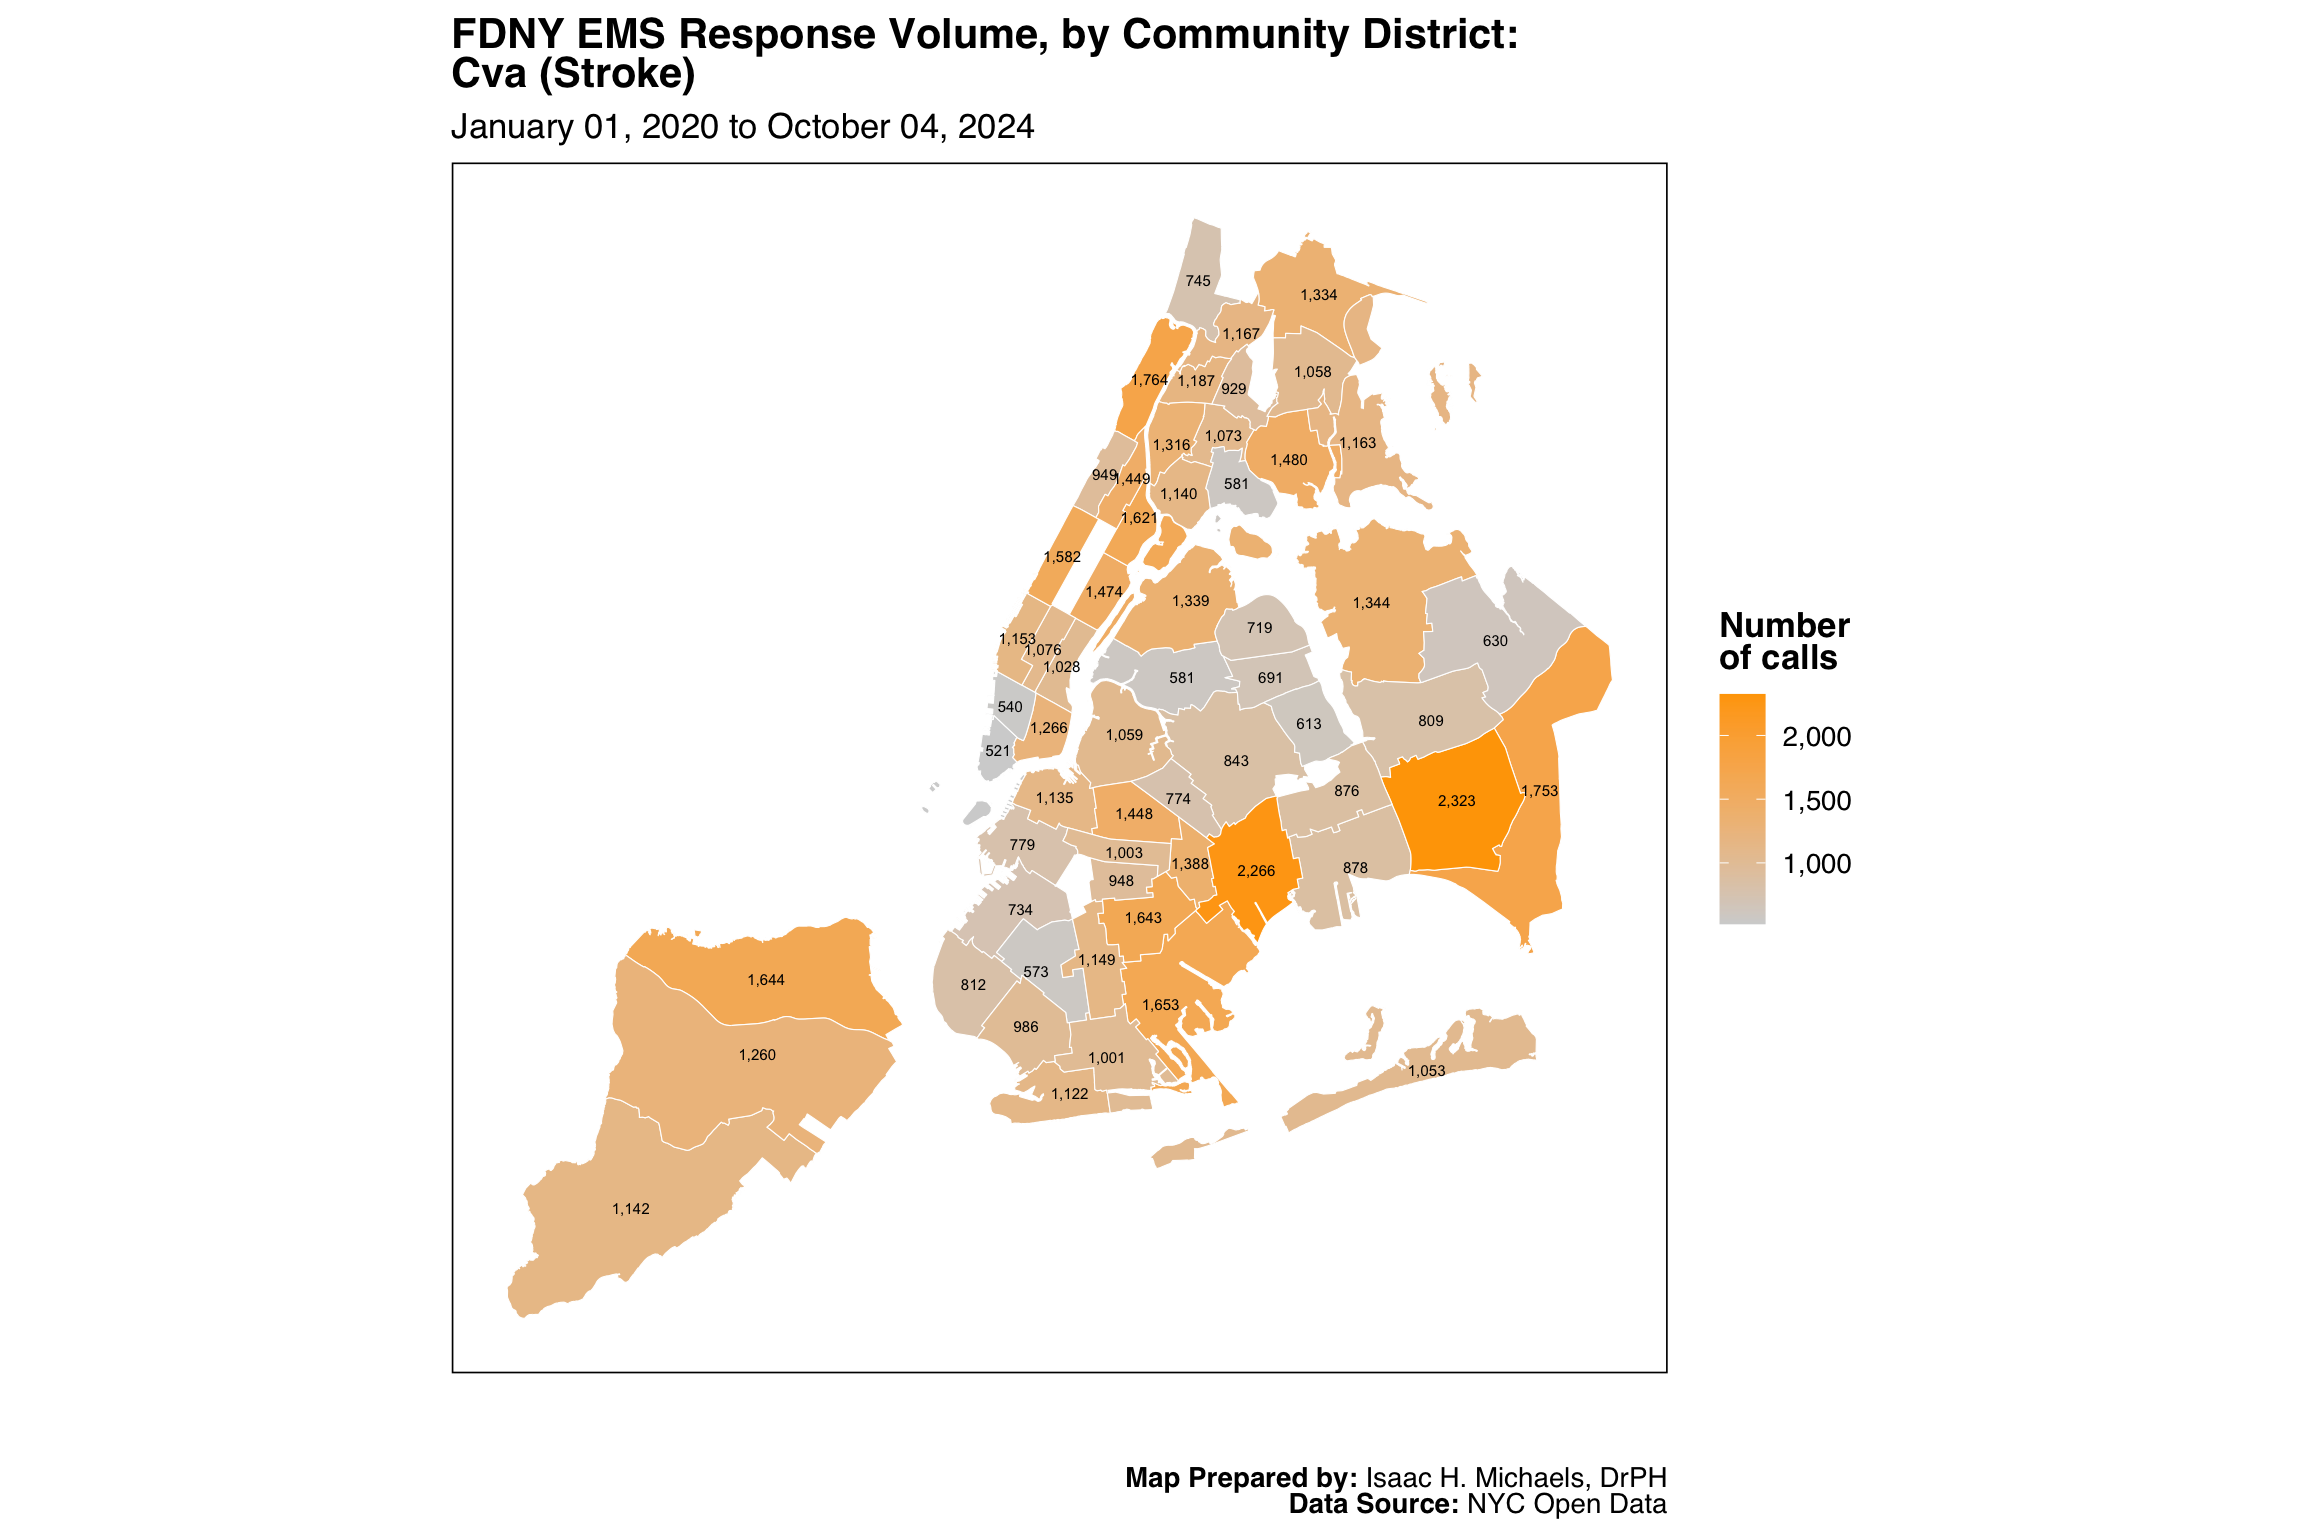
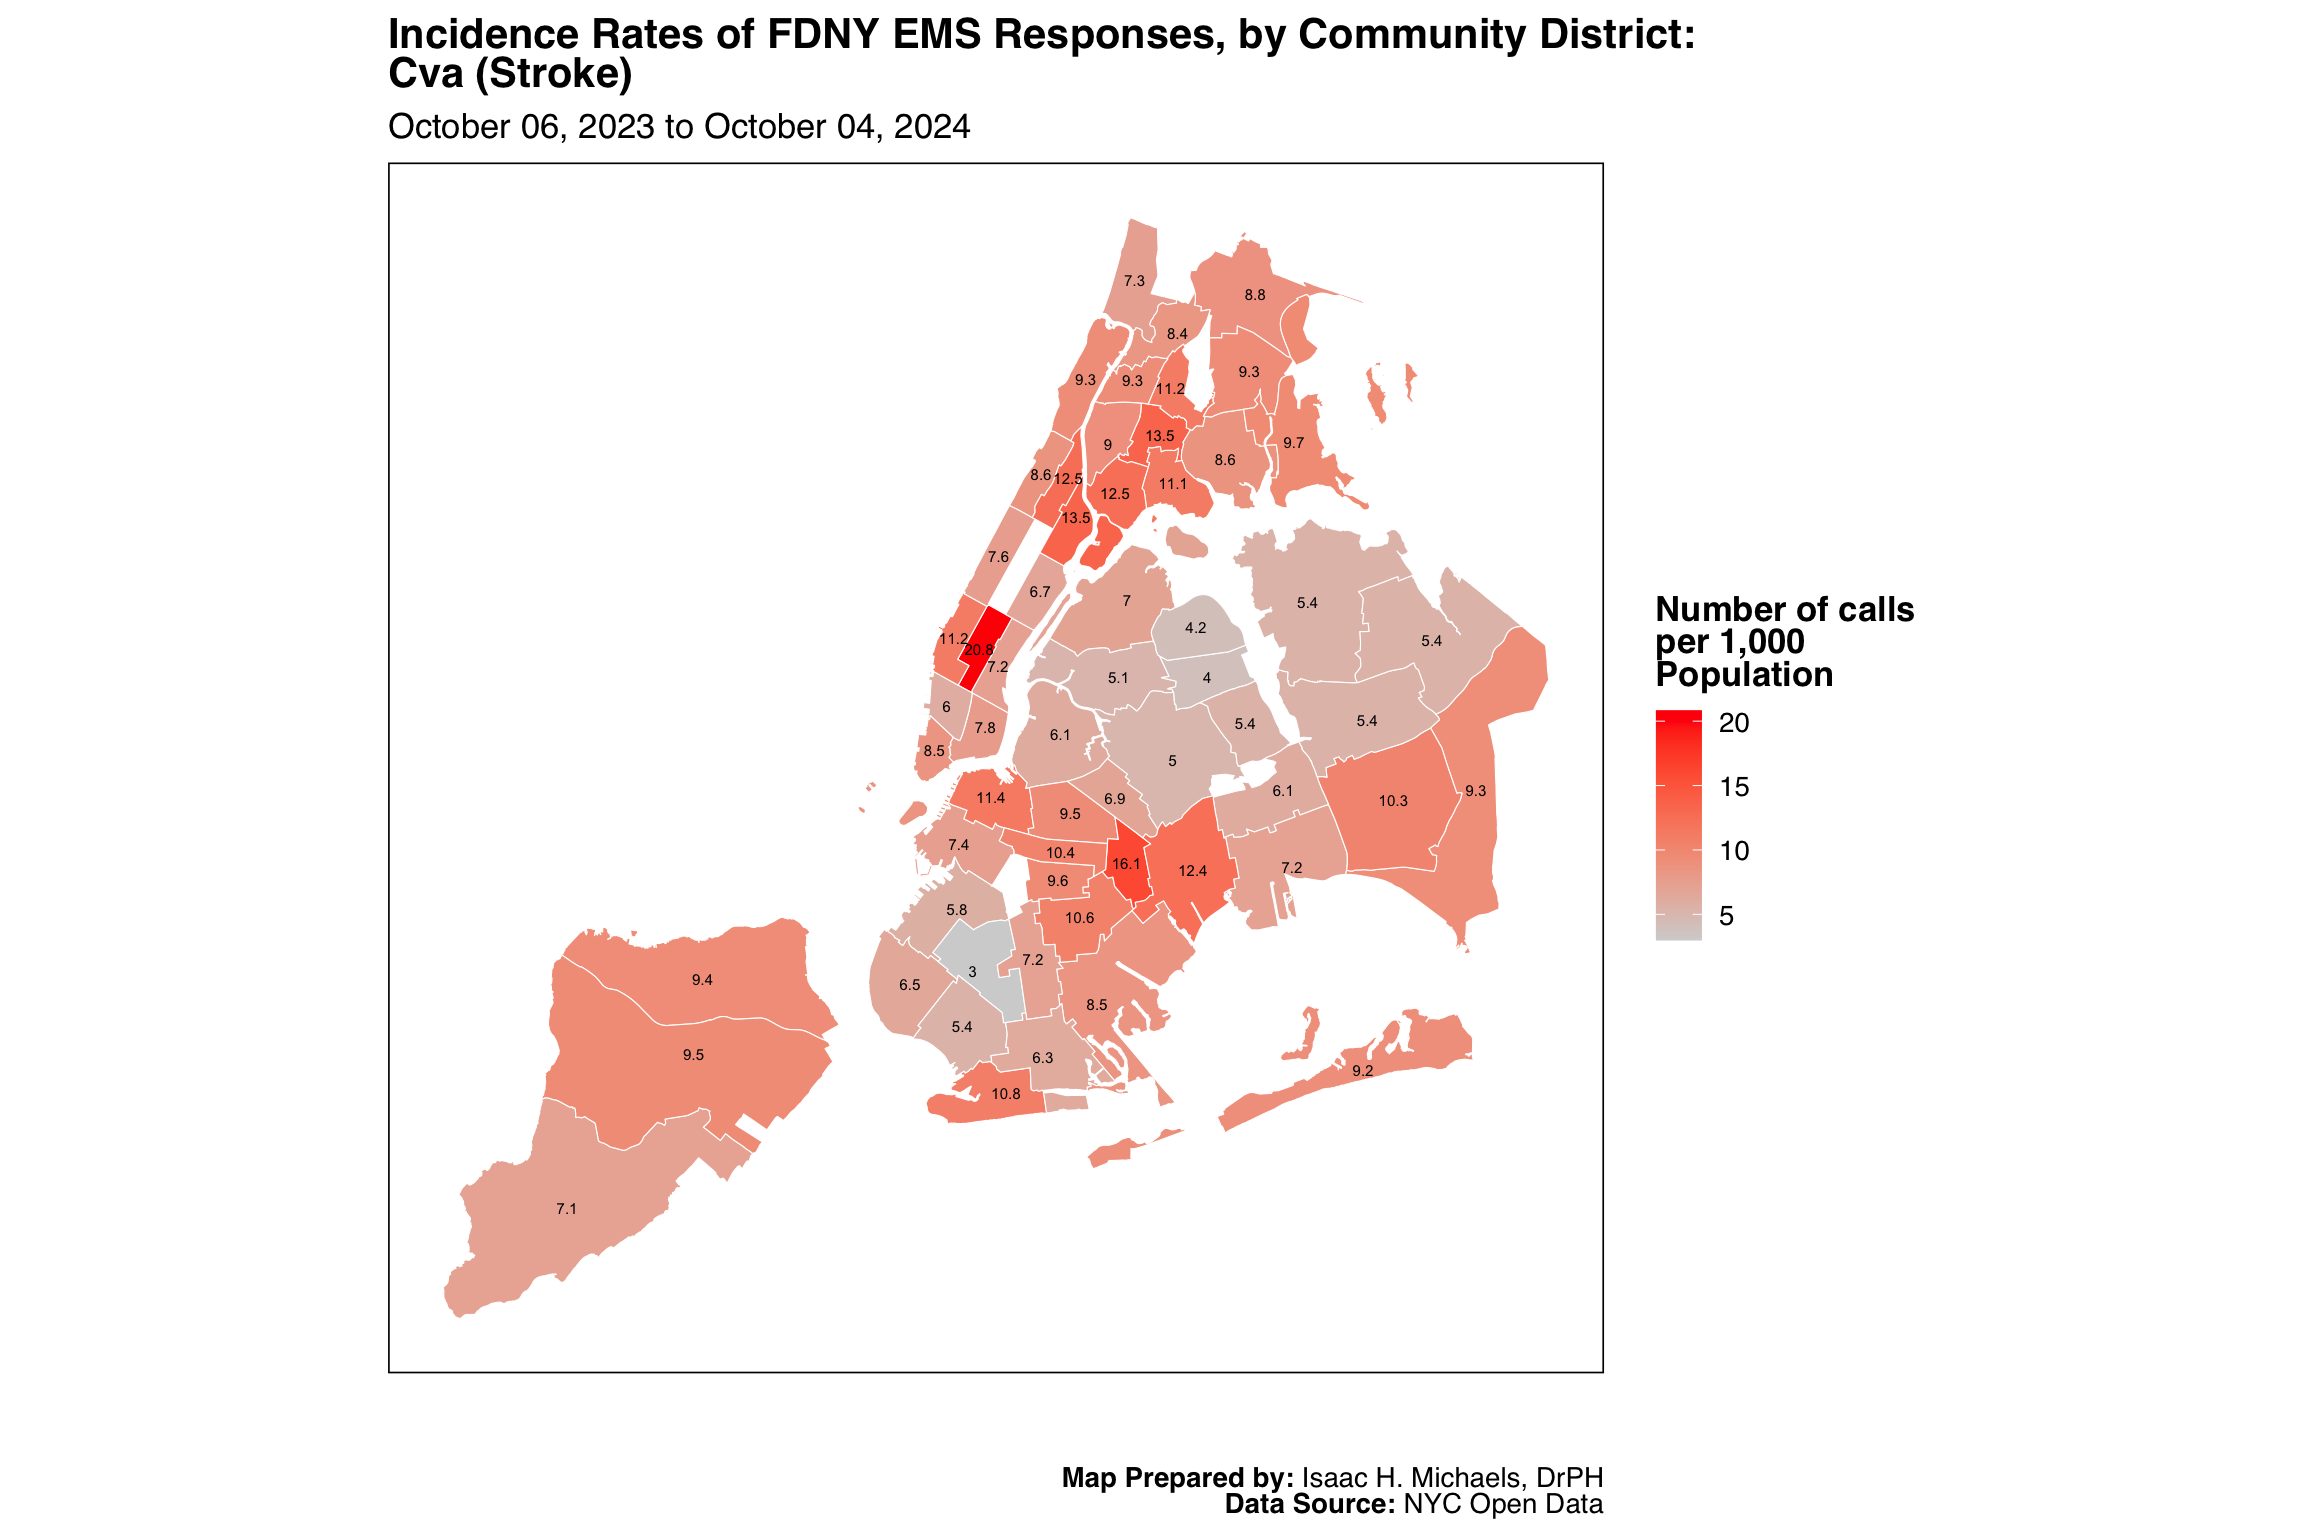
Cva (Stroke)

Map Prepared by: Isaac H. Michaels, DrPH
Data Source: NYC Open Data
Map Prepared by: Isaac H. Michaels, DrPH
EMS Data Source: NYC Open Data
Population Data Source: NYC Open Data
Graphs Prepared by: Isaac H. Michaels, DrPH
Data Source: NYC Open Data
| FDNY EMS Incident Volume, by Borough: Cva (Stroke) |
||||||
| January 01, 2025 to July 01, 2026 | ||||||
| Borough |
Latest Year: 2026
|
All Years: 2025-2026
|
||||
|---|---|---|---|---|---|---|
| Incidents | % | Rate per 1,000 Population | Total Incidents | % | Monthly Trend | |
| Bronx | 1,845 | 20% | 1.3 | 5,307 | 19% | |
| Brooklyn | 2,860 | 31% | 1.1 | 8,760 | 32% | |
| Manhattan | 1,822 | 20% | 1.1 | 5,362 | 19% | |
| Queens | 2,116 | 23% | 0.9 | 6,506 | 23% | |
| Staten Island | 628 | 7% | 1.3 | 1,857 | 7% | |
| Table Prepred by: Isaac H. Michaels, DrPH | ||||||
| Data Source: NYC Open Data | ||||||
Table Prepared by: Isaac H. Michaels, DrPH
EMS Data Source: NYC Open Data
Population Data Source: Health Data NY
| FDNY EMS Incident Volume, by Severity Level: Cva (Stroke) |
||||
| January 01, 2025 to July 01, 2026 | ||||
| Final Severity Level |
Latest Year: 2026
|
All Years: 2025-2026
|
||
|---|---|---|---|---|
| Incidents | % | Incidents | % | |
| 1 | 0 | 0% | 0 | 0% |
| 2 | 9,270 | 100% | 27,790 | 100% |
| 3 | 0 | 0% | 0 | 0% |
| 4 | 1 | 0% | 2 | 0% |
| 5 | 0 | 0% | 0 | 0% |
| 6 | 0 | 0% | 0 | 0% |
| 7 | 0 | 0% | 0 | 0% |
| 8 | 0 | 0% | 0 | 0% |
| Table Prepred by: Isaac H. Michaels, DrPH | ||||
| Data Source: NYC Open Data | ||||
Table Prepared by: Isaac H. Michaels, DrPH
Data Source: NYC Open Data
| FDNY EMS Incident Volume, by Disposition: Cva (Stroke) |
||||
| January 01, 2025 to July 01, 2026 | ||||
| Disposition |
Latest Year: 2026
|
All Years: 2025-2026
|
||
|---|---|---|---|---|
| Incidents | % | Incidents | % | |
| Cancelled | 70 | 1% | 199 | 1% |
| Condition Corrected | 16 | 0% | 42 | 0% |
| Patient Gone on Arrival | 119 | 1% | 317 | 1% |
| Patient Pronounced Dead | 1 | 0% | 5 | 0% |
| Refused Medical Aid | 968 | 10% | 2,995 | 11% |
| Transporting Patient | 7,862 | 85% | 23,569 | 85% |
| Treated and Transported | 21 | 0% | 56 | 0% |
| Unfounded | 205 | 2% | 586 | 2% |
| NA | 9 | 0% | 23 | 0% |
| Table Prepred by: Isaac H. Michaels, DrPH | ||||
| Data Source: NYC Open Data | ||||
Table Prepared by: Isaac H. Michaels, DrPH
Data Source: NYC Open Data
Back to top
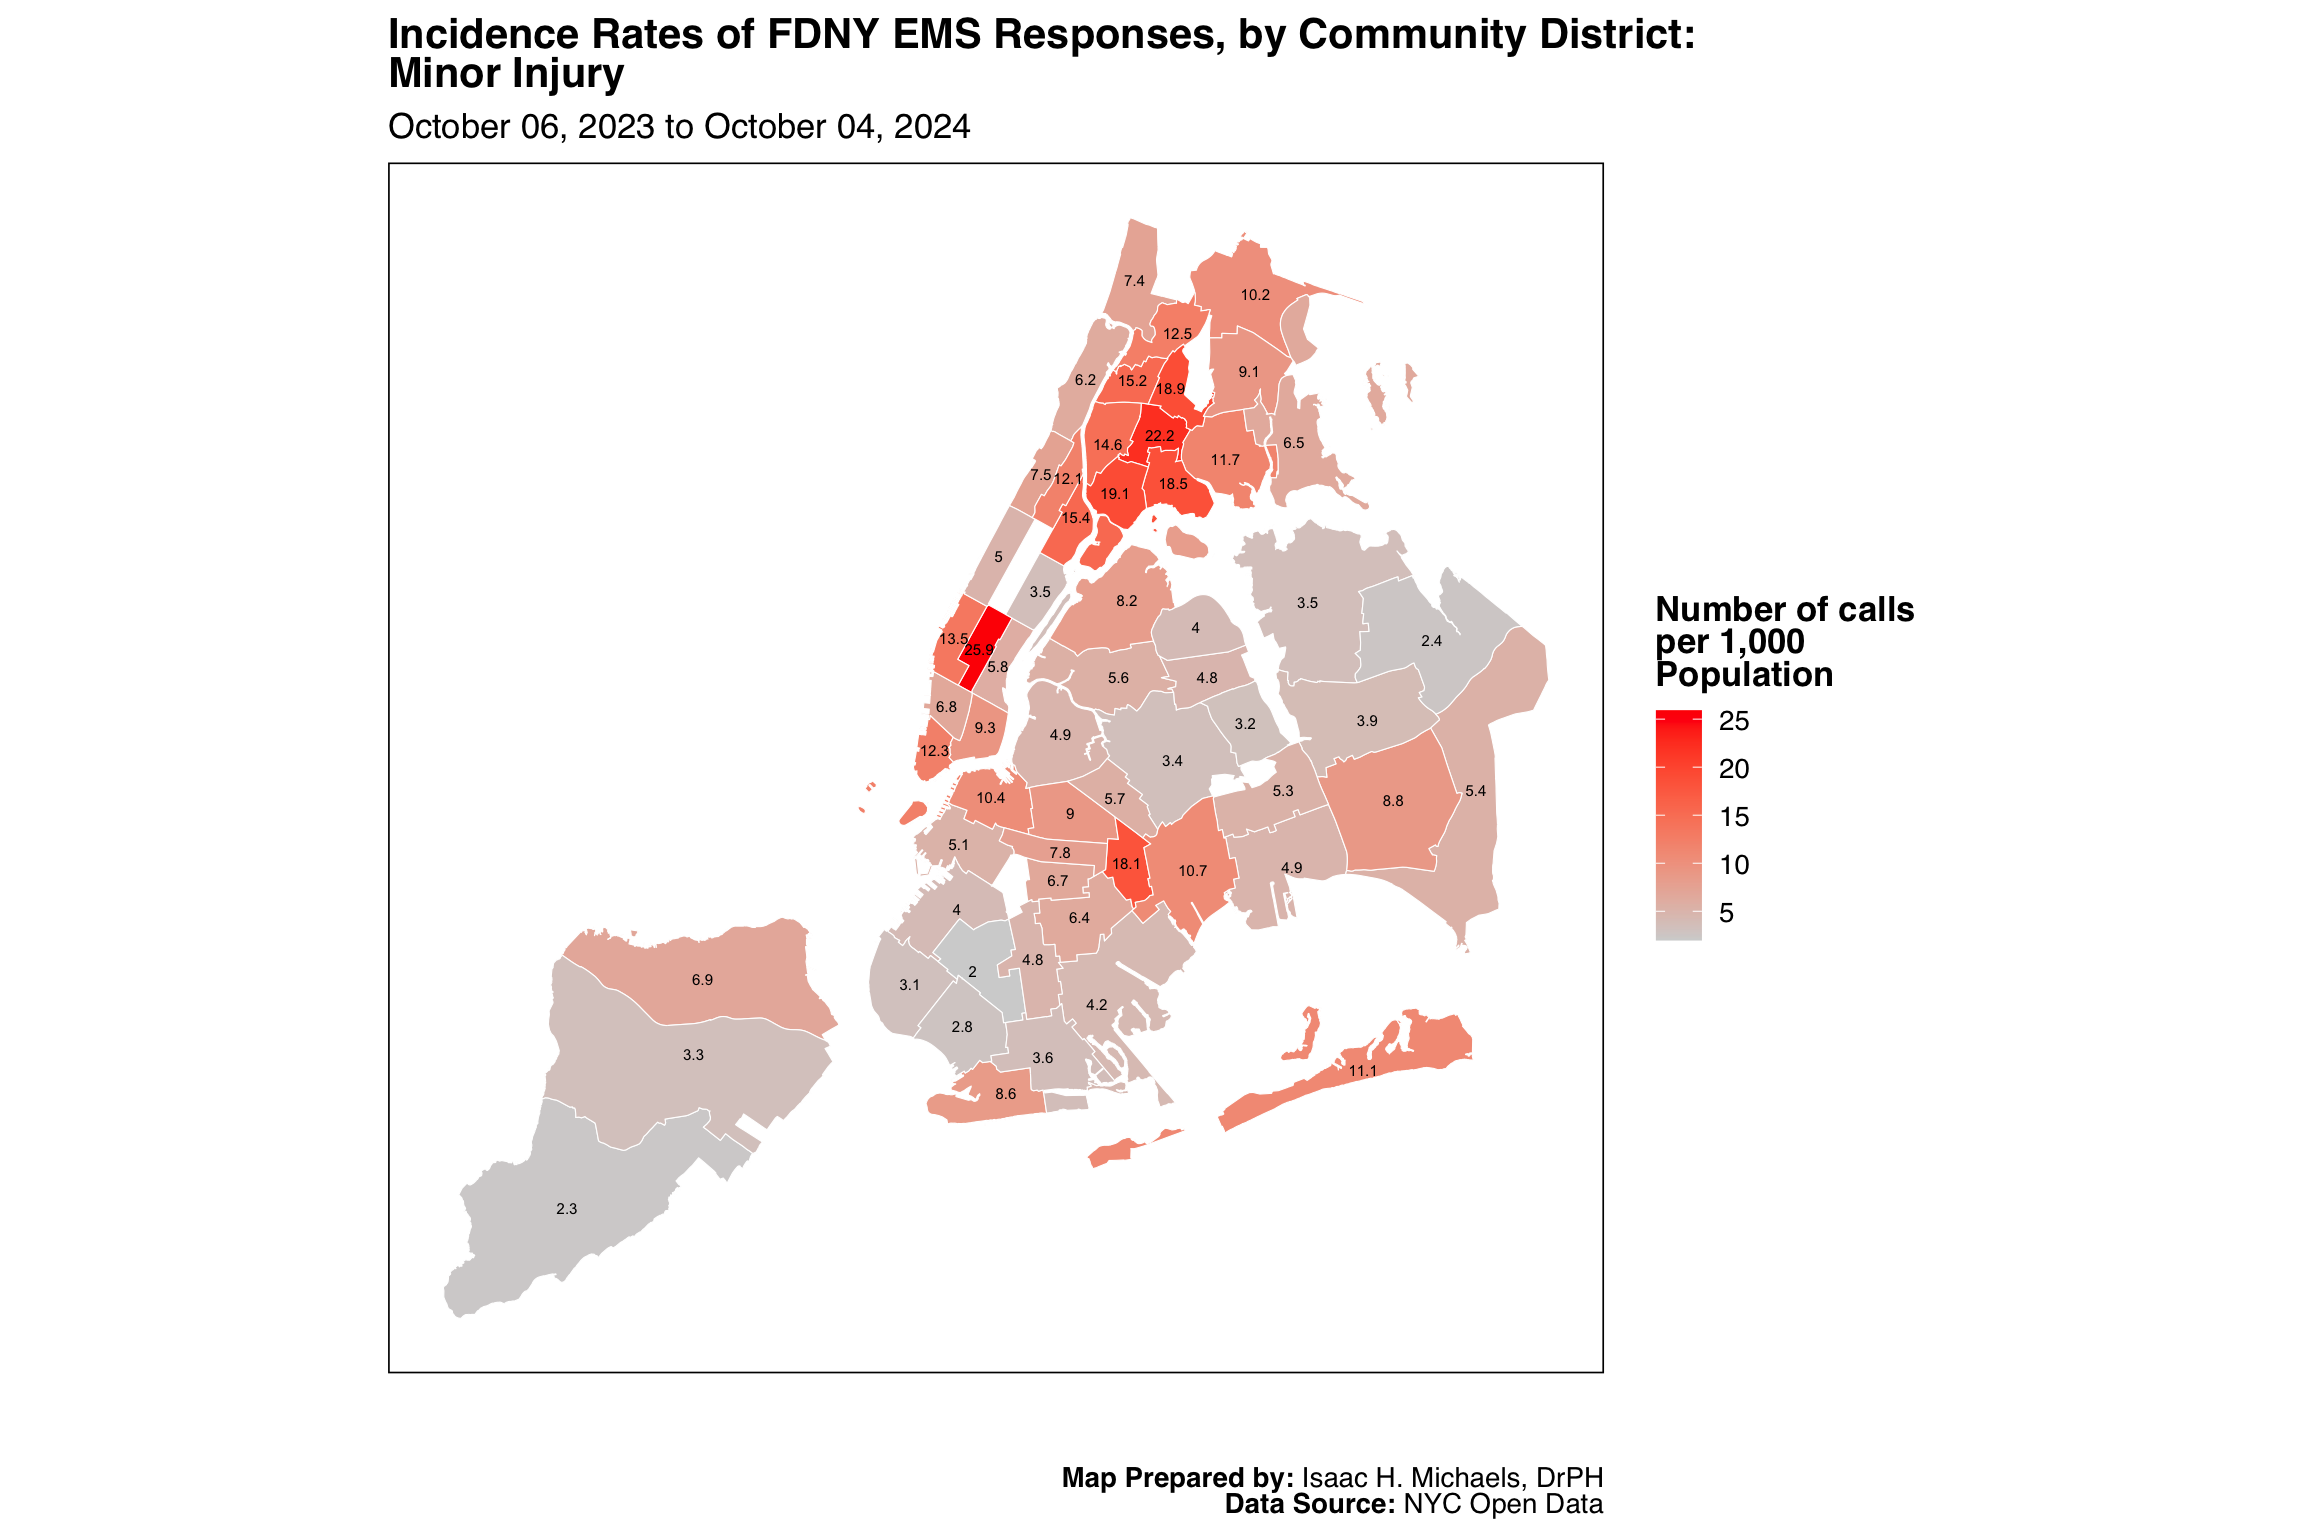
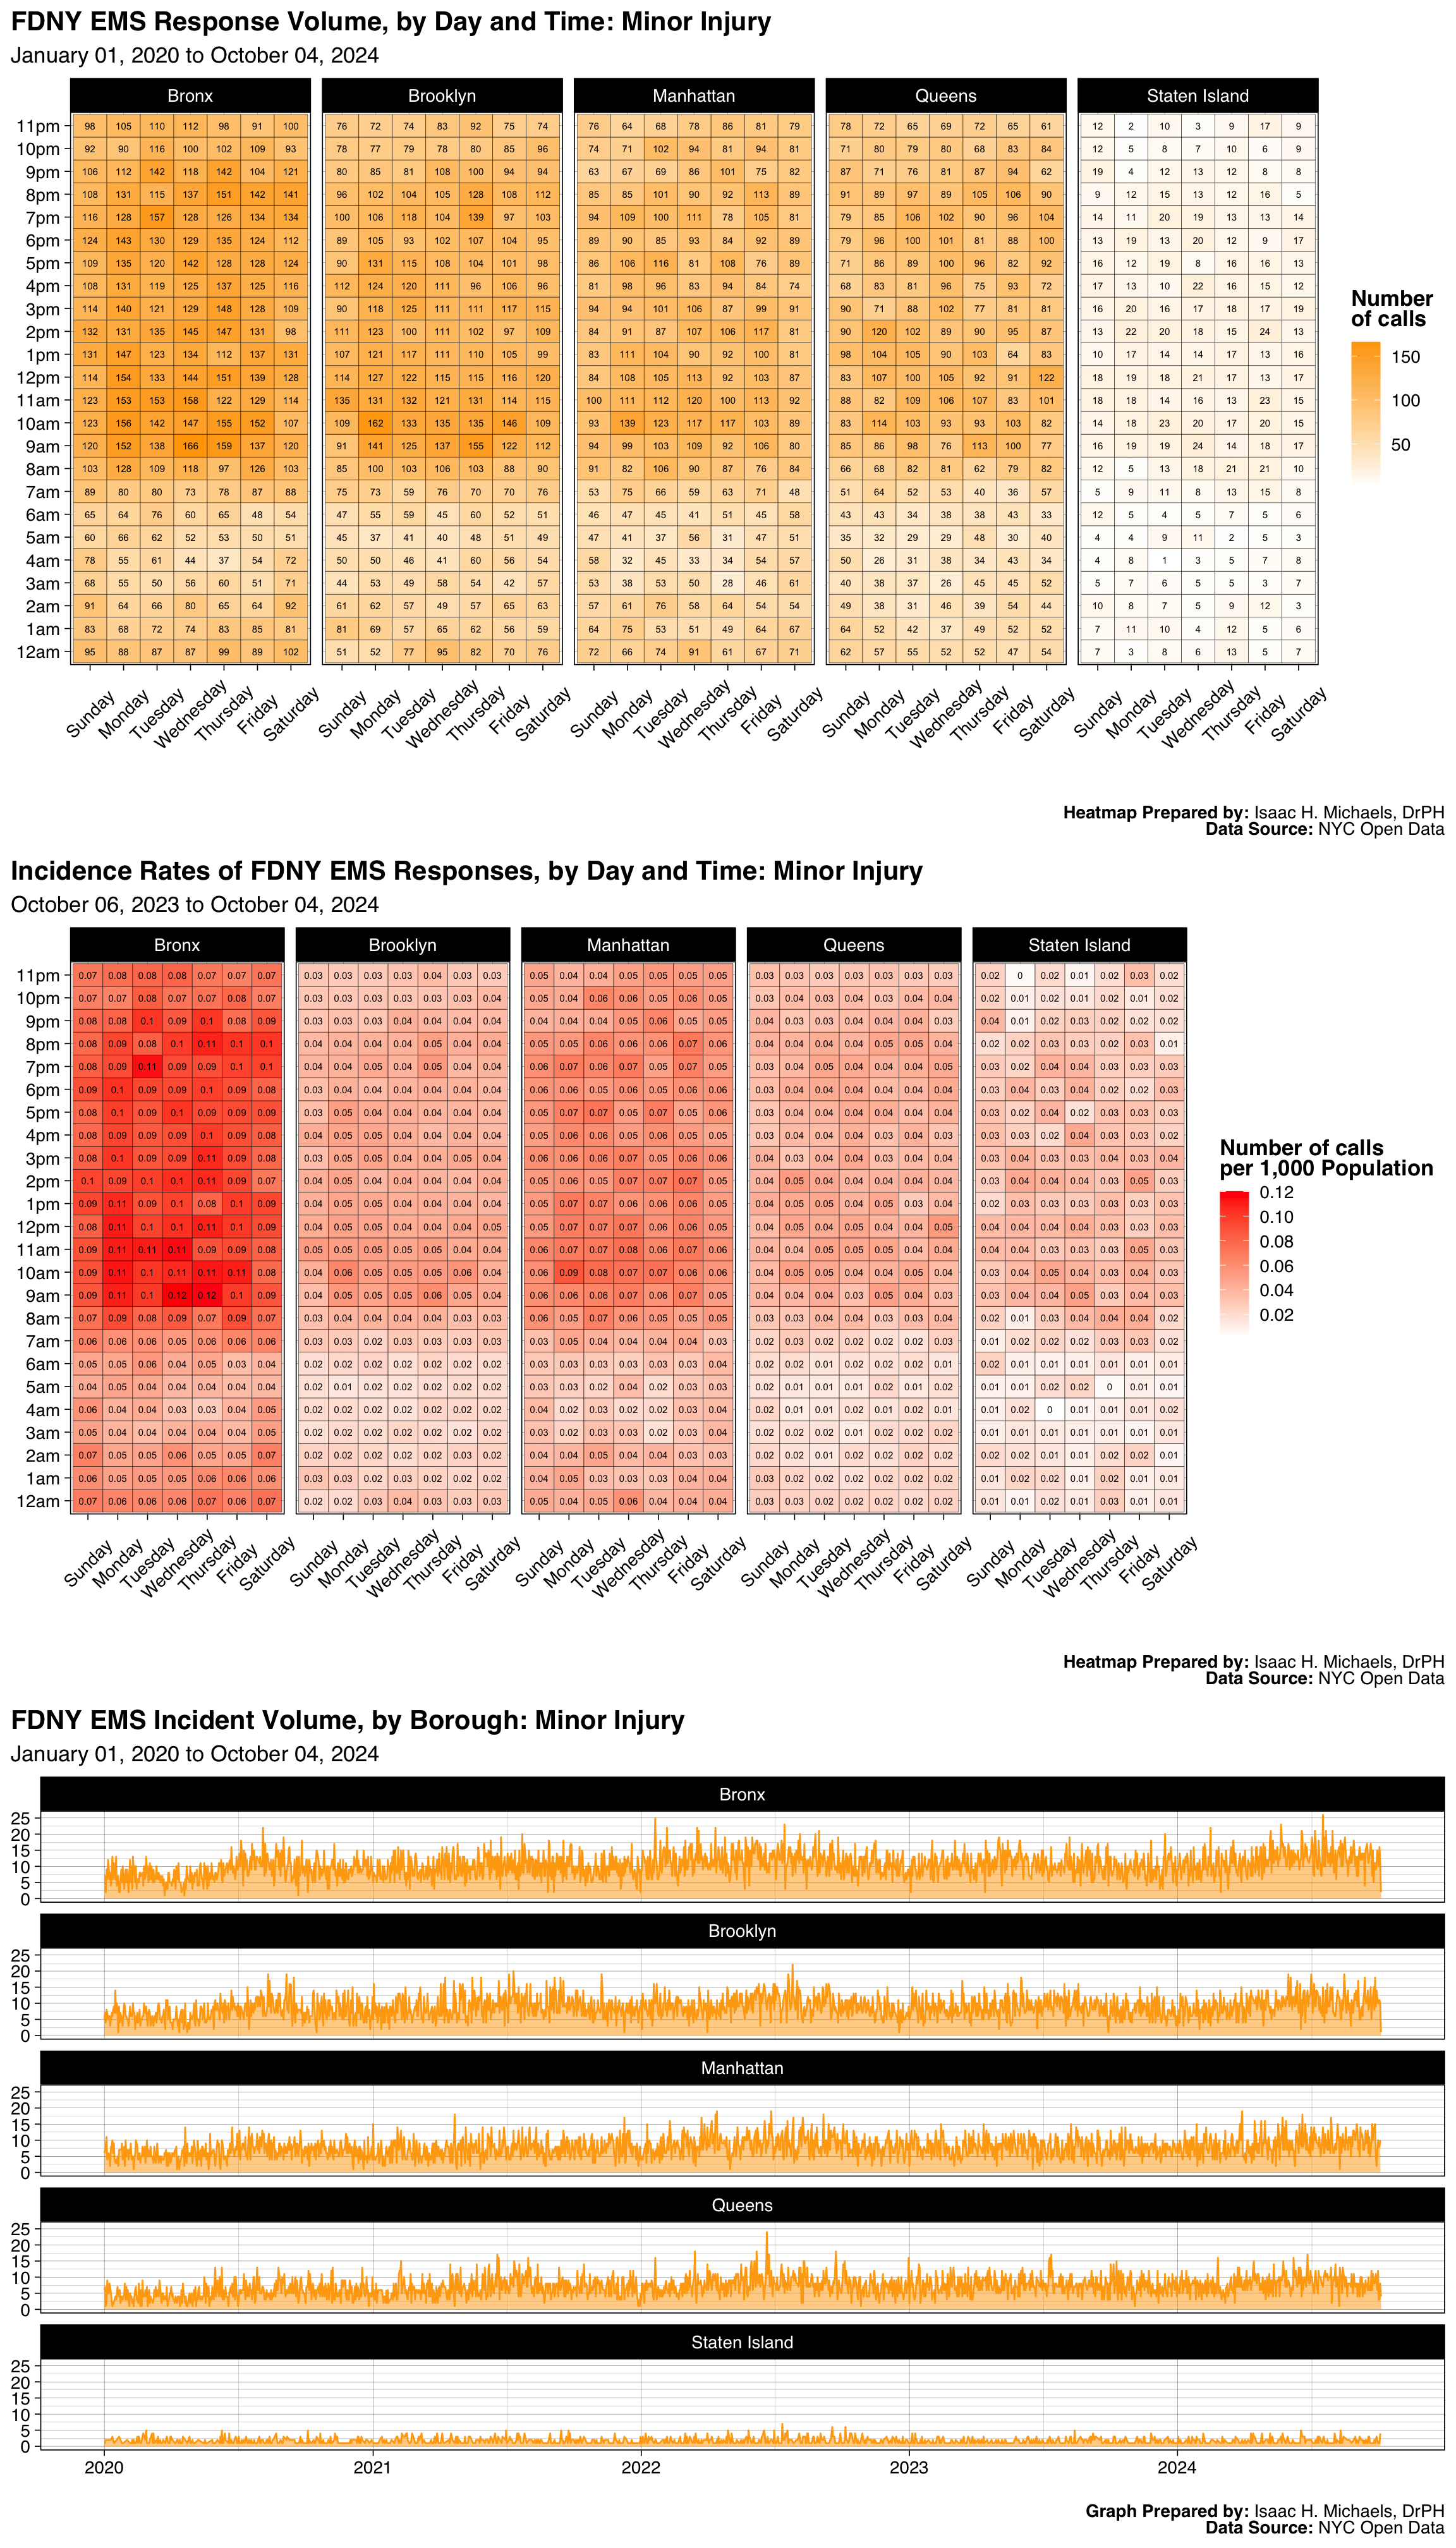
Minor Injury
Map Prepared by: Isaac H. Michaels, DrPH
Data Source: NYC Open Data
Map Prepared by: Isaac H. Michaels, DrPH
EMS Data Source: NYC Open Data
Population Data Source: NYC Open Data
Graphs Prepared by: Isaac H. Michaels, DrPH
Data Source: NYC Open Data
| FDNY EMS Incident Volume, by Borough: Minor Injury |
||||||
| January 01, 2025 to July 01, 2026 | ||||||
| Borough |
Latest Year: 2026
|
All Years: 2025-2026
|
||||
|---|---|---|---|---|---|---|
| Incidents | % | Rate per 1,000 Population | Total Incidents | % | Monthly Trend | |
| Bronx | 1,830 | 28% | 1.3 | 5,877 | 29% | |
| Brooklyn | 1,731 | 26% | 0.7 | 5,033 | 25% | |
| Manhattan | 1,485 | 23% | 0.9 | 4,545 | 23% | |
| Queens | 1,290 | 20% | 0.6 | 3,918 | 19% | |
| Staten Island | 251 | 4% | 0.5 | 726 | 4% | |
| Table Prepred by: Isaac H. Michaels, DrPH | ||||||
| Data Source: NYC Open Data | ||||||
Table Prepared by: Isaac H. Michaels, DrPH
EMS Data Source: NYC Open Data
Population Data Source: Health Data NY
| FDNY EMS Incident Volume, by Severity Level: Minor Injury |
||||
| January 01, 2025 to July 01, 2026 | ||||
| Final Severity Level |
Latest Year: 2026
|
All Years: 2025-2026
|
||
|---|---|---|---|---|
| Incidents | % | Incidents | % | |
| 1 | 0 | 0% | 0 | 0% |
| 2 | 0 | 0% | 0 | 0% |
| 3 | 5 | 0% | 12 | 0% |
| 4 | 69 | 1% | 234 | 1% |
| 5 | 0 | 0% | 2 | 0% |
| 6 | 1 | 0% | 1 | 0% |
| 7 | 6,512 | 99% | 19,850 | 99% |
| 8 | 0 | 0% | 0 | 0% |
| Table Prepred by: Isaac H. Michaels, DrPH | ||||
| Data Source: NYC Open Data | ||||
Table Prepared by: Isaac H. Michaels, DrPH
Data Source: NYC Open Data
| FDNY EMS Incident Volume, by Disposition: Minor Injury |
||||
| January 01, 2025 to July 01, 2026 | ||||
| Disposition |
Latest Year: 2026
|
All Years: 2025-2026
|
||
|---|---|---|---|---|
| Incidents | % | Incidents | % | |
| Cancelled | 121 | 2% | 321 | 2% |
| Condition Corrected | 54 | 1% | 175 | 1% |
| Patient Gone on Arrival | 232 | 4% | 641 | 3% |
| Refused Medical Aid | 1,524 | 23% | 4,738 | 24% |
| Transporting Patient | 3,881 | 59% | 12,221 | 61% |
| Treated and Transported | 3 | 0% | 10 | 0% |
| Triaged at Scene No Transport | 1 | 0% | 2 | 0% |
| Unfounded | 357 | 5% | 1,131 | 6% |
| NA | 414 | 6% | 860 | 4% |
| Table Prepred by: Isaac H. Michaels, DrPH | ||||
| Data Source: NYC Open Data | ||||
Table Prepared by: Isaac H. Michaels, DrPH
Data Source: NYC Open Data
Back to top
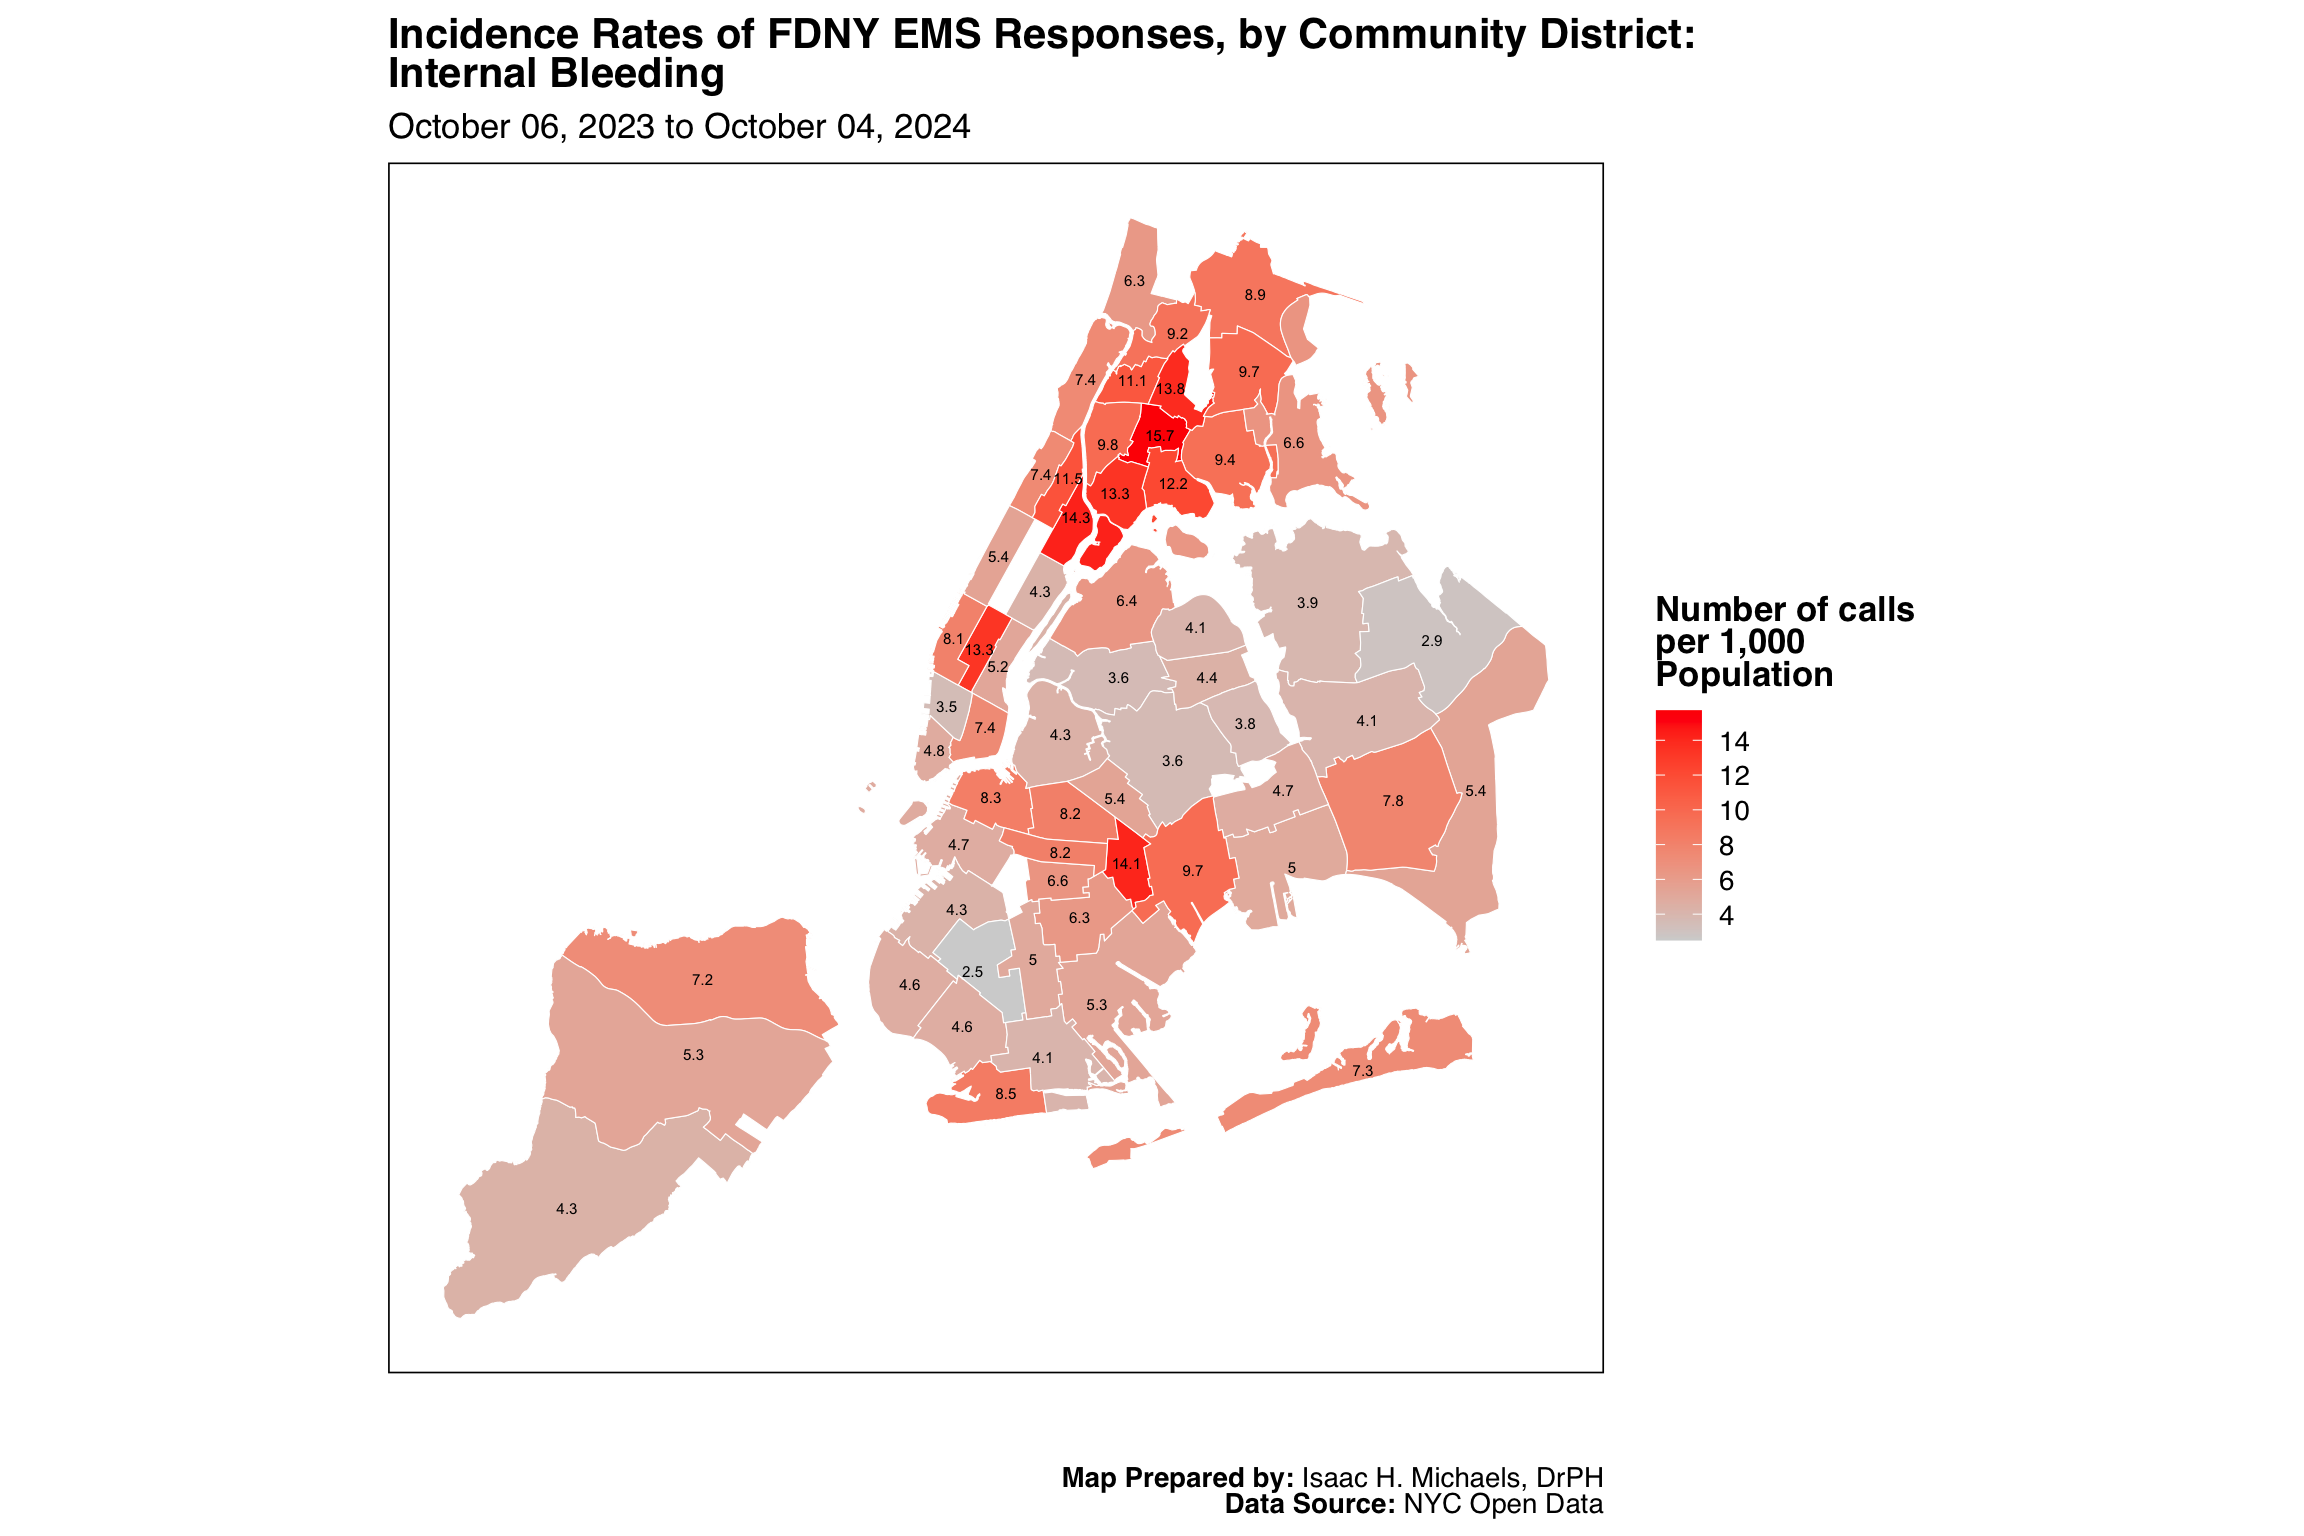
Internal Bleeding
Map Prepared by: Isaac H. Michaels, DrPH
Data Source: NYC Open Data
Map Prepared by: Isaac H. Michaels, DrPH
EMS Data Source: NYC Open Data
Population Data Source: NYC Open Data
Graphs Prepared by: Isaac H. Michaels, DrPH
Data Source: NYC Open Data
| FDNY EMS Incident Volume, by Borough: Internal Bleeding |
||||||
| January 01, 2025 to July 01, 2026 | ||||||
| Borough |
Latest Year: 2026
|
All Years: 2025-2026
|
||||
|---|---|---|---|---|---|---|
| Incidents | % | Rate per 1,000 Population | Total Incidents | % | Monthly Trend | |
| Bronx | 1,836 | 27% | 1.3 | 5,299 | 27% | |
| Brooklyn | 1,887 | 28% | 0.7 | 5,501 | 28% | |
| Manhattan | 1,208 | 18% | 0.8 | 3,684 | 19% | |
| Queens | 1,424 | 21% | 0.6 | 4,283 | 22% | |
| Staten Island | 339 | 5% | 0.7 | 962 | 5% | |
| Table Prepred by: Isaac H. Michaels, DrPH | ||||||
| Data Source: NYC Open Data | ||||||
Table Prepared by: Isaac H. Michaels, DrPH
EMS Data Source: NYC Open Data
Population Data Source: Health Data NY
| FDNY EMS Incident Volume, by Severity Level: Internal Bleeding |
||||
| January 01, 2025 to July 01, 2026 | ||||
| Final Severity Level |
Latest Year: 2026
|
All Years: 2025-2026
|
||
|---|---|---|---|---|
| Incidents | % | Incidents | % | |
| 1 | 0 | 0% | 0 | 0% |
| 2 | 1 | 0% | 2 | 0% |
| 3 | 12 | 0% | 44 | 0% |
| 4 | 6,680 | 100% | 19,681 | 100% |
| 5 | 0 | 0% | 1 | 0% |
| 6 | 1 | 0% | 1 | 0% |
| 7 | 0 | 0% | 0 | 0% |
| 8 | 0 | 0% | 0 | 0% |
| Table Prepred by: Isaac H. Michaels, DrPH | ||||
| Data Source: NYC Open Data | ||||
Table Prepared by: Isaac H. Michaels, DrPH
Data Source: NYC Open Data
| FDNY EMS Incident Volume, by Disposition: Internal Bleeding |
||||
| January 01, 2025 to July 01, 2026 | ||||
| Disposition |
Latest Year: 2026
|
All Years: 2025-2026
|
||
|---|---|---|---|---|
| Incidents | % | Incidents | % | |
| Cancelled | 63 | 1% | 163 | 1% |
| Condition Corrected | 13 | 0% | 38 | 0% |
| Patient Gone on Arrival | 181 | 3% | 364 | 2% |
| Refused Medical Aid | 562 | 8% | 1,719 | 9% |
| Transporting Patient | 5,682 | 85% | 16,899 | 86% |
| Treated and Transported | 10 | 0% | 17 | 0% |
| Unfounded | 142 | 2% | 456 | 2% |
| NA | 41 | 1% | 71 | 0% |
| Table Prepred by: Isaac H. Michaels, DrPH | ||||
| Data Source: NYC Open Data | ||||
Table Prepared by: Isaac H. Michaels, DrPH
Data Source: NYC Open Data
Back to top
Respiratory Distress

Map Prepared by: Isaac H. Michaels, DrPH
Data Source: NYC Open Data
Map Prepared by: Isaac H. Michaels, DrPH
EMS Data Source: NYC Open Data
Population Data Source: NYC Open Data
Graphs Prepared by: Isaac H. Michaels, DrPH
Data Source: NYC Open Data
| FDNY EMS Incident Volume, by Borough: Respiratory Distress |
||||||
| January 01, 2025 to July 01, 2026 | ||||||
| Borough |
Latest Year: 2026
|
All Years: 2025-2026
|
||||
|---|---|---|---|---|---|---|
| Incidents | % | Rate per 1,000 Population | Total Incidents | % | Monthly Trend | |
| Bronx | 1,554 | 24% | 1.1 | 4,494 | 25% | |
| Brooklyn | 1,743 | 27% | 0.7 | 4,938 | 27% | |
| Manhattan | 1,483 | 23% | 0.9 | 4,232 | 23% | |
| Queens | 1,421 | 22% | 0.6 | 3,760 | 21% | |
| Staten Island | 313 | 5% | 0.6 | 896 | 5% | |
| Table Prepred by: Isaac H. Michaels, DrPH | ||||||
| Data Source: NYC Open Data | ||||||
Table Prepared by: Isaac H. Michaels, DrPH
EMS Data Source: NYC Open Data
Population Data Source: Health Data NY
| FDNY EMS Incident Volume, by Severity Level: Respiratory Distress |
||||
| January 01, 2025 to July 01, 2026 | ||||
| Final Severity Level |
Latest Year: 2026
|
All Years: 2025-2026
|
||
|---|---|---|---|---|
| Incidents | % | Incidents | % | |
| 1 | 0 | 0% | 0 | 0% |
| 2 | 1 | 0% | 1 | 0% |
| 3 | 6 | 0% | 16 | 0% |
| 4 | 6,507 | 100% | 18,303 | 100% |
| 5 | 0 | 0% | 0 | 0% |
| 6 | 0 | 0% | 0 | 0% |
| 7 | 0 | 0% | 0 | 0% |
| 8 | 0 | 0% | 0 | 0% |
| Table Prepred by: Isaac H. Michaels, DrPH | ||||
| Data Source: NYC Open Data | ||||
Table Prepared by: Isaac H. Michaels, DrPH
Data Source: NYC Open Data
| FDNY EMS Incident Volume, by Disposition: Respiratory Distress |
||||
| January 01, 2025 to July 01, 2026 | ||||
| Disposition |
Latest Year: 2026
|
All Years: 2025-2026
|
||
|---|---|---|---|---|
| Incidents | % | Incidents | % | |
| Cancelled | 212 | 3% | 502 | 3% |
| Condition Corrected | 68 | 1% | 211 | 1% |
| Patient Gone on Arrival | 296 | 5% | 808 | 4% |
| Patient Pronounced Dead | 3 | 0% | 5 | 0% |
| Refused Medical Aid | 1,112 | 17% | 3,340 | 18% |
| Transporting Patient | 4,039 | 62% | 11,658 | 64% |
| Treated and Transported | 12 | 0% | 26 | 0% |
| Triaged at Scene No Transport | 2 | 0% | 3 | 0% |
| Unfounded | 597 | 9% | 1,436 | 8% |
| NA | 173 | 3% | 331 | 2% |
| Table Prepred by: Isaac H. Michaels, DrPH | ||||
| Data Source: NYC Open Data | ||||
Table Prepared by: Isaac H. Michaels, DrPH
Data Source: NYC Open Data
Back to top
Seizures

Map Prepared by: Isaac H. Michaels, DrPH
Data Source: NYC Open Data

Map Prepared by: Isaac H. Michaels, DrPH
EMS Data Source: NYC Open Data
Population Data Source: NYC Open Data
Graphs Prepared by: Isaac H. Michaels, DrPH
Data Source: NYC Open Data
| FDNY EMS Incident Volume, by Borough: Seizures |
||||||
| January 01, 2025 to July 01, 2026 | ||||||
| Borough |
Latest Year: 2026
|
All Years: 2025-2026
|
||||
|---|---|---|---|---|---|---|
| Incidents | % | Rate per 1,000 Population | Total Incidents | % | Monthly Trend | |
| Bronx | 1,161 | 21% | 0.8 | 3,672 | 22% | |
| Brooklyn | 1,632 | 30% | 0.6 | 4,844 | 29% | |
| Manhattan | 1,320 | 24% | 0.8 | 4,140 | 25% | |
| Queens | 1,090 | 20% | 0.5 | 3,212 | 19% | |
| Staten Island | 219 | 4% | 0.4 | 665 | 4% | |
| Table Prepred by: Isaac H. Michaels, DrPH | ||||||
| Data Source: NYC Open Data | ||||||
Table Prepared by: Isaac H. Michaels, DrPH
EMS Data Source: NYC Open Data
Population Data Source: Health Data NY
| FDNY EMS Incident Volume, by Severity Level: Seizures |
||||
| January 01, 2025 to July 01, 2026 | ||||
| Final Severity Level |
Latest Year: 2026
|
All Years: 2025-2026
|
||
|---|---|---|---|---|
| Incidents | % | Incidents | % | |
| 1 | 0 | 0% | 0 | 0% |
| 2 | 2 | 0% | 4 | 0% |
| 3 | 5,419 | 100% | 16,527 | 100% |
| 4 | 1 | 0% | 2 | 0% |
| 5 | 0 | 0% | 0 | 0% |
| 6 | 0 | 0% | 0 | 0% |
| 7 | 0 | 0% | 0 | 0% |
| 8 | 0 | 0% | 0 | 0% |
| Table Prepred by: Isaac H. Michaels, DrPH | ||||
| Data Source: NYC Open Data | ||||
Table Prepared by: Isaac H. Michaels, DrPH
Data Source: NYC Open Data
| FDNY EMS Incident Volume, by Disposition: Seizures |
||||
| January 01, 2025 to July 01, 2026 | ||||
| Disposition |
Latest Year: 2026
|
All Years: 2025-2026
|
||
|---|---|---|---|---|
| Incidents | % | Incidents | % | |
| Cancelled | 80 | 1% | 233 | 1% |
| Condition Corrected | 22 | 0% | 59 | 0% |
| Patient Gone on Arrival | 196 | 4% | 621 | 4% |
| Patient Pronounced Dead | 1 | 0% | 3 | 0% |
| Refused Medical Aid | 853 | 16% | 2,738 | 17% |
| Transporting Patient | 4,001 | 74% | 12,056 | 73% |
| Treated and Transported | 7 | 0% | 26 | 0% |
| Unfounded | 250 | 5% | 769 | 5% |
| NA | 12 | 0% | 27 | 0% |
| Table Prepred by: Isaac H. Michaels, DrPH | ||||
| Data Source: NYC Open Data | ||||
Table Prepared by: Isaac H. Michaels, DrPH
Data Source: NYC Open Data
Back to top
Anaphylaxis

Map Prepared by: Isaac H. Michaels, DrPH
Data Source: NYC Open Data
Map Prepared by: Isaac H. Michaels, DrPH
EMS Data Source: NYC Open Data
Population Data Source: NYC Open Data
Graphs Prepared by: Isaac H. Michaels, DrPH
Data Source: NYC Open Data
| FDNY EMS Incident Volume, by Borough: Anaphylaxis |
||||||
| January 01, 2025 to July 01, 2026 | ||||||
| Borough |
Latest Year: 2026
|
All Years: 2025-2026
|
||||
|---|---|---|---|---|---|---|
| Incidents | % | Rate per 1,000 Population | Total Incidents | % | Monthly Trend | |
| Bronx | 1,111 | 22% | 0.8 | 3,292 | 22% | |
| Brooklyn | 1,502 | 29% | 0.6 | 4,412 | 29% | |
| Manhattan | 1,266 | 25% | 0.8 | 3,842 | 25% | |
| Queens | 965 | 19% | 0.4 | 2,907 | 19% | |
| Staten Island | 257 | 5% | 0.5 | 712 | 5% | |
| Table Prepred by: Isaac H. Michaels, DrPH | ||||||
| Data Source: NYC Open Data | ||||||
Table Prepared by: Isaac H. Michaels, DrPH
EMS Data Source: NYC Open Data
Population Data Source: Health Data NY
| FDNY EMS Incident Volume, by Severity Level: Anaphylaxis |
||||
| January 01, 2025 to July 01, 2026 | ||||
| Final Severity Level |
Latest Year: 2026
|
All Years: 2025-2026
|
||
|---|---|---|---|---|
| Incidents | % | Incidents | % | |
| 1 | 1 | 0% | 2 | 0% |
| 2 | 5,090 | 100% | 15,133 | 100% |
| 3 | 0 | 0% | 3 | 0% |
| 4 | 10 | 0% | 27 | 0% |
| 5 | 0 | 0% | 0 | 0% |
| 6 | 0 | 0% | 0 | 0% |
| 7 | 0 | 0% | 0 | 0% |
| 8 | 0 | 0% | 0 | 0% |
| Table Prepred by: Isaac H. Michaels, DrPH | ||||
| Data Source: NYC Open Data | ||||
Table Prepared by: Isaac H. Michaels, DrPH
Data Source: NYC Open Data
| FDNY EMS Incident Volume, by Disposition: Anaphylaxis |
||||
| January 01, 2025 to July 01, 2026 | ||||
| Disposition |
Latest Year: 2026
|
All Years: 2025-2026
|
||
|---|---|---|---|---|
| Incidents | % | Incidents | % | |
| Cancelled | 50 | 1% | 118 | 1% |
| Condition Corrected | 7 | 0% | 15 | 0% |
| Patient Gone on Arrival | 67 | 1% | 210 | 1% |
| Refused Medical Aid | 649 | 13% | 1,953 | 13% |
| Transporting Patient | 4,244 | 83% | 12,590 | 83% |
| Treated and Transported | 4 | 0% | 14 | 0% |
| Triaged at Scene No Transport | 1 | 0% | 3 | 0% |
| Unfounded | 71 | 1% | 250 | 2% |
| NA | 8 | 0% | 12 | 0% |
| Table Prepred by: Isaac H. Michaels, DrPH | ||||
| Data Source: NYC Open Data | ||||
Table Prepared by: Isaac H. Michaels, DrPH
Data Source: NYC Open Data
Back to top
Asthma Attack
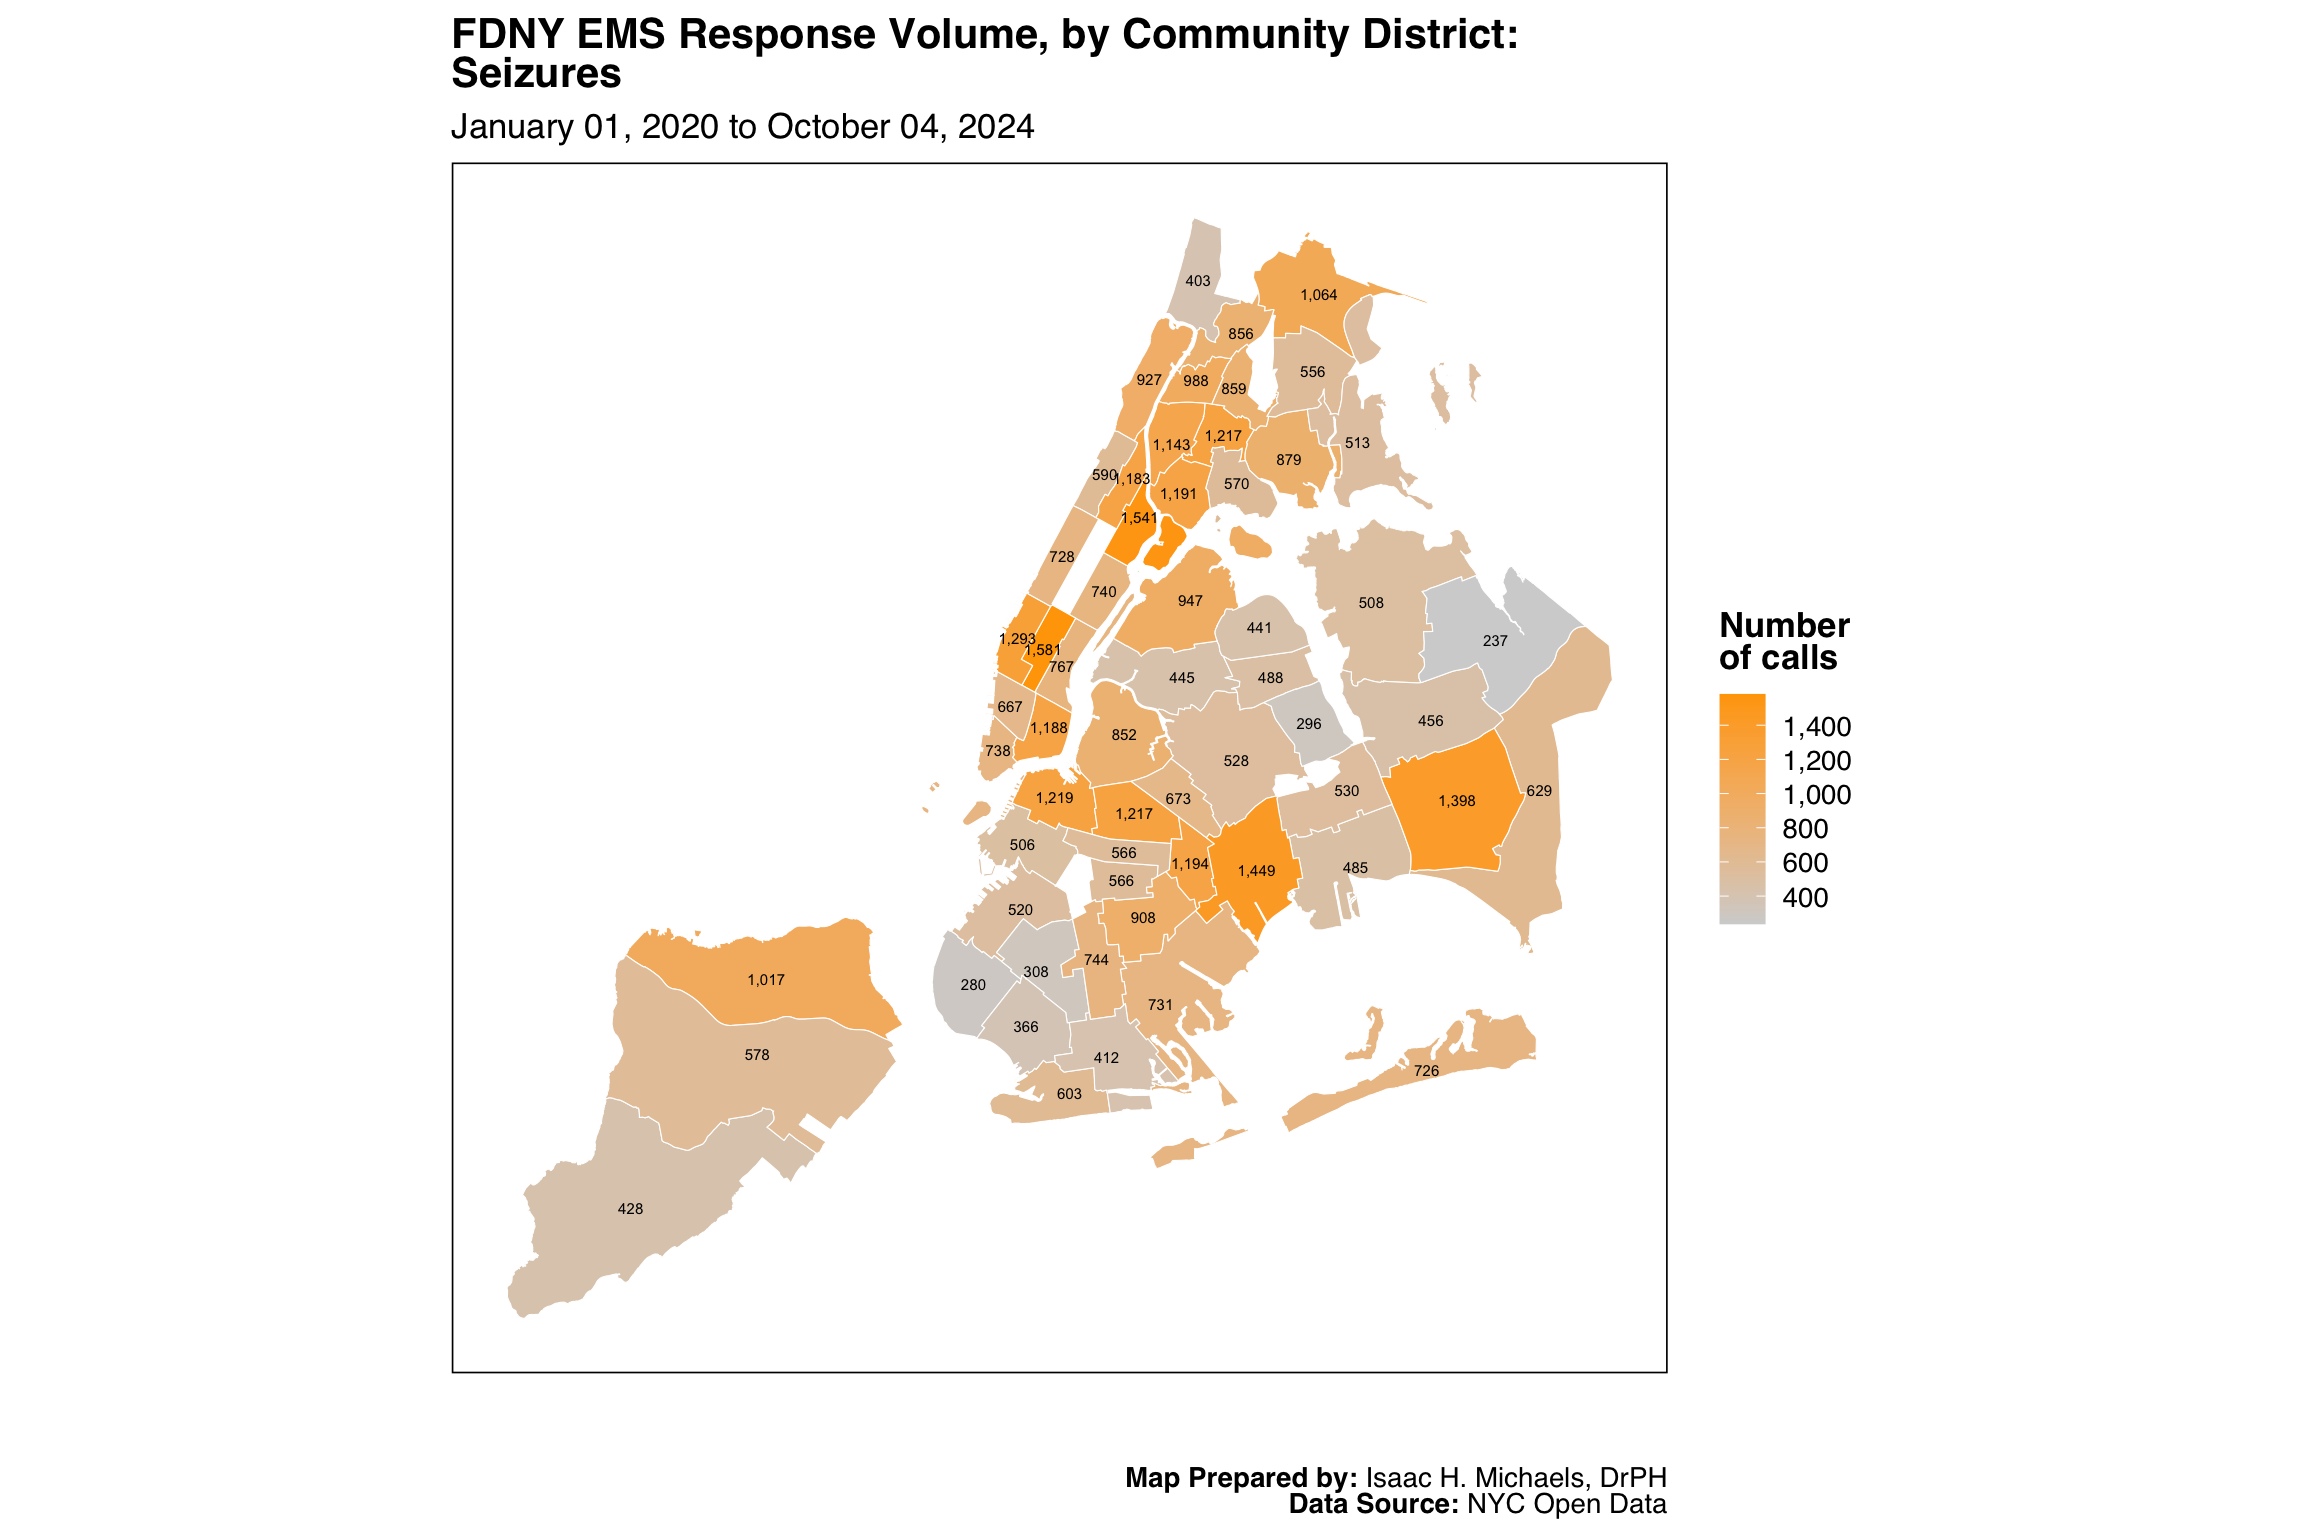
Map Prepared by: Isaac H. Michaels, DrPH
Data Source: NYC Open Data

Map Prepared by: Isaac H. Michaels, DrPH
EMS Data Source: NYC Open Data
Population Data Source: NYC Open Data
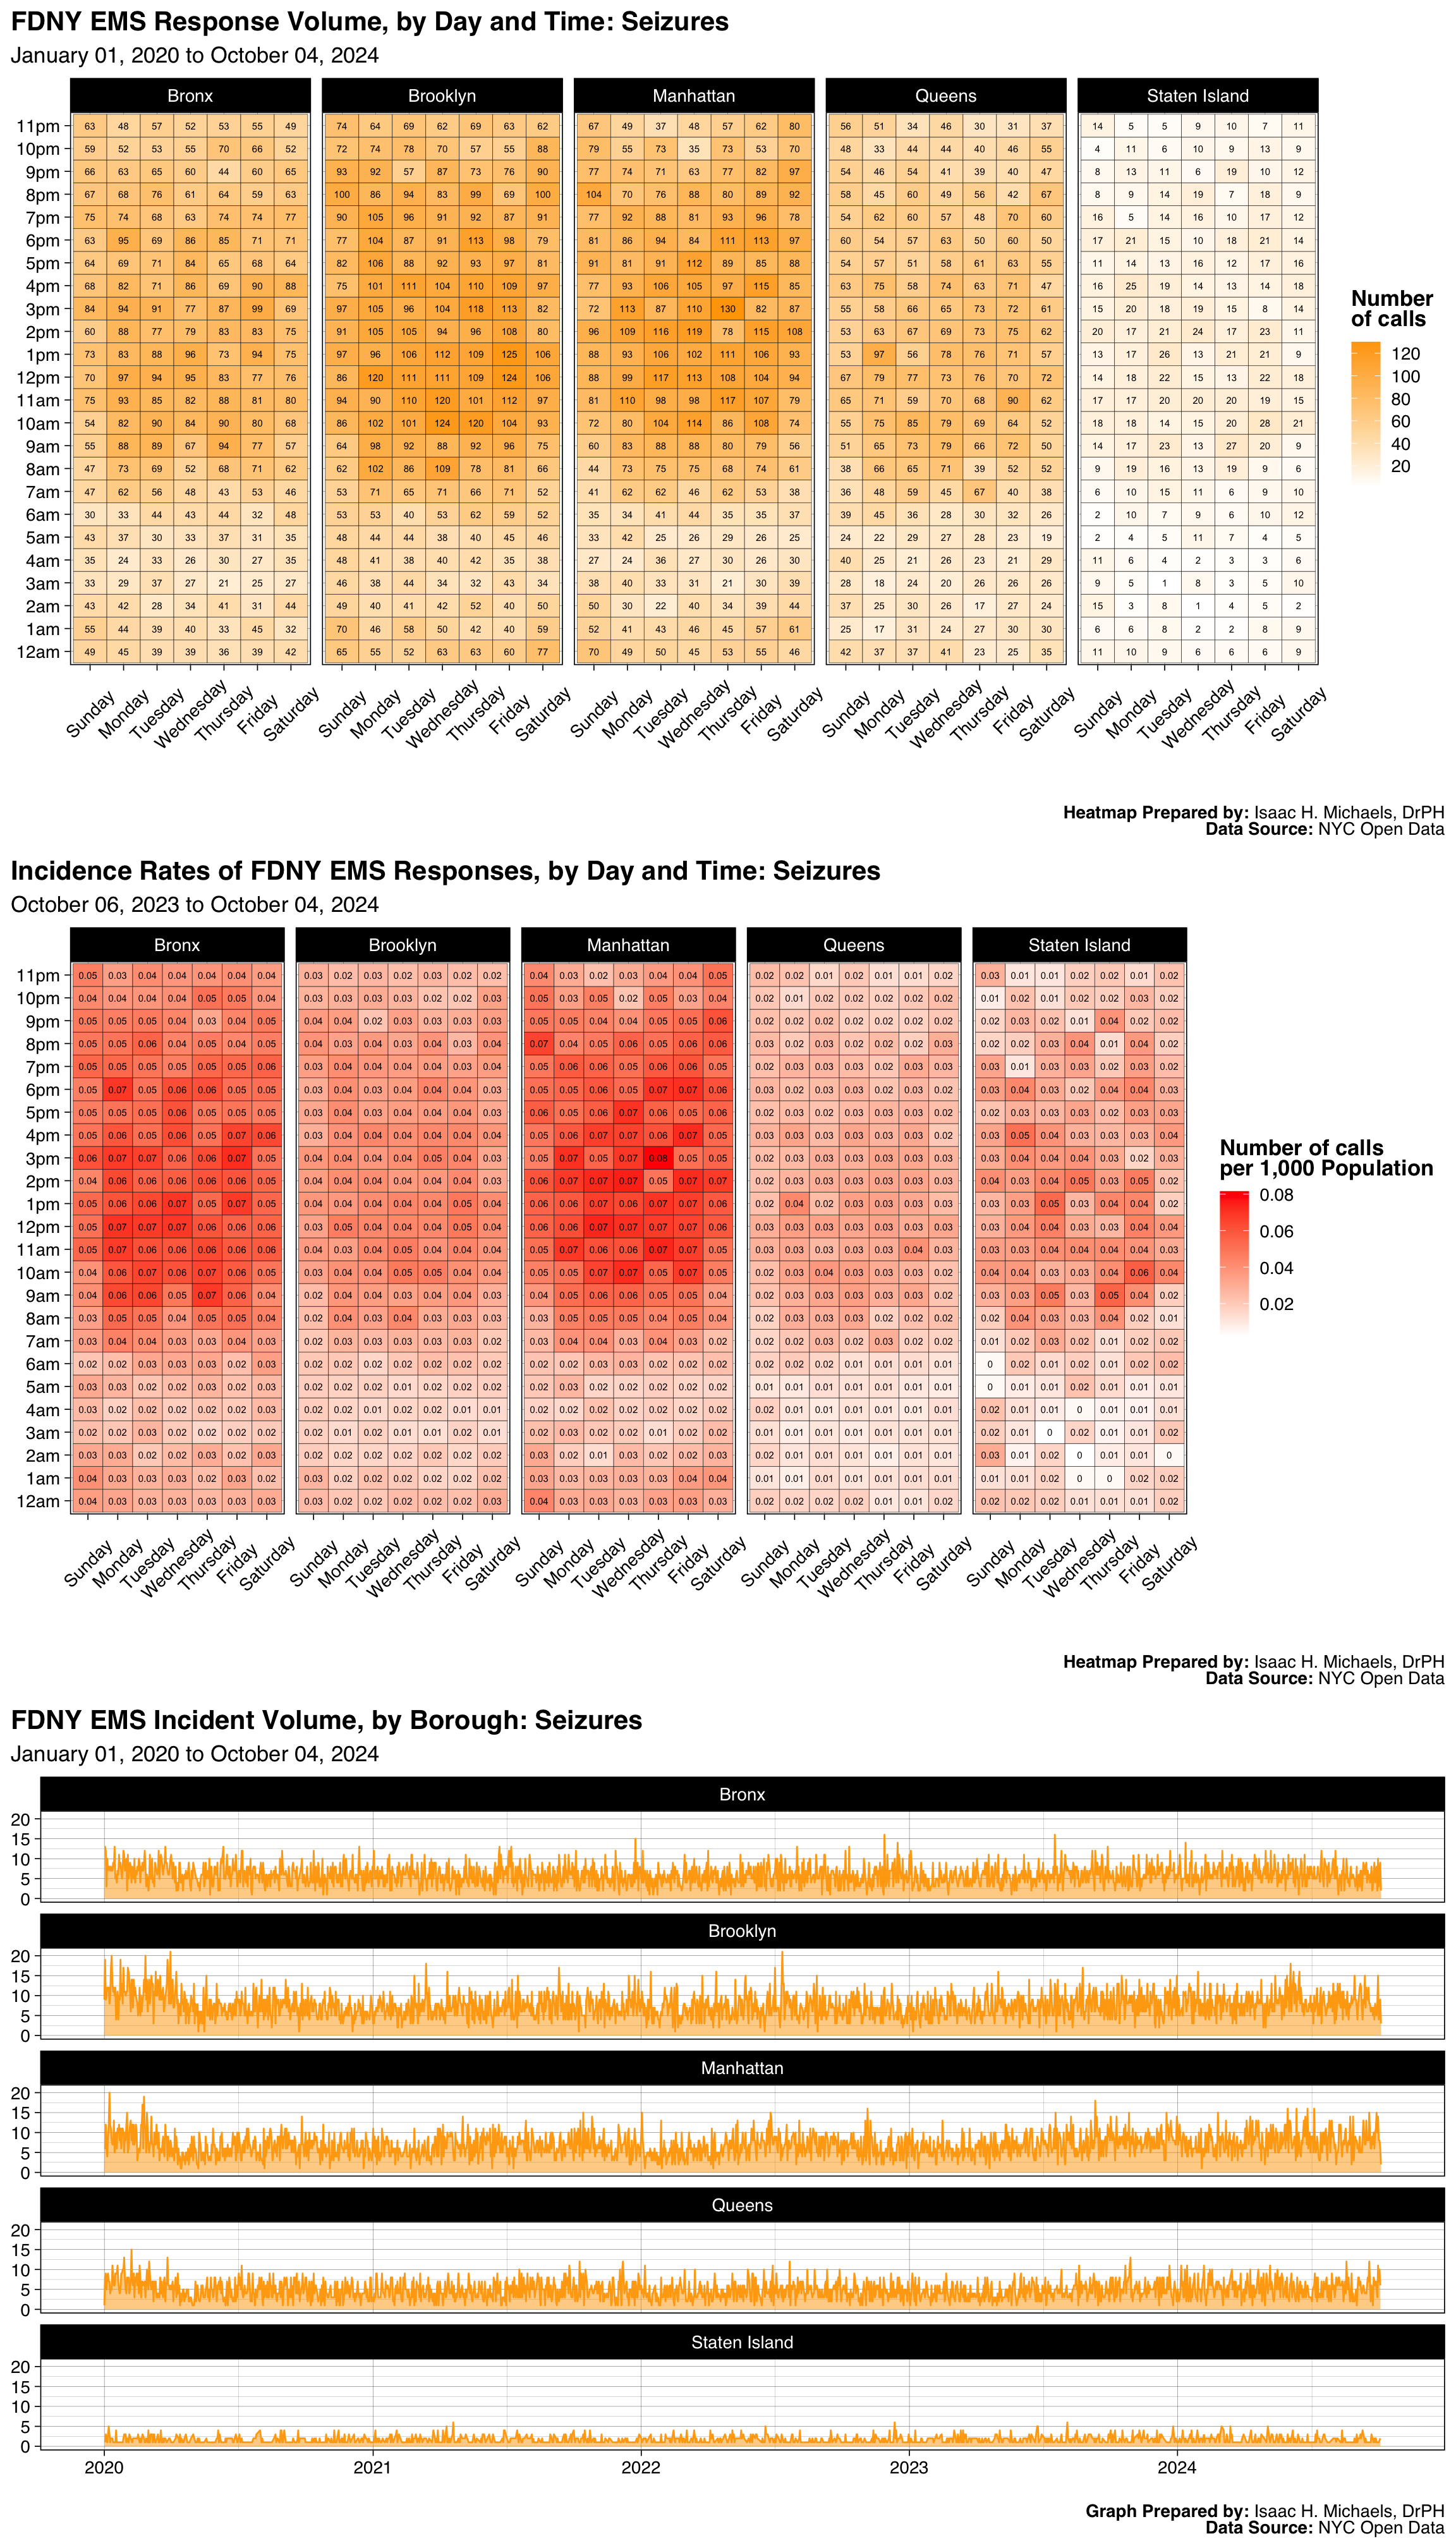
Graphs Prepared by: Isaac H. Michaels, DrPH
Data Source: NYC Open Data
| FDNY EMS Incident Volume, by Borough: Asthma Attack |
||||||
| January 01, 2025 to July 01, 2026 | ||||||
| Borough |
Latest Year: 2026
|
All Years: 2025-2026
|
||||
|---|---|---|---|---|---|---|
| Incidents | % | Rate per 1,000 Population | Total Incidents | % | Monthly Trend | |
| Bronx | 1,310 | 32% | 0.9 | 3,718 | 31% | |
| Brooklyn | 1,101 | 27% | 0.4 | 3,458 | 29% | |
| Manhattan | 858 | 21% | 0.5 | 2,555 | 21% | |
| Queens | 621 | 15% | 0.3 | 1,754 | 15% | |
| Staten Island | 194 | 5% | 0.4 | 532 | 4% | |
| Table Prepred by: Isaac H. Michaels, DrPH | ||||||
| Data Source: NYC Open Data | ||||||
Table Prepared by: Isaac H. Michaels, DrPH
EMS Data Source: NYC Open Data
Population Data Source: Health Data NY
| FDNY EMS Incident Volume, by Severity Level: Asthma Attack |
||||
| January 01, 2025 to July 01, 2026 | ||||
| Final Severity Level |
Latest Year: 2026
|
All Years: 2025-2026
|
||
|---|---|---|---|---|
| Incidents | % | Incidents | % | |
| 1 | 0 | 0% | 0 | 0% |
| 2 | 0 | 0% | 1 | 0% |
| 3 | 4,084 | 100% | 12,016 | 100% |
| 4 | 0 | 0% | 0 | 0% |
| 5 | 0 | 0% | 0 | 0% |
| 6 | 0 | 0% | 0 | 0% |
| 7 | 0 | 0% | 0 | 0% |
| 8 | 0 | 0% | 0 | 0% |
| Table Prepred by: Isaac H. Michaels, DrPH | ||||
| Data Source: NYC Open Data | ||||
Table Prepared by: Isaac H. Michaels, DrPH
Data Source: NYC Open Data
| FDNY EMS Incident Volume, by Disposition: Asthma Attack |
||||
| January 01, 2025 to July 01, 2026 | ||||
| Disposition |
Latest Year: 2026
|
All Years: 2025-2026
|
||
|---|---|---|---|---|
| Incidents | % | Incidents | % | |
| Cancelled | 50 | 1% | 104 | 1% |
| Condition Corrected | 35 | 1% | 90 | 1% |
| Patient Gone on Arrival | 80 | 2% | 196 | 2% |
| Refused Medical Aid | 828 | 20% | 2,372 | 20% |
| Transporting Patient | 2,923 | 72% | 8,747 | 73% |
| Treated and Transported | 3 | 0% | 12 | 0% |
| Triaged at Scene No Transport | 1 | 0% | 1 | 0% |
| Unfounded | 156 | 4% | 472 | 4% |
| NA | 8 | 0% | 18 | 0% |
| Table Prepred by: Isaac H. Michaels, DrPH | ||||
| Data Source: NYC Open Data | ||||
Table Prepared by: Isaac H. Michaels, DrPH
Data Source: NYC Open Data
Back to top
Hypothermia
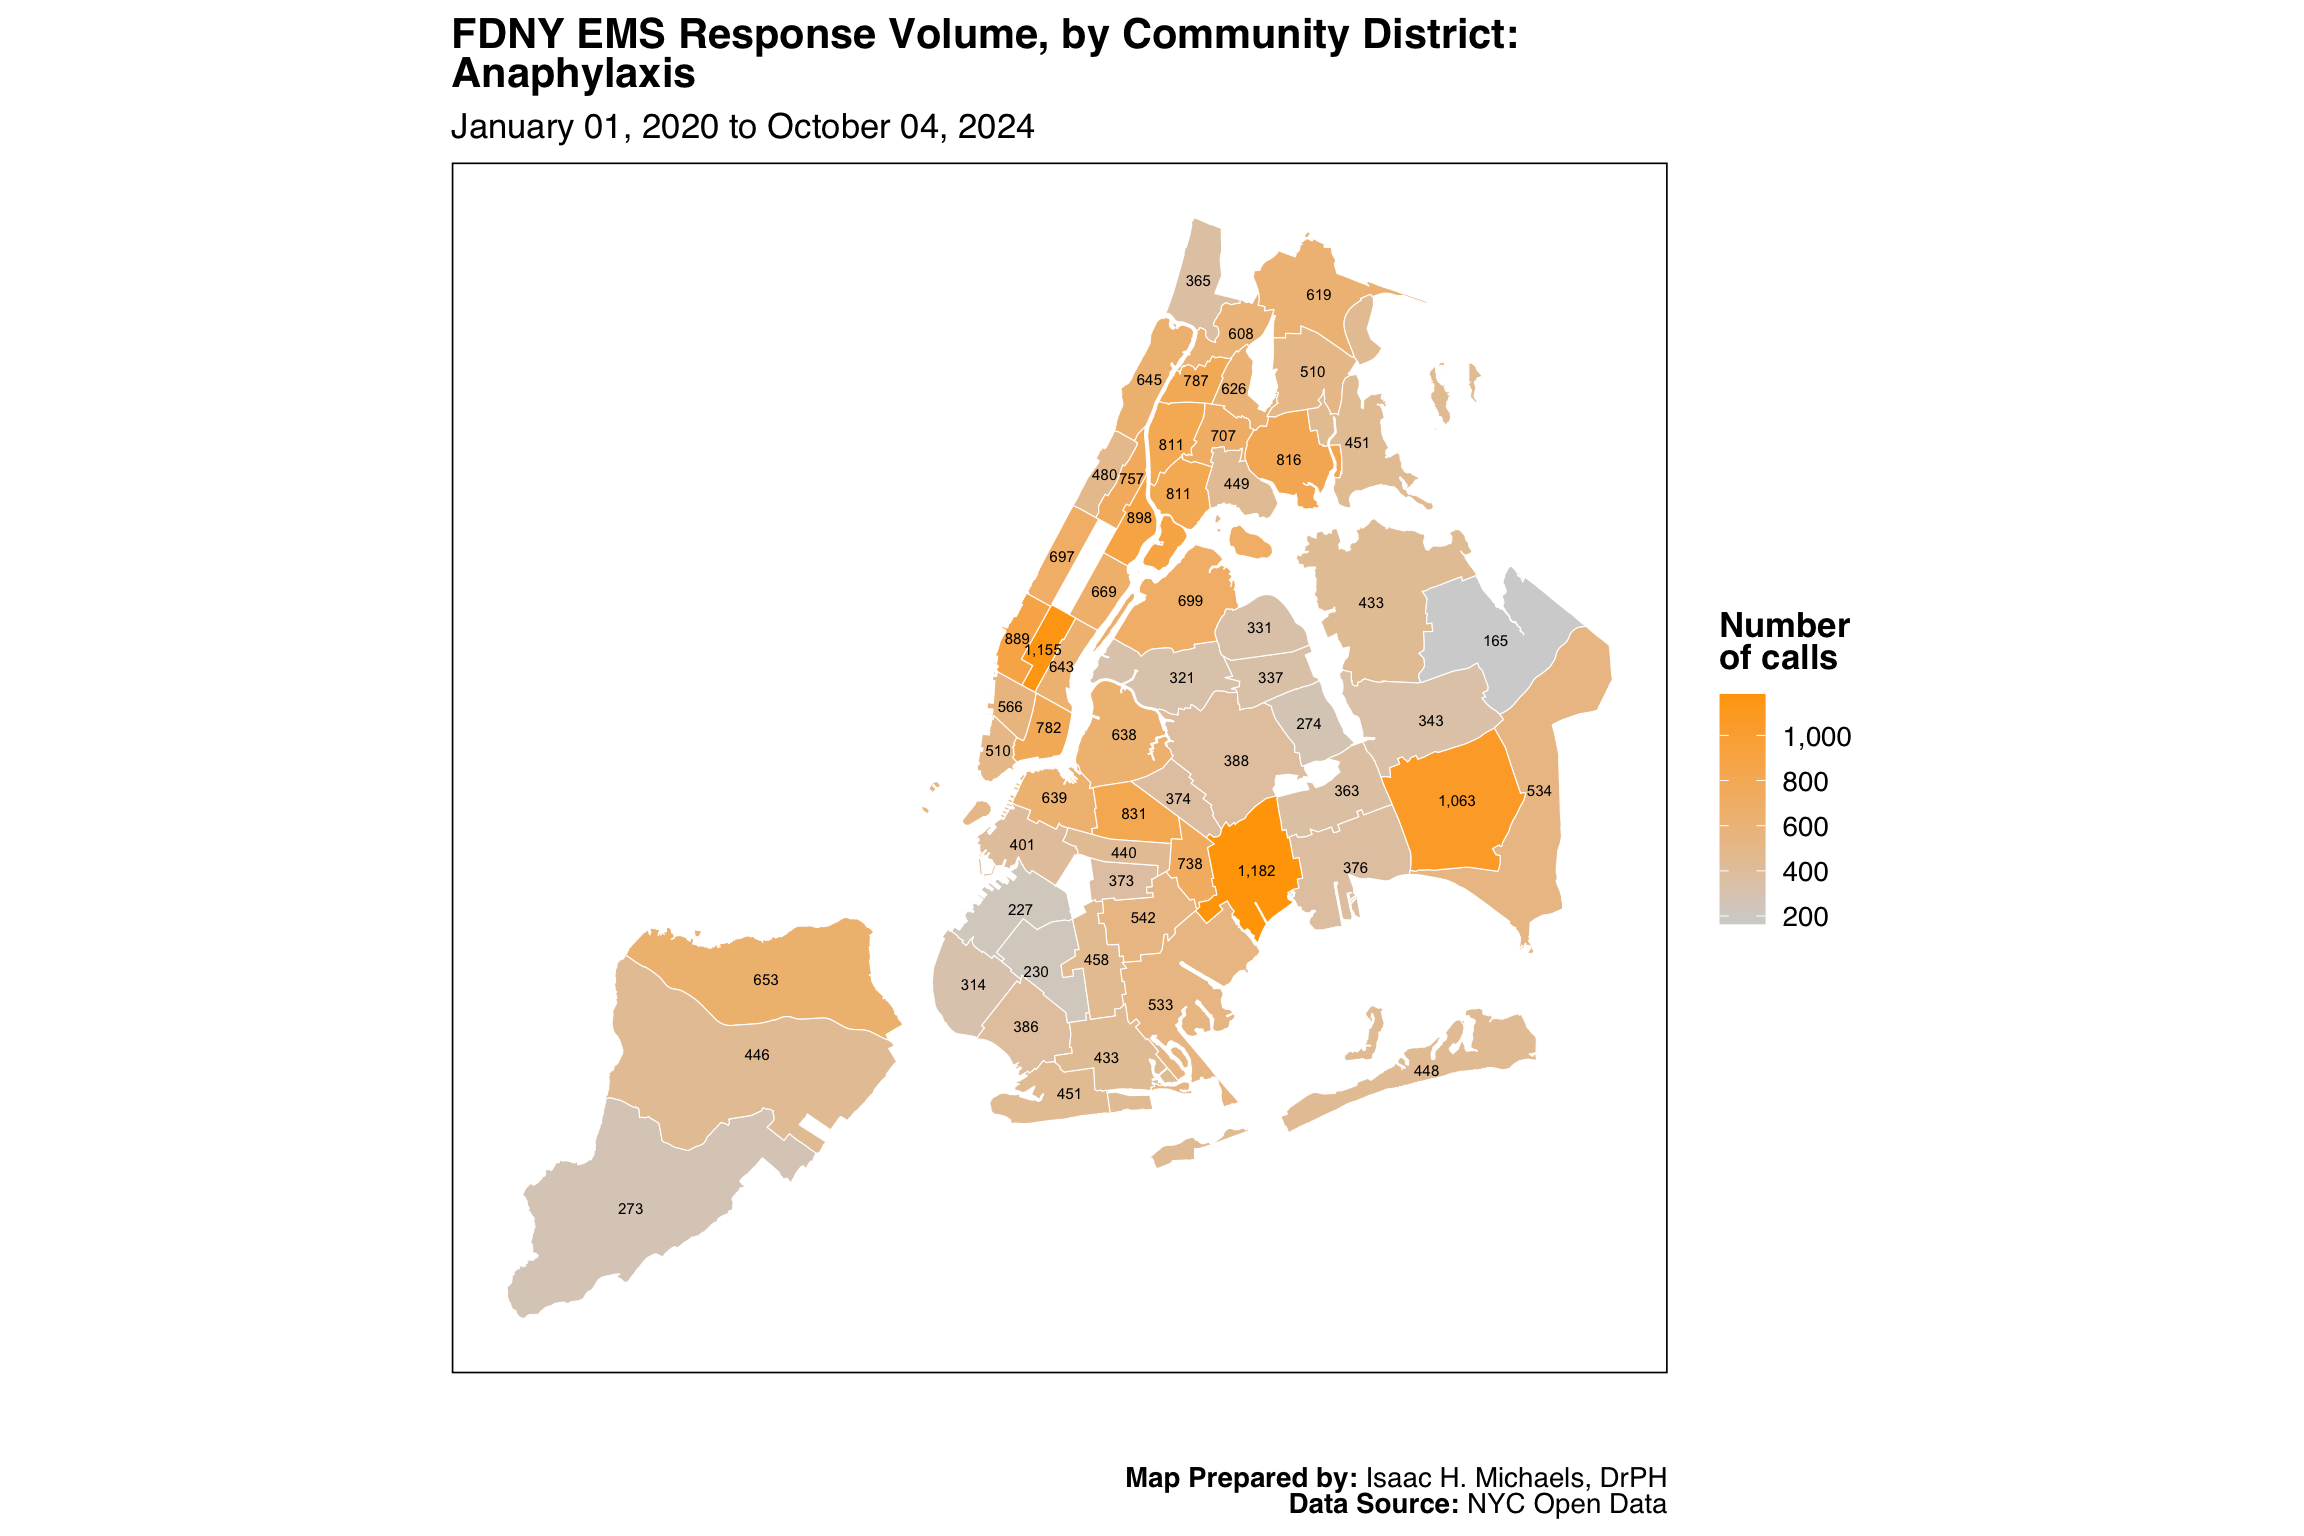
Map Prepared by: Isaac H. Michaels, DrPH
Data Source: NYC Open Data

Map Prepared by: Isaac H. Michaels, DrPH
EMS Data Source: NYC Open Data
Population Data Source: NYC Open Data
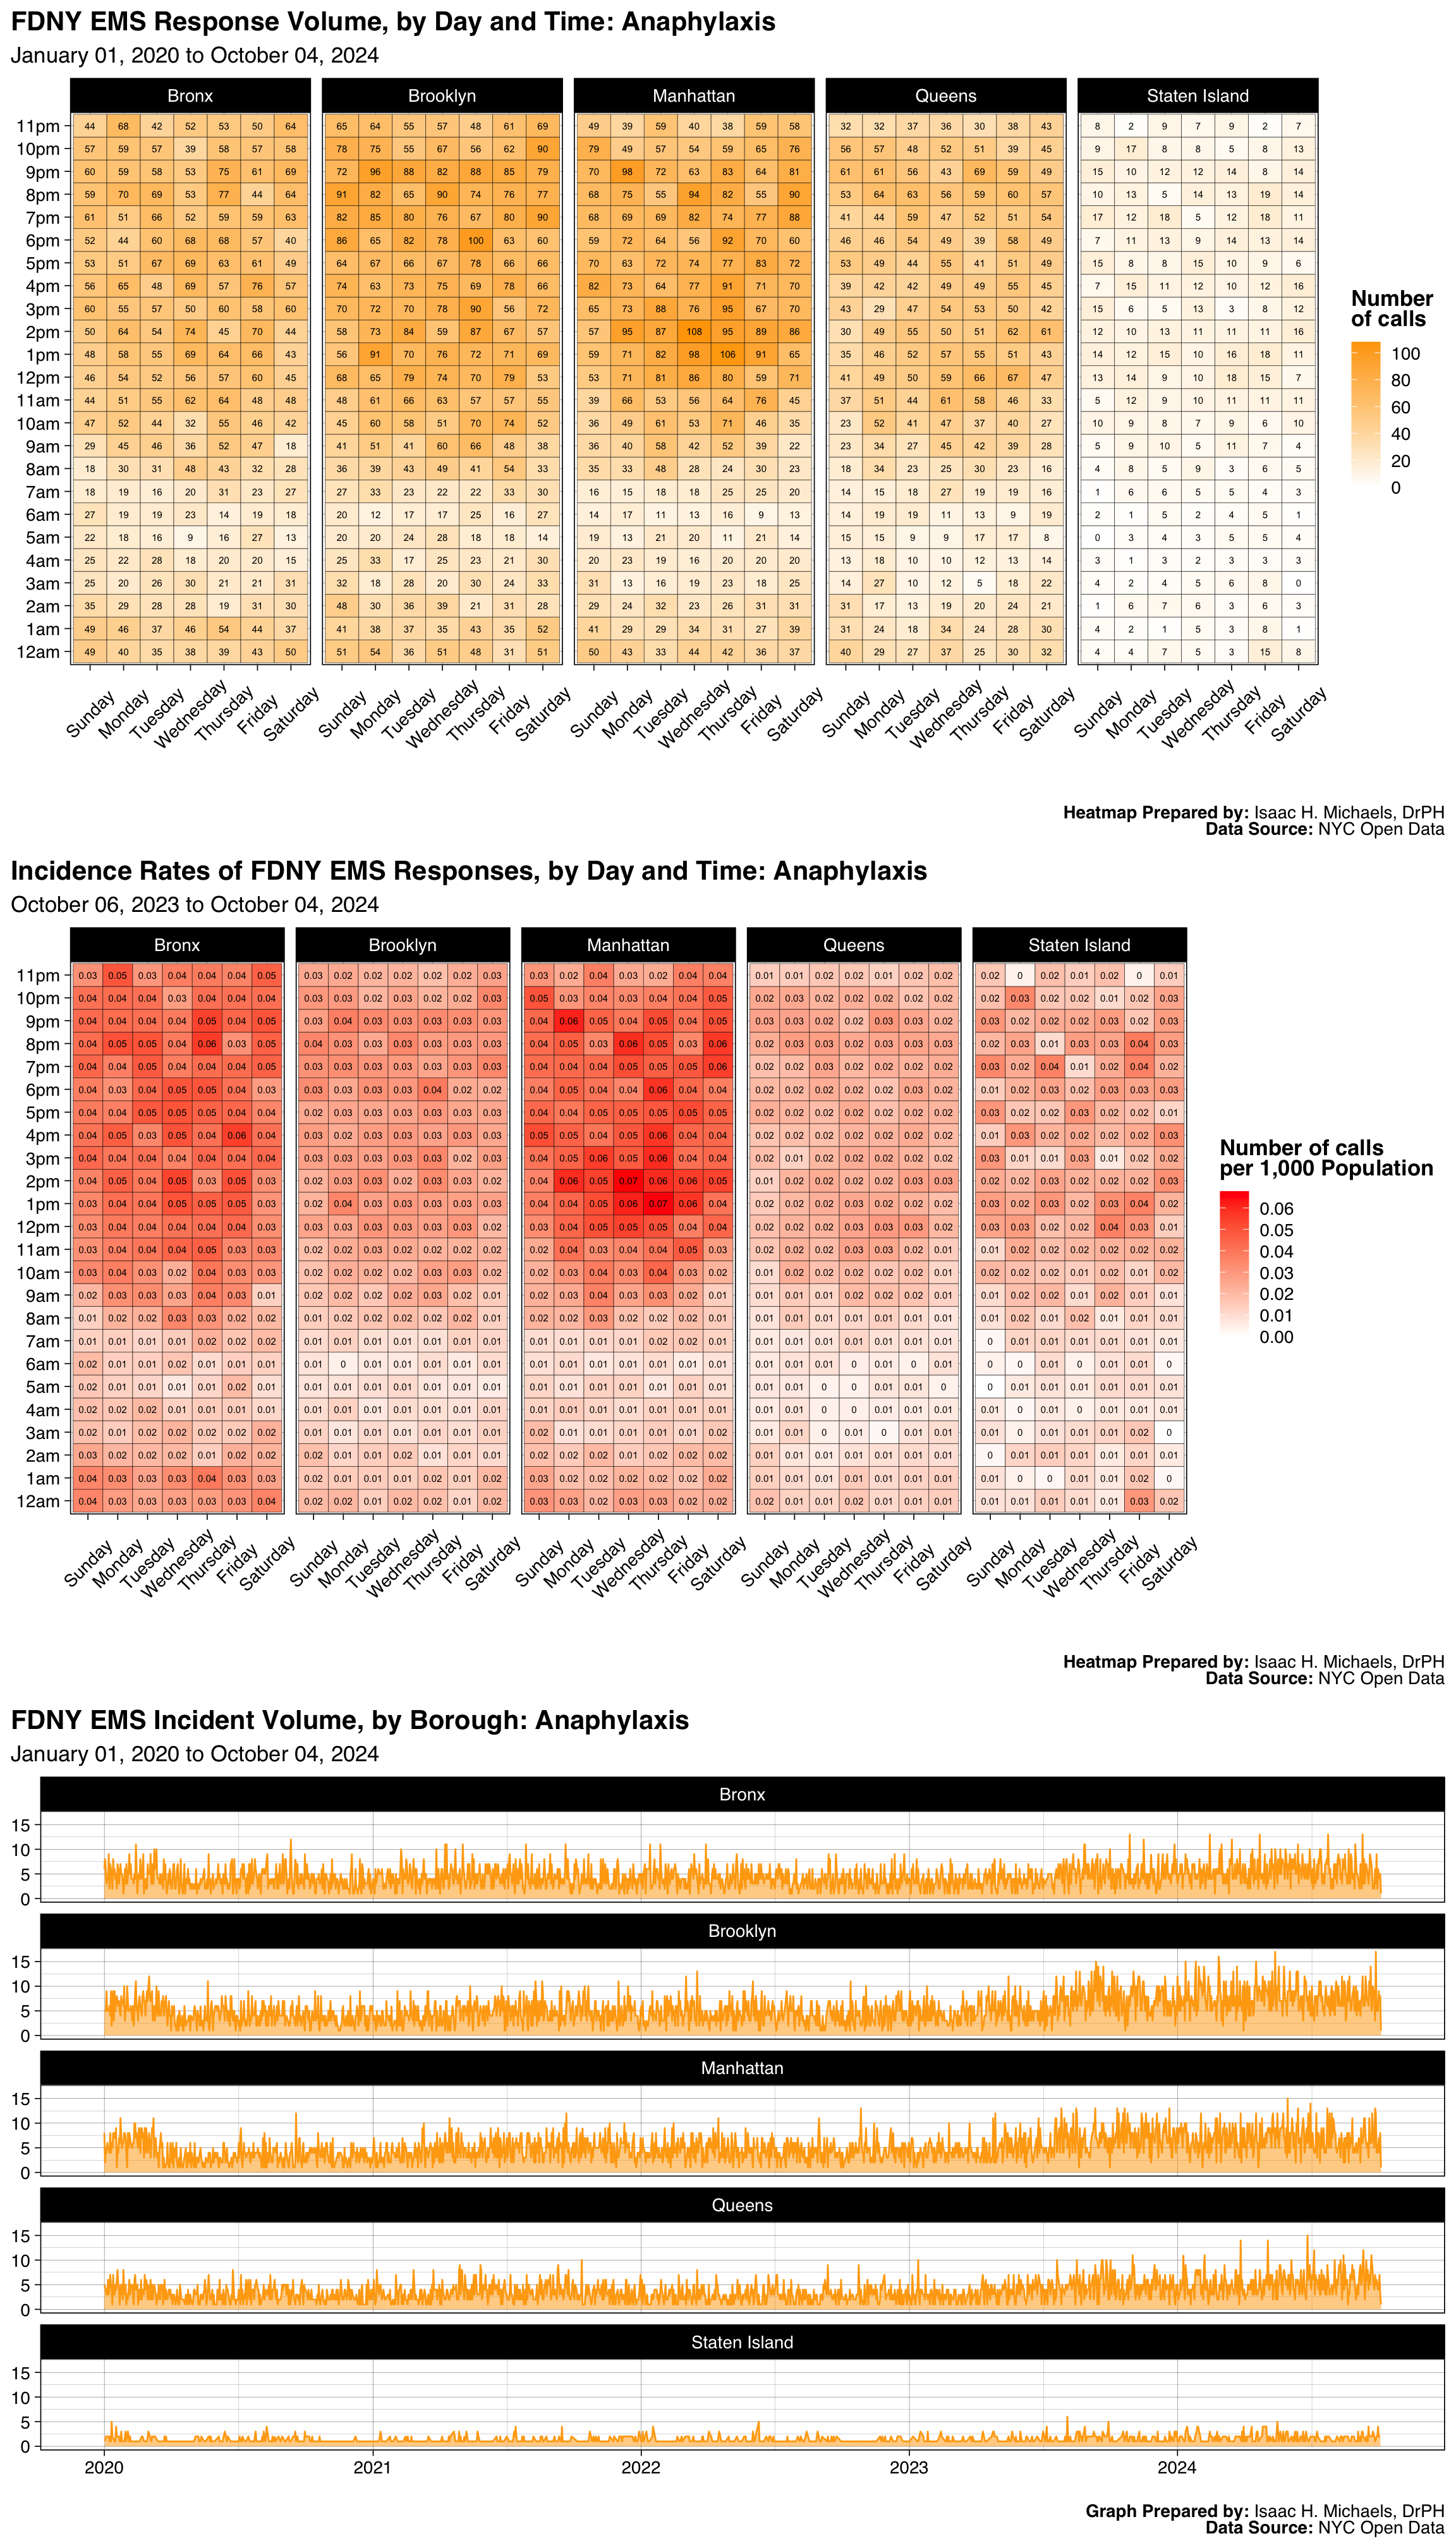
Graphs Prepared by: Isaac H. Michaels, DrPH
Data Source: NYC Open Data
| FDNY EMS Incident Volume, by Borough: Hypothermia |
||||||
| January 01, 2025 to July 01, 2026 | ||||||
| Borough |
Latest Year: 2026
|
All Years: 2025-2026
|
||||
|---|---|---|---|---|---|---|
| Incidents | % | Rate per 1,000 Population | Total Incidents | % | Monthly Trend | |
| Bronx | 653 | 7% | 0.5 | 933 | 8% | |
| Brooklyn | 2,009 | 22% | 0.8 | 2,637 | 22% | |
| Manhattan | 4,950 | 55% | 3.1 | 6,300 | 54% | |
| Queens | 1,172 | 13% | 0.5 | 1,611 | 14% | |
| Staten Island | 160 | 2% | 0.3 | 260 | 2% | |
| Table Prepred by: Isaac H. Michaels, DrPH | ||||||
| Data Source: NYC Open Data | ||||||
Table Prepared by: Isaac H. Michaels, DrPH
EMS Data Source: NYC Open Data
Population Data Source: Health Data NY
| FDNY EMS Incident Volume, by Severity Level: Hypothermia |
||||
| January 01, 2025 to July 01, 2026 | ||||
| Final Severity Level |
Latest Year: 2026
|
All Years: 2025-2026
|
||
|---|---|---|---|---|
| Incidents | % | Incidents | % | |
| 1 | 0 | 0% | 0 | 0% |
| 2 | 0 | 0% | 0 | 0% |
| 3 | 2 | 0% | 3 | 0% |
| 4 | 5,171 | 58% | 5,189 | 44% |
| 5 | 3,771 | 42% | 6,549 | 56% |
| 6 | 0 | 0% | 0 | 0% |
| 7 | 0 | 0% | 0 | 0% |
| 8 | 0 | 0% | 0 | 0% |
| Table Prepred by: Isaac H. Michaels, DrPH | ||||
| Data Source: NYC Open Data | ||||
Table Prepared by: Isaac H. Michaels, DrPH
Data Source: NYC Open Data
| FDNY EMS Incident Volume, by Disposition: Hypothermia |
||||
| January 01, 2025 to July 01, 2026 | ||||
| Disposition |
Latest Year: 2026
|
All Years: 2025-2026
|
||
|---|---|---|---|---|
| Incidents | % | Incidents | % | |
| Cancelled | 211 | 2% | 241 | 2% |
| Condition Corrected | 110 | 1% | 201 | 2% |
| Patient Gone on Arrival | 422 | 5% | 548 | 5% |
| Patient Pronounced Dead | 1 | 0% | 1 | 0% |
| Refused Medical Aid | 3,466 | 39% | 4,259 | 36% |
| Transporting Patient | 1,301 | 15% | 2,038 | 17% |
| Treated Not Transported | 1 | 0% | 1 | 0% |
| Treated and Transported | 6 | 0% | 6 | 0% |
| Triaged at Scene No Transport | 1 | 0% | 1 | 0% |
| Unfounded | 3,059 | 34% | 4,031 | 34% |
| NA | 366 | 4% | 414 | 4% |
| Table Prepred by: Isaac H. Michaels, DrPH | ||||
| Data Source: NYC Open Data | ||||
Table Prepared by: Isaac H. Michaels, DrPH
Data Source: NYC Open Data
Back to top
Stabbing
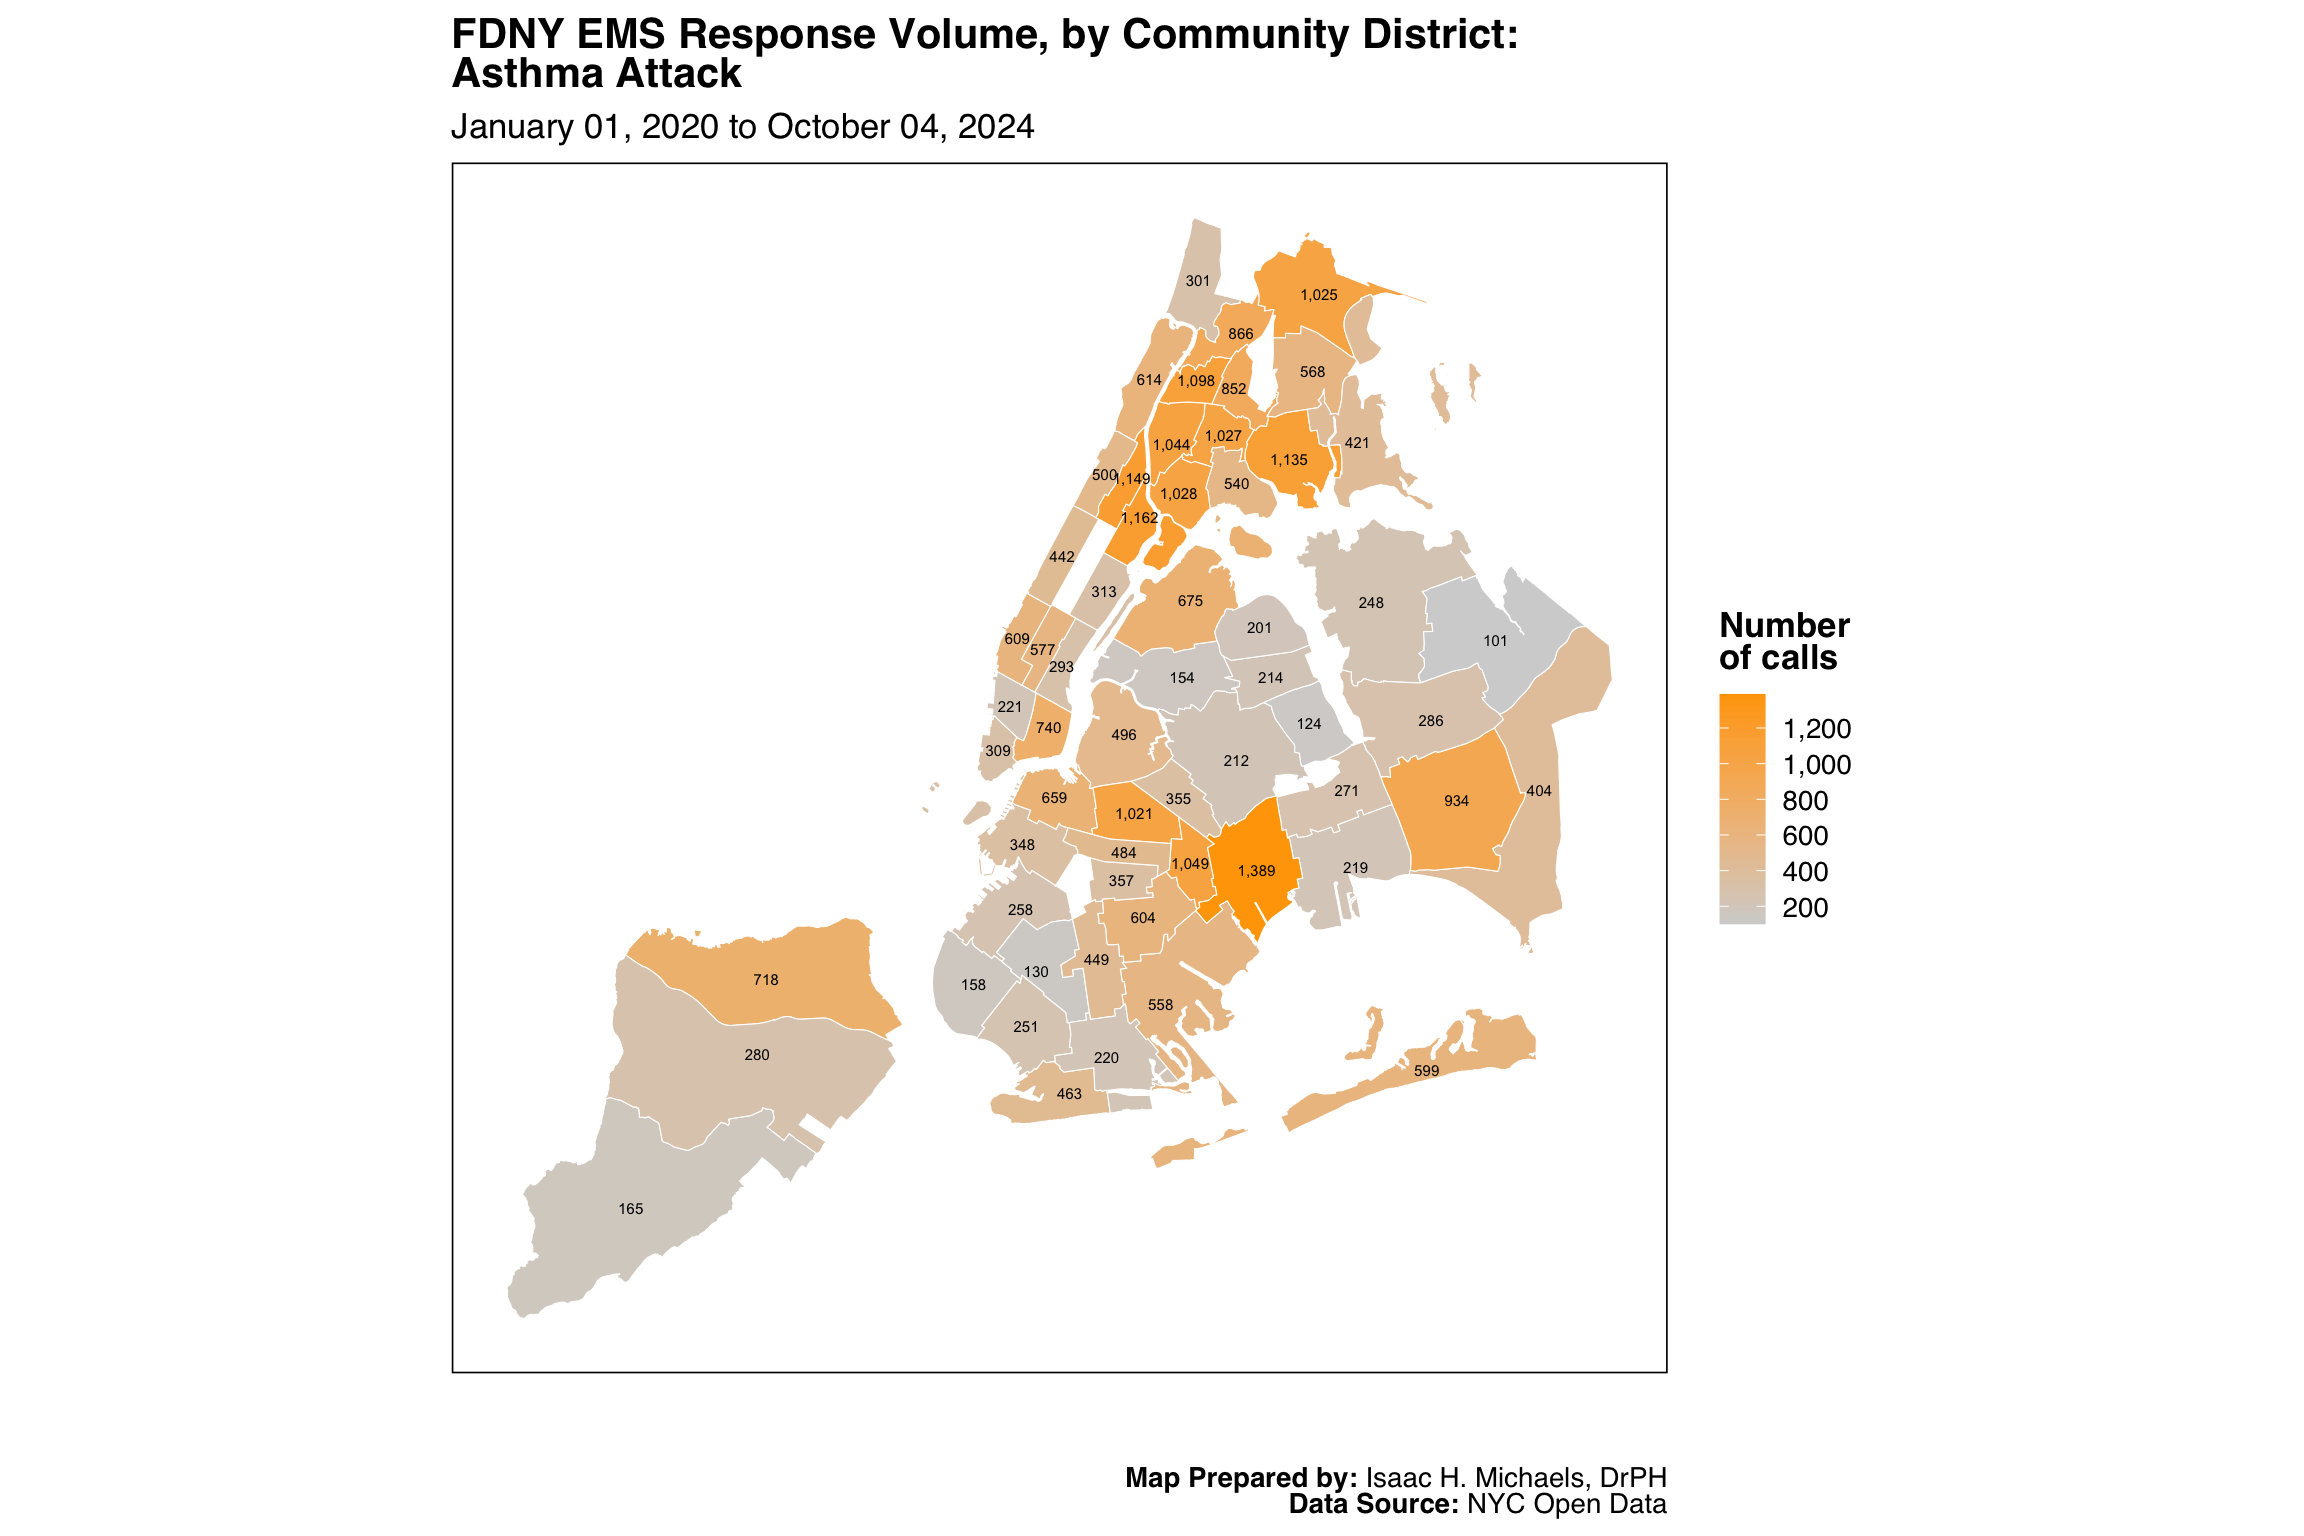
Map Prepared by: Isaac H. Michaels, DrPH
Data Source: NYC Open Data
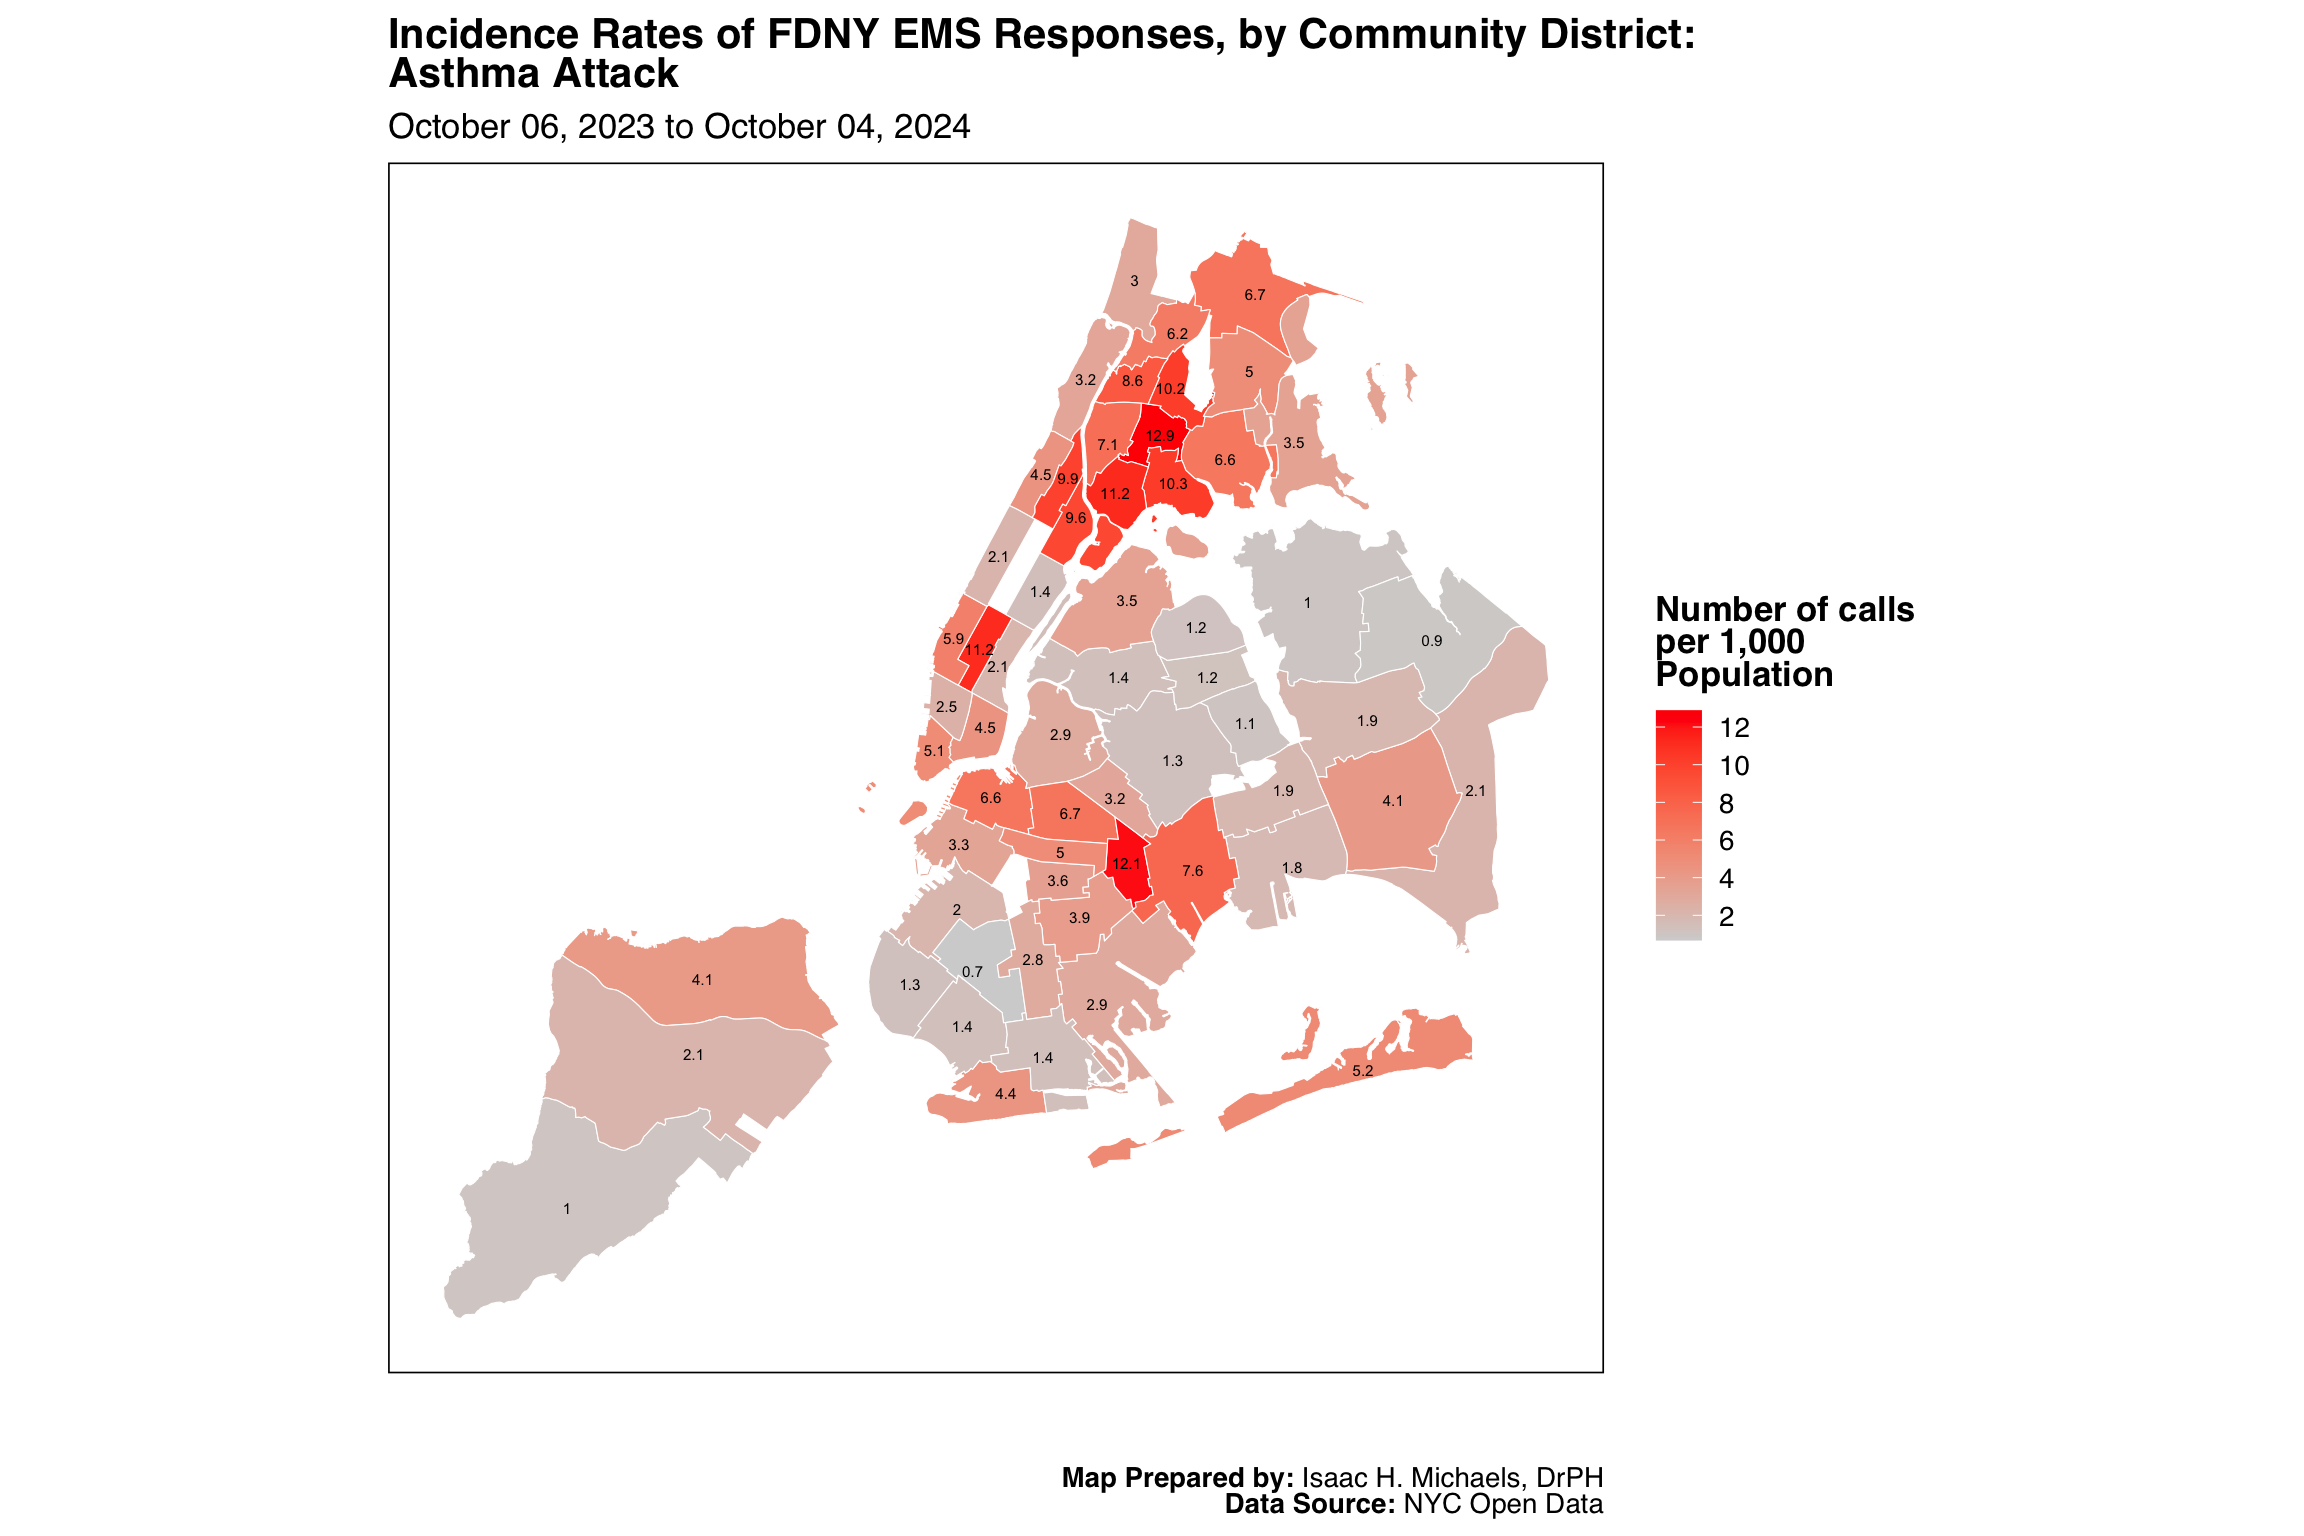
Map Prepared by: Isaac H. Michaels, DrPH
EMS Data Source: NYC Open Data
Population Data Source: NYC Open Data
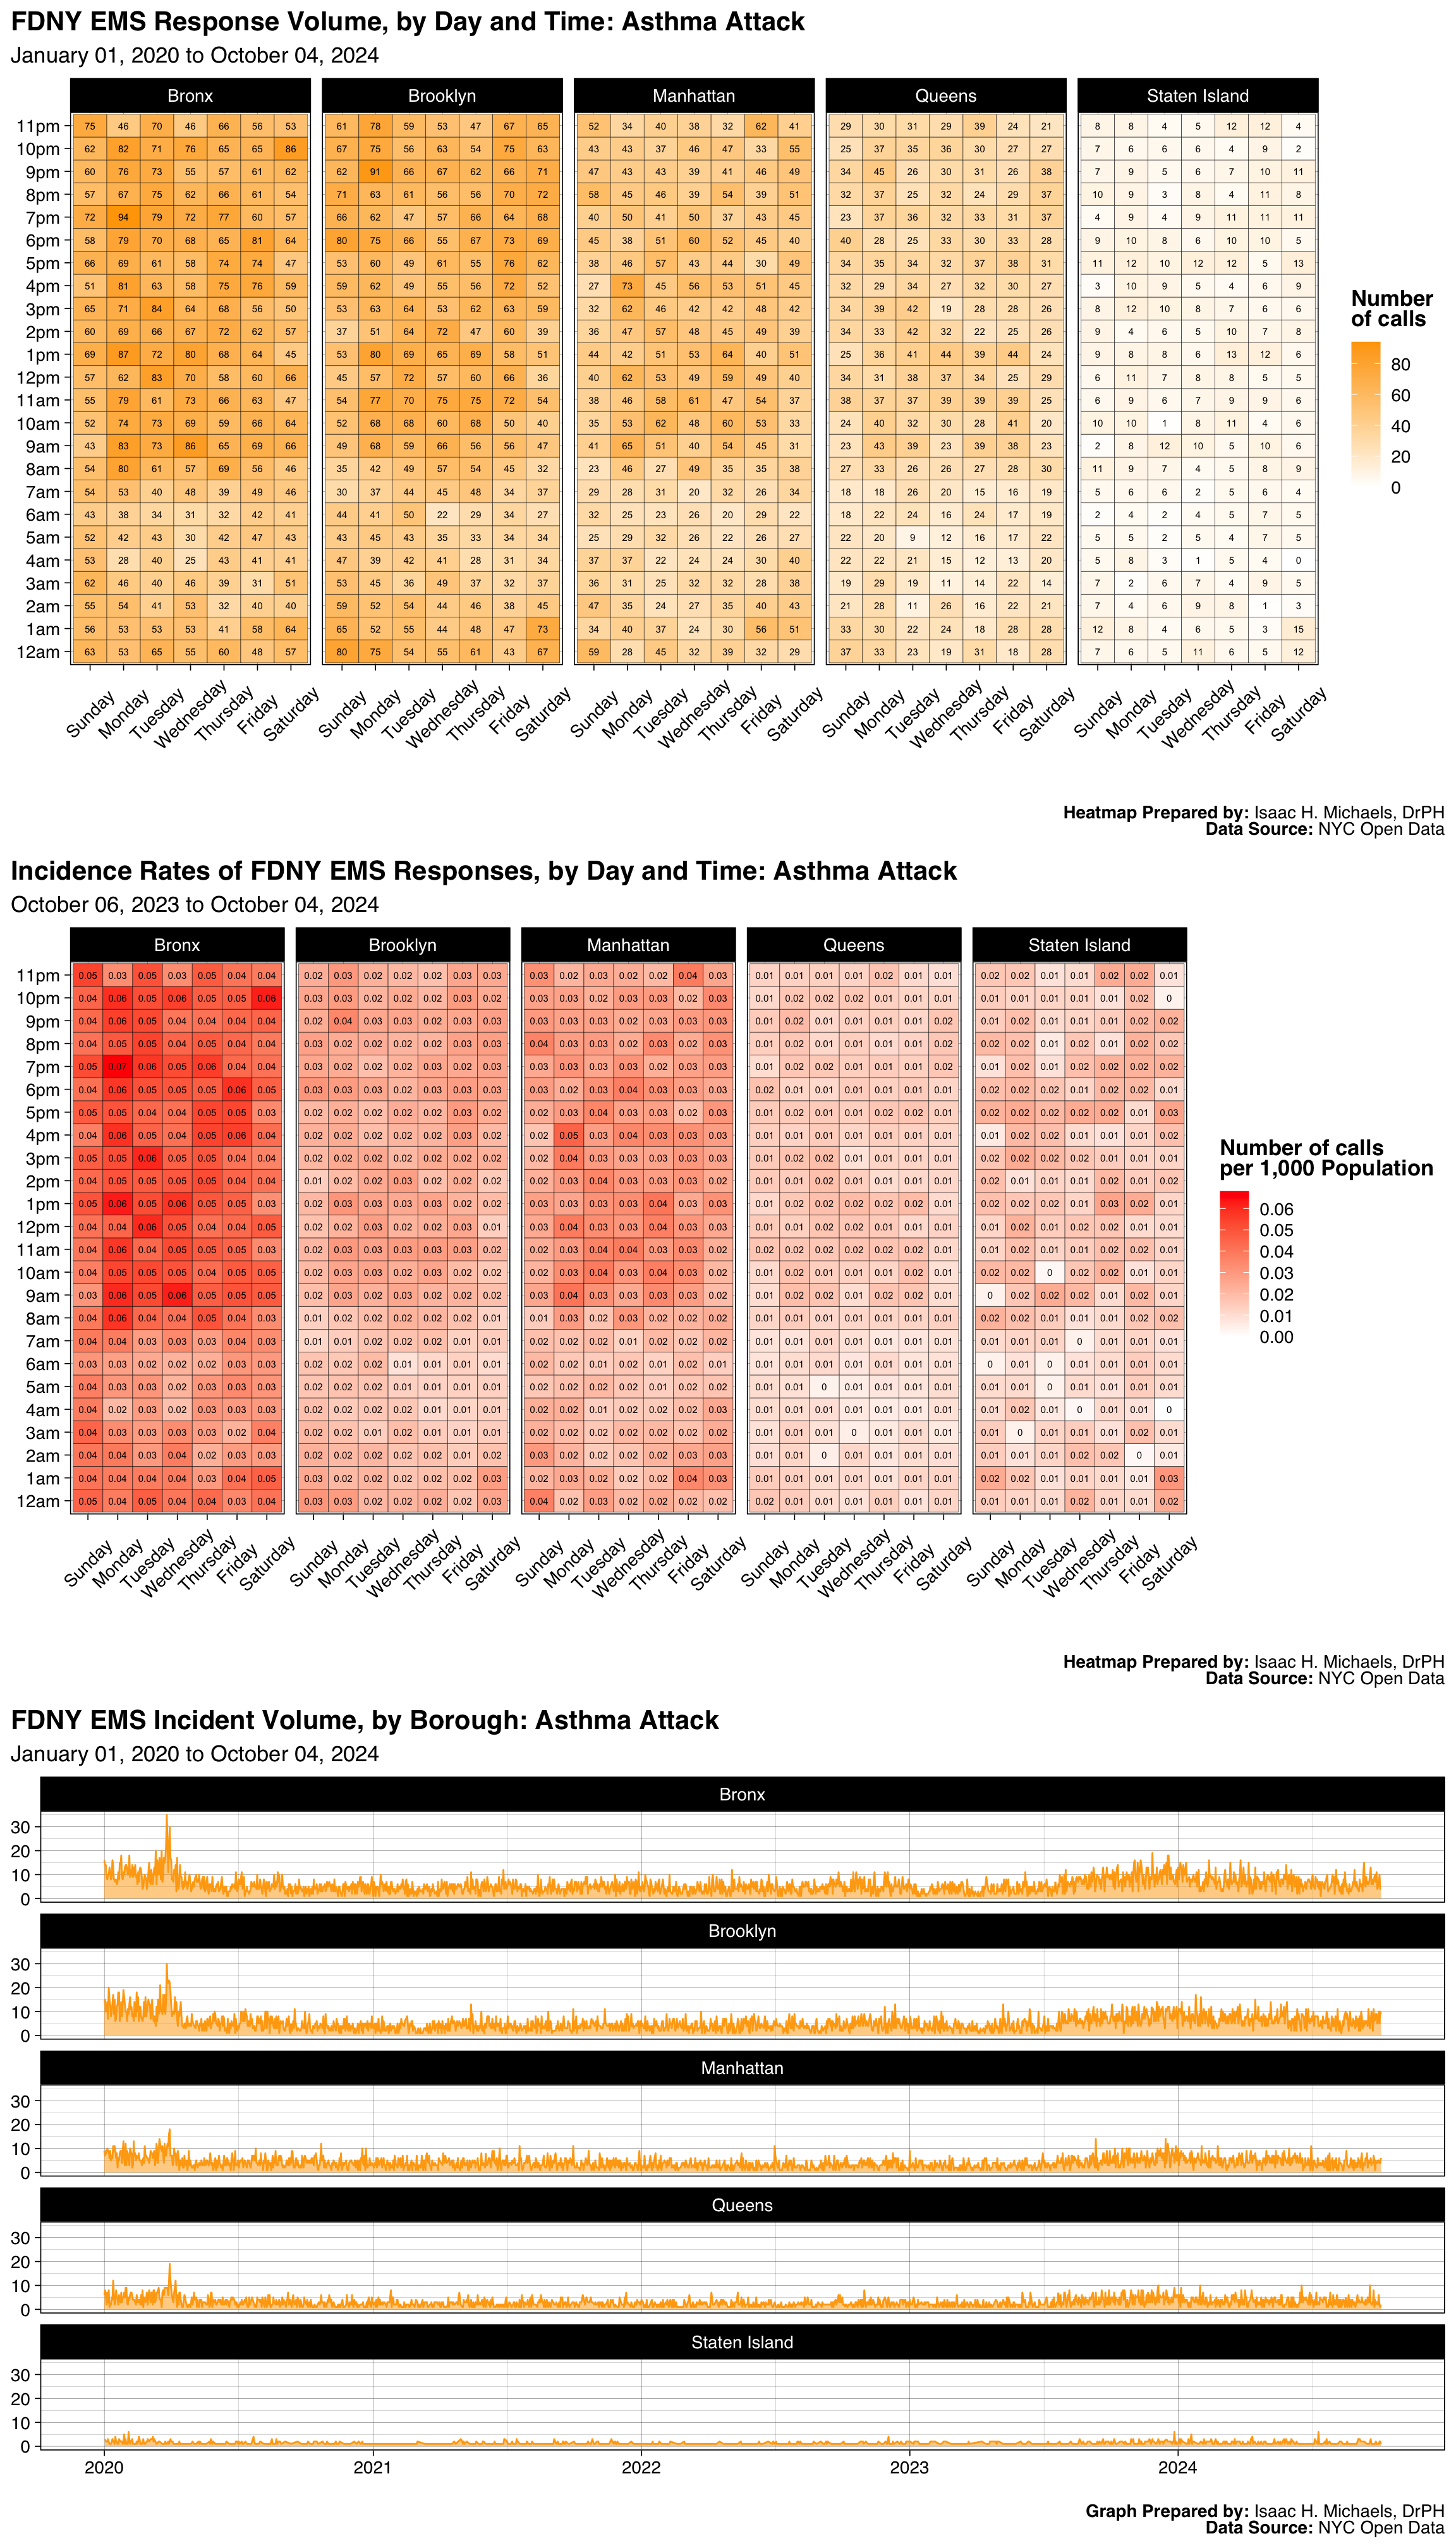
Graphs Prepared by: Isaac H. Michaels, DrPH
Data Source: NYC Open Data
| FDNY EMS Incident Volume, by Borough: Stabbing |
||||||
| January 01, 2025 to July 01, 2026 | ||||||
| Borough |
Latest Year: 2026
|
All Years: 2025-2026
|
||||
|---|---|---|---|---|---|---|
| Incidents | % | Rate per 1,000 Population | Total Incidents | % | Monthly Trend | |
| Bronx | 1,002 | 32% | 0.7 | 3,200 | 32% | |
| Brooklyn | 927 | 30% | 0.4 | 2,881 | 29% | |
| Manhattan | 543 | 17% | 0.3 | 1,687 | 17% | |
| Queens | 555 | 18% | 0.2 | 1,823 | 18% | |
| Staten Island | 85 | 3% | 0.2 | 269 | 3% | |
| Table Prepred by: Isaac H. Michaels, DrPH | ||||||
| Data Source: NYC Open Data | ||||||
Table Prepared by: Isaac H. Michaels, DrPH
EMS Data Source: NYC Open Data
Population Data Source: Health Data NY
| FDNY EMS Incident Volume, by Severity Level: Stabbing |
||||
| January 01, 2025 to July 01, 2026 | ||||
| Final Severity Level |
Latest Year: 2026
|
All Years: 2025-2026
|
||
|---|---|---|---|---|
| Incidents | % | Incidents | % | |
| 1 | 0 | 0% | 0 | 0% |
| 2 | 1 | 0% | 1 | 0% |
| 3 | 3,111 | 100% | 9,859 | 100% |
| 4 | 0 | 0% | 0 | 0% |
| 5 | 0 | 0% | 0 | 0% |
| 6 | 0 | 0% | 0 | 0% |
| 7 | 0 | 0% | 0 | 0% |
| 8 | 0 | 0% | 0 | 0% |
| Table Prepred by: Isaac H. Michaels, DrPH | ||||
| Data Source: NYC Open Data | ||||
Table Prepared by: Isaac H. Michaels, DrPH
Data Source: NYC Open Data
| FDNY EMS Incident Volume, by Disposition: Stabbing |
||||
| January 01, 2025 to July 01, 2026 | ||||
| Disposition |
Latest Year: 2026
|
All Years: 2025-2026
|
||
|---|---|---|---|---|
| Incidents | % | Incidents | % | |
| Cancelled | 147 | 5% | 403 | 4% |
| Condition Corrected | 346 | 11% | 1,097 | 11% |
| Patient Gone on Arrival | 164 | 5% | 495 | 5% |
| Patient Pronounced Dead | 2 | 0% | 3 | 0% |
| Refused Medical Aid | 359 | 12% | 1,248 | 13% |
| Transporting Patient | 1,367 | 44% | 4,425 | 45% |
| Treated and Transported | 3 | 0% | 13 | 0% |
| Unfounded | 669 | 21% | 2,078 | 21% |
| NA | 55 | 2% | 98 | 1% |
| Table Prepred by: Isaac H. Michaels, DrPH | ||||
| Data Source: NYC Open Data | ||||
Table Prepared by: Isaac H. Michaels, DrPH
Data Source: NYC Open Data
Back to top
Sick Pediatric, <5 Year Old
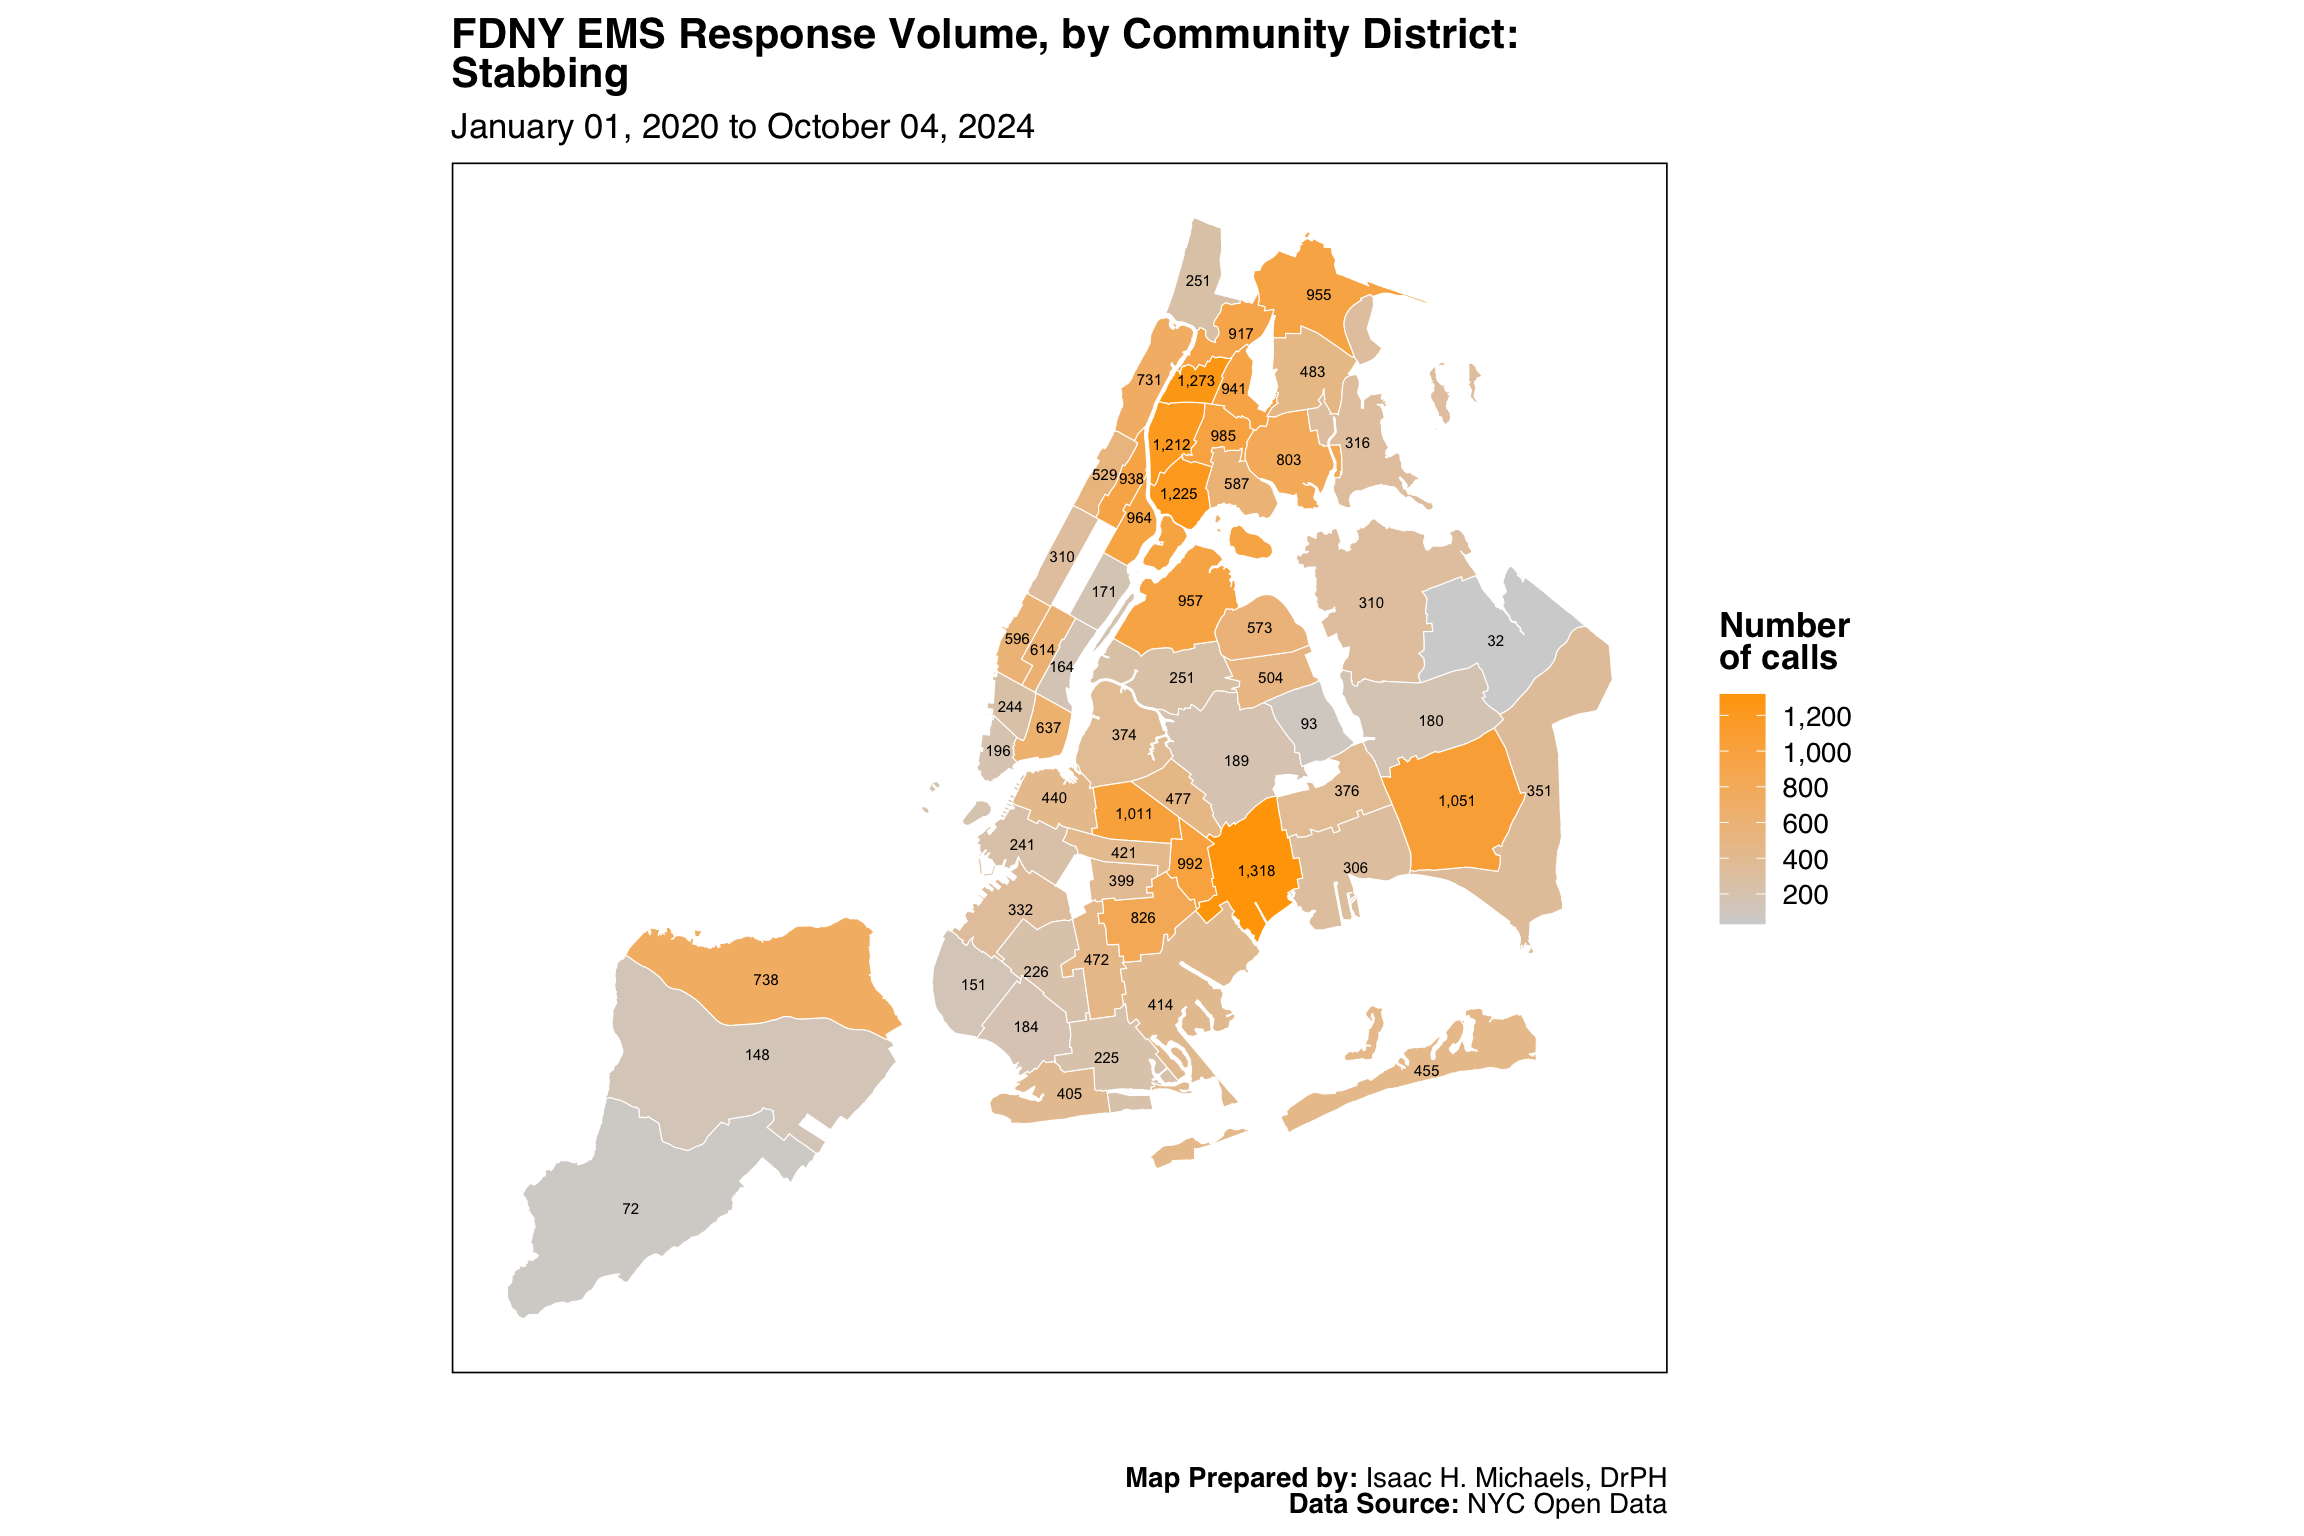
Map Prepared by: Isaac H. Michaels, DrPH
Data Source: NYC Open Data
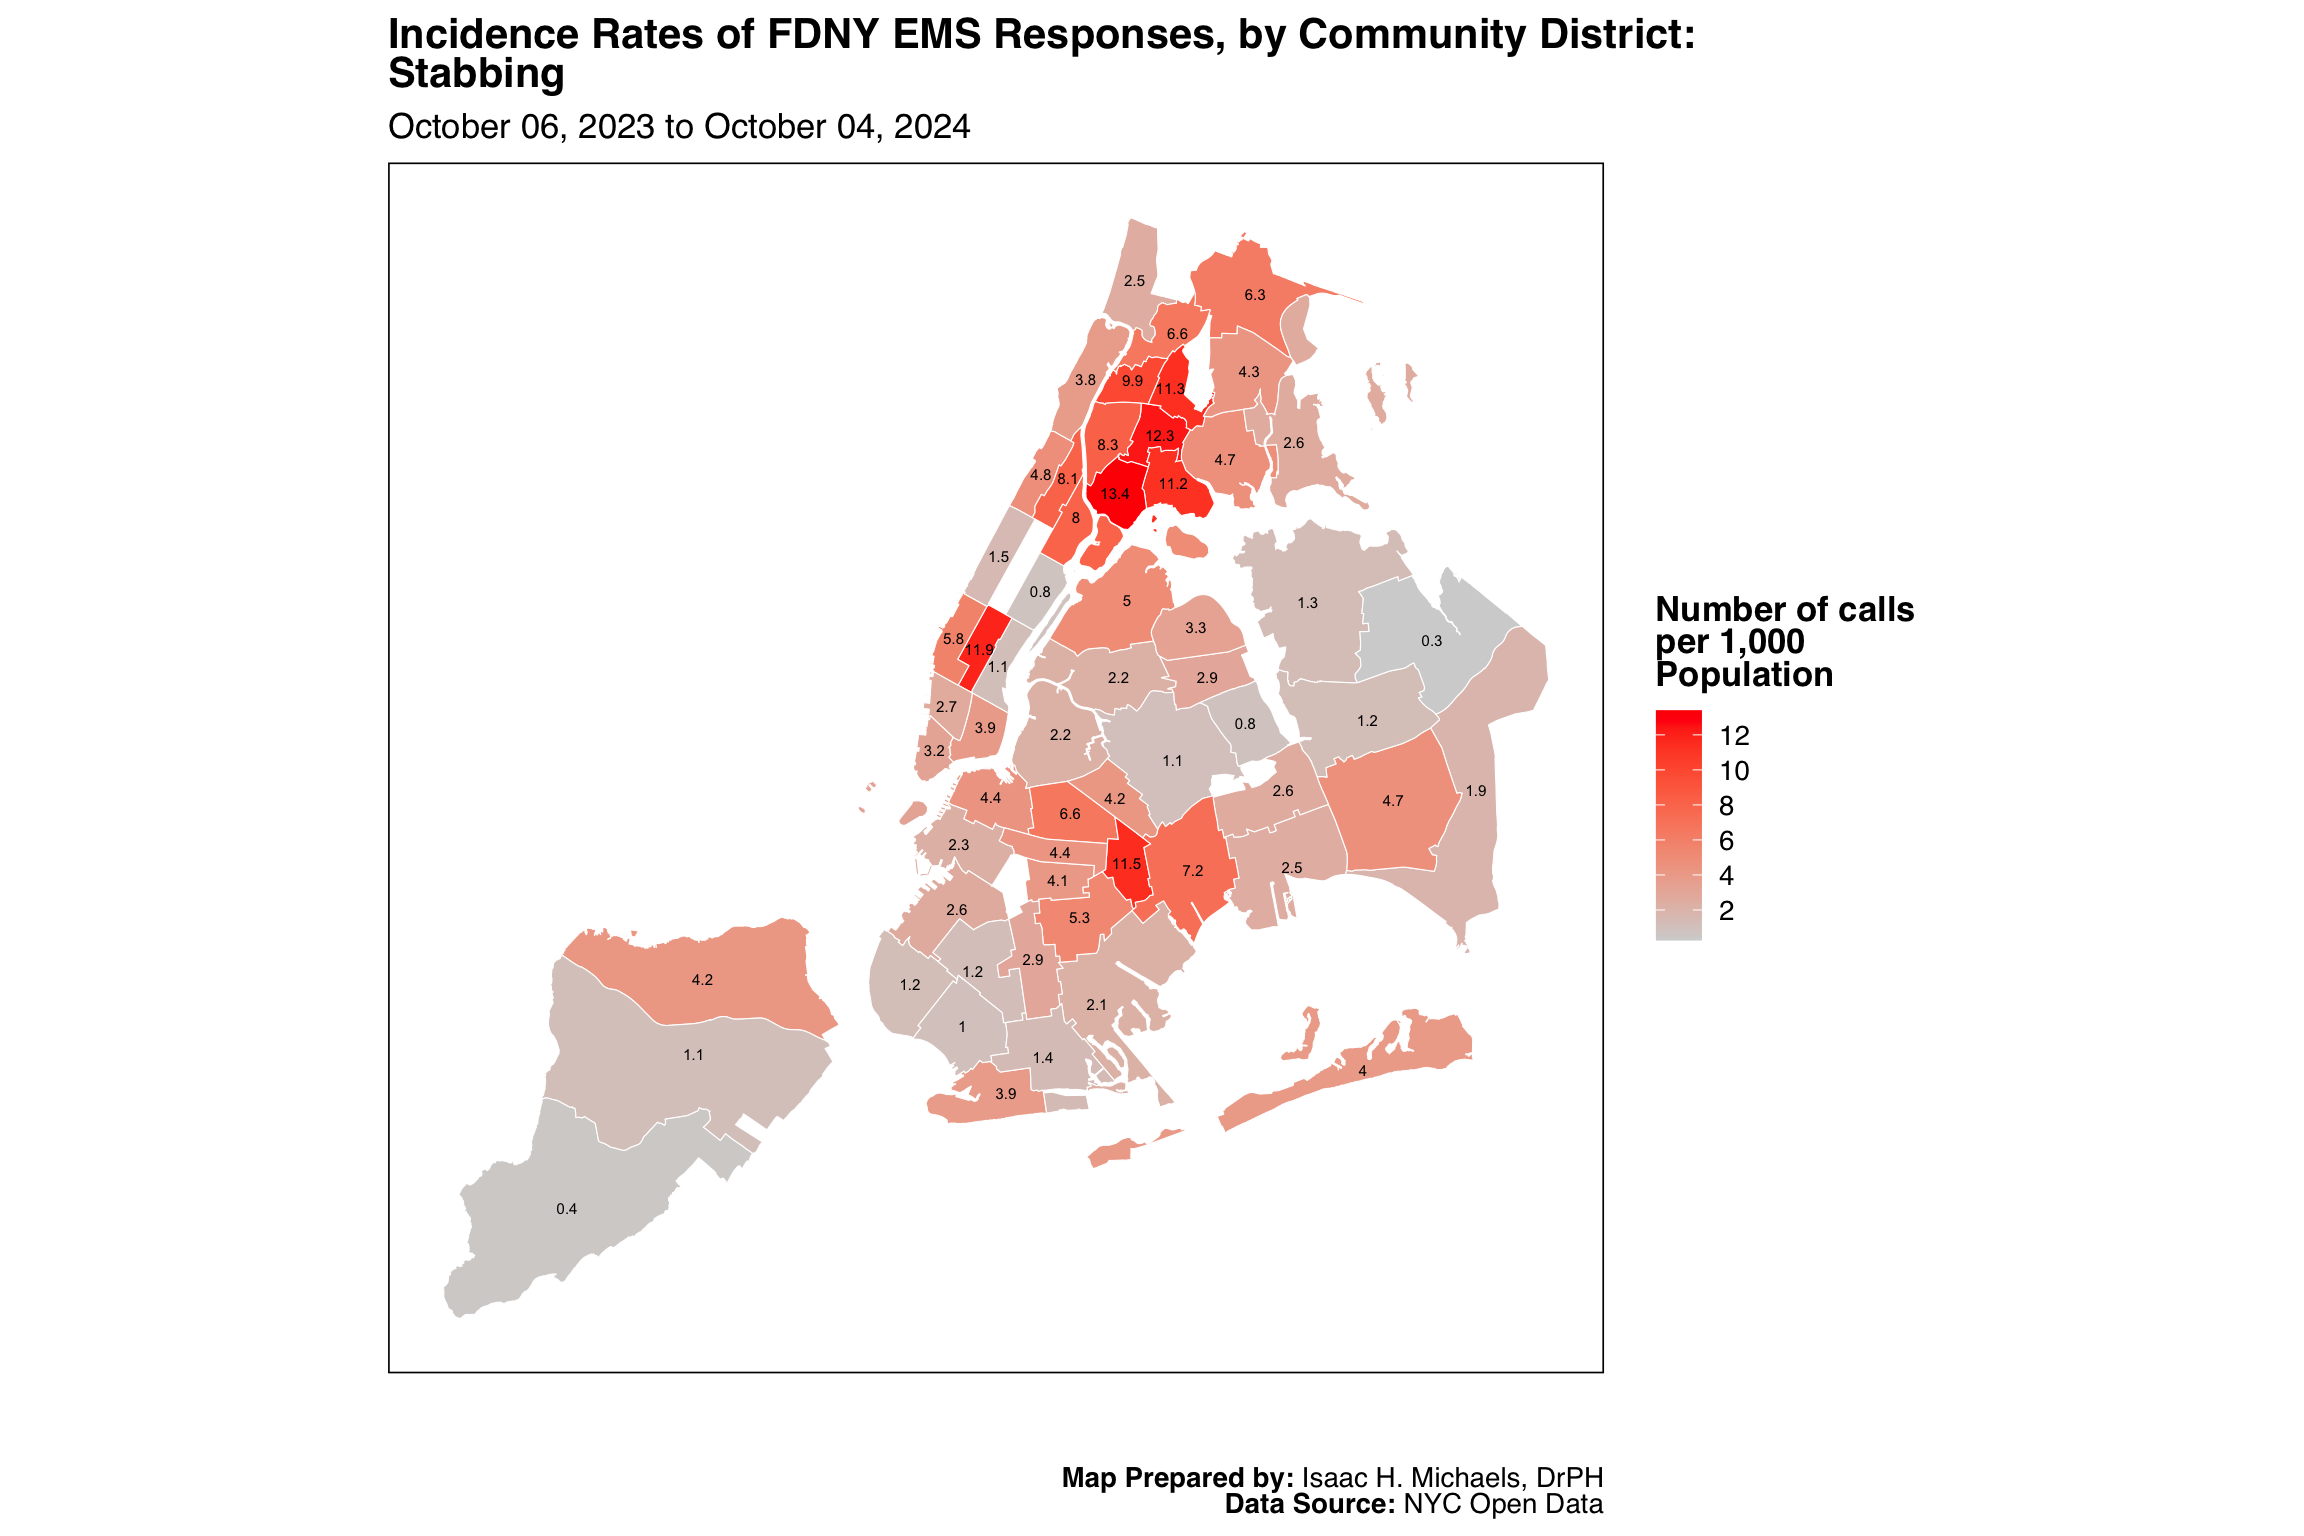
Map Prepared by: Isaac H. Michaels, DrPH
EMS Data Source: NYC Open Data
Population Data Source: NYC Open Data
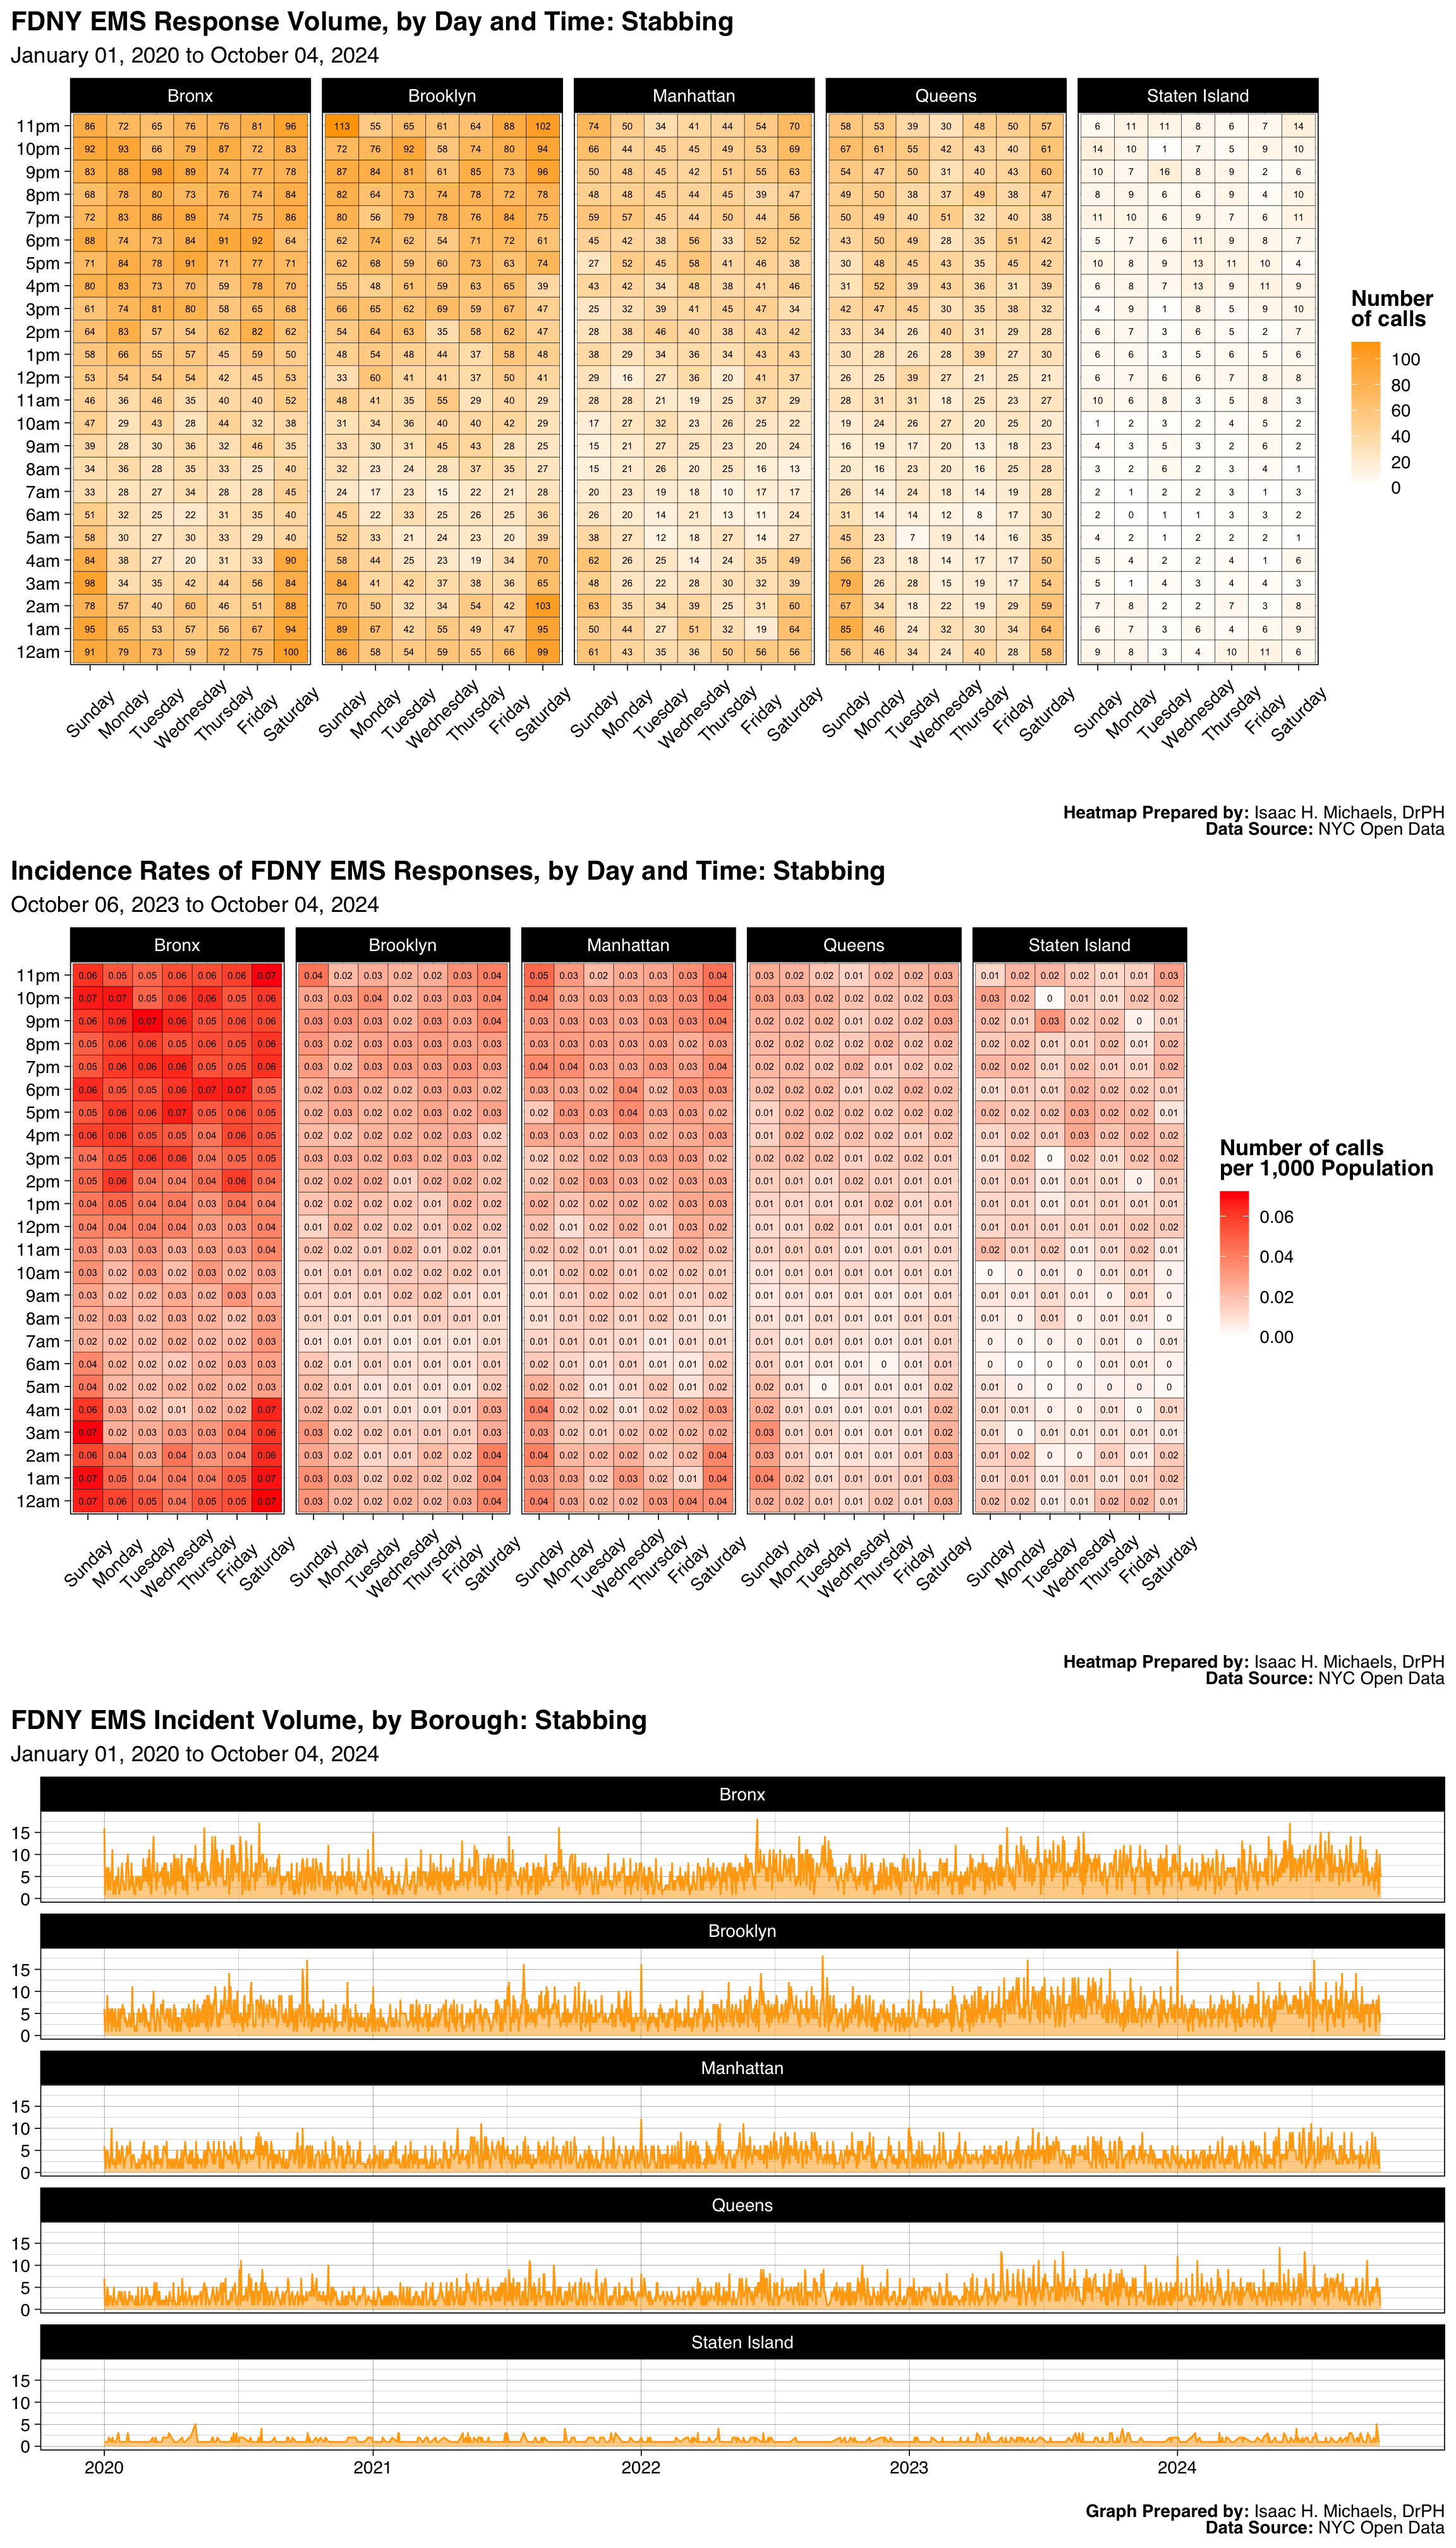
Graphs Prepared by: Isaac H. Michaels, DrPH
Data Source: NYC Open Data
| FDNY EMS Incident Volume, by Borough: Sick Pediatric, <5 Year Old |
||||||
| January 01, 2025 to July 01, 2026 | ||||||
| Borough |
Latest Year: 2026
|
All Years: 2025-2026
|
||||
|---|---|---|---|---|---|---|
| Incidents | % | Rate per 1,000 Population | Total Incidents | % | Monthly Trend | |
| Bronx | 864 | 37% | 0.6 | 3,403 | 35% | |
| Brooklyn | 624 | 27% | 0.2 | 2,654 | 28% | |
| Manhattan | 246 | 11% | 0.2 | 1,128 | 12% | |
| Queens | 481 | 21% | 0.2 | 2,042 | 21% | |
| Staten Island | 93 | 4% | 0.2 | 361 | 4% | |
| Table Prepred by: Isaac H. Michaels, DrPH | ||||||
| Data Source: NYC Open Data | ||||||
Table Prepared by: Isaac H. Michaels, DrPH
EMS Data Source: NYC Open Data
Population Data Source: Health Data NY
| FDNY EMS Incident Volume, by Severity Level: Sick Pediatric, <5 Year Old |
||||
| January 01, 2025 to July 01, 2026 | ||||
| Final Severity Level |
Latest Year: 2026
|
All Years: 2025-2026
|
||
|---|---|---|---|---|
| Incidents | % | Incidents | % | |
| 1 | 0 | 0% | 0 | 0% |
| 2 | 0 | 0% | 1 | 0% |
| 3 | 2 | 0% | 12 | 0% |
| 4 | 2,306 | 100% | 9,575 | 100% |
| 5 | 0 | 0% | 0 | 0% |
| 6 | 0 | 0% | 0 | 0% |
| 7 | 0 | 0% | 0 | 0% |
| 8 | 0 | 0% | 0 | 0% |
| Table Prepred by: Isaac H. Michaels, DrPH | ||||
| Data Source: NYC Open Data | ||||
Table Prepared by: Isaac H. Michaels, DrPH
Data Source: NYC Open Data
| FDNY EMS Incident Volume, by Disposition: Sick Pediatric, <5 Year Old |
||||
| January 01, 2025 to July 01, 2026 | ||||
| Disposition |
Latest Year: 2026
|
All Years: 2025-2026
|
||
|---|---|---|---|---|
| Incidents | % | Incidents | % | |
| Cancelled | 46 | 2% | 109 | 1% |
| Condition Corrected | 10 | 0% | 33 | 0% |
| Patient Gone on Arrival | 92 | 4% | 299 | 3% |
| Refused Medical Aid | 164 | 7% | 686 | 7% |
| Transporting Patient | 1,923 | 83% | 8,257 | 86% |
| Treated and Transported | 2 | 0% | 6 | 0% |
| Unfounded | 35 | 2% | 135 | 1% |
| NA | 36 | 2% | 63 | 1% |
| Table Prepred by: Isaac H. Michaels, DrPH | ||||
| Data Source: NYC Open Data | ||||
Table Prepared by: Isaac H. Michaels, DrPH
Data Source: NYC Open Data
Back to top
Multiple Trauma Patient
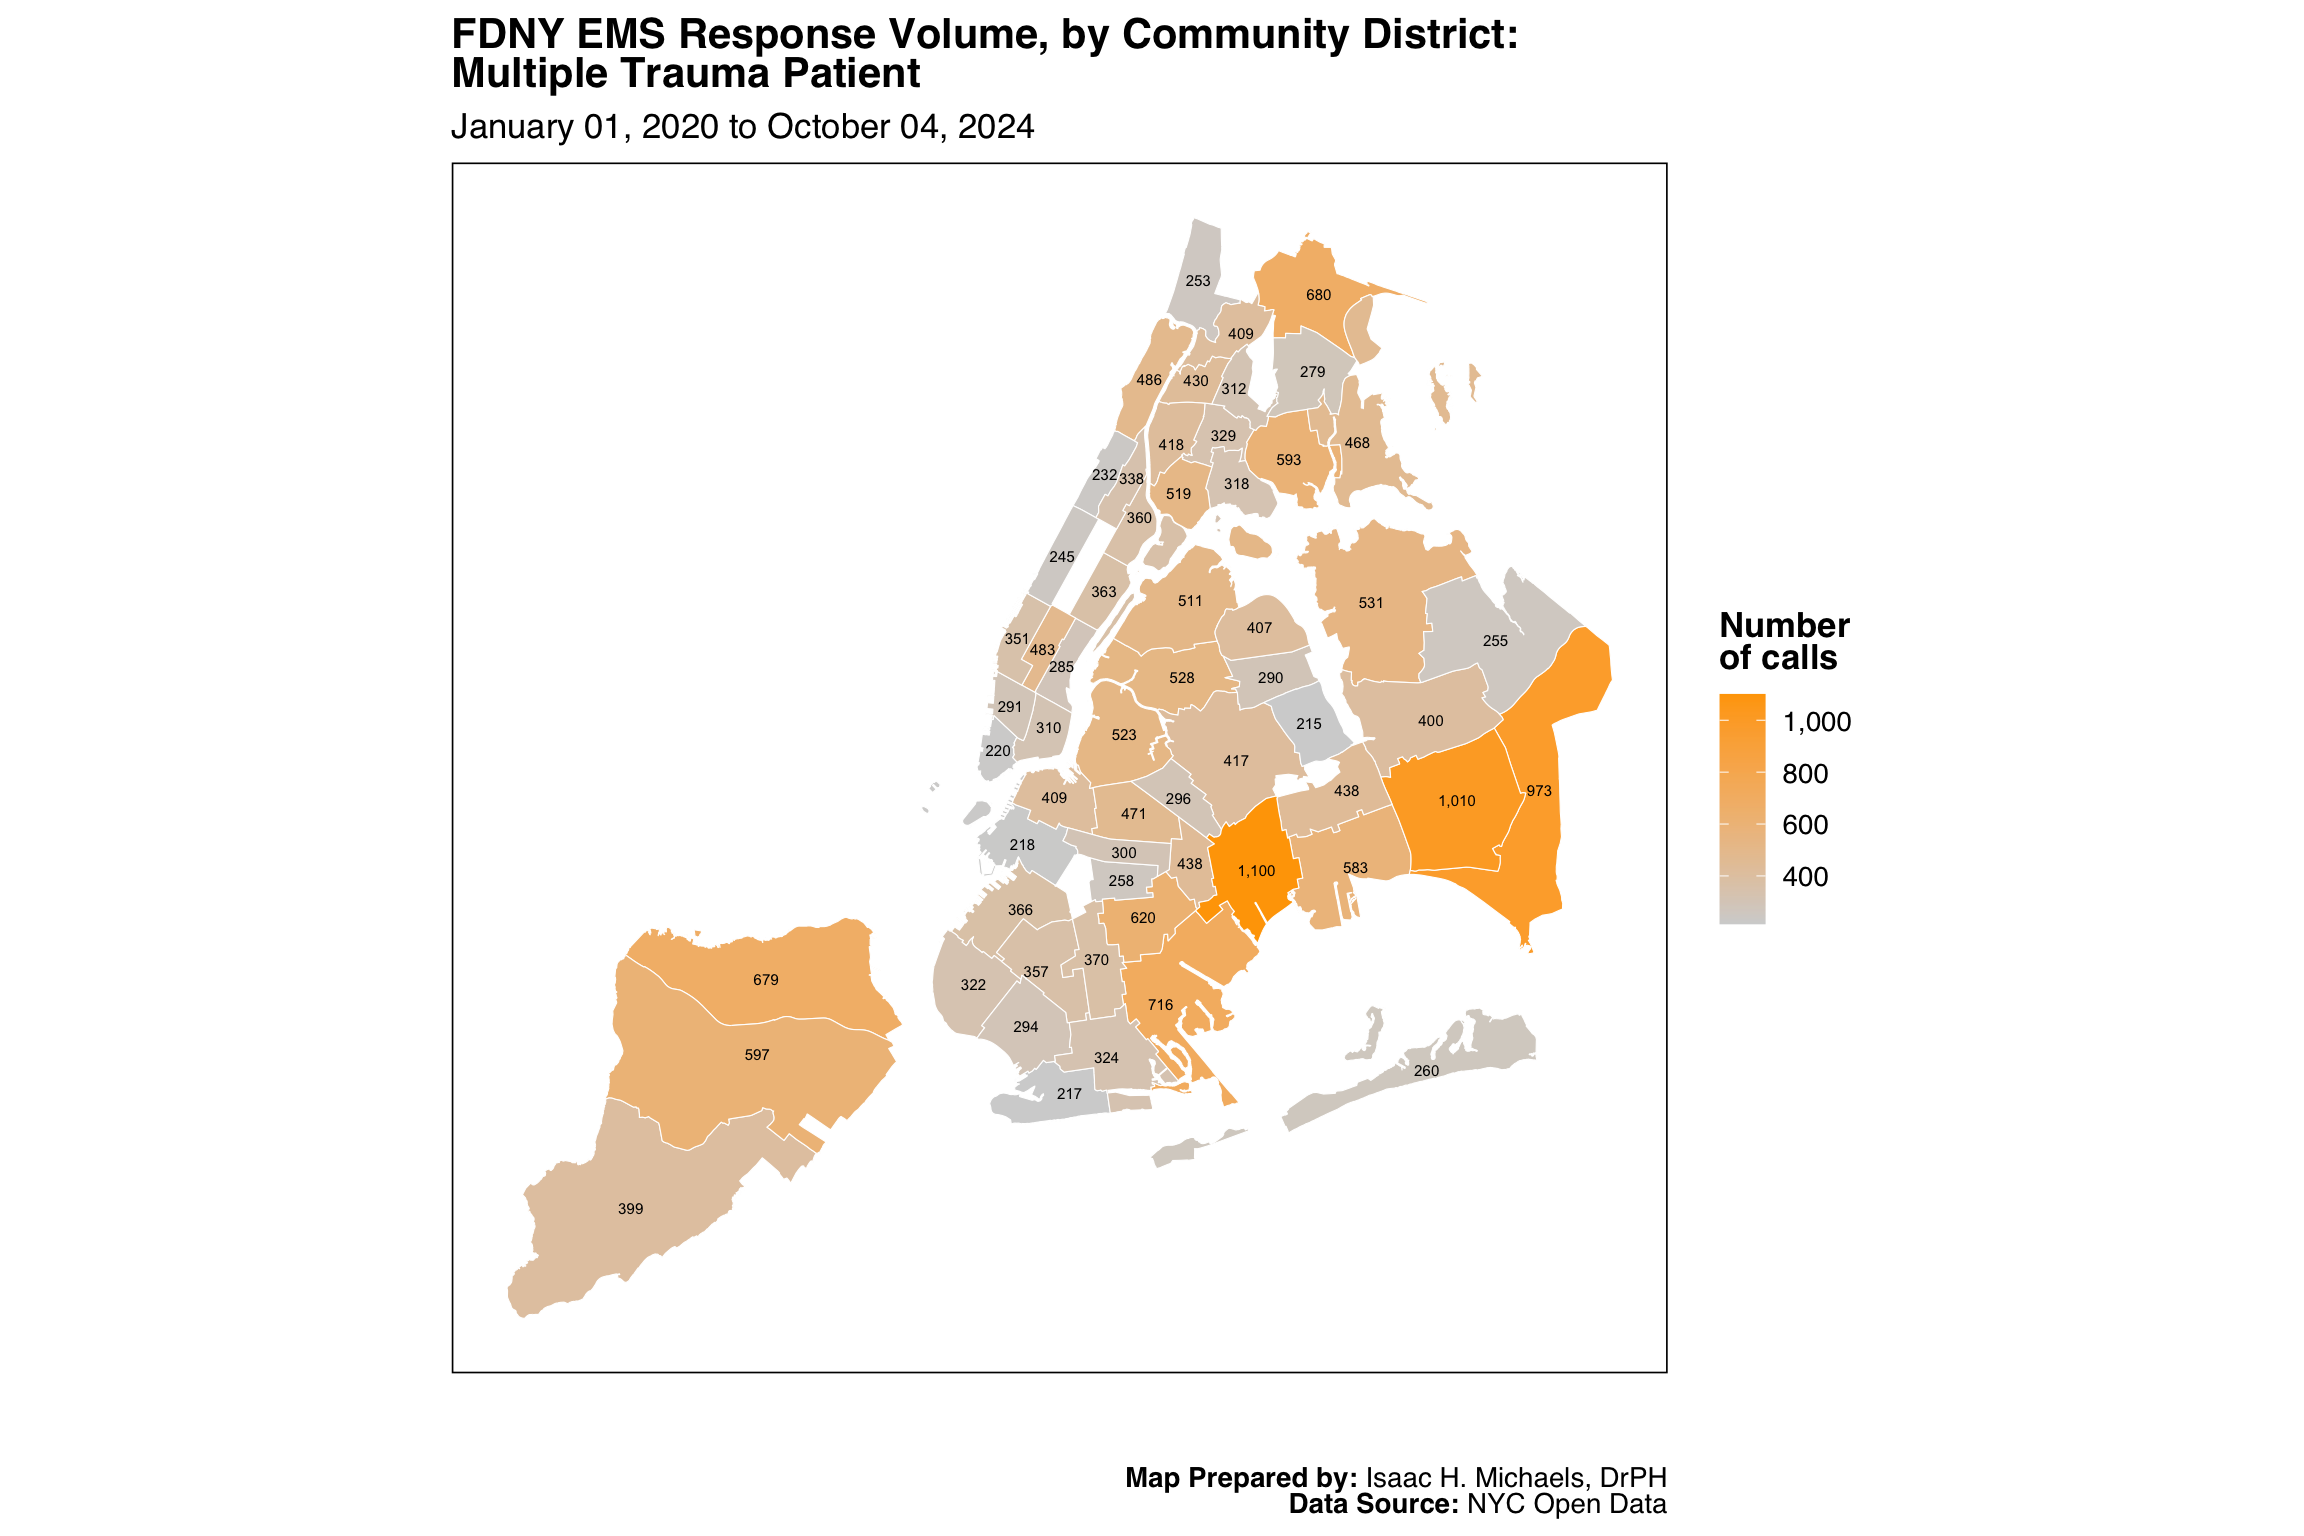
Map Prepared by: Isaac H. Michaels, DrPH
Data Source: NYC Open Data
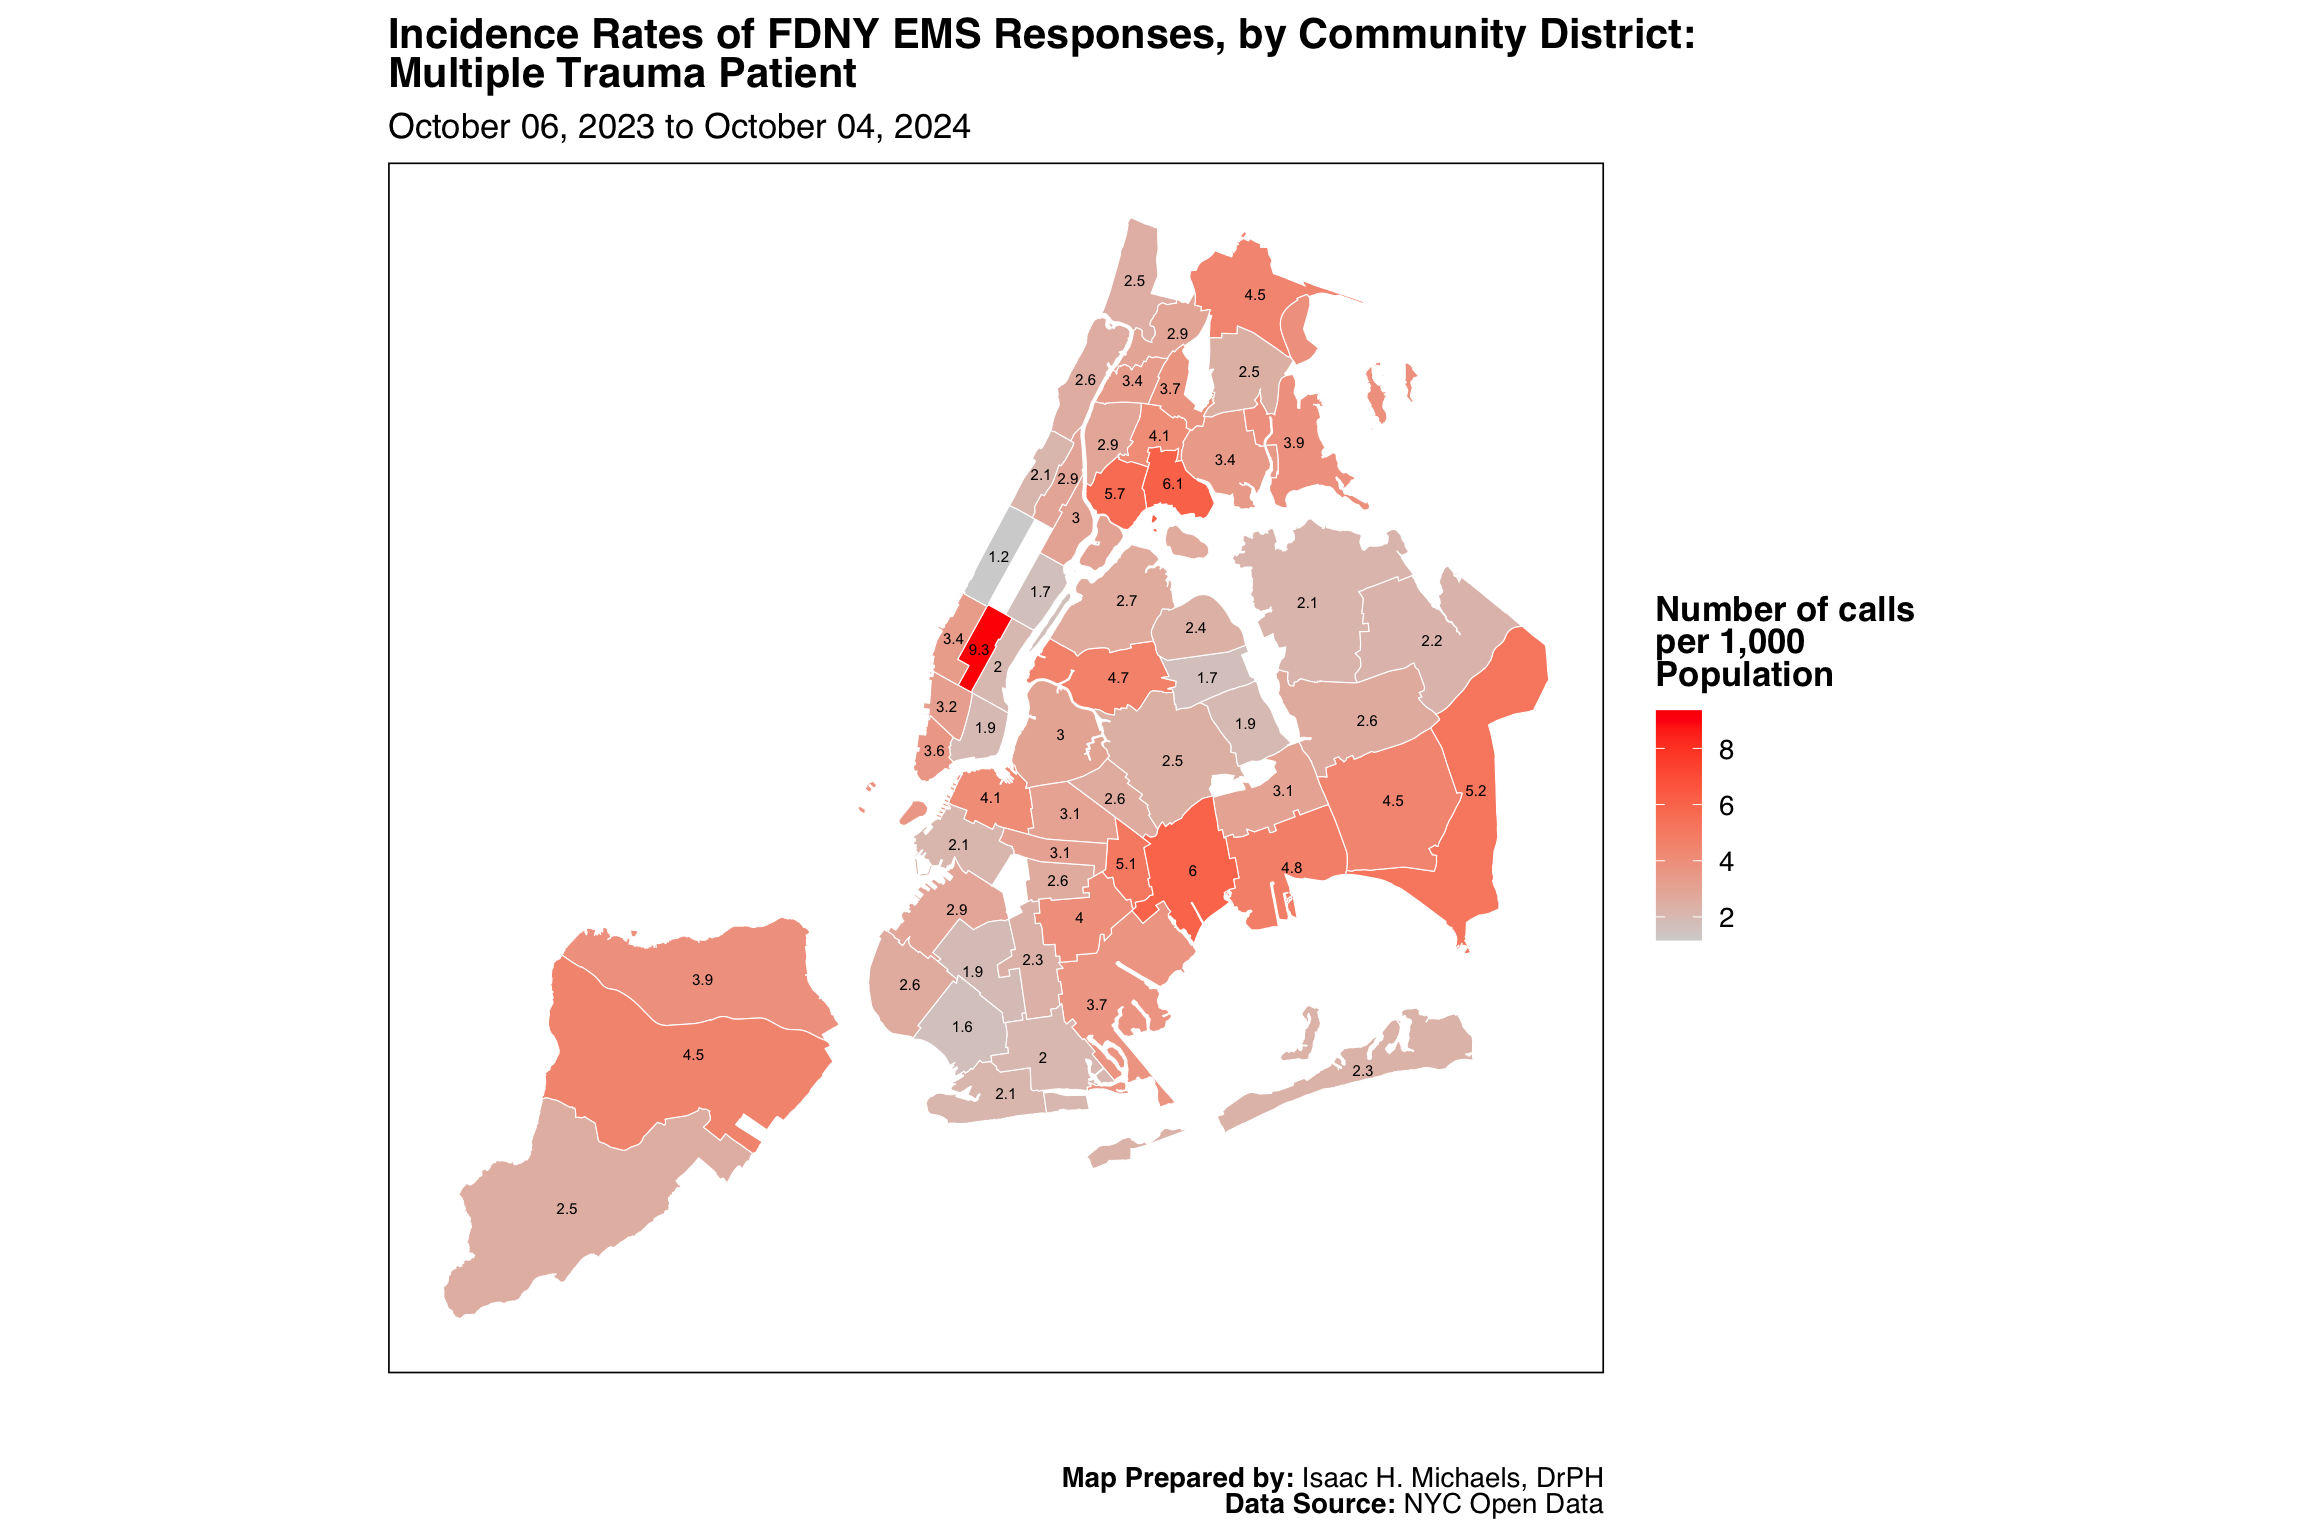
Map Prepared by: Isaac H. Michaels, DrPH
EMS Data Source: NYC Open Data
Population Data Source: NYC Open Data
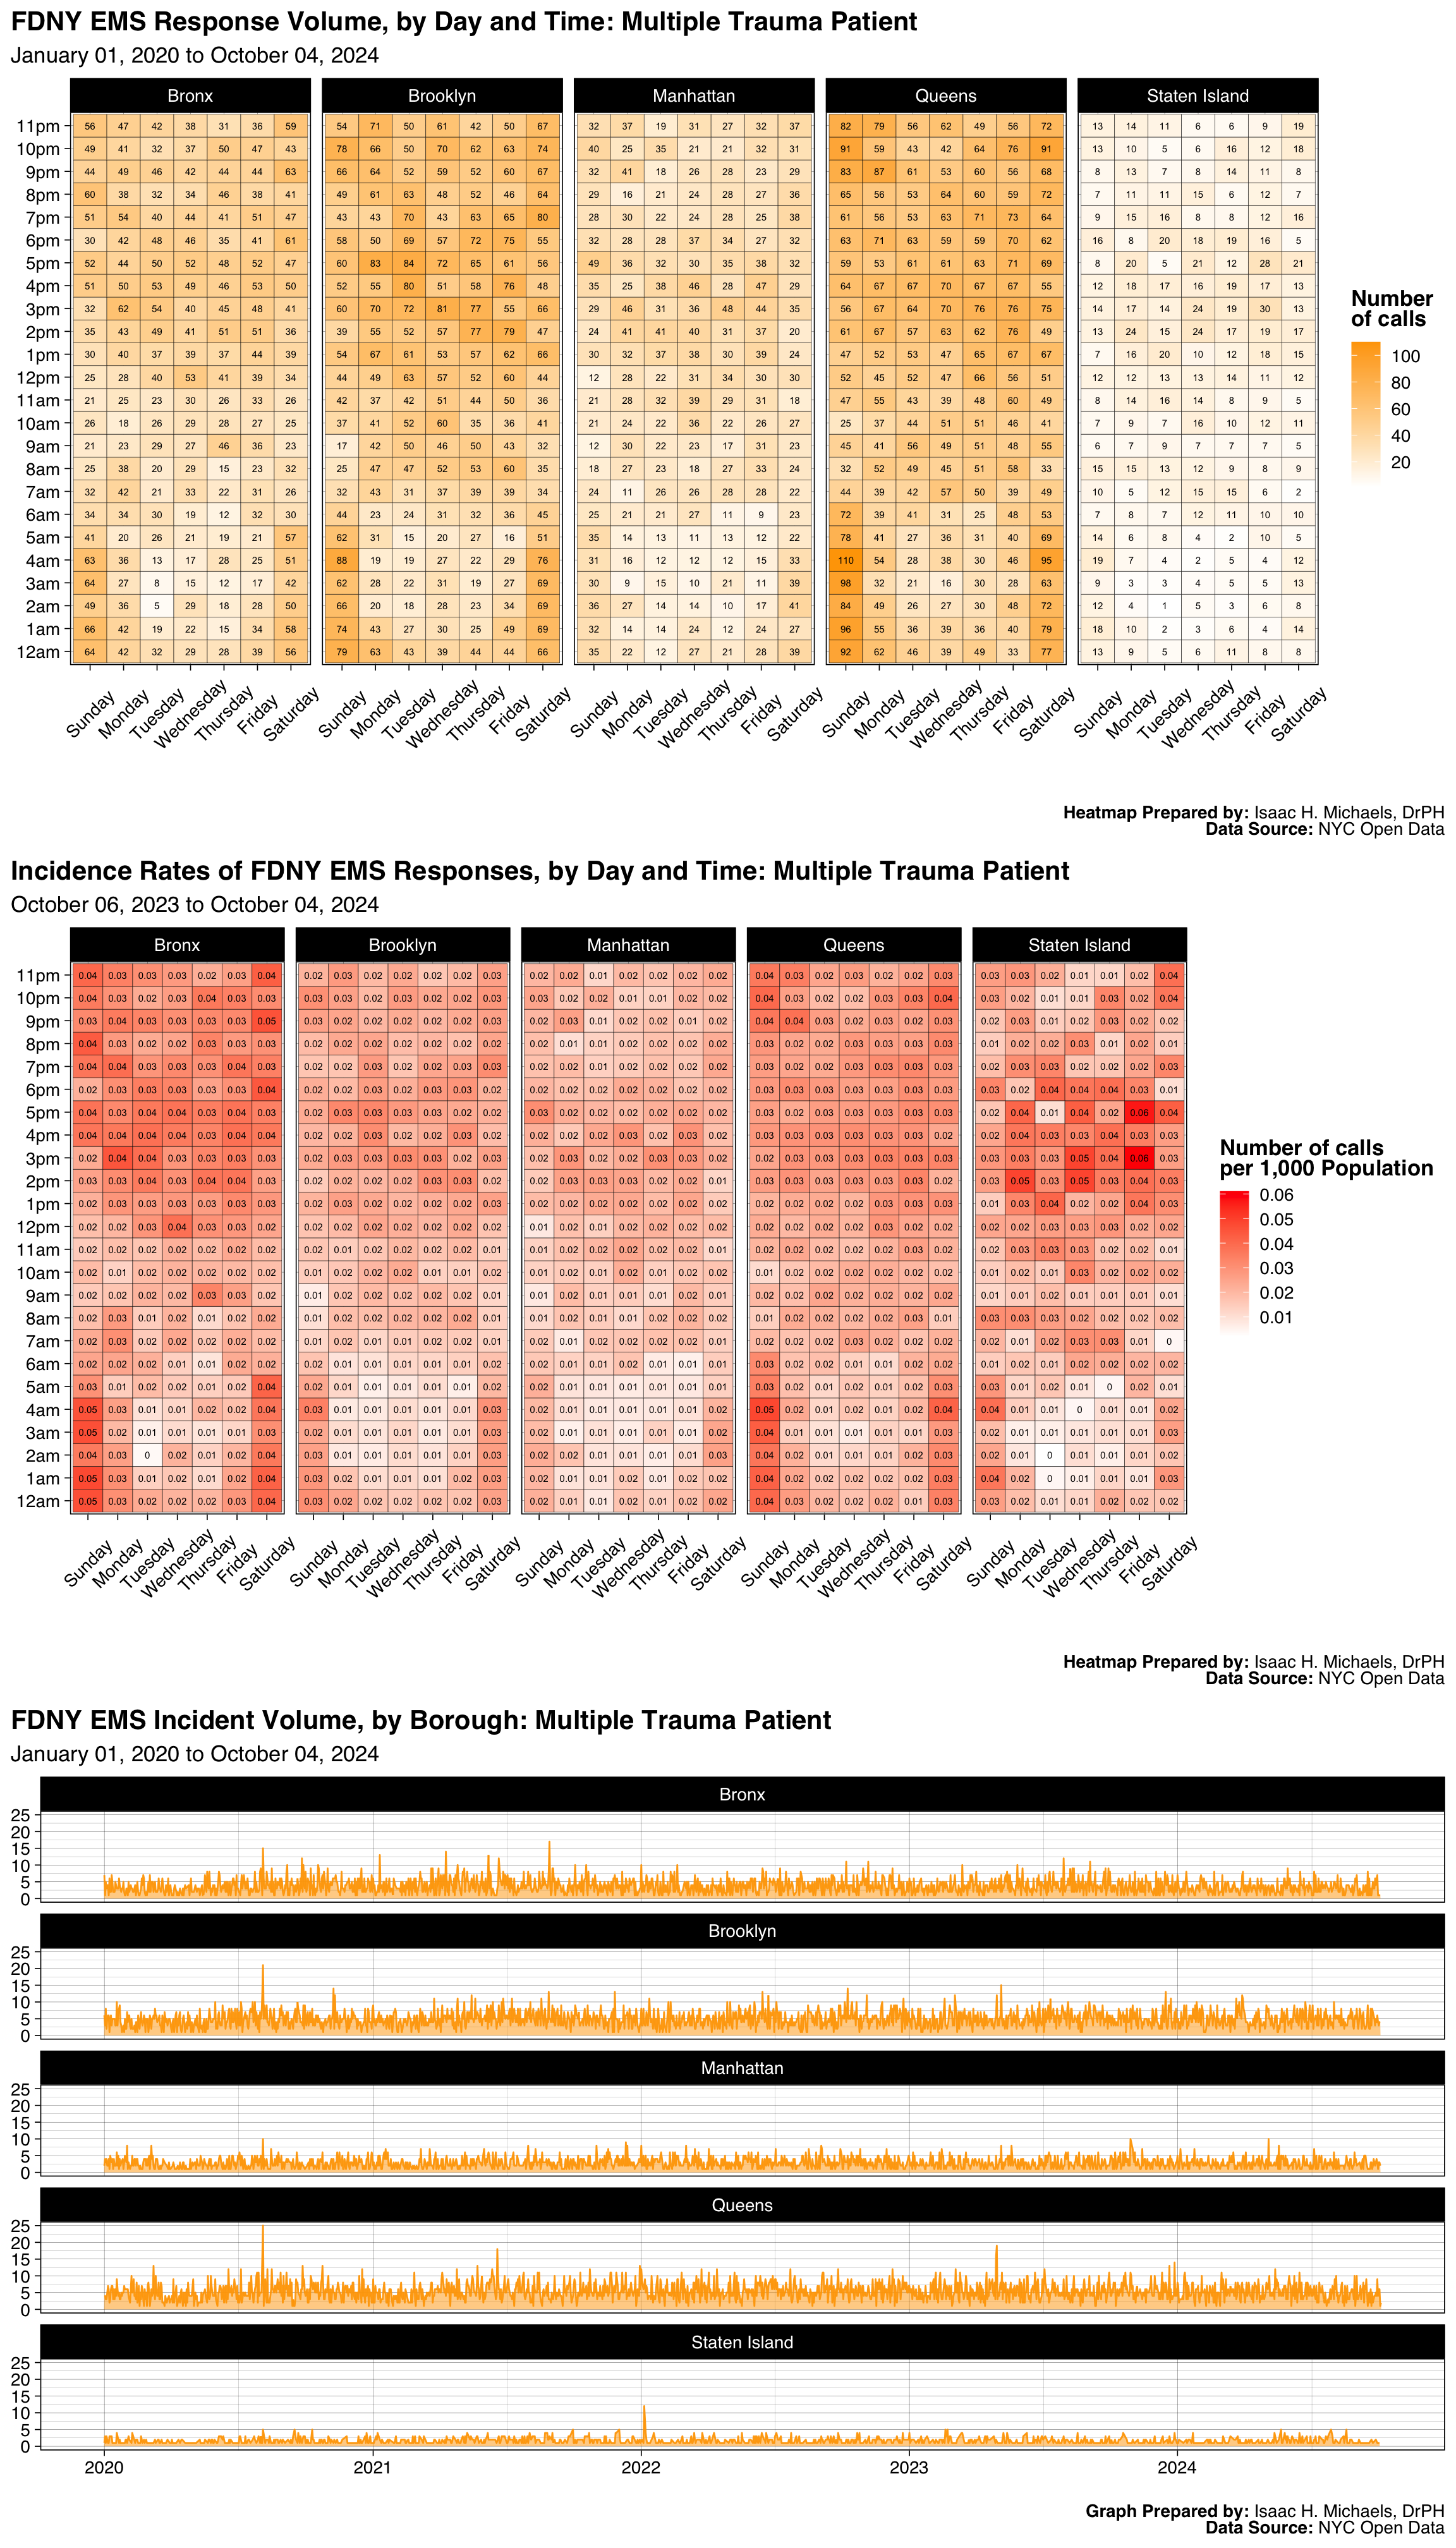
Graphs Prepared by: Isaac H. Michaels, DrPH
Data Source: NYC Open Data
| FDNY EMS Incident Volume, by Borough: Multiple Trauma Patient |
||||||
| January 01, 2025 to July 01, 2026 | ||||||
| Borough |
Latest Year: 2026
|
All Years: 2025-2026
|
||||
|---|---|---|---|---|---|---|
| Incidents | % | Rate per 1,000 Population | Total Incidents | % | Monthly Trend | |
| Bronx | 529 | 19% | 0.4 | 1,602 | 19% | |
| Brooklyn | 773 | 27% | 0.3 | 2,369 | 28% | |
| Manhattan | 432 | 15% | 0.3 | 1,183 | 14% | |
| Queens | 883 | 31% | 0.4 | 2,695 | 32% | |
| Staten Island | 207 | 7% | 0.4 | 611 | 7% | |
| Table Prepred by: Isaac H. Michaels, DrPH | ||||||
| Data Source: NYC Open Data | ||||||
Table Prepared by: Isaac H. Michaels, DrPH
EMS Data Source: NYC Open Data
Population Data Source: Health Data NY
| FDNY EMS Incident Volume, by Severity Level: Multiple Trauma Patient |
||||
| January 01, 2025 to July 01, 2026 | ||||
| Final Severity Level |
Latest Year: 2026
|
All Years: 2025-2026
|
||
|---|---|---|---|---|
| Incidents | % | Incidents | % | |
| 1 | 0 | 0% | 0 | 0% |
| 2 | 2,820 | 100% | 8,449 | 100% |
| 3 | 1 | 0% | 2 | 0% |
| 4 | 3 | 0% | 9 | 0% |
| 5 | 0 | 0% | 0 | 0% |
| 6 | 0 | 0% | 0 | 0% |
| 7 | 0 | 0% | 0 | 0% |
| 8 | 0 | 0% | 0 | 0% |
| Table Prepred by: Isaac H. Michaels, DrPH | ||||
| Data Source: NYC Open Data | ||||
Table Prepared by: Isaac H. Michaels, DrPH
Data Source: NYC Open Data
| FDNY EMS Incident Volume, by Disposition: Multiple Trauma Patient |
||||
| January 01, 2025 to July 01, 2026 | ||||
| Disposition |
Latest Year: 2026
|
All Years: 2025-2026
|
||
|---|---|---|---|---|
| Incidents | % | Incidents | % | |
| Cancelled | 266 | 9% | 751 | 9% |
| Condition Corrected | 169 | 6% | 532 | 6% |
| Patient Gone on Arrival | 85 | 3% | 250 | 3% |
| Patient Pronounced Dead | 21 | 1% | 62 | 1% |
| Refused Medical Aid | 489 | 17% | 1,430 | 17% |
| Transporting Patient | 1,567 | 55% | 4,761 | 56% |
| Treated and Transported | 1 | 0% | 10 | 0% |
| Unfounded | 215 | 8% | 623 | 7% |
| NA | 11 | 0% | 41 | 0% |
| Table Prepred by: Isaac H. Michaels, DrPH | ||||
| Data Source: NYC Open Data | ||||
Table Prepared by: Isaac H. Michaels, DrPH
Data Source: NYC Open Data
Back to top
Police 10-13, Confirmed

Map Prepared by: Isaac H. Michaels, DrPH
Data Source: NYC Open Data
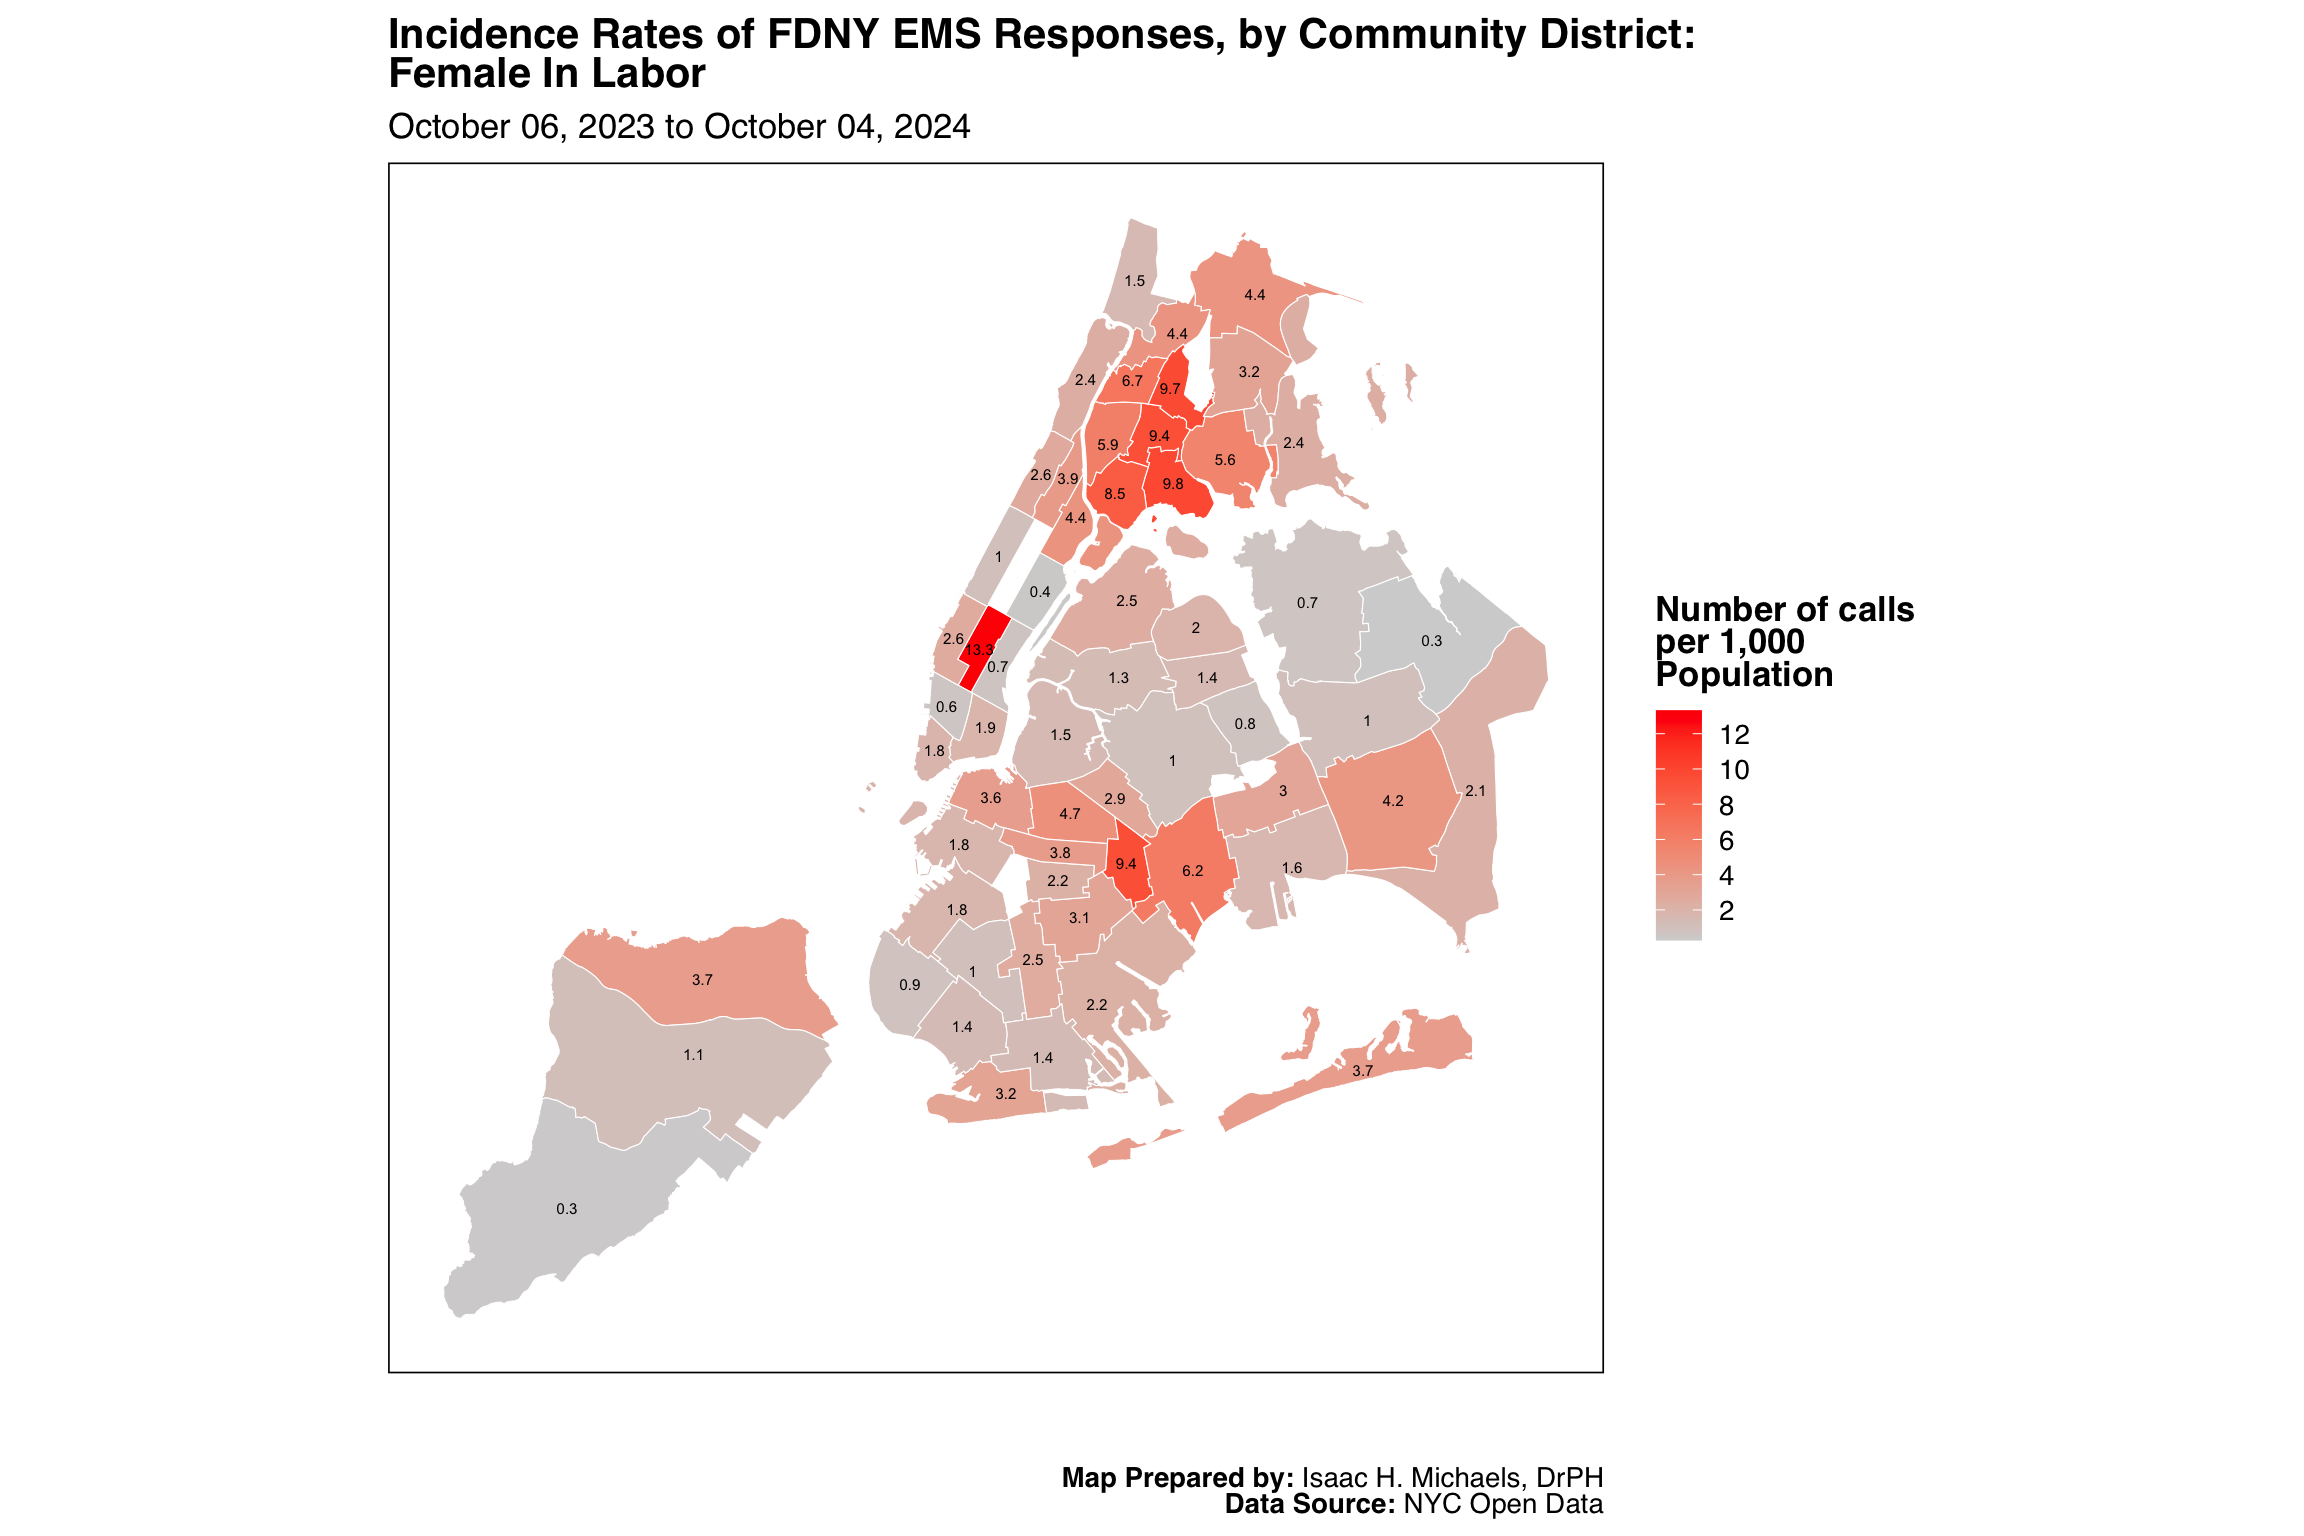
Map Prepared by: Isaac H. Michaels, DrPH
EMS Data Source: NYC Open Data
Population Data Source: NYC Open Data
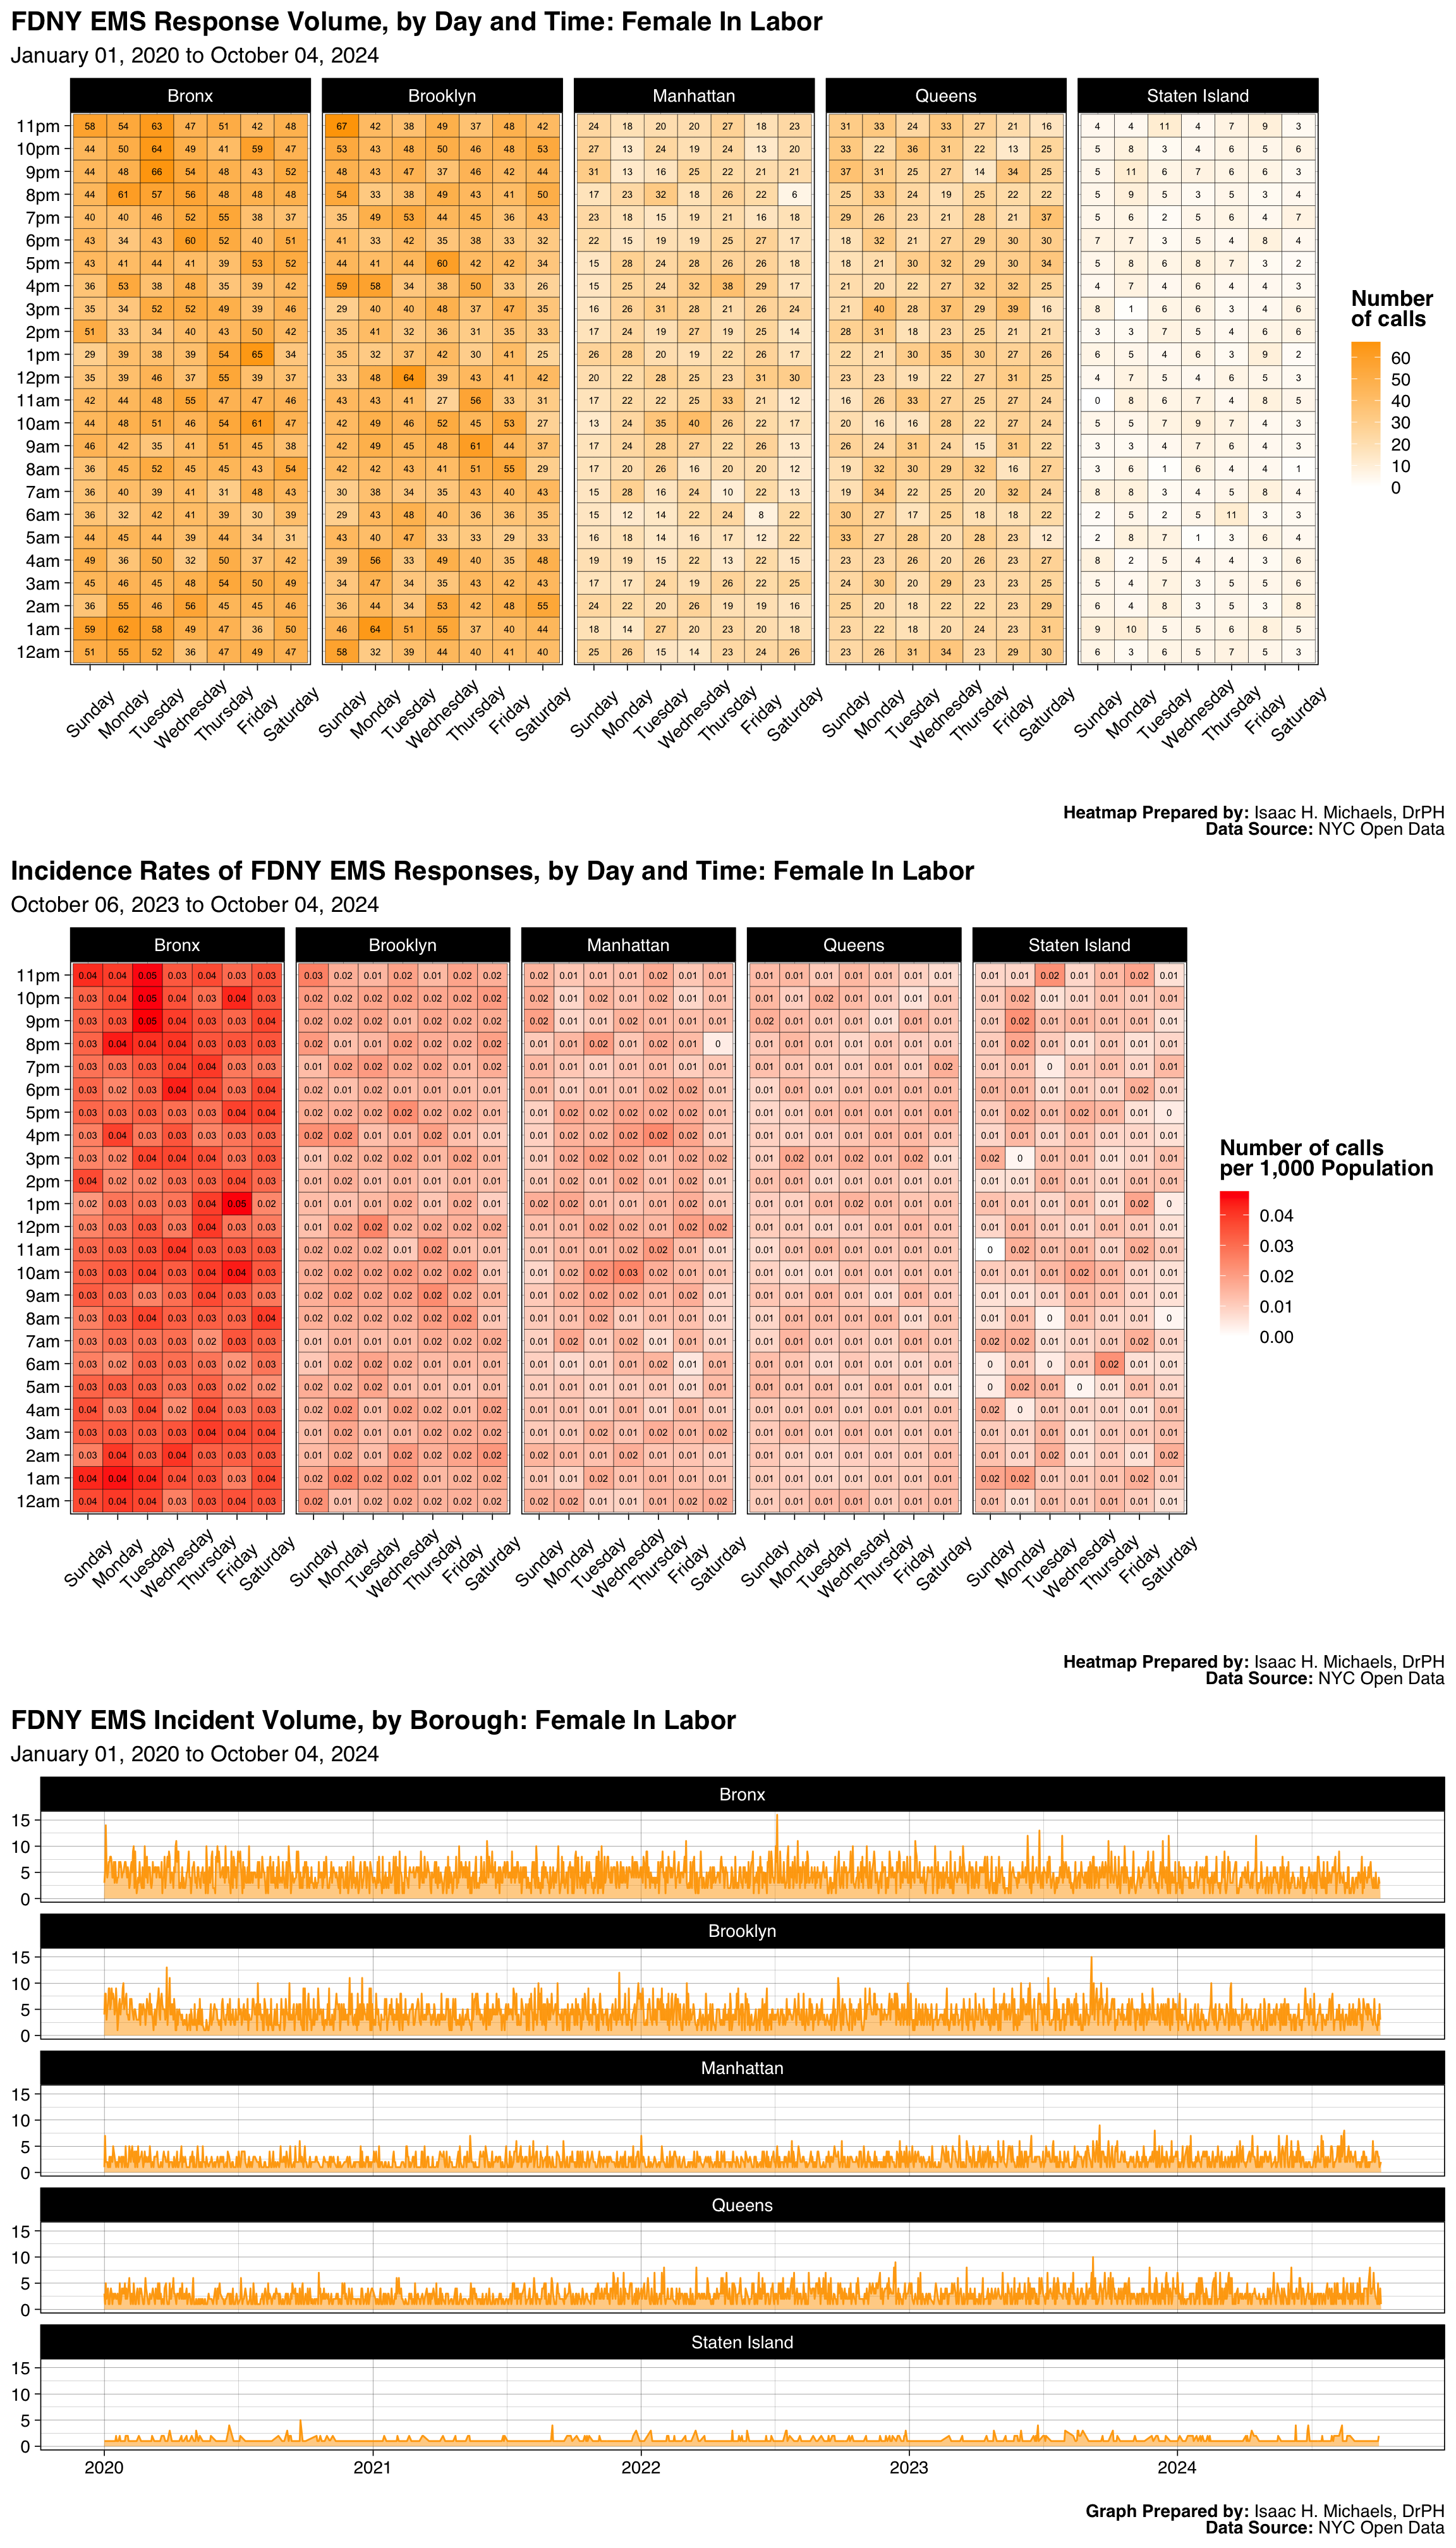
Graphs Prepared by: Isaac H. Michaels, DrPH
Data Source: NYC Open Data
| FDNY EMS Incident Volume, by Borough: Police 10-13, Confirmed |
||||||
| January 01, 2025 to July 01, 2026 | ||||||
| Borough |
Latest Year: 2026
|
All Years: 2025-2026
|
||||
|---|---|---|---|---|---|---|
| Incidents | % | Rate per 1,000 Population | Total Incidents | % | Monthly Trend | |
| Bronx | 518 | 26% | 0.4 | 1,643 | 26% | |
| Brooklyn | 695 | 34% | 0.3 | 2,050 | 33% | |
| Manhattan | 475 | 24% | 0.3 | 1,507 | 24% | |
| Queens | 267 | 13% | 0.1 | 839 | 13% | |
| Staten Island | 61 | 3% | 0.1 | 176 | 3% | |
| Table Prepred by: Isaac H. Michaels, DrPH | ||||||
| Data Source: NYC Open Data | ||||||
Table Prepared by: Isaac H. Michaels, DrPH
EMS Data Source: NYC Open Data
Population Data Source: Health Data NY
| FDNY EMS Incident Volume, by Severity Level: Police 10-13, Confirmed |
||||
| January 01, 2025 to July 01, 2026 | ||||
| Final Severity Level |
Latest Year: 2026
|
All Years: 2025-2026
|
||
|---|---|---|---|---|
| Incidents | % | Incidents | % | |
| 1 | 0 | 0% | 0 | 0% |
| 2 | 2 | 0% | 3 | 0% |
| 3 | 2,011 | 100% | 6,206 | 100% |
| 4 | 2 | 0% | 4 | 0% |
| 5 | 0 | 0% | 0 | 0% |
| 6 | 0 | 0% | 0 | 0% |
| 7 | 1 | 0% | 2 | 0% |
| 8 | 0 | 0% | 0 | 0% |
| Table Prepred by: Isaac H. Michaels, DrPH | ||||
| Data Source: NYC Open Data | ||||
Table Prepared by: Isaac H. Michaels, DrPH
Data Source: NYC Open Data
| FDNY EMS Incident Volume, by Disposition: Police 10-13, Confirmed |
||||
| January 01, 2025 to July 01, 2026 | ||||
| Disposition |
Latest Year: 2026
|
All Years: 2025-2026
|
||
|---|---|---|---|---|
| Incidents | % | Incidents | % | |
| Cancelled | 174 | 9% | 489 | 8% |
| Condition Corrected | 788 | 39% | 2,563 | 41% |
| Patient Gone on Arrival | 51 | 3% | 111 | 2% |
| Refused Medical Aid | 131 | 6% | 371 | 6% |
| Transporting Patient | 268 | 13% | 884 | 14% |
| Treated Not Transported | 1 | 0% | 1 | 0% |
| Treated and Transported | 1 | 0% | 4 | 0% |
| Triaged at Scene No Transport | 1 | 0% | 1 | 0% |
| Unfounded | 546 | 27% | 1,650 | 27% |
| NA | 55 | 3% | 140 | 2% |
| Table Prepred by: Isaac H. Michaels, DrPH | ||||
| Data Source: NYC Open Data | ||||
Table Prepared by: Isaac H. Michaels, DrPH
Data Source: NYC Open Data
Back to top
Request For Stand-By

Map Prepared by: Isaac H. Michaels, DrPH
Data Source: NYC Open Data
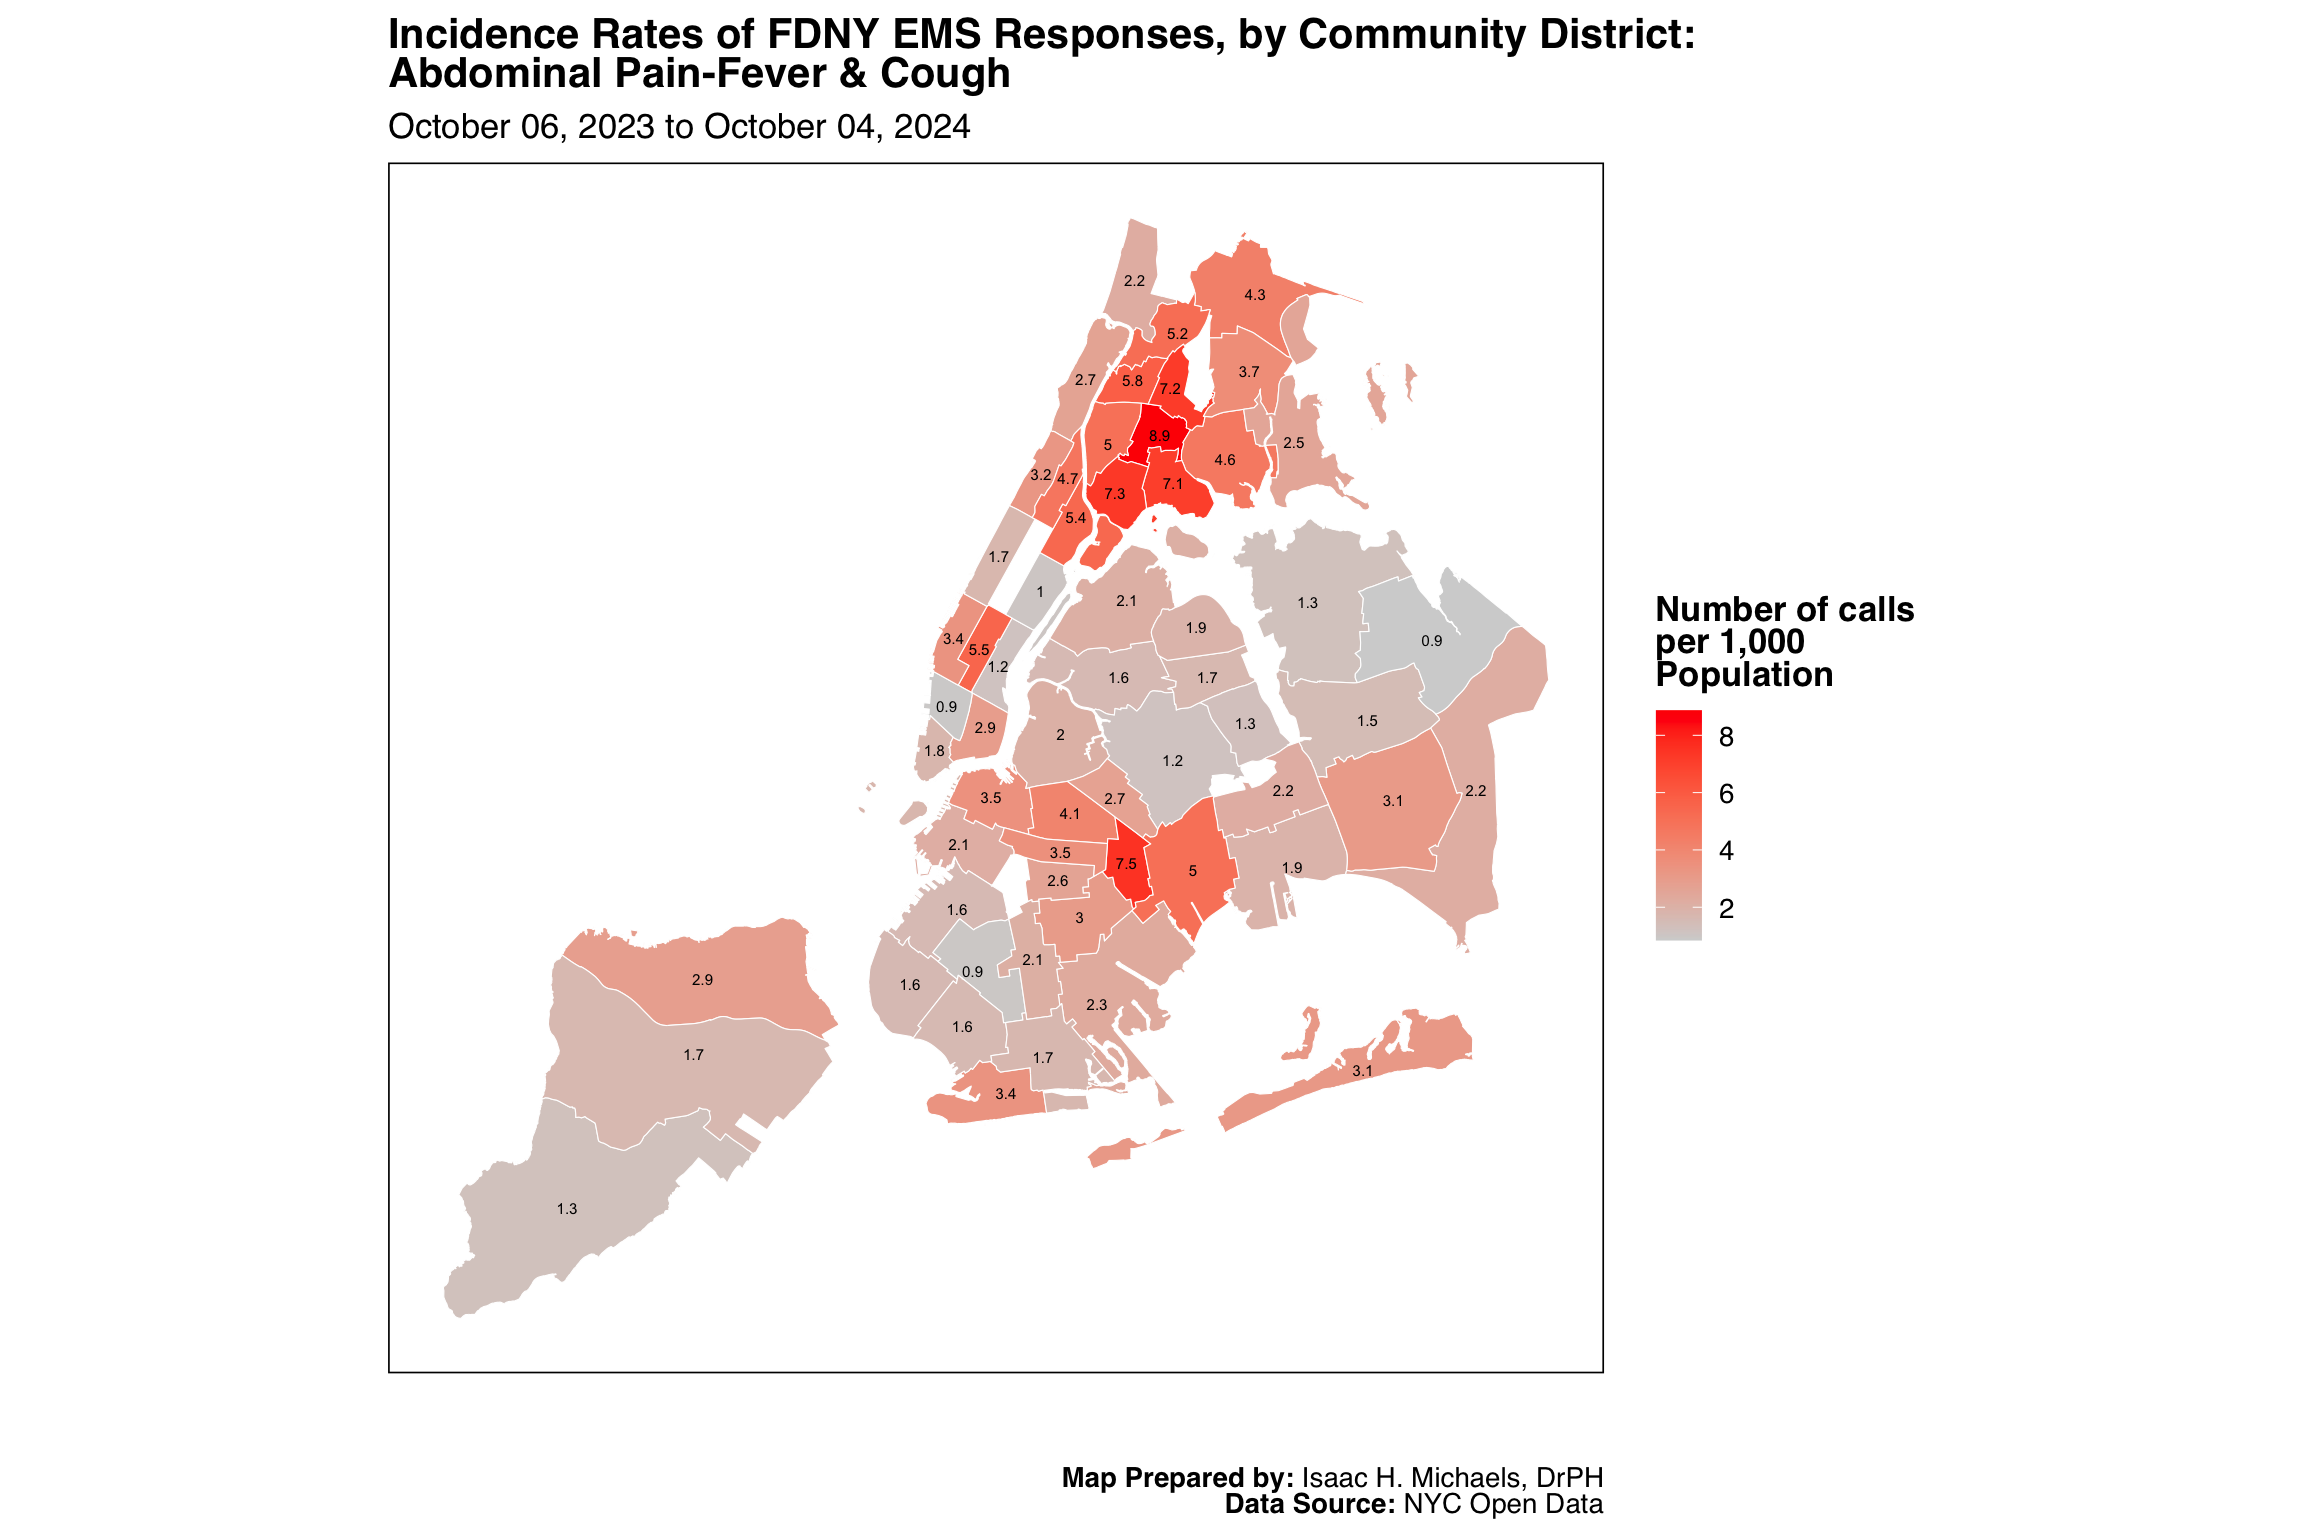
Map Prepared by: Isaac H. Michaels, DrPH
EMS Data Source: NYC Open Data
Population Data Source: NYC Open Data
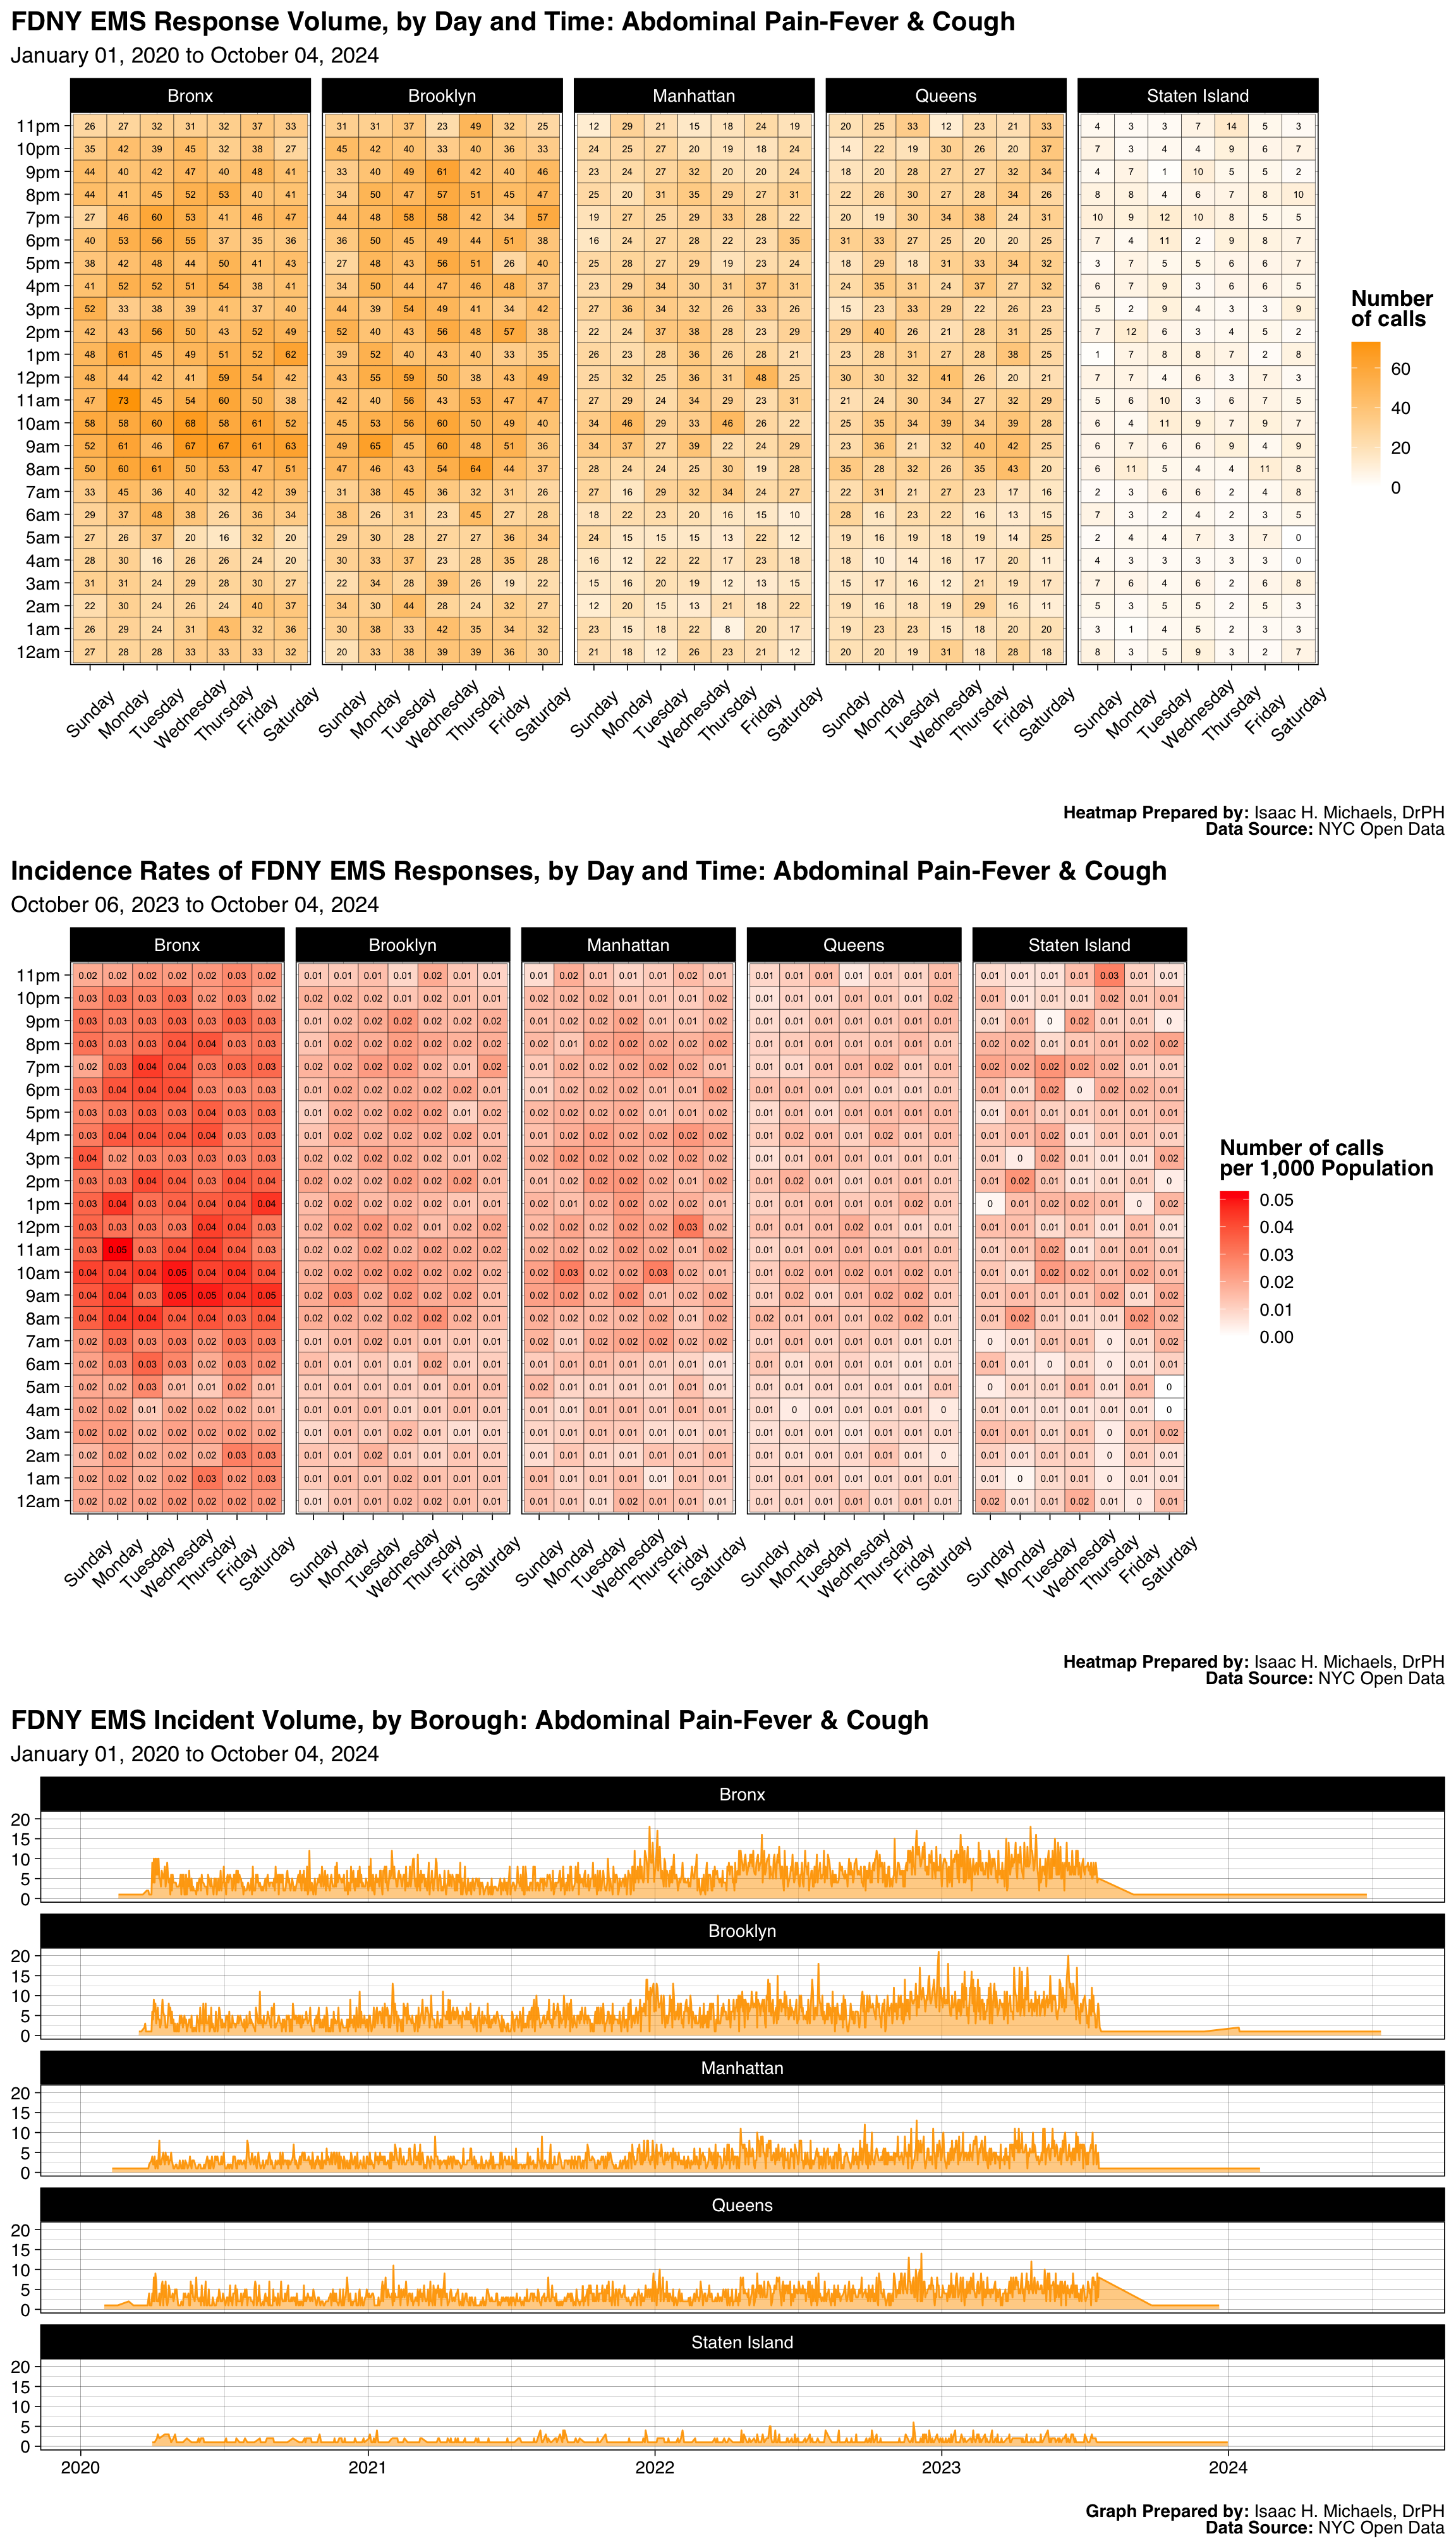
Graphs Prepared by: Isaac H. Michaels, DrPH
Data Source: NYC Open Data
| FDNY EMS Incident Volume, by Borough: Request For Stand-By |
||||||
| January 01, 2025 to July 01, 2026 | ||||||
| Borough |
Latest Year: 2026
|
All Years: 2025-2026
|
||||
|---|---|---|---|---|---|---|
| Incidents | % | Rate per 1,000 Population | Total Incidents | % | Monthly Trend | |
| Bronx | 226 | 11% | 0.2 | 665 | 11% | |
| Brooklyn | 428 | 21% | 0.2 | 1,278 | 21% | |
| Manhattan | 641 | 31% | 0.4 | 1,990 | 33% | |
| Queens | 677 | 33% | 0.3 | 1,890 | 31% | |
| Staten Island | 73 | 4% | 0.1 | 263 | 4% | |
| Table Prepred by: Isaac H. Michaels, DrPH | ||||||
| Data Source: NYC Open Data | ||||||
Table Prepared by: Isaac H. Michaels, DrPH
EMS Data Source: NYC Open Data
Population Data Source: Health Data NY
| FDNY EMS Incident Volume, by Severity Level: Request For Stand-By |
||||
| January 01, 2025 to July 01, 2026 | ||||
| Final Severity Level |
Latest Year: 2026
|
All Years: 2025-2026
|
||
|---|---|---|---|---|
| Incidents | % | Incidents | % | |
| 1 | 0 | 0% | 1 | 0% |
| 2 | 0 | 0% | 2 | 0% |
| 3 | 1 | 0% | 1 | 0% |
| 4 | 0 | 0% | 1 | 0% |
| 5 | 0 | 0% | 0 | 0% |
| 6 | 0 | 0% | 0 | 0% |
| 7 | 0 | 0% | 0 | 0% |
| 8 | 2,044 | 100% | 6,082 | 100% |
| Table Prepred by: Isaac H. Michaels, DrPH | ||||
| Data Source: NYC Open Data | ||||
Table Prepared by: Isaac H. Michaels, DrPH
Data Source: NYC Open Data
| FDNY EMS Incident Volume, by Disposition: Request For Stand-By |
||||
| January 01, 2025 to July 01, 2026 | ||||
| Disposition |
Latest Year: 2026
|
All Years: 2025-2026
|
||
|---|---|---|---|---|
| Incidents | % | Incidents | % | |
| Cancelled | 238 | 12% | 838 | 14% |
| Condition Corrected | 942 | 46% | 2,748 | 45% |
| Patient Gone on Arrival | 4 | 0% | 19 | 0% |
| Refused Medical Aid | 31 | 2% | 116 | 2% |
| Transporting Patient | 38 | 2% | 181 | 3% |
| Treated and Transported | 1 | 0% | 5 | 0% |
| Unfounded | 374 | 18% | 1,217 | 20% |
| NA | 417 | 20% | 960 | 16% |
| Table Prepred by: Isaac H. Michaels, DrPH | ||||
| Data Source: NYC Open Data | ||||
Table Prepared by: Isaac H. Michaels, DrPH
Data Source: NYC Open Data
Back to top
Female In Labor
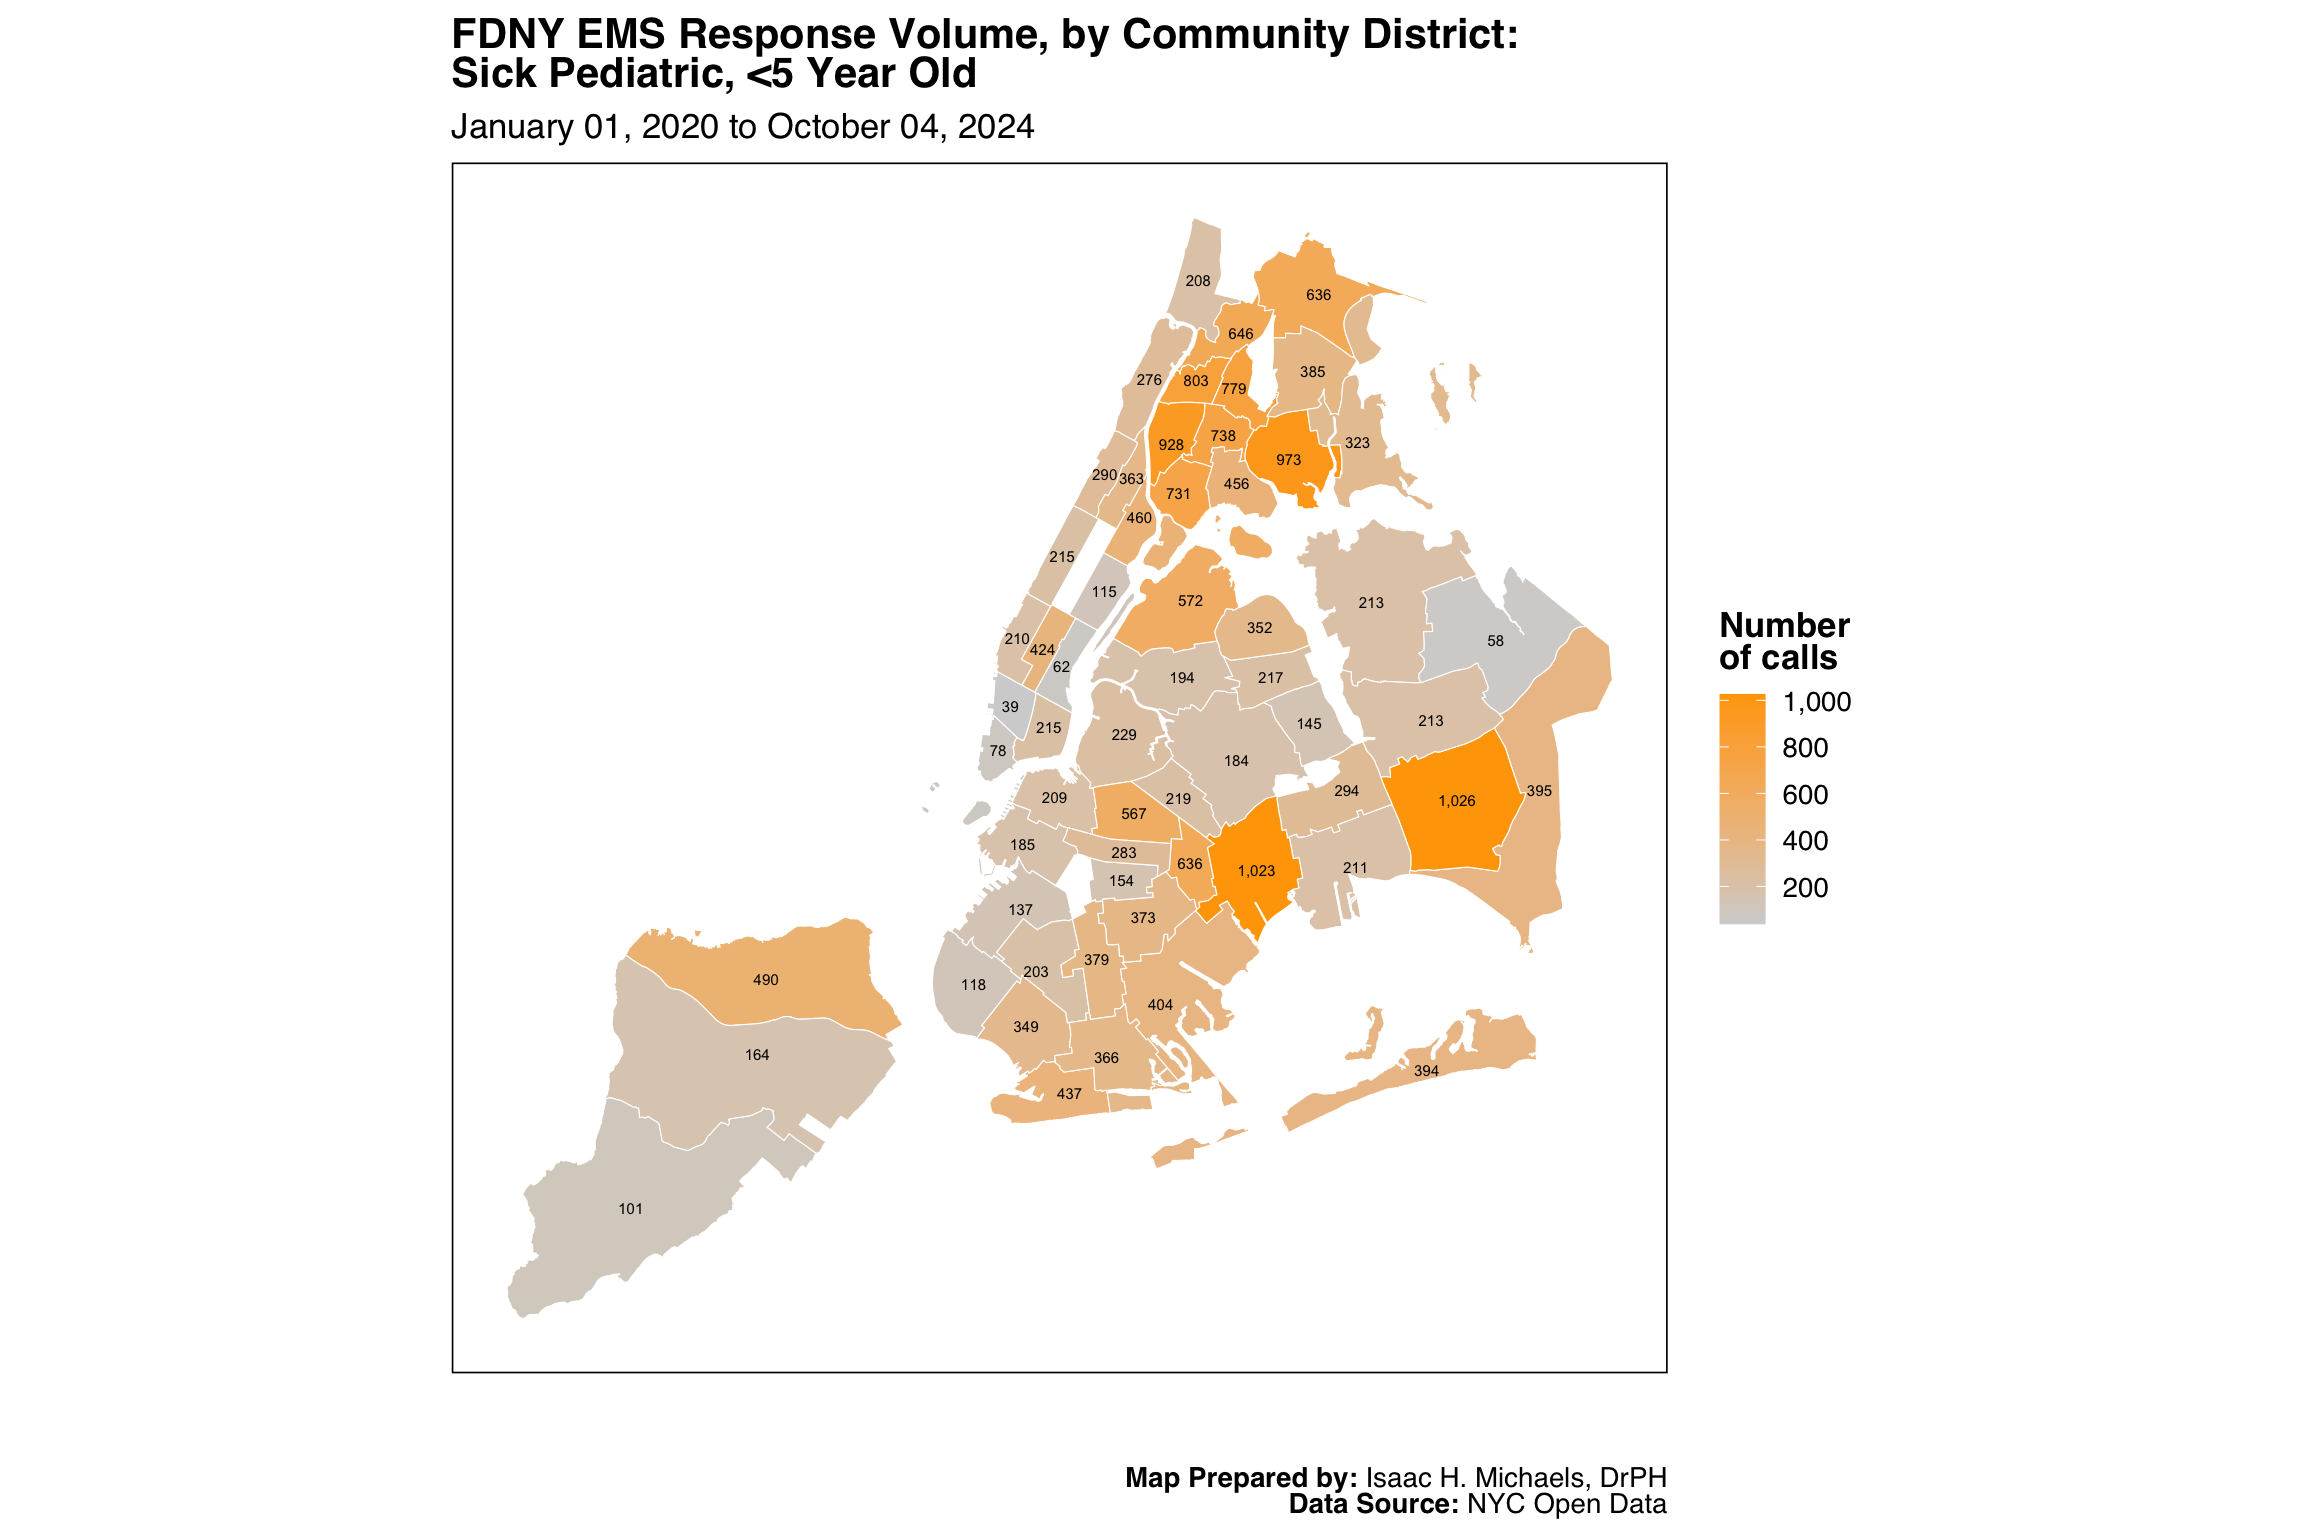
Map Prepared by: Isaac H. Michaels, DrPH
Data Source: NYC Open Data
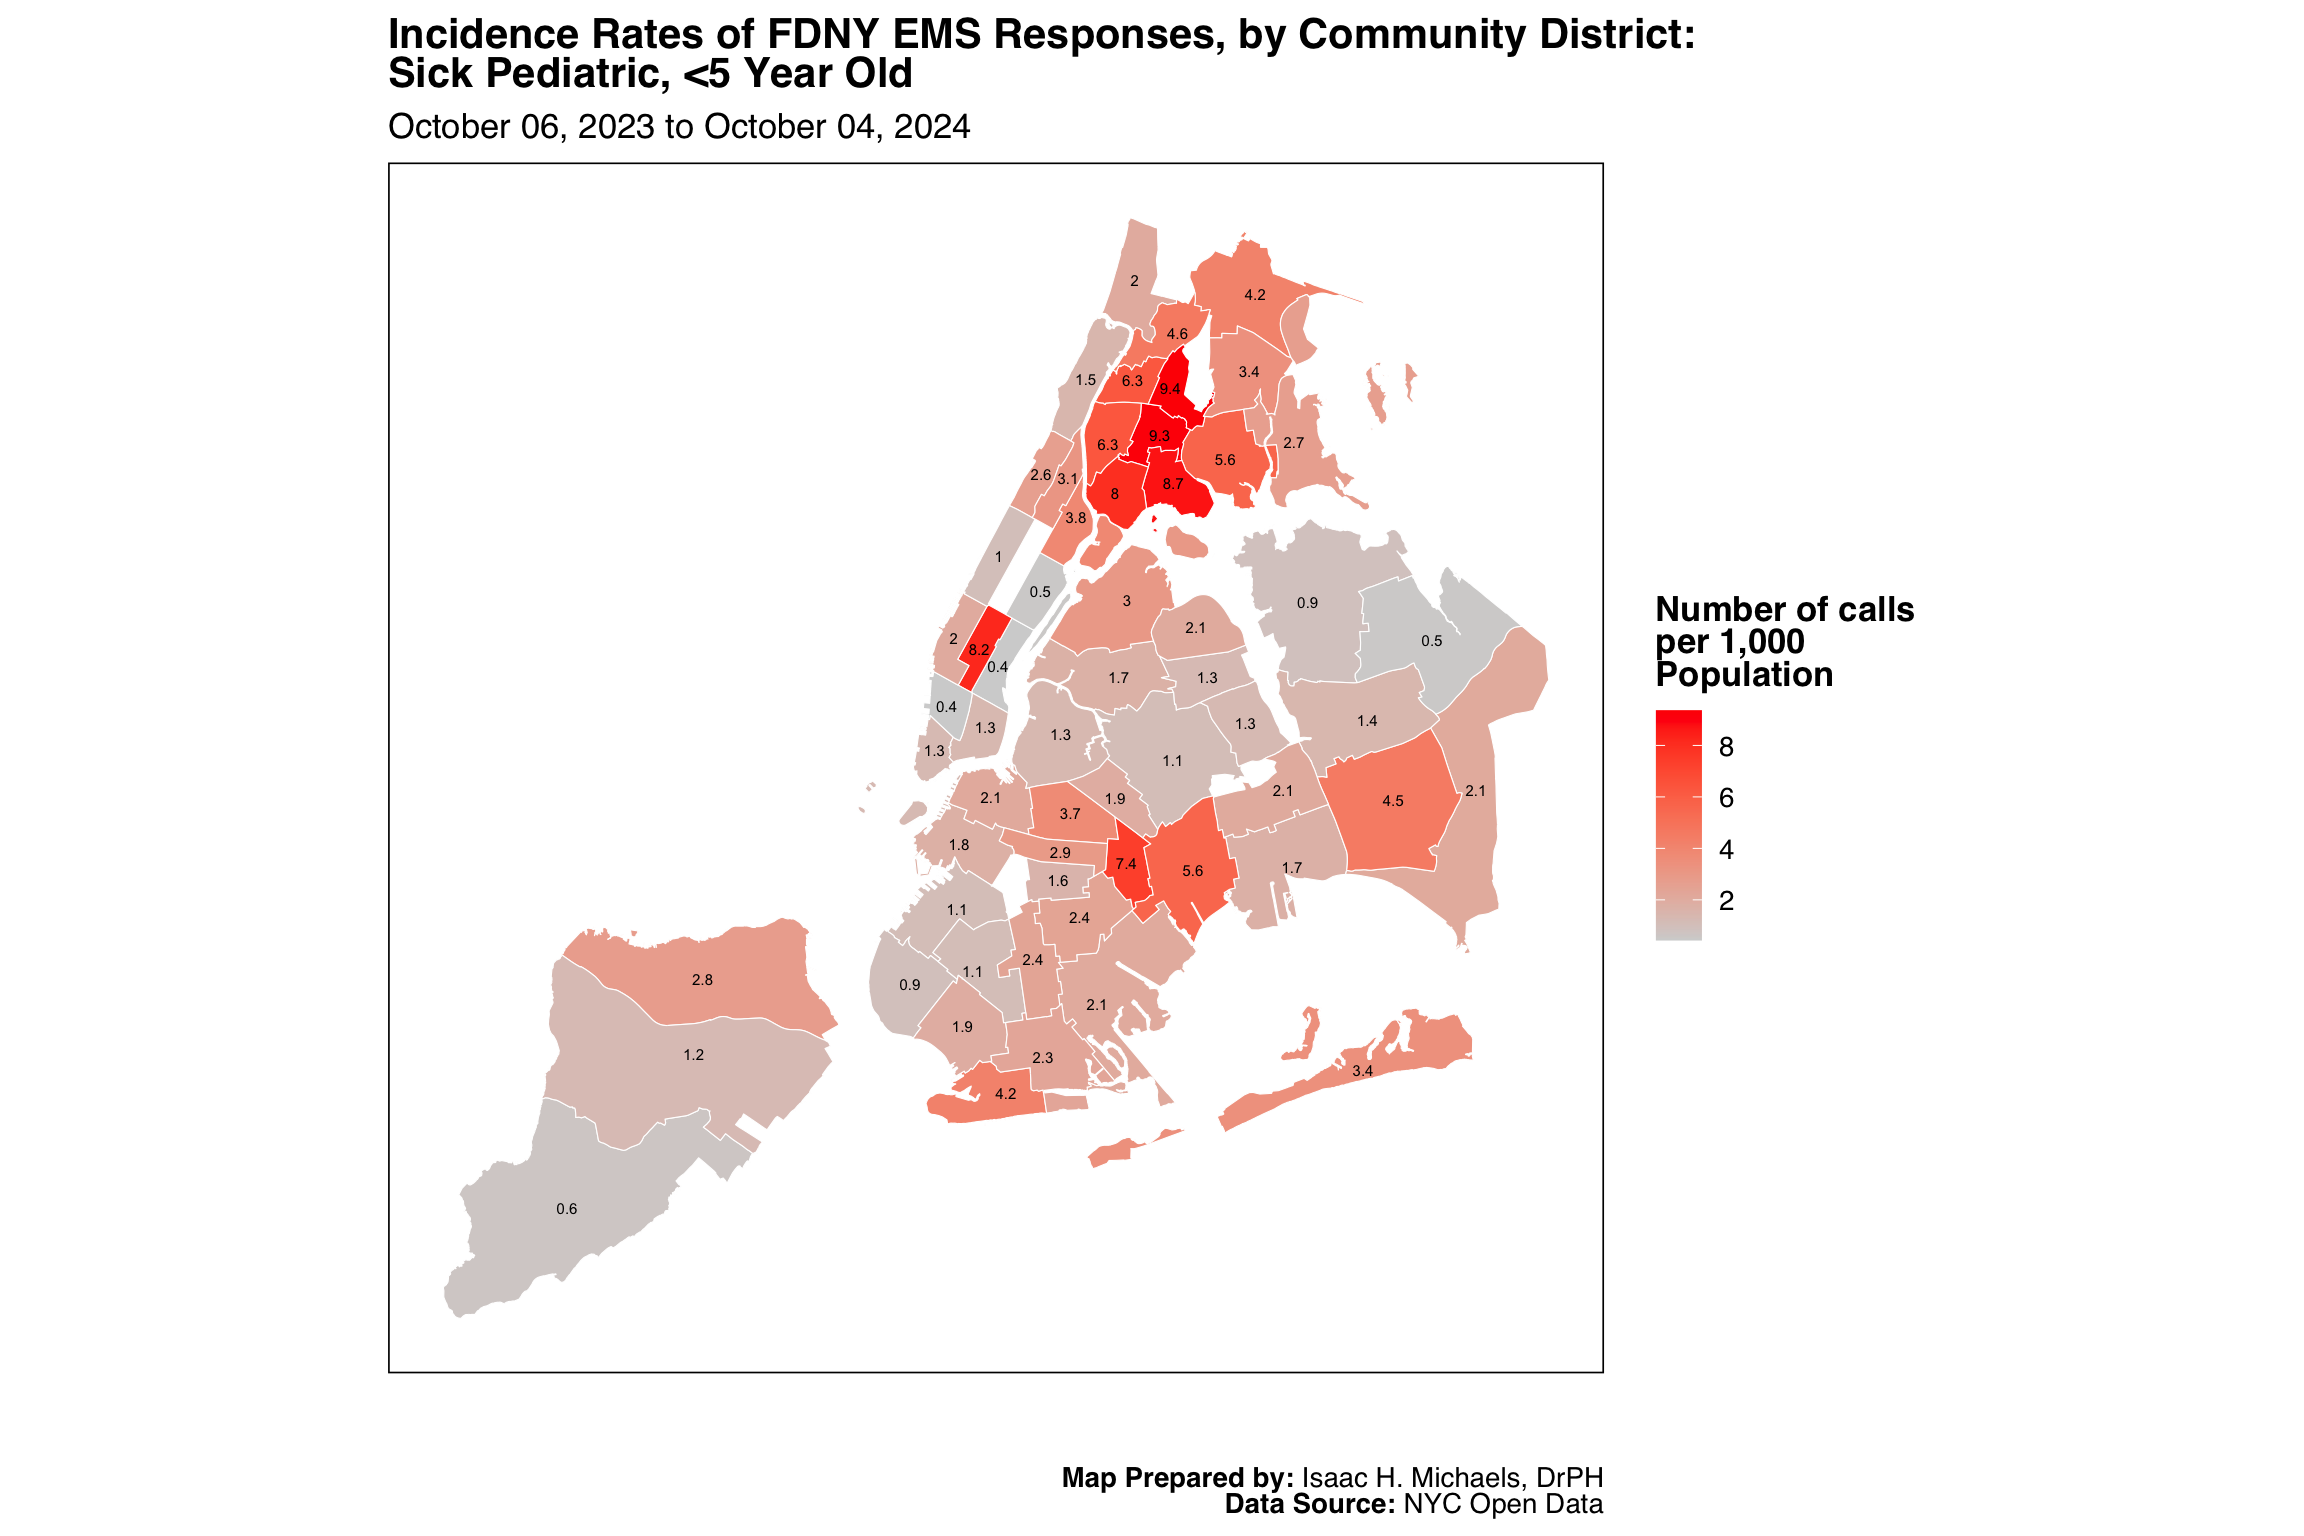
Map Prepared by: Isaac H. Michaels, DrPH
EMS Data Source: NYC Open Data
Population Data Source: NYC Open Data
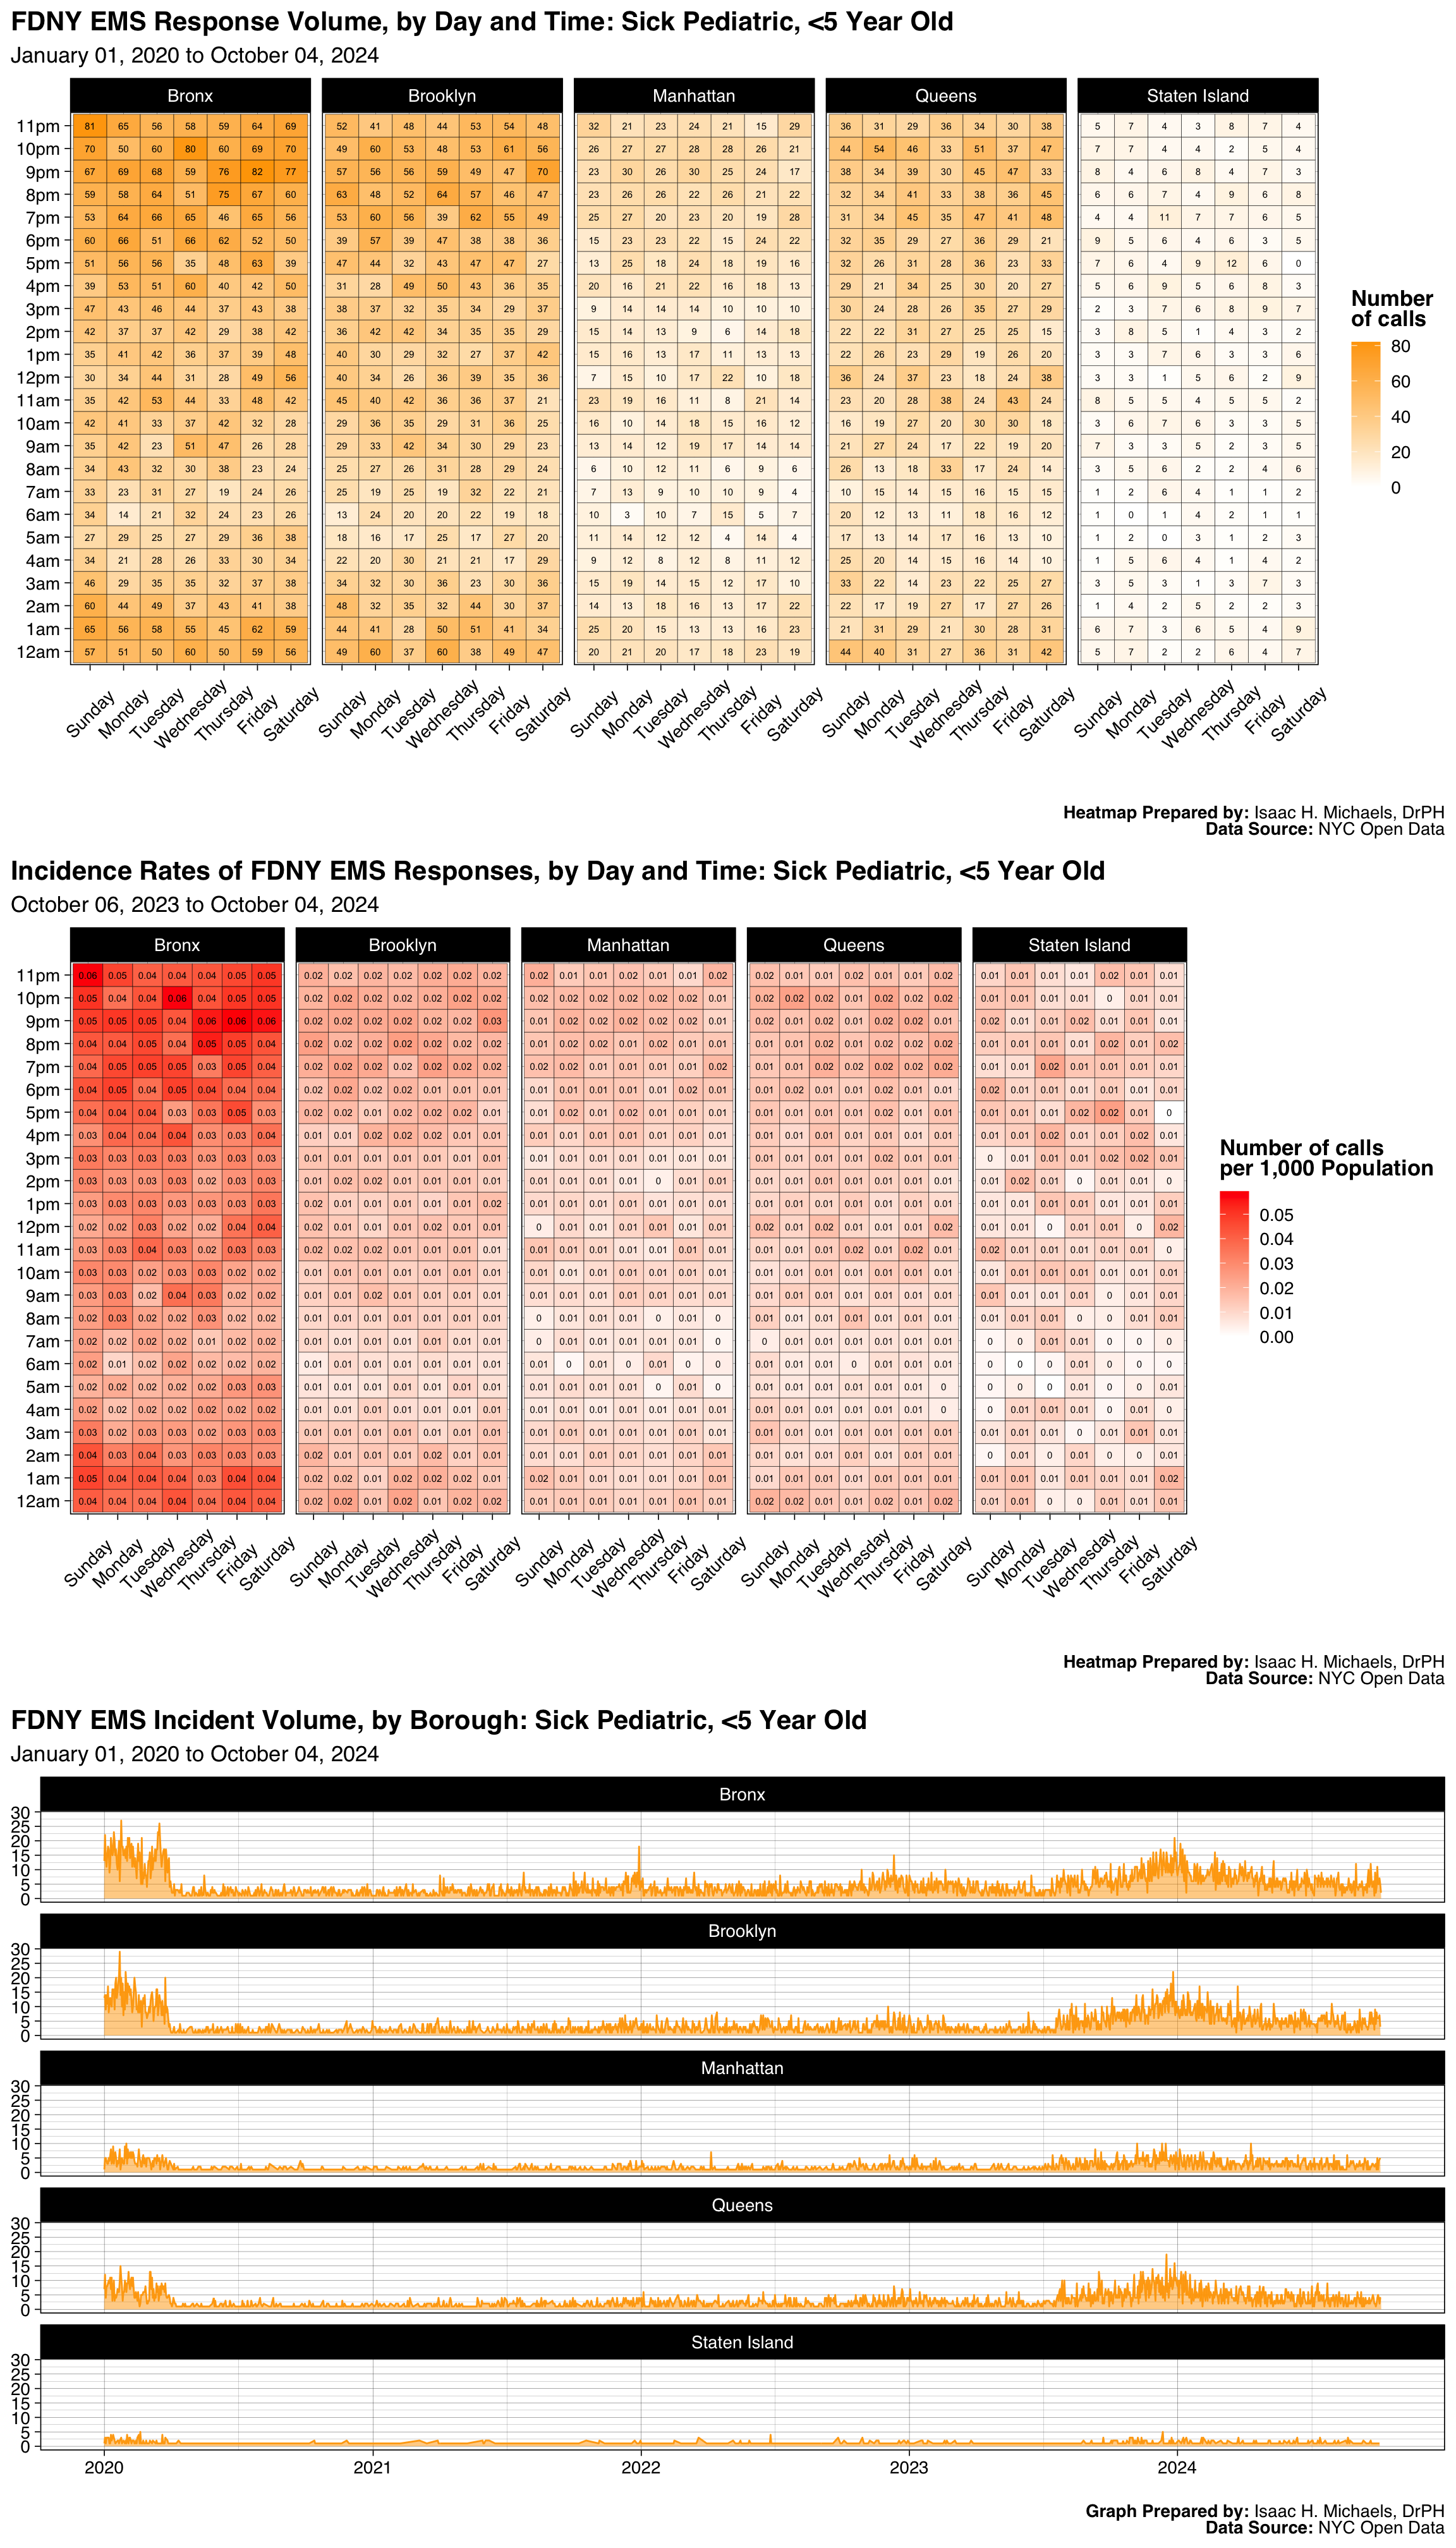
Graphs Prepared by: Isaac H. Michaels, DrPH
Data Source: NYC Open Data
| FDNY EMS Incident Volume, by Borough: Female In Labor |
||||||
| January 01, 2025 to July 01, 2026 | ||||||
| Borough |
Latest Year: 2026
|
All Years: 2025-2026
|
||||
|---|---|---|---|---|---|---|
| Incidents | % | Rate per 1,000 Population | Total Incidents | % | Monthly Trend | |
| Bronx | 617 | 36% | 0.4 | 1,968 | 33% | |
| Brooklyn | 433 | 25% | 0.2 | 1,650 | 28% | |
| Manhattan | 245 | 14% | 0.2 | 867 | 15% | |
| Queens | 351 | 21% | 0.2 | 1,149 | 20% | |
| Staten Island | 66 | 4% | 0.1 | 242 | 4% | |
| Table Prepred by: Isaac H. Michaels, DrPH | ||||||
| Data Source: NYC Open Data | ||||||
Table Prepared by: Isaac H. Michaels, DrPH
EMS Data Source: NYC Open Data
Population Data Source: Health Data NY
| FDNY EMS Incident Volume, by Severity Level: Female In Labor |
||||
| January 01, 2025 to July 01, 2026 | ||||
| Final Severity Level |
Latest Year: 2026
|
All Years: 2025-2026
|
||
|---|---|---|---|---|
| Incidents | % | Incidents | % | |
| 1 | 0 | 0% | 0 | 0% |
| 2 | 1 | 0% | 1 | 0% |
| 3 | 1 | 0% | 6 | 0% |
| 4 | 1,710 | 100% | 5,869 | 100% |
| 5 | 0 | 0% | 0 | 0% |
| 6 | 0 | 0% | 0 | 0% |
| 7 | 0 | 0% | 0 | 0% |
| 8 | 0 | 0% | 0 | 0% |
| Table Prepred by: Isaac H. Michaels, DrPH | ||||
| Data Source: NYC Open Data | ||||
Table Prepared by: Isaac H. Michaels, DrPH
Data Source: NYC Open Data
| FDNY EMS Incident Volume, by Disposition: Female In Labor |
||||
| January 01, 2025 to July 01, 2026 | ||||
| Disposition |
Latest Year: 2026
|
All Years: 2025-2026
|
||
|---|---|---|---|---|
| Incidents | % | Incidents | % | |
| Cancelled | 45 | 3% | 83 | 1% |
| Condition Corrected | 5 | 0% | 19 | 0% |
| Patient Gone on Arrival | 80 | 5% | 207 | 4% |
| Refused Medical Aid | 110 | 6% | 414 | 7% |
| Transporting Patient | 1,392 | 81% | 4,945 | 84% |
| Treated and Transported | 3 | 0% | 6 | 0% |
| Unfounded | 44 | 3% | 146 | 2% |
| NA | 33 | 2% | 56 | 1% |
| Table Prepred by: Isaac H. Michaels, DrPH | ||||
| Data Source: NYC Open Data | ||||
Table Prepared by: Isaac H. Michaels, DrPH
Data Source: NYC Open Data
Back to top
Gyn Bleeding/Pt Not Pregnant
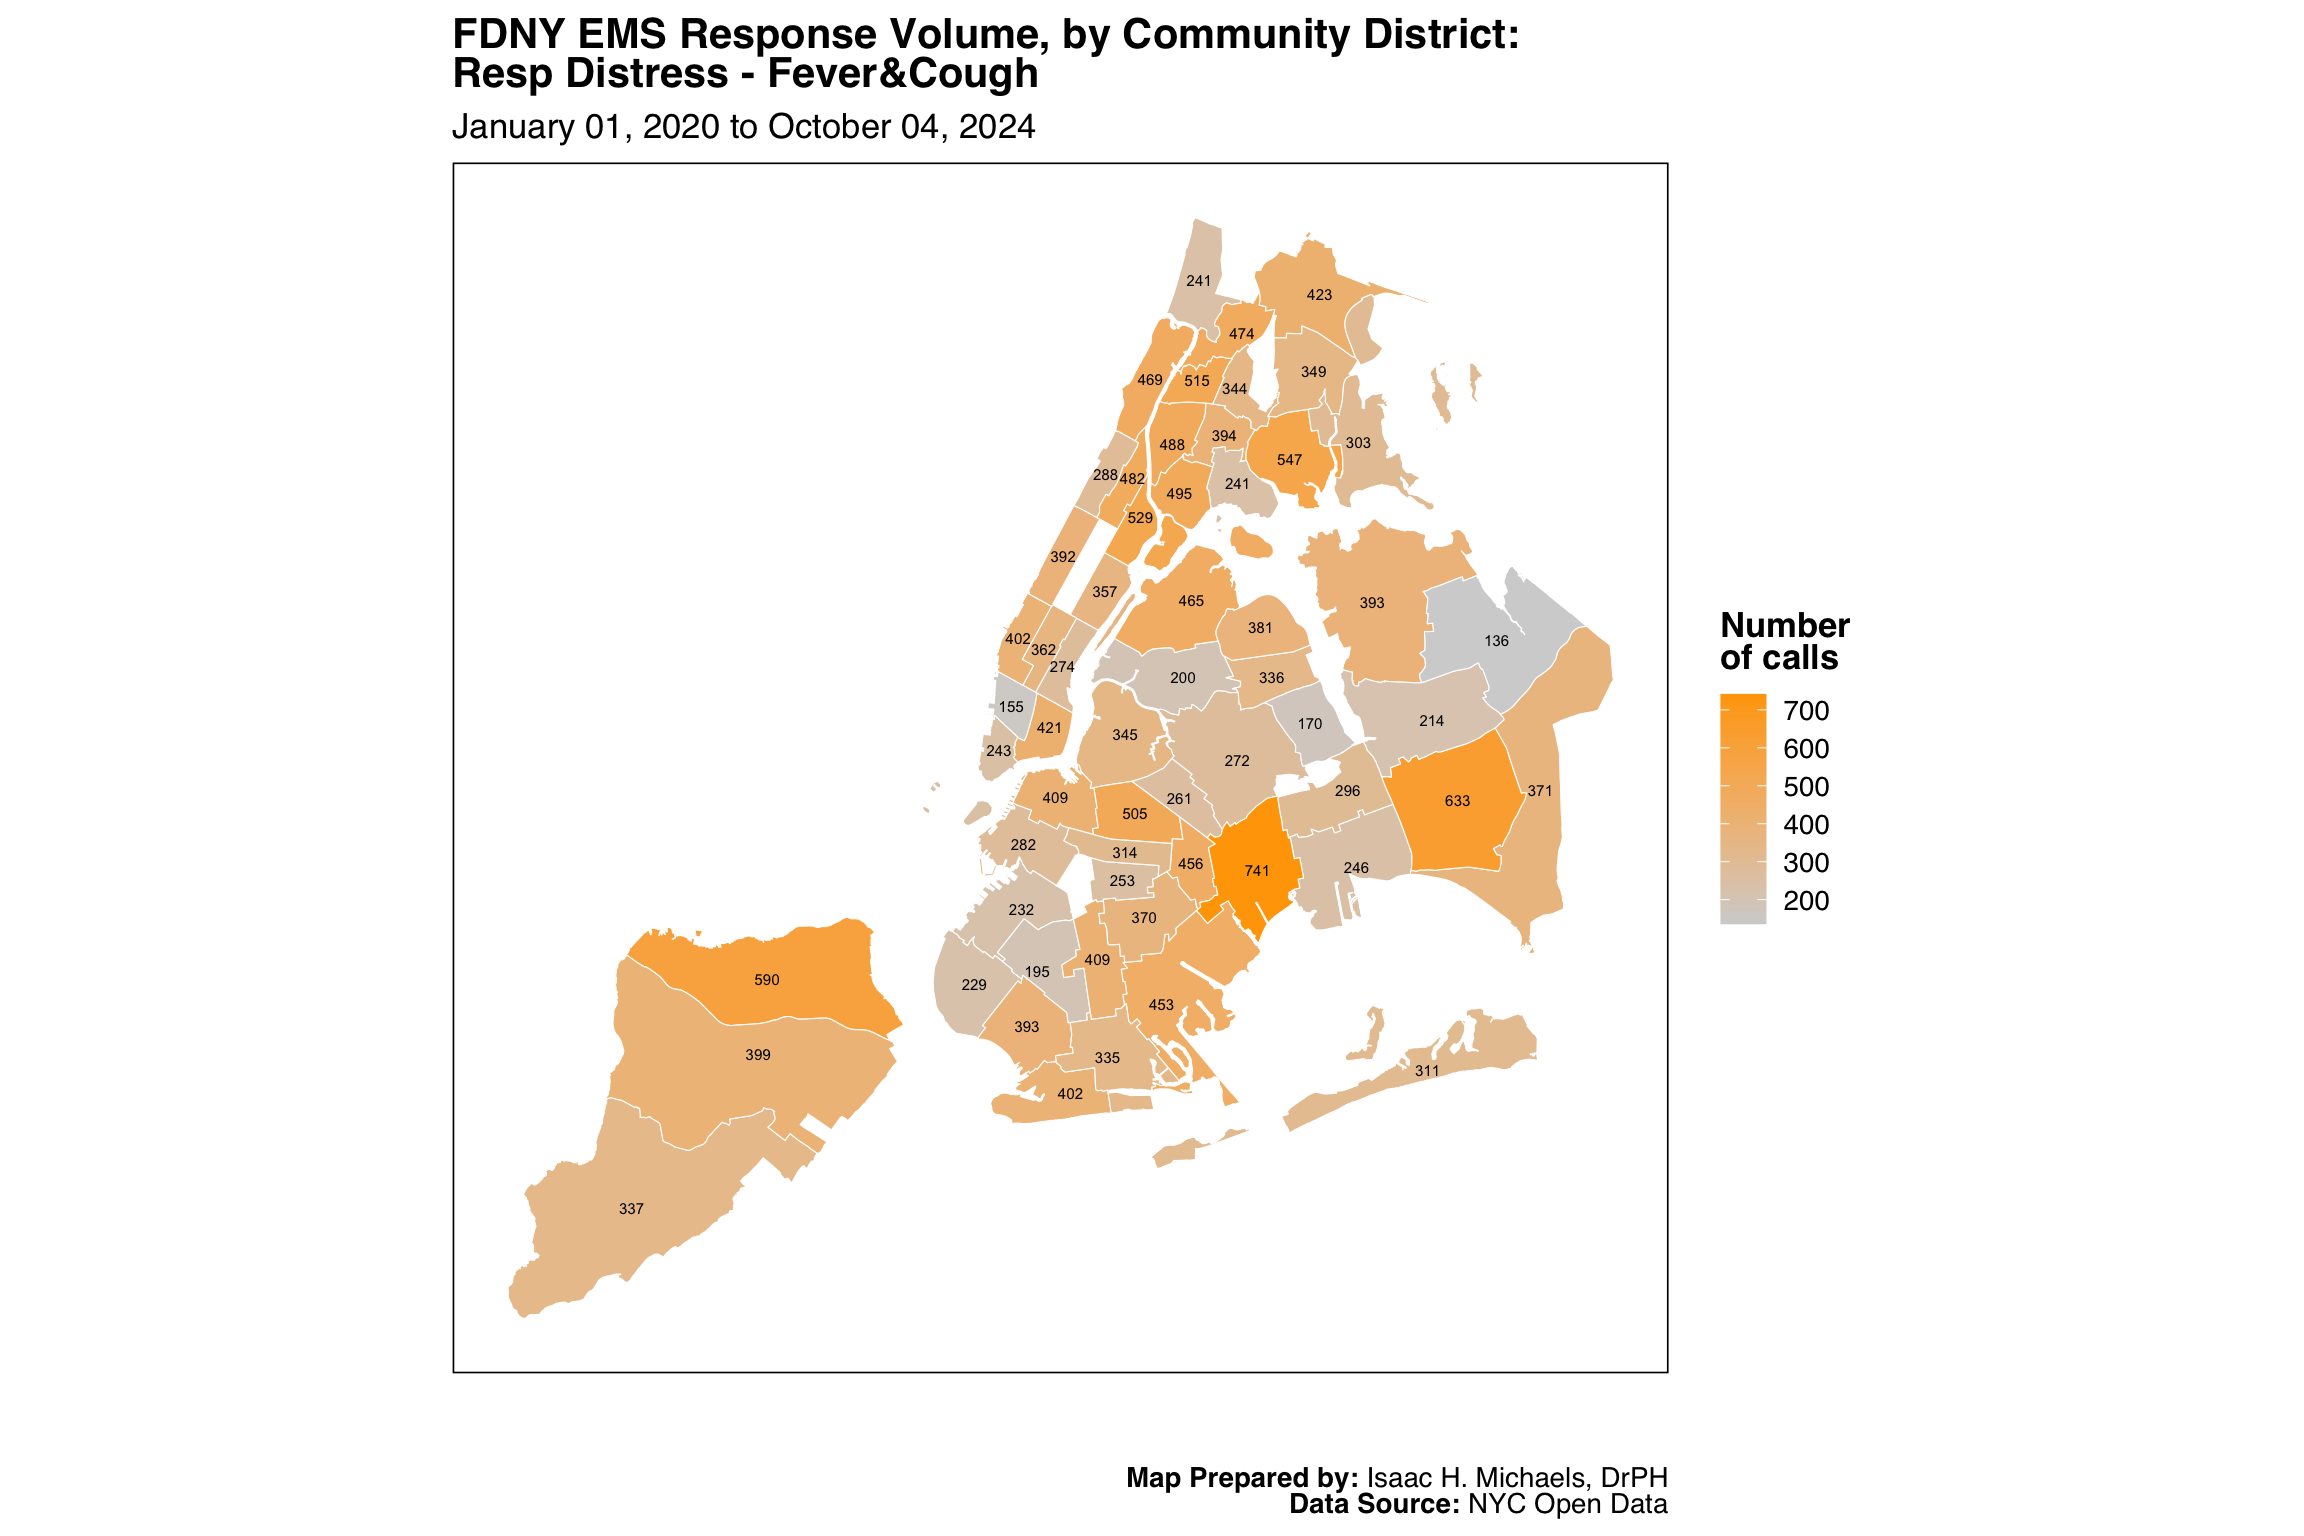
Map Prepared by: Isaac H. Michaels, DrPH
Data Source: NYC Open Data
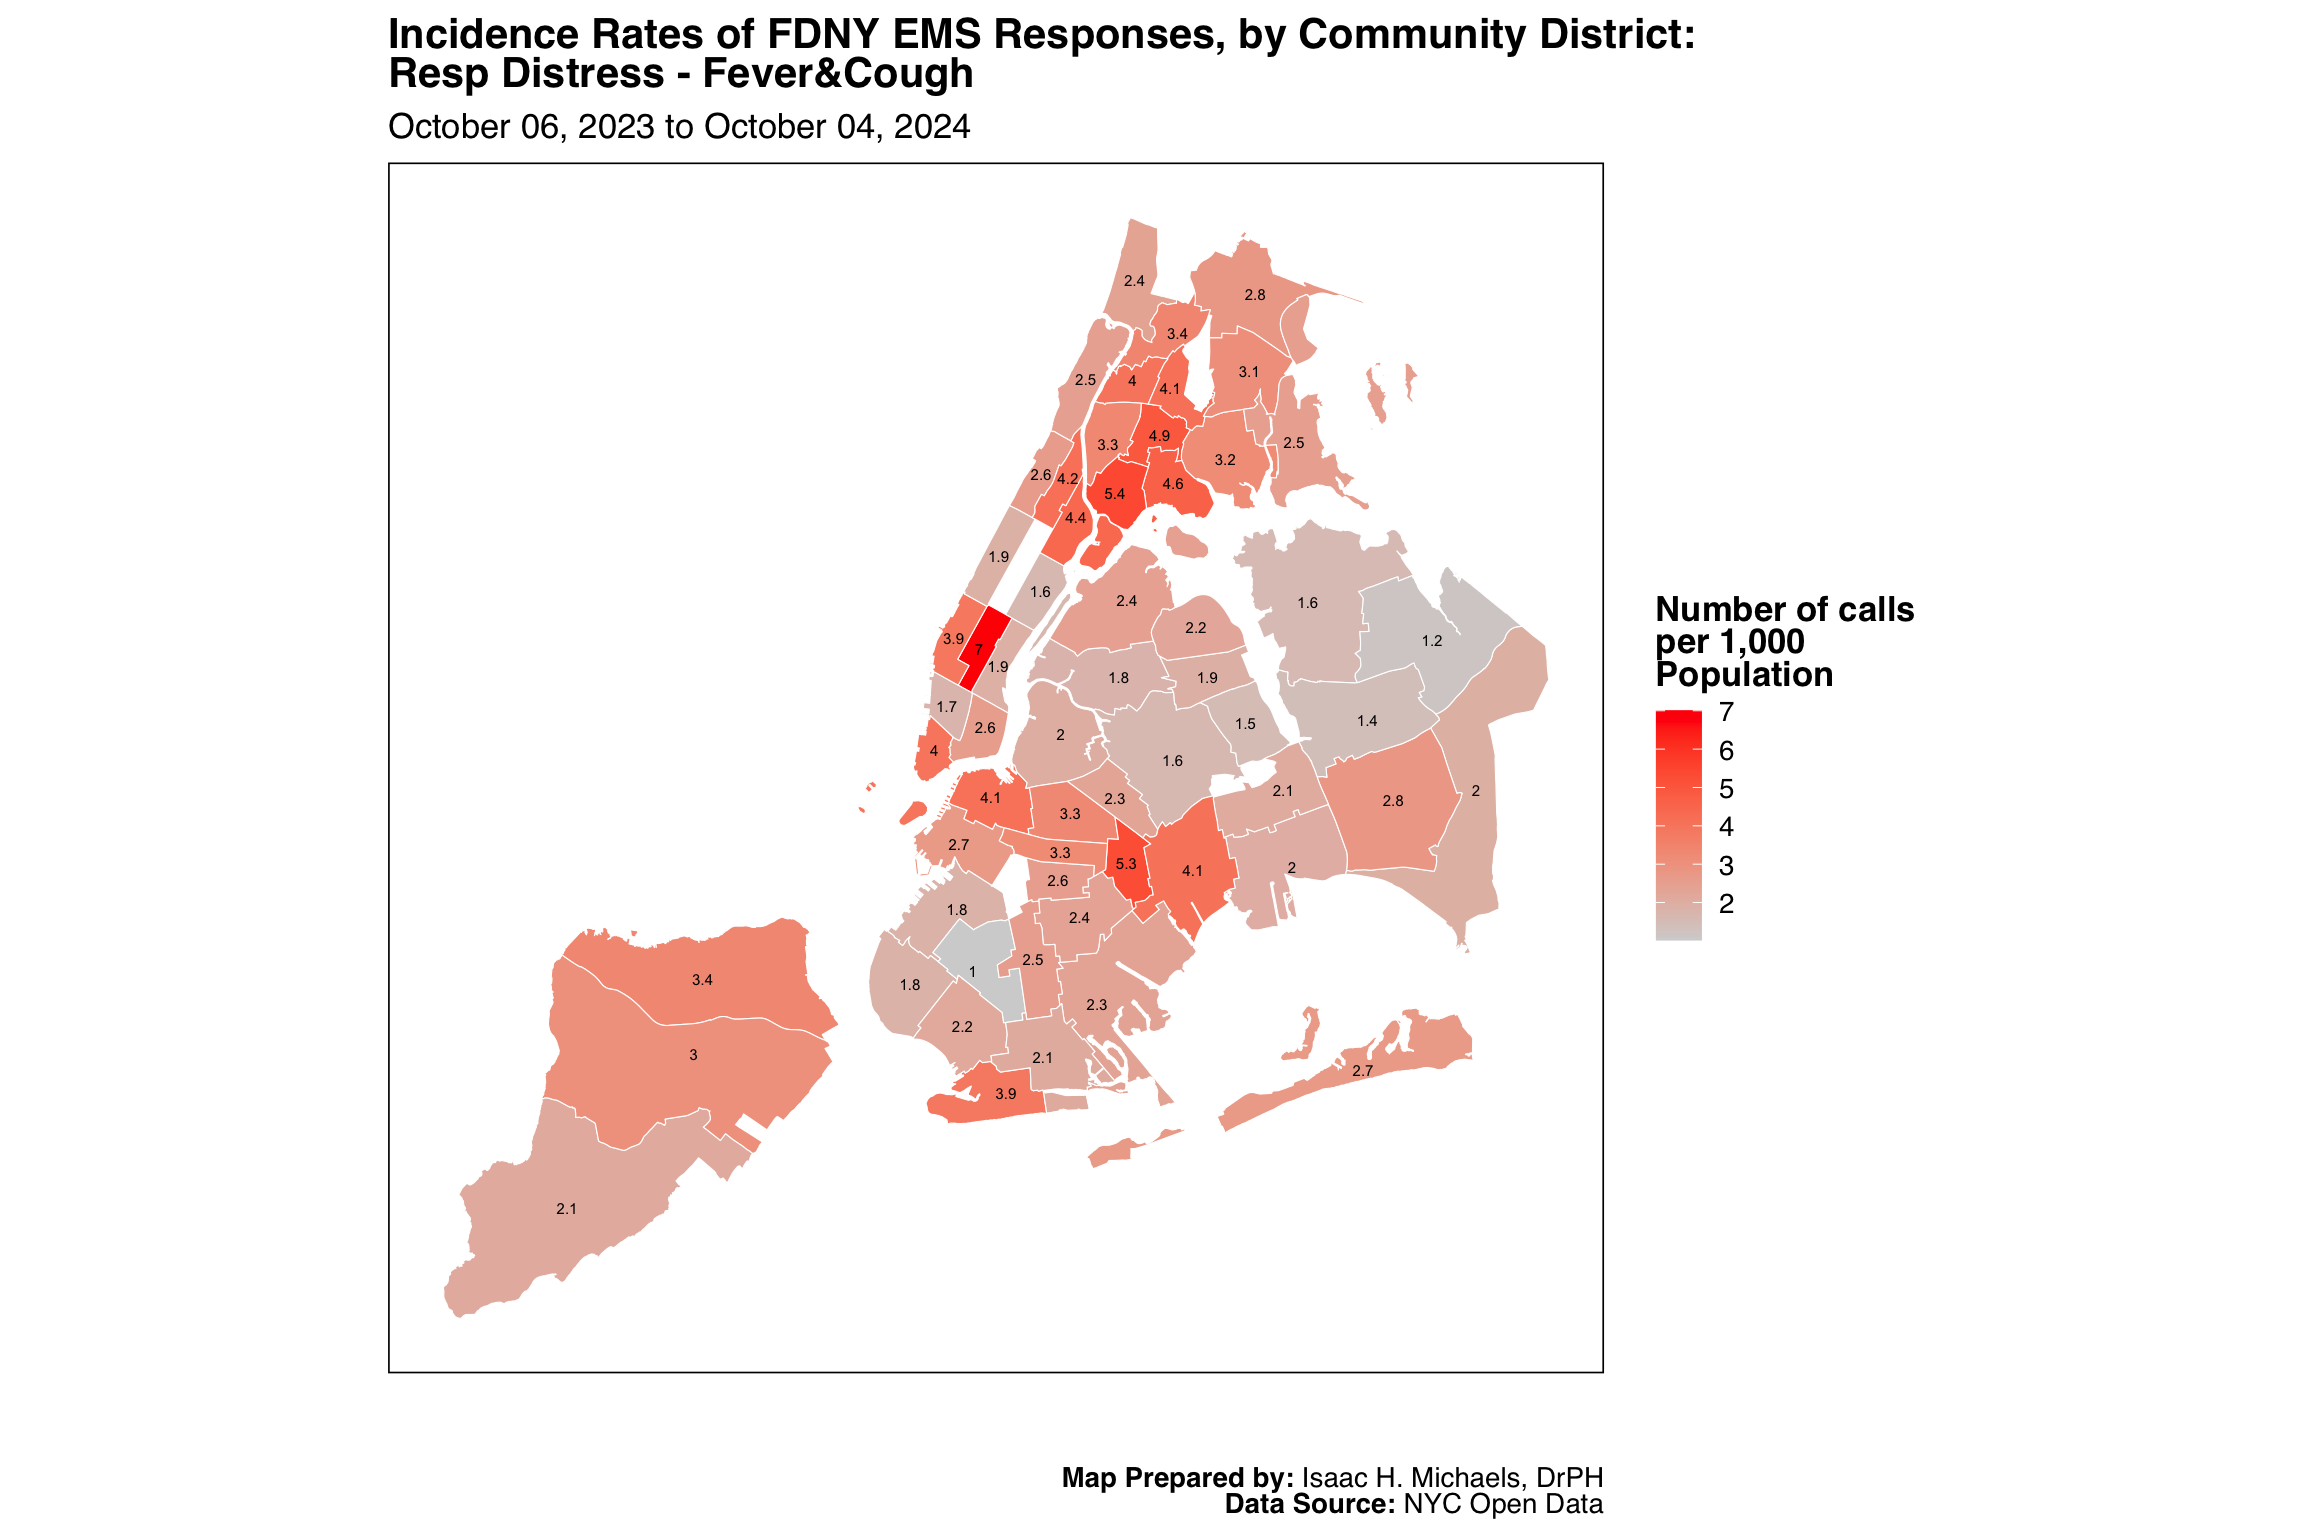
Map Prepared by: Isaac H. Michaels, DrPH
EMS Data Source: NYC Open Data
Population Data Source: NYC Open Data
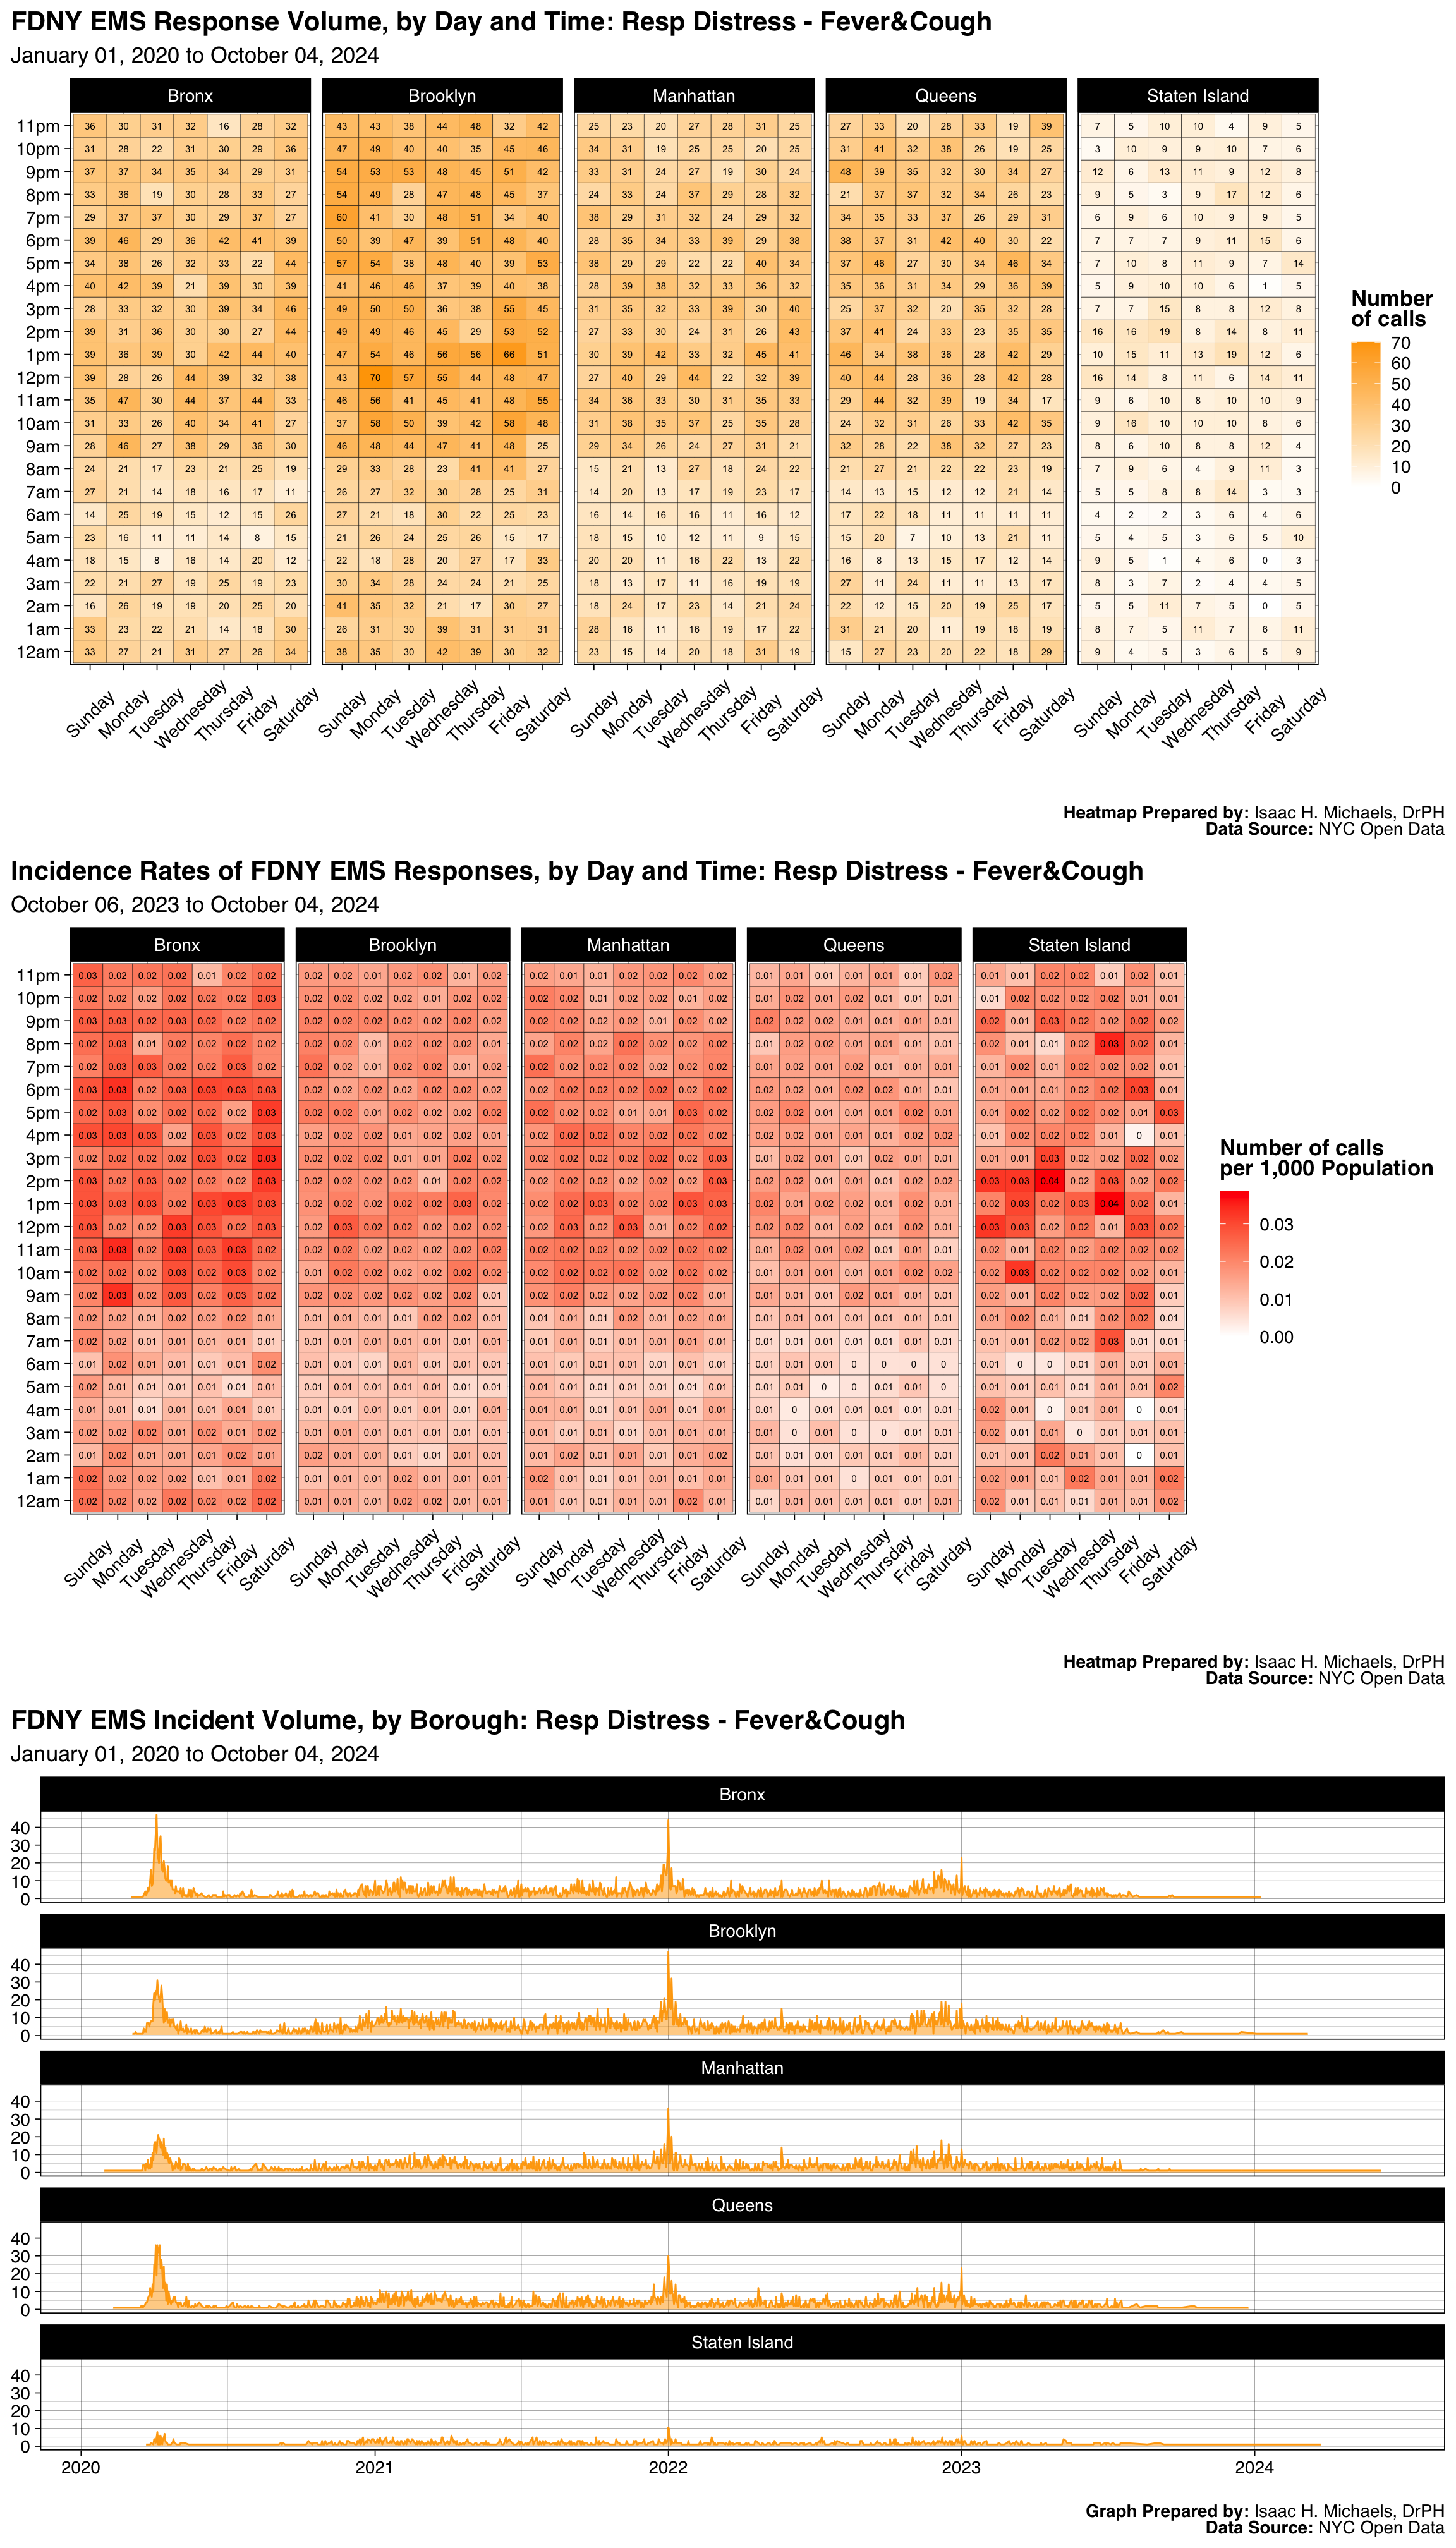
Graphs Prepared by: Isaac H. Michaels, DrPH
Data Source: NYC Open Data
| FDNY EMS Incident Volume, by Borough: Gyn Bleeding/Pt Not Pregnant |
||||||
| January 01, 2025 to July 01, 2026 | ||||||
| Borough |
Latest Year: 2026
|
All Years: 2025-2026
|
||||
|---|---|---|---|---|---|---|
| Incidents | % | Rate per 1,000 Population | Total Incidents | % | Monthly Trend | |
| Bronx | 485 | 26% | 0.4 | 1,579 | 29% | |
| Brooklyn | 554 | 30% | 0.2 | 1,667 | 30% | |
| Manhattan | 369 | 20% | 0.2 | 1,012 | 18% | |
| Queens | 373 | 20% | 0.2 | 1,051 | 19% | |
| Staten Island | 70 | 4% | 0.1 | 193 | 4% | |
| Table Prepred by: Isaac H. Michaels, DrPH | ||||||
| Data Source: NYC Open Data | ||||||
Table Prepared by: Isaac H. Michaels, DrPH
EMS Data Source: NYC Open Data
Population Data Source: Health Data NY
| FDNY EMS Incident Volume, by Severity Level: Gyn Bleeding/Pt Not Pregnant |
||||
| January 01, 2025 to July 01, 2026 | ||||
| Final Severity Level |
Latest Year: 2026
|
All Years: 2025-2026
|
||
|---|---|---|---|---|
| Incidents | % | Incidents | % | |
| 1 | 0 | 0% | 0 | 0% |
| 2 | 0 | 0% | 0 | 0% |
| 3 | 2 | 0% | 3 | 0% |
| 4 | 9 | 0% | 21 | 0% |
| 5 | 1,840 | 99% | 5,478 | 100% |
| 6 | 0 | 0% | 0 | 0% |
| 7 | 0 | 0% | 0 | 0% |
| 8 | 0 | 0% | 0 | 0% |
| Table Prepred by: Isaac H. Michaels, DrPH | ||||
| Data Source: NYC Open Data | ||||
Table Prepared by: Isaac H. Michaels, DrPH
Data Source: NYC Open Data
| FDNY EMS Incident Volume, by Disposition: Gyn Bleeding/Pt Not Pregnant |
||||
| January 01, 2025 to July 01, 2026 | ||||
| Disposition |
Latest Year: 2026
|
All Years: 2025-2026
|
||
|---|---|---|---|---|
| Incidents | % | Incidents | % | |
| Cancelled | 34 | 2% | 73 | 1% |
| Condition Corrected | 12 | 1% | 40 | 1% |
| Patient Gone on Arrival | 70 | 4% | 163 | 3% |
| Refused Medical Aid | 141 | 8% | 449 | 8% |
| Transporting Patient | 1,475 | 80% | 4,490 | 82% |
| Treated and Transported | 2 | 0% | 3 | 0% |
| Unfounded | 66 | 4% | 188 | 3% |
| NA | 51 | 3% | 96 | 2% |
| Table Prepred by: Isaac H. Michaels, DrPH | ||||
| Data Source: NYC Open Data | ||||
Table Prepared by: Isaac H. Michaels, DrPH
Data Source: NYC Open Data
Back to top
Major Obstetrical Complaint
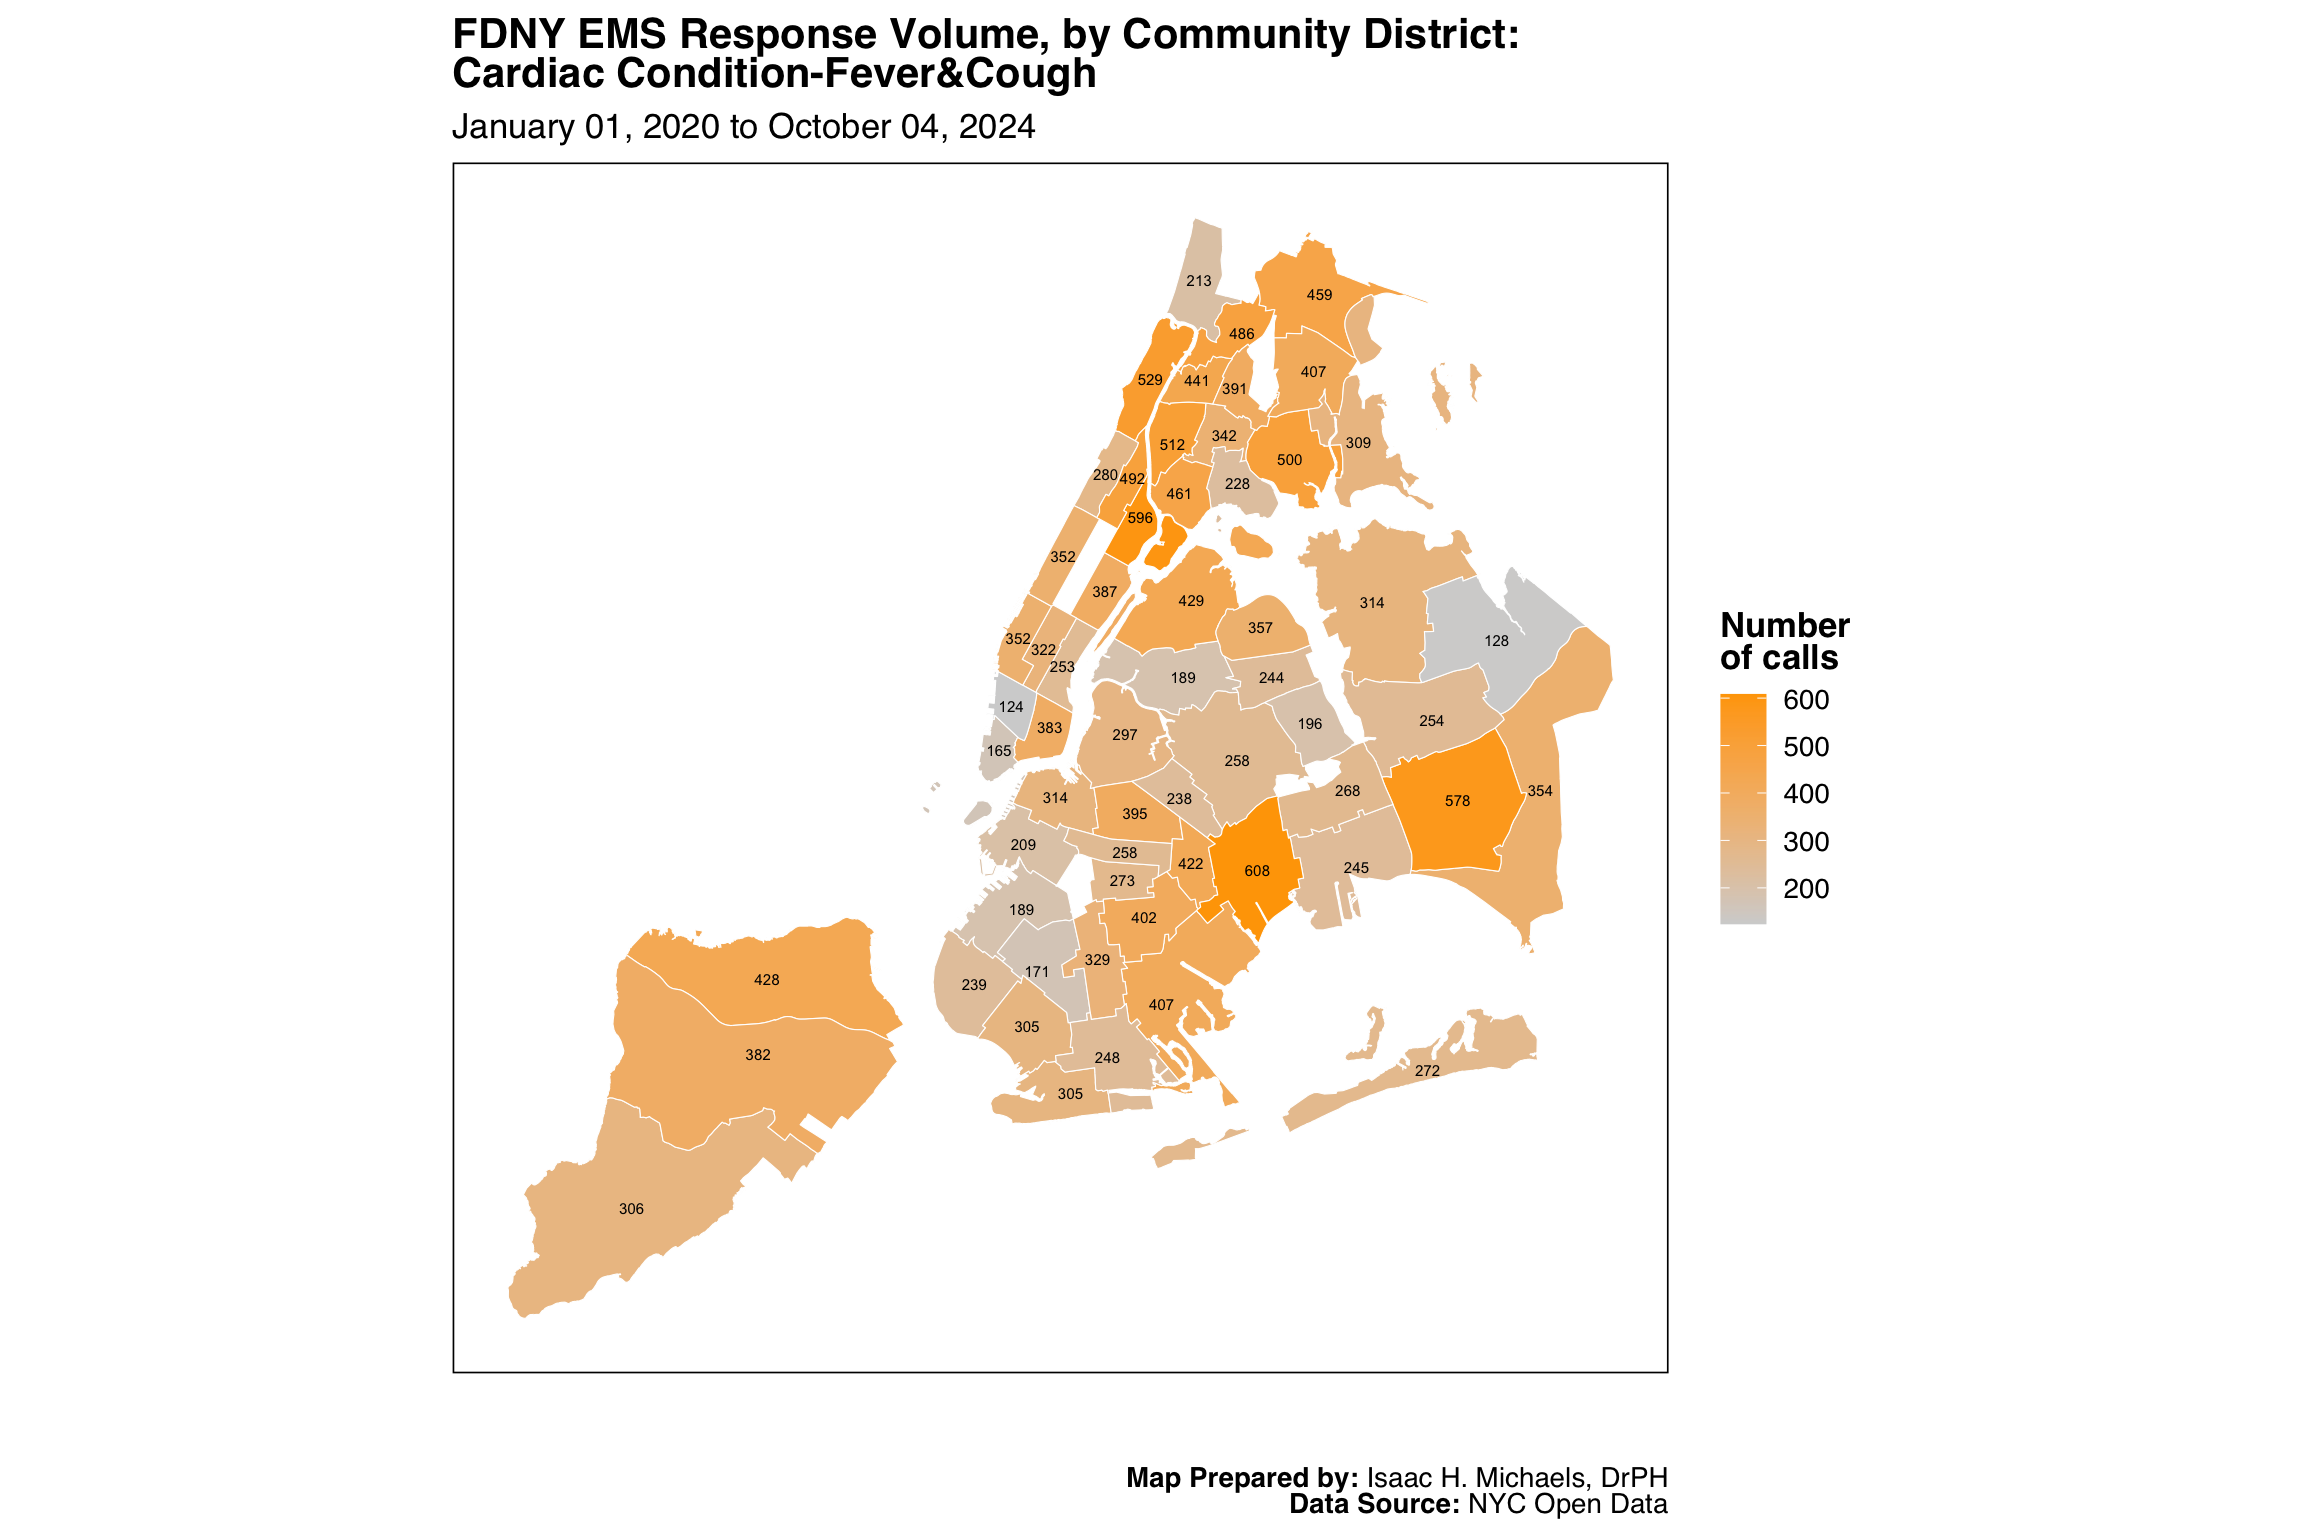
Map Prepared by: Isaac H. Michaels, DrPH
Data Source: NYC Open Data

Map Prepared by: Isaac H. Michaels, DrPH
EMS Data Source: NYC Open Data
Population Data Source: NYC Open Data
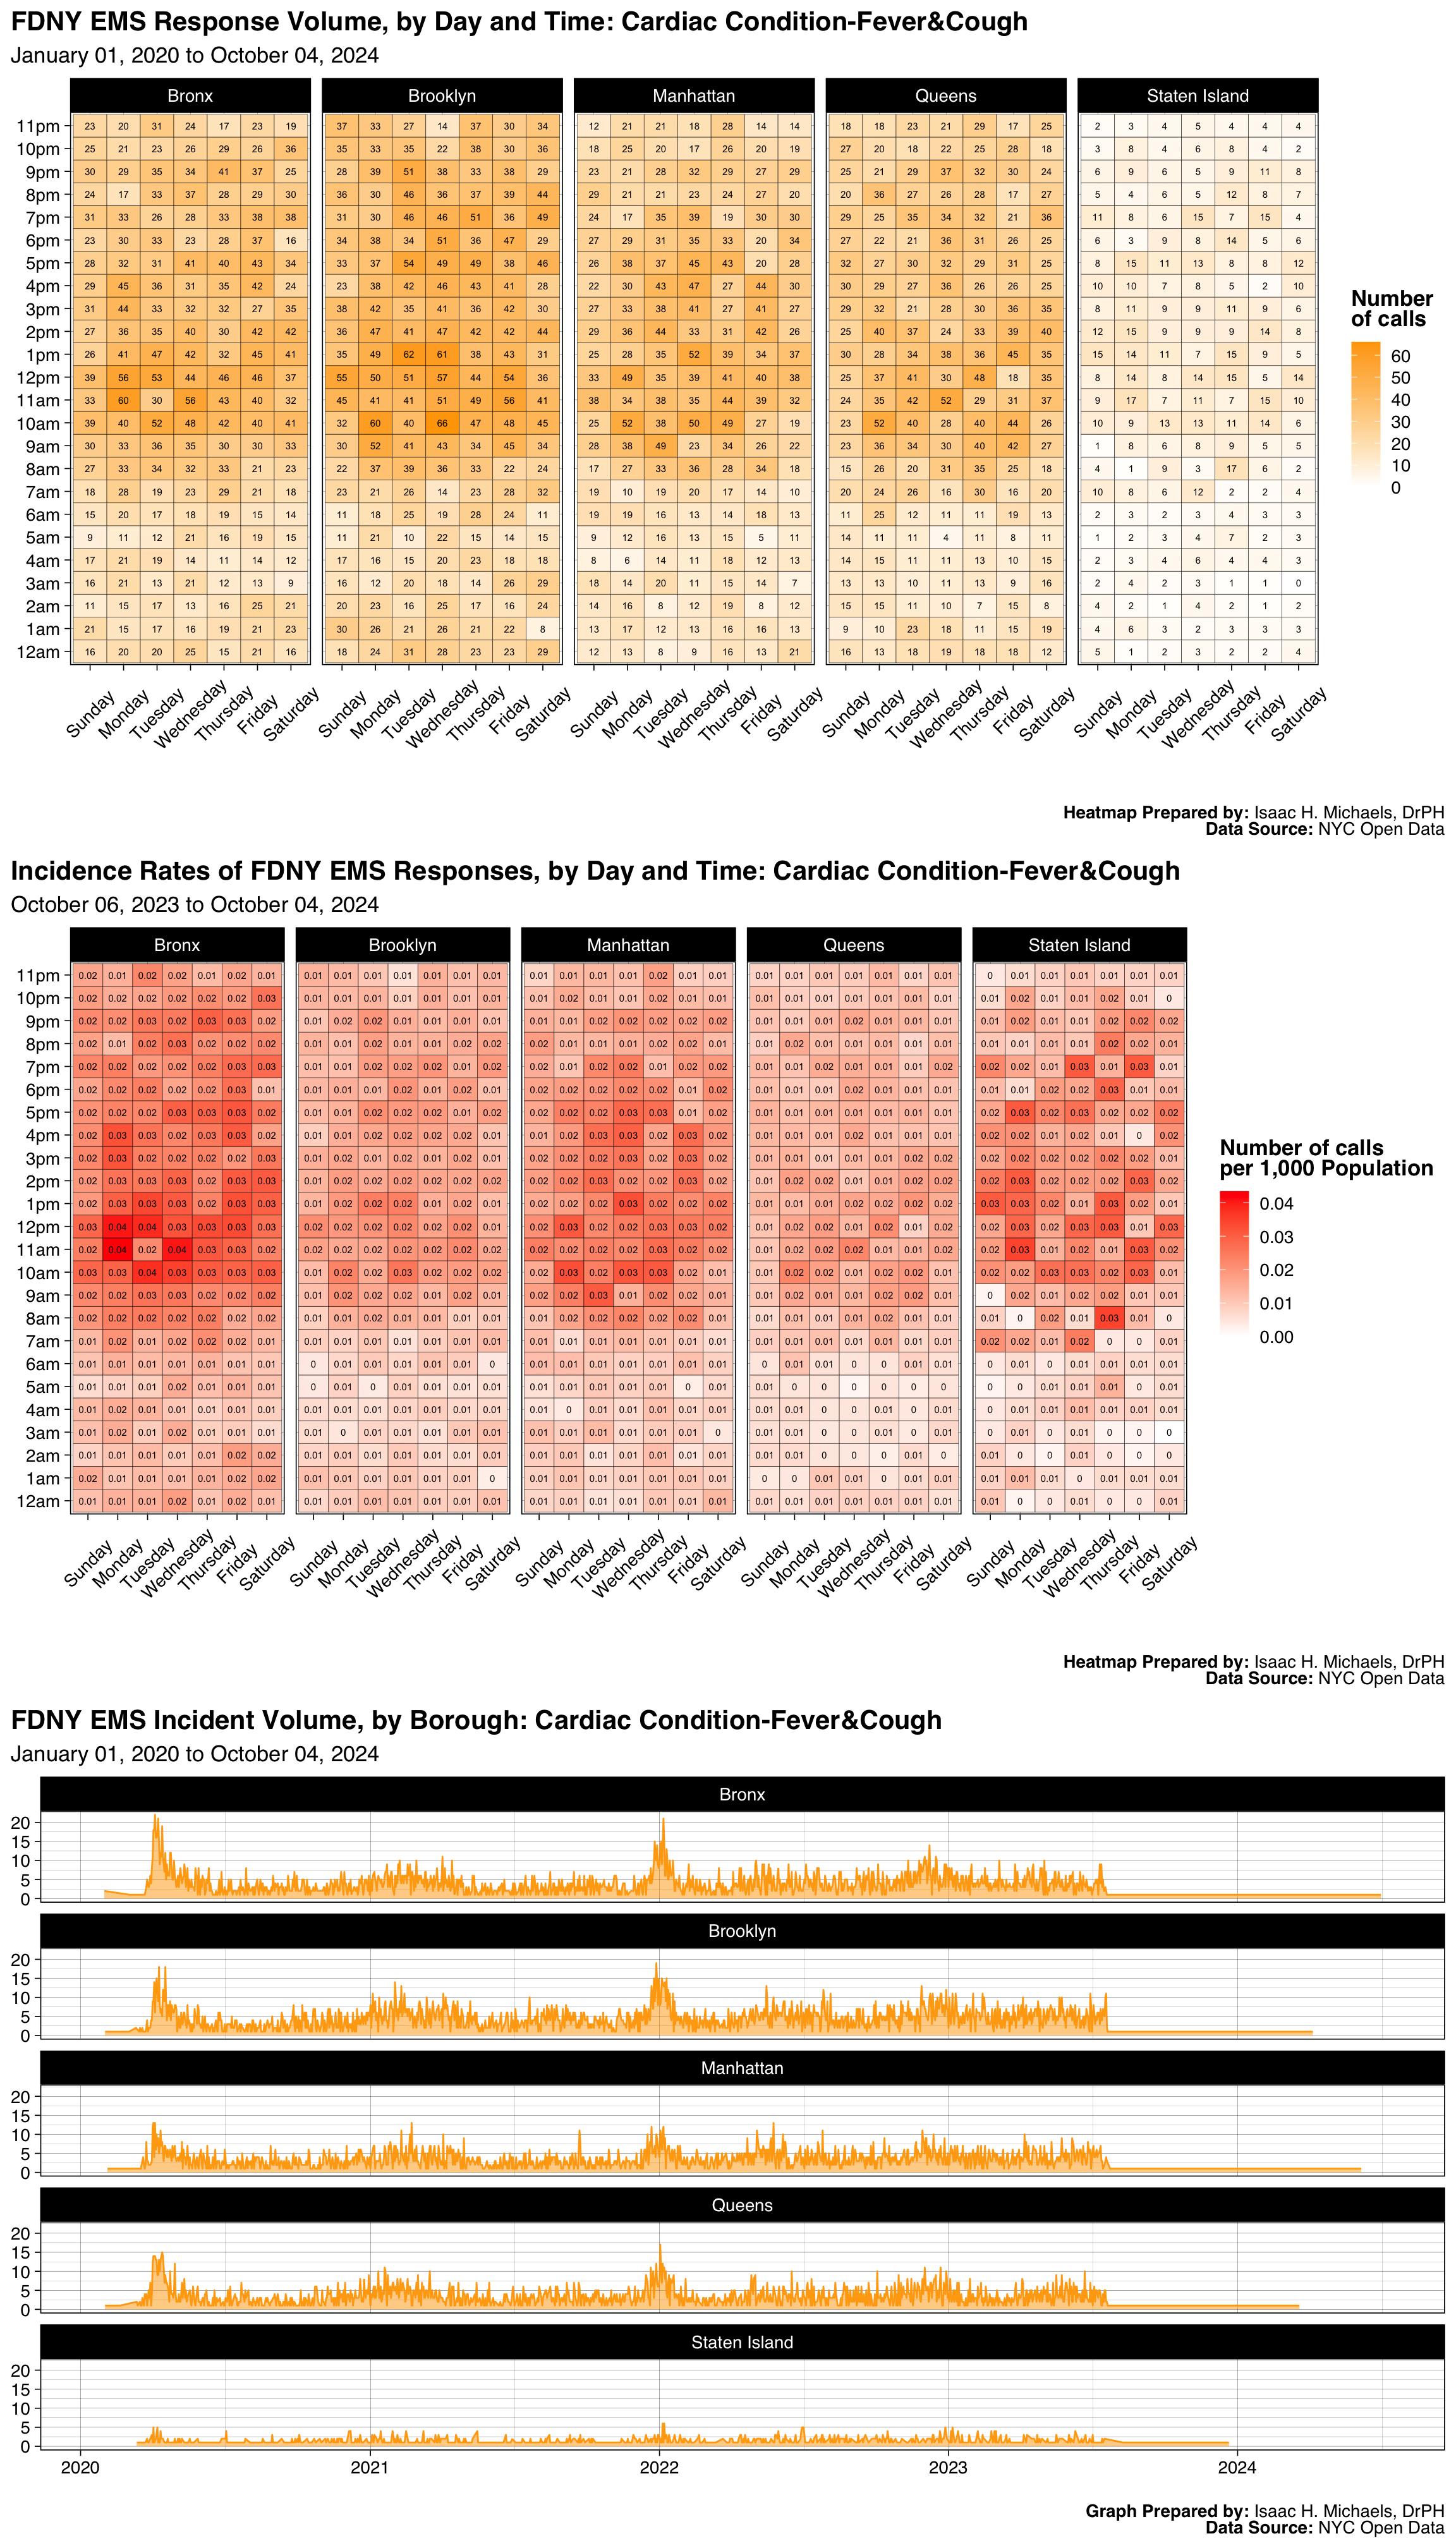
Graphs Prepared by: Isaac H. Michaels, DrPH
Data Source: NYC Open Data
| FDNY EMS Incident Volume, by Borough: Major Obstetrical Complaint |
||||||
| January 01, 2025 to July 01, 2026 | ||||||
| Borough |
Latest Year: 2026
|
All Years: 2025-2026
|
||||
|---|---|---|---|---|---|---|
| Incidents | % | Rate per 1,000 Population | Total Incidents | % | Monthly Trend | |
| Bronx | 597 | 36% | 0.4 | 1,908 | 36% | |
| Brooklyn | 420 | 25% | 0.2 | 1,390 | 26% | |
| Manhattan | 232 | 14% | 0.1 | 783 | 15% | |
| Queens | 352 | 21% | 0.2 | 1,043 | 20% | |
| Staten Island | 57 | 3% | 0.1 | 199 | 4% | |
| Table Prepred by: Isaac H. Michaels, DrPH | ||||||
| Data Source: NYC Open Data | ||||||
Table Prepared by: Isaac H. Michaels, DrPH
EMS Data Source: NYC Open Data
Population Data Source: Health Data NY
| FDNY EMS Incident Volume, by Severity Level: Major Obstetrical Complaint |
||||
| January 01, 2025 to July 01, 2026 | ||||
| Final Severity Level |
Latest Year: 2026
|
All Years: 2025-2026
|
||
|---|---|---|---|---|
| Incidents | % | Incidents | % | |
| 1 | 0 | 0% | 0 | 0% |
| 2 | 0 | 0% | 1 | 0% |
| 3 | 5 | 0% | 10 | 0% |
| 4 | 1,653 | 100% | 5,312 | 100% |
| 5 | 0 | 0% | 0 | 0% |
| 6 | 0 | 0% | 0 | 0% |
| 7 | 0 | 0% | 0 | 0% |
| 8 | 0 | 0% | 0 | 0% |
| Table Prepred by: Isaac H. Michaels, DrPH | ||||
| Data Source: NYC Open Data | ||||
Table Prepared by: Isaac H. Michaels, DrPH
Data Source: NYC Open Data
| FDNY EMS Incident Volume, by Disposition: Major Obstetrical Complaint |
||||
| January 01, 2025 to July 01, 2026 | ||||
| Disposition |
Latest Year: 2026
|
All Years: 2025-2026
|
||
|---|---|---|---|---|
| Incidents | % | Incidents | % | |
| Cancelled | 23 | 1% | 50 | 1% |
| Condition Corrected | 3 | 0% | 9 | 0% |
| Patient Gone on Arrival | 55 | 3% | 162 | 3% |
| Refused Medical Aid | 118 | 7% | 448 | 8% |
| Transporting Patient | 1,412 | 85% | 4,516 | 85% |
| Treated and Transported | 2 | 0% | 6 | 0% |
| Triaged at Scene No Transport | 1 | 0% | 1 | 0% |
| Unfounded | 38 | 2% | 114 | 2% |
| NA | 6 | 0% | 17 | 0% |
| Table Prepred by: Isaac H. Michaels, DrPH | ||||
| Data Source: NYC Open Data | ||||
Table Prepared by: Isaac H. Michaels, DrPH
Data Source: NYC Open Data
Back to top
Stroke
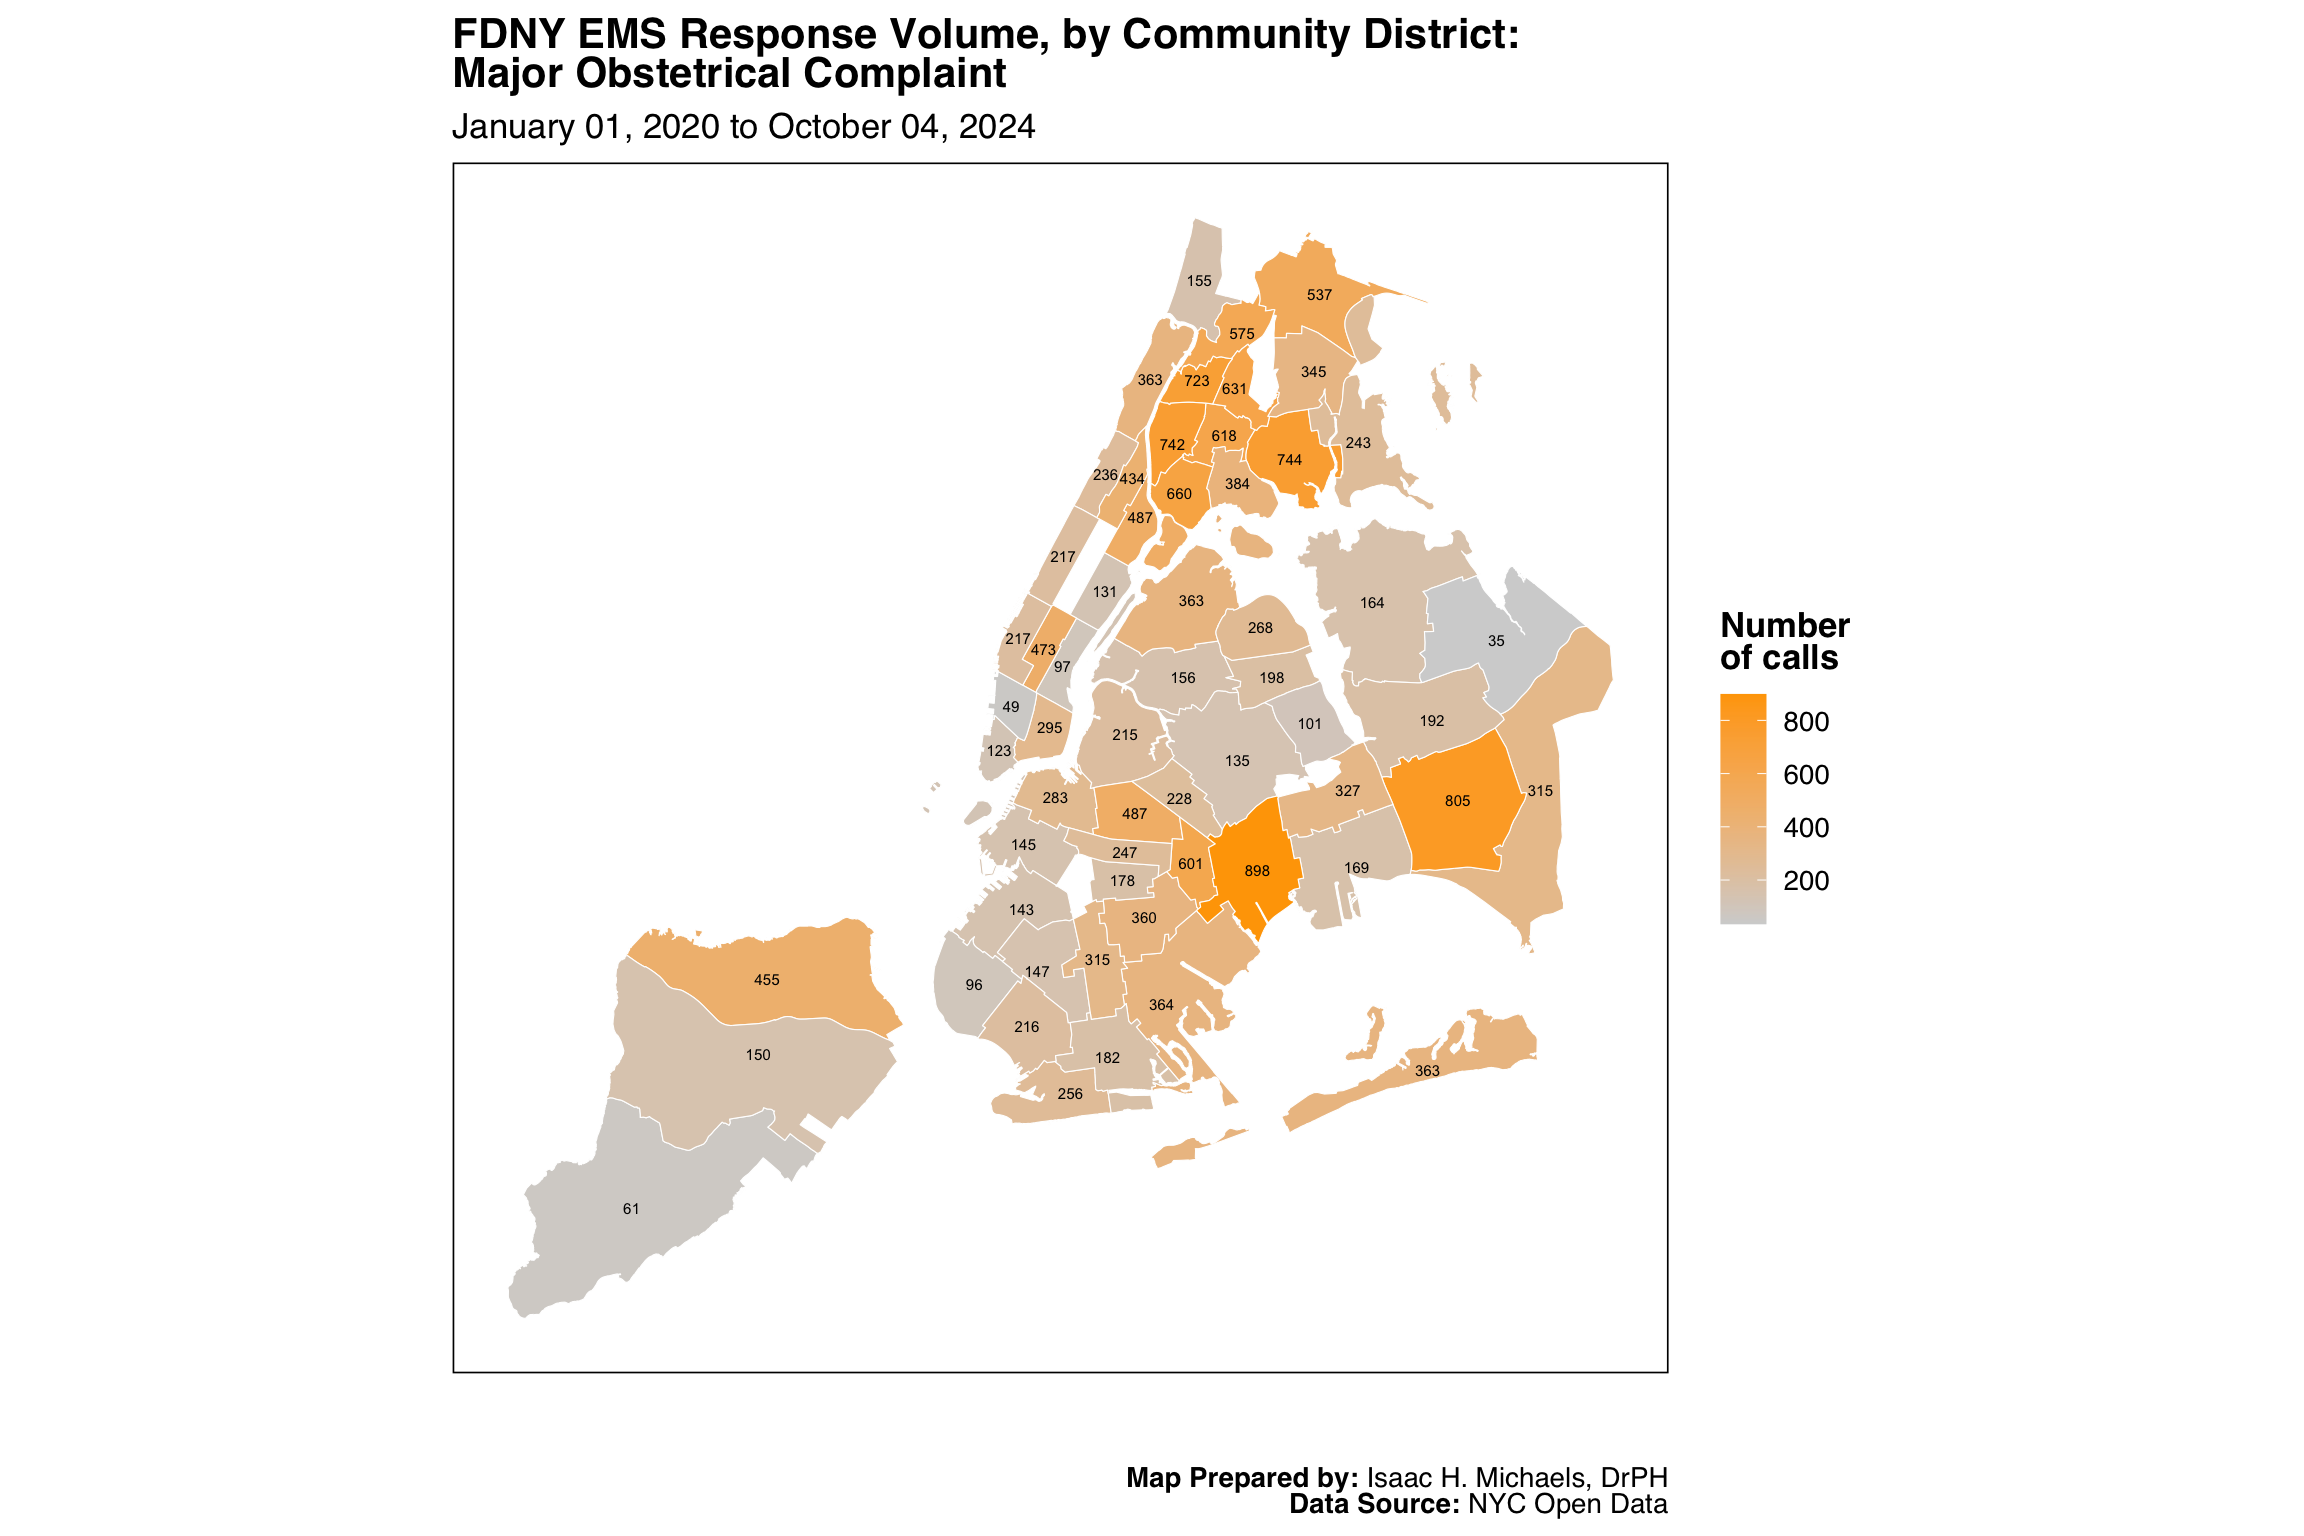
Map Prepared by: Isaac H. Michaels, DrPH
Data Source: NYC Open Data
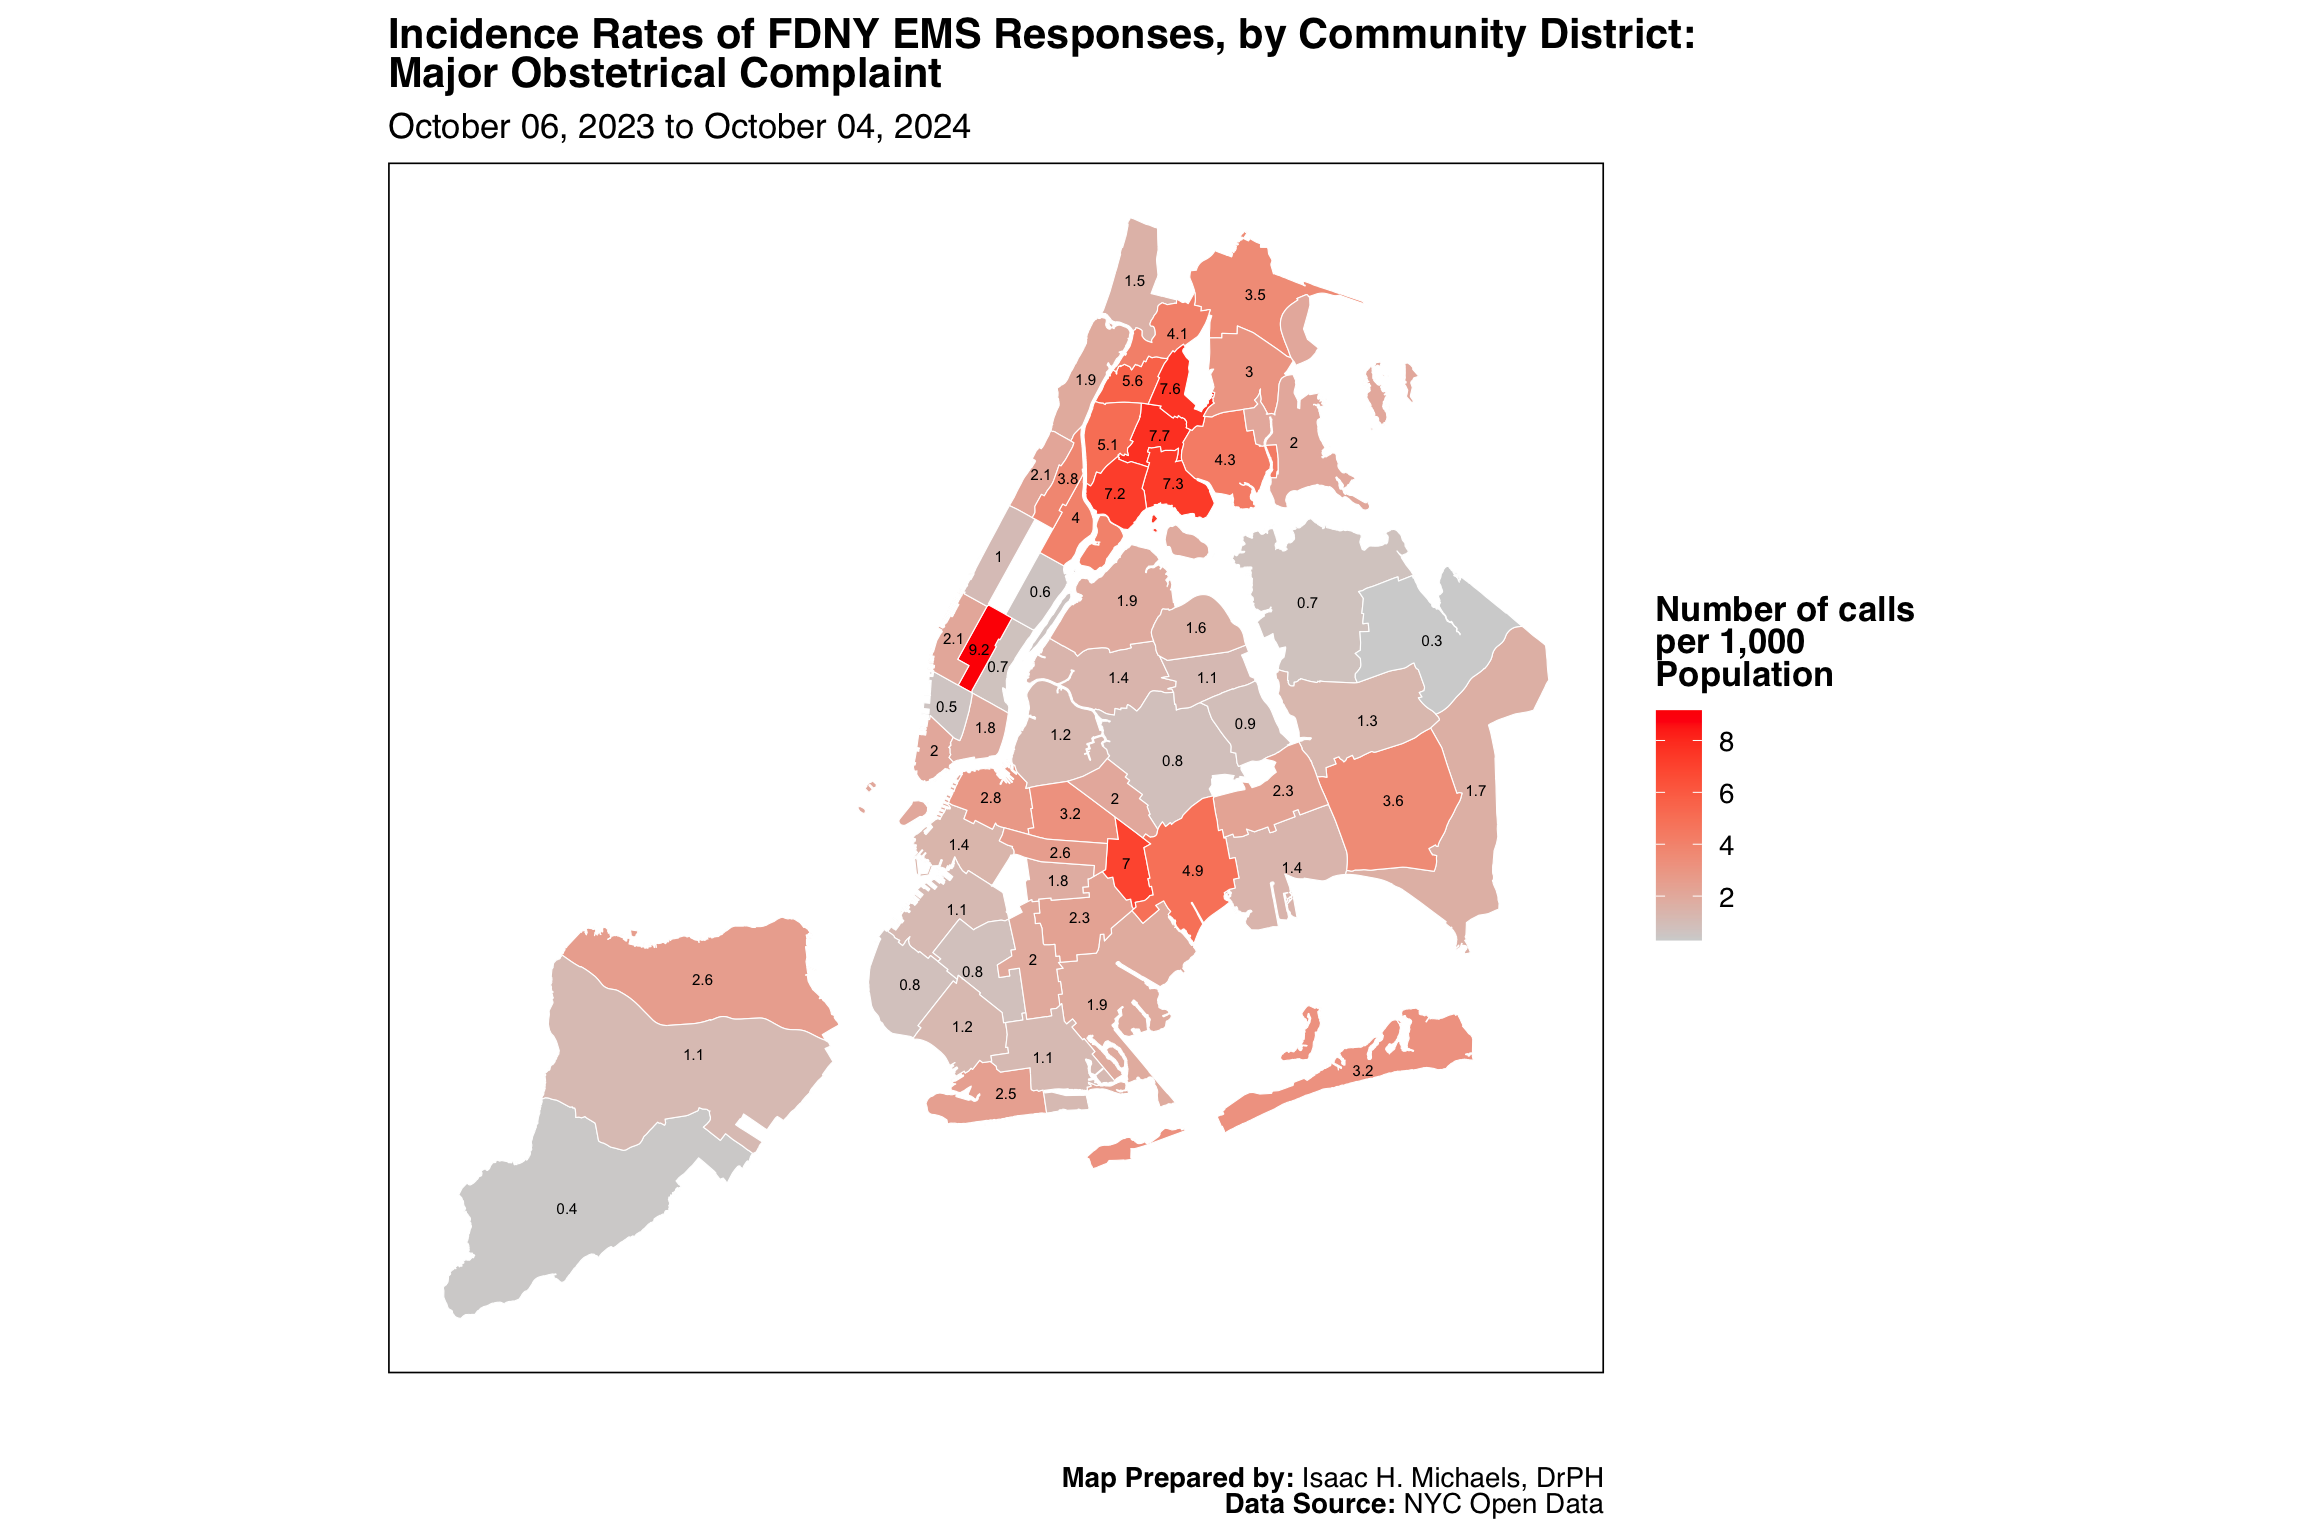
Map Prepared by: Isaac H. Michaels, DrPH
EMS Data Source: NYC Open Data
Population Data Source: NYC Open Data
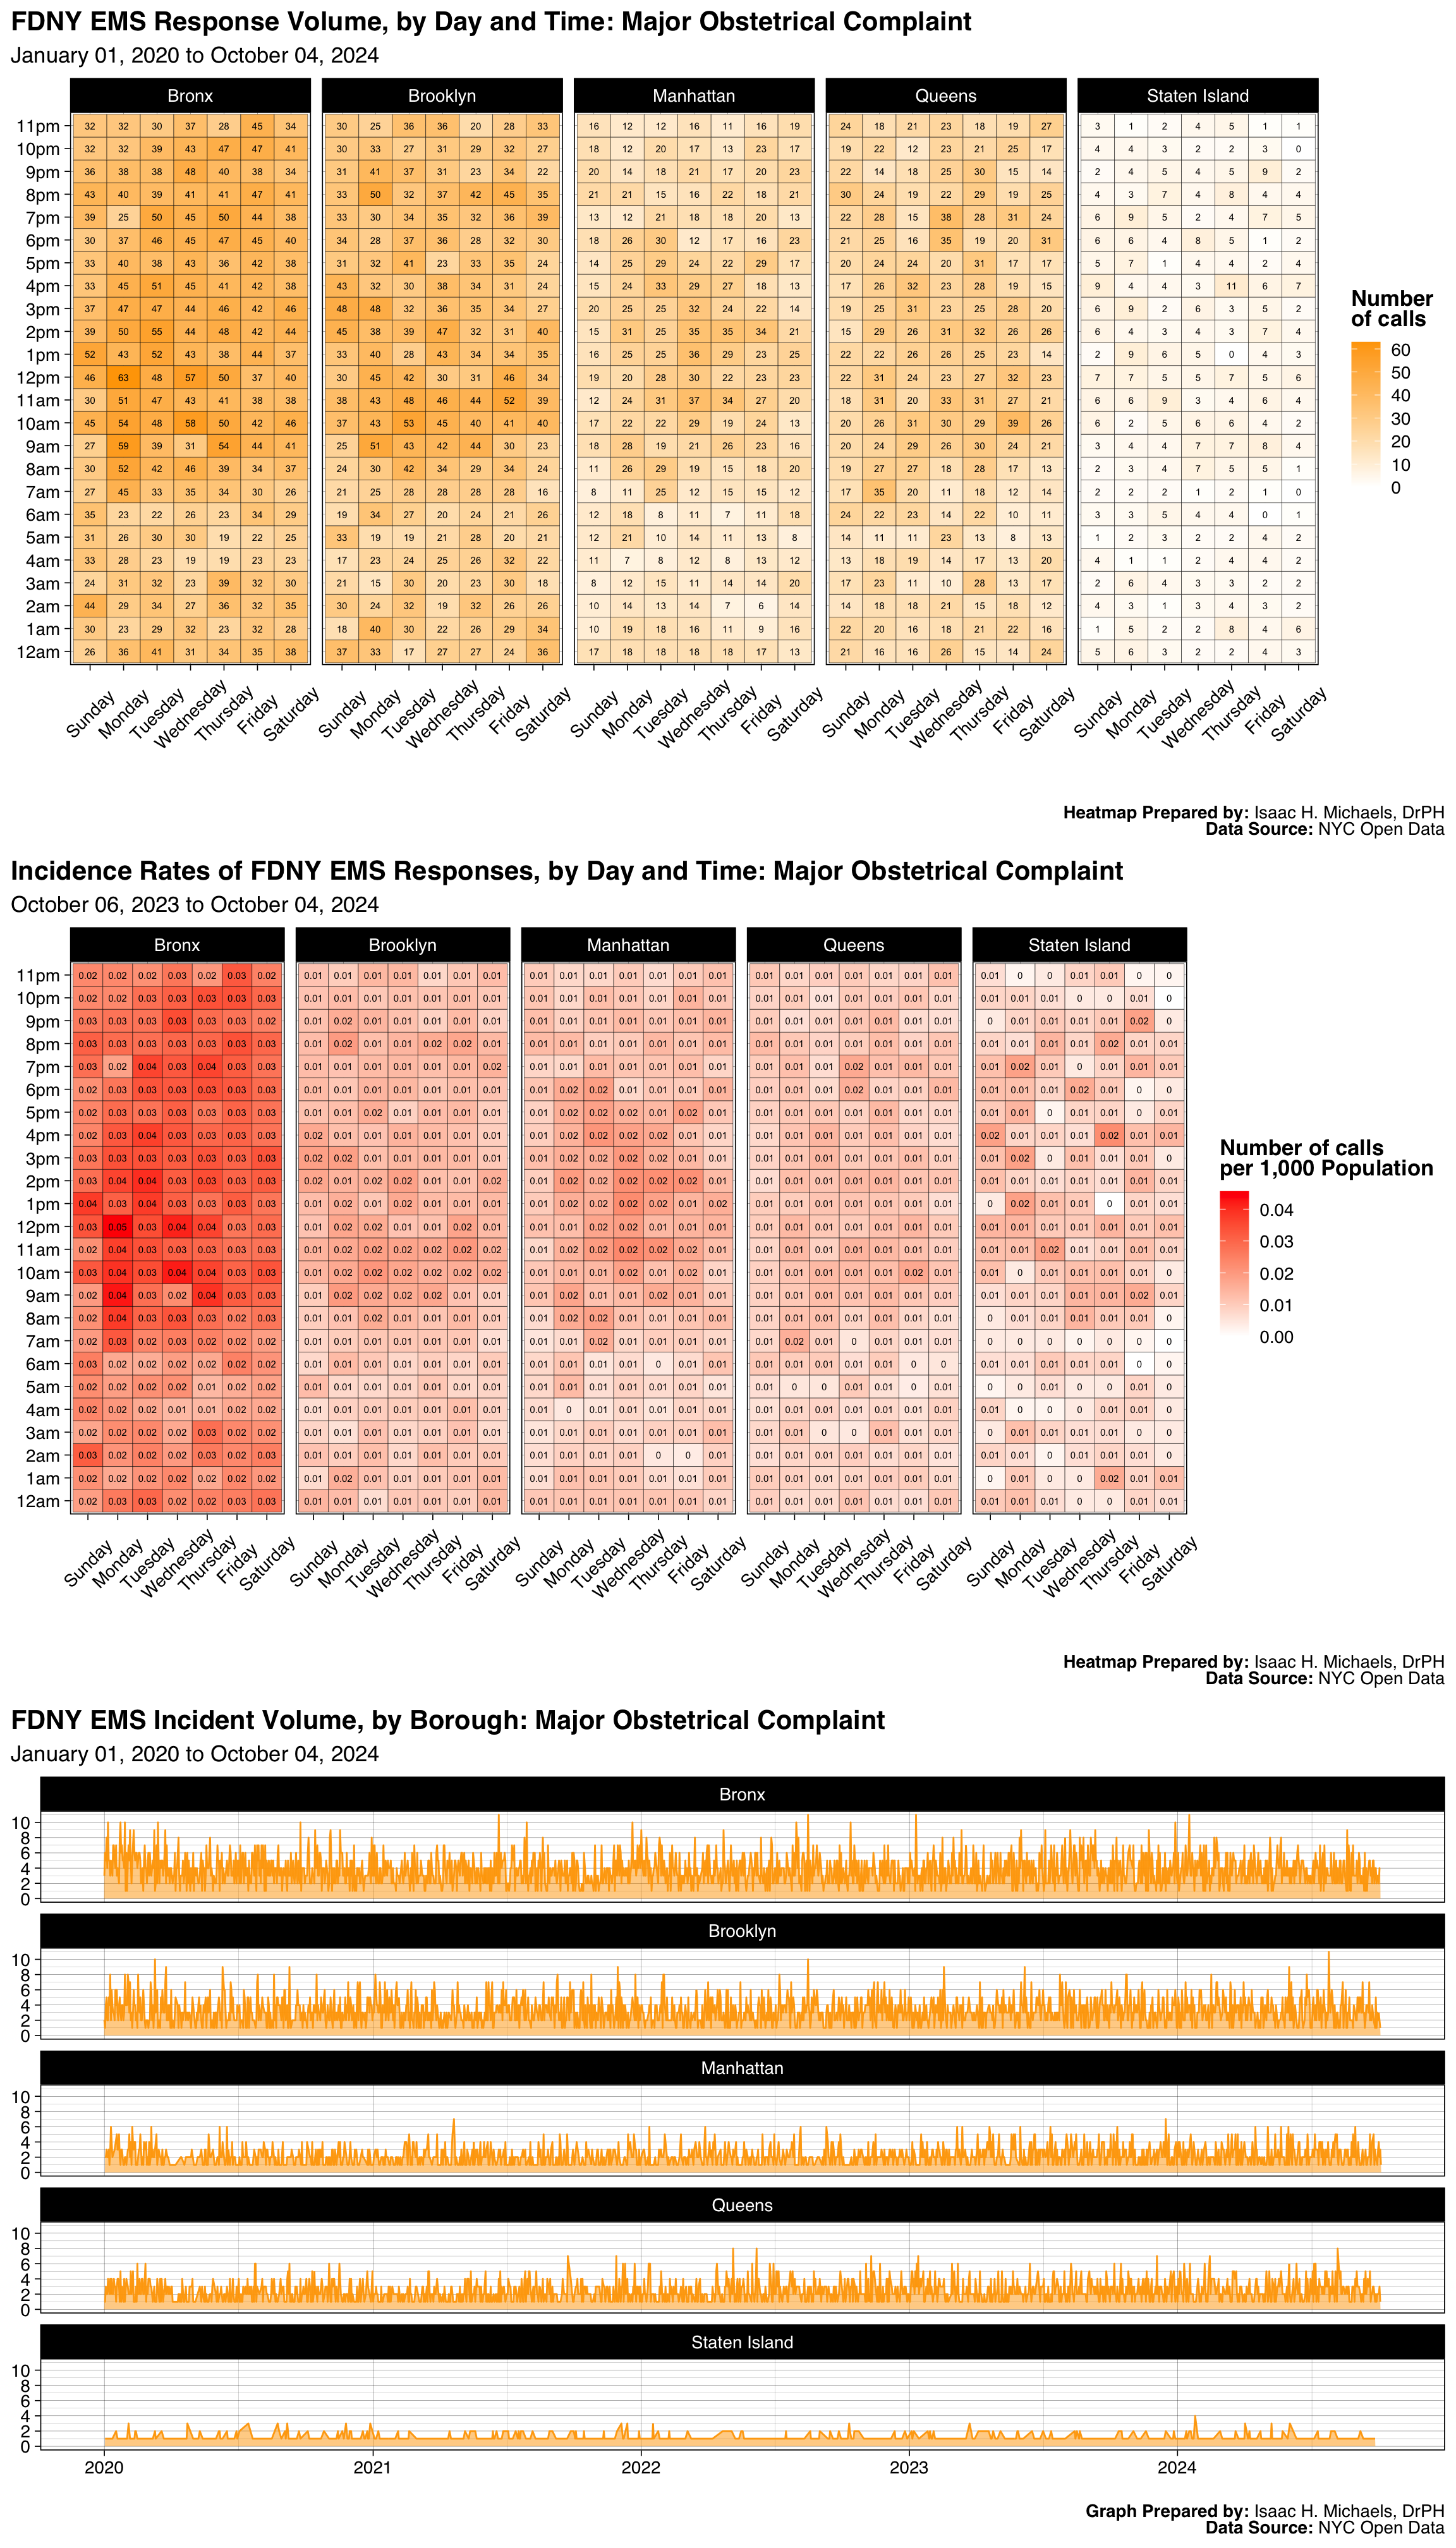
Graphs Prepared by: Isaac H. Michaels, DrPH
Data Source: NYC Open Data
| FDNY EMS Incident Volume, by Borough: Stroke |
||||||
| January 01, 2025 to July 01, 2026 | ||||||
| Borough |
Latest Year: 2026
|
All Years: 2025-2026
|
||||
|---|---|---|---|---|---|---|
| Incidents | % | Rate per 1,000 Population | Total Incidents | % | Monthly Trend | |
| Bronx | 325 | 21% | 0.2 | 1,018 | 21% | |
| Brooklyn | 521 | 33% | 0.2 | 1,615 | 34% | |
| Manhattan | 260 | 17% | 0.2 | 828 | 17% | |
| Queens | 356 | 23% | 0.2 | 1,004 | 21% | |
| Staten Island | 100 | 6% | 0.2 | 276 | 6% | |
| Table Prepred by: Isaac H. Michaels, DrPH | ||||||
| Data Source: NYC Open Data | ||||||
Table Prepared by: Isaac H. Michaels, DrPH
EMS Data Source: NYC Open Data
Population Data Source: Health Data NY
| FDNY EMS Incident Volume, by Severity Level: Stroke |
||||
| January 01, 2025 to July 01, 2026 | ||||
| Final Severity Level |
Latest Year: 2026
|
All Years: 2025-2026
|
||
|---|---|---|---|---|
| Incidents | % | Incidents | % | |
| 1 | 0 | 0% | 0 | 0% |
| 2 | 2 | 0% | 5 | 0% |
| 3 | 2 | 0% | 4 | 0% |
| 4 | 1,558 | 100% | 4,732 | 100% |
| 5 | 0 | 0% | 0 | 0% |
| 6 | 0 | 0% | 0 | 0% |
| 7 | 0 | 0% | 0 | 0% |
| 8 | 0 | 0% | 0 | 0% |
| Table Prepred by: Isaac H. Michaels, DrPH | ||||
| Data Source: NYC Open Data | ||||
Table Prepared by: Isaac H. Michaels, DrPH
Data Source: NYC Open Data
| FDNY EMS Incident Volume, by Disposition: Stroke |
||||
| January 01, 2025 to July 01, 2026 | ||||
| Disposition |
Latest Year: 2026
|
All Years: 2025-2026
|
||
|---|---|---|---|---|
| Incidents | % | Incidents | % | |
| Cancelled | 11 | 1% | 31 | 1% |
| Condition Corrected | 4 | 0% | 12 | 0% |
| Patient Gone on Arrival | 37 | 2% | 88 | 2% |
| Patient Pronounced Dead | 1 | 0% | 2 | 0% |
| Refused Medical Aid | 137 | 9% | 428 | 9% |
| Transporting Patient | 1,318 | 84% | 4,005 | 84% |
| Treated and Transported | 3 | 0% | 9 | 0% |
| Unfounded | 43 | 3% | 142 | 3% |
| NA | 8 | 1% | 24 | 1% |
| Table Prepred by: Isaac H. Michaels, DrPH | ||||
| Data Source: NYC Open Data | ||||
Table Prepared by: Isaac H. Michaels, DrPH
Data Source: NYC Open Data
Back to top
Reaction To Medication

Map Prepared by: Isaac H. Michaels, DrPH
Data Source: NYC Open Data
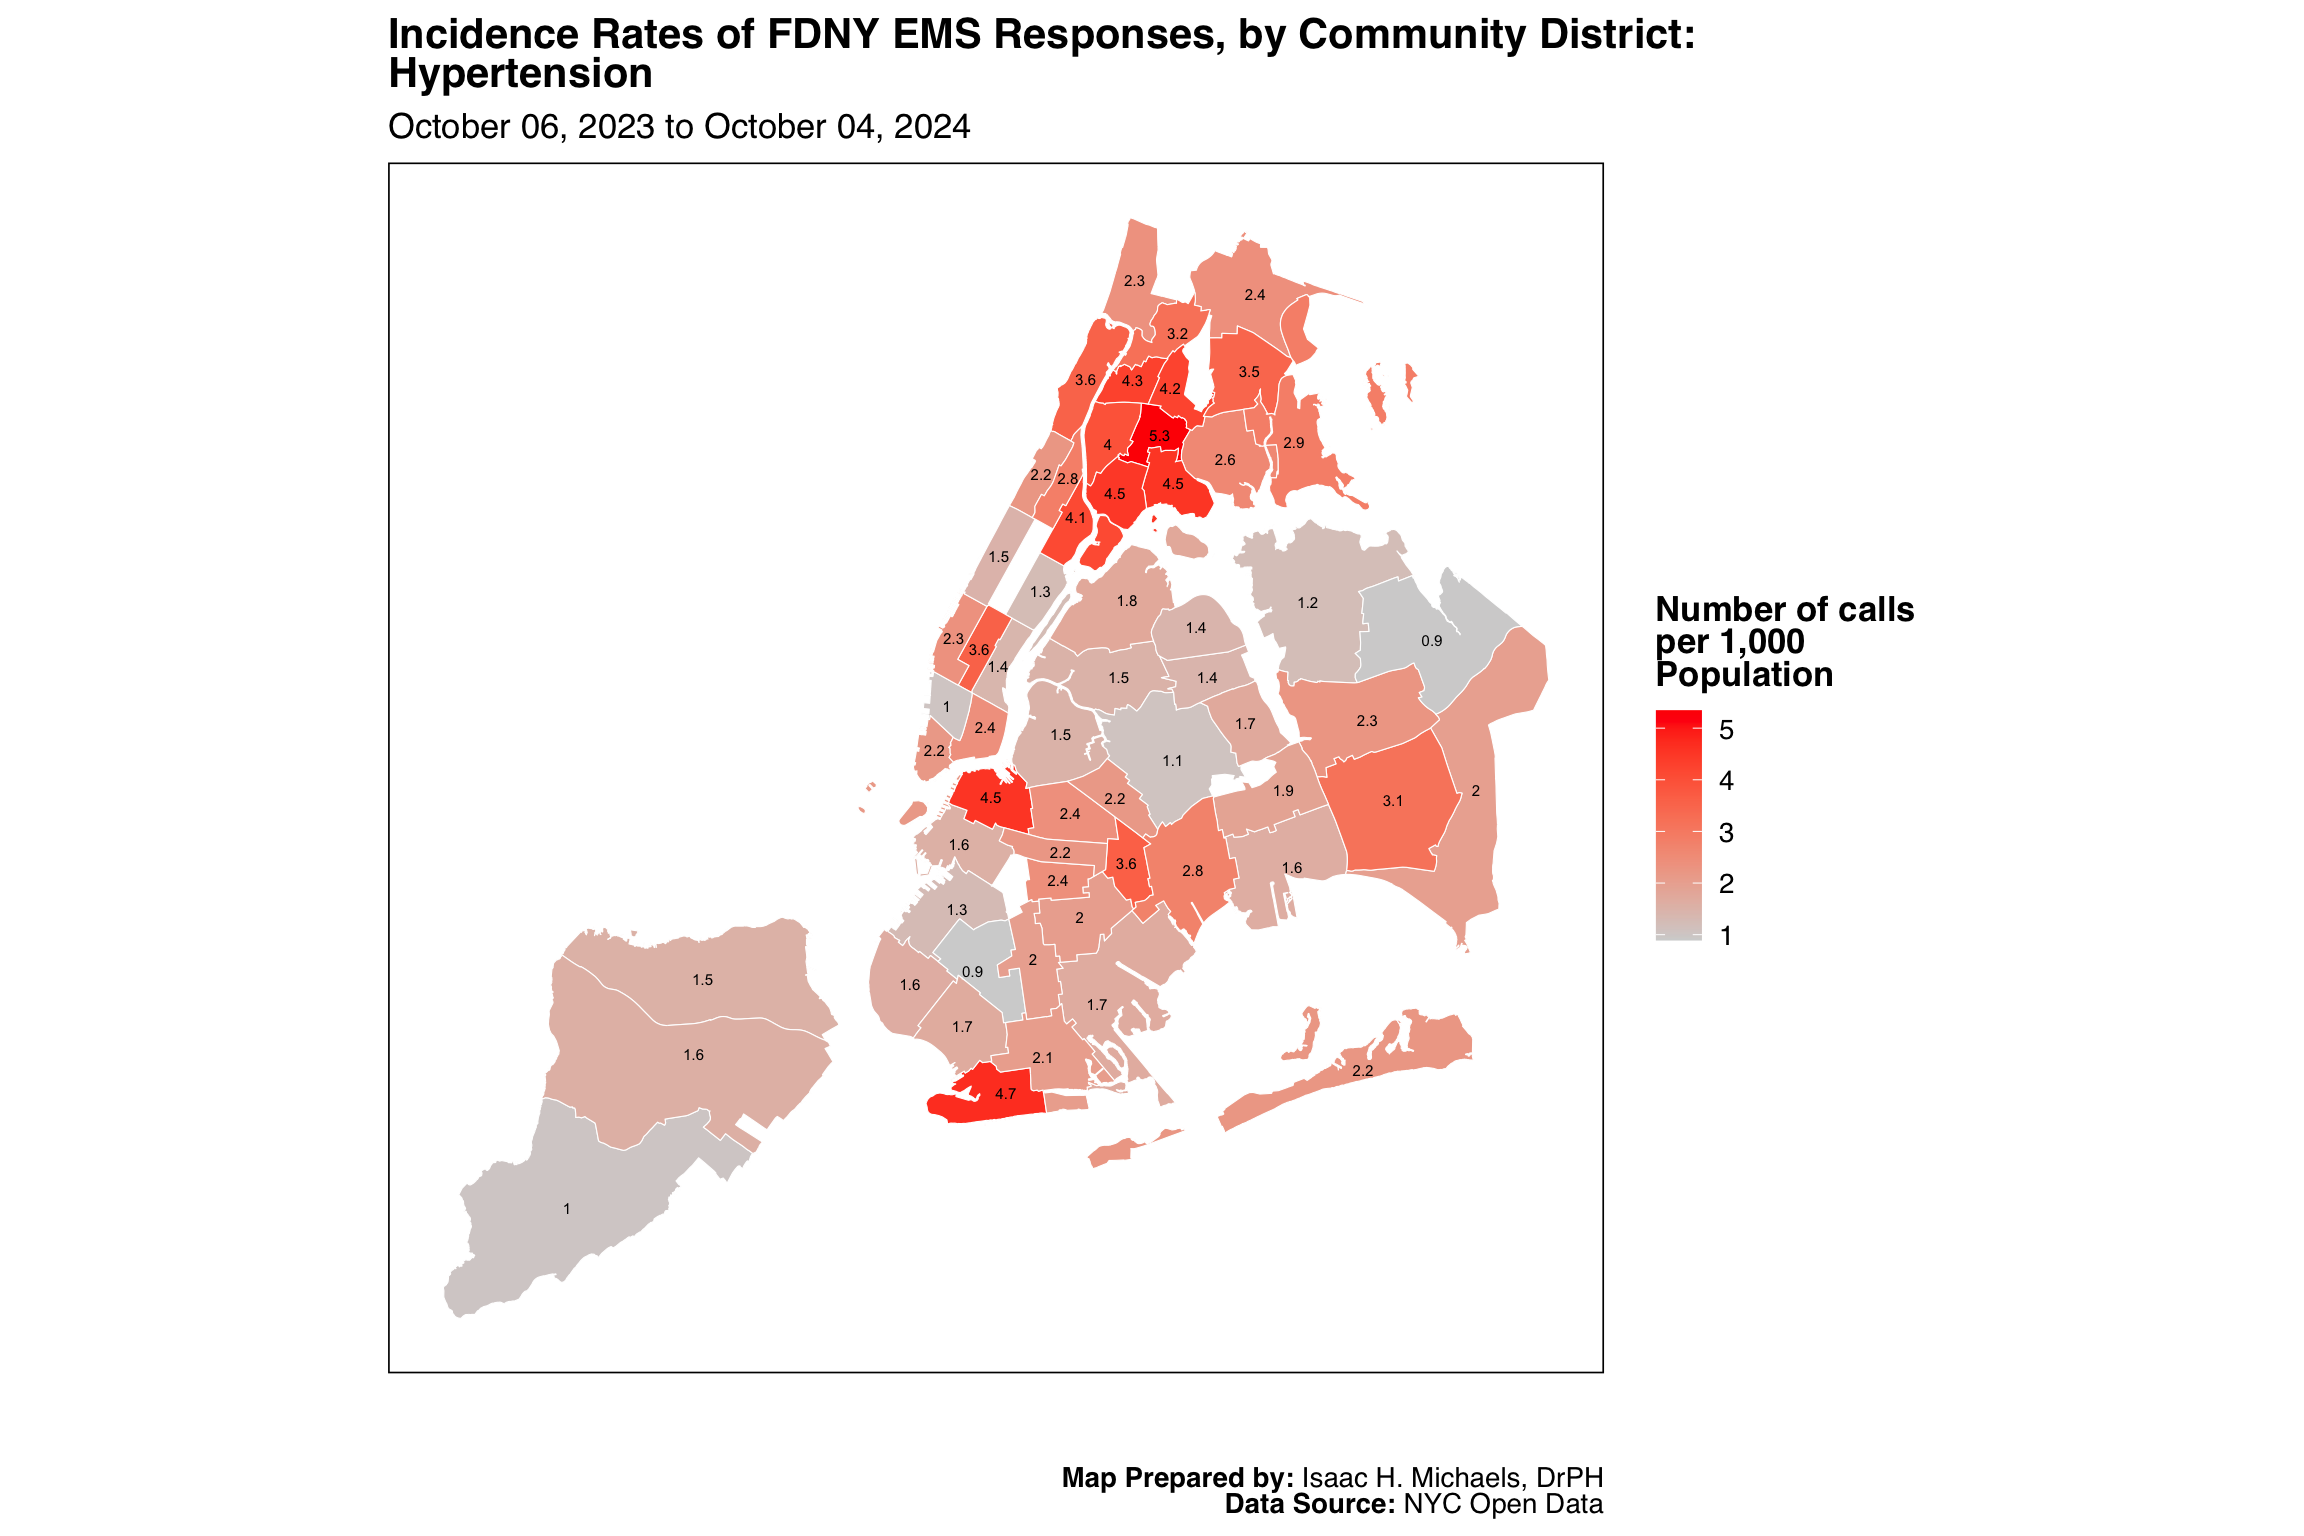
Map Prepared by: Isaac H. Michaels, DrPH
EMS Data Source: NYC Open Data
Population Data Source: NYC Open Data
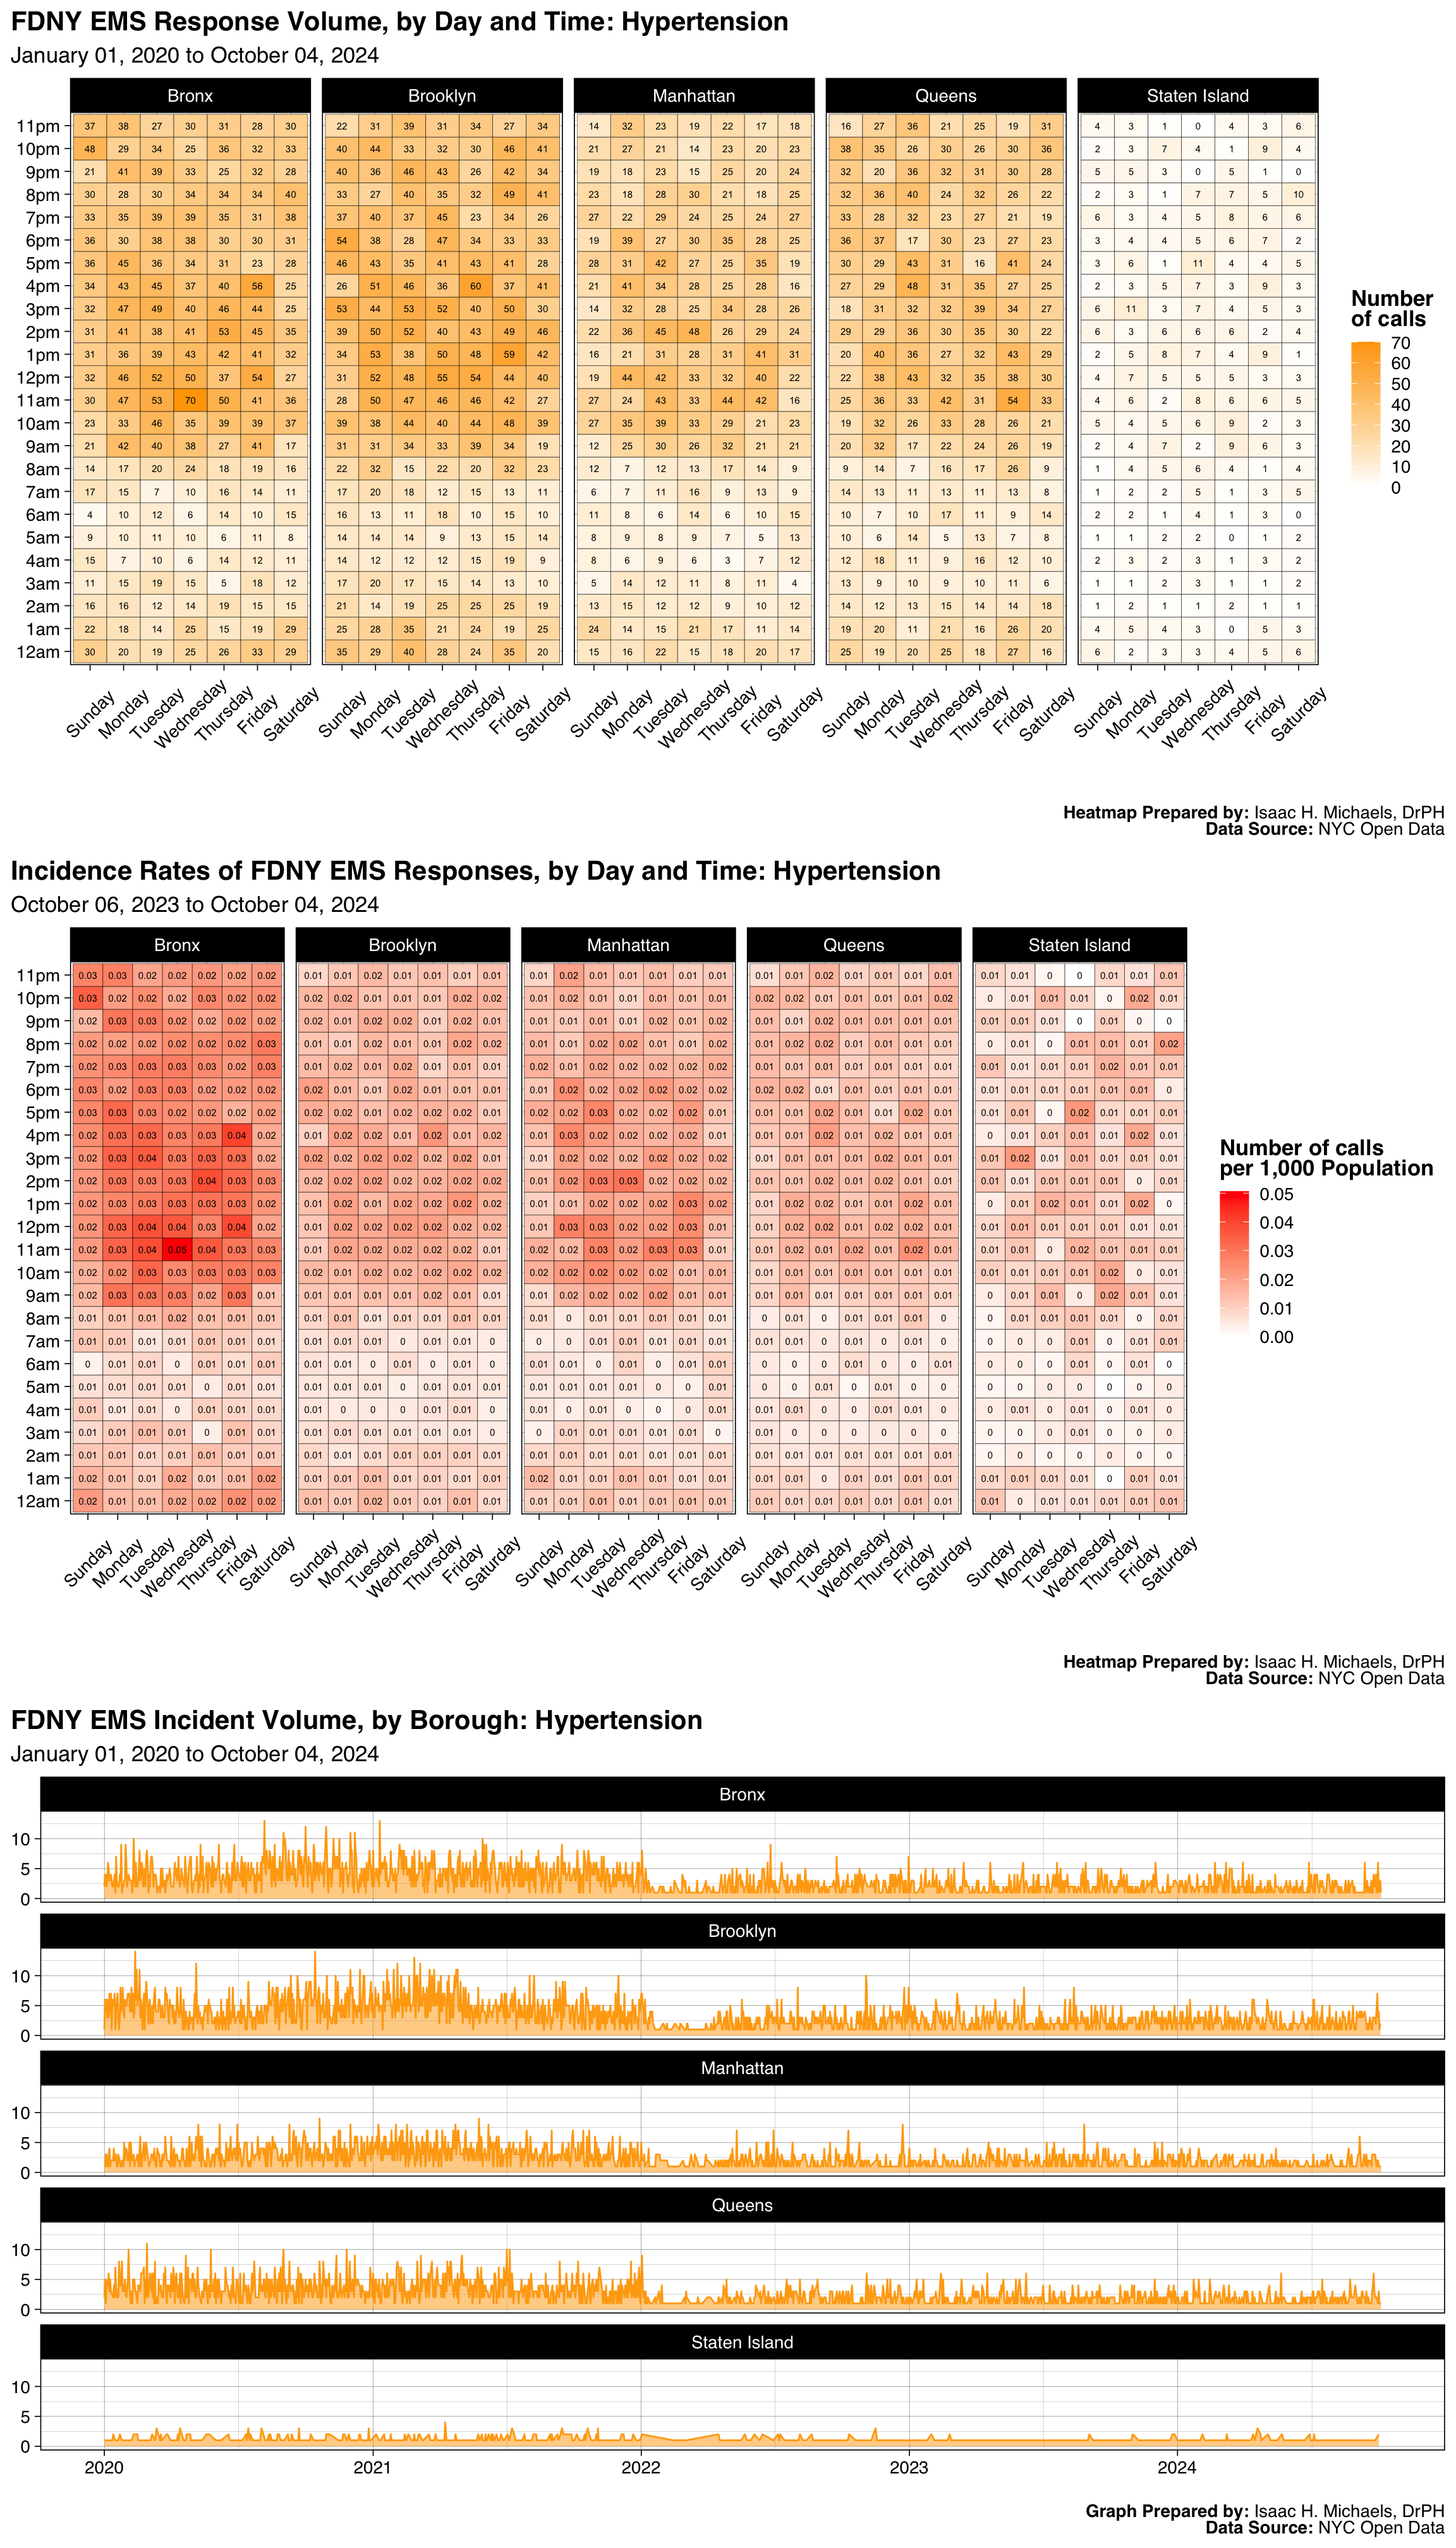
Graphs Prepared by: Isaac H. Michaels, DrPH
Data Source: NYC Open Data
| FDNY EMS Incident Volume, by Borough: Reaction To Medication |
||||||
| January 01, 2025 to July 01, 2026 | ||||||
| Borough |
Latest Year: 2026
|
All Years: 2025-2026
|
||||
|---|---|---|---|---|---|---|
| Incidents | % | Rate per 1,000 Population | Total Incidents | % | Monthly Trend | |
| Bronx | 257 | 25% | 0.2 | 841 | 25% | |
| Brooklyn | 288 | 28% | 0.1 | 963 | 28% | |
| Manhattan | 244 | 23% | 0.2 | 810 | 24% | |
| Queens | 212 | 20% | 0.1 | 662 | 19% | |
| Staten Island | 38 | 4% | 0.1 | 127 | 4% | |
| Table Prepred by: Isaac H. Michaels, DrPH | ||||||
| Data Source: NYC Open Data | ||||||
Table Prepared by: Isaac H. Michaels, DrPH
EMS Data Source: NYC Open Data
Population Data Source: Health Data NY
| FDNY EMS Incident Volume, by Severity Level: Reaction To Medication |
||||
| January 01, 2025 to July 01, 2026 | ||||
| Final Severity Level |
Latest Year: 2026
|
All Years: 2025-2026
|
||
|---|---|---|---|---|
| Incidents | % | Incidents | % | |
| 1 | 0 | 0% | 0 | 0% |
| 2 | 0 | 0% | 0 | 0% |
| 3 | 1 | 0% | 3 | 0% |
| 4 | 104 | 10% | 327 | 10% |
| 5 | 934 | 90% | 3,073 | 90% |
| 6 | 0 | 0% | 0 | 0% |
| 7 | 0 | 0% | 0 | 0% |
| 8 | 0 | 0% | 0 | 0% |
| Table Prepred by: Isaac H. Michaels, DrPH | ||||
| Data Source: NYC Open Data | ||||
Table Prepared by: Isaac H. Michaels, DrPH
Data Source: NYC Open Data
| FDNY EMS Incident Volume, by Disposition: Reaction To Medication |
||||
| January 01, 2025 to July 01, 2026 | ||||
| Disposition |
Latest Year: 2026
|
All Years: 2025-2026
|
||
|---|---|---|---|---|
| Incidents | % | Incidents | % | |
| Cancelled | 22 | 2% | 51 | 1% |
| Condition Corrected | 2 | 0% | 6 | 0% |
| Patient Gone on Arrival | 33 | 3% | 120 | 4% |
| Refused Medical Aid | 217 | 21% | 726 | 21% |
| Transporting Patient | 696 | 67% | 2,339 | 69% |
| Treated and Transported | 1 | 0% | 1 | 0% |
| Unfounded | 34 | 3% | 98 | 3% |
| NA | 34 | 3% | 62 | 2% |
| Table Prepred by: Isaac H. Michaels, DrPH | ||||
| Data Source: NYC Open Data | ||||
Table Prepared by: Isaac H. Michaels, DrPH
Data Source: NYC Open Data
Back to top
Gun Shot Wound

Map Prepared by: Isaac H. Michaels, DrPH
Data Source: NYC Open Data
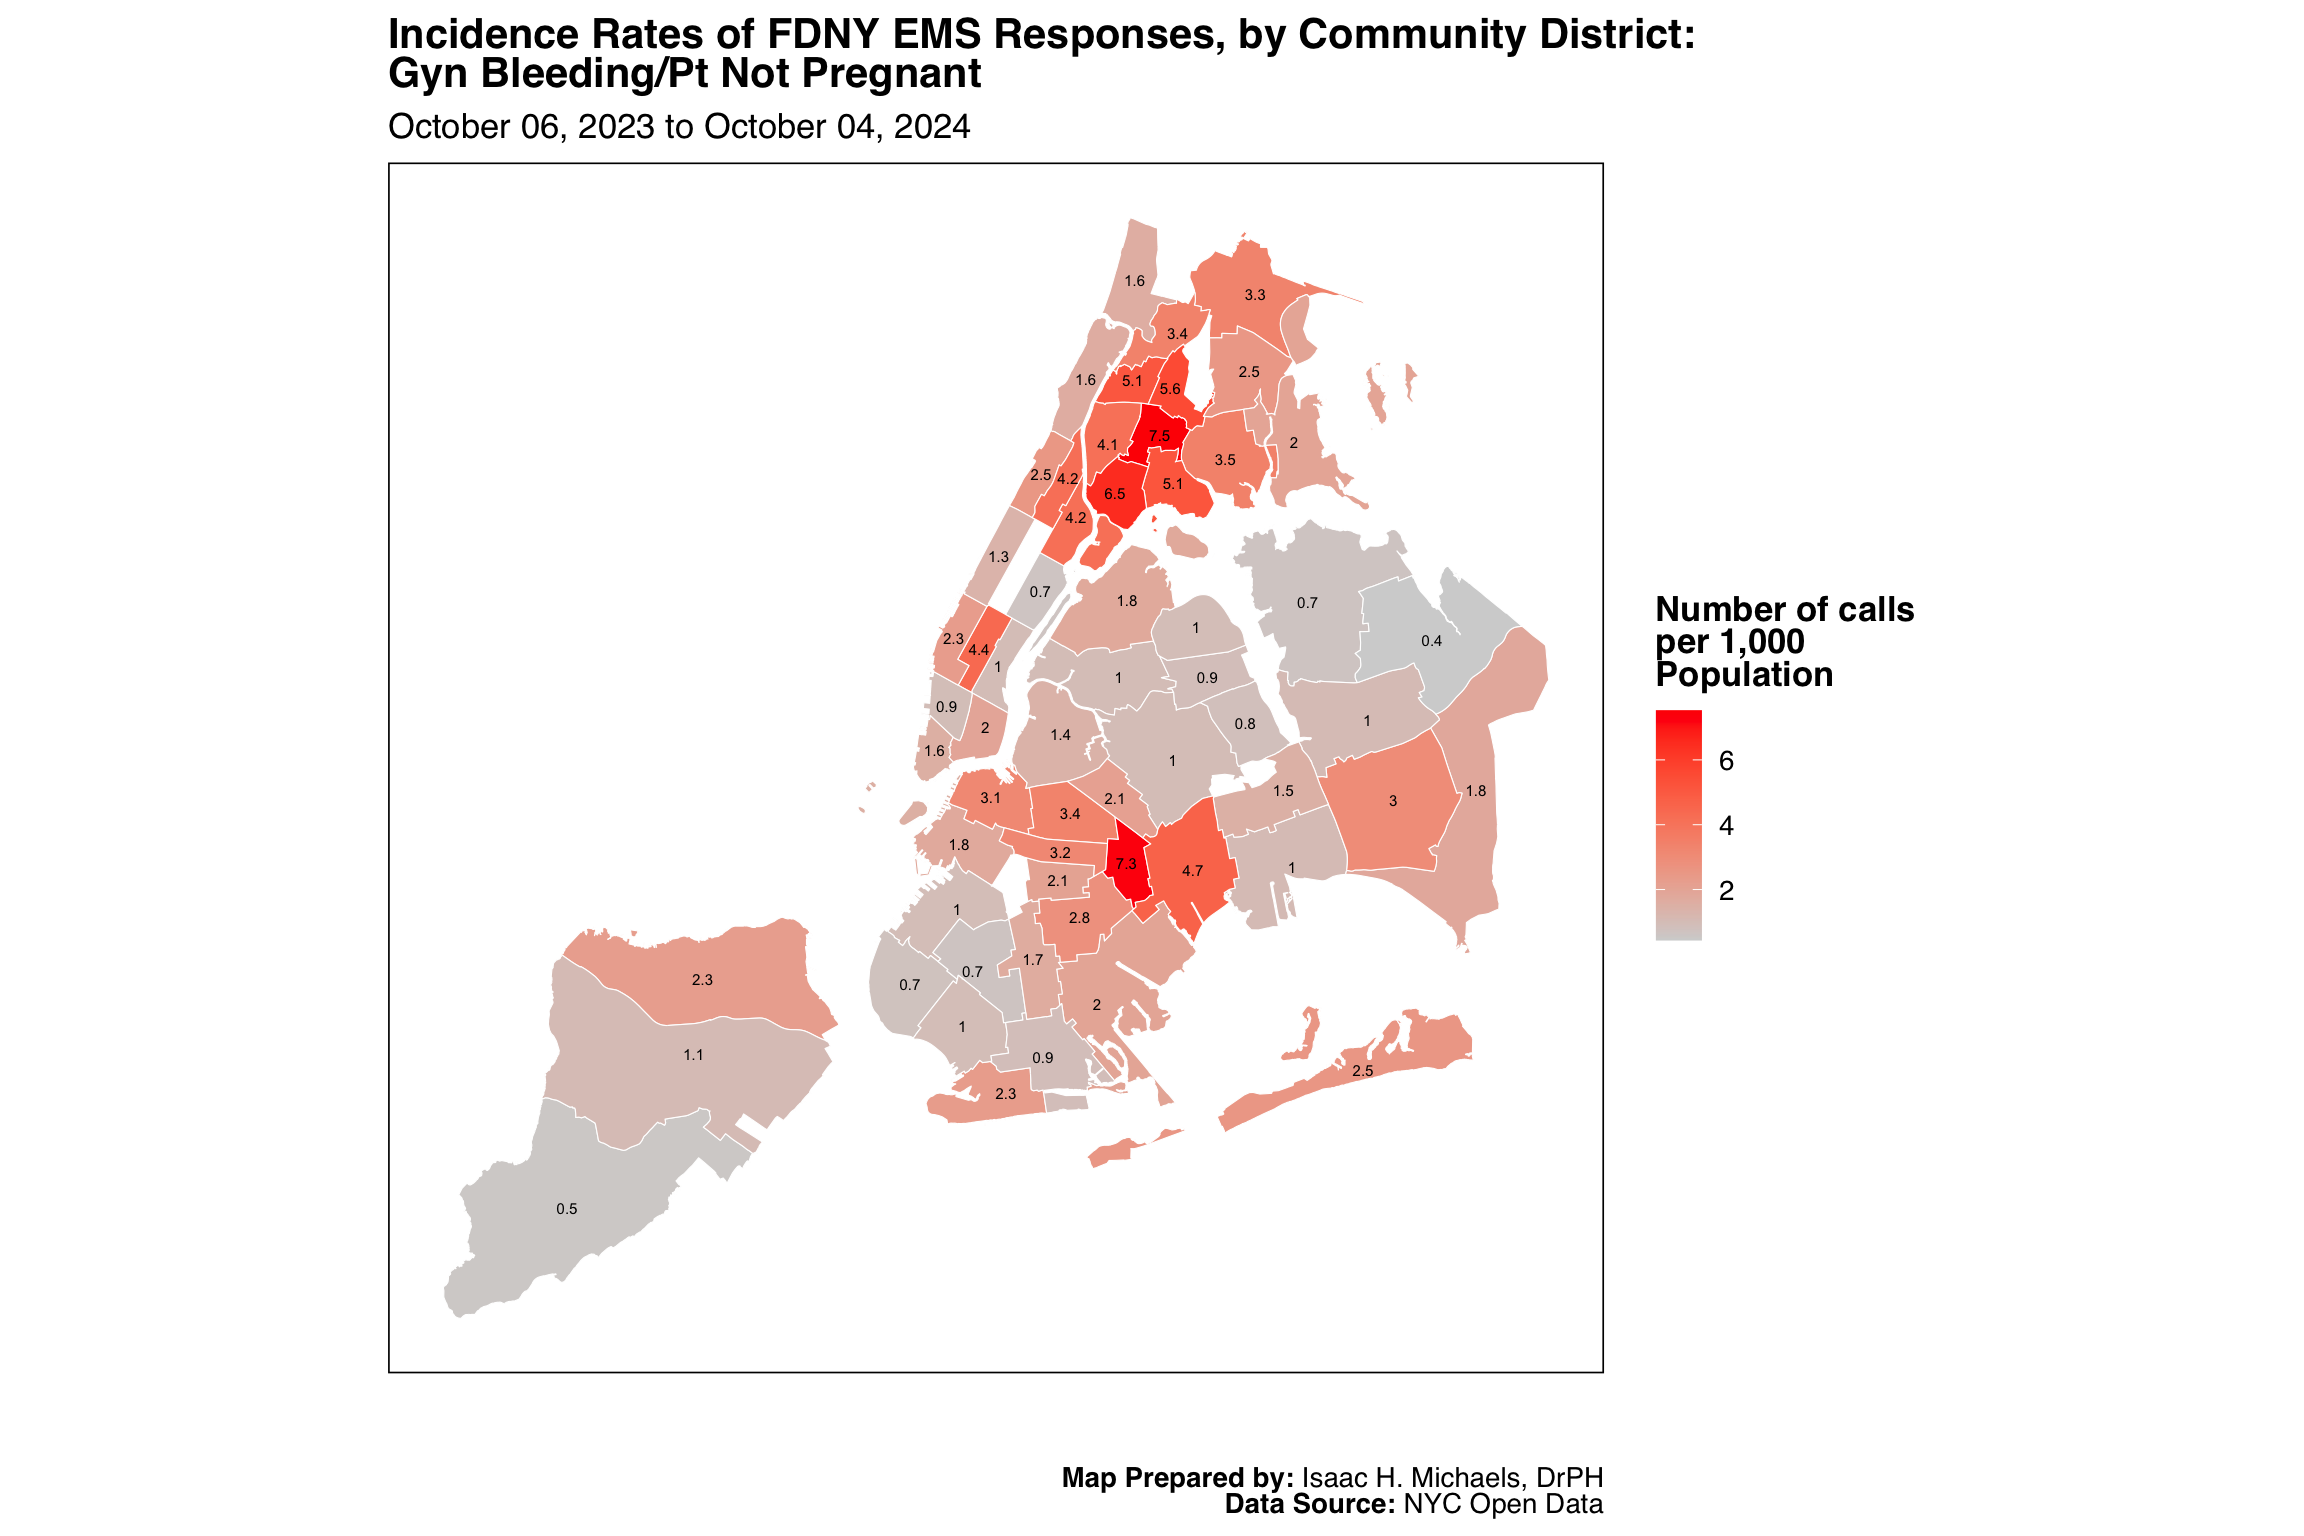
Map Prepared by: Isaac H. Michaels, DrPH
EMS Data Source: NYC Open Data
Population Data Source: NYC Open Data
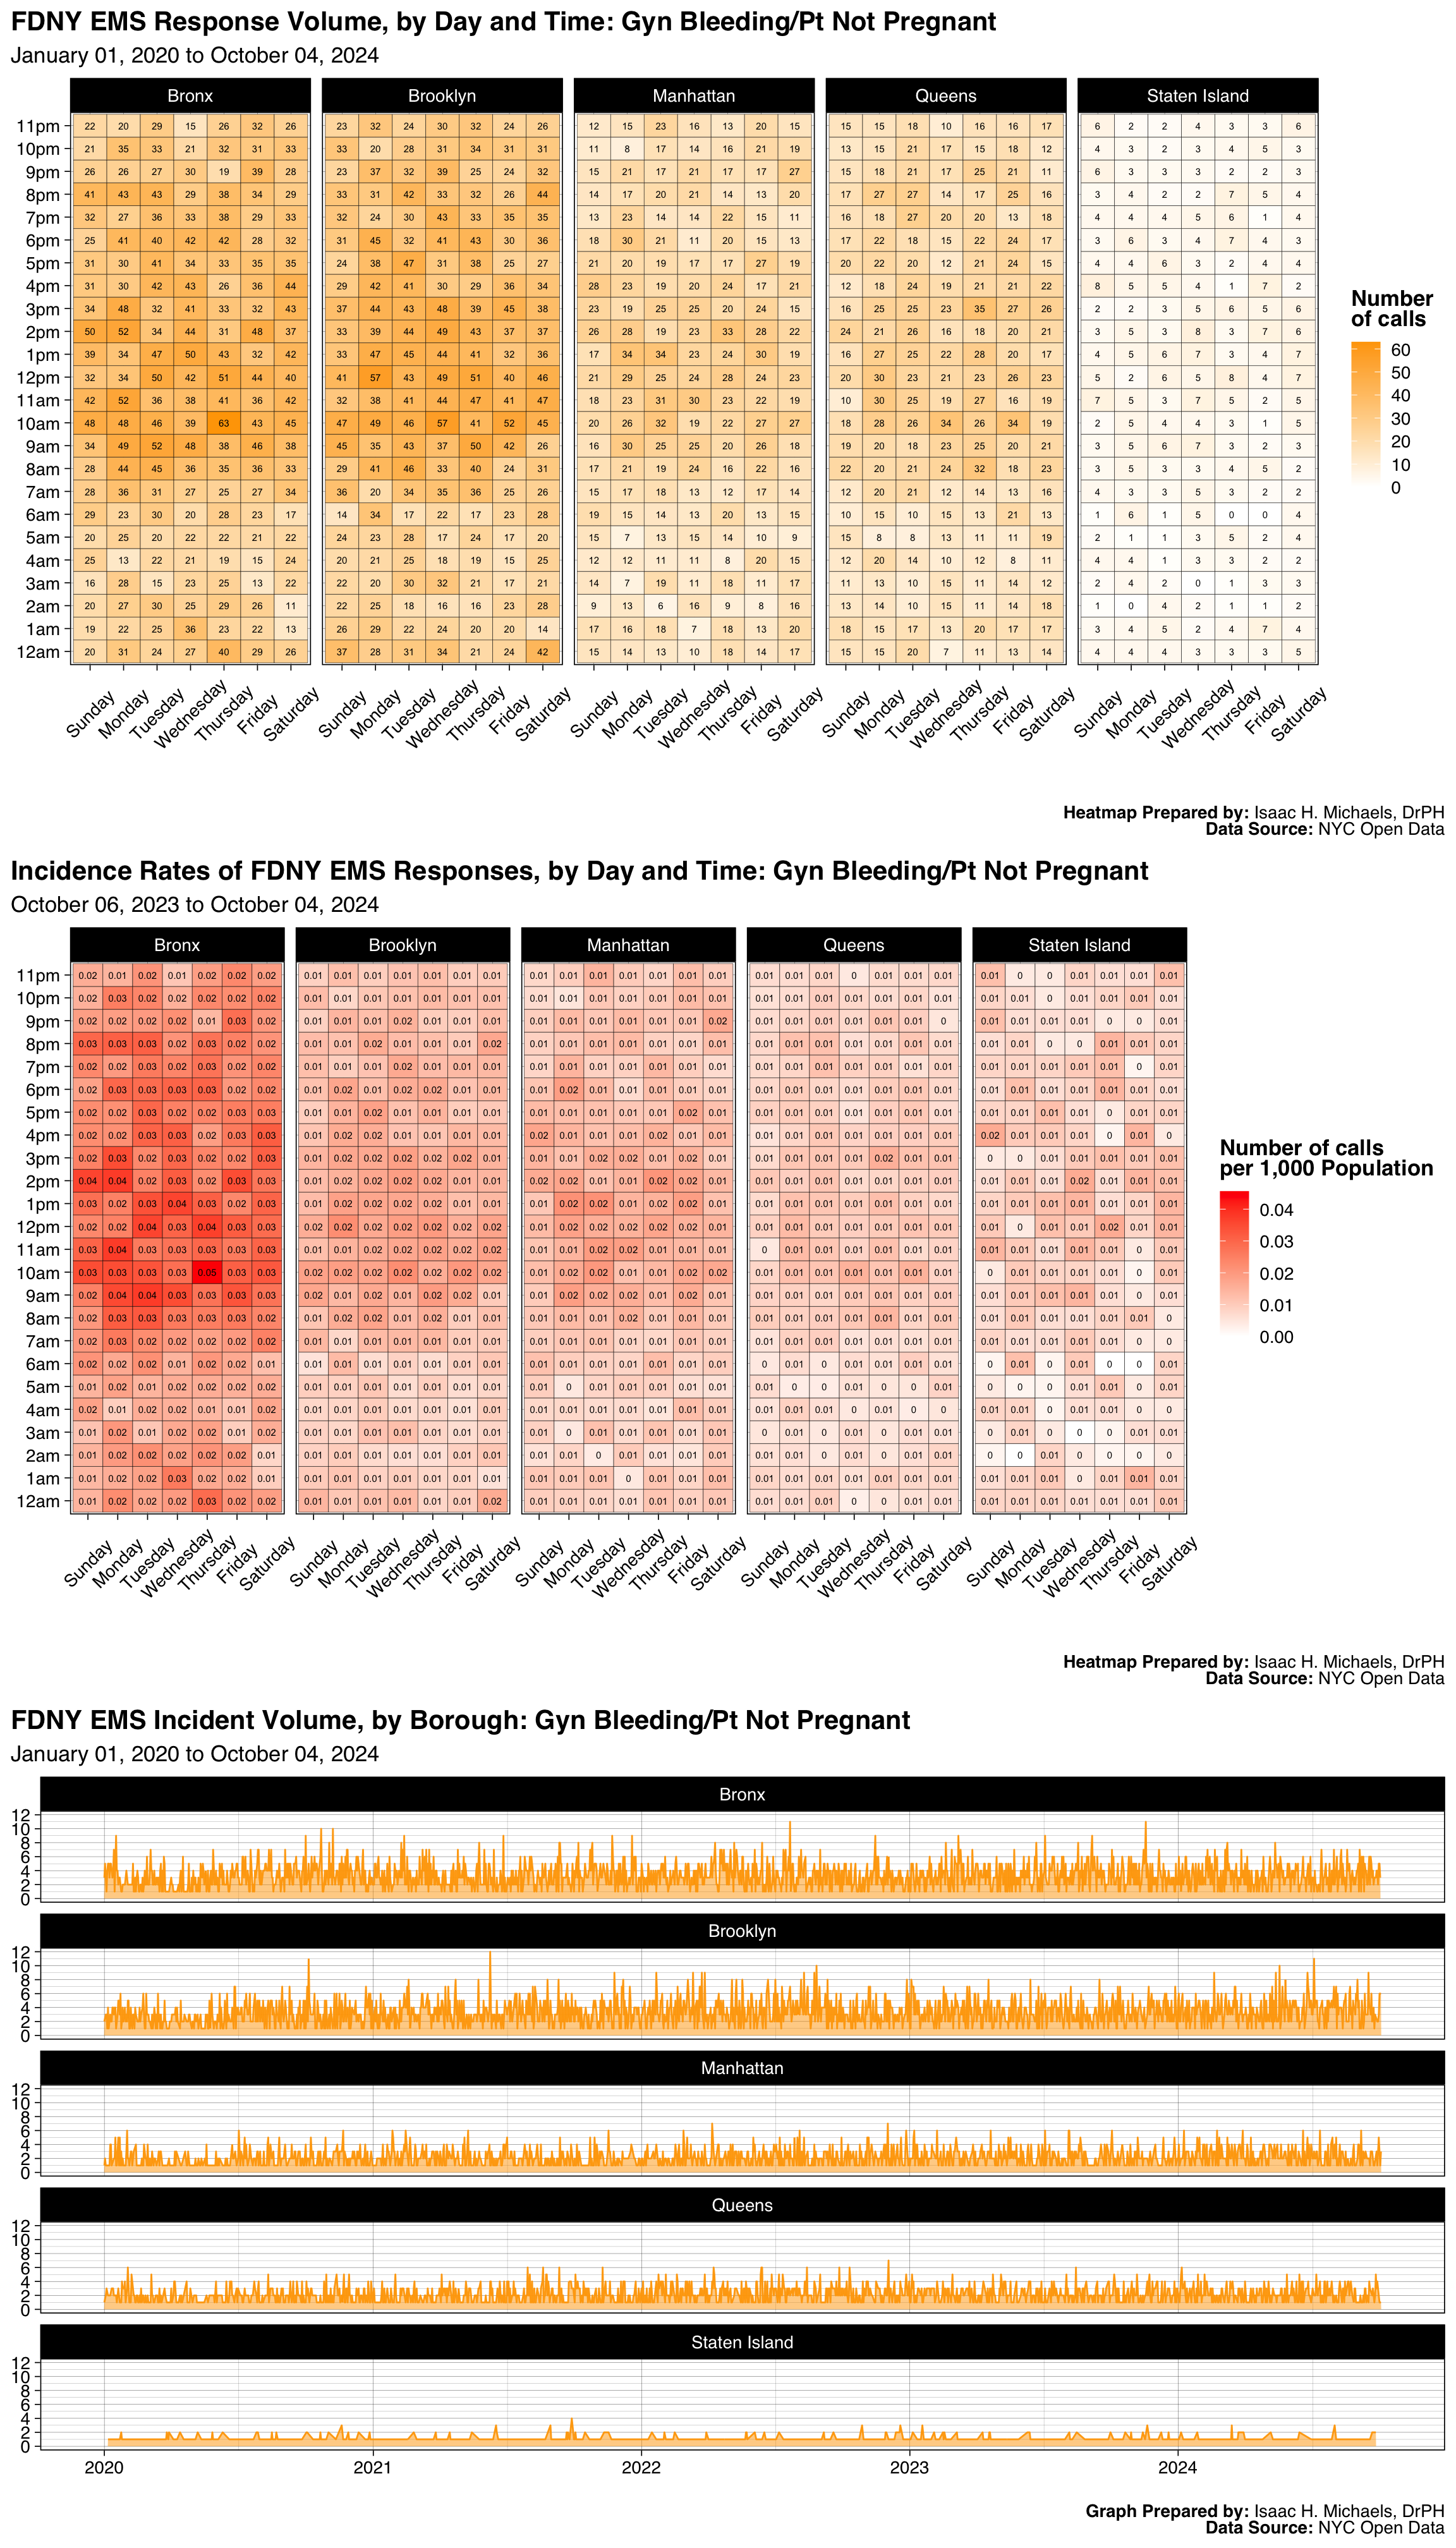
Graphs Prepared by: Isaac H. Michaels, DrPH
Data Source: NYC Open Data
| FDNY EMS Incident Volume, by Borough: Gun Shot Wound |
||||||
| January 01, 2025 to July 01, 2026 | ||||||
| Borough |
Latest Year: 2026
|
All Years: 2025-2026
|
||||
|---|---|---|---|---|---|---|
| Incidents | % | Rate per 1,000 Population | Total Incidents | % | Monthly Trend | |
| Bronx | 352 | 31% | 0.3 | 1,003 | 30% | |
| Brooklyn | 358 | 32% | 0.1 | 1,130 | 34% | |
| Manhattan | 215 | 19% | 0.1 | 649 | 19% | |
| Queens | 155 | 14% | 0.1 | 465 | 14% | |
| Staten Island | 47 | 4% | 0.1 | 121 | 4% | |
| Table Prepred by: Isaac H. Michaels, DrPH | ||||||
| Data Source: NYC Open Data | ||||||
Table Prepared by: Isaac H. Michaels, DrPH
EMS Data Source: NYC Open Data
Population Data Source: Health Data NY
| FDNY EMS Incident Volume, by Severity Level: Gun Shot Wound |
||||
| January 01, 2025 to July 01, 2026 | ||||
| Final Severity Level |
Latest Year: 2026
|
All Years: 2025-2026
|
||
|---|---|---|---|---|
| Incidents | % | Incidents | % | |
| 1 | 0 | 0% | 0 | 0% |
| 2 | 0 | 0% | 1 | 0% |
| 3 | 1,126 | 100% | 3,366 | 100% |
| 4 | 0 | 0% | 0 | 0% |
| 5 | 0 | 0% | 0 | 0% |
| 6 | 0 | 0% | 0 | 0% |
| 7 | 1 | 0% | 1 | 0% |
| 8 | 0 | 0% | 0 | 0% |
| Table Prepred by: Isaac H. Michaels, DrPH | ||||
| Data Source: NYC Open Data | ||||
Table Prepared by: Isaac H. Michaels, DrPH
Data Source: NYC Open Data
| FDNY EMS Incident Volume, by Disposition: Gun Shot Wound |
||||
| January 01, 2025 to July 01, 2026 | ||||
| Disposition |
Latest Year: 2026
|
All Years: 2025-2026
|
||
|---|---|---|---|---|
| Incidents | % | Incidents | % | |
| Cancelled | 110 | 10% | 277 | 8% |
| Condition Corrected | 128 | 11% | 370 | 11% |
| Patient Gone on Arrival | 38 | 3% | 101 | 3% |
| Patient Pronounced Dead | 2 | 0% | 5 | 0% |
| Refused Medical Aid | 28 | 2% | 119 | 4% |
| Transporting Patient | 284 | 25% | 912 | 27% |
| Unfounded | 463 | 41% | 1,458 | 43% |
| NA | 74 | 7% | 126 | 4% |
| Table Prepred by: Isaac H. Michaels, DrPH | ||||
| Data Source: NYC Open Data | ||||
Table Prepared by: Isaac H. Michaels, DrPH
Data Source: NYC Open Data
Back to top
Choking
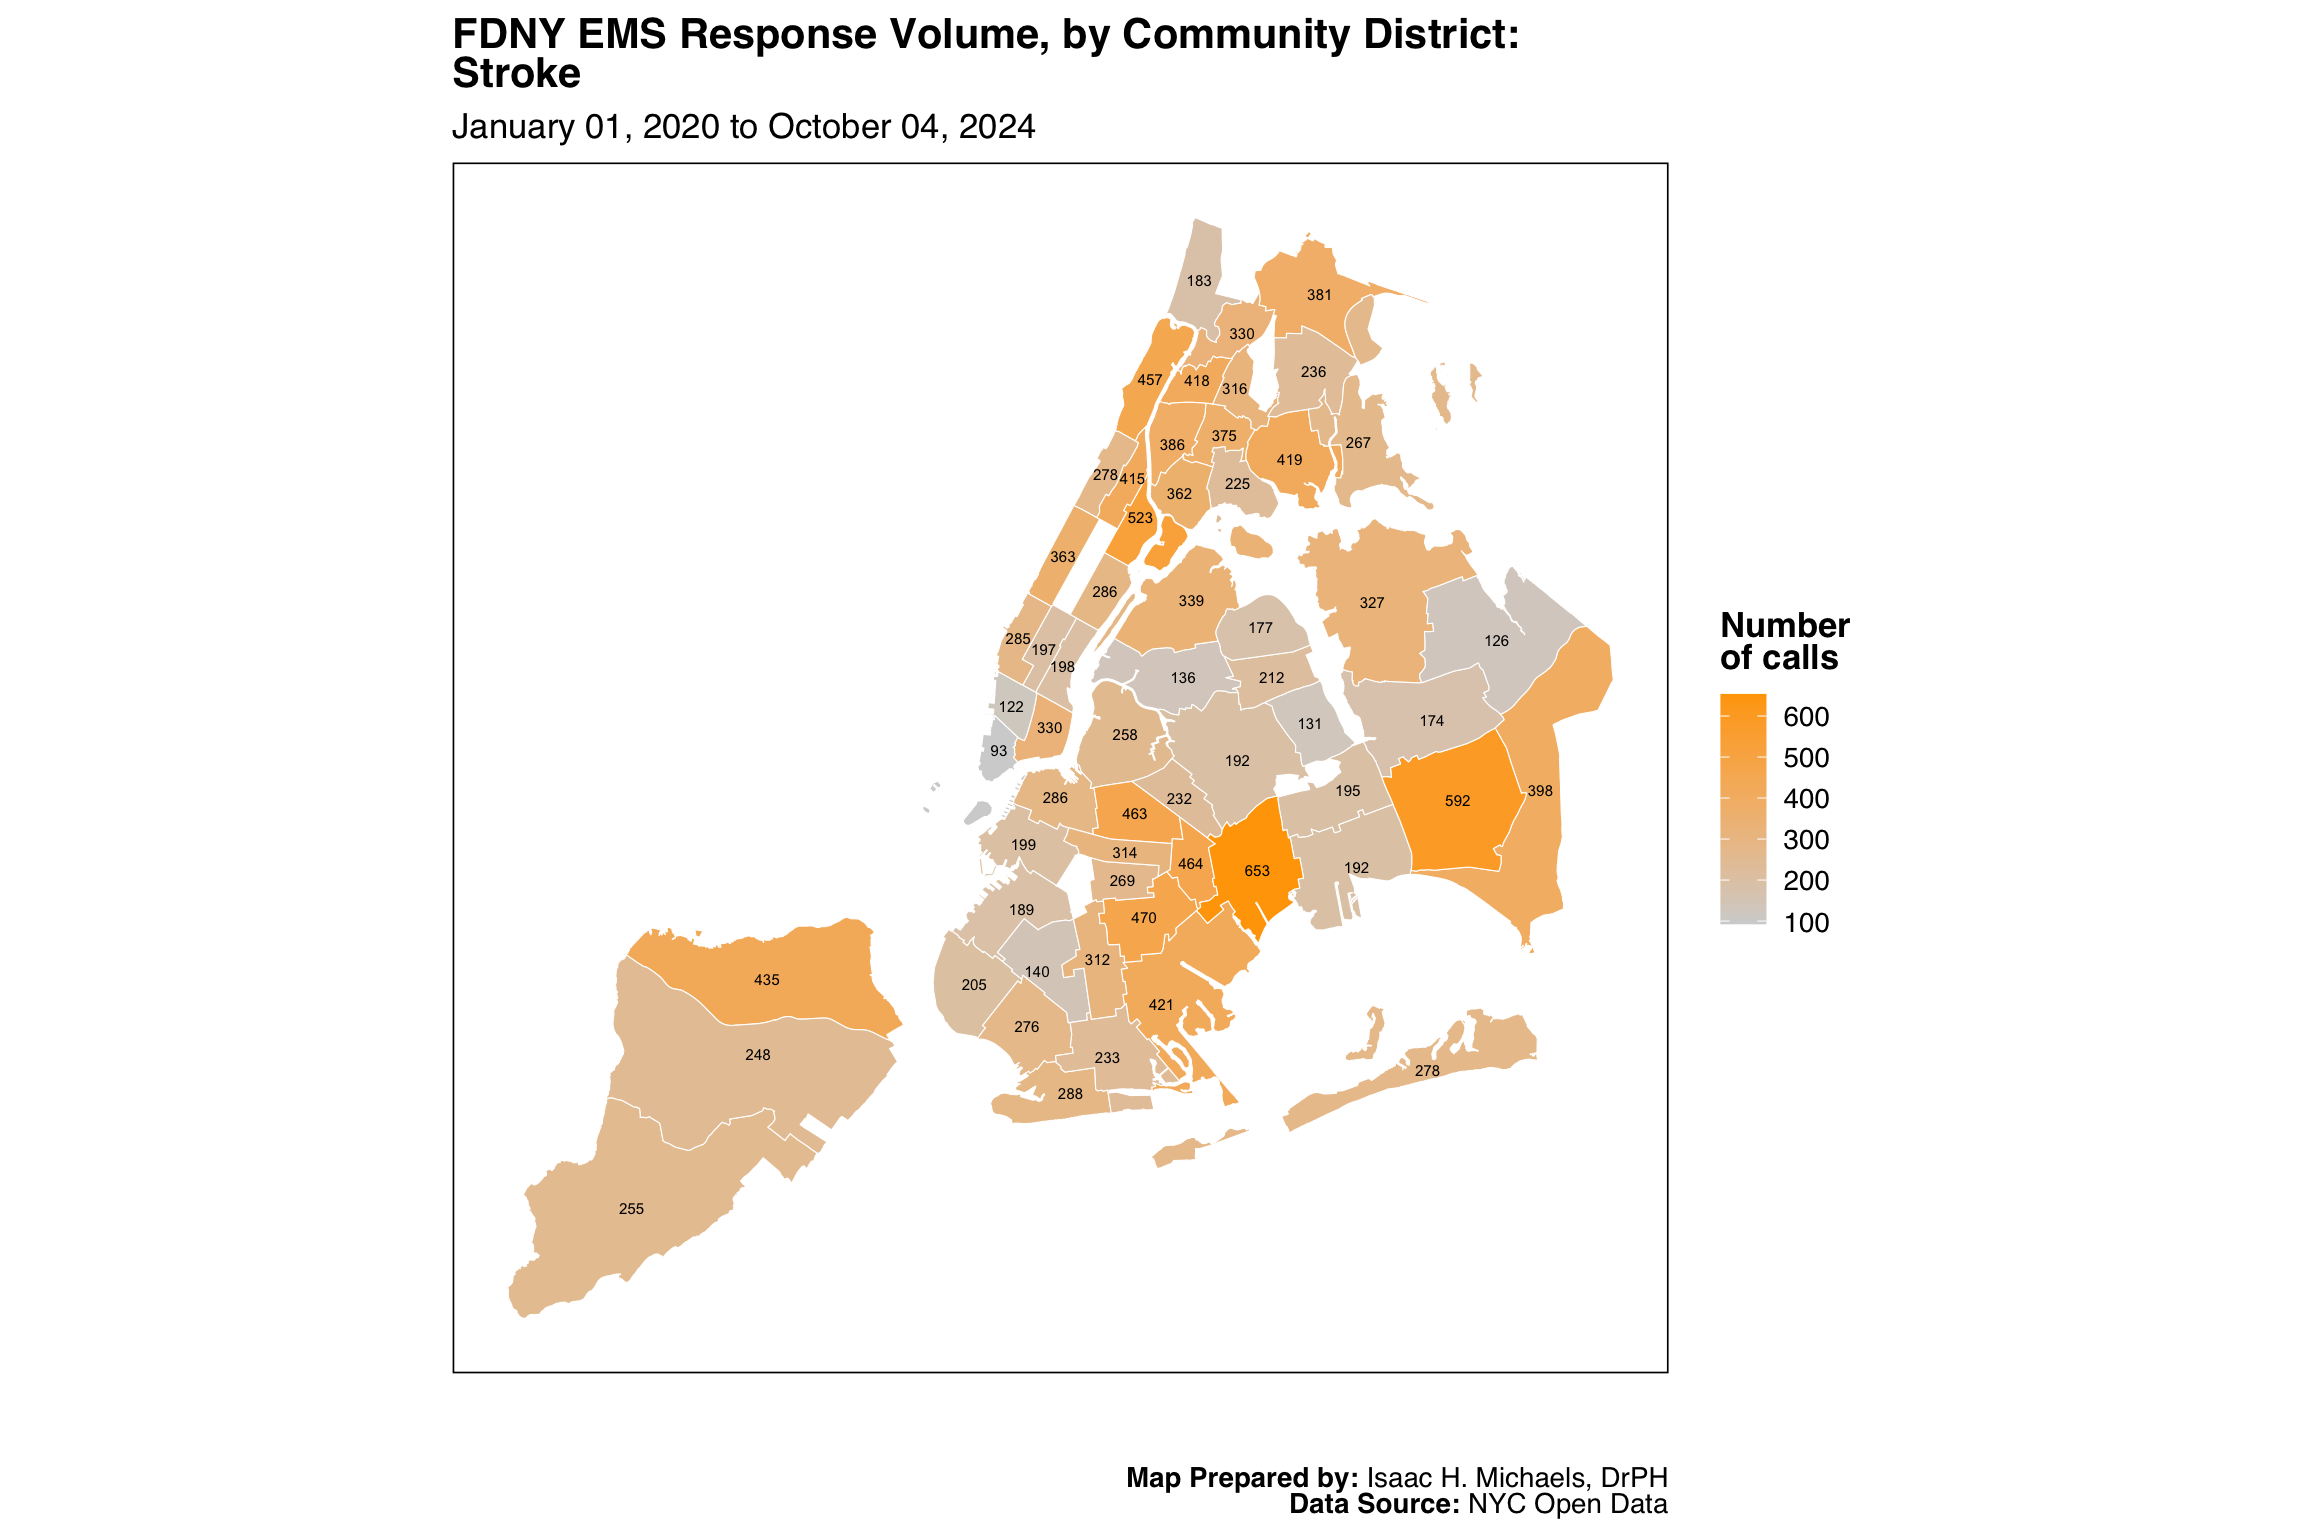
Map Prepared by: Isaac H. Michaels, DrPH
Data Source: NYC Open Data

Map Prepared by: Isaac H. Michaels, DrPH
EMS Data Source: NYC Open Data
Population Data Source: NYC Open Data
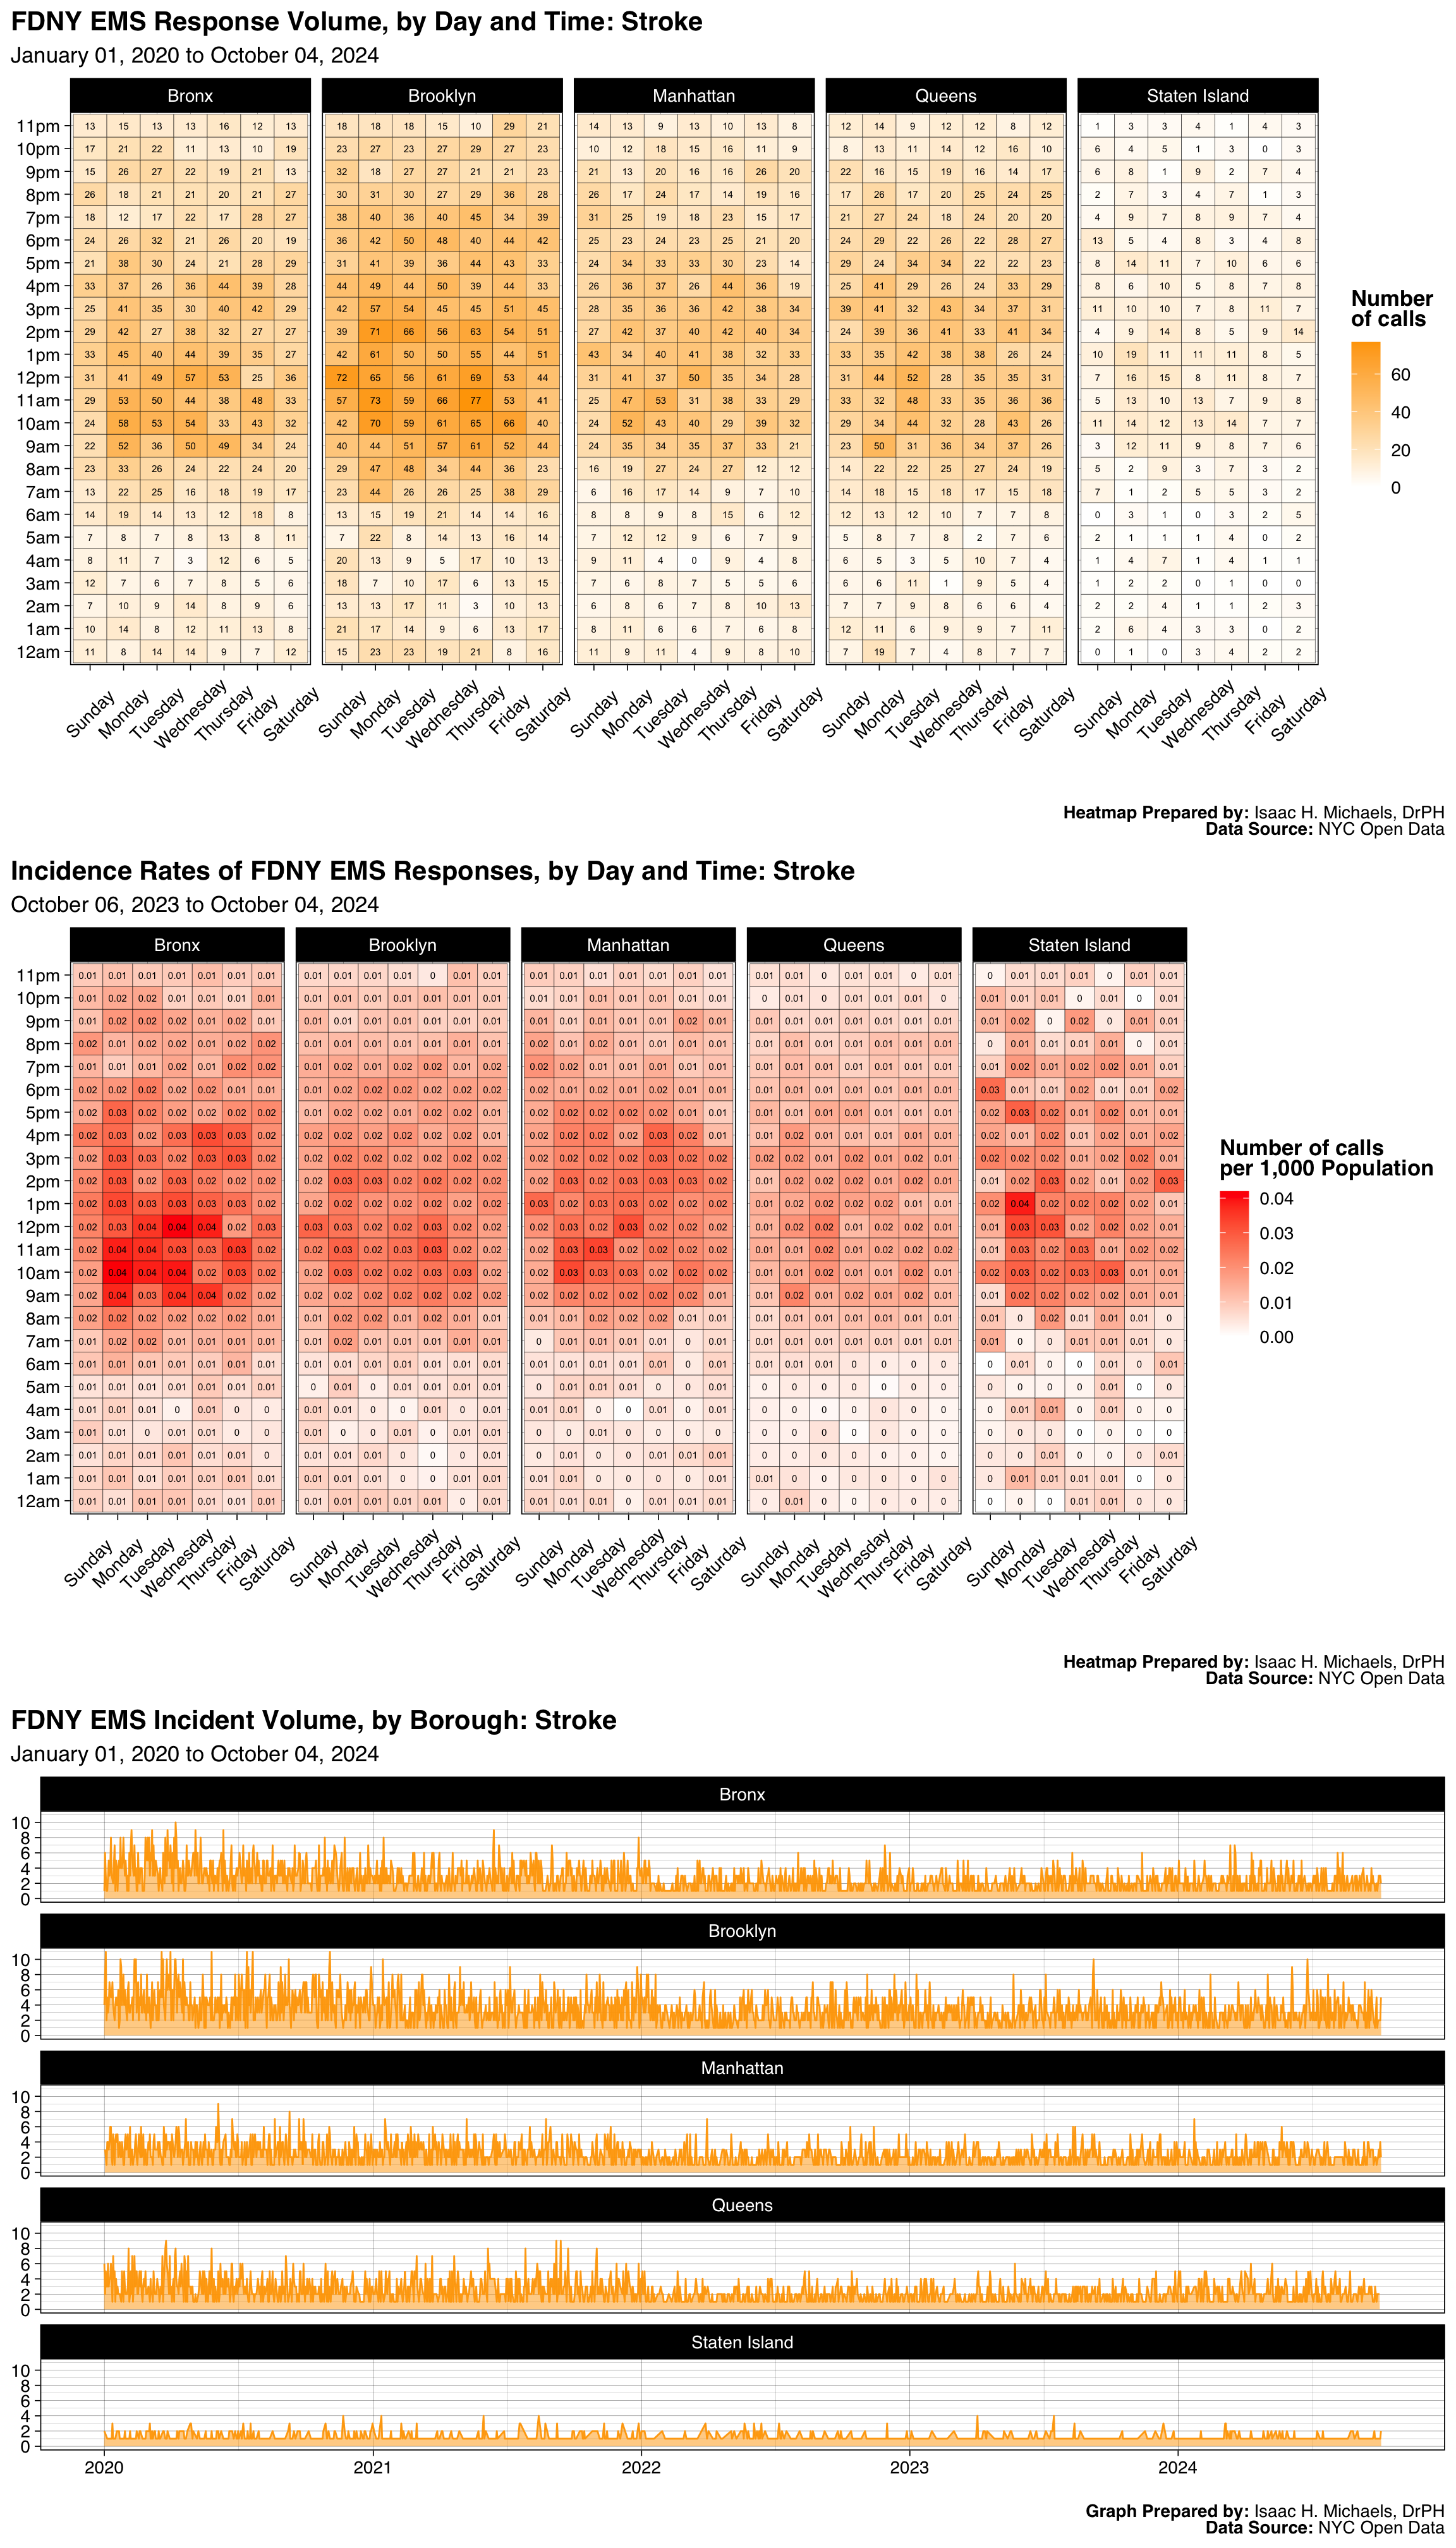
Graphs Prepared by: Isaac H. Michaels, DrPH
Data Source: NYC Open Data
| FDNY EMS Incident Volume, by Borough: Choking |
||||||
| January 01, 2025 to July 01, 2026 | ||||||
| Borough |
Latest Year: 2026
|
All Years: 2025-2026
|
||||
|---|---|---|---|---|---|---|
| Incidents | % | Rate per 1,000 Population | Total Incidents | % | Monthly Trend | |
| Bronx | 212 | 21% | 0.2 | 636 | 21% | |
| Brooklyn | 300 | 29% | 0.1 | 870 | 28% | |
| Manhattan | 168 | 16% | 0.1 | 542 | 18% | |
| Queens | 277 | 27% | 0.1 | 804 | 26% | |
| Staten Island | 77 | 7% | 0.2 | 211 | 7% | |
| Table Prepred by: Isaac H. Michaels, DrPH | ||||||
| Data Source: NYC Open Data | ||||||
Table Prepared by: Isaac H. Michaels, DrPH
EMS Data Source: NYC Open Data
Population Data Source: Health Data NY
| FDNY EMS Incident Volume, by Severity Level: Choking |
||||
| January 01, 2025 to July 01, 2026 | ||||
| Final Severity Level |
Latest Year: 2026
|
All Years: 2025-2026
|
||
|---|---|---|---|---|
| Incidents | % | Incidents | % | |
| 1 | 1,032 | 100% | 3,059 | 100% |
| 2 | 0 | 0% | 1 | 0% |
| 3 | 0 | 0% | 0 | 0% |
| 4 | 2 | 0% | 3 | 0% |
| 5 | 0 | 0% | 0 | 0% |
| 6 | 0 | 0% | 0 | 0% |
| 7 | 0 | 0% | 0 | 0% |
| 8 | 0 | 0% | 0 | 0% |
| Table Prepred by: Isaac H. Michaels, DrPH | ||||
| Data Source: NYC Open Data | ||||
Table Prepared by: Isaac H. Michaels, DrPH
Data Source: NYC Open Data
| FDNY EMS Incident Volume, by Disposition: Choking |
||||
| January 01, 2025 to July 01, 2026 | ||||
| Disposition |
Latest Year: 2026
|
All Years: 2025-2026
|
||
|---|---|---|---|---|
| Incidents | % | Incidents | % | |
| Cancelled | 19 | 2% | 55 | 2% |
| Condition Corrected | 2 | 0% | 9 | 0% |
| Patient Gone on Arrival | 17 | 2% | 65 | 2% |
| Patient Pronounced Dead | 4 | 0% | 11 | 0% |
| Refused Medical Aid | 262 | 25% | 758 | 25% |
| Transporting Patient | 697 | 67% | 2,049 | 67% |
| Treated and Transported | 1 | 0% | 3 | 0% |
| Unfounded | 30 | 3% | 107 | 3% |
| NA | 2 | 0% | 6 | 0% |
| Table Prepred by: Isaac H. Michaels, DrPH | ||||
| Data Source: NYC Open Data | ||||
Table Prepared by: Isaac H. Michaels, DrPH
Data Source: NYC Open Data
Back to top
Gyn/Severe Pain/Bleeding
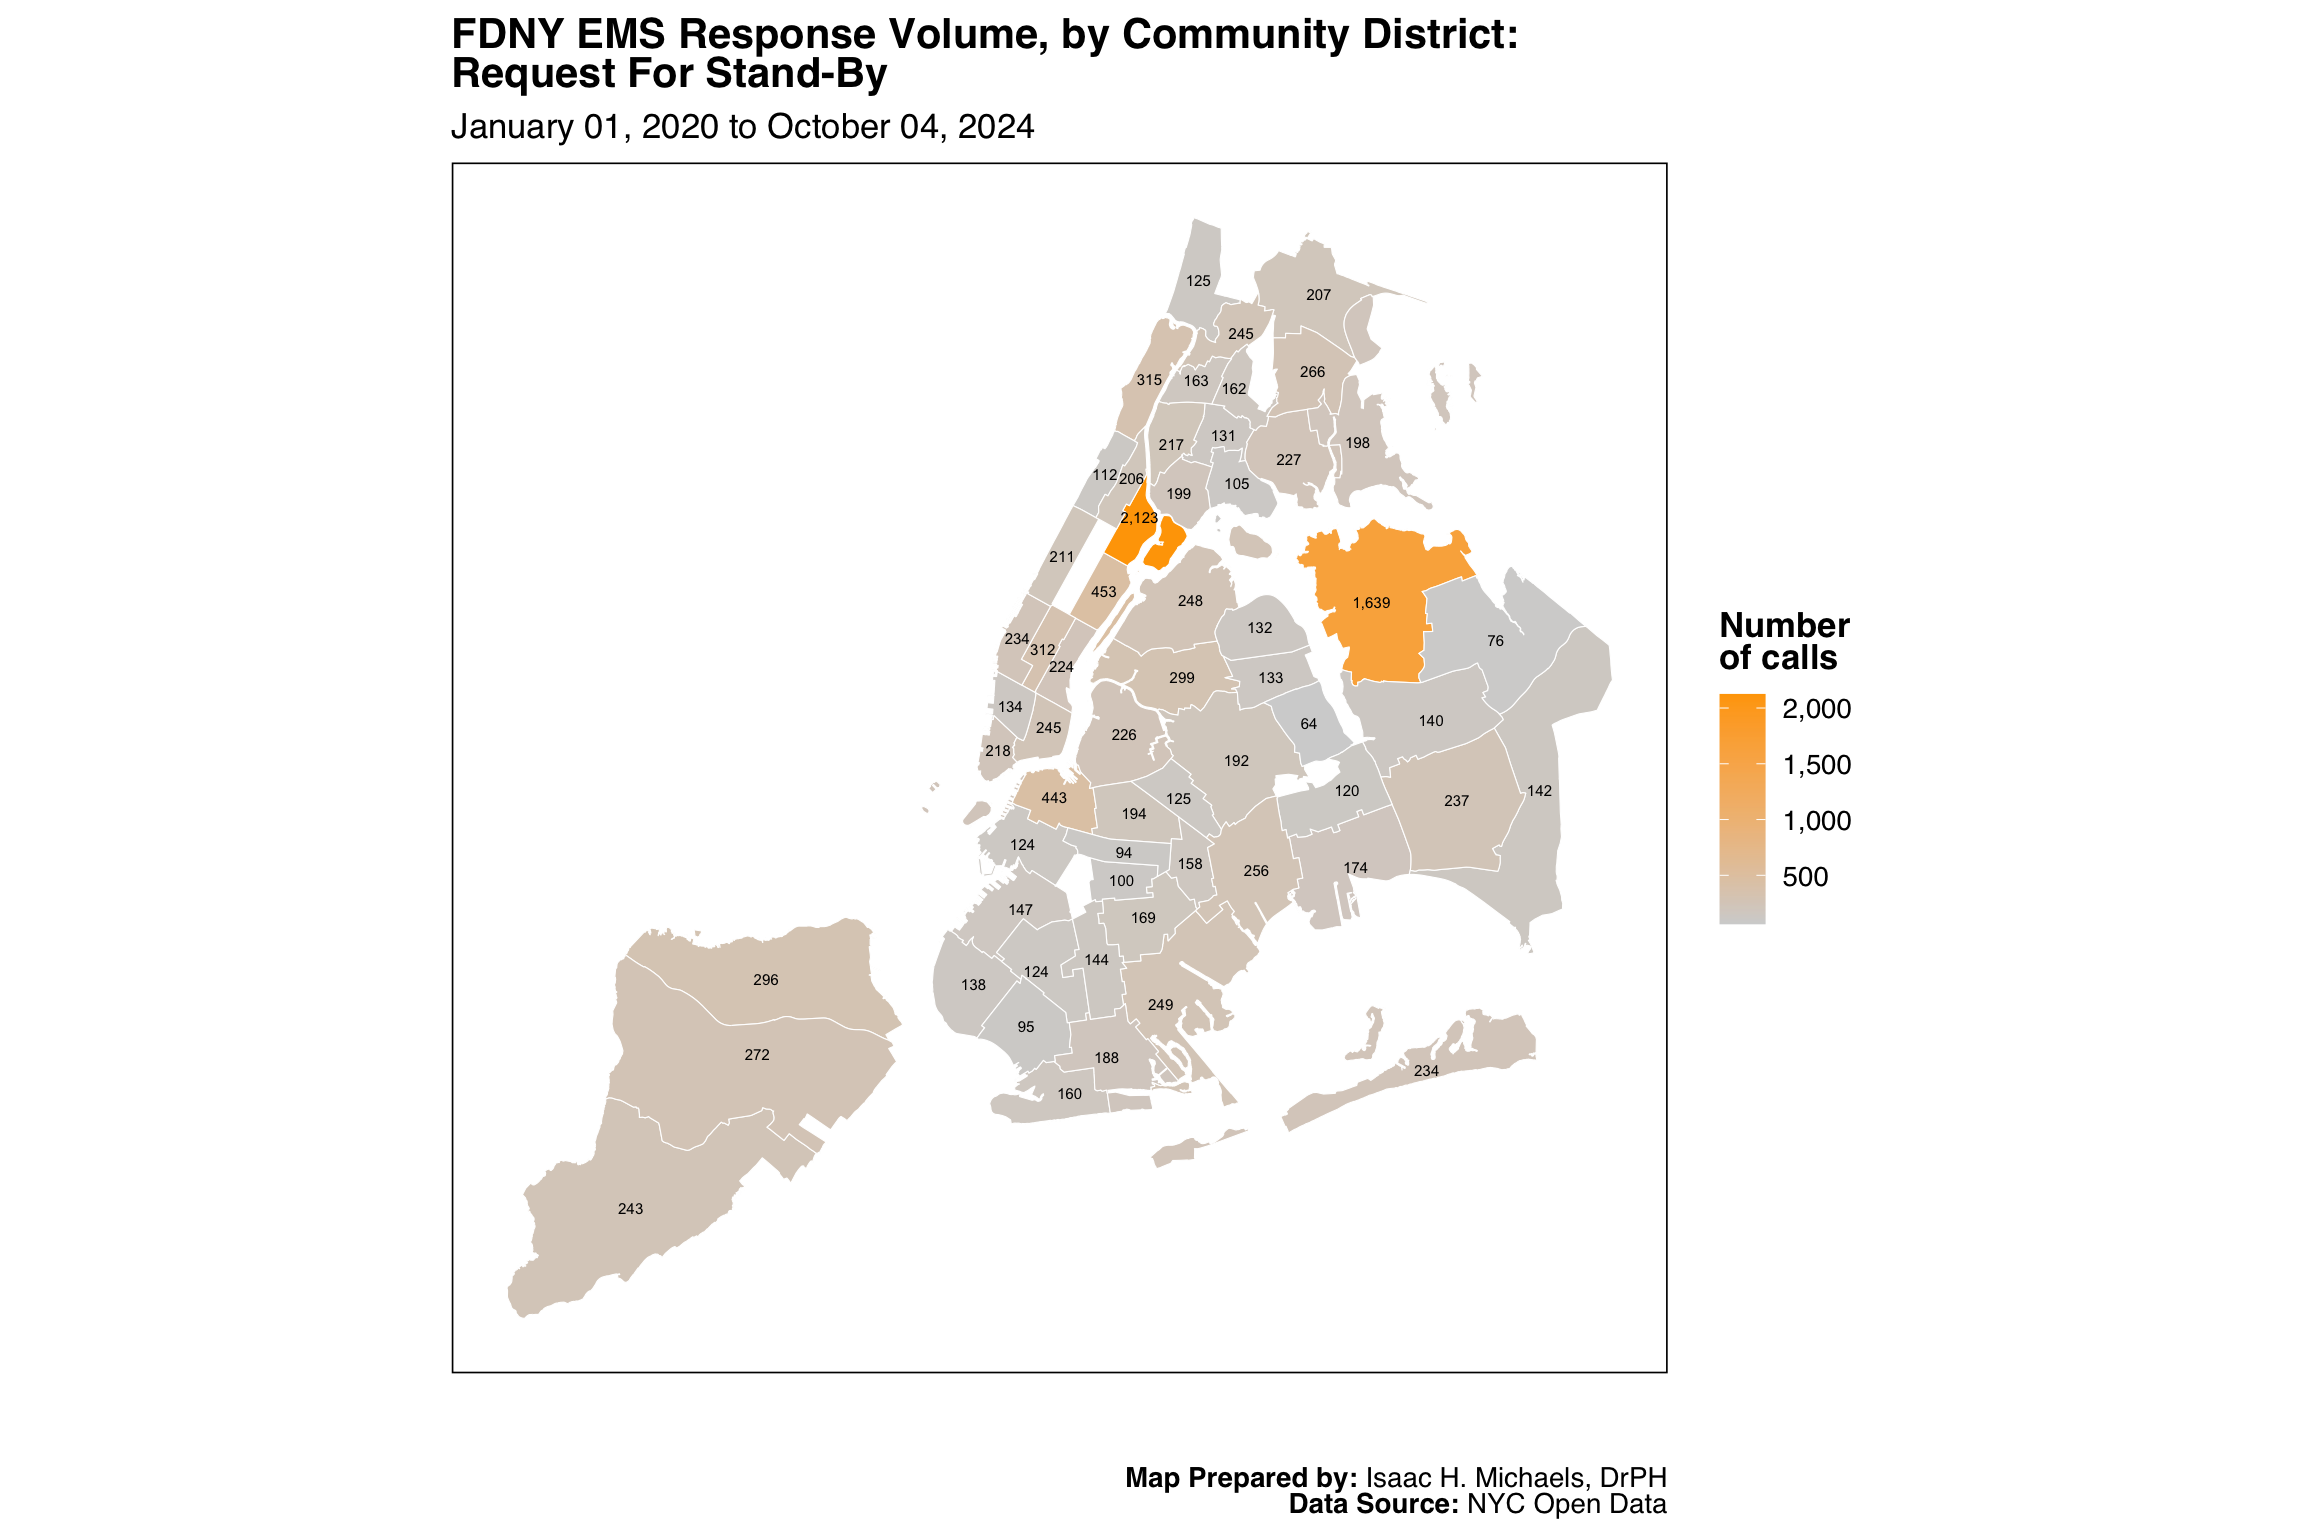
Map Prepared by: Isaac H. Michaels, DrPH
Data Source: NYC Open Data
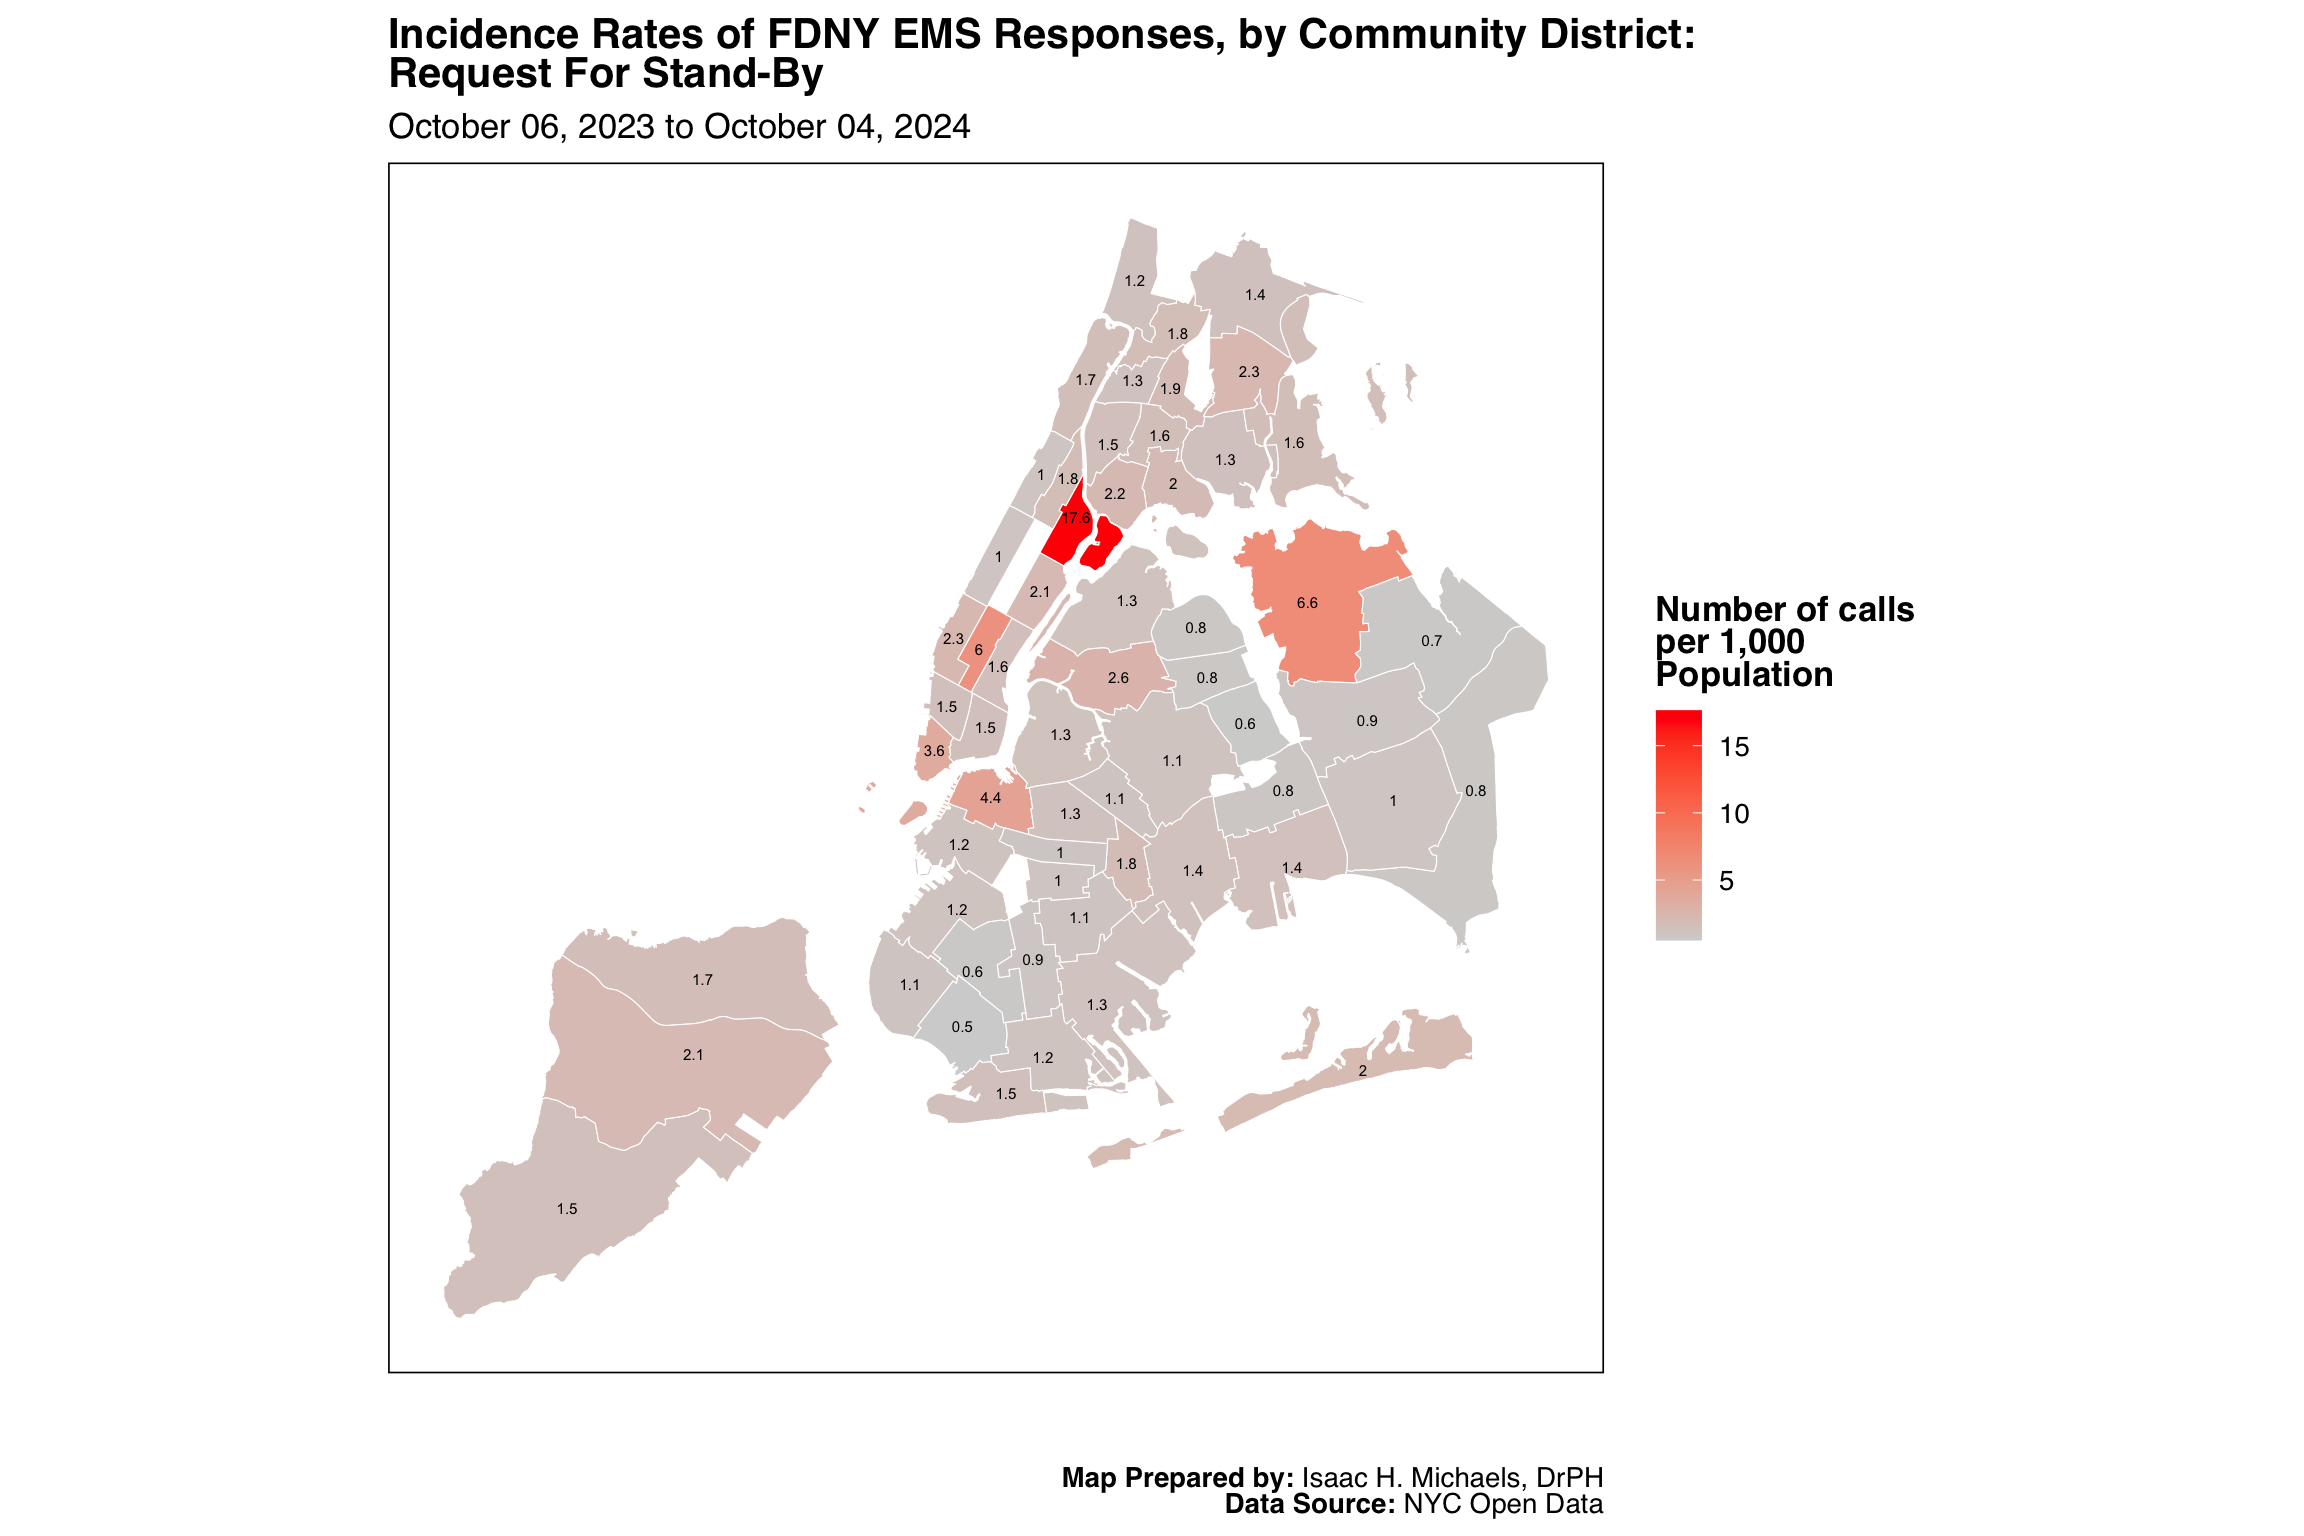
Map Prepared by: Isaac H. Michaels, DrPH
EMS Data Source: NYC Open Data
Population Data Source: NYC Open Data
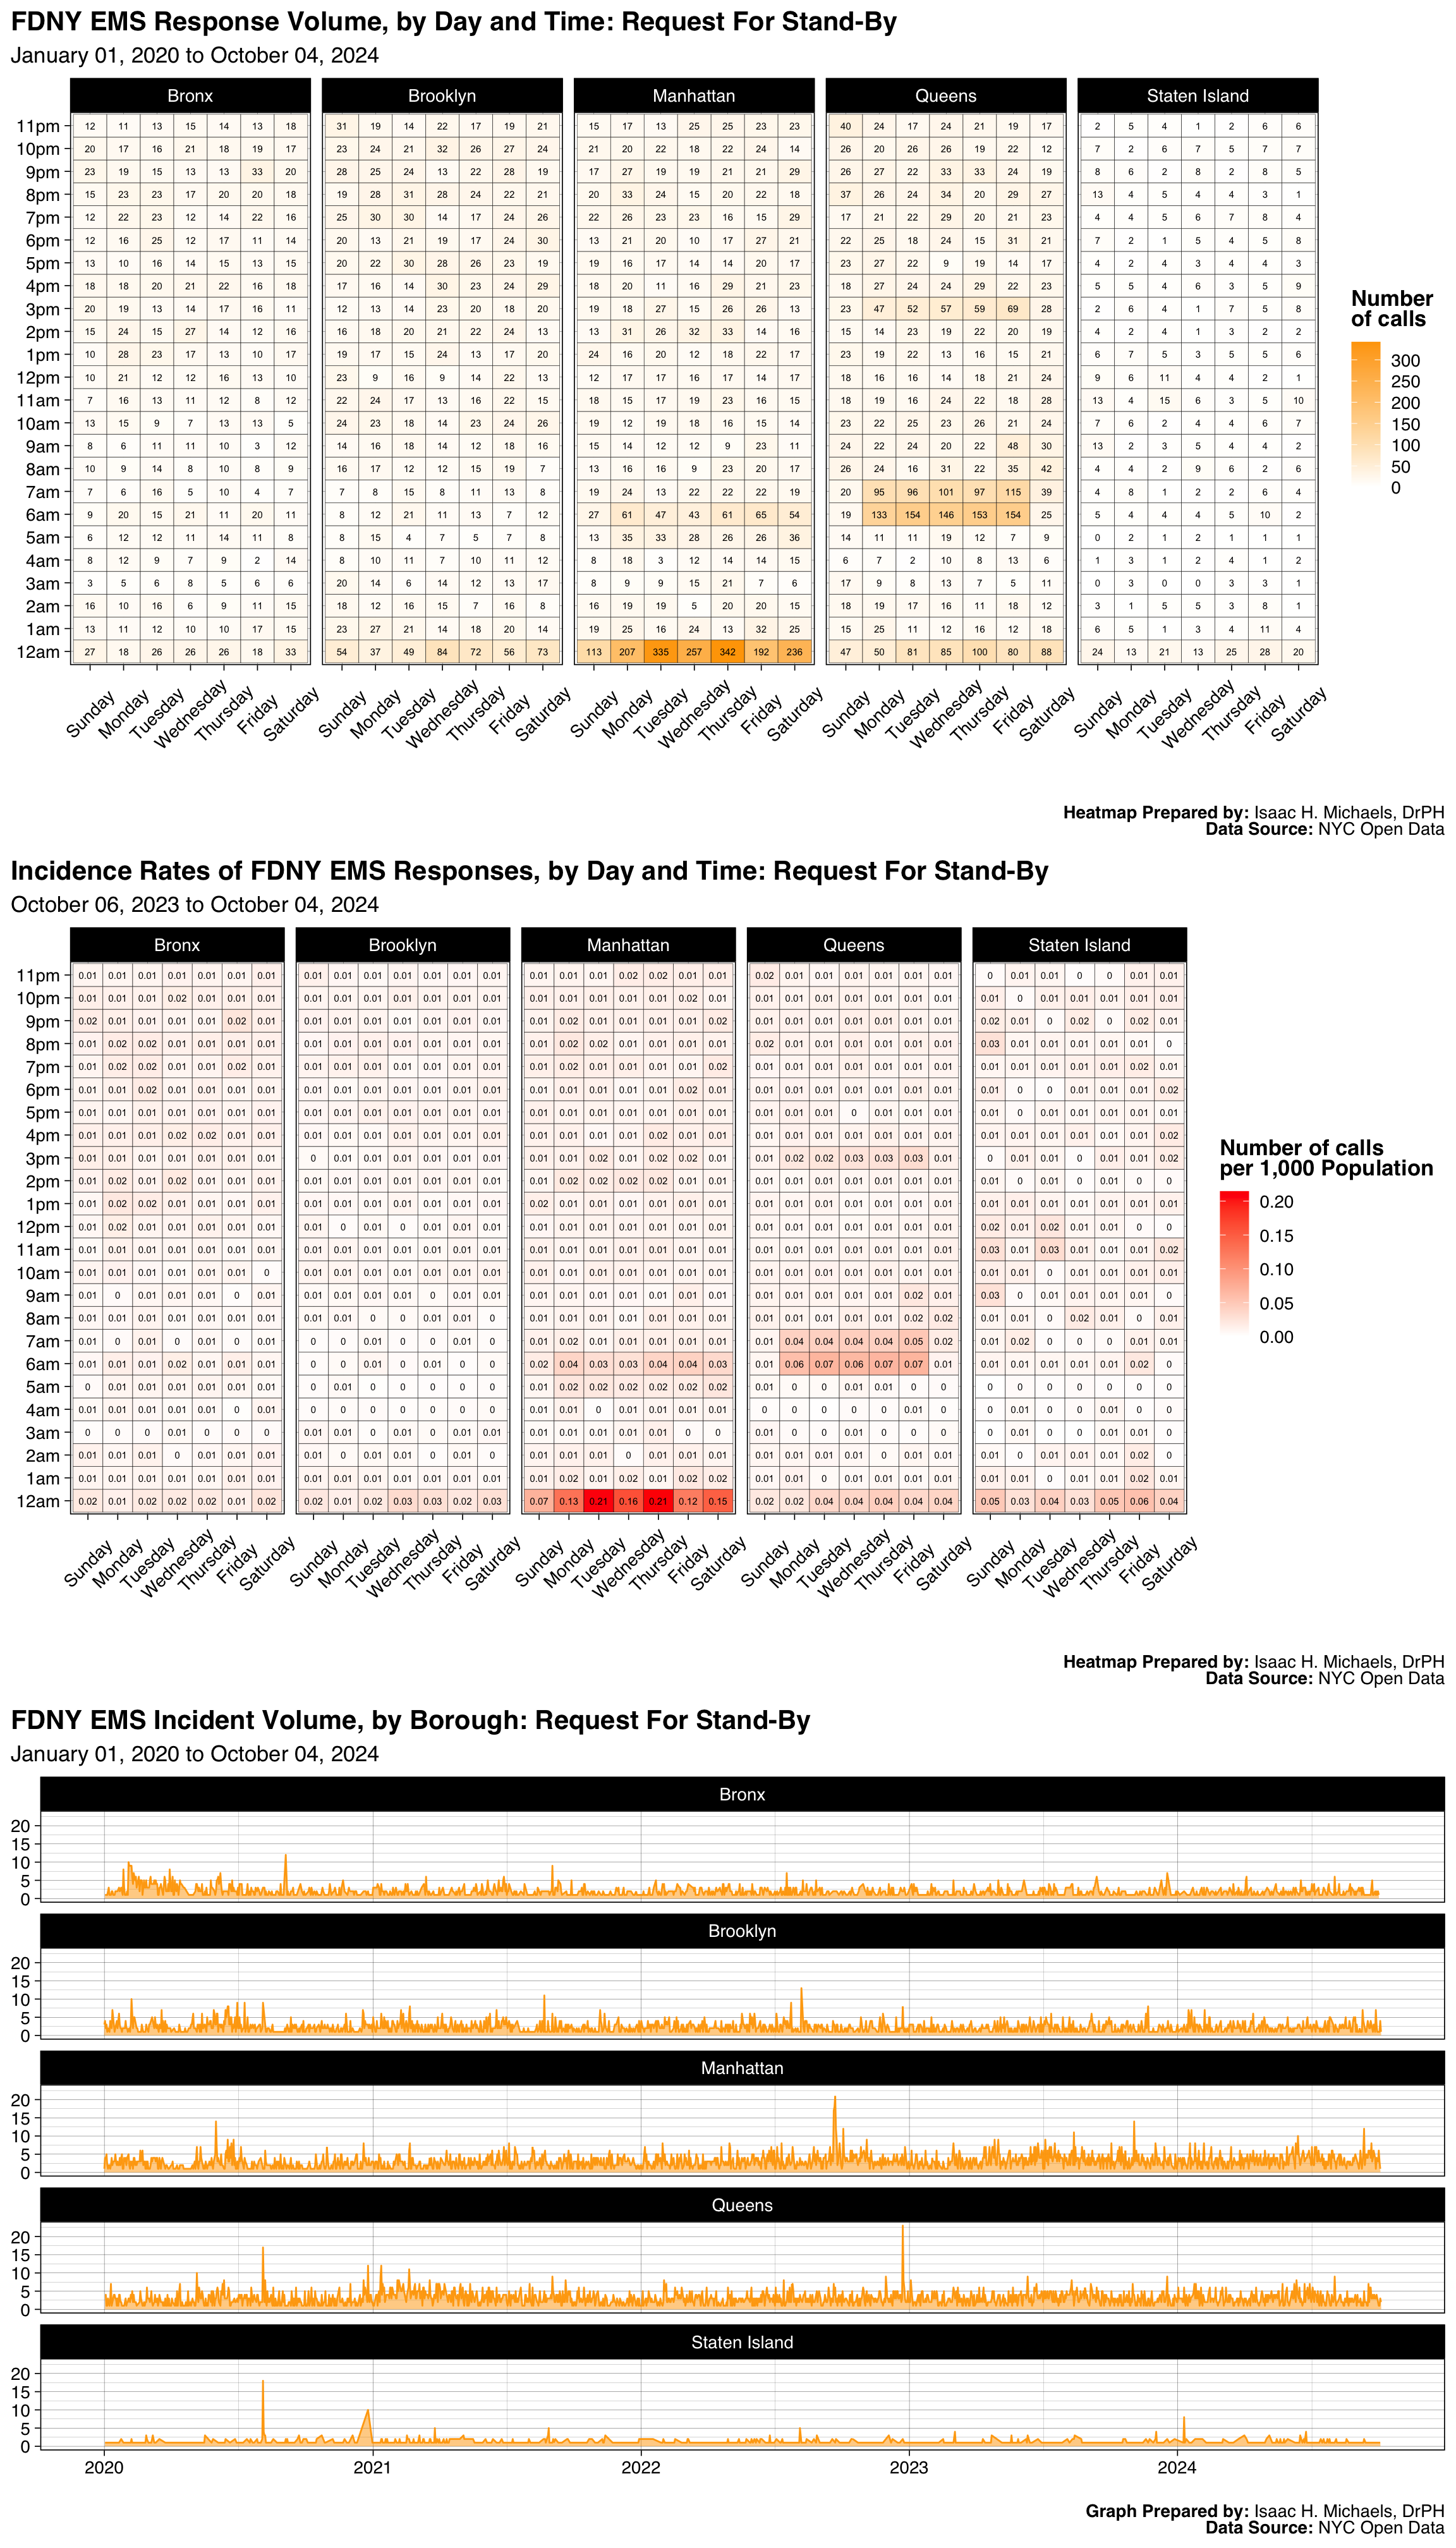
Graphs Prepared by: Isaac H. Michaels, DrPH
Data Source: NYC Open Data
| FDNY EMS Incident Volume, by Borough: Gyn/Severe Pain/Bleeding |
||||||
| January 01, 2025 to July 01, 2026 | ||||||
| Borough |
Latest Year: 2026
|
All Years: 2025-2026
|
||||
|---|---|---|---|---|---|---|
| Incidents | % | Rate per 1,000 Population | Total Incidents | % | Monthly Trend | |
| Bronx | 319 | 32% | 0.2 | 1,029 | 34% | |
| Brooklyn | 284 | 29% | 0.1 | 839 | 28% | |
| Manhattan | 165 | 17% | 0.1 | 533 | 18% | |
| Queens | 185 | 19% | 0.1 | 539 | 18% | |
| Staten Island | 31 | 3% | 0.1 | 102 | 3% | |
| Table Prepred by: Isaac H. Michaels, DrPH | ||||||
| Data Source: NYC Open Data | ||||||
Table Prepared by: Isaac H. Michaels, DrPH
EMS Data Source: NYC Open Data
Population Data Source: Health Data NY
| FDNY EMS Incident Volume, by Severity Level: Gyn/Severe Pain/Bleeding |
||||
| January 01, 2025 to July 01, 2026 | ||||
| Final Severity Level |
Latest Year: 2026
|
All Years: 2025-2026
|
||
|---|---|---|---|---|
| Incidents | % | Incidents | % | |
| 1 | 0 | 0% | 0 | 0% |
| 2 | 0 | 0% | 1 | 0% |
| 3 | 1 | 0% | 5 | 0% |
| 4 | 983 | 100% | 3,036 | 100% |
| 5 | 0 | 0% | 0 | 0% |
| 6 | 0 | 0% | 0 | 0% |
| 7 | 0 | 0% | 0 | 0% |
| 8 | 0 | 0% | 0 | 0% |
| Table Prepred by: Isaac H. Michaels, DrPH | ||||
| Data Source: NYC Open Data | ||||
Table Prepared by: Isaac H. Michaels, DrPH
Data Source: NYC Open Data
| FDNY EMS Incident Volume, by Disposition: Gyn/Severe Pain/Bleeding |
||||
| January 01, 2025 to July 01, 2026 | ||||
| Disposition |
Latest Year: 2026
|
All Years: 2025-2026
|
||
|---|---|---|---|---|
| Incidents | % | Incidents | % | |
| Cancelled | 7 | 1% | 25 | 1% |
| Condition Corrected | 1 | 0% | 2 | 0% |
| Patient Gone on Arrival | 28 | 3% | 73 | 2% |
| Patient Pronounced Dead | 1 | 0% | 1 | 0% |
| Refused Medical Aid | 71 | 7% | 268 | 9% |
| Transporting Patient | 840 | 85% | 2,594 | 85% |
| Unfounded | 26 | 3% | 60 | 2% |
| NA | 10 | 1% | 18 | 1% |
| Table Prepred by: Isaac H. Michaels, DrPH | ||||
| Data Source: NYC Open Data | ||||
Table Prepared by: Isaac H. Michaels, DrPH
Data Source: NYC Open Data
Back to top
Miscarriage
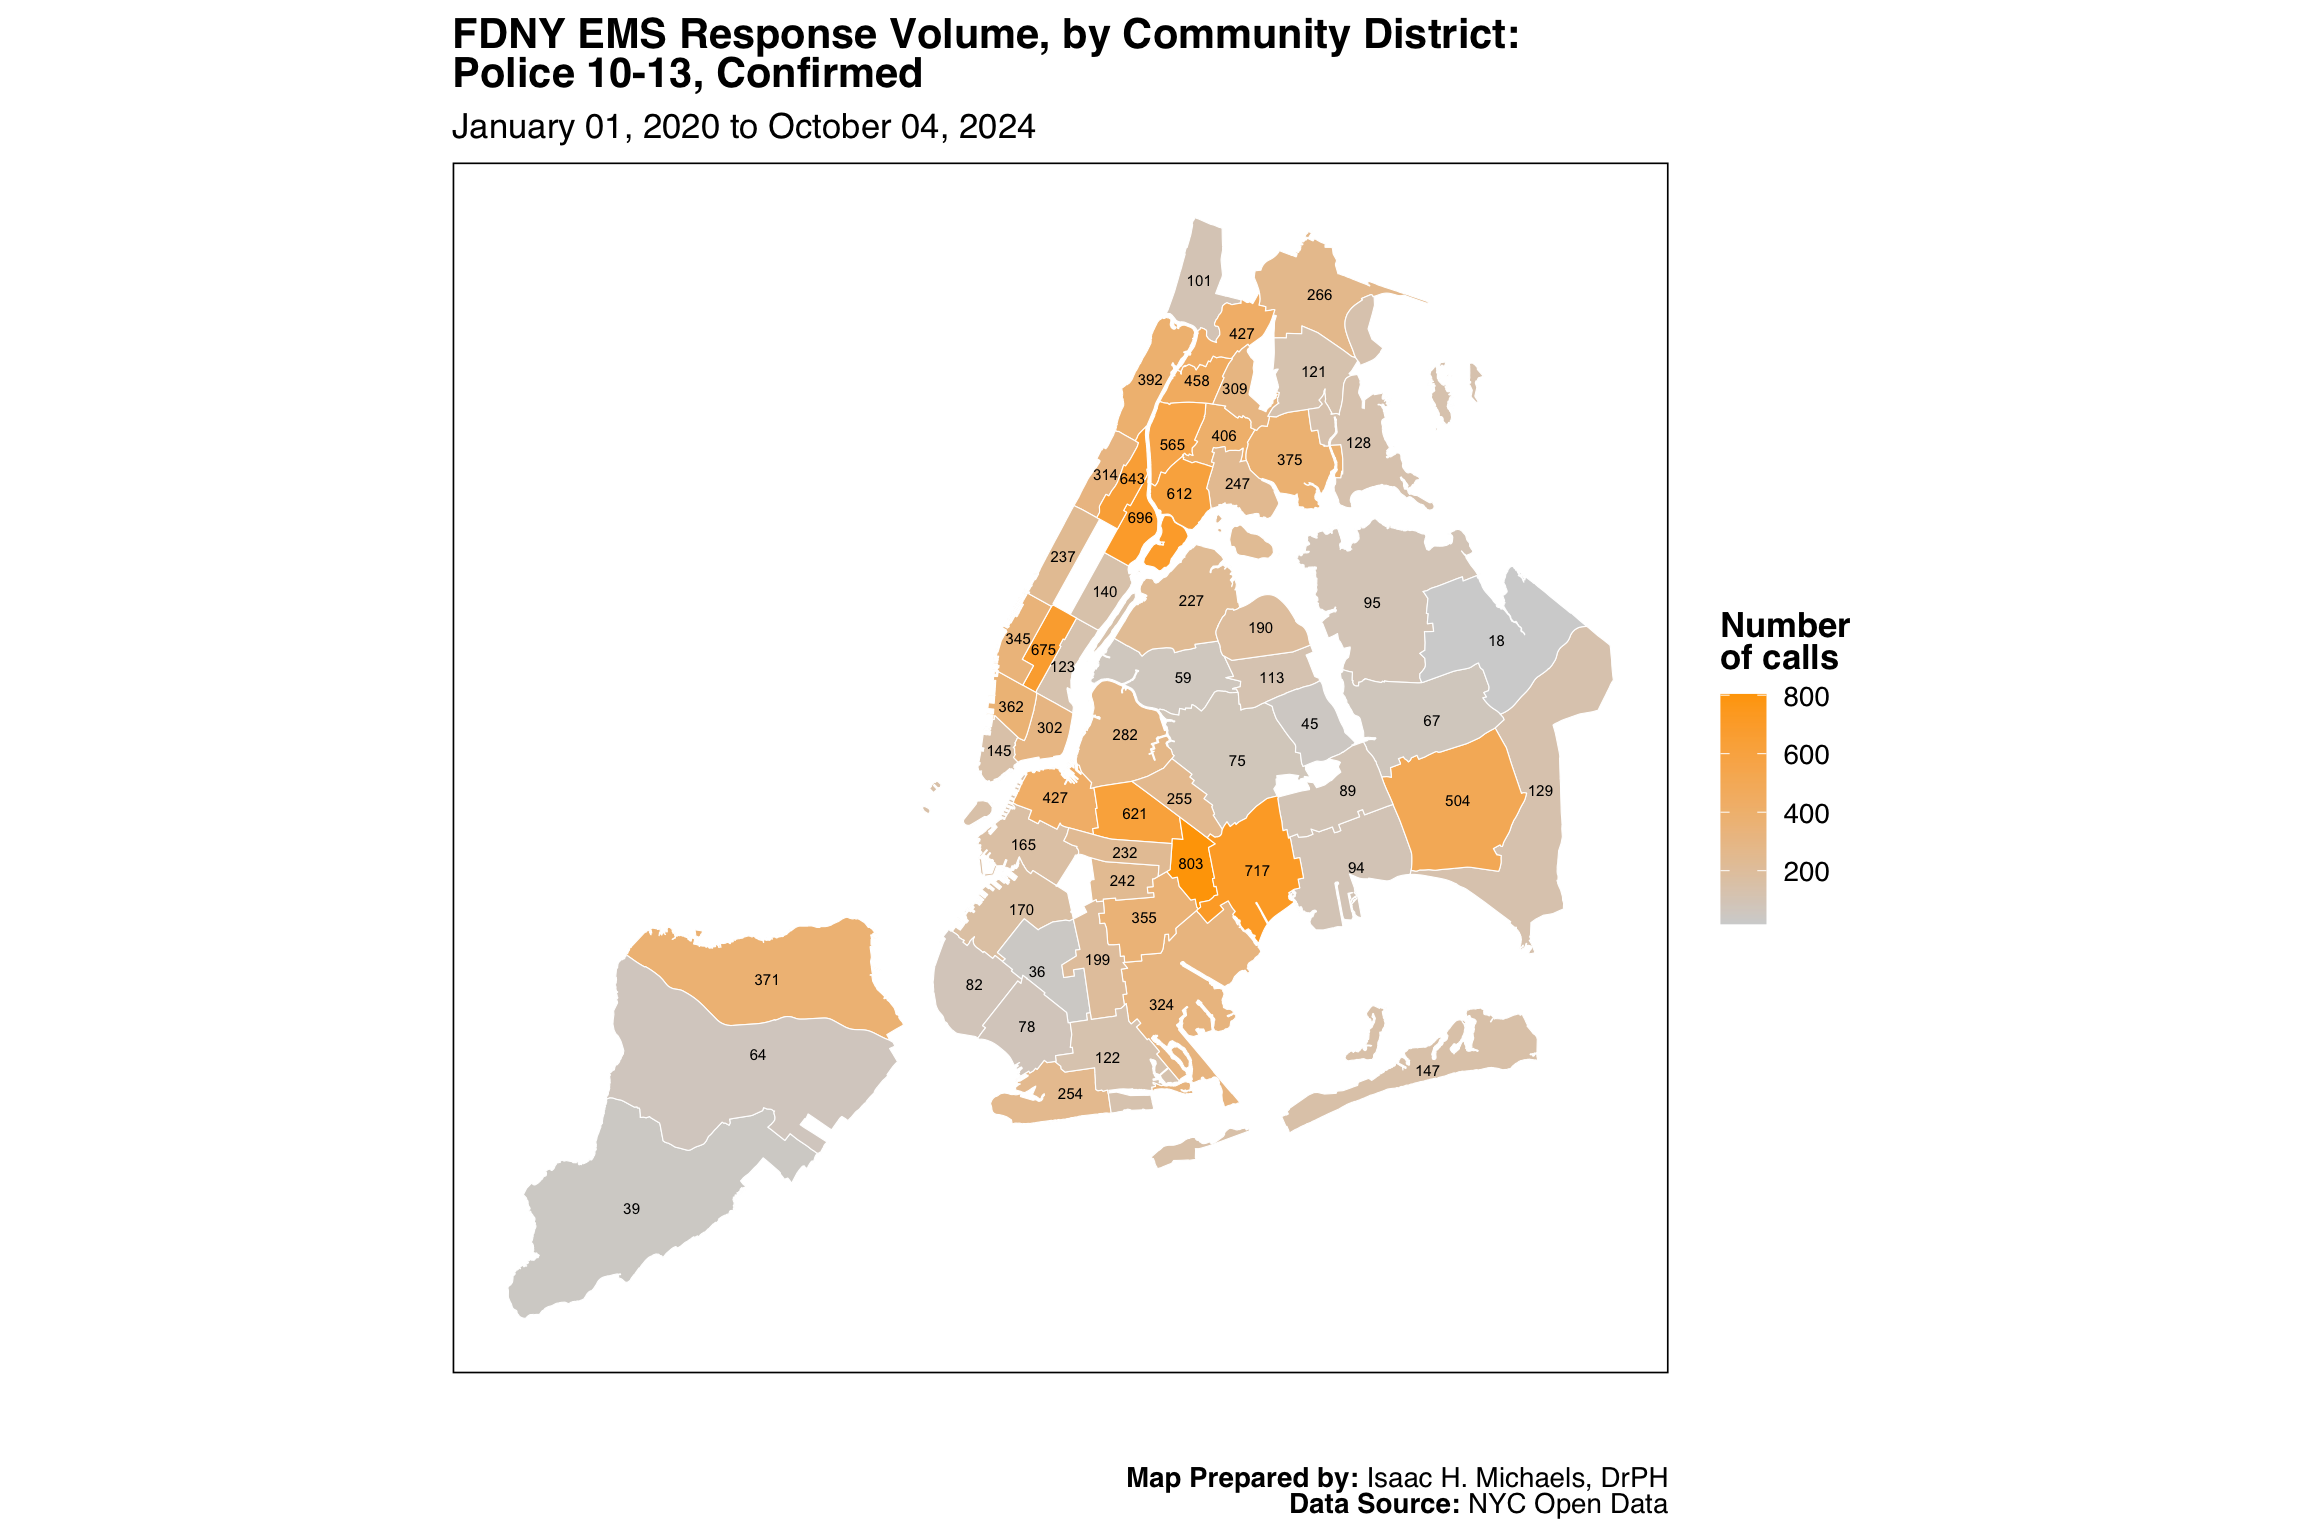
Map Prepared by: Isaac H. Michaels, DrPH
Data Source: NYC Open Data
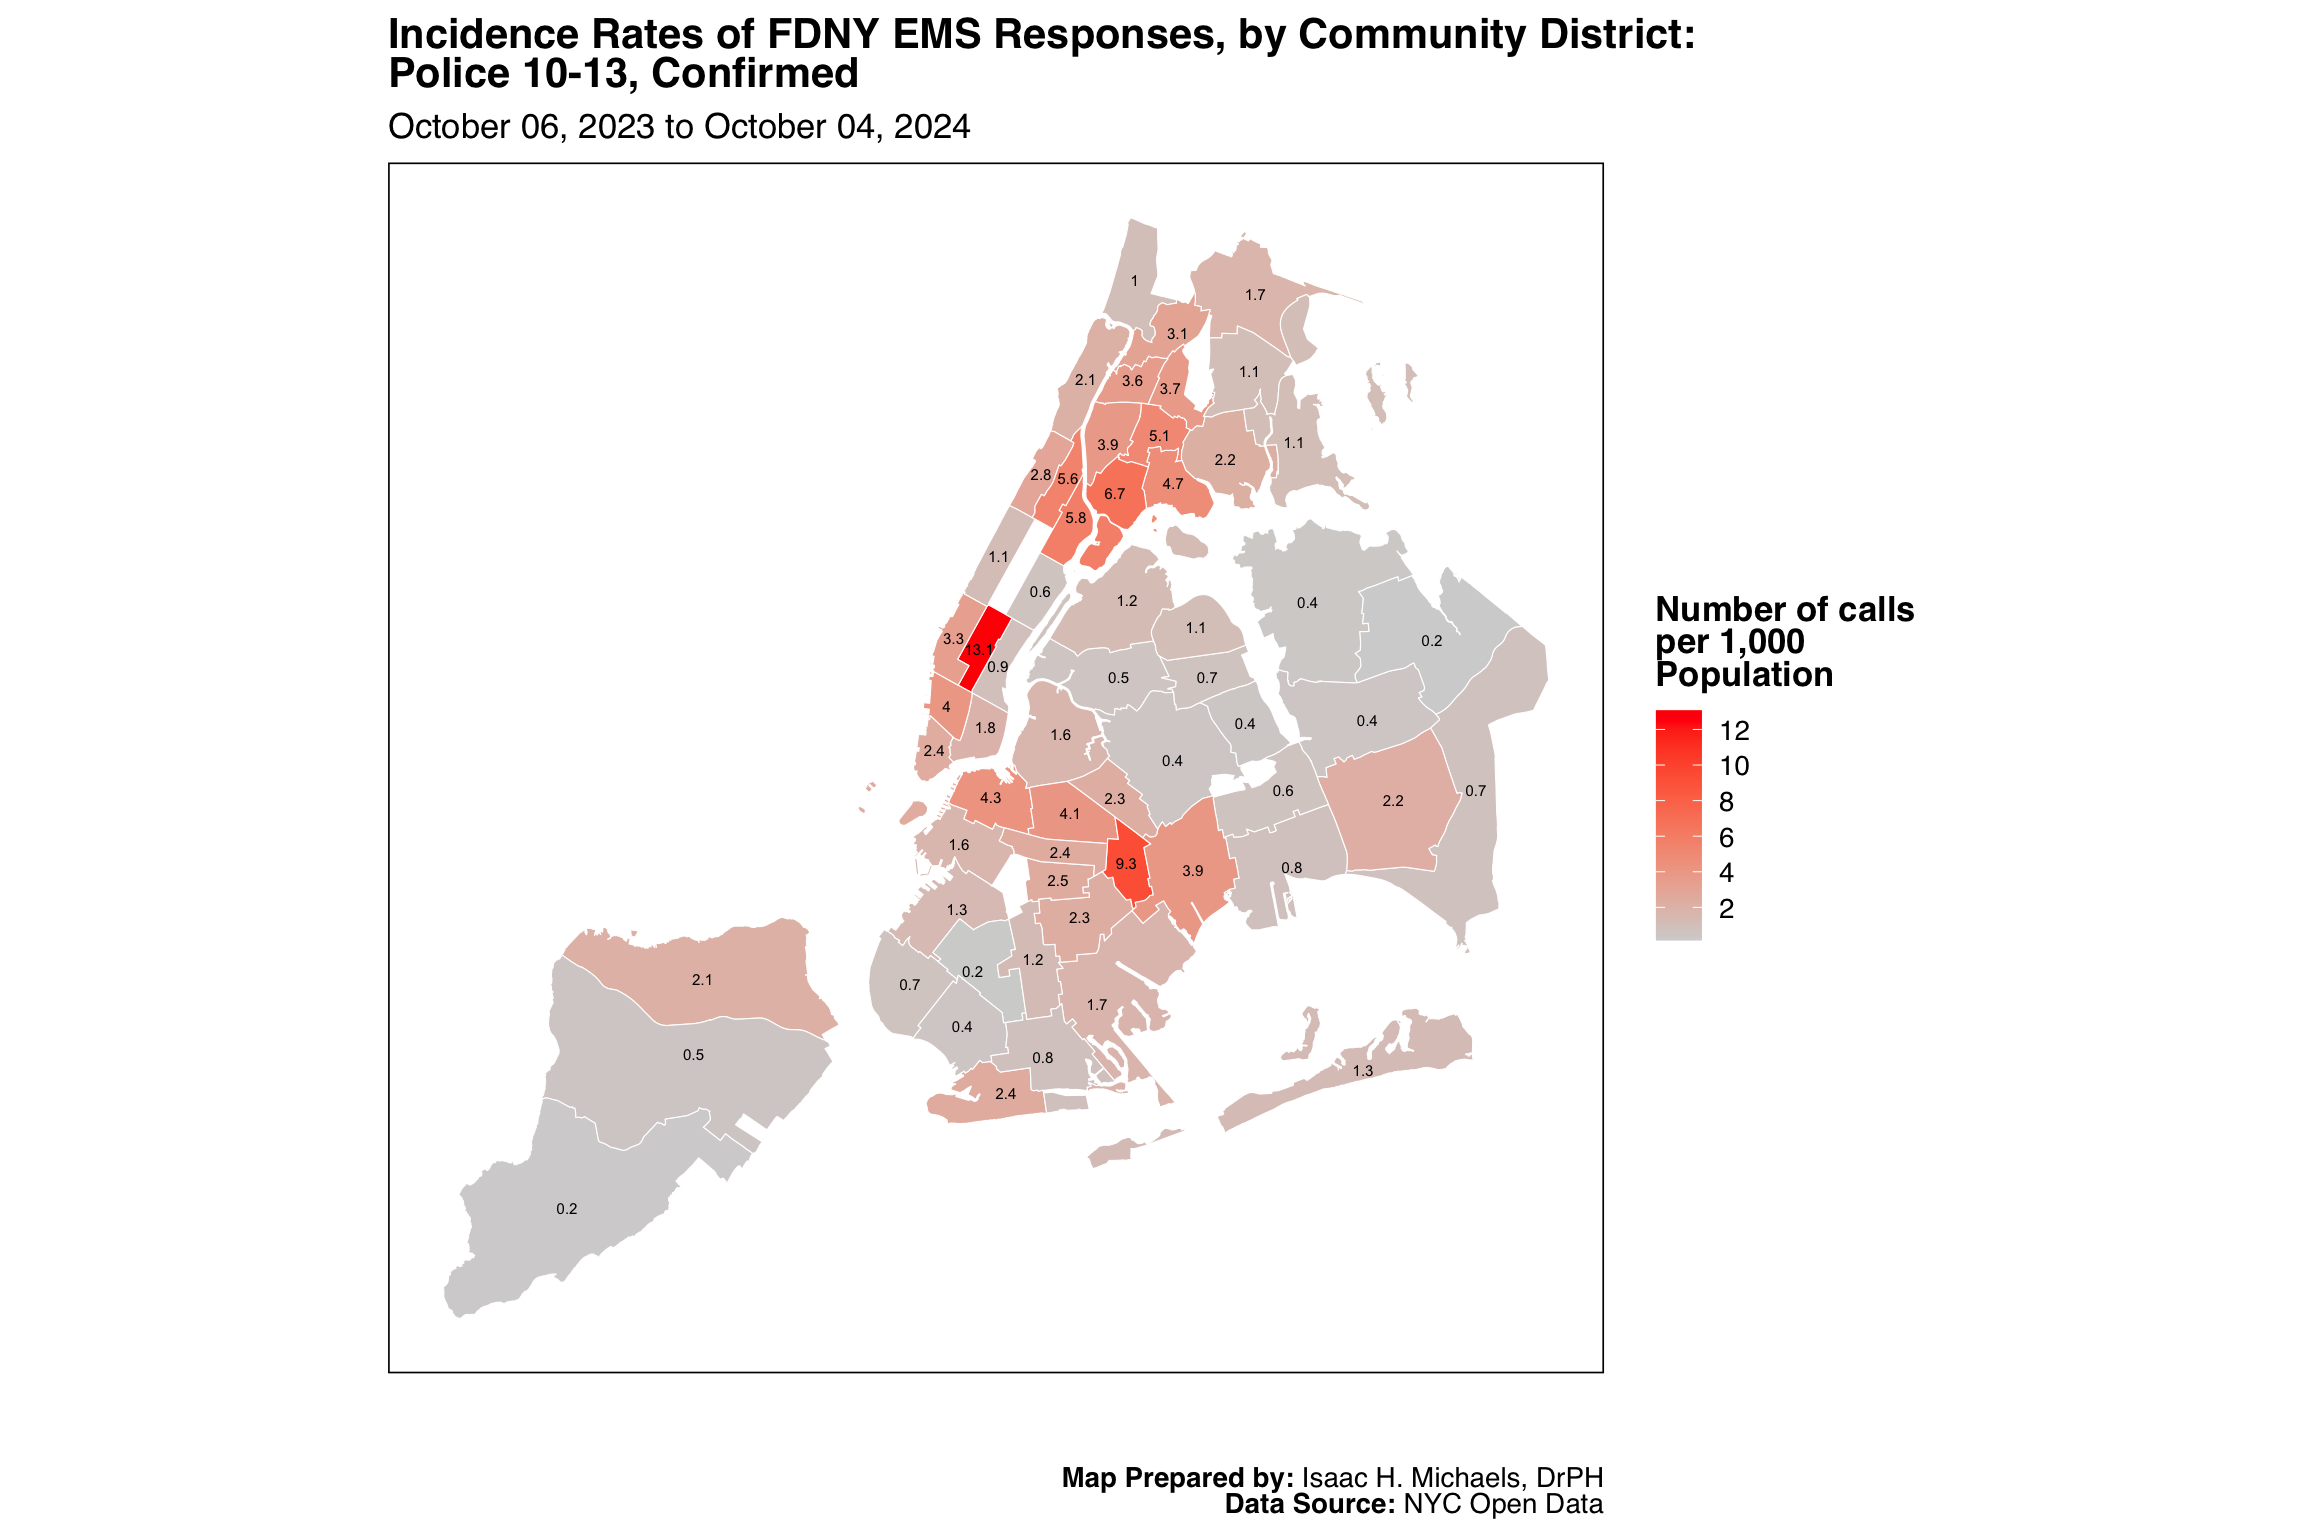
Map Prepared by: Isaac H. Michaels, DrPH
EMS Data Source: NYC Open Data
Population Data Source: NYC Open Data
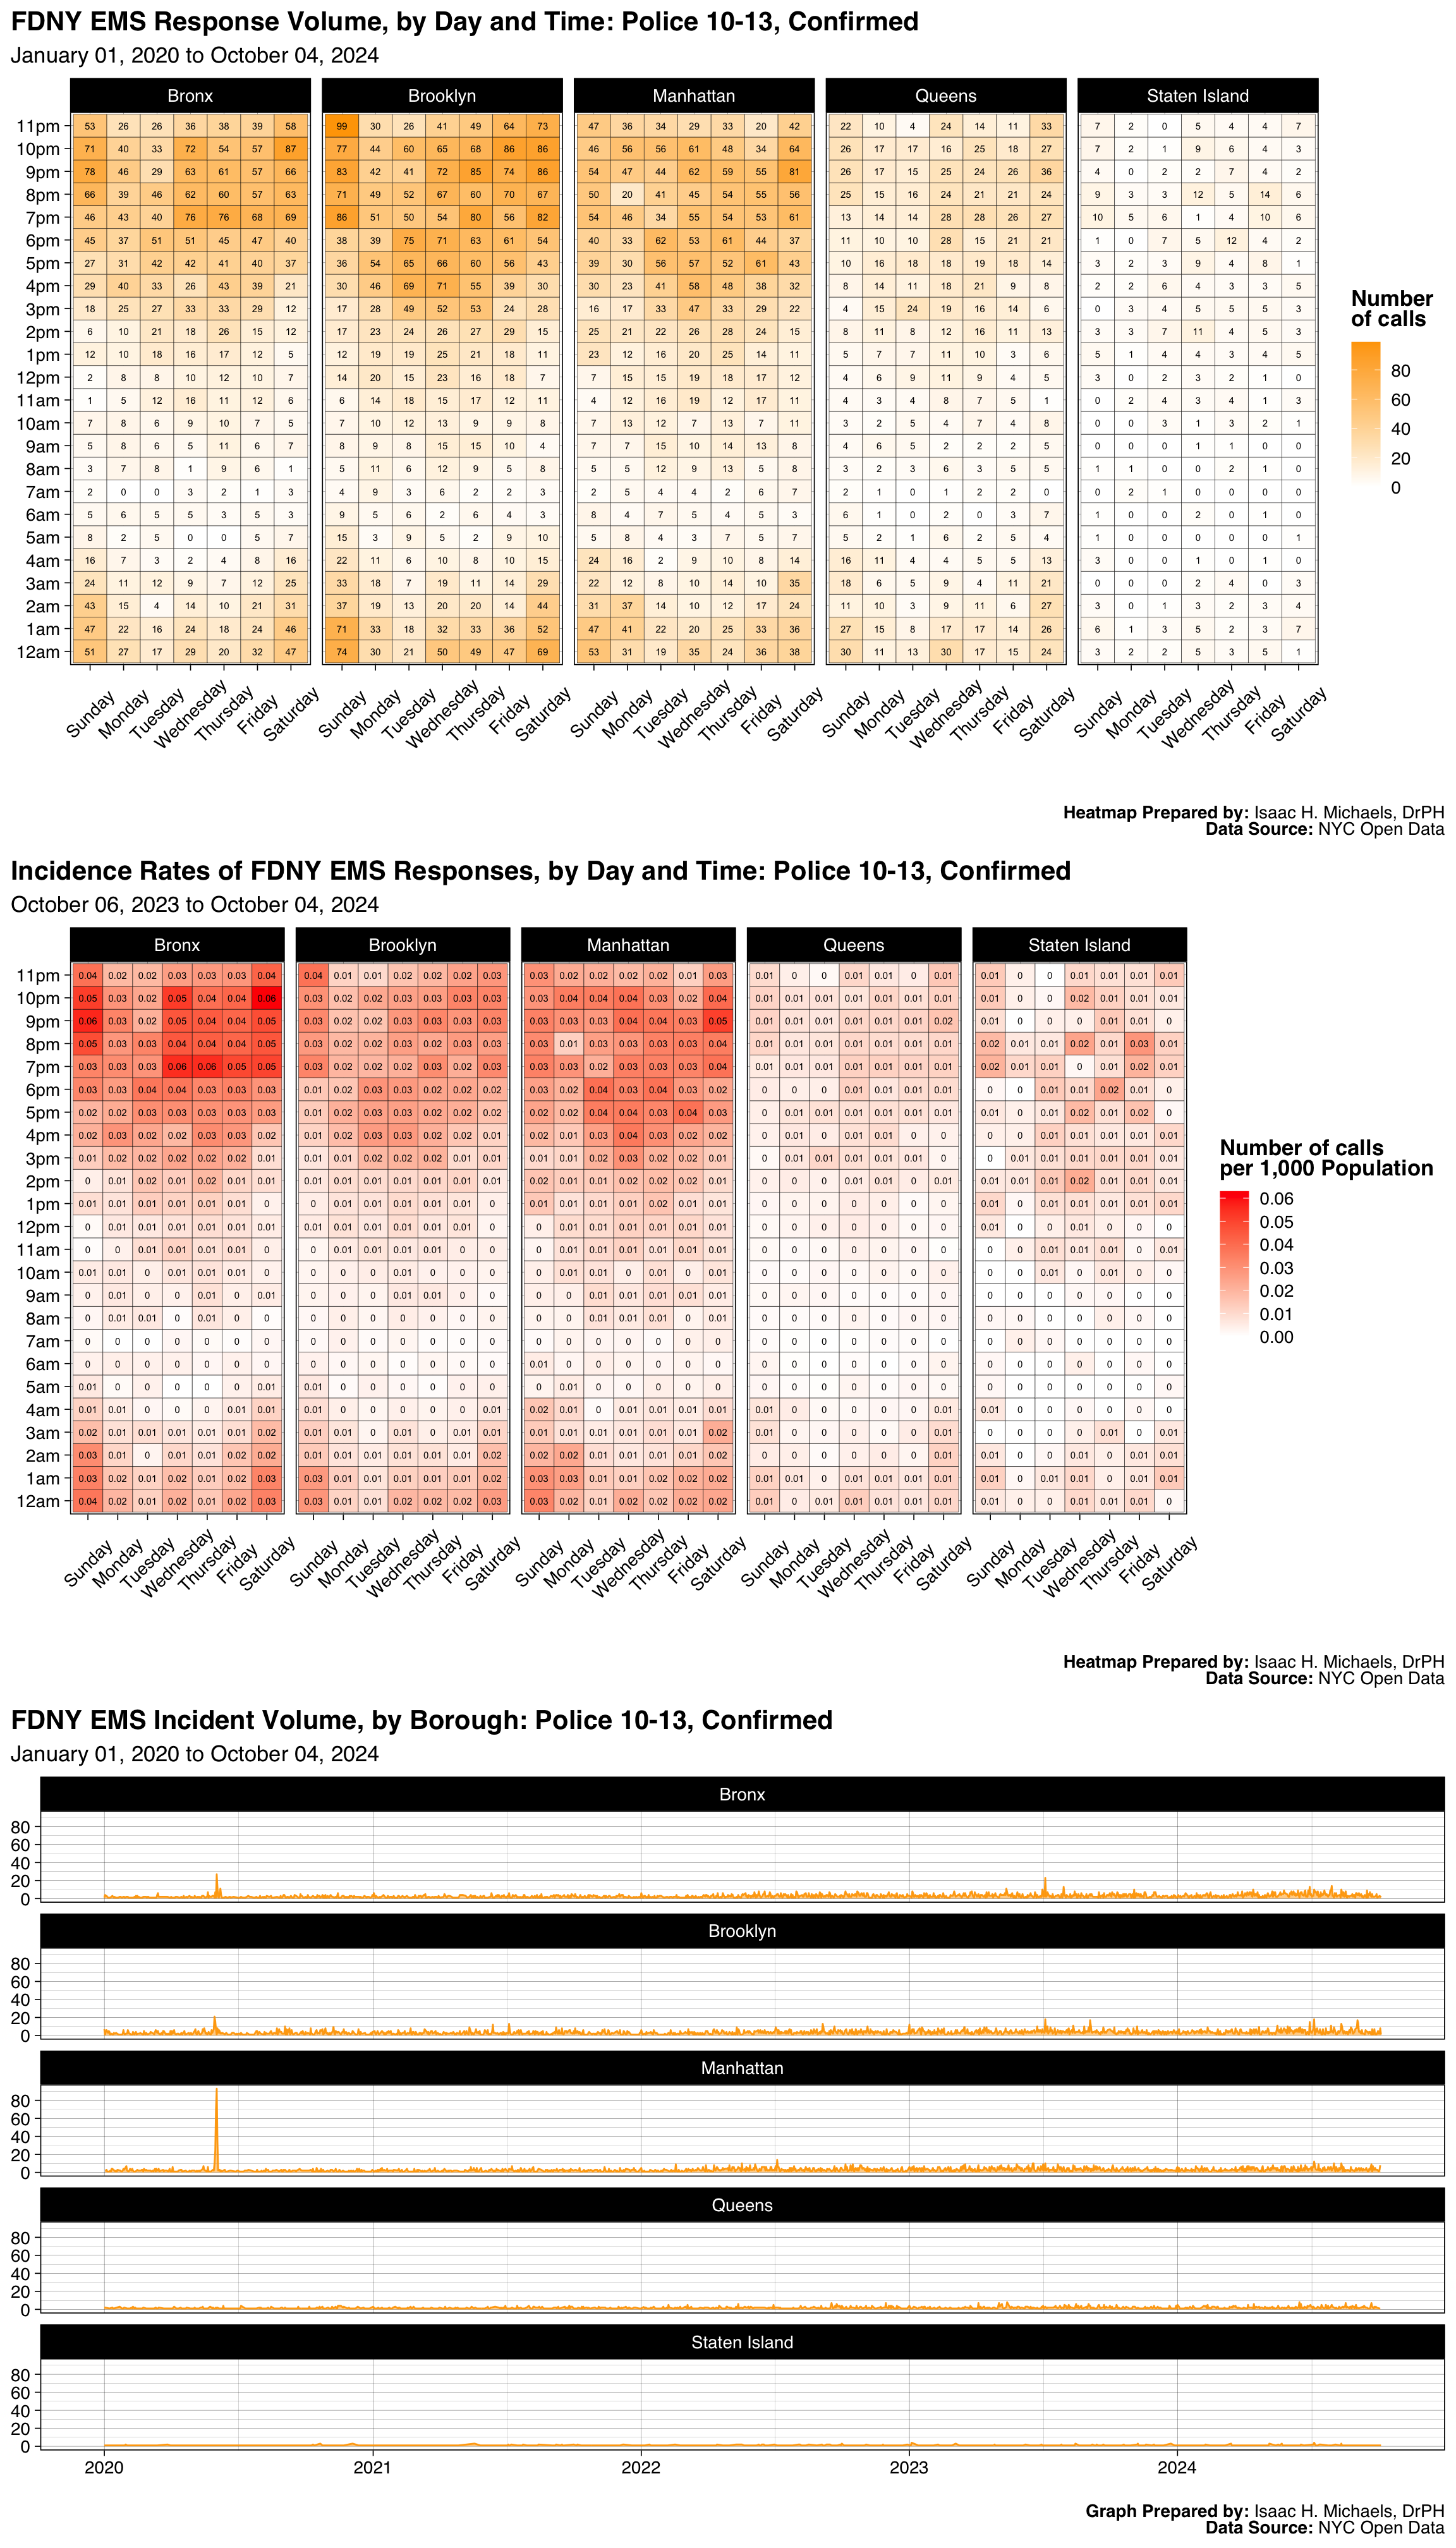
Graphs Prepared by: Isaac H. Michaels, DrPH
Data Source: NYC Open Data
| FDNY EMS Incident Volume, by Borough: Miscarriage |
||||||
| January 01, 2025 to July 01, 2026 | ||||||
| Borough |
Latest Year: 2026
|
All Years: 2025-2026
|
||||
|---|---|---|---|---|---|---|
| Incidents | % | Rate per 1,000 Population | Total Incidents | % | Monthly Trend | |
| Bronx | 324 | 36% | 0.2 | 991 | 34% | |
| Brooklyn | 229 | 25% | 0.1 | 827 | 28% | |
| Manhattan | 124 | 14% | 0.1 | 414 | 14% | |
| Queens | 193 | 21% | 0.1 | 609 | 21% | |
| Staten Island | 34 | 4% | 0.1 | 102 | 3% | |
| Table Prepred by: Isaac H. Michaels, DrPH | ||||||
| Data Source: NYC Open Data | ||||||
Table Prepared by: Isaac H. Michaels, DrPH
EMS Data Source: NYC Open Data
Population Data Source: Health Data NY
| FDNY EMS Incident Volume, by Severity Level: Miscarriage |
||||
| January 01, 2025 to July 01, 2026 | ||||
| Final Severity Level |
Latest Year: 2026
|
All Years: 2025-2026
|
||
|---|---|---|---|---|
| Incidents | % | Incidents | % | |
| 1 | 0 | 0% | 0 | 0% |
| 2 | 0 | 0% | 0 | 0% |
| 3 | 0 | 0% | 1 | 0% |
| 4 | 1 | 0% | 7 | 0% |
| 5 | 903 | 100% | 2,935 | 100% |
| 6 | 0 | 0% | 0 | 0% |
| 7 | 0 | 0% | 0 | 0% |
| 8 | 0 | 0% | 0 | 0% |
| Table Prepred by: Isaac H. Michaels, DrPH | ||||
| Data Source: NYC Open Data | ||||
Table Prepared by: Isaac H. Michaels, DrPH
Data Source: NYC Open Data
| FDNY EMS Incident Volume, by Disposition: Miscarriage |
||||
| January 01, 2025 to July 01, 2026 | ||||
| Disposition |
Latest Year: 2026
|
All Years: 2025-2026
|
||
|---|---|---|---|---|
| Incidents | % | Incidents | % | |
| Cancelled | 18 | 2% | 34 | 1% |
| Condition Corrected | 2 | 0% | 9 | 0% |
| Patient Gone on Arrival | 53 | 6% | 137 | 5% |
| Refused Medical Aid | 49 | 5% | 170 | 6% |
| Transporting Patient | 727 | 80% | 2,445 | 83% |
| Treated and Transported | 1 | 0% | 2 | 0% |
| Unfounded | 32 | 4% | 95 | 3% |
| NA | 22 | 2% | 51 | 2% |
| Table Prepred by: Isaac H. Michaels, DrPH | ||||
| Data Source: NYC Open Data | ||||
Table Prepared by: Isaac H. Michaels, DrPH
Data Source: NYC Open Data
Back to top
Hypertension

Map Prepared by: Isaac H. Michaels, DrPH
Data Source: NYC Open Data
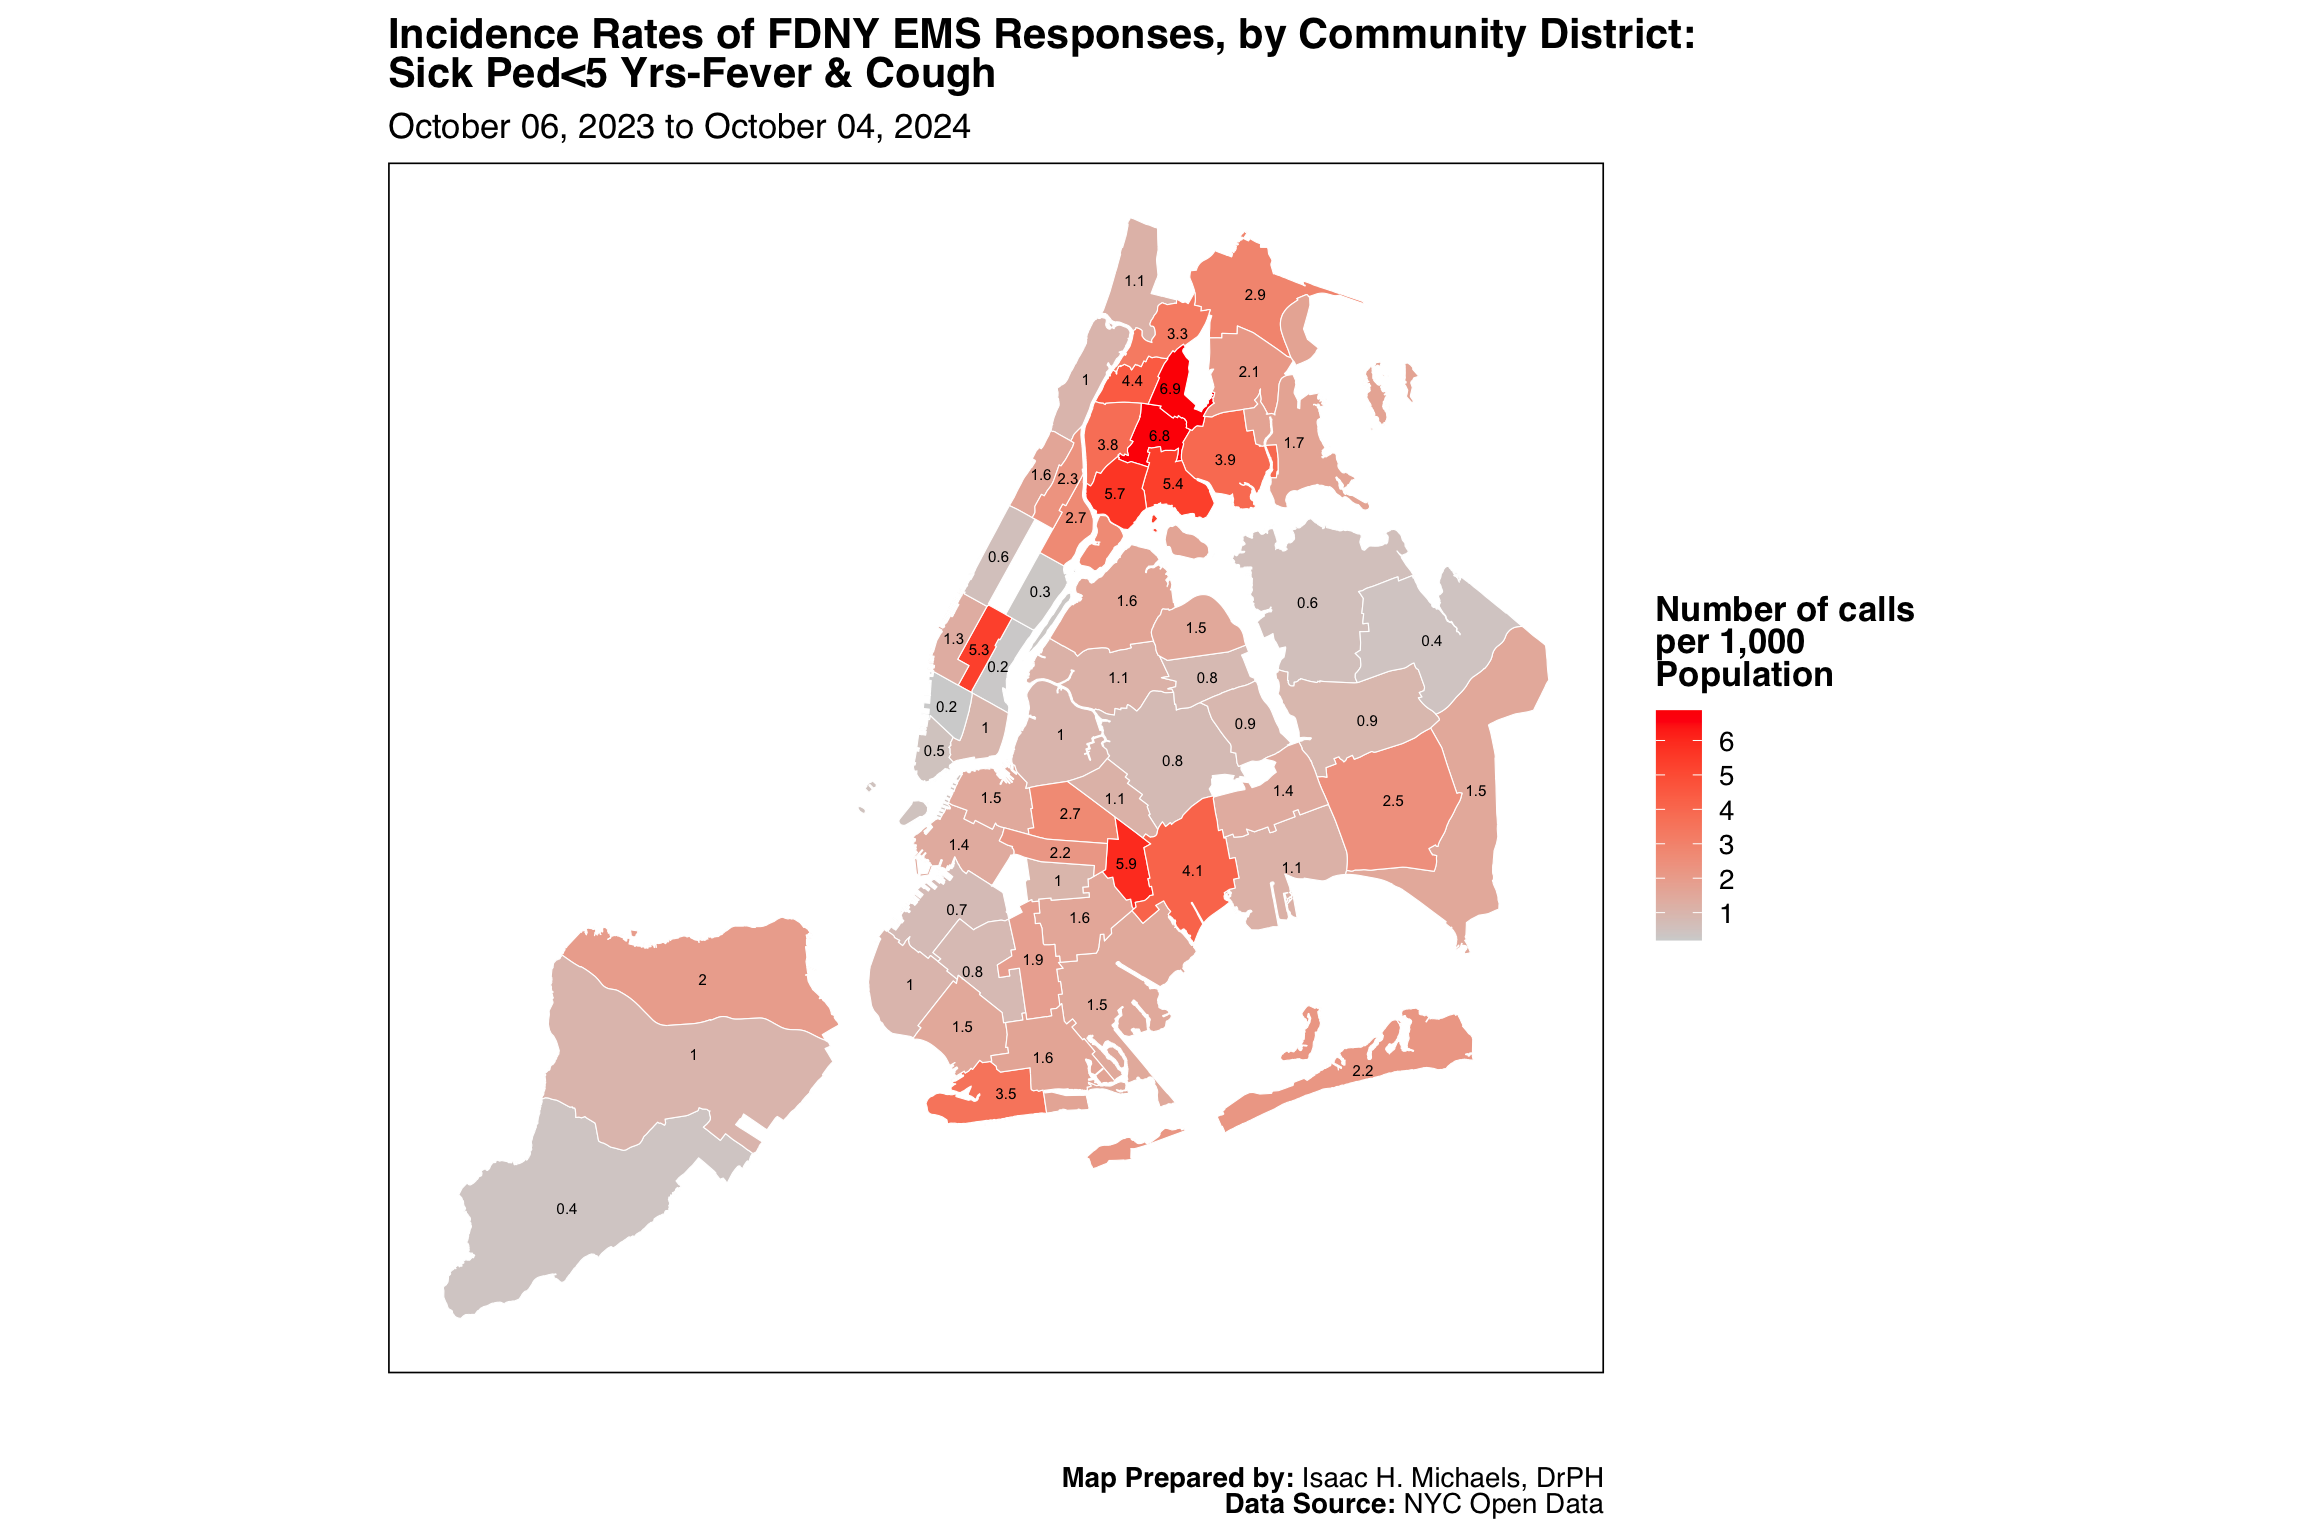
Map Prepared by: Isaac H. Michaels, DrPH
EMS Data Source: NYC Open Data
Population Data Source: NYC Open Data
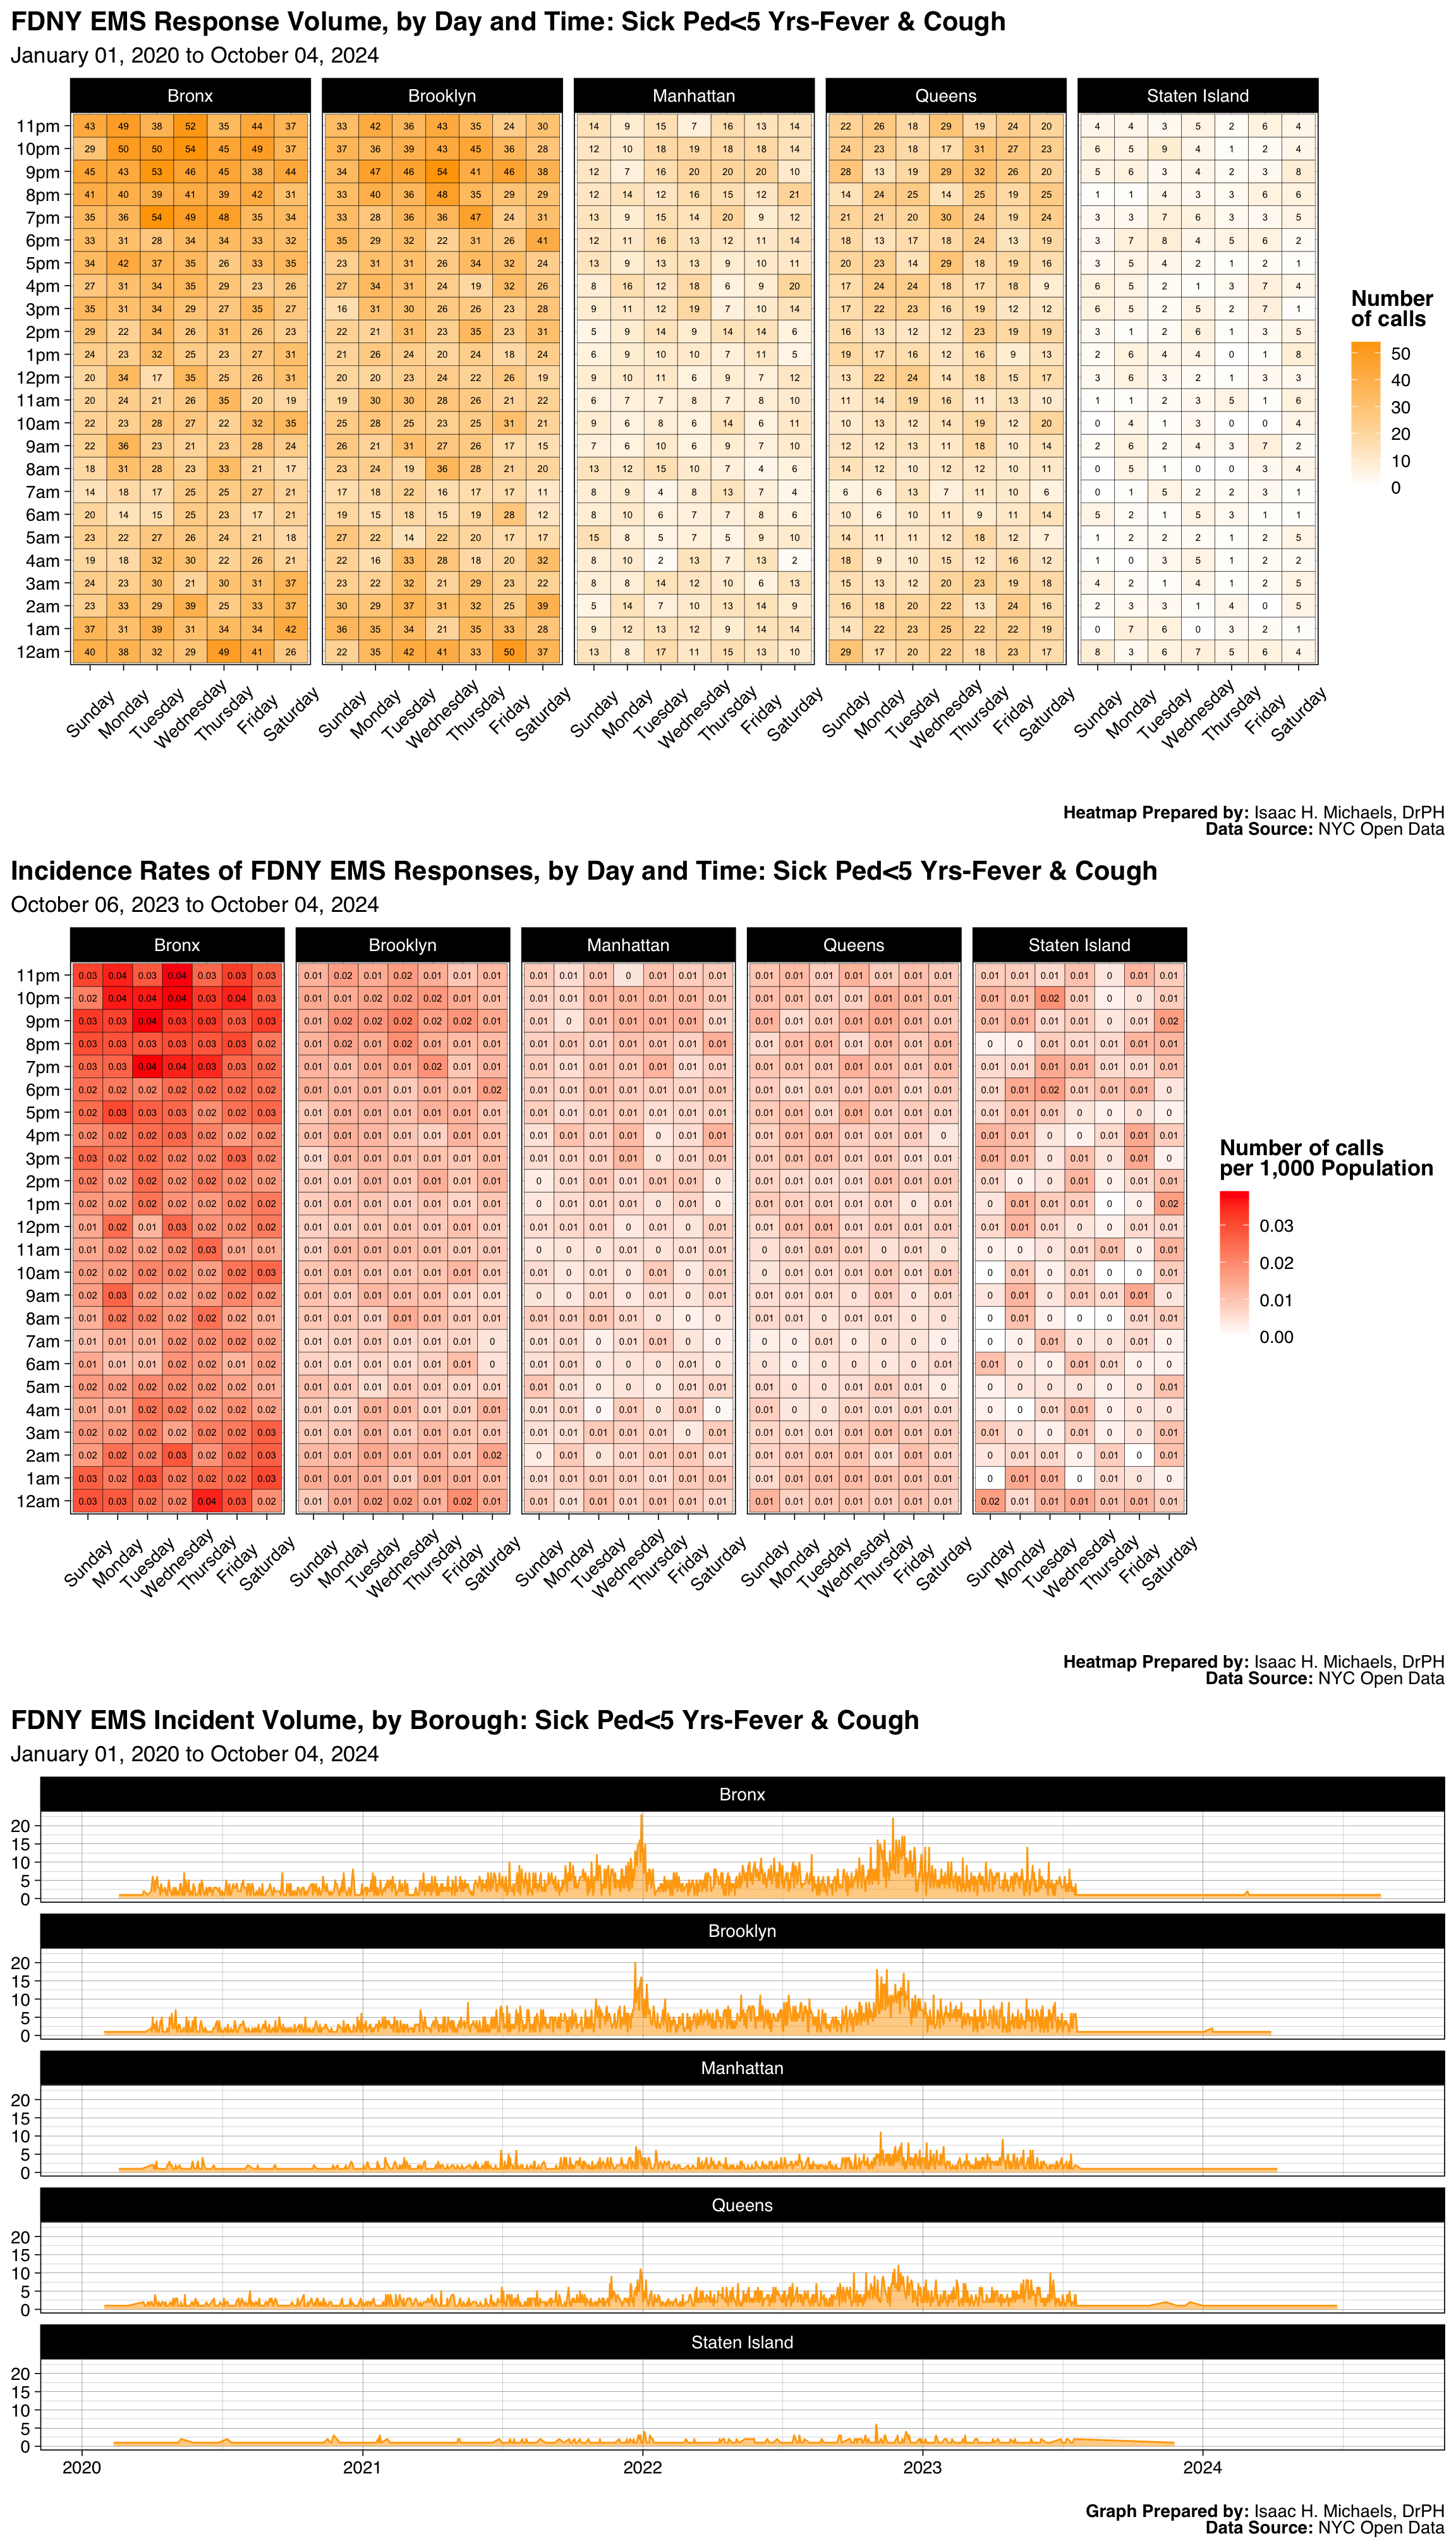
Graphs Prepared by: Isaac H. Michaels, DrPH
Data Source: NYC Open Data
| FDNY EMS Incident Volume, by Borough: Hypertension |
||||||
| January 01, 2025 to July 01, 2026 | ||||||
| Borough |
Latest Year: 2026
|
All Years: 2025-2026
|
||||
|---|---|---|---|---|---|---|
| Incidents | % | Rate per 1,000 Population | Total Incidents | % | Monthly Trend | |
| Bronx | 91 | 22% | 0.1 | 616 | 21% | |
| Brooklyn | 129 | 31% | 0.0 | 886 | 31% | |
| Manhattan | 88 | 21% | 0.1 | 629 | 22% | |
| Queens | 82 | 20% | 0.0 | 613 | 21% | |
| Staten Island | 21 | 5% | 0.0 | 123 | 4% | |
| Table Prepred by: Isaac H. Michaels, DrPH | ||||||
| Data Source: NYC Open Data | ||||||
Table Prepared by: Isaac H. Michaels, DrPH
EMS Data Source: NYC Open Data
Population Data Source: Health Data NY
| FDNY EMS Incident Volume, by Severity Level: Hypertension |
||||
| January 01, 2025 to July 01, 2026 | ||||
| Final Severity Level |
Latest Year: 2026
|
All Years: 2025-2026
|
||
|---|---|---|---|---|
| Incidents | % | Incidents | % | |
| 1 | 0 | 0% | 0 | 0% |
| 2 | 0 | 0% | 0 | 0% |
| 3 | 3 | 1% | 8 | 0% |
| 4 | 1 | 0% | 10 | 0% |
| 5 | 0 | 0% | 0 | 0% |
| 6 | 1 | 0% | 2 | 0% |
| 7 | 406 | 99% | 2,847 | 99% |
| 8 | 0 | 0% | 0 | 0% |
| Table Prepred by: Isaac H. Michaels, DrPH | ||||
| Data Source: NYC Open Data | ||||
Table Prepared by: Isaac H. Michaels, DrPH
Data Source: NYC Open Data
| FDNY EMS Incident Volume, by Disposition: Hypertension |
||||
| January 01, 2025 to July 01, 2026 | ||||
| Disposition |
Latest Year: 2026
|
All Years: 2025-2026
|
||
|---|---|---|---|---|
| Incidents | % | Incidents | % | |
| Cancelled | 16 | 4% | 56 | 2% |
| Condition Corrected | 2 | 0% | 11 | 0% |
| Patient Gone on Arrival | 17 | 4% | 70 | 2% |
| Refused Medical Aid | 110 | 27% | 909 | 32% |
| Transporting Patient | 214 | 52% | 1,658 | 58% |
| Treated and Transported | 1 | 0% | 3 | 0% |
| Unfounded | 18 | 4% | 62 | 2% |
| NA | 33 | 8% | 98 | 3% |
| Table Prepred by: Isaac H. Michaels, DrPH | ||||
| Data Source: NYC Open Data | ||||
Table Prepared by: Isaac H. Michaels, DrPH
Data Source: NYC Open Data
Back to top
Inhalation Of Smoke
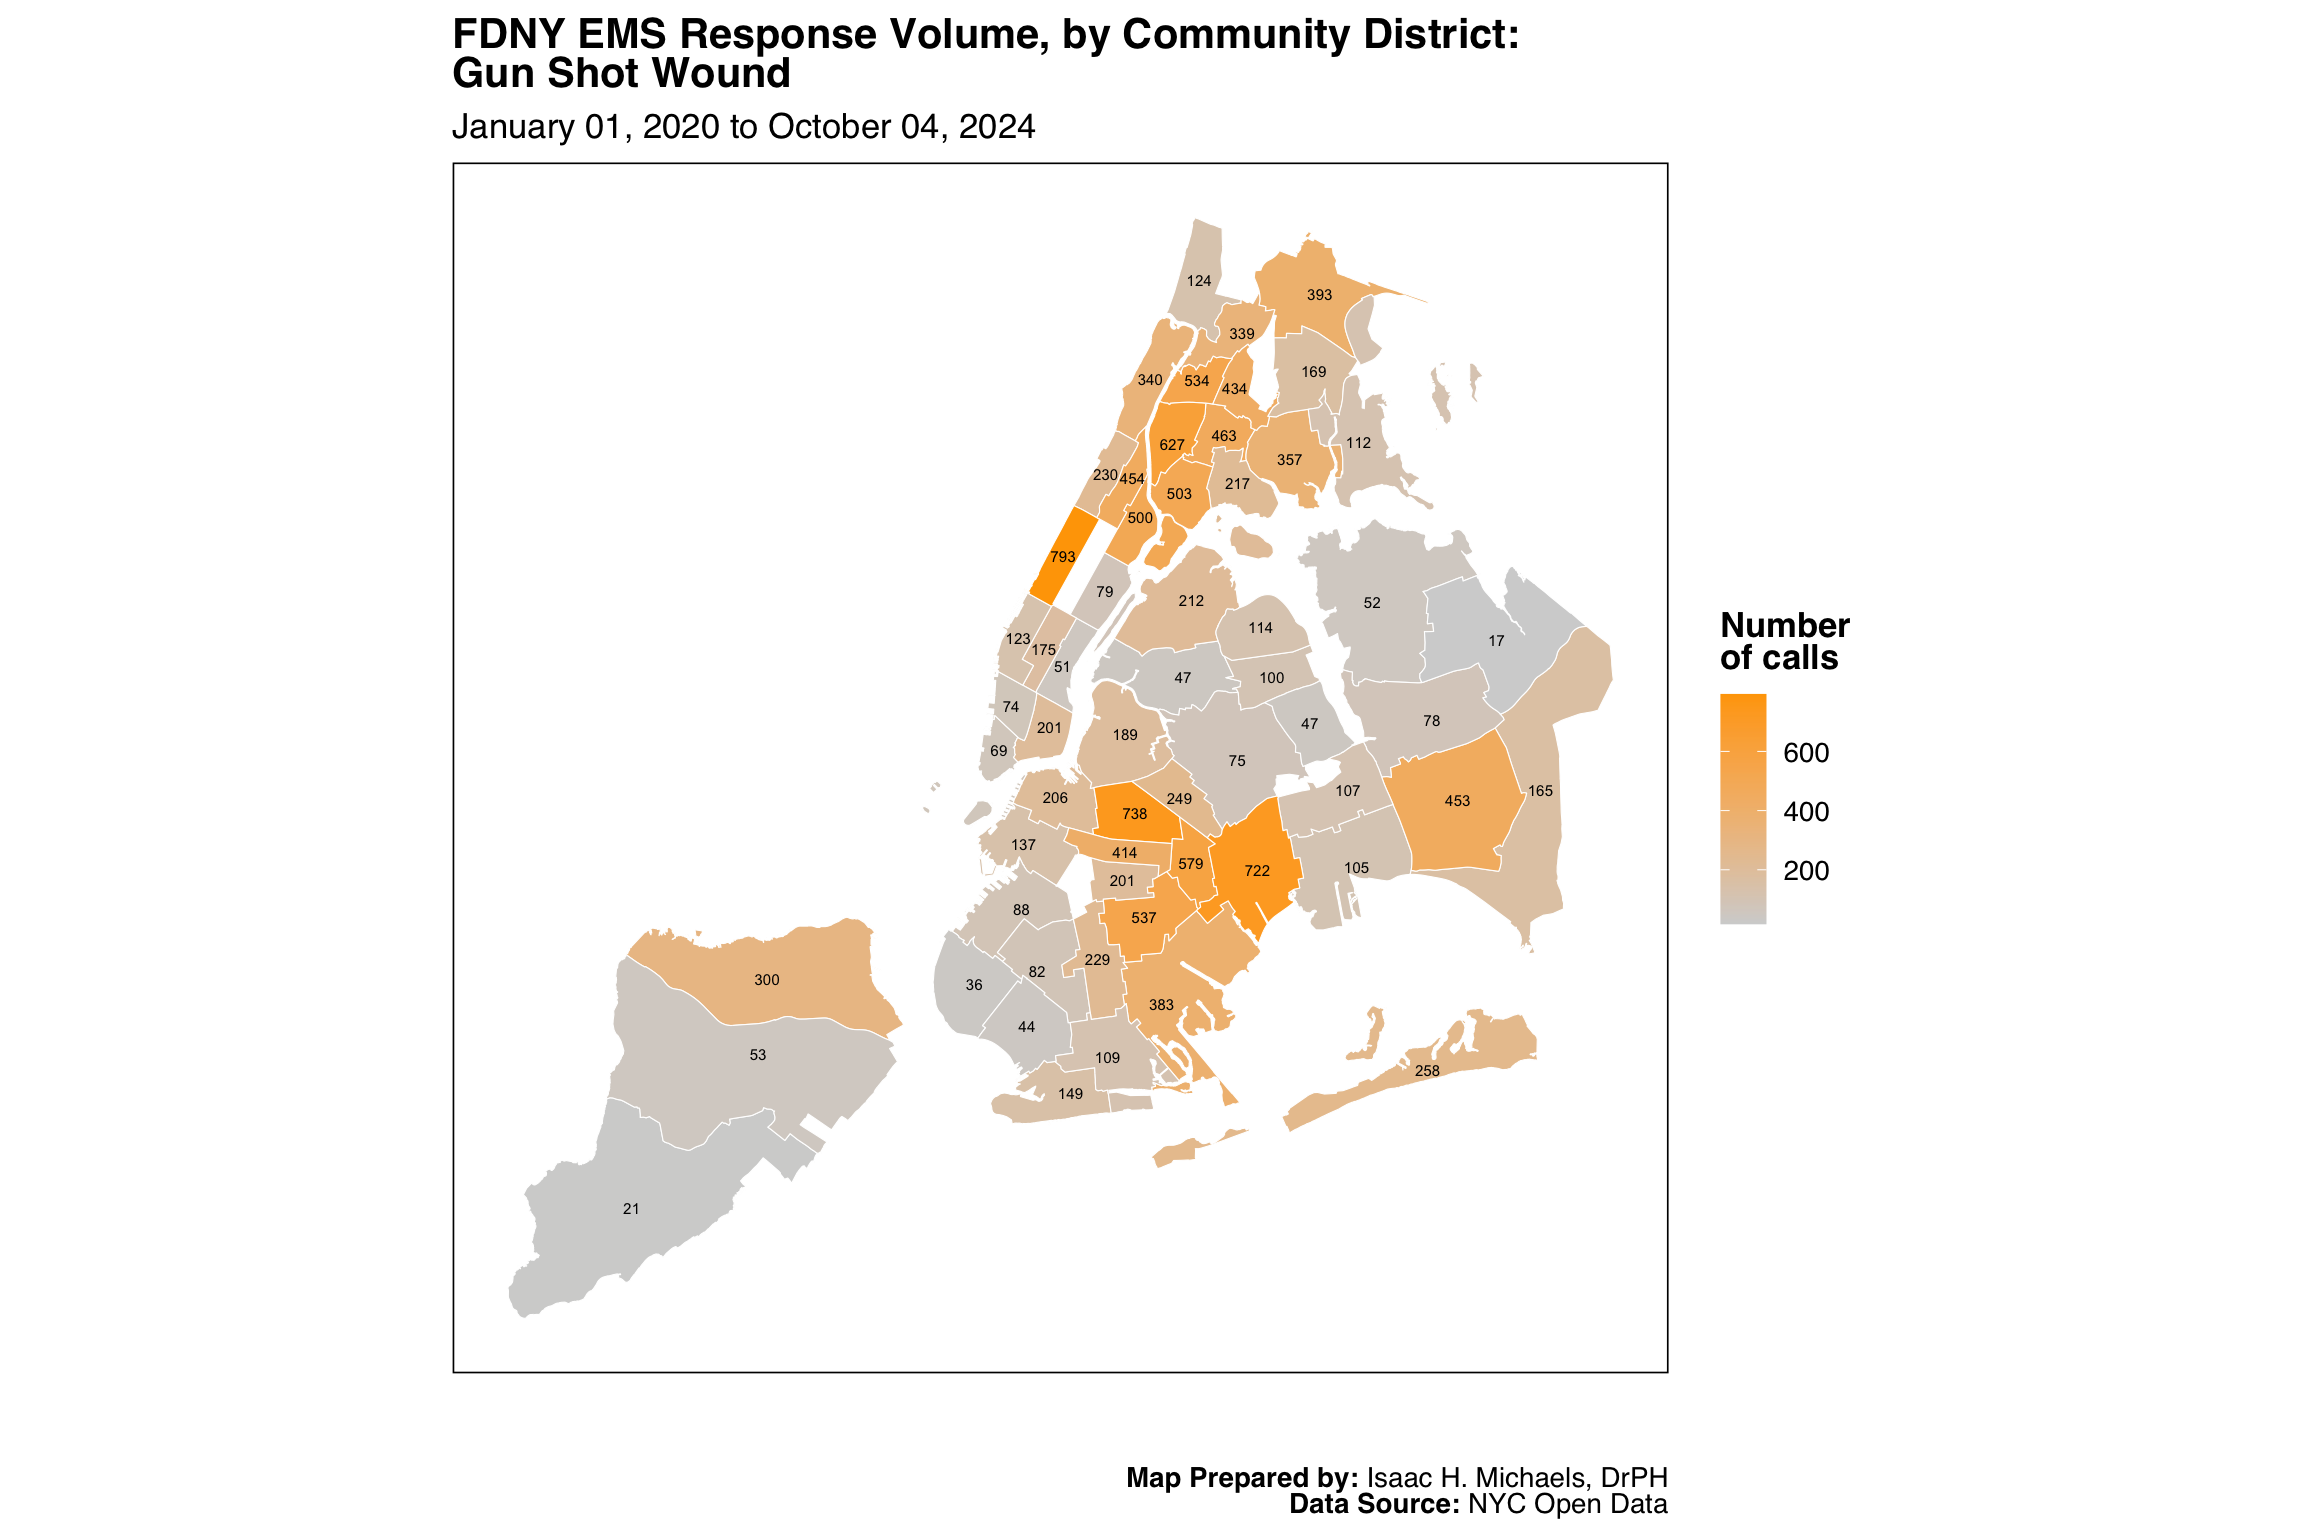
Map Prepared by: Isaac H. Michaels, DrPH
Data Source: NYC Open Data

Map Prepared by: Isaac H. Michaels, DrPH
EMS Data Source: NYC Open Data
Population Data Source: NYC Open Data
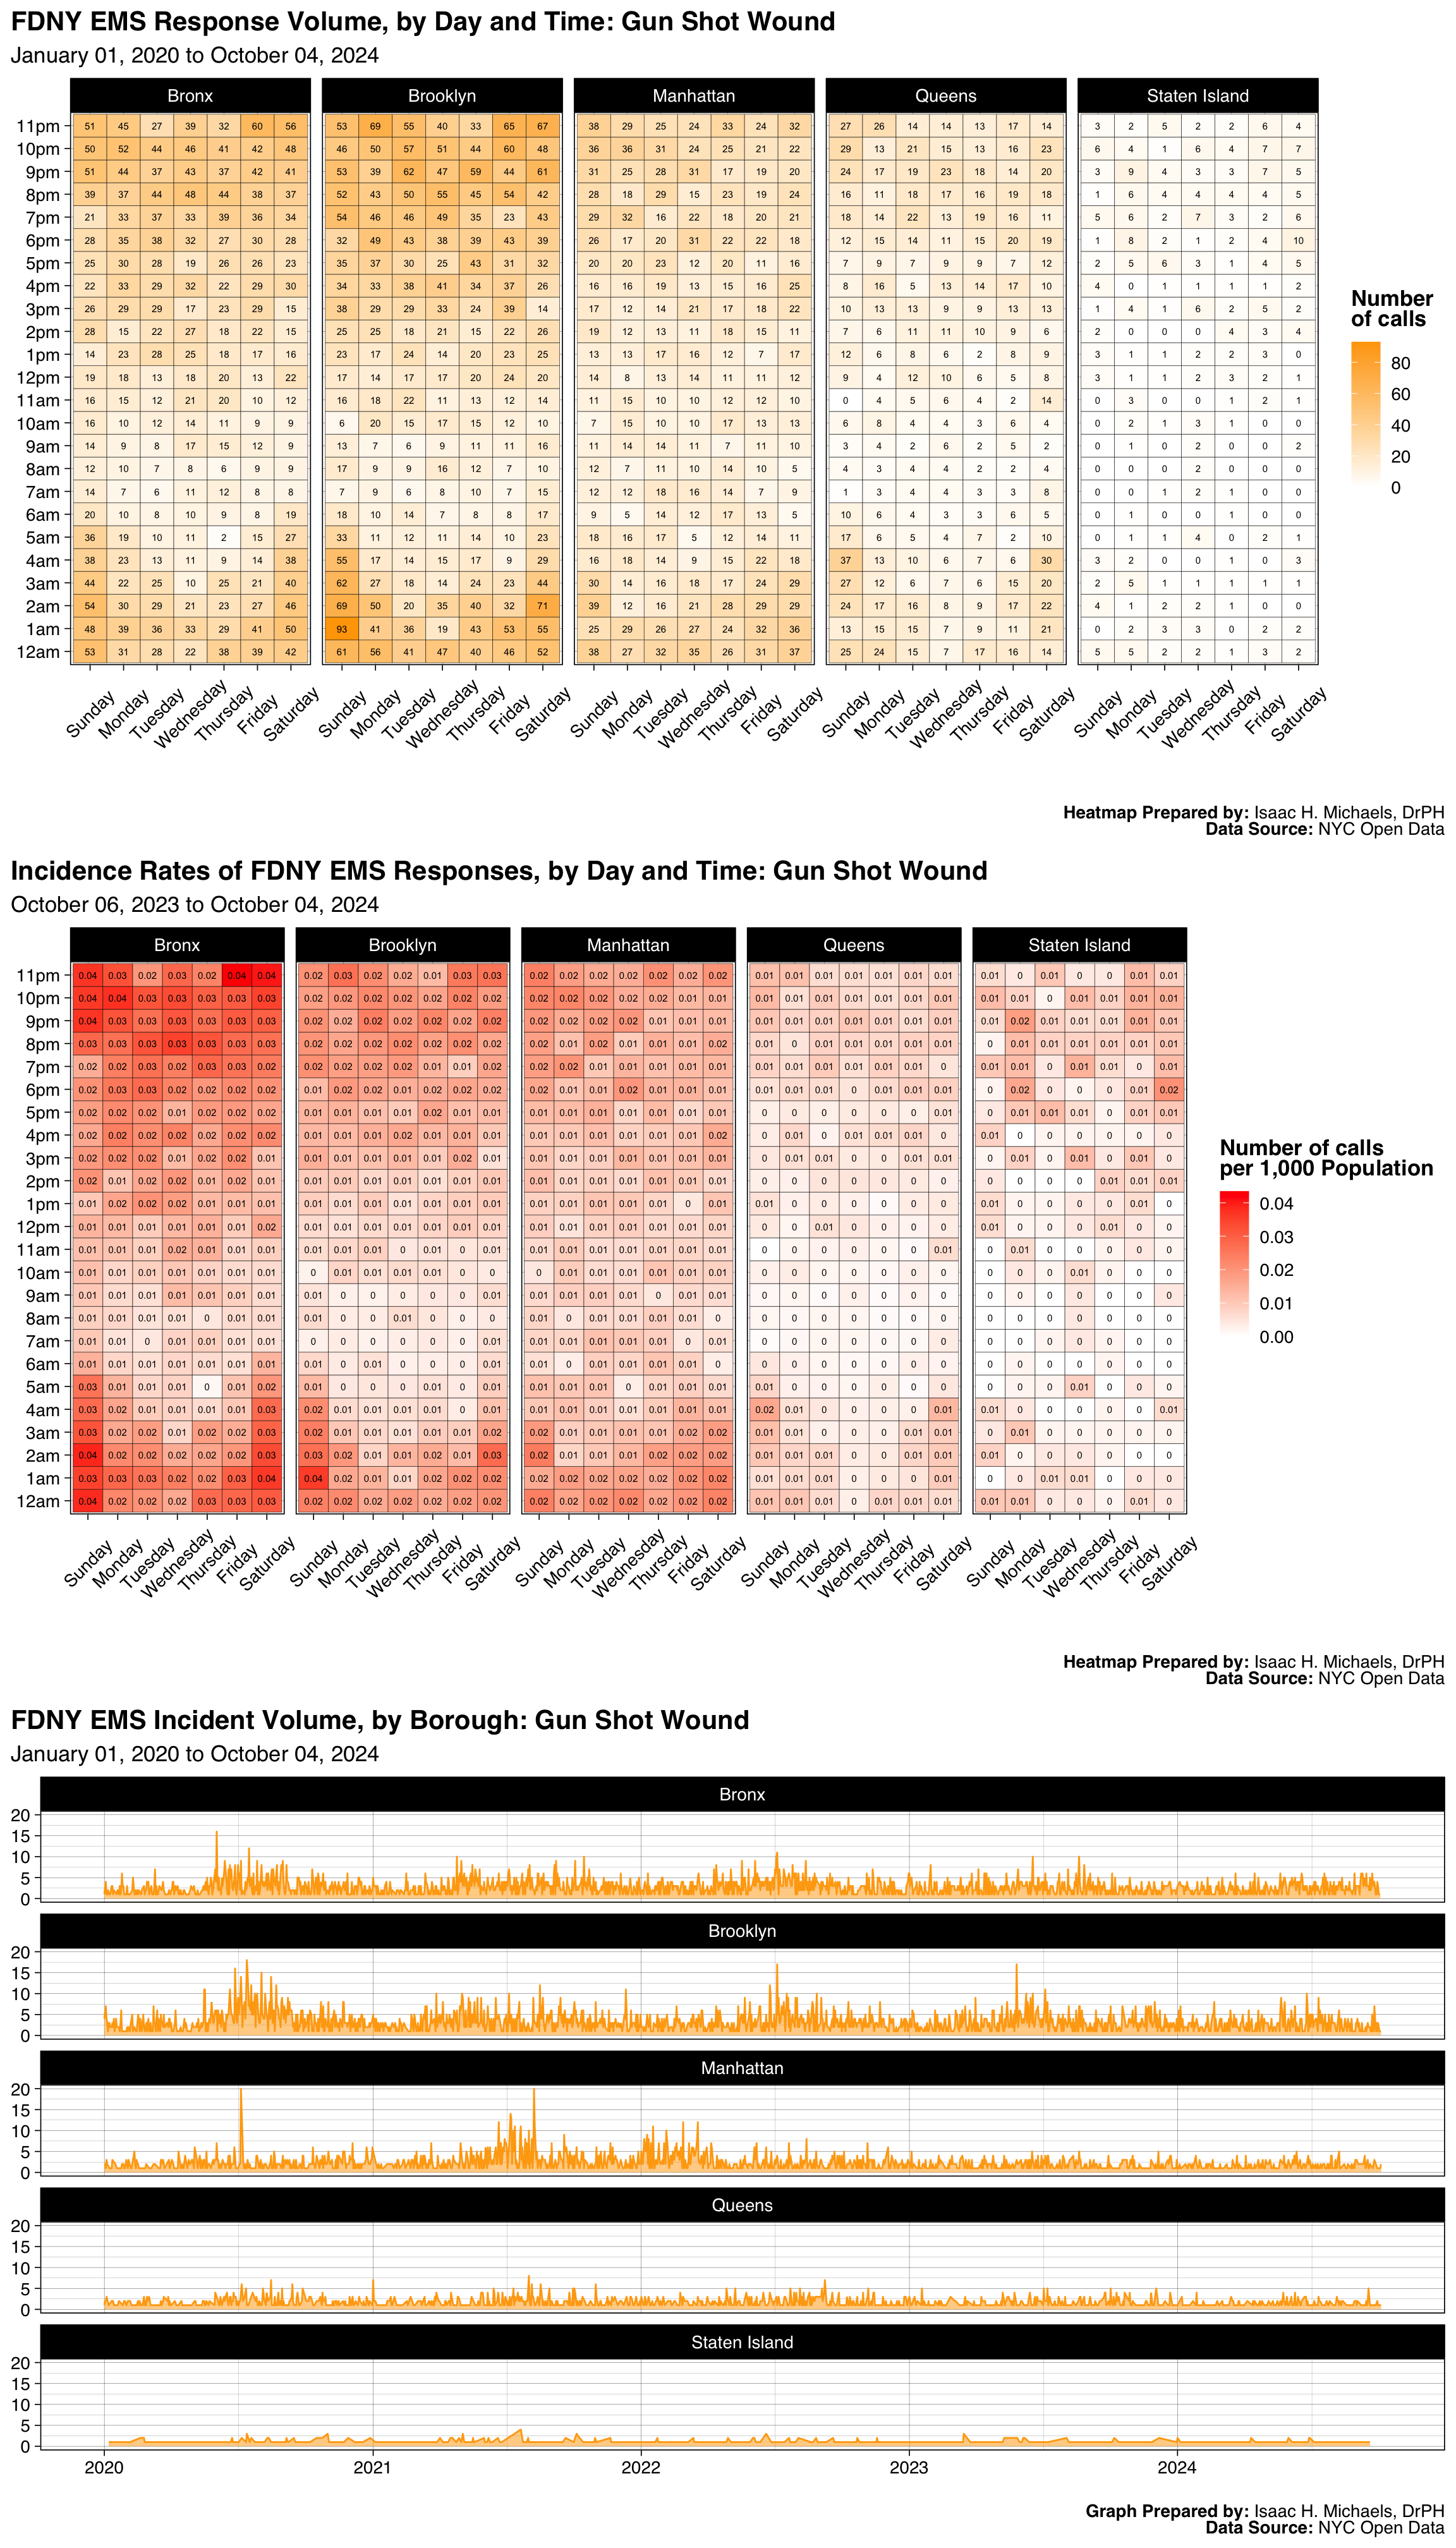
Graphs Prepared by: Isaac H. Michaels, DrPH
Data Source: NYC Open Data
| FDNY EMS Incident Volume, by Borough: Inhalation Of Smoke |
||||||
| January 01, 2025 to July 01, 2026 | ||||||
| Borough |
Latest Year: 2026
|
All Years: 2025-2026
|
||||
|---|---|---|---|---|---|---|
| Incidents | % | Rate per 1,000 Population | Total Incidents | % | Monthly Trend | |
| Bronx | 225 | 22% | 0.2 | 661 | 24% | |
| Brooklyn | 280 | 28% | 0.1 | 792 | 29% | |
| Manhattan | 223 | 22% | 0.1 | 605 | 22% | |
| Queens | 231 | 23% | 0.1 | 566 | 21% | |
| Staten Island | 58 | 6% | 0.1 | 122 | 4% | |
| Table Prepred by: Isaac H. Michaels, DrPH | ||||||
| Data Source: NYC Open Data | ||||||
Table Prepared by: Isaac H. Michaels, DrPH
EMS Data Source: NYC Open Data
Population Data Source: Health Data NY
| FDNY EMS Incident Volume, by Severity Level: Inhalation Of Smoke |
||||
| January 01, 2025 to July 01, 2026 | ||||
| Final Severity Level |
Latest Year: 2026
|
All Years: 2025-2026
|
||
|---|---|---|---|---|
| Incidents | % | Incidents | % | |
| 1 | 0 | 0% | 0 | 0% |
| 2 | 0 | 0% | 0 | 0% |
| 3 | 0 | 0% | 1 | 0% |
| 4 | 16 | 2% | 46 | 2% |
| 5 | 1,001 | 98% | 2,699 | 98% |
| 6 | 0 | 0% | 0 | 0% |
| 7 | 0 | 0% | 0 | 0% |
| 8 | 0 | 0% | 0 | 0% |
| Table Prepred by: Isaac H. Michaels, DrPH | ||||
| Data Source: NYC Open Data | ||||
Table Prepared by: Isaac H. Michaels, DrPH
Data Source: NYC Open Data
| FDNY EMS Incident Volume, by Disposition: Inhalation Of Smoke |
||||
| January 01, 2025 to July 01, 2026 | ||||
| Disposition |
Latest Year: 2026
|
All Years: 2025-2026
|
||
|---|---|---|---|---|
| Incidents | % | Incidents | % | |
| Cancelled | 57 | 6% | 139 | 5% |
| Condition Corrected | 123 | 12% | 373 | 14% |
| Patient Gone on Arrival | 31 | 3% | 70 | 3% |
| Patient Pronounced Dead | 1 | 0% | 9 | 0% |
| Refused Medical Aid | 361 | 35% | 938 | 34% |
| Transporting Patient | 190 | 19% | 561 | 20% |
| Treated and Transported | 1 | 0% | 5 | 0% |
| Unfounded | 172 | 17% | 510 | 19% |
| NA | 81 | 8% | 141 | 5% |
| Table Prepred by: Isaac H. Michaels, DrPH | ||||
| Data Source: NYC Open Data | ||||
Table Prepared by: Isaac H. Michaels, DrPH
Data Source: NYC Open Data
Back to top
One Alarm Fire
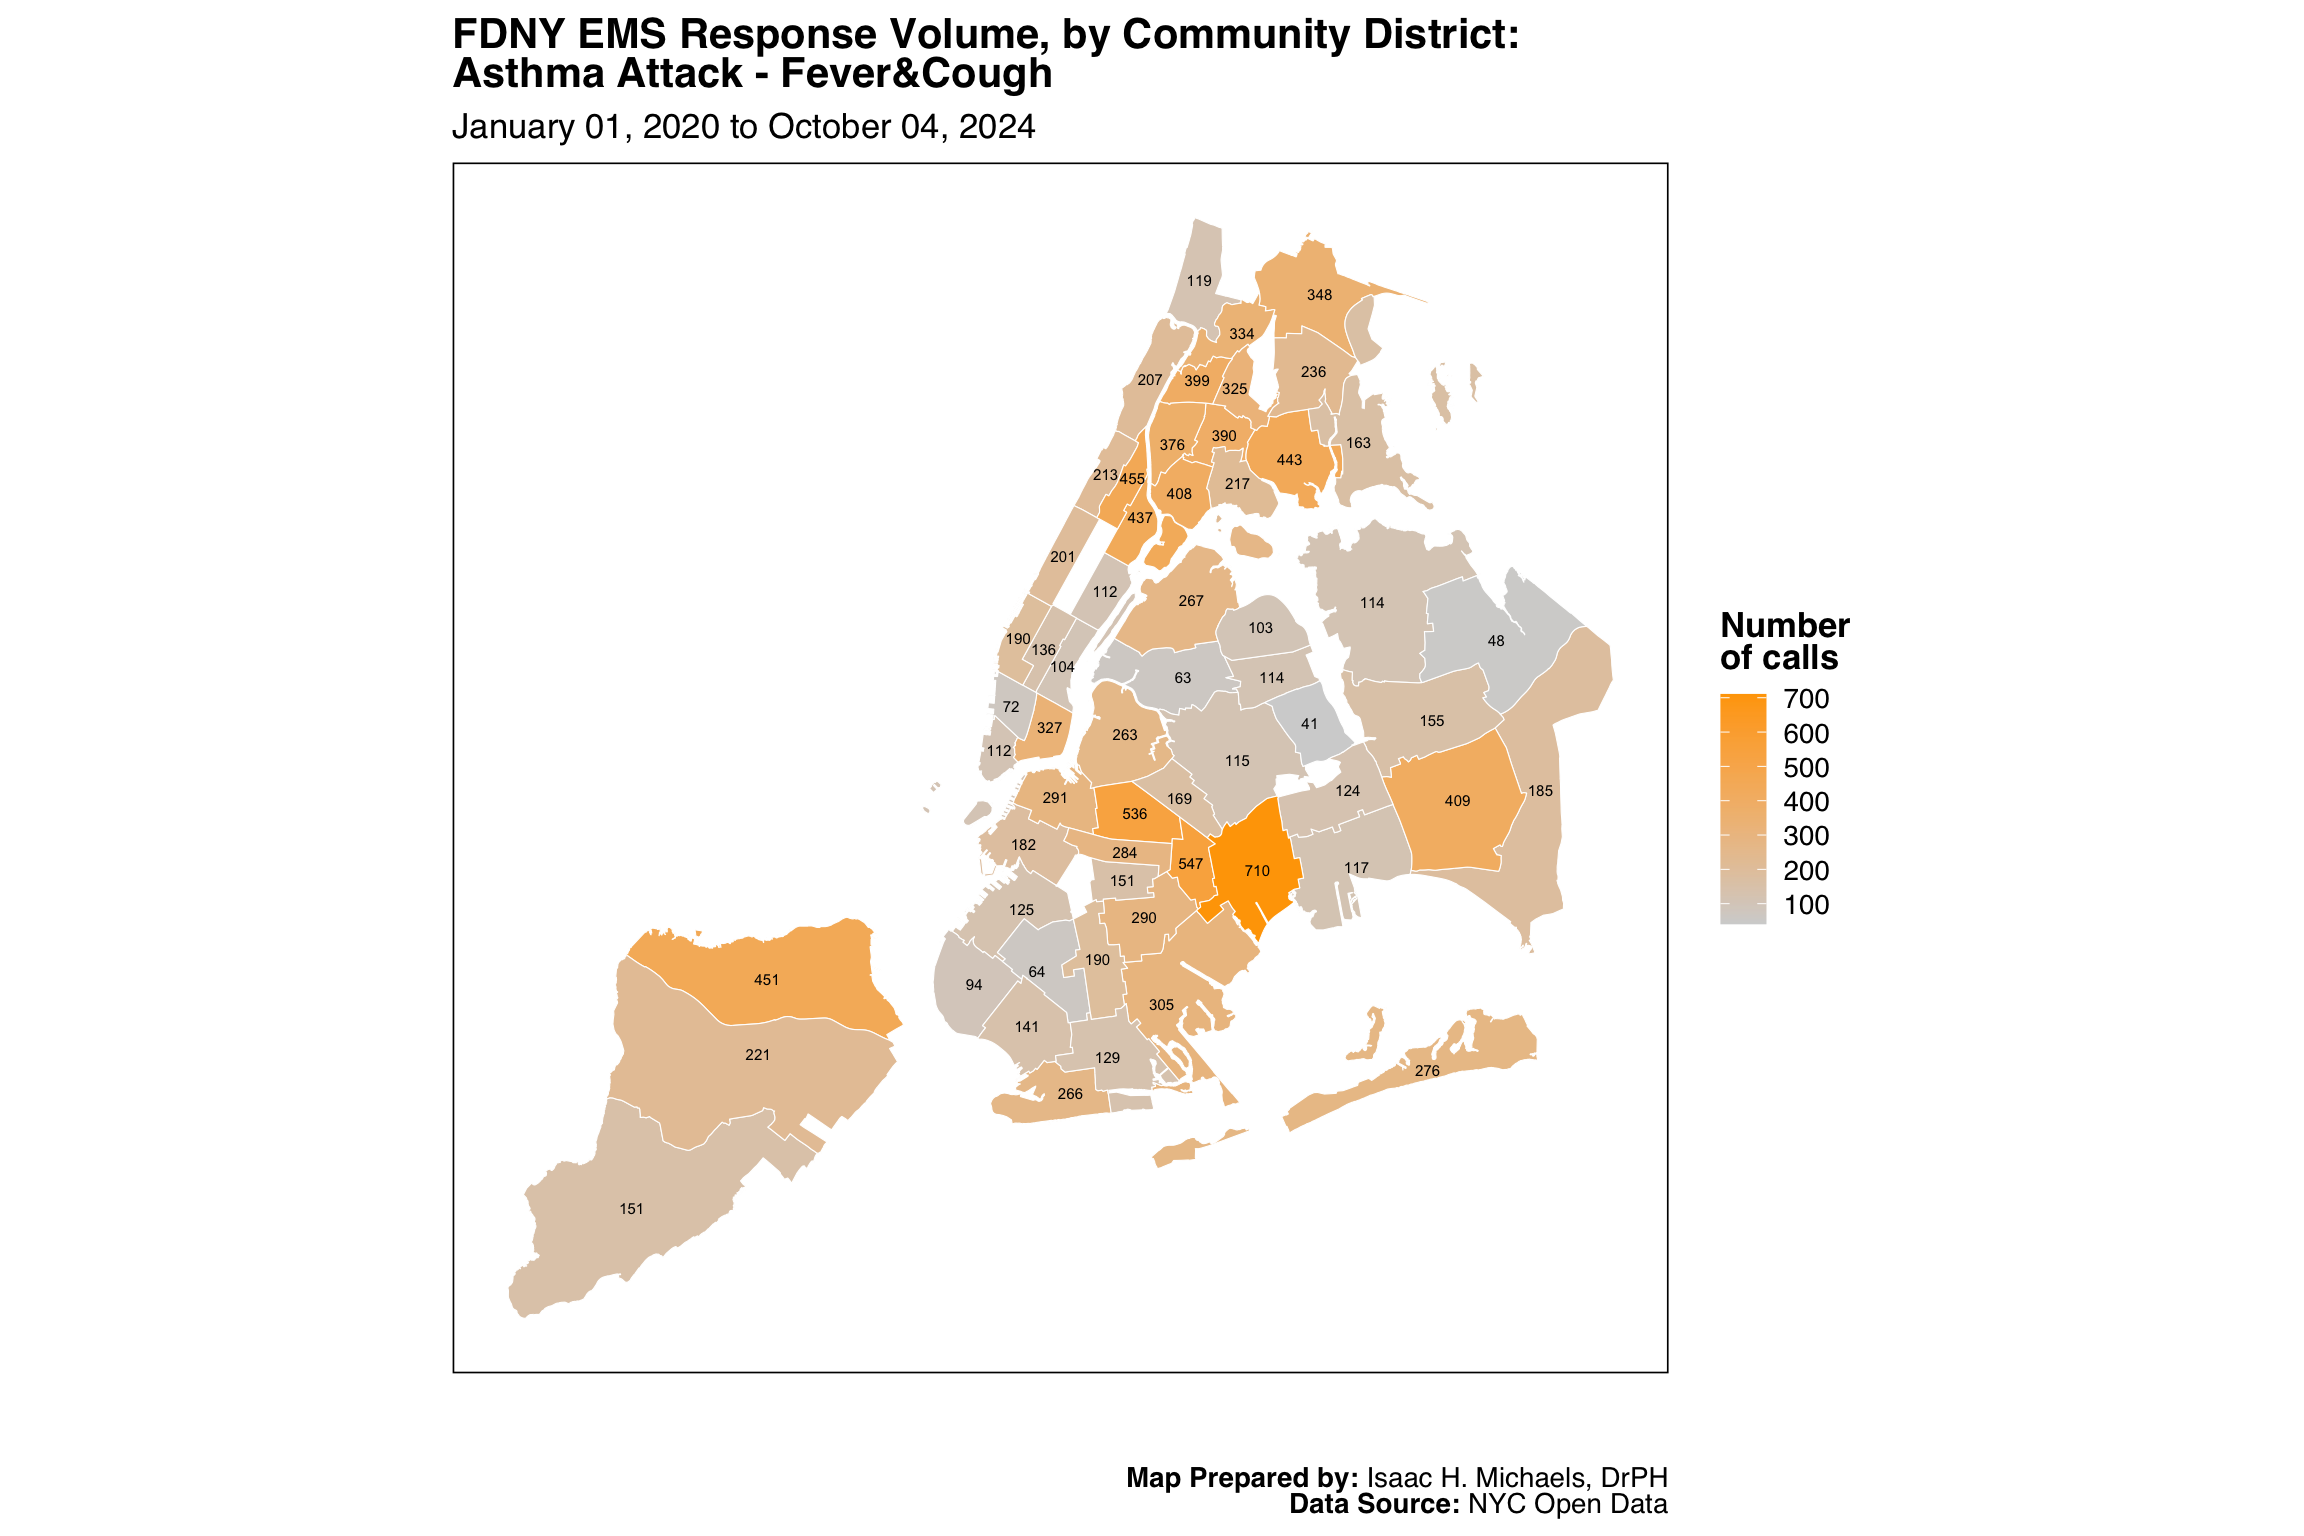
Map Prepared by: Isaac H. Michaels, DrPH
Data Source: NYC Open Data
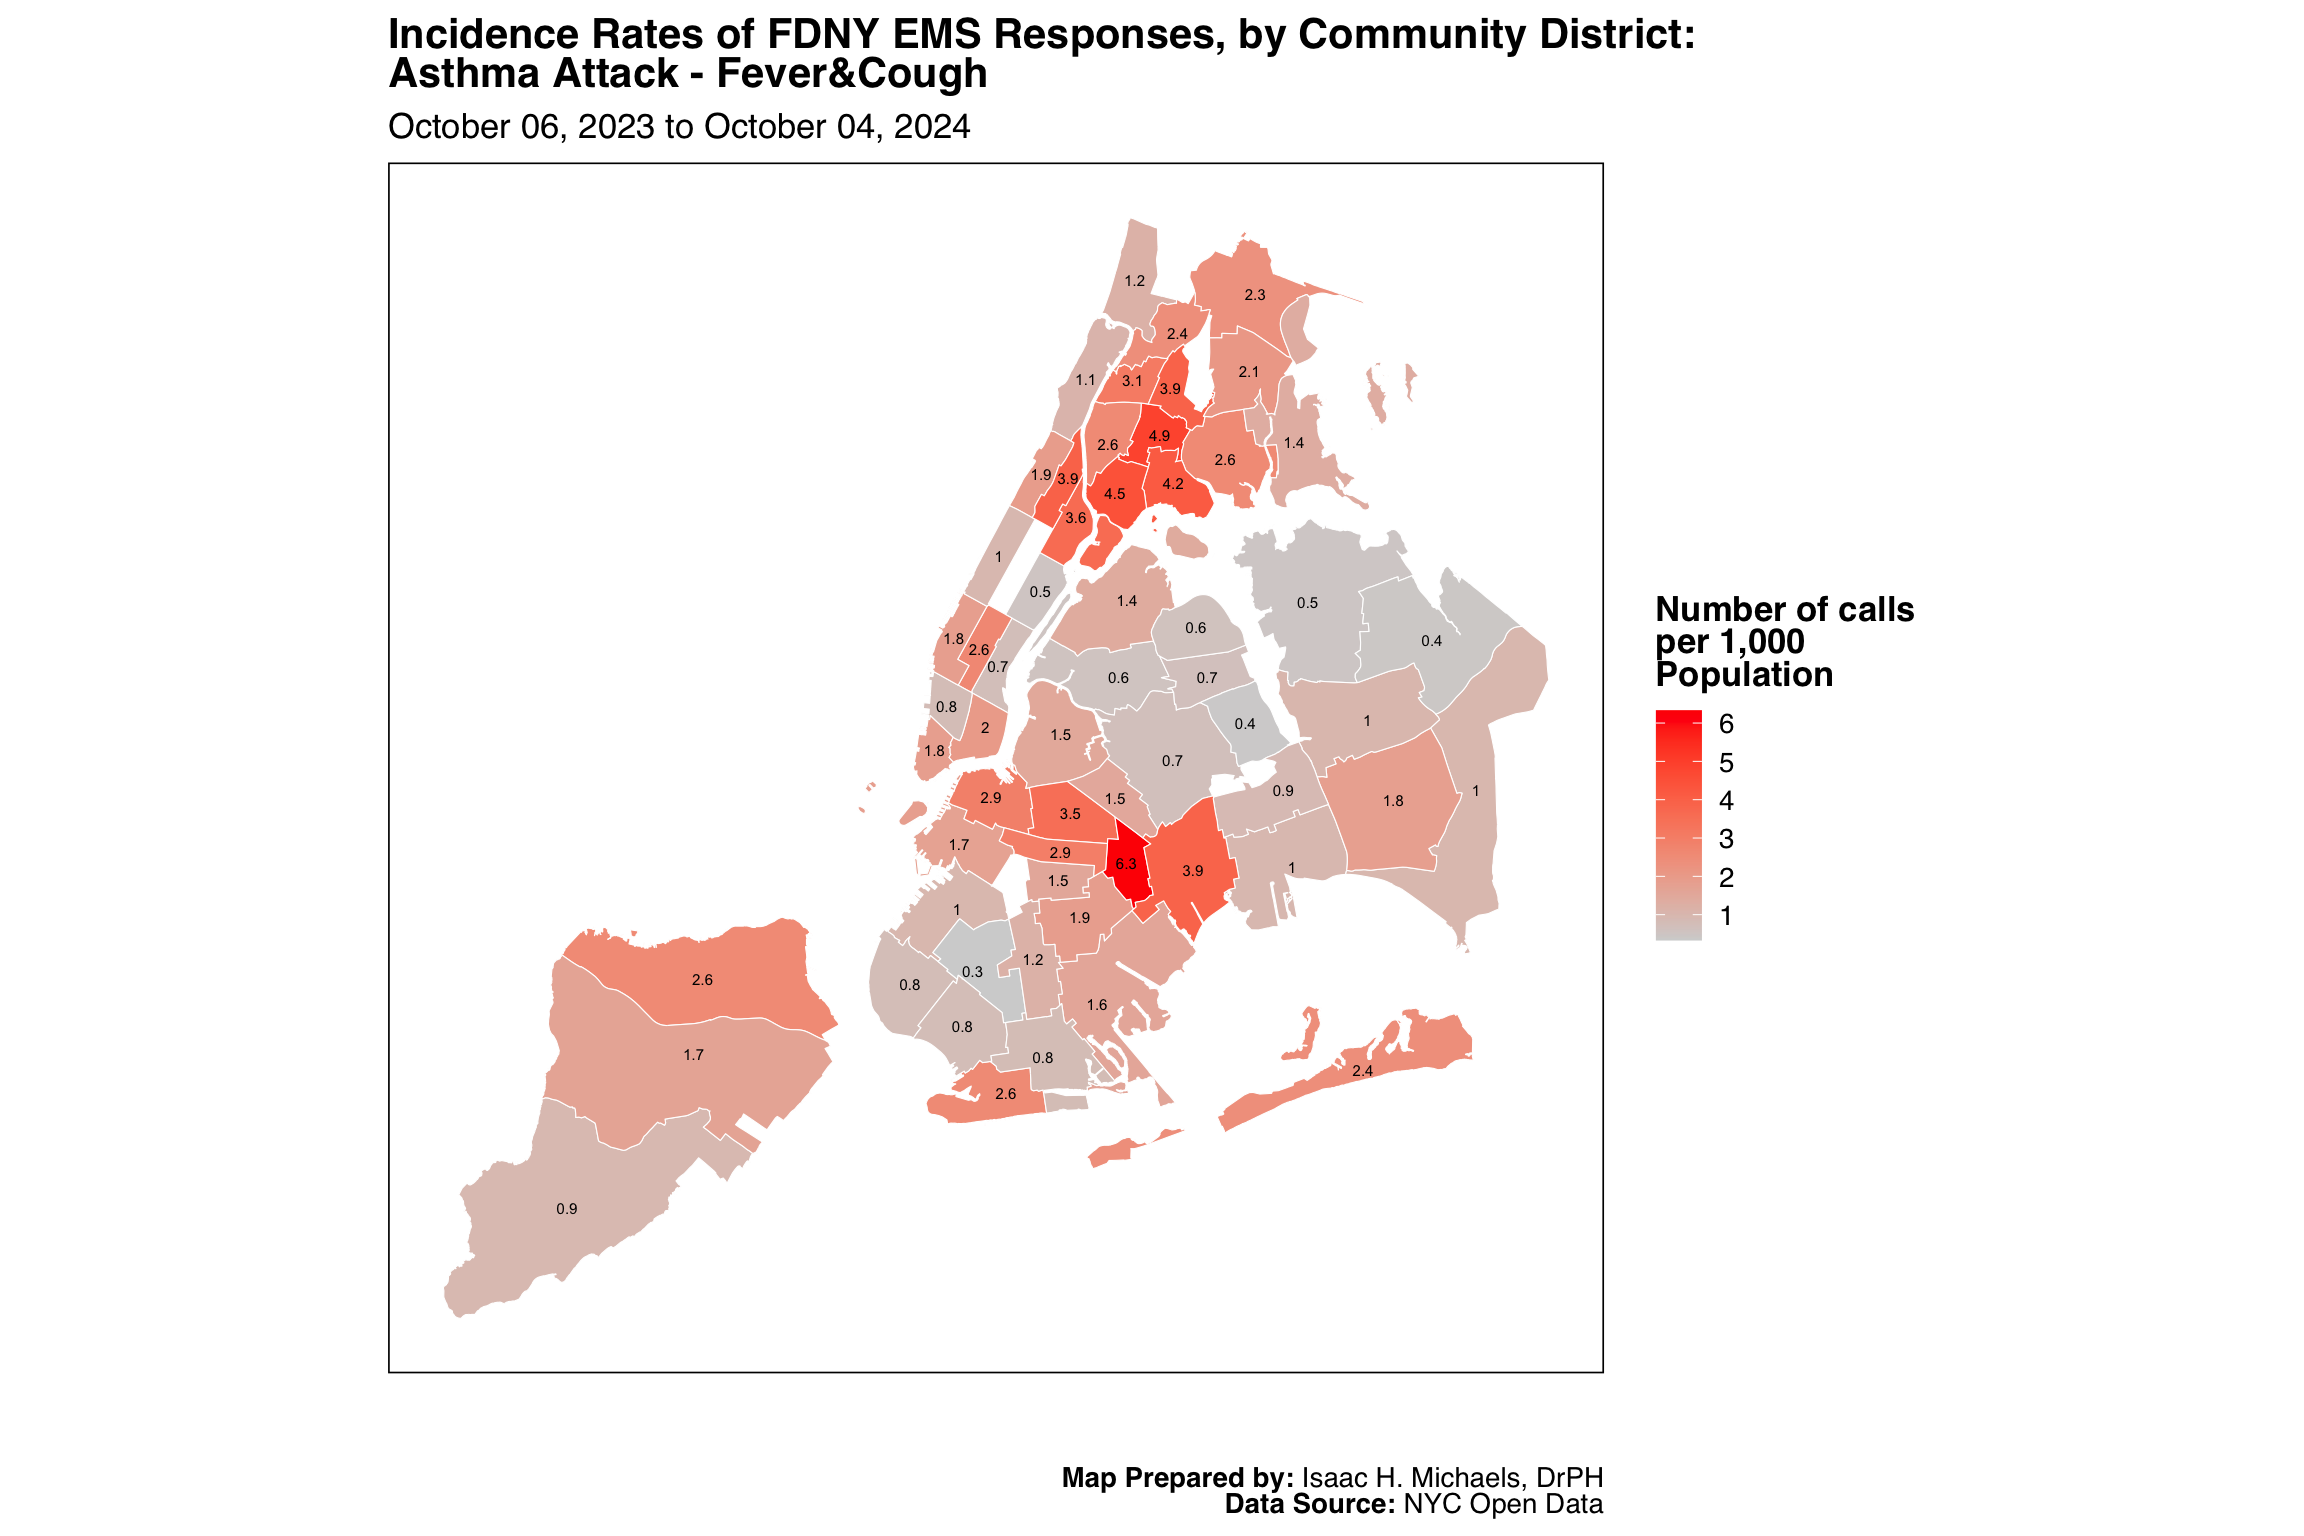
Map Prepared by: Isaac H. Michaels, DrPH
EMS Data Source: NYC Open Data
Population Data Source: NYC Open Data
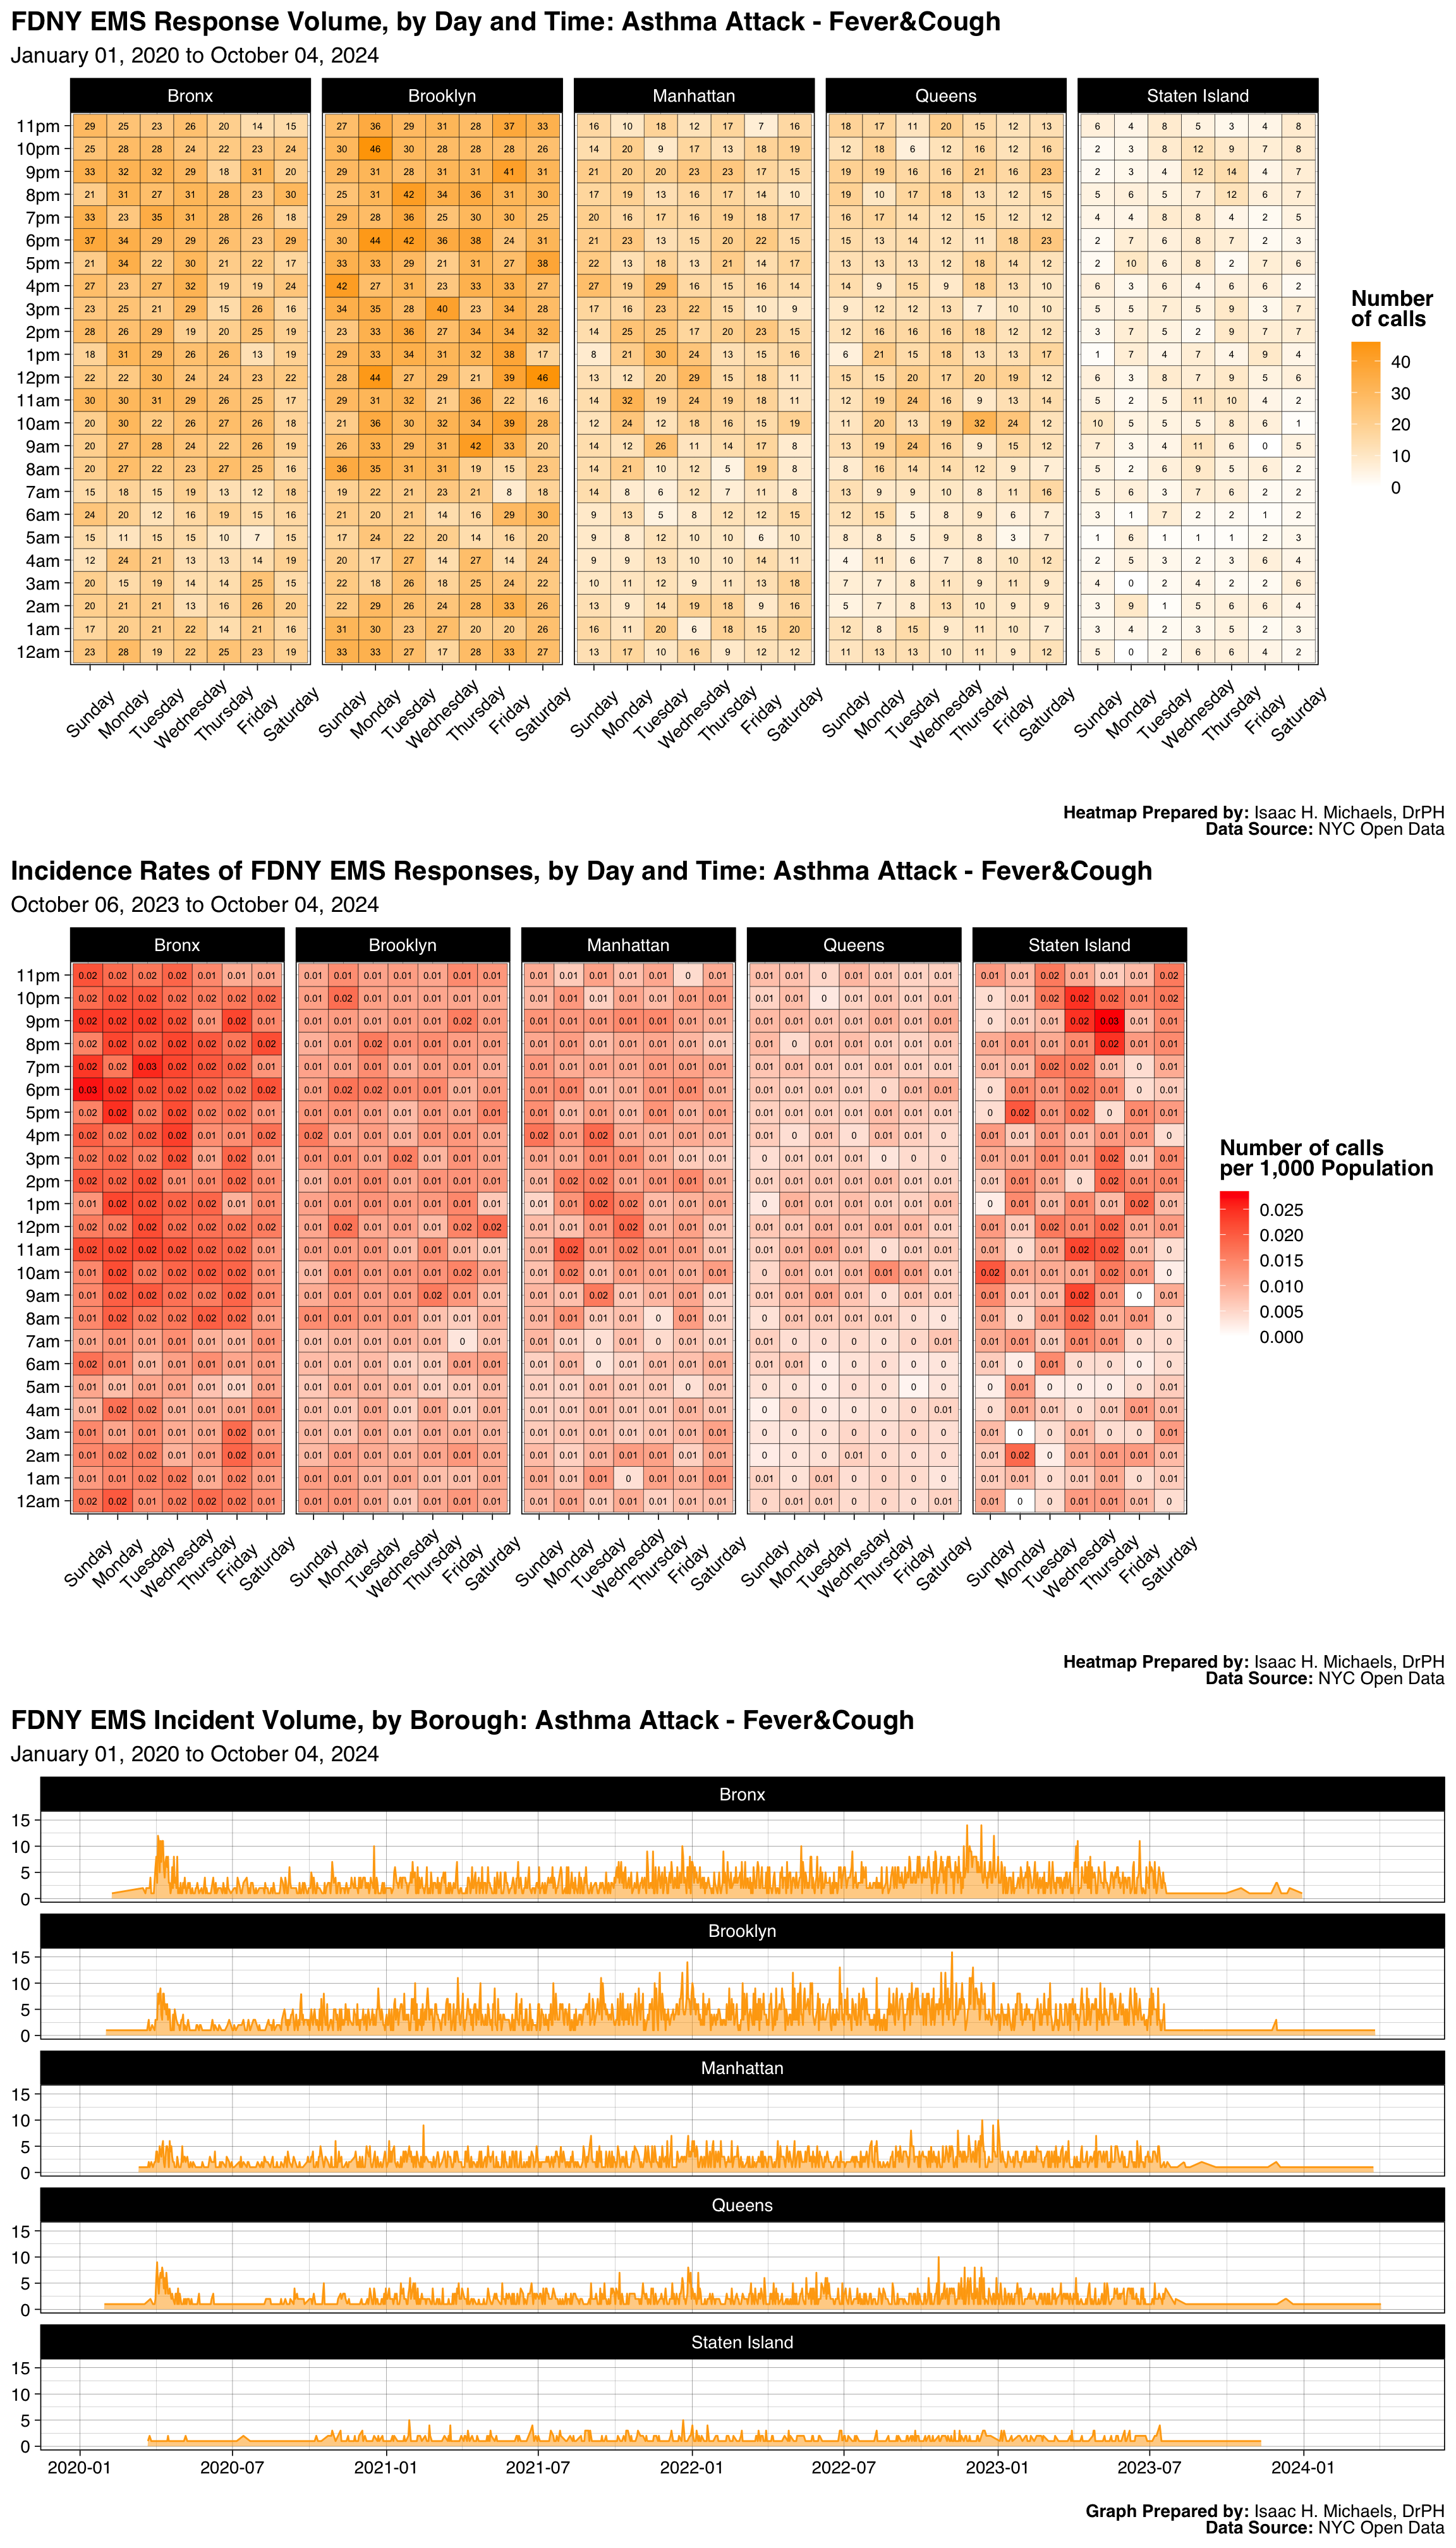
Graphs Prepared by: Isaac H. Michaels, DrPH
Data Source: NYC Open Data
| FDNY EMS Incident Volume, by Borough: One Alarm Fire |
||||||
| January 01, 2025 to July 01, 2026 | ||||||
| Borough |
Latest Year: 2026
|
All Years: 2025-2026
|
||||
|---|---|---|---|---|---|---|
| Incidents | % | Rate per 1,000 Population | Total Incidents | % | Monthly Trend | |
| Bronx | 188 | 22% | 0.1 | 517 | 21% | |
| Brooklyn | 277 | 33% | 0.1 | 789 | 33% | |
| Manhattan | 90 | 11% | 0.1 | 262 | 11% | |
| Queens | 241 | 28% | 0.1 | 723 | 30% | |
| Staten Island | 50 | 6% | 0.1 | 132 | 5% | |
| Table Prepred by: Isaac H. Michaels, DrPH | ||||||
| Data Source: NYC Open Data | ||||||
Table Prepared by: Isaac H. Michaels, DrPH
EMS Data Source: NYC Open Data
Population Data Source: Health Data NY
| FDNY EMS Incident Volume, by Severity Level: One Alarm Fire |
||||
| January 01, 2025 to July 01, 2026 | ||||
| Final Severity Level |
Latest Year: 2026
|
All Years: 2025-2026
|
||
|---|---|---|---|---|
| Incidents | % | Incidents | % | |
| 1 | 0 | 0% | 0 | 0% |
| 2 | 846 | 100% | 2,423 | 100% |
| 3 | 0 | 0% | 0 | 0% |
| 4 | 0 | 0% | 0 | 0% |
| 5 | 0 | 0% | 0 | 0% |
| 6 | 0 | 0% | 0 | 0% |
| 7 | 0 | 0% | 0 | 0% |
| 8 | 0 | 0% | 0 | 0% |
| Table Prepred by: Isaac H. Michaels, DrPH | ||||
| Data Source: NYC Open Data | ||||
Table Prepared by: Isaac H. Michaels, DrPH
Data Source: NYC Open Data
| FDNY EMS Incident Volume, by Disposition: One Alarm Fire |
||||
| January 01, 2025 to July 01, 2026 | ||||
| Disposition |
Latest Year: 2026
|
All Years: 2025-2026
|
||
|---|---|---|---|---|
| Incidents | % | Incidents | % | |
| Cancelled | 466 | 55% | 1,356 | 56% |
| Condition Corrected | 96 | 11% | 264 | 11% |
| Refused Medical Aid | 21 | 2% | 68 | 3% |
| Transporting Patient | 238 | 28% | 663 | 27% |
| Treated and Transported | 2 | 0% | 2 | 0% |
| Unfounded | 22 | 3% | 66 | 3% |
| NA | 1 | 0% | 4 | 0% |
| Table Prepred by: Isaac H. Michaels, DrPH | ||||
| Data Source: NYC Open Data | ||||
Table Prepared by: Isaac H. Michaels, DrPH
Data Source: NYC Open Data
Back to top
Minor Burns <18% Adlt Or <10%
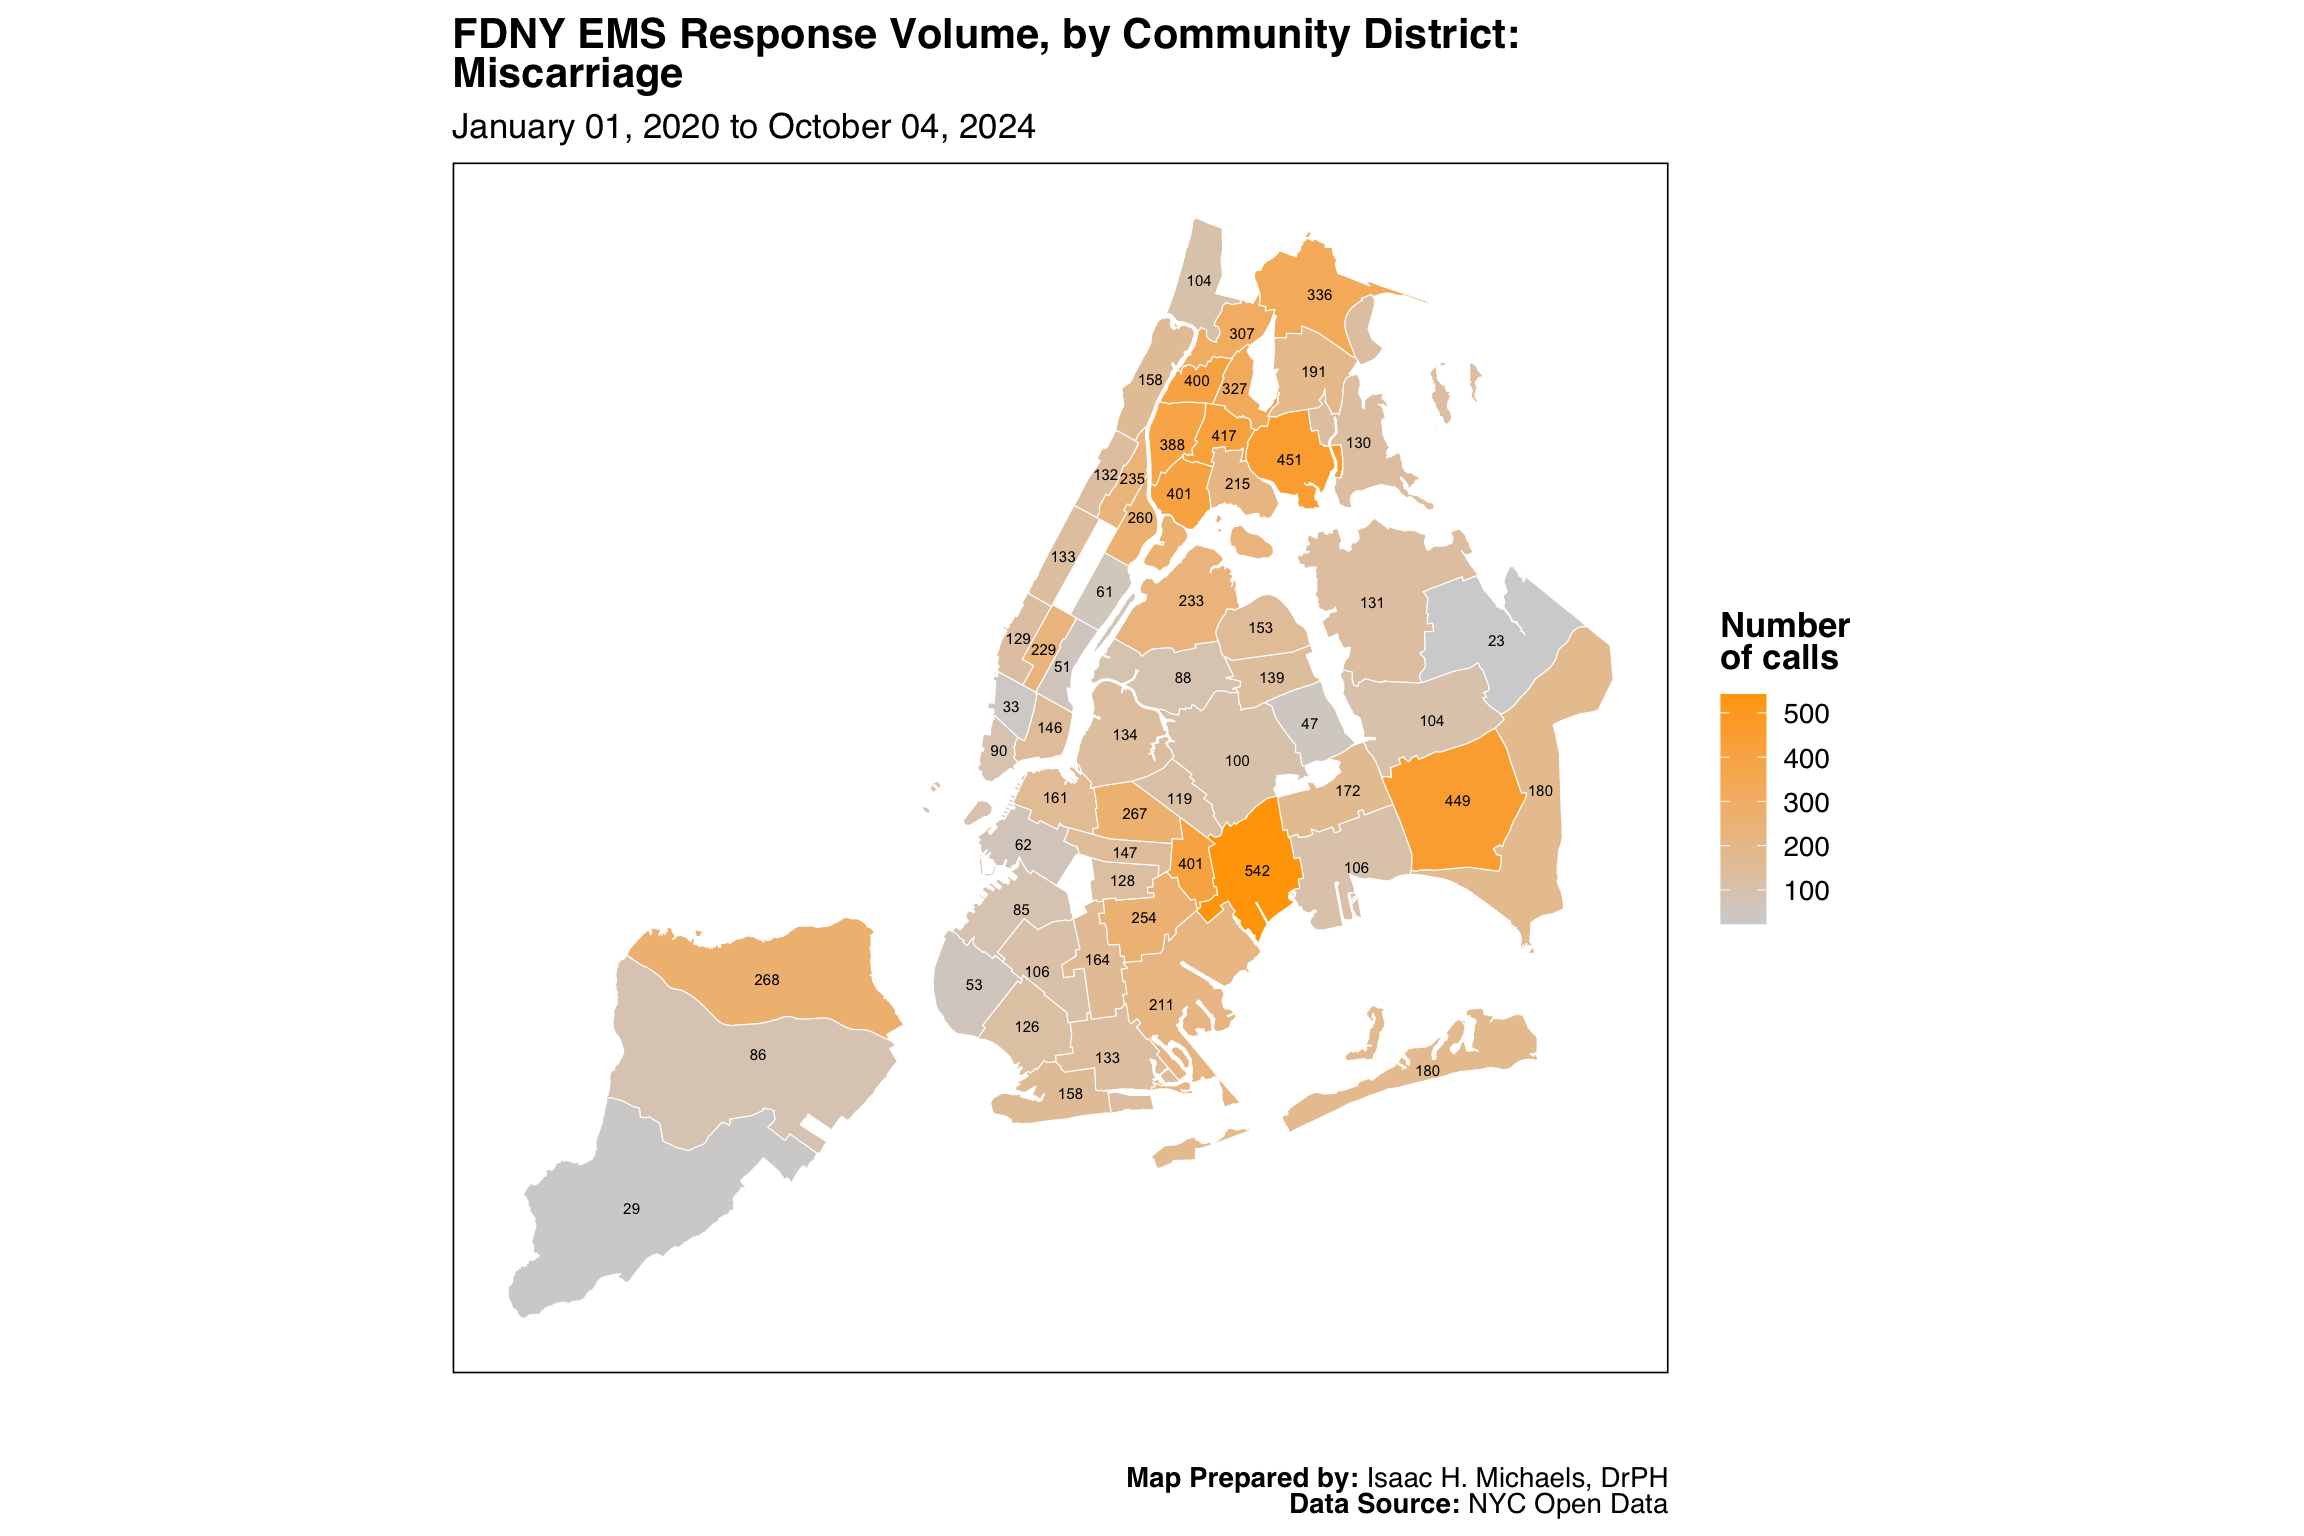
Map Prepared by: Isaac H. Michaels, DrPH
Data Source: NYC Open Data
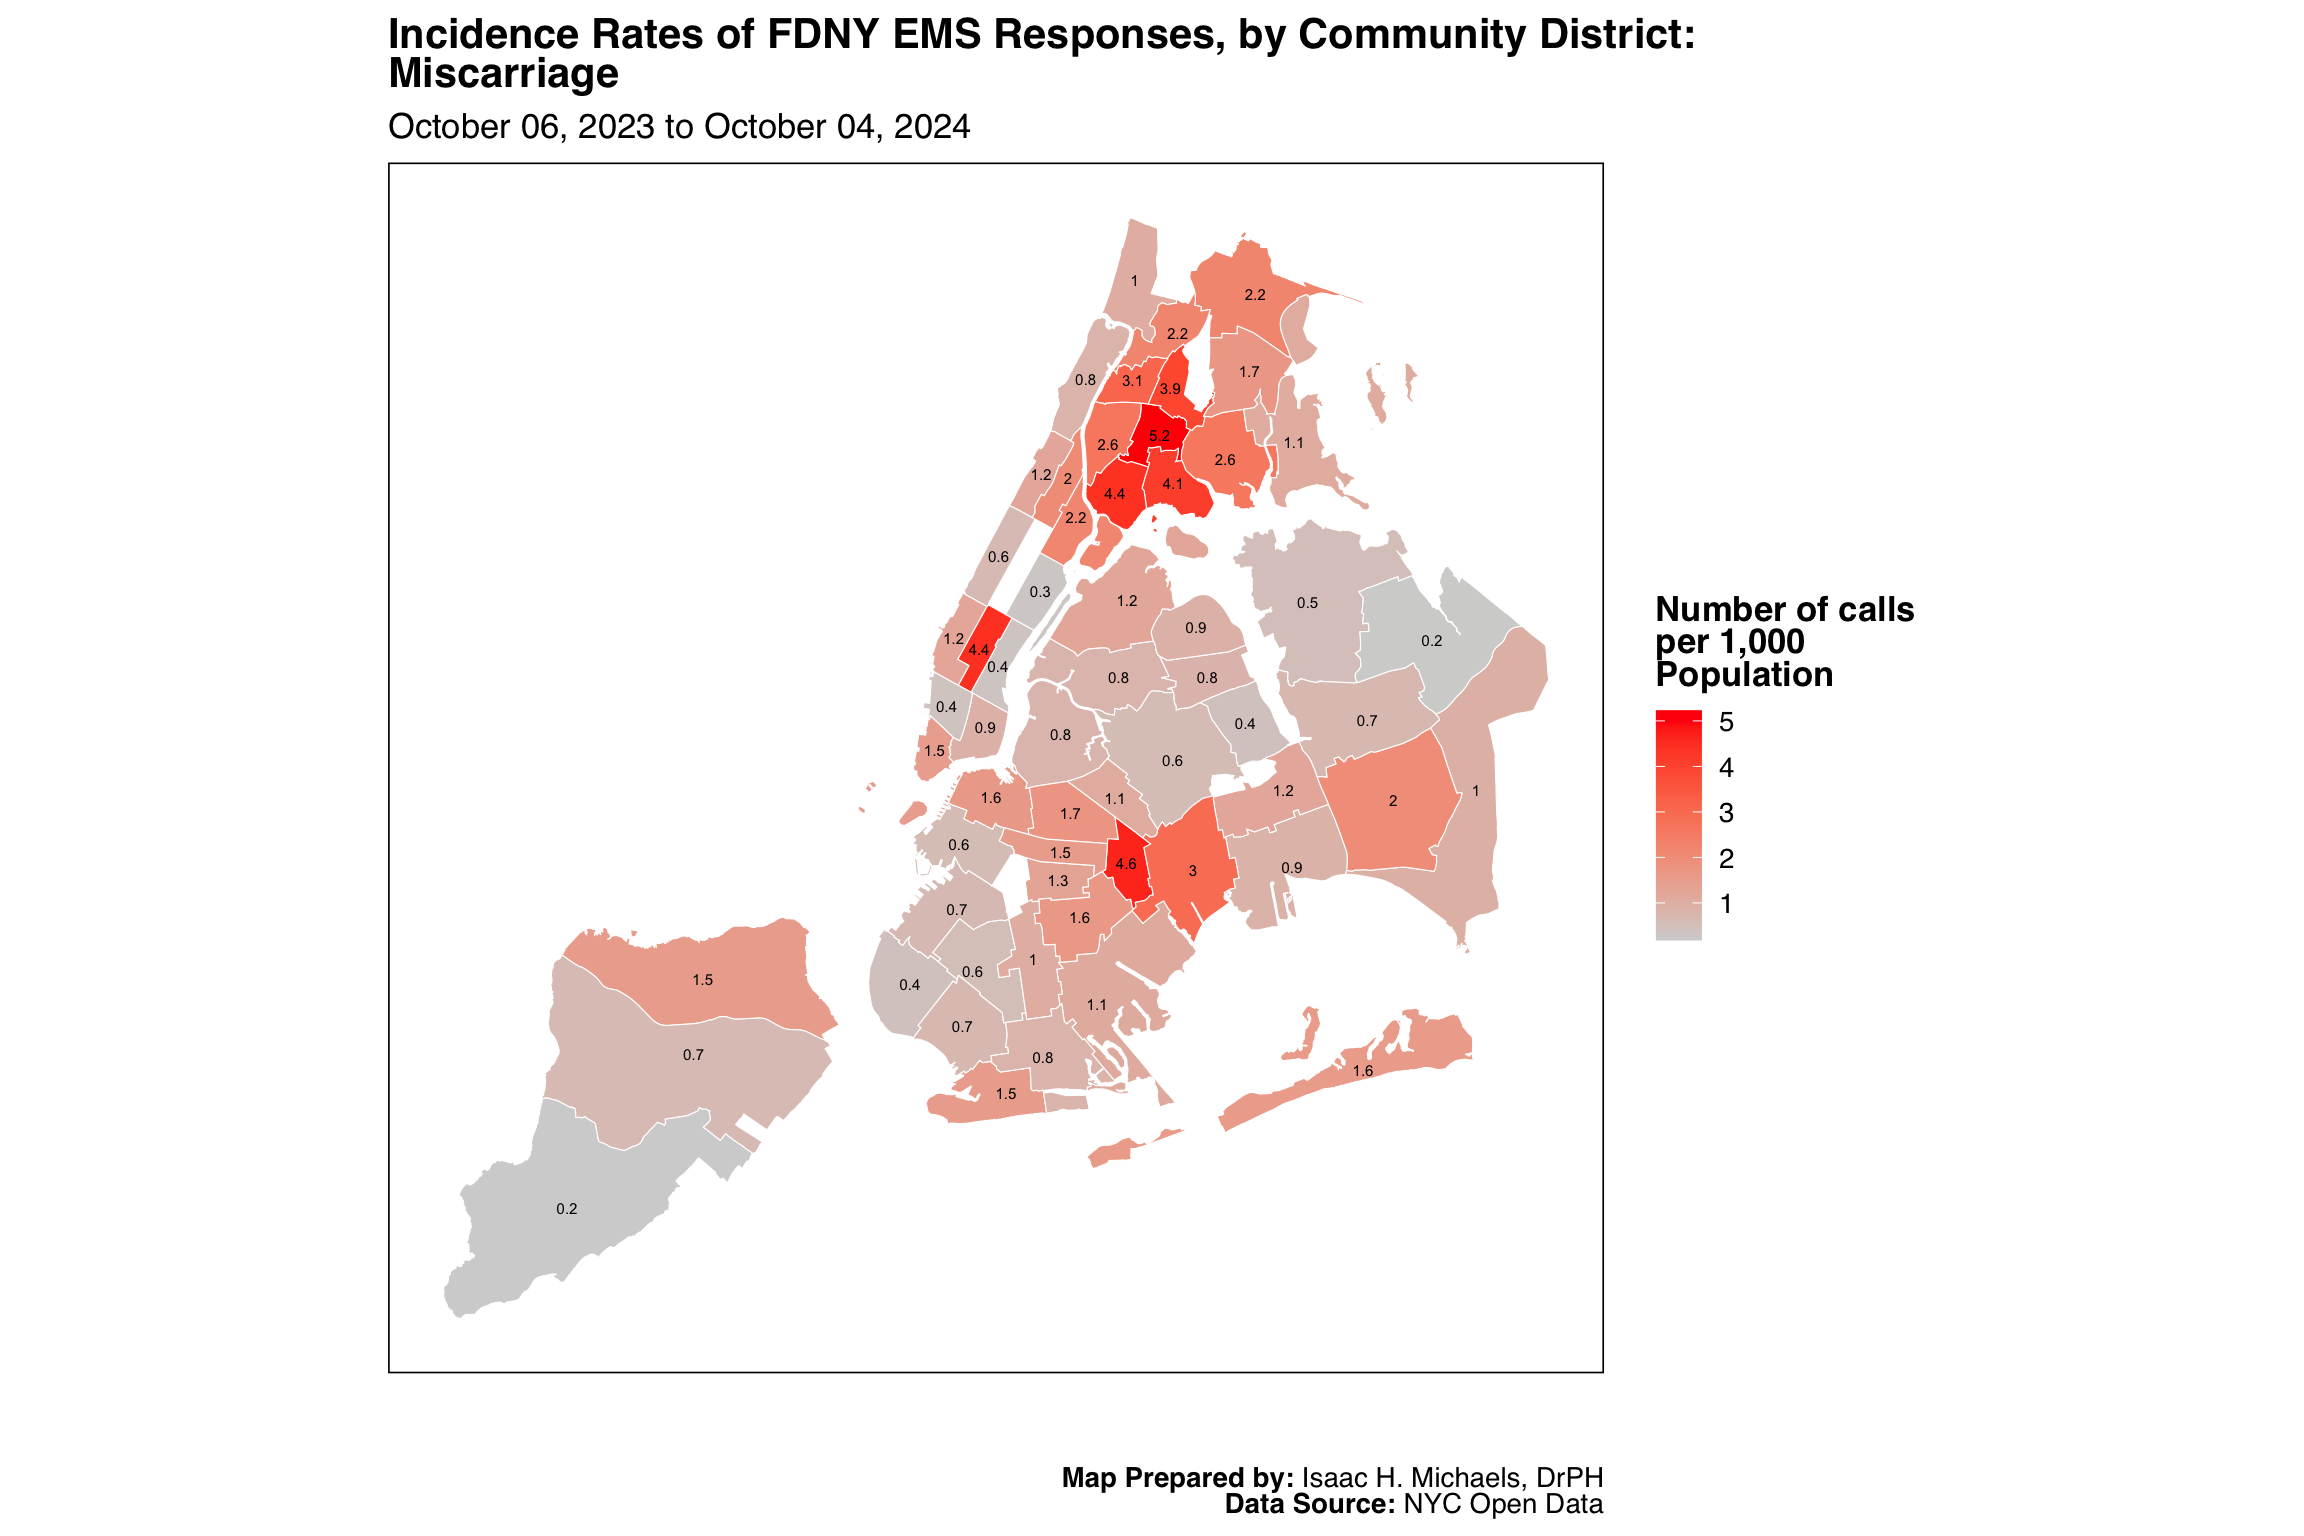
Map Prepared by: Isaac H. Michaels, DrPH
EMS Data Source: NYC Open Data
Population Data Source: NYC Open Data
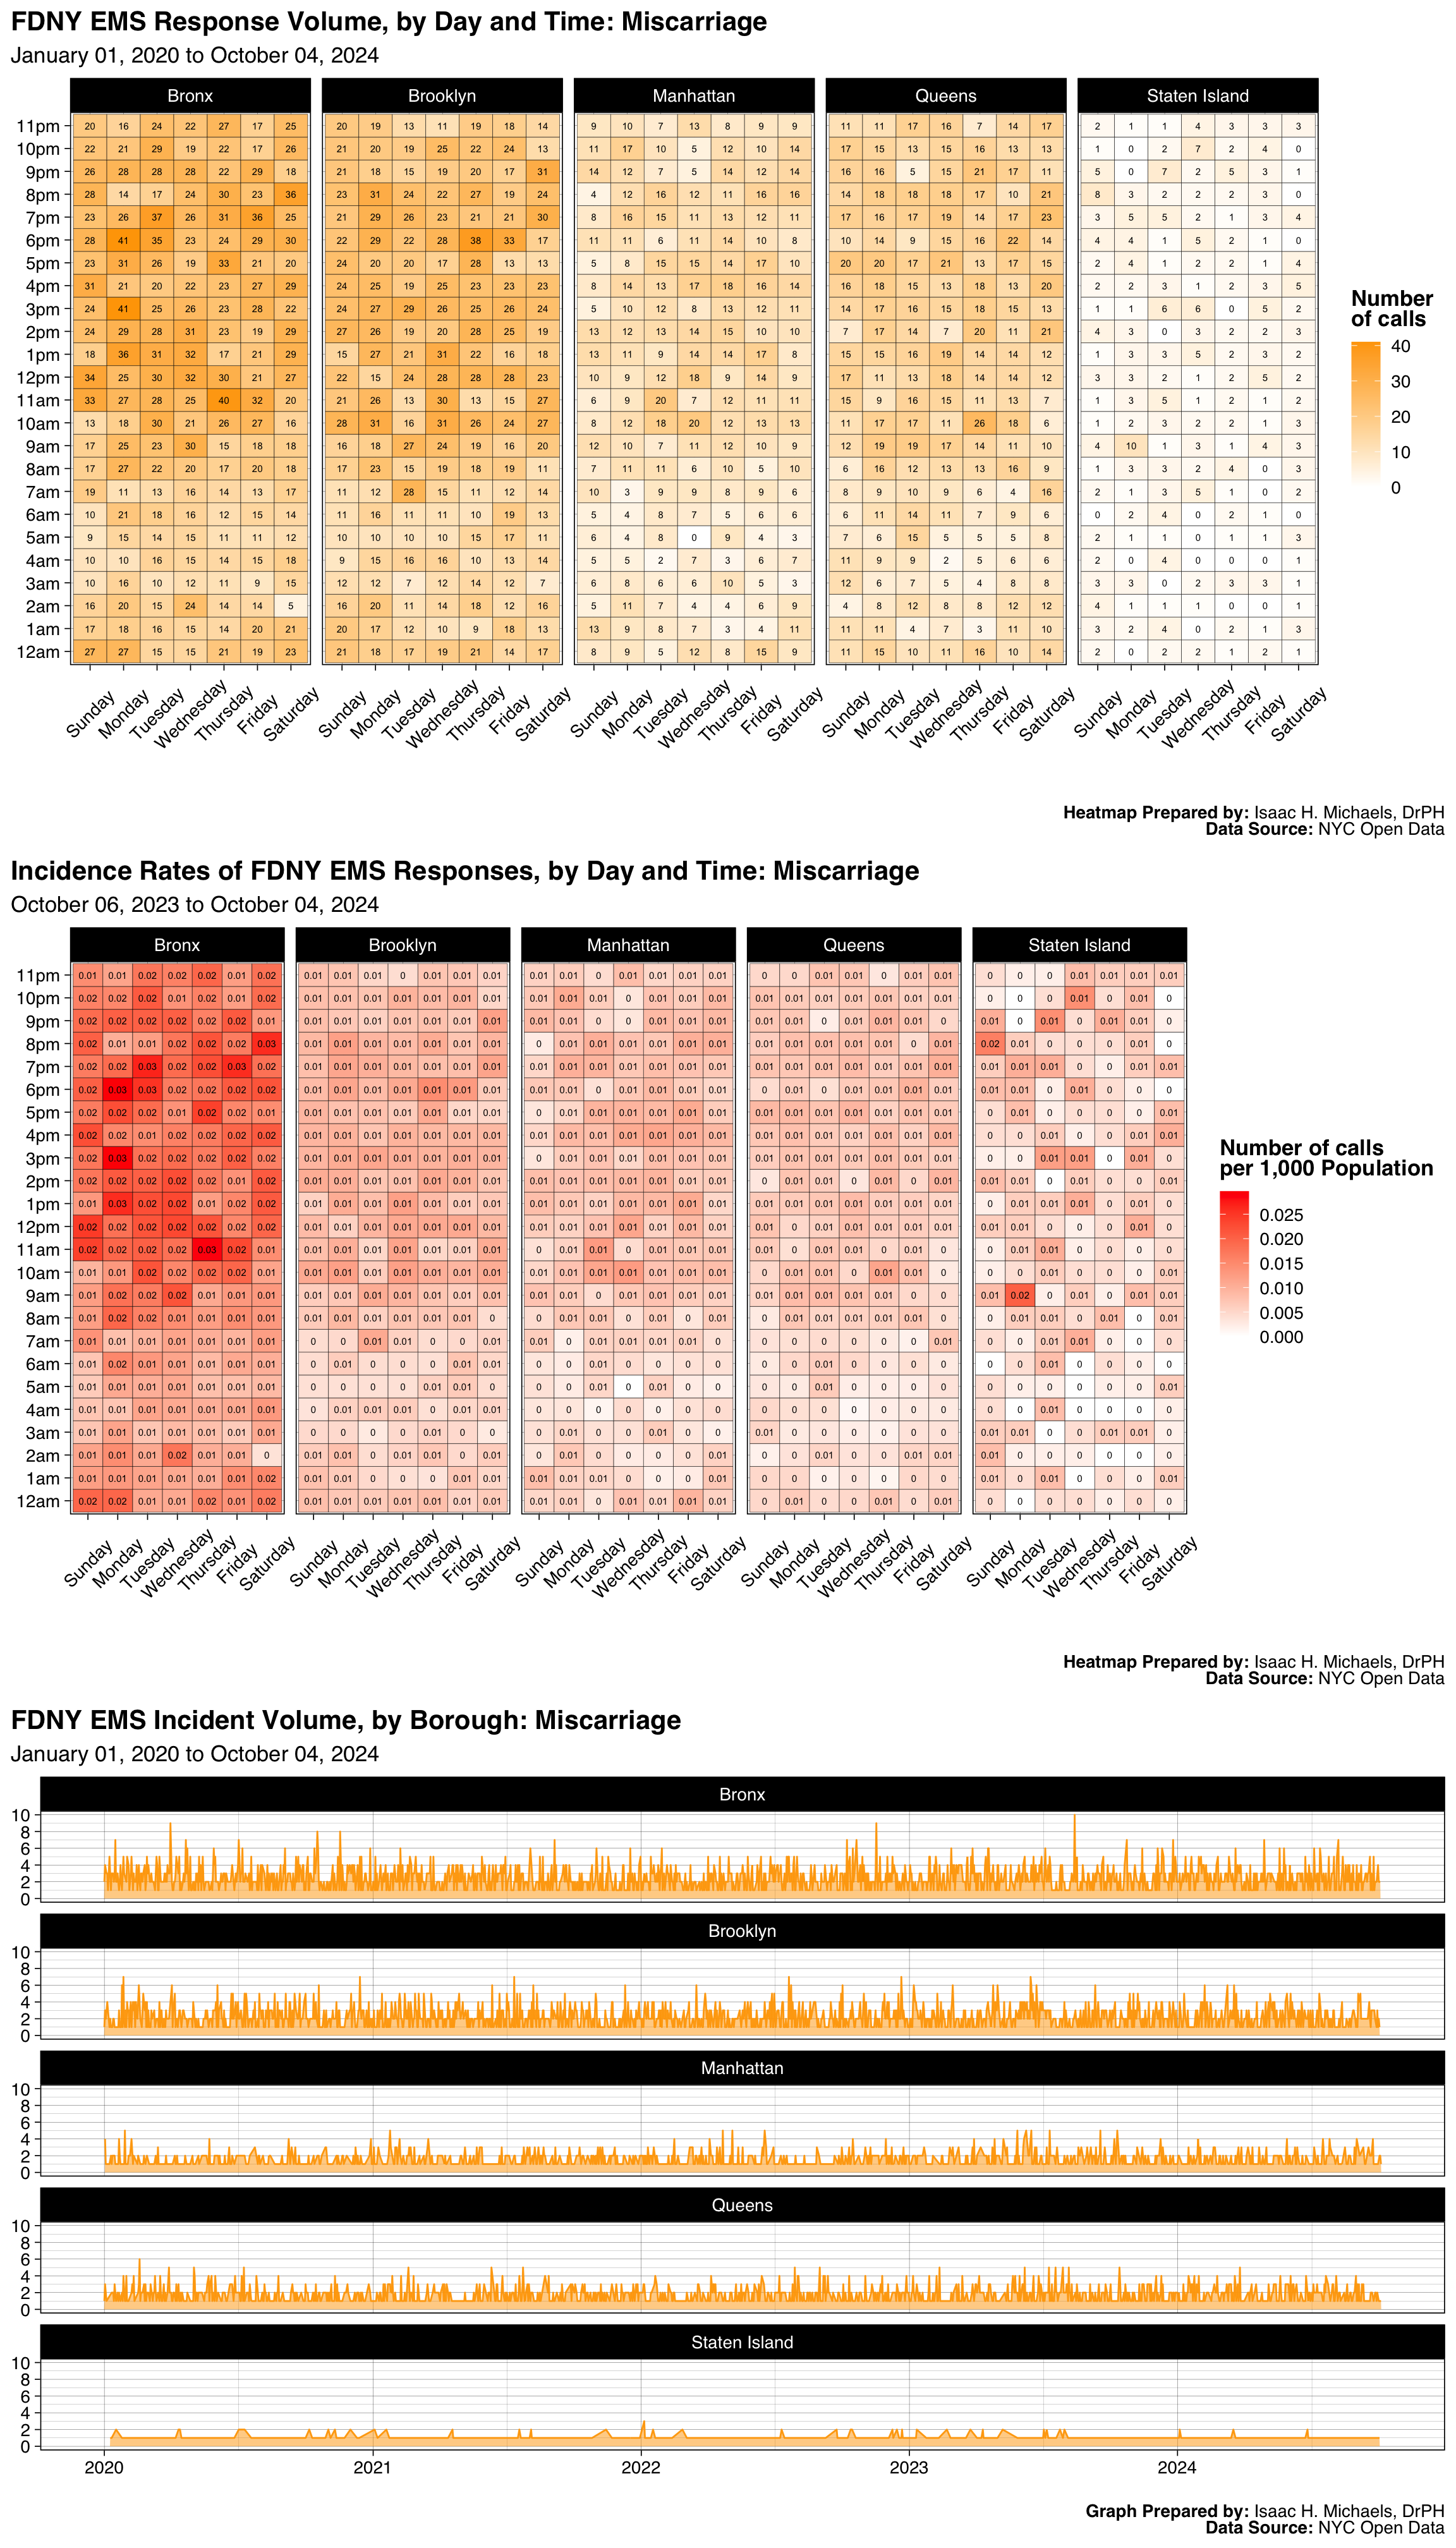
Graphs Prepared by: Isaac H. Michaels, DrPH
Data Source: NYC Open Data
| FDNY EMS Incident Volume, by Borough: Minor Burns <18% Adlt Or <10% |
||||||
| January 01, 2025 to July 01, 2026 | ||||||
| Borough |
Latest Year: 2026
|
All Years: 2025-2026
|
||||
|---|---|---|---|---|---|---|
| Incidents | % | Rate per 1,000 Population | Total Incidents | % | Monthly Trend | |
| Bronx | 196 | 25% | 0.1 | 611 | 27% | |
| Brooklyn | 211 | 27% | 0.1 | 633 | 28% | |
| Manhattan | 198 | 25% | 0.1 | 539 | 23% | |
| Queens | 155 | 20% | 0.1 | 434 | 19% | |
| Staten Island | 34 | 4% | 0.1 | 80 | 3% | |
| Table Prepred by: Isaac H. Michaels, DrPH | ||||||
| Data Source: NYC Open Data | ||||||
Table Prepared by: Isaac H. Michaels, DrPH
EMS Data Source: NYC Open Data
Population Data Source: Health Data NY
| FDNY EMS Incident Volume, by Severity Level: Minor Burns <18% Adlt Or <10% |
||||
| January 01, 2025 to July 01, 2026 | ||||
| Final Severity Level |
Latest Year: 2026
|
All Years: 2025-2026
|
||
|---|---|---|---|---|
| Incidents | % | Incidents | % | |
| 1 | 0 | 0% | 1 | 0% |
| 2 | 1 | 0% | 1 | 0% |
| 3 | 5 | 1% | 9 | 0% |
| 4 | 52 | 7% | 116 | 5% |
| 5 | 736 | 93% | 2,170 | 94% |
| 6 | 0 | 0% | 0 | 0% |
| 7 | 0 | 0% | 0 | 0% |
| 8 | 0 | 0% | 0 | 0% |
| Table Prepred by: Isaac H. Michaels, DrPH | ||||
| Data Source: NYC Open Data | ||||
Table Prepared by: Isaac H. Michaels, DrPH
Data Source: NYC Open Data
| FDNY EMS Incident Volume, by Disposition: Minor Burns <18% Adlt Or <10% |
||||
| January 01, 2025 to July 01, 2026 | ||||
| Disposition |
Latest Year: 2026
|
All Years: 2025-2026
|
||
|---|---|---|---|---|
| Incidents | % | Incidents | % | |
| Cancelled | 27 | 3% | 80 | 3% |
| Condition Corrected | 29 | 4% | 65 | 3% |
| Patient Gone on Arrival | 42 | 5% | 114 | 5% |
| Refused Medical Aid | 228 | 29% | 675 | 29% |
| Transporting Patient | 364 | 46% | 1,105 | 48% |
| Unfounded | 43 | 5% | 154 | 7% |
| NA | 61 | 8% | 101 | 4% |
| Table Prepred by: Isaac H. Michaels, DrPH | ||||
| Data Source: NYC Open Data | ||||
Table Prepared by: Isaac H. Michaels, DrPH
Data Source: NYC Open Data
Back to top
Obstetric Complications

Map Prepared by: Isaac H. Michaels, DrPH
Data Source: NYC Open Data
Map Prepared by: Isaac H. Michaels, DrPH
EMS Data Source: NYC Open Data
Population Data Source: NYC Open Data
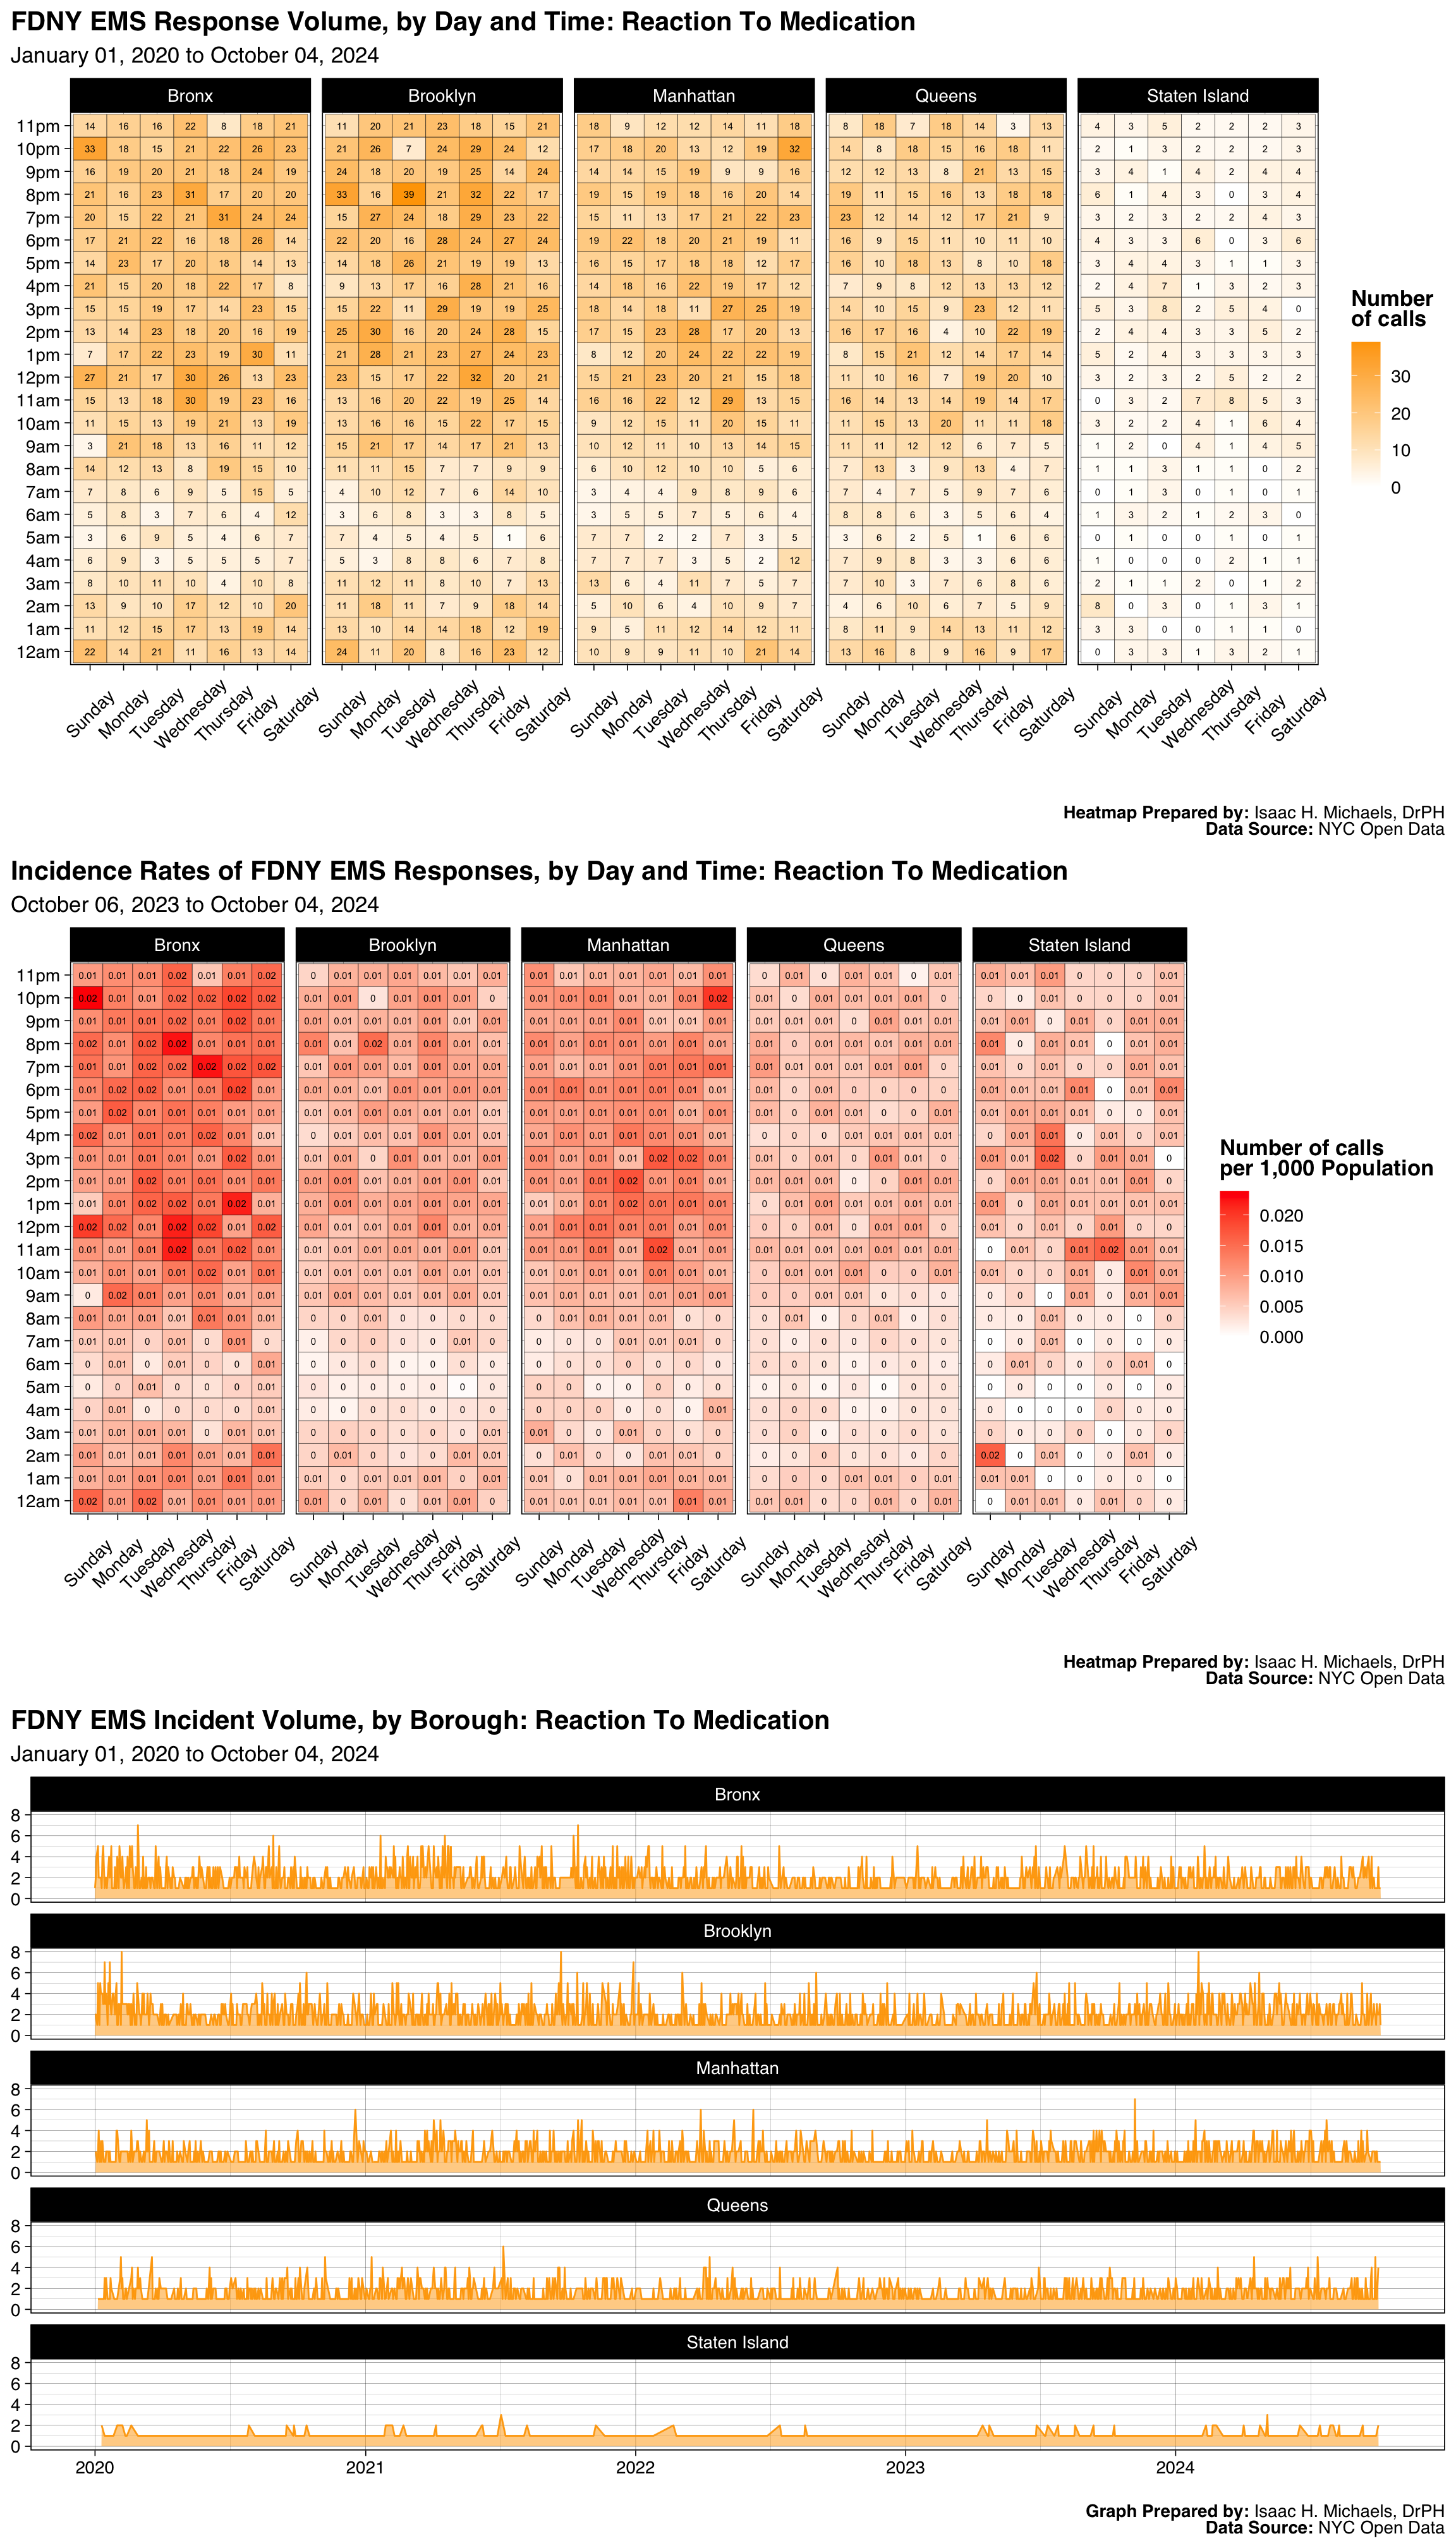
Graphs Prepared by: Isaac H. Michaels, DrPH
Data Source: NYC Open Data
| FDNY EMS Incident Volume, by Borough: Obstetric Complications |
||||||
| January 01, 2025 to July 01, 2026 | ||||||
| Borough |
Latest Year: 2026
|
All Years: 2025-2026
|
||||
|---|---|---|---|---|---|---|
| Incidents | % | Rate per 1,000 Population | Total Incidents | % | Monthly Trend | |
| Bronx | 280 | 35% | 0.2 | 747 | 33% | |
| Brooklyn | 230 | 28% | 0.1 | 618 | 28% | |
| Manhattan | 111 | 14% | 0.1 | 344 | 15% | |
| Queens | 158 | 20% | 0.1 | 446 | 20% | |
| Staten Island | 30 | 4% | 0.1 | 78 | 3% | |
| Table Prepred by: Isaac H. Michaels, DrPH | ||||||
| Data Source: NYC Open Data | ||||||
Table Prepared by: Isaac H. Michaels, DrPH
EMS Data Source: NYC Open Data
Population Data Source: Health Data NY
| FDNY EMS Incident Volume, by Severity Level: Obstetric Complications |
||||
| January 01, 2025 to July 01, 2026 | ||||
| Final Severity Level |
Latest Year: 2026
|
All Years: 2025-2026
|
||
|---|---|---|---|---|
| Incidents | % | Incidents | % | |
| 1 | 0 | 0% | 0 | 0% |
| 2 | 1 | 0% | 2 | 0% |
| 3 | 3 | 0% | 7 | 0% |
| 4 | 804 | 99% | 2,223 | 100% |
| 5 | 0 | 0% | 0 | 0% |
| 6 | 1 | 0% | 1 | 0% |
| 7 | 0 | 0% | 0 | 0% |
| 8 | 0 | 0% | 0 | 0% |
| Table Prepred by: Isaac H. Michaels, DrPH | ||||
| Data Source: NYC Open Data | ||||
Table Prepared by: Isaac H. Michaels, DrPH
Data Source: NYC Open Data
| FDNY EMS Incident Volume, by Disposition: Obstetric Complications |
||||
| January 01, 2025 to July 01, 2026 | ||||
| Disposition |
Latest Year: 2026
|
All Years: 2025-2026
|
||
|---|---|---|---|---|
| Incidents | % | Incidents | % | |
| Cancelled | 12 | 1% | 37 | 2% |
| Condition Corrected | 2 | 0% | 5 | 0% |
| Patient Gone on Arrival | 36 | 4% | 90 | 4% |
| Refused Medical Aid | 82 | 10% | 244 | 11% |
| Transporting Patient | 636 | 79% | 1,767 | 79% |
| Treated and Transported | 1 | 0% | 1 | 0% |
| Unfounded | 34 | 4% | 76 | 3% |
| NA | 6 | 1% | 13 | 1% |
| Table Prepred by: Isaac H. Michaels, DrPH | ||||
| Data Source: NYC Open Data | ||||
Table Prepared by: Isaac H. Michaels, DrPH
Data Source: NYC Open Data
Back to top
Police 10-13, Unconfirmed
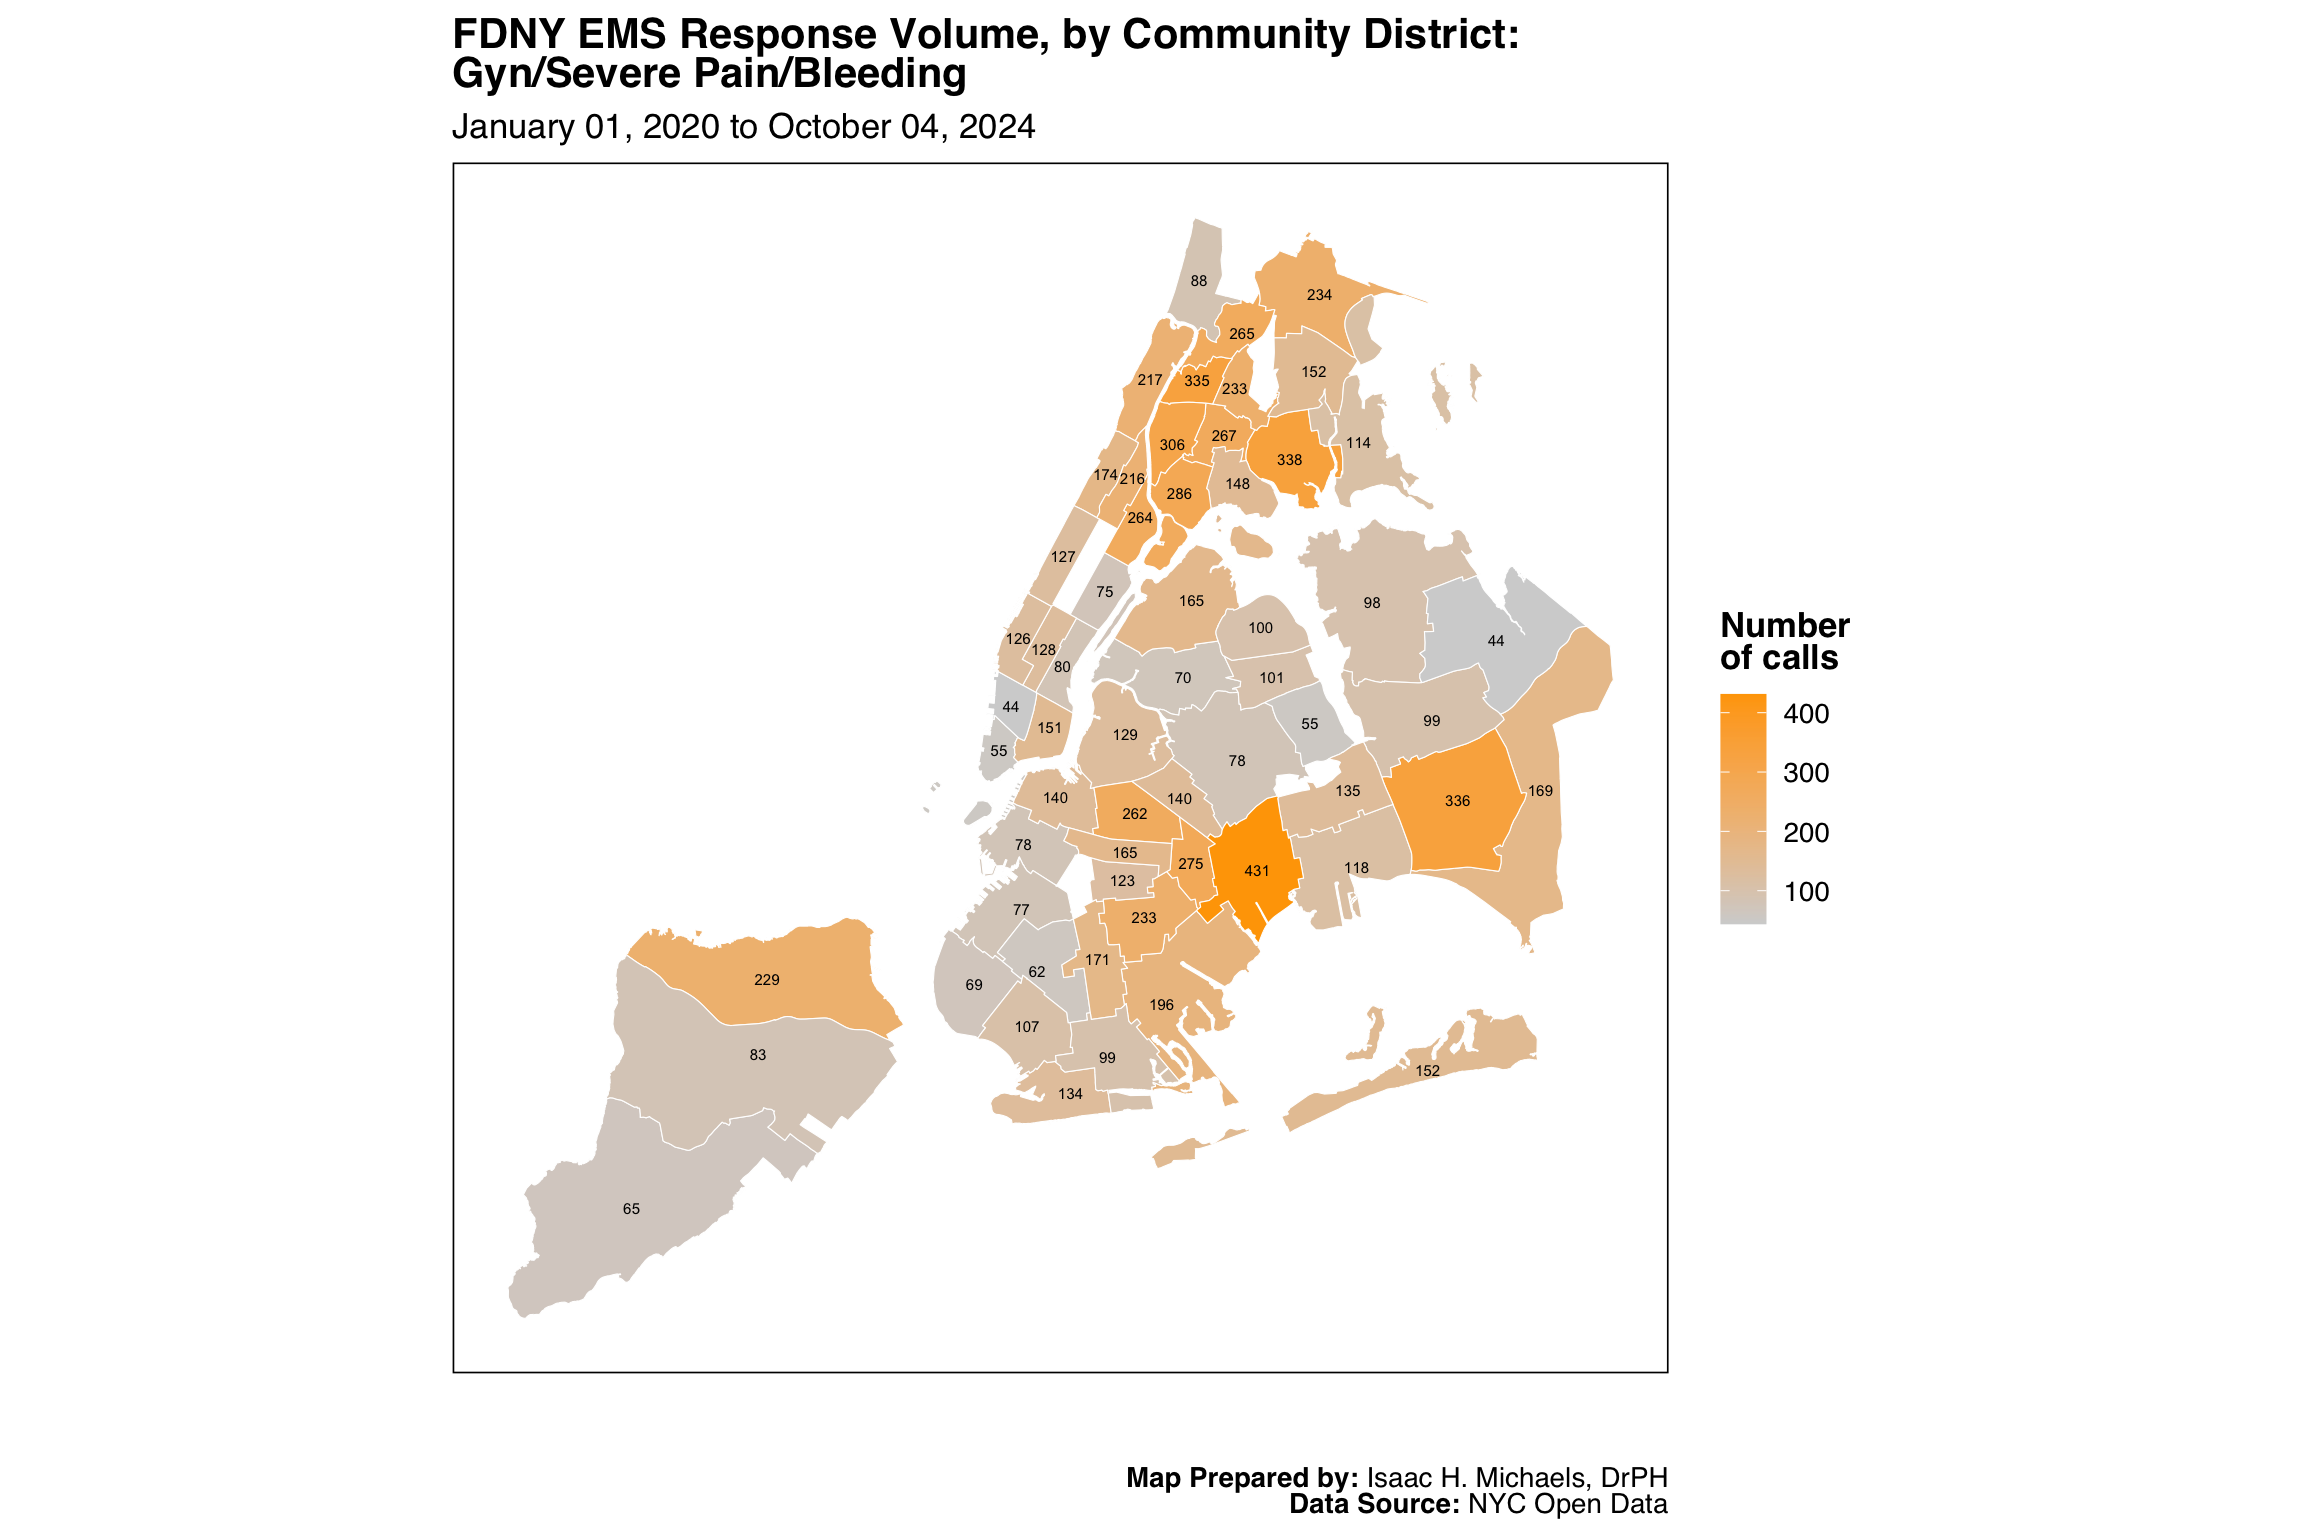
Map Prepared by: Isaac H. Michaels, DrPH
Data Source: NYC Open Data

Map Prepared by: Isaac H. Michaels, DrPH
EMS Data Source: NYC Open Data
Population Data Source: NYC Open Data
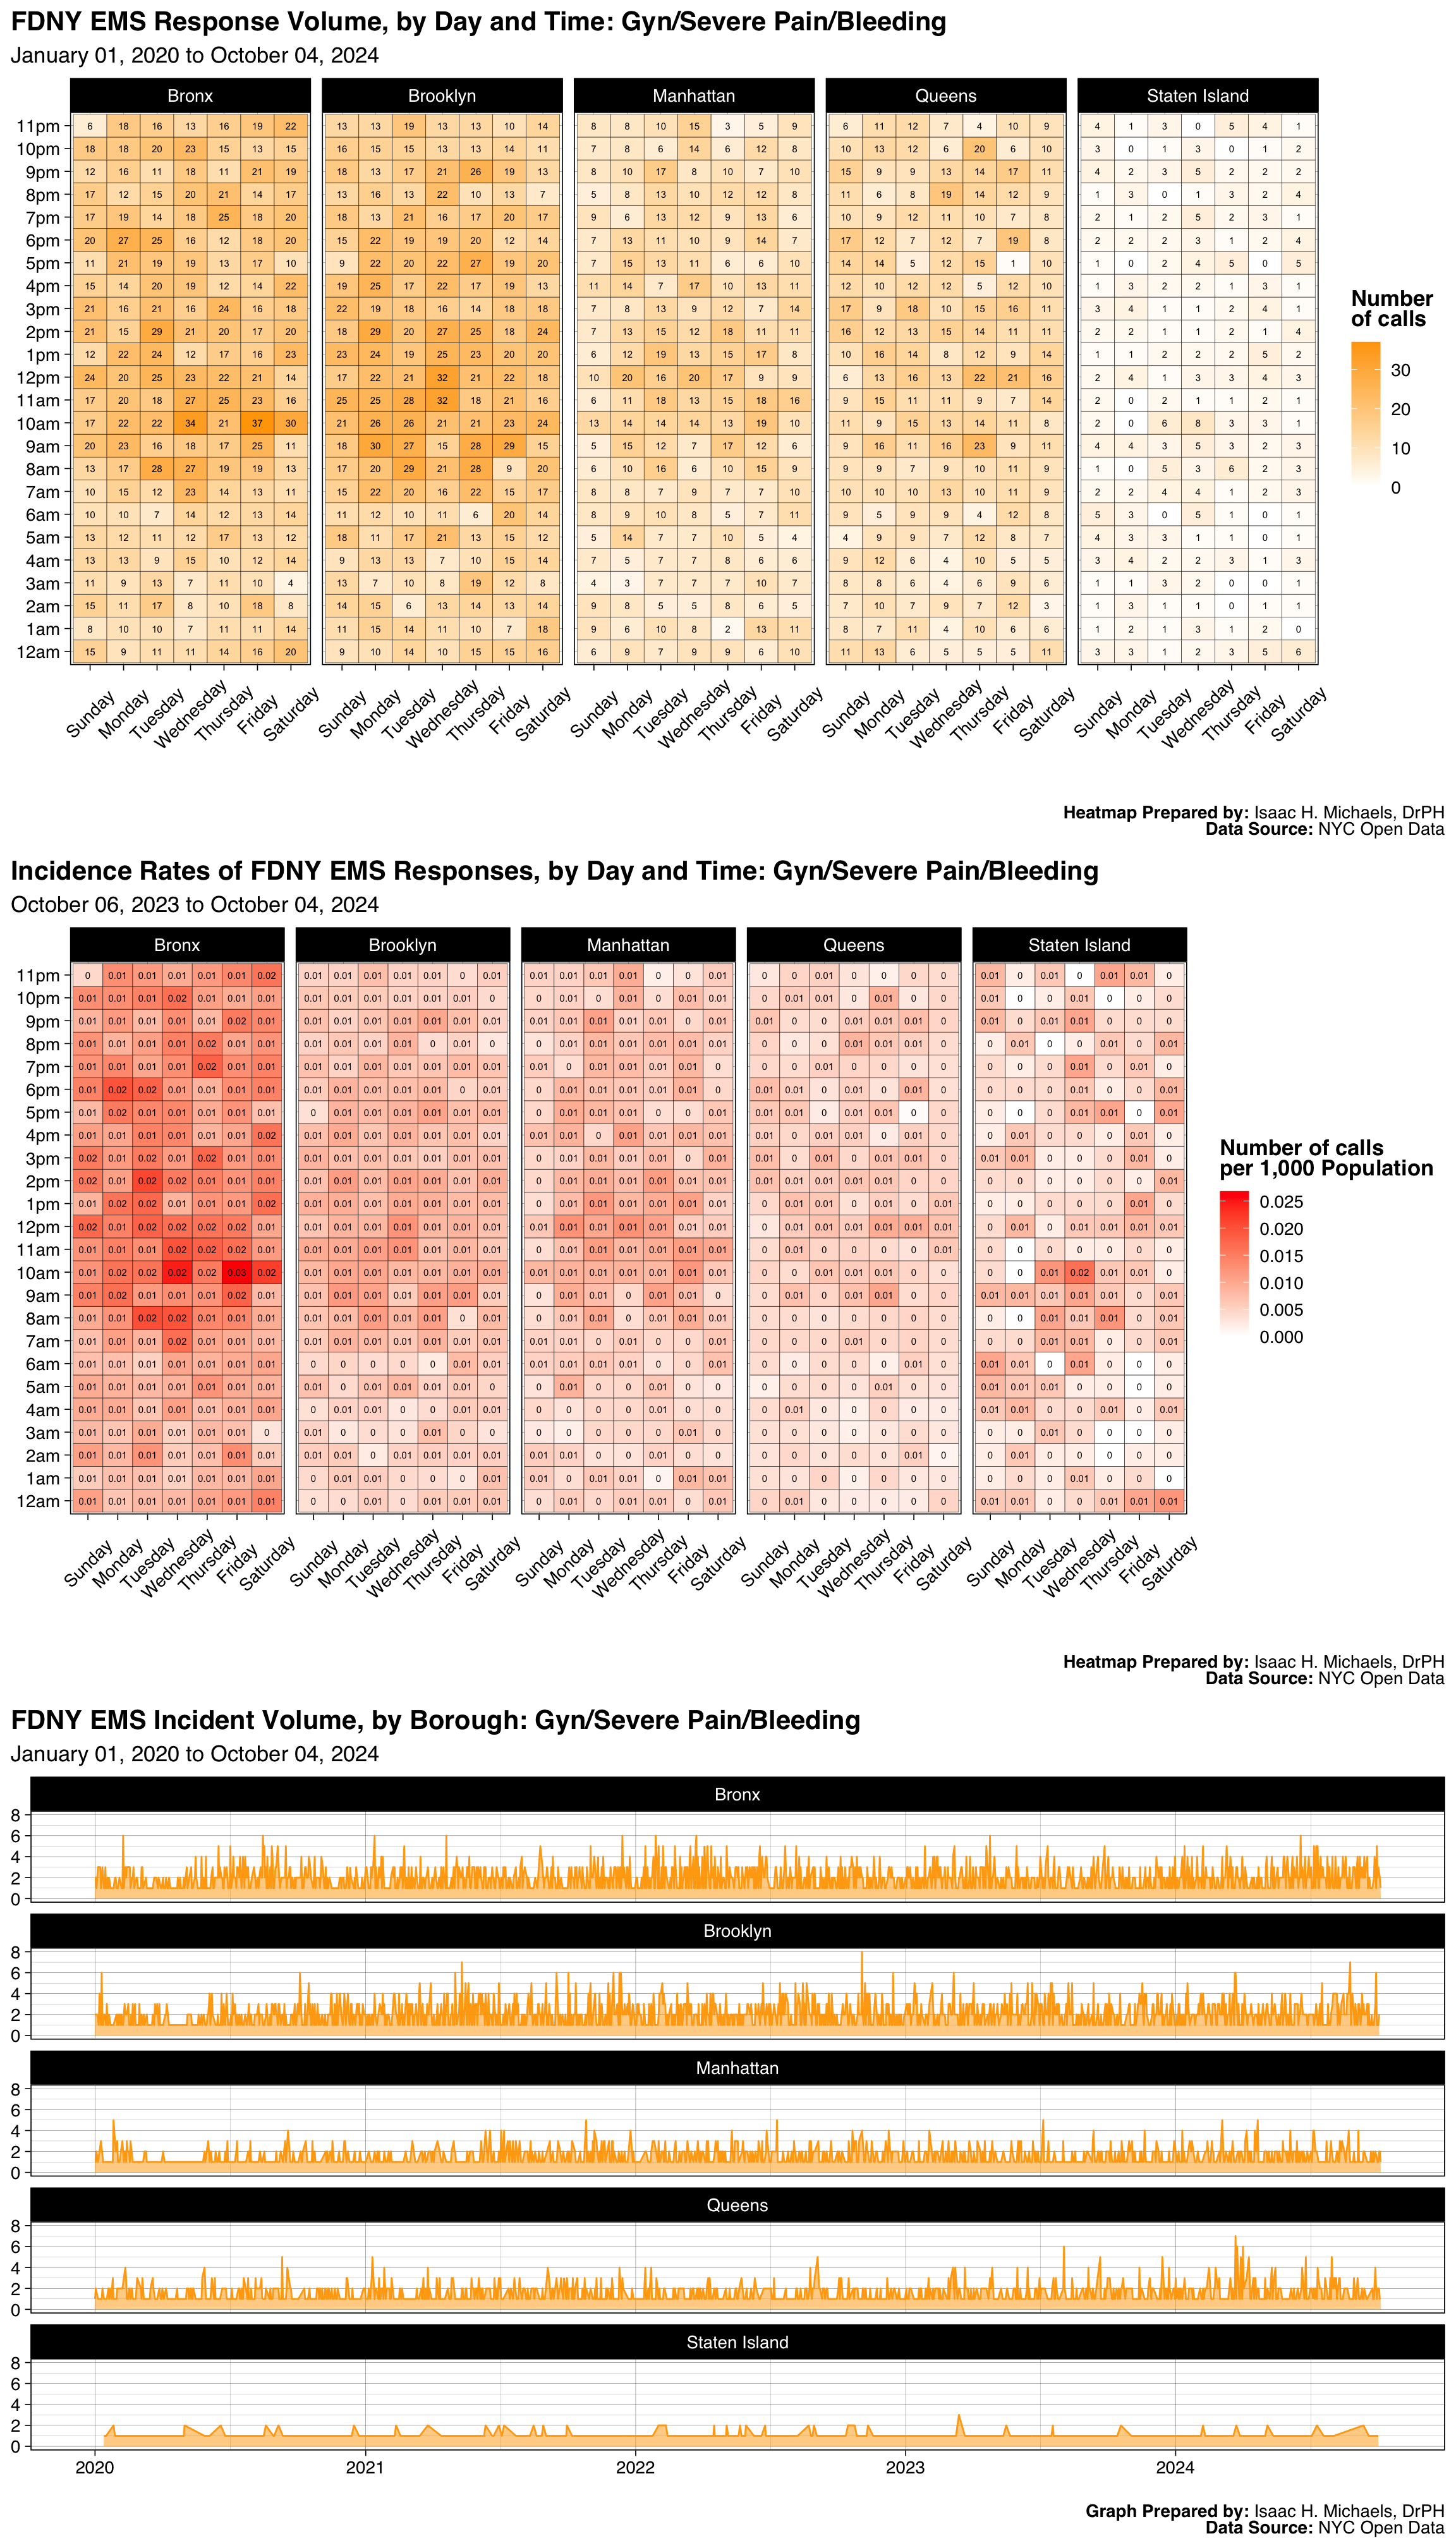
Graphs Prepared by: Isaac H. Michaels, DrPH
Data Source: NYC Open Data
| FDNY EMS Incident Volume, by Borough: Police 10-13, Unconfirmed |
||||||
| January 01, 2025 to July 01, 2026 | ||||||
| Borough |
Latest Year: 2026
|
All Years: 2025-2026
|
||||
|---|---|---|---|---|---|---|
| Incidents | % | Rate per 1,000 Population | Total Incidents | % | Monthly Trend | |
| Bronx | 201 | 30% | 0.1 | 546 | 28% | |
| Brooklyn | 136 | 20% | 0.1 | 393 | 20% | |
| Manhattan | 253 | 38% | 0.2 | 673 | 35% | |
| Queens | 70 | 10% | 0.0 | 259 | 13% | |
| Staten Island | 11 | 2% | 0.0 | 49 | 3% | |
| Table Prepred by: Isaac H. Michaels, DrPH | ||||||
| Data Source: NYC Open Data | ||||||
Table Prepared by: Isaac H. Michaels, DrPH
EMS Data Source: NYC Open Data
Population Data Source: Health Data NY
| FDNY EMS Incident Volume, by Severity Level: Police 10-13, Unconfirmed |
||||
| January 01, 2025 to July 01, 2026 | ||||
| Final Severity Level |
Latest Year: 2026
|
All Years: 2025-2026
|
||
|---|---|---|---|---|
| Incidents | % | Incidents | % | |
| 1 | 0 | 0% | 0 | 0% |
| 2 | 1 | 0% | 1 | 0% |
| 3 | 0 | 0% | 1 | 0% |
| 4 | 0 | 0% | 2 | 0% |
| 5 | 0 | 0% | 0 | 0% |
| 6 | 0 | 0% | 0 | 0% |
| 7 | 670 | 100% | 1,916 | 100% |
| 8 | 0 | 0% | 0 | 0% |
| Table Prepred by: Isaac H. Michaels, DrPH | ||||
| Data Source: NYC Open Data | ||||
Table Prepared by: Isaac H. Michaels, DrPH
Data Source: NYC Open Data
| FDNY EMS Incident Volume, by Disposition: Police 10-13, Unconfirmed |
||||
| January 01, 2025 to July 01, 2026 | ||||
| Disposition |
Latest Year: 2026
|
All Years: 2025-2026
|
||
|---|---|---|---|---|
| Incidents | % | Incidents | % | |
| Cancelled | 56 | 8% | 248 | 13% |
| Condition Corrected | 102 | 15% | 377 | 20% |
| Patient Gone on Arrival | 7 | 1% | 24 | 1% |
| Refused Medical Aid | 18 | 3% | 74 | 4% |
| Transporting Patient | 35 | 5% | 136 | 7% |
| Treated and Transported | 1 | 0% | 1 | 0% |
| Unfounded | 105 | 16% | 363 | 19% |
| NA | 347 | 52% | 697 | 36% |
| Table Prepred by: Isaac H. Michaels, DrPH | ||||
| Data Source: NYC Open Data | ||||
Table Prepared by: Isaac H. Michaels, DrPH
Data Source: NYC Open Data
Back to top
Heat Exhaustion
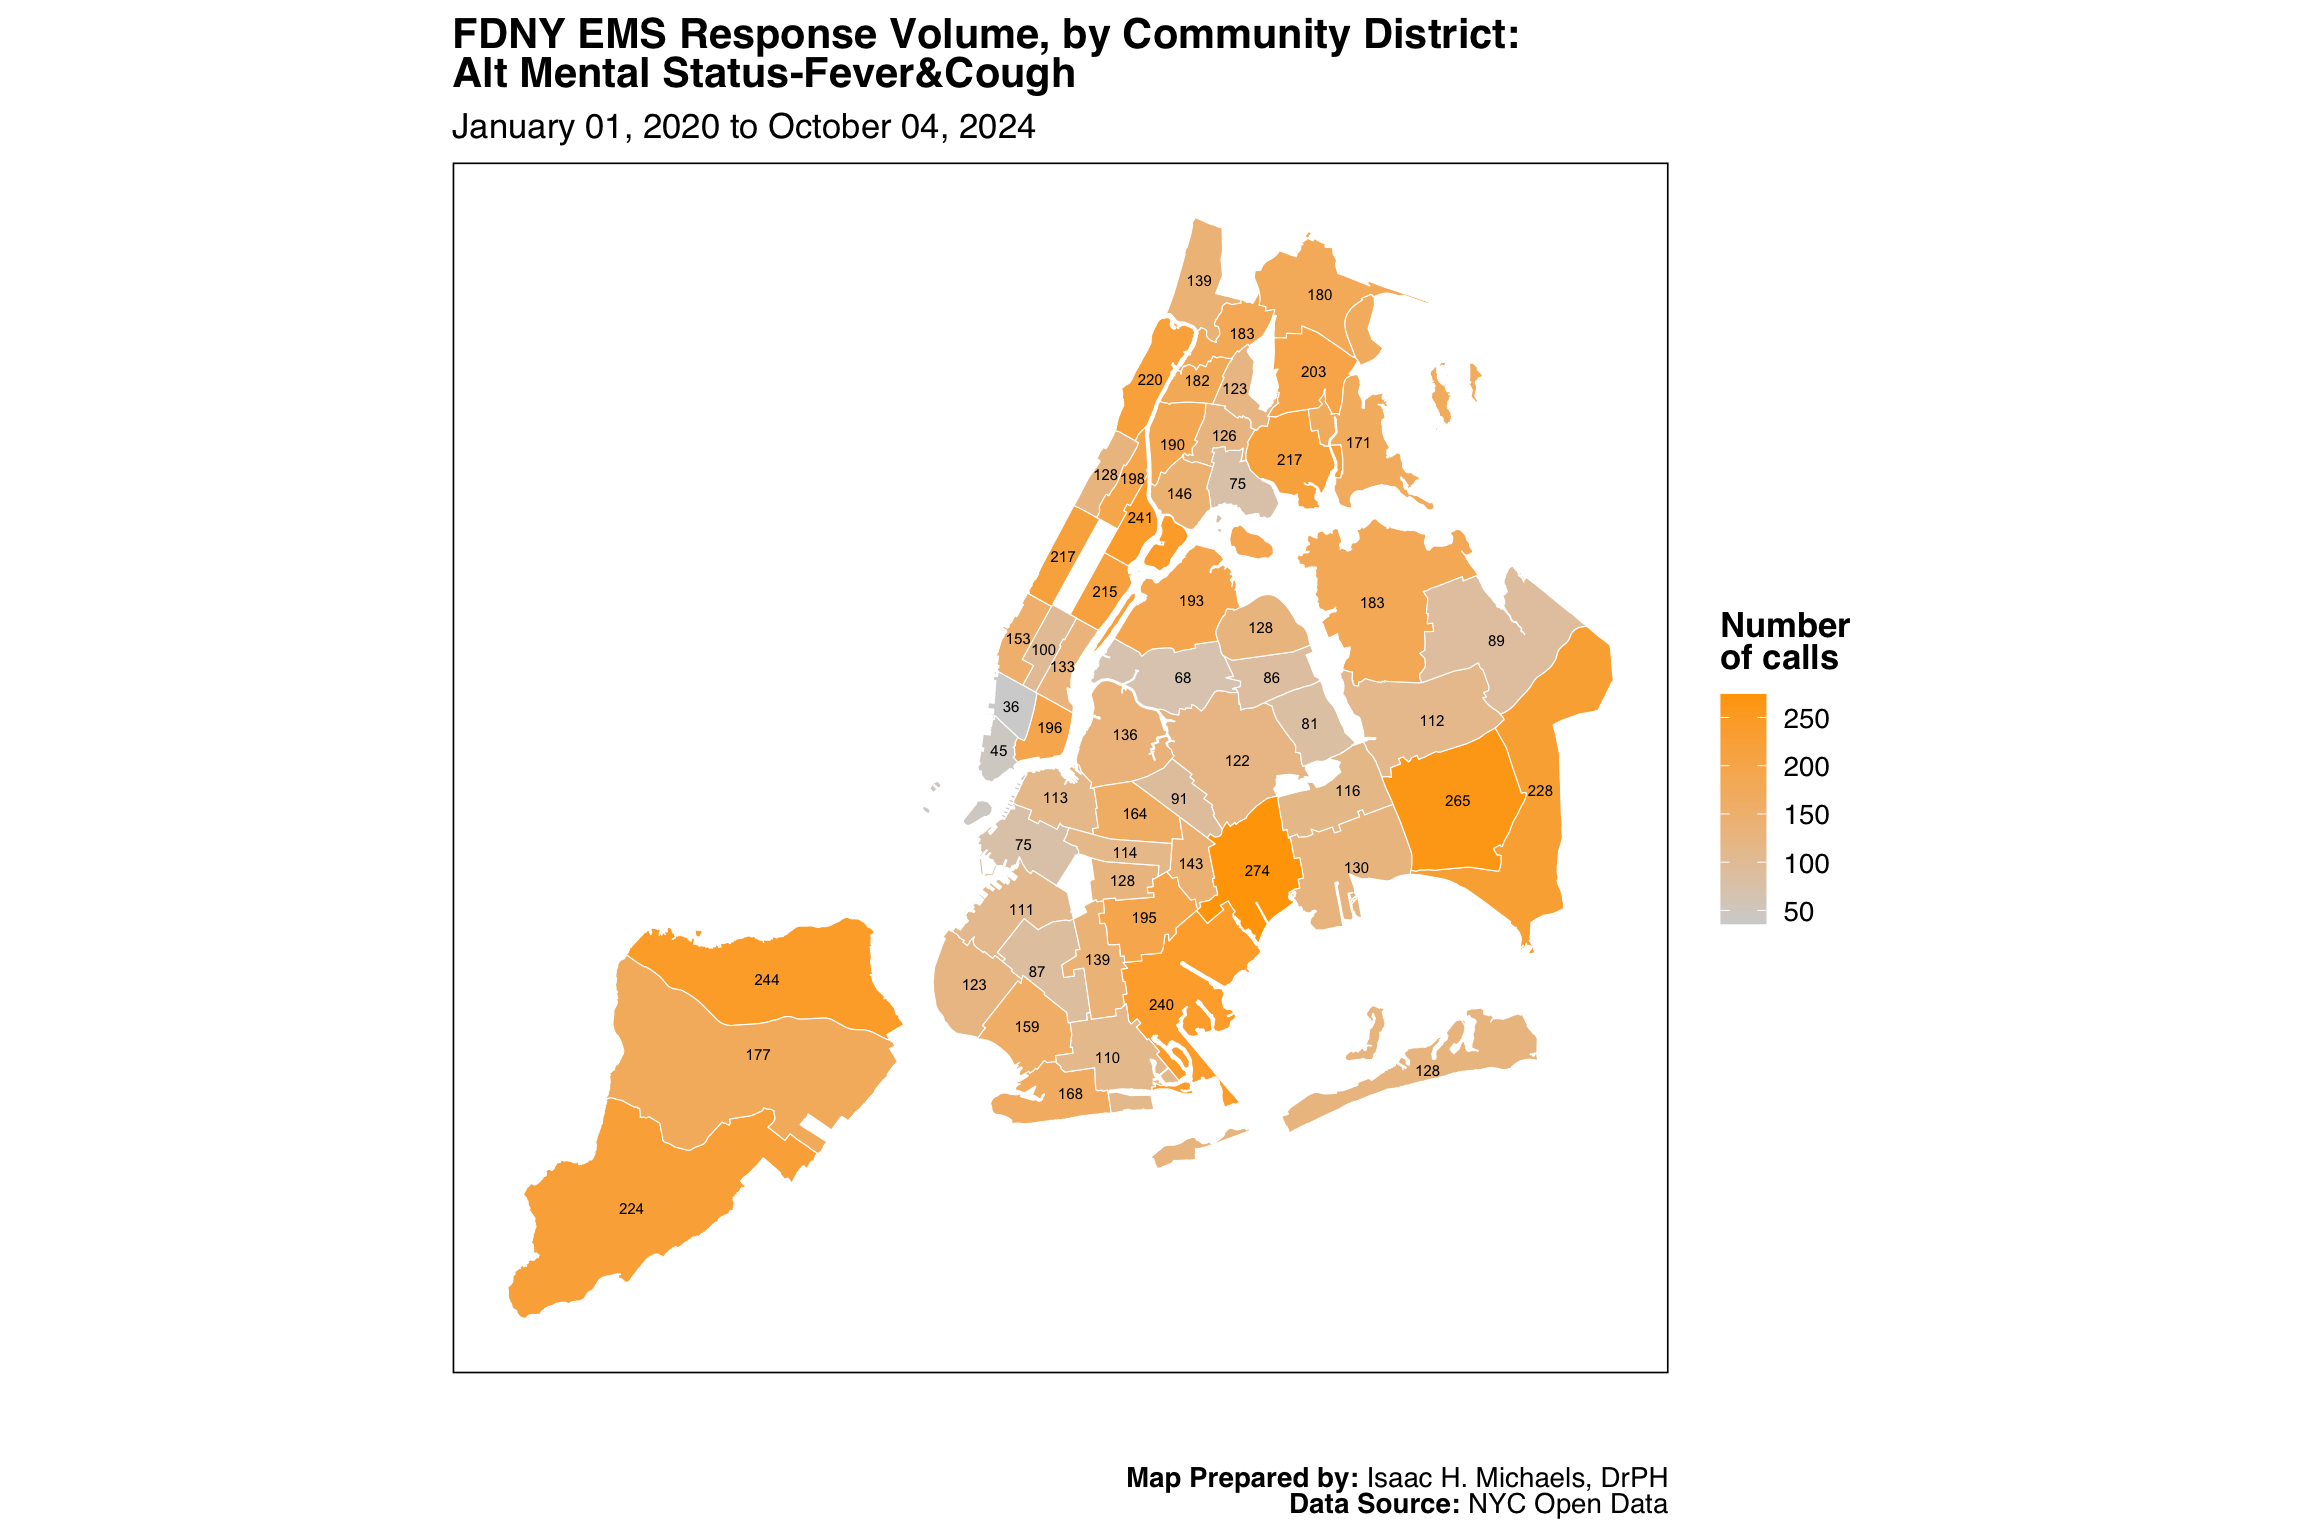
Map Prepared by: Isaac H. Michaels, DrPH
Data Source: NYC Open Data
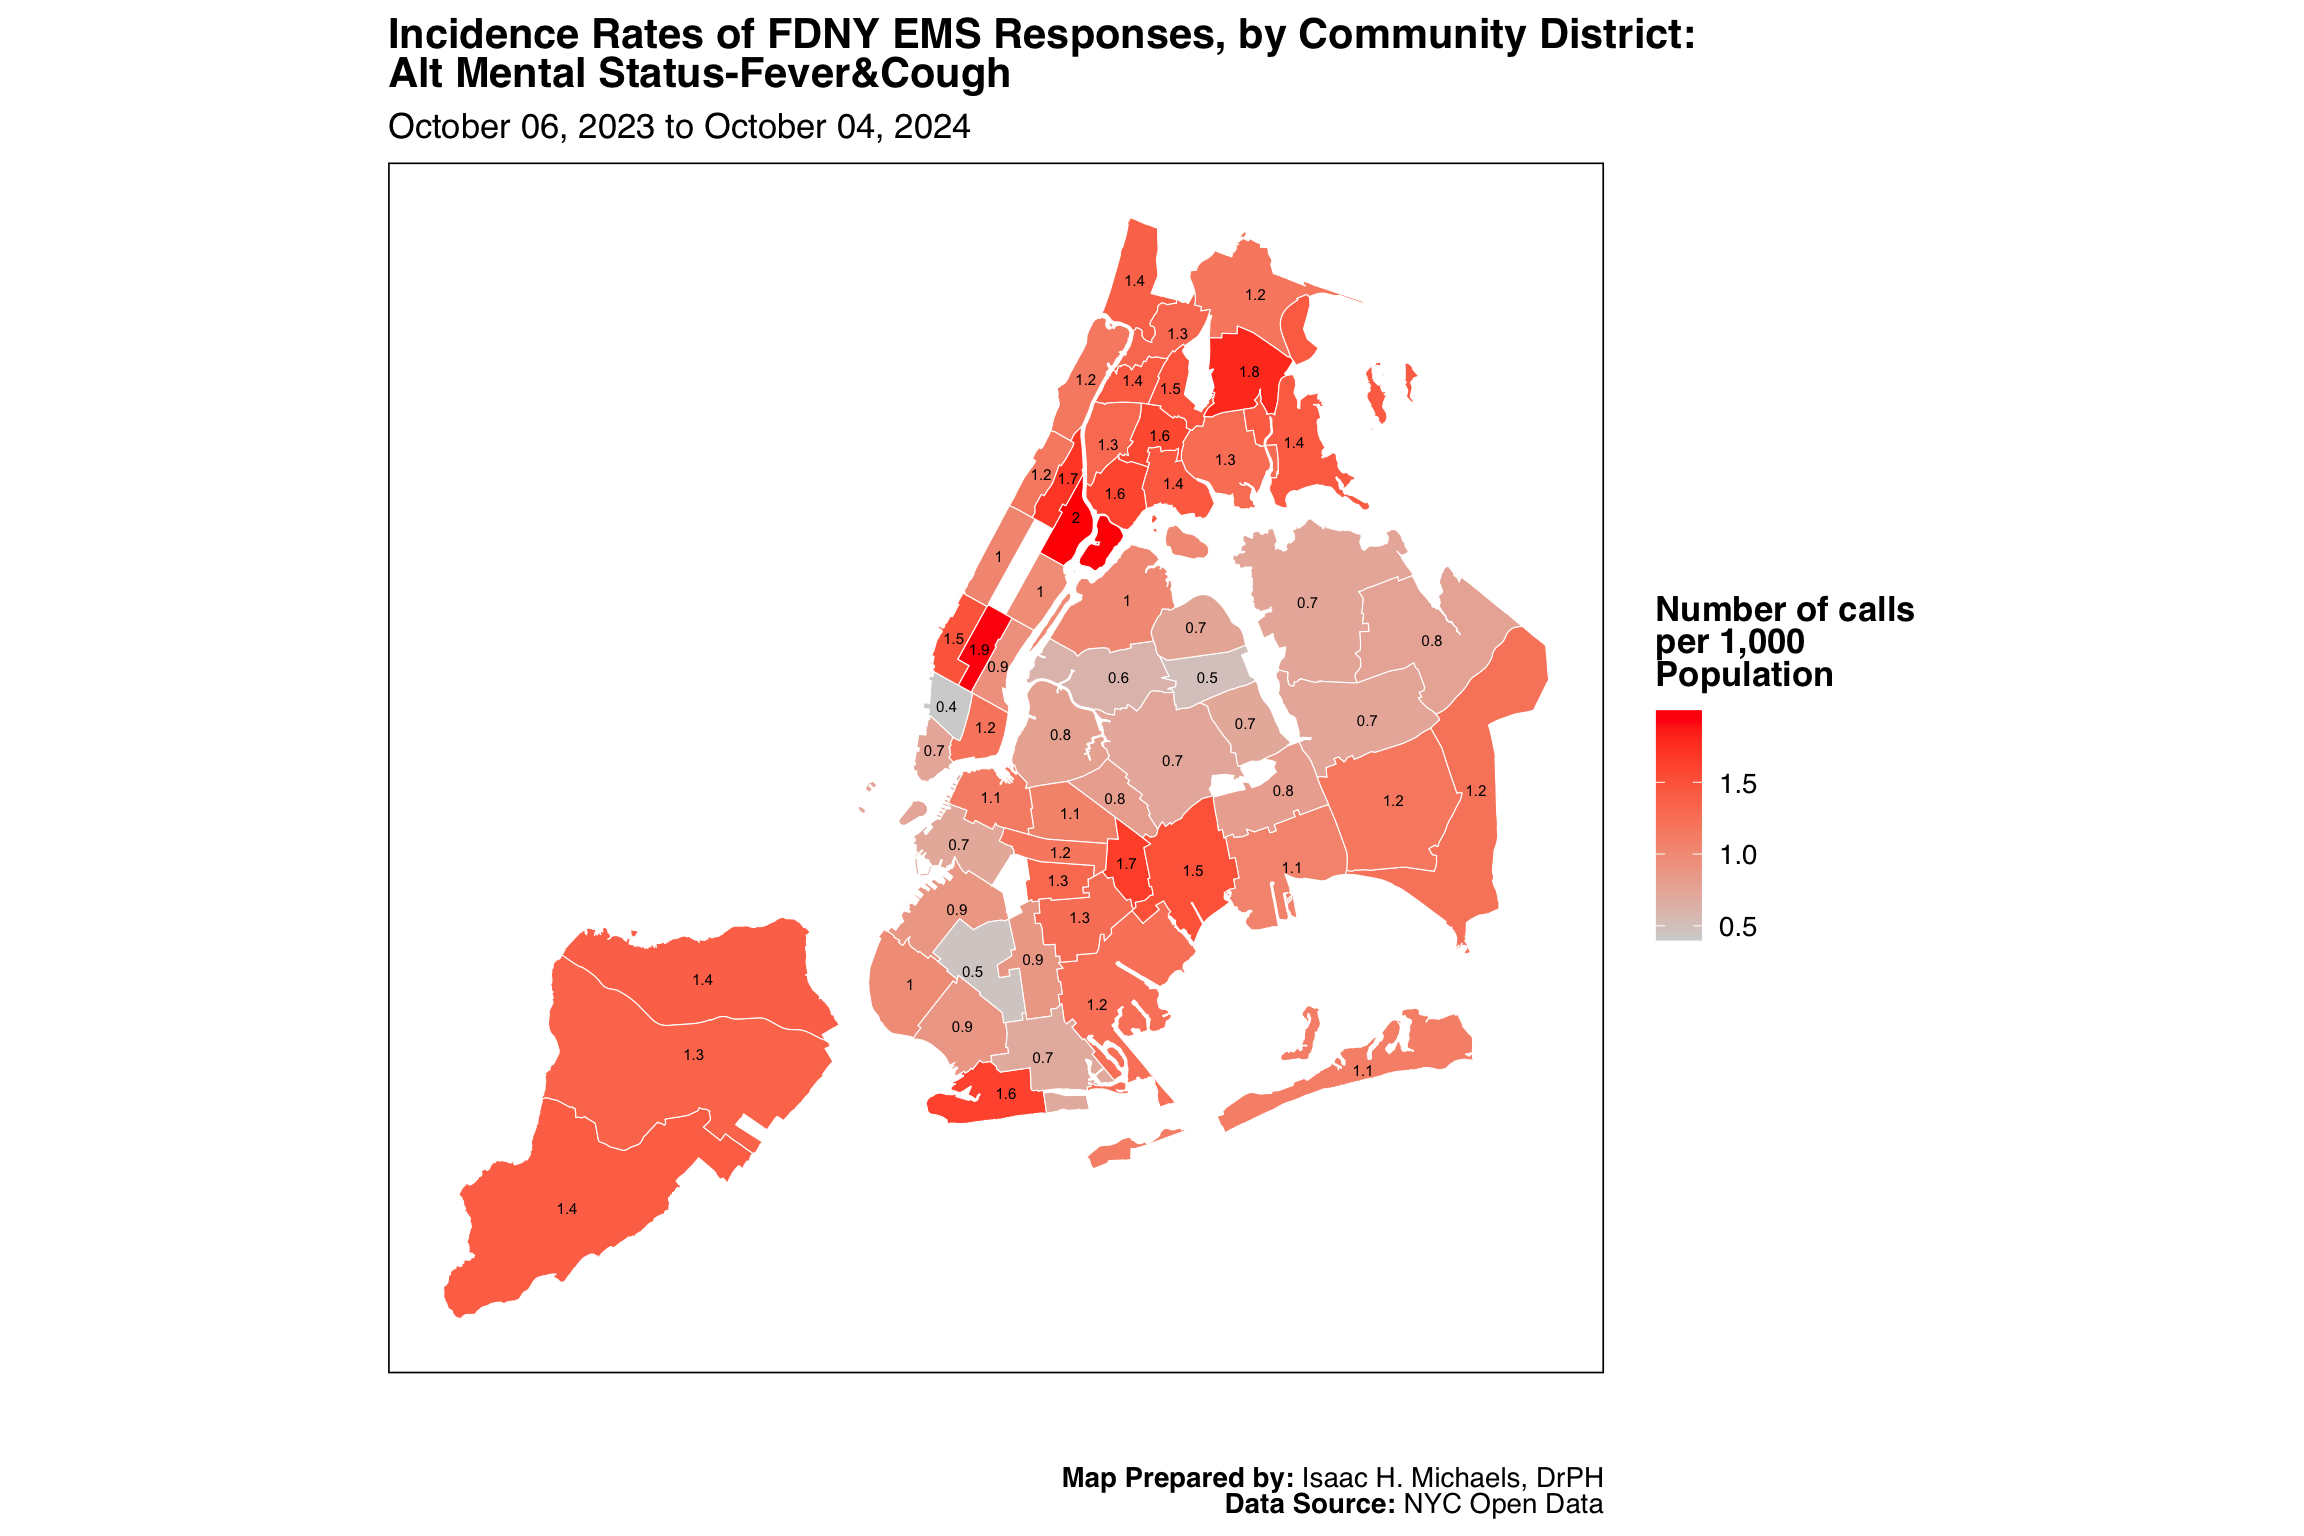
Map Prepared by: Isaac H. Michaels, DrPH
EMS Data Source: NYC Open Data
Population Data Source: NYC Open Data
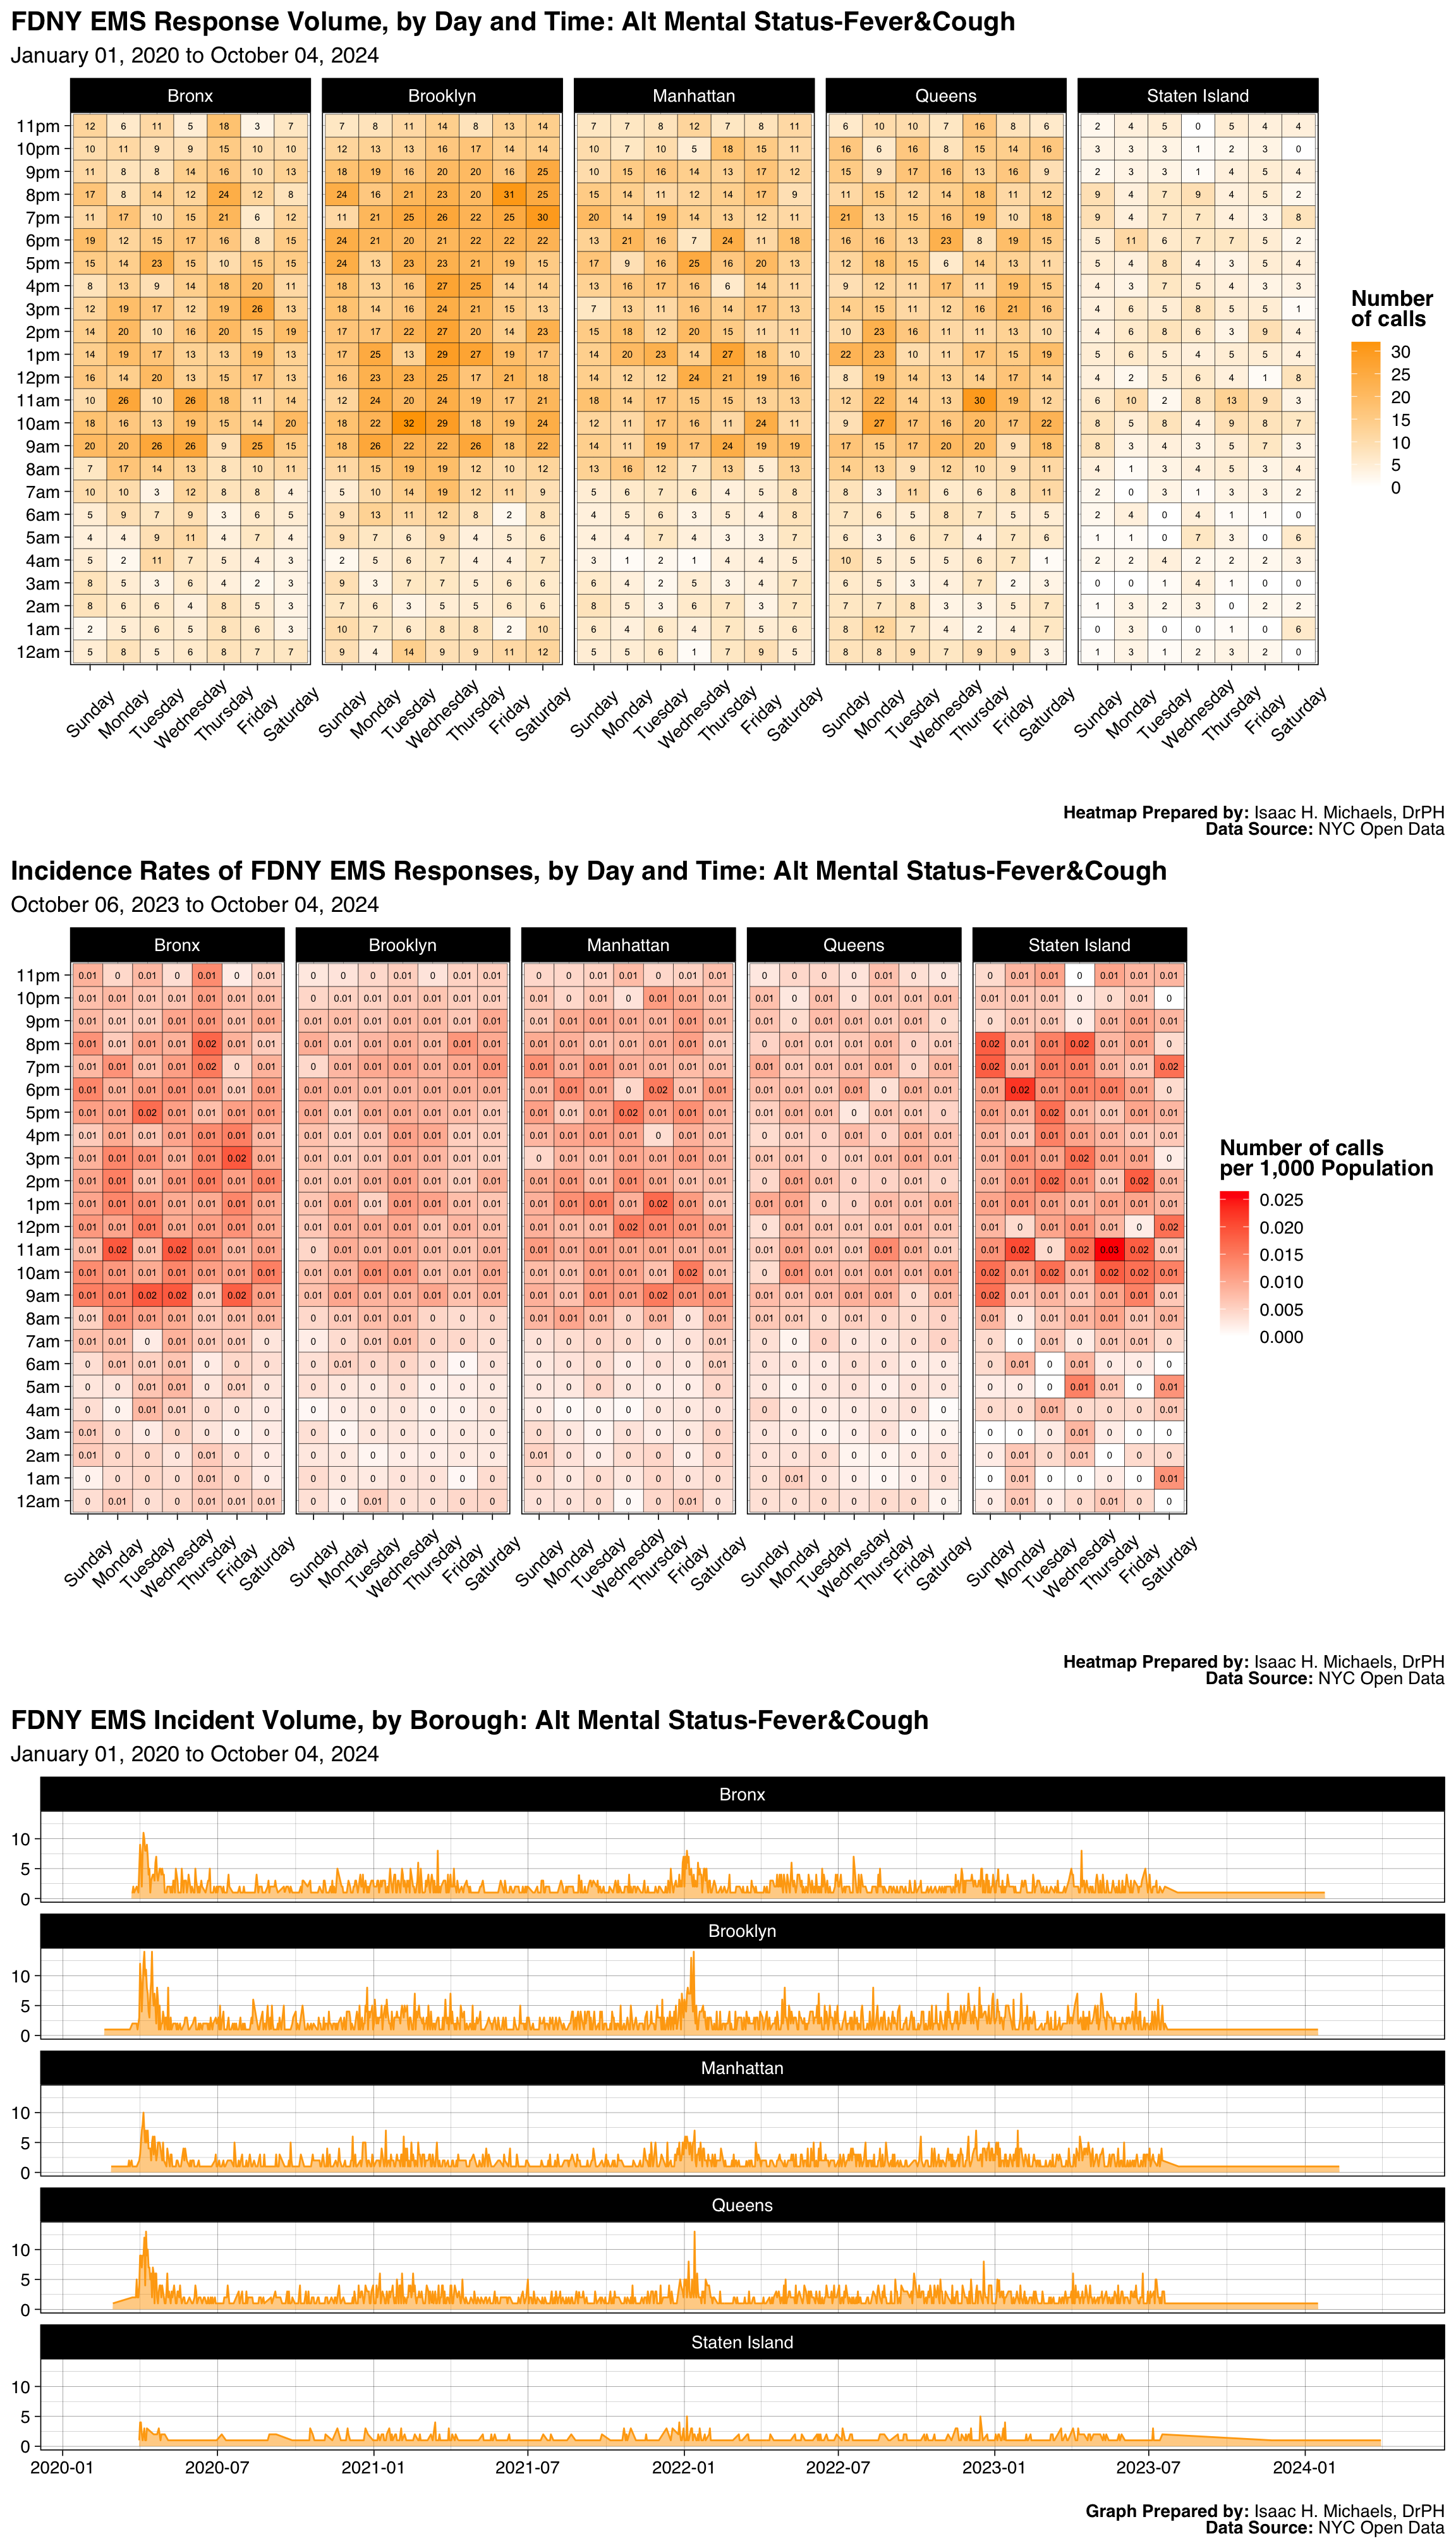
Graphs Prepared by: Isaac H. Michaels, DrPH
Data Source: NYC Open Data
| FDNY EMS Incident Volume, by Borough: Heat Exhaustion |
||||||
| January 01, 2025 to July 01, 2026 | ||||||
| Borough |
Latest Year: 2026
|
All Years: 2025-2026
|
||||
|---|---|---|---|---|---|---|
| Incidents | % | Rate per 1,000 Population | Total Incidents | % | Monthly Trend | |
| Bronx | 68 | 18% | 0.0 | 288 | 18% | |
| Brooklyn | 93 | 25% | 0.0 | 407 | 26% | |
| Manhattan | 133 | 36% | 0.1 | 542 | 34% | |
| Queens | 55 | 15% | 0.0 | 276 | 17% | |
| Staten Island | 20 | 5% | 0.0 | 76 | 5% | |
| Table Prepred by: Isaac H. Michaels, DrPH | ||||||
| Data Source: NYC Open Data | ||||||
Table Prepared by: Isaac H. Michaels, DrPH
EMS Data Source: NYC Open Data
Population Data Source: Health Data NY
| FDNY EMS Incident Volume, by Severity Level: Heat Exhaustion |
||||
| January 01, 2025 to July 01, 2026 | ||||
| Final Severity Level |
Latest Year: 2026
|
All Years: 2025-2026
|
||
|---|---|---|---|---|
| Incidents | % | Incidents | % | |
| 1 | 0 | 0% | 0 | 0% |
| 2 | 0 | 0% | 0 | 0% |
| 3 | 3 | 1% | 6 | 0% |
| 4 | 366 | 99% | 1,583 | 100% |
| 5 | 0 | 0% | 0 | 0% |
| 6 | 0 | 0% | 0 | 0% |
| 7 | 0 | 0% | 0 | 0% |
| 8 | 0 | 0% | 0 | 0% |
| Table Prepred by: Isaac H. Michaels, DrPH | ||||
| Data Source: NYC Open Data | ||||
Table Prepared by: Isaac H. Michaels, DrPH
Data Source: NYC Open Data
| FDNY EMS Incident Volume, by Disposition: Heat Exhaustion |
||||
| January 01, 2025 to July 01, 2026 | ||||
| Disposition |
Latest Year: 2026
|
All Years: 2025-2026
|
||
|---|---|---|---|---|
| Incidents | % | Incidents | % | |
| Cancelled | 21 | 6% | 62 | 4% |
| Condition Corrected | 1 | 0% | 15 | 1% |
| Patient Gone on Arrival | 36 | 10% | 135 | 8% |
| Refused Medical Aid | 78 | 21% | 394 | 25% |
| Transporting Patient | 154 | 42% | 739 | 47% |
| Treated and Transported | 1 | 0% | 3 | 0% |
| Unfounded | 54 | 15% | 195 | 12% |
| NA | 24 | 7% | 46 | 3% |
| Table Prepred by: Isaac H. Michaels, DrPH | ||||
| Data Source: NYC Open Data | ||||
Table Prepared by: Isaac H. Michaels, DrPH
Data Source: NYC Open Data
Back to top
Major Burns 18% Adlt 10% Child

Map Prepared by: Isaac H. Michaels, DrPH
Data Source: NYC Open Data
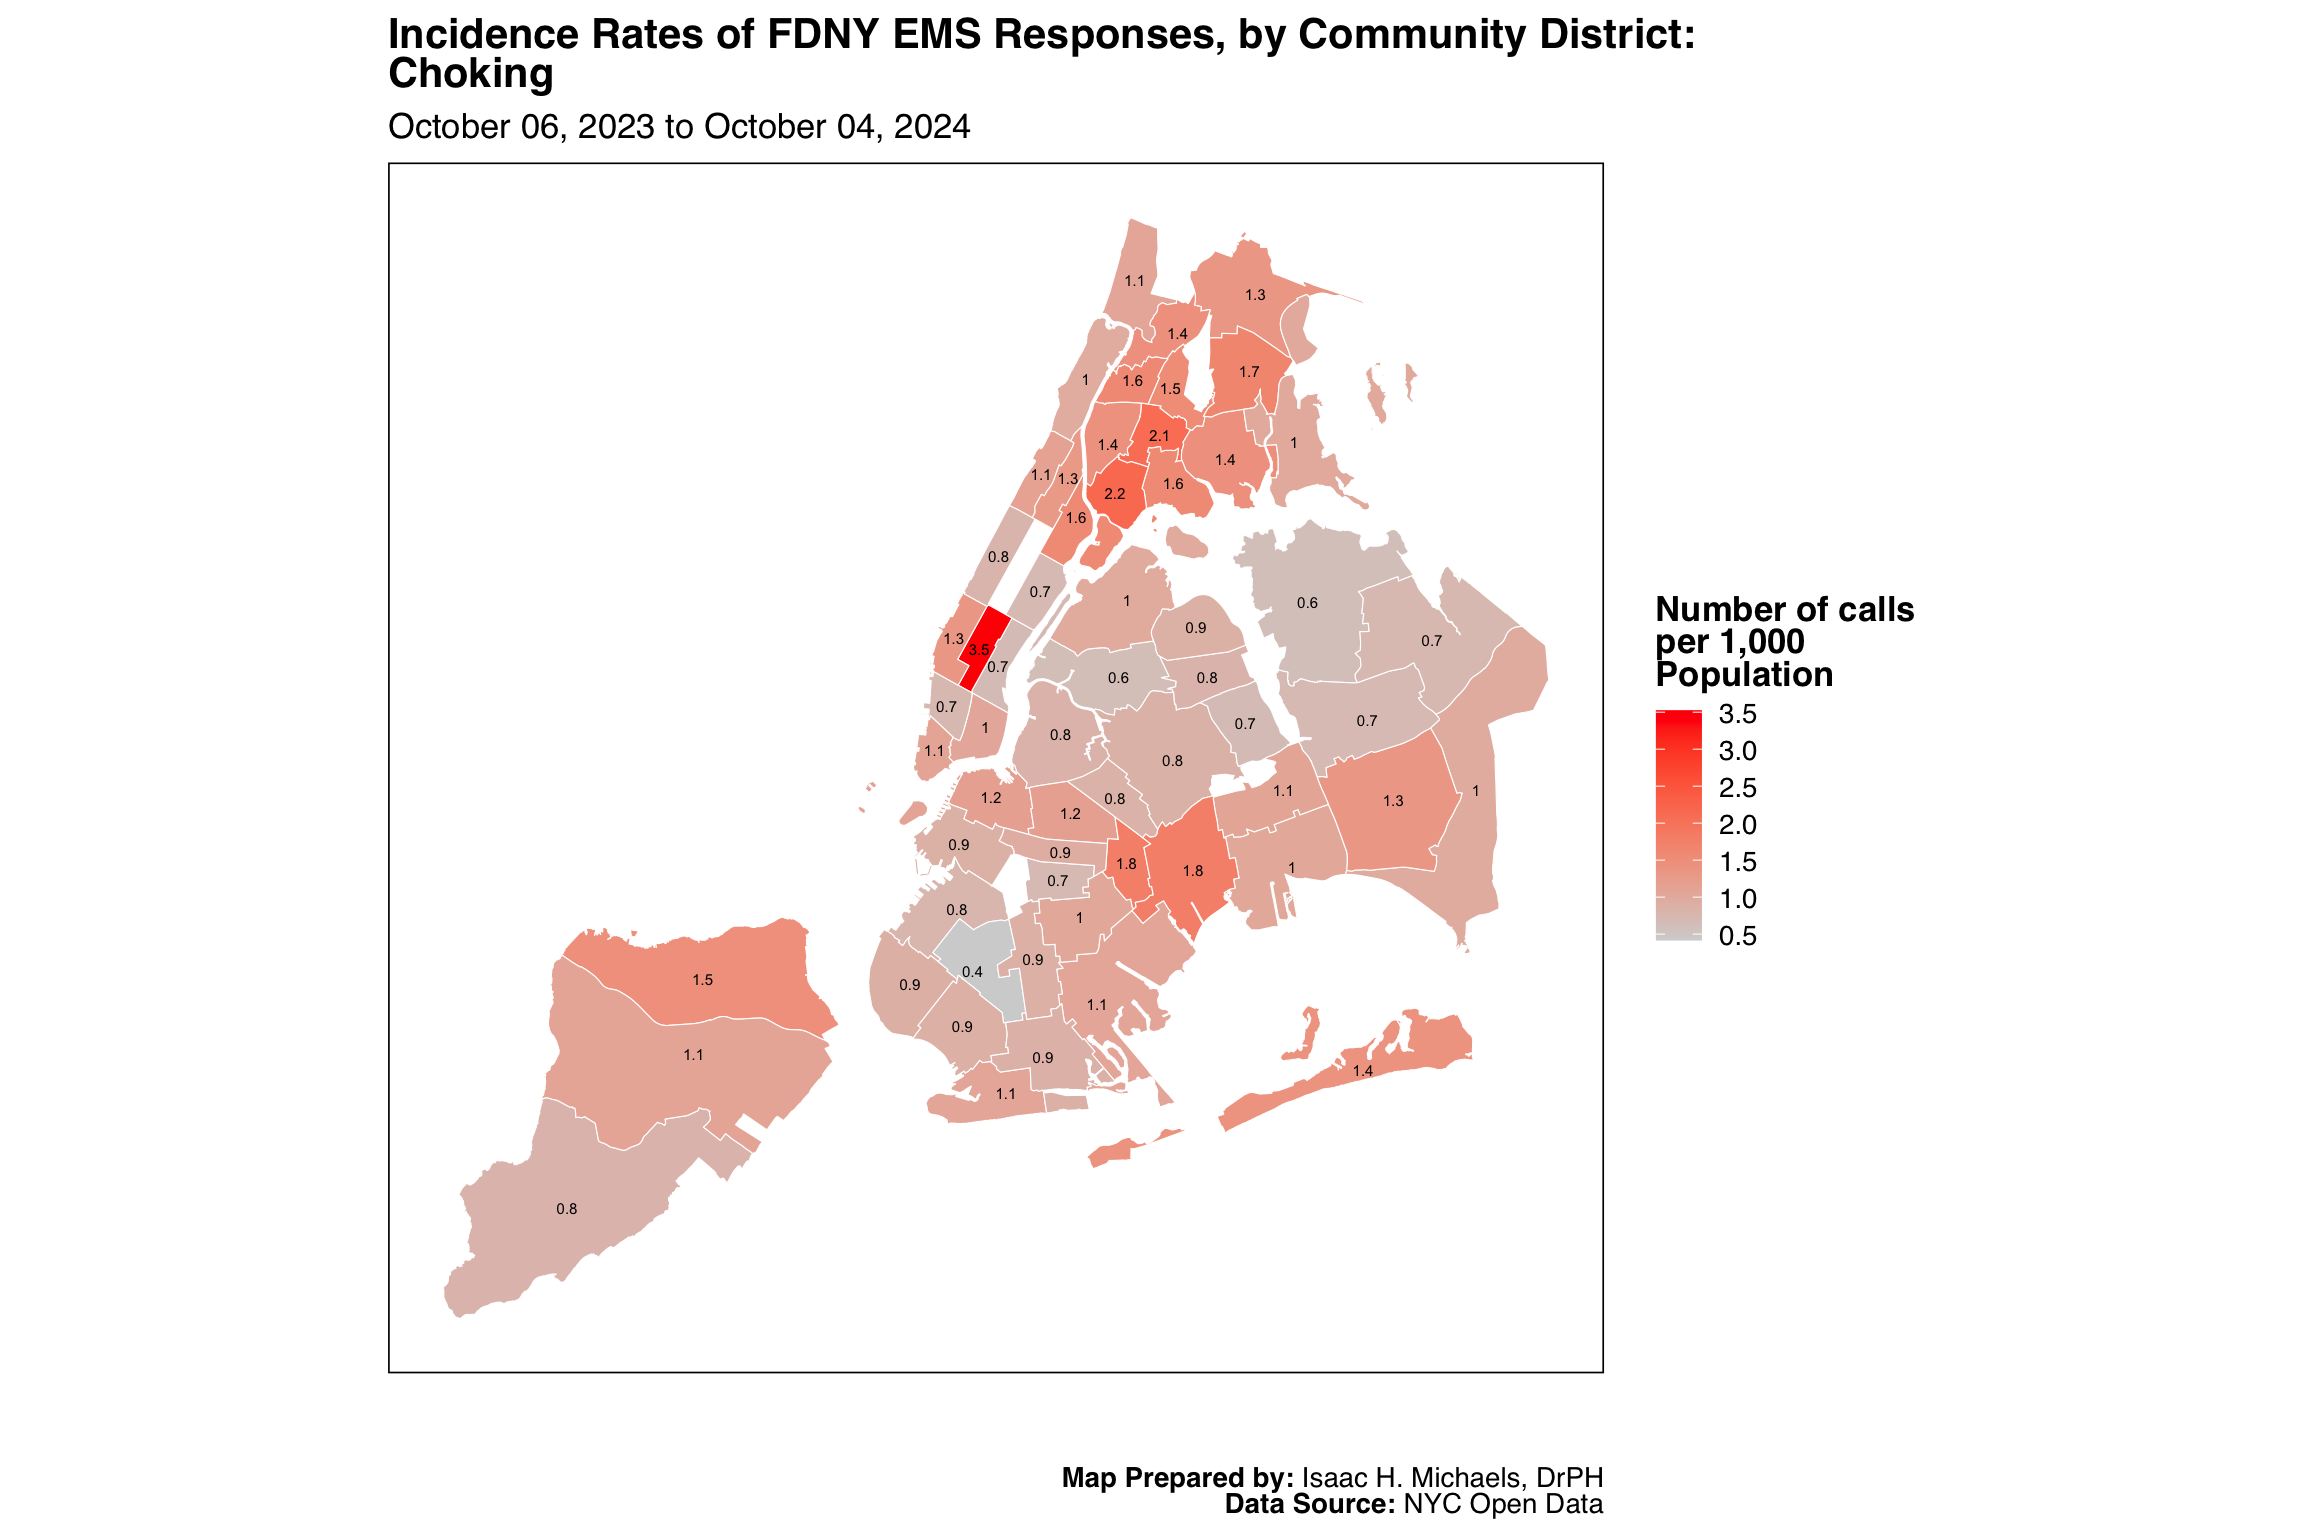
Map Prepared by: Isaac H. Michaels, DrPH
EMS Data Source: NYC Open Data
Population Data Source: NYC Open Data
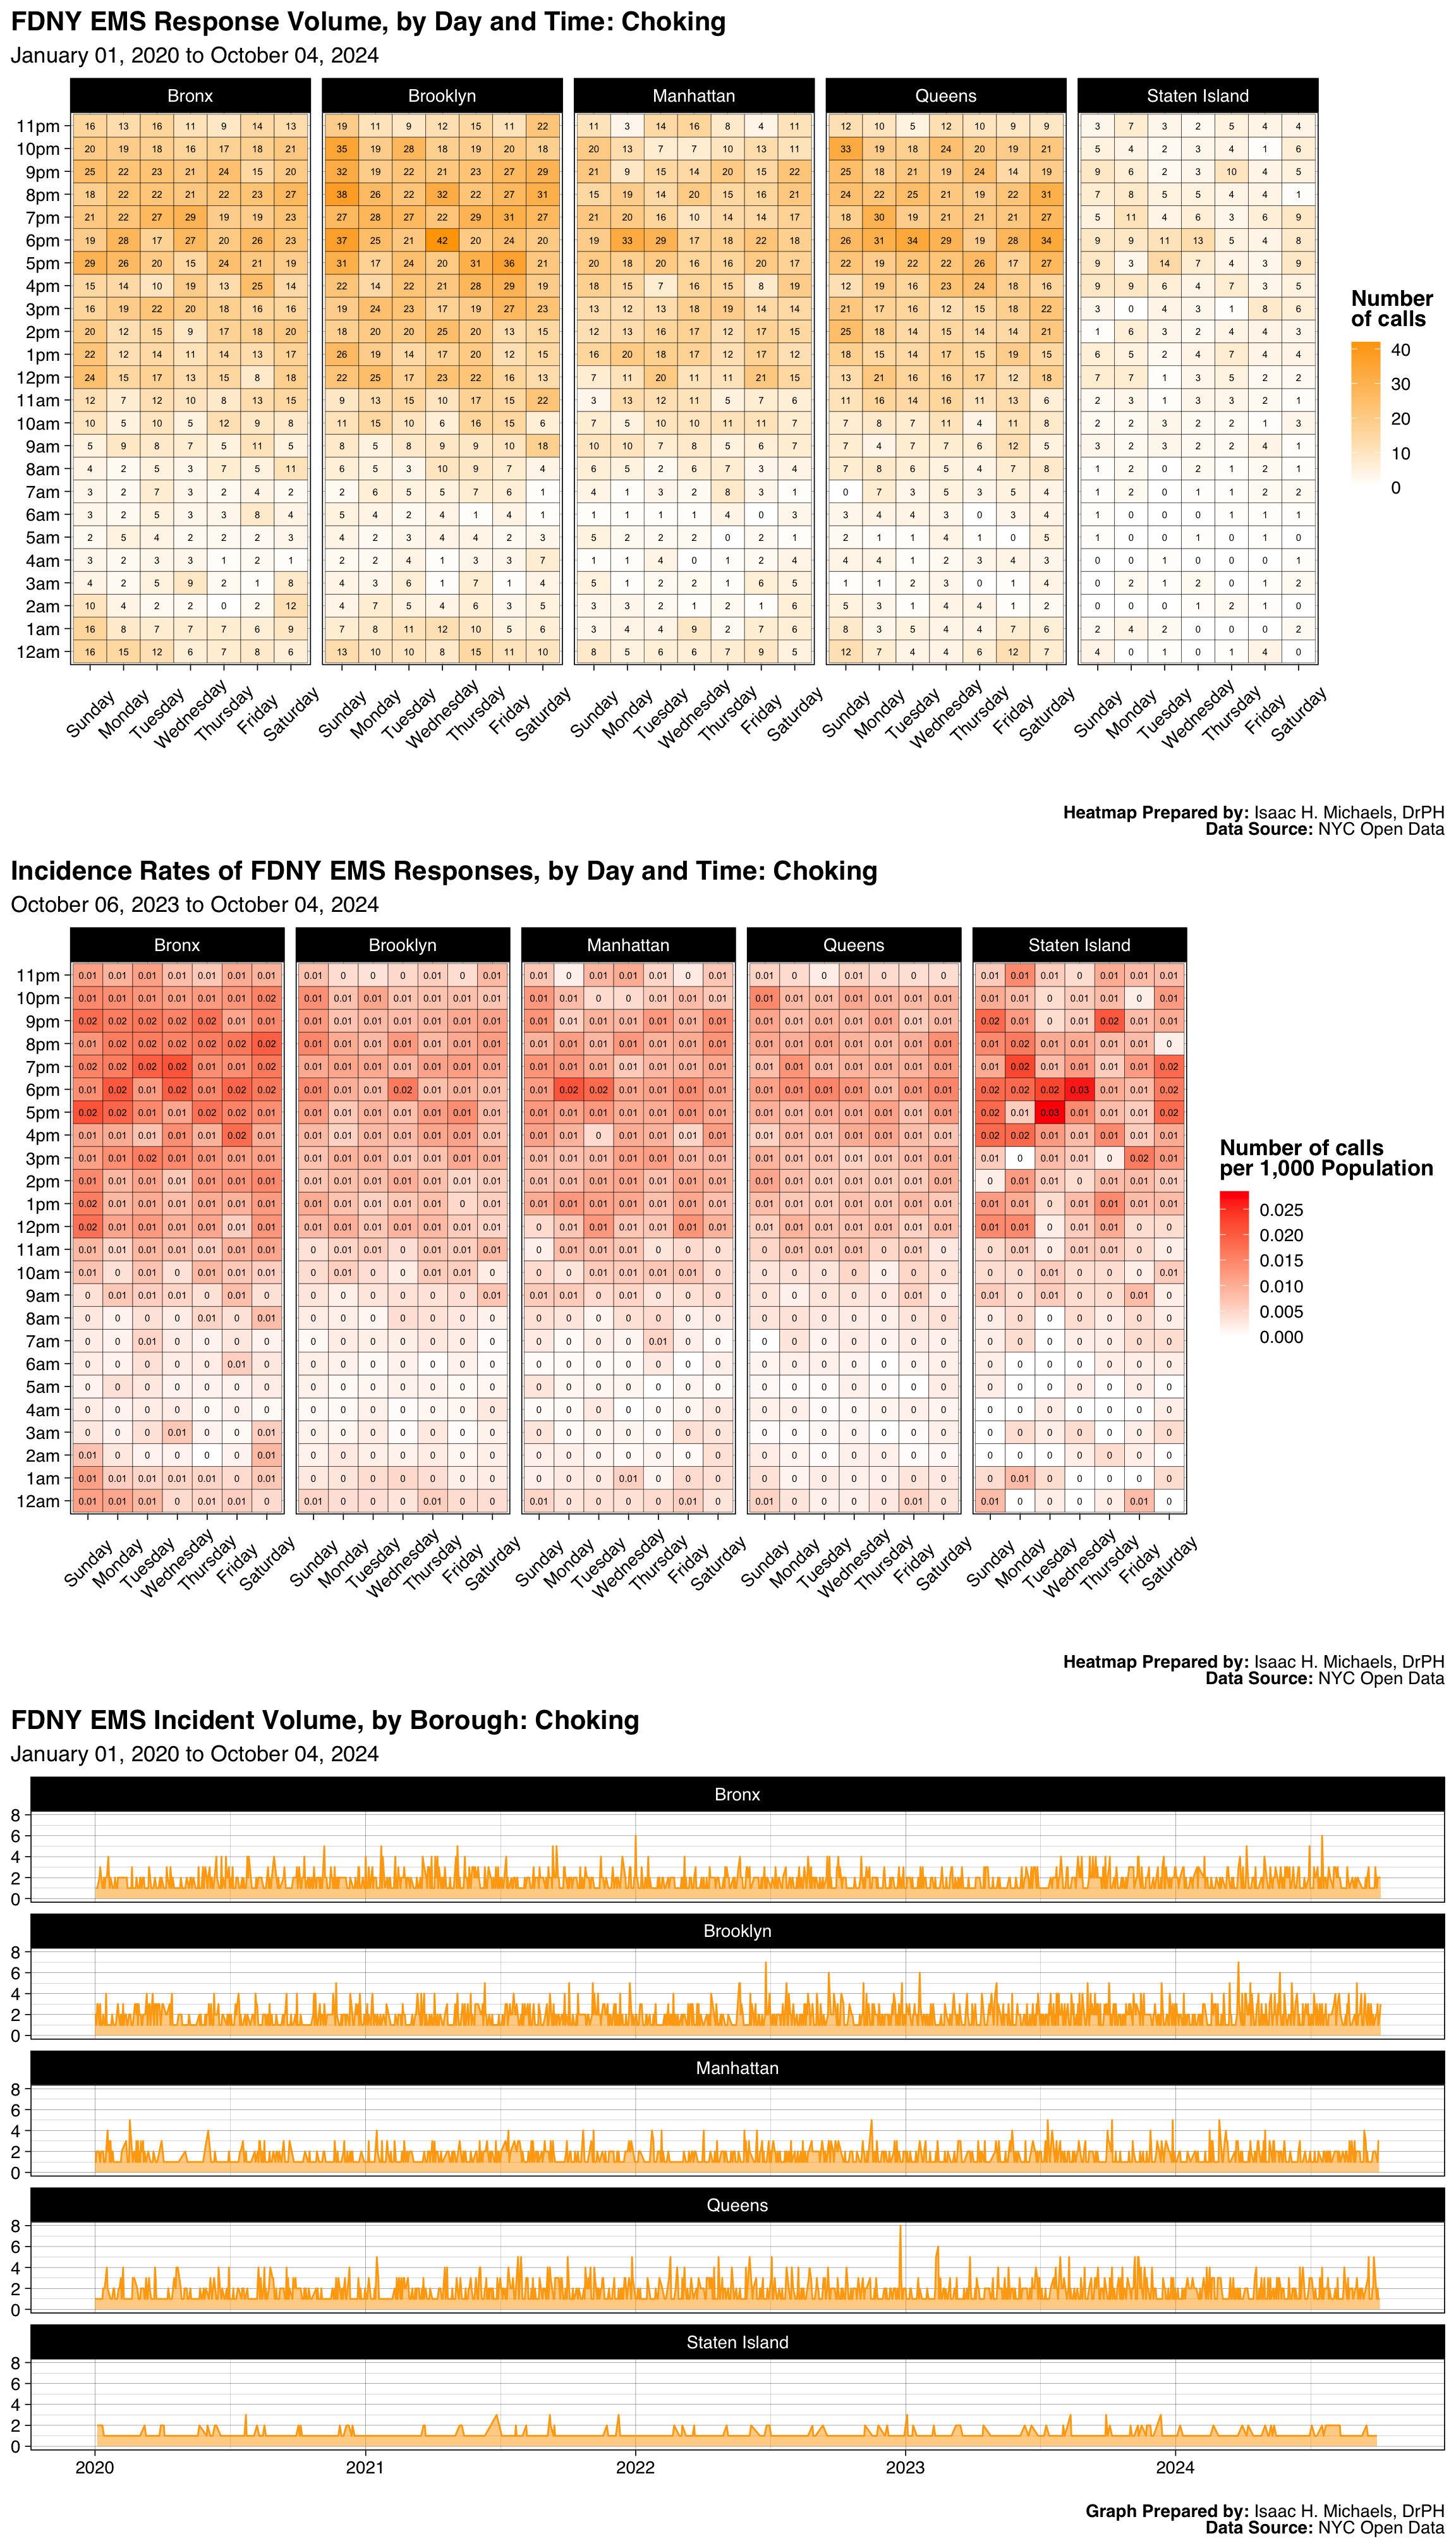
Graphs Prepared by: Isaac H. Michaels, DrPH
Data Source: NYC Open Data
| FDNY EMS Incident Volume, by Borough: Major Burns 18% Adlt 10% Child |
||||||
| January 01, 2025 to July 01, 2026 | ||||||
| Borough |
Latest Year: 2026
|
All Years: 2025-2026
|
||||
|---|---|---|---|---|---|---|
| Incidents | % | Rate per 1,000 Population | Total Incidents | % | Monthly Trend | |
| Bronx | 156 | 25% | 0.1 | 373 | 24% | |
| Brooklyn | 187 | 31% | 0.1 | 476 | 31% | |
| Manhattan | 118 | 19% | 0.1 | 296 | 19% | |
| Queens | 120 | 20% | 0.1 | 321 | 21% | |
| Staten Island | 32 | 5% | 0.1 | 74 | 5% | |
| Table Prepred by: Isaac H. Michaels, DrPH | ||||||
| Data Source: NYC Open Data | ||||||
Table Prepared by: Isaac H. Michaels, DrPH
EMS Data Source: NYC Open Data
Population Data Source: Health Data NY
| FDNY EMS Incident Volume, by Severity Level: Major Burns 18% Adlt 10% Child |
||||
| January 01, 2025 to July 01, 2026 | ||||
| Final Severity Level |
Latest Year: 2026
|
All Years: 2025-2026
|
||
|---|---|---|---|---|
| Incidents | % | Incidents | % | |
| 1 | 0 | 0% | 0 | 0% |
| 2 | 0 | 0% | 0 | 0% |
| 3 | 612 | 100% | 1,532 | 99% |
| 4 | 1 | 0% | 8 | 1% |
| 5 | 0 | 0% | 0 | 0% |
| 6 | 0 | 0% | 0 | 0% |
| 7 | 0 | 0% | 0 | 0% |
| 8 | 0 | 0% | 0 | 0% |
| Table Prepred by: Isaac H. Michaels, DrPH | ||||
| Data Source: NYC Open Data | ||||
Table Prepared by: Isaac H. Michaels, DrPH
Data Source: NYC Open Data
| FDNY EMS Incident Volume, by Disposition: Major Burns 18% Adlt 10% Child |
||||
| January 01, 2025 to July 01, 2026 | ||||
| Disposition |
Latest Year: 2026
|
All Years: 2025-2026
|
||
|---|---|---|---|---|
| Incidents | % | Incidents | % | |
| Cancelled | 21 | 3% | 60 | 4% |
| Condition Corrected | 11 | 2% | 39 | 3% |
| Patient Gone on Arrival | 11 | 2% | 29 | 2% |
| Patient Pronounced Dead | 1 | 0% | 2 | 0% |
| Refused Medical Aid | 94 | 15% | 205 | 13% |
| Transporting Patient | 438 | 71% | 1,111 | 72% |
| Unfounded | 36 | 6% | 91 | 6% |
| NA | 1 | 0% | 3 | 0% |
| Table Prepred by: Isaac H. Michaels, DrPH | ||||
| Data Source: NYC Open Data | ||||
Table Prepared by: Isaac H. Michaels, DrPH
Data Source: NYC Open Data
Back to top
Jumper Up
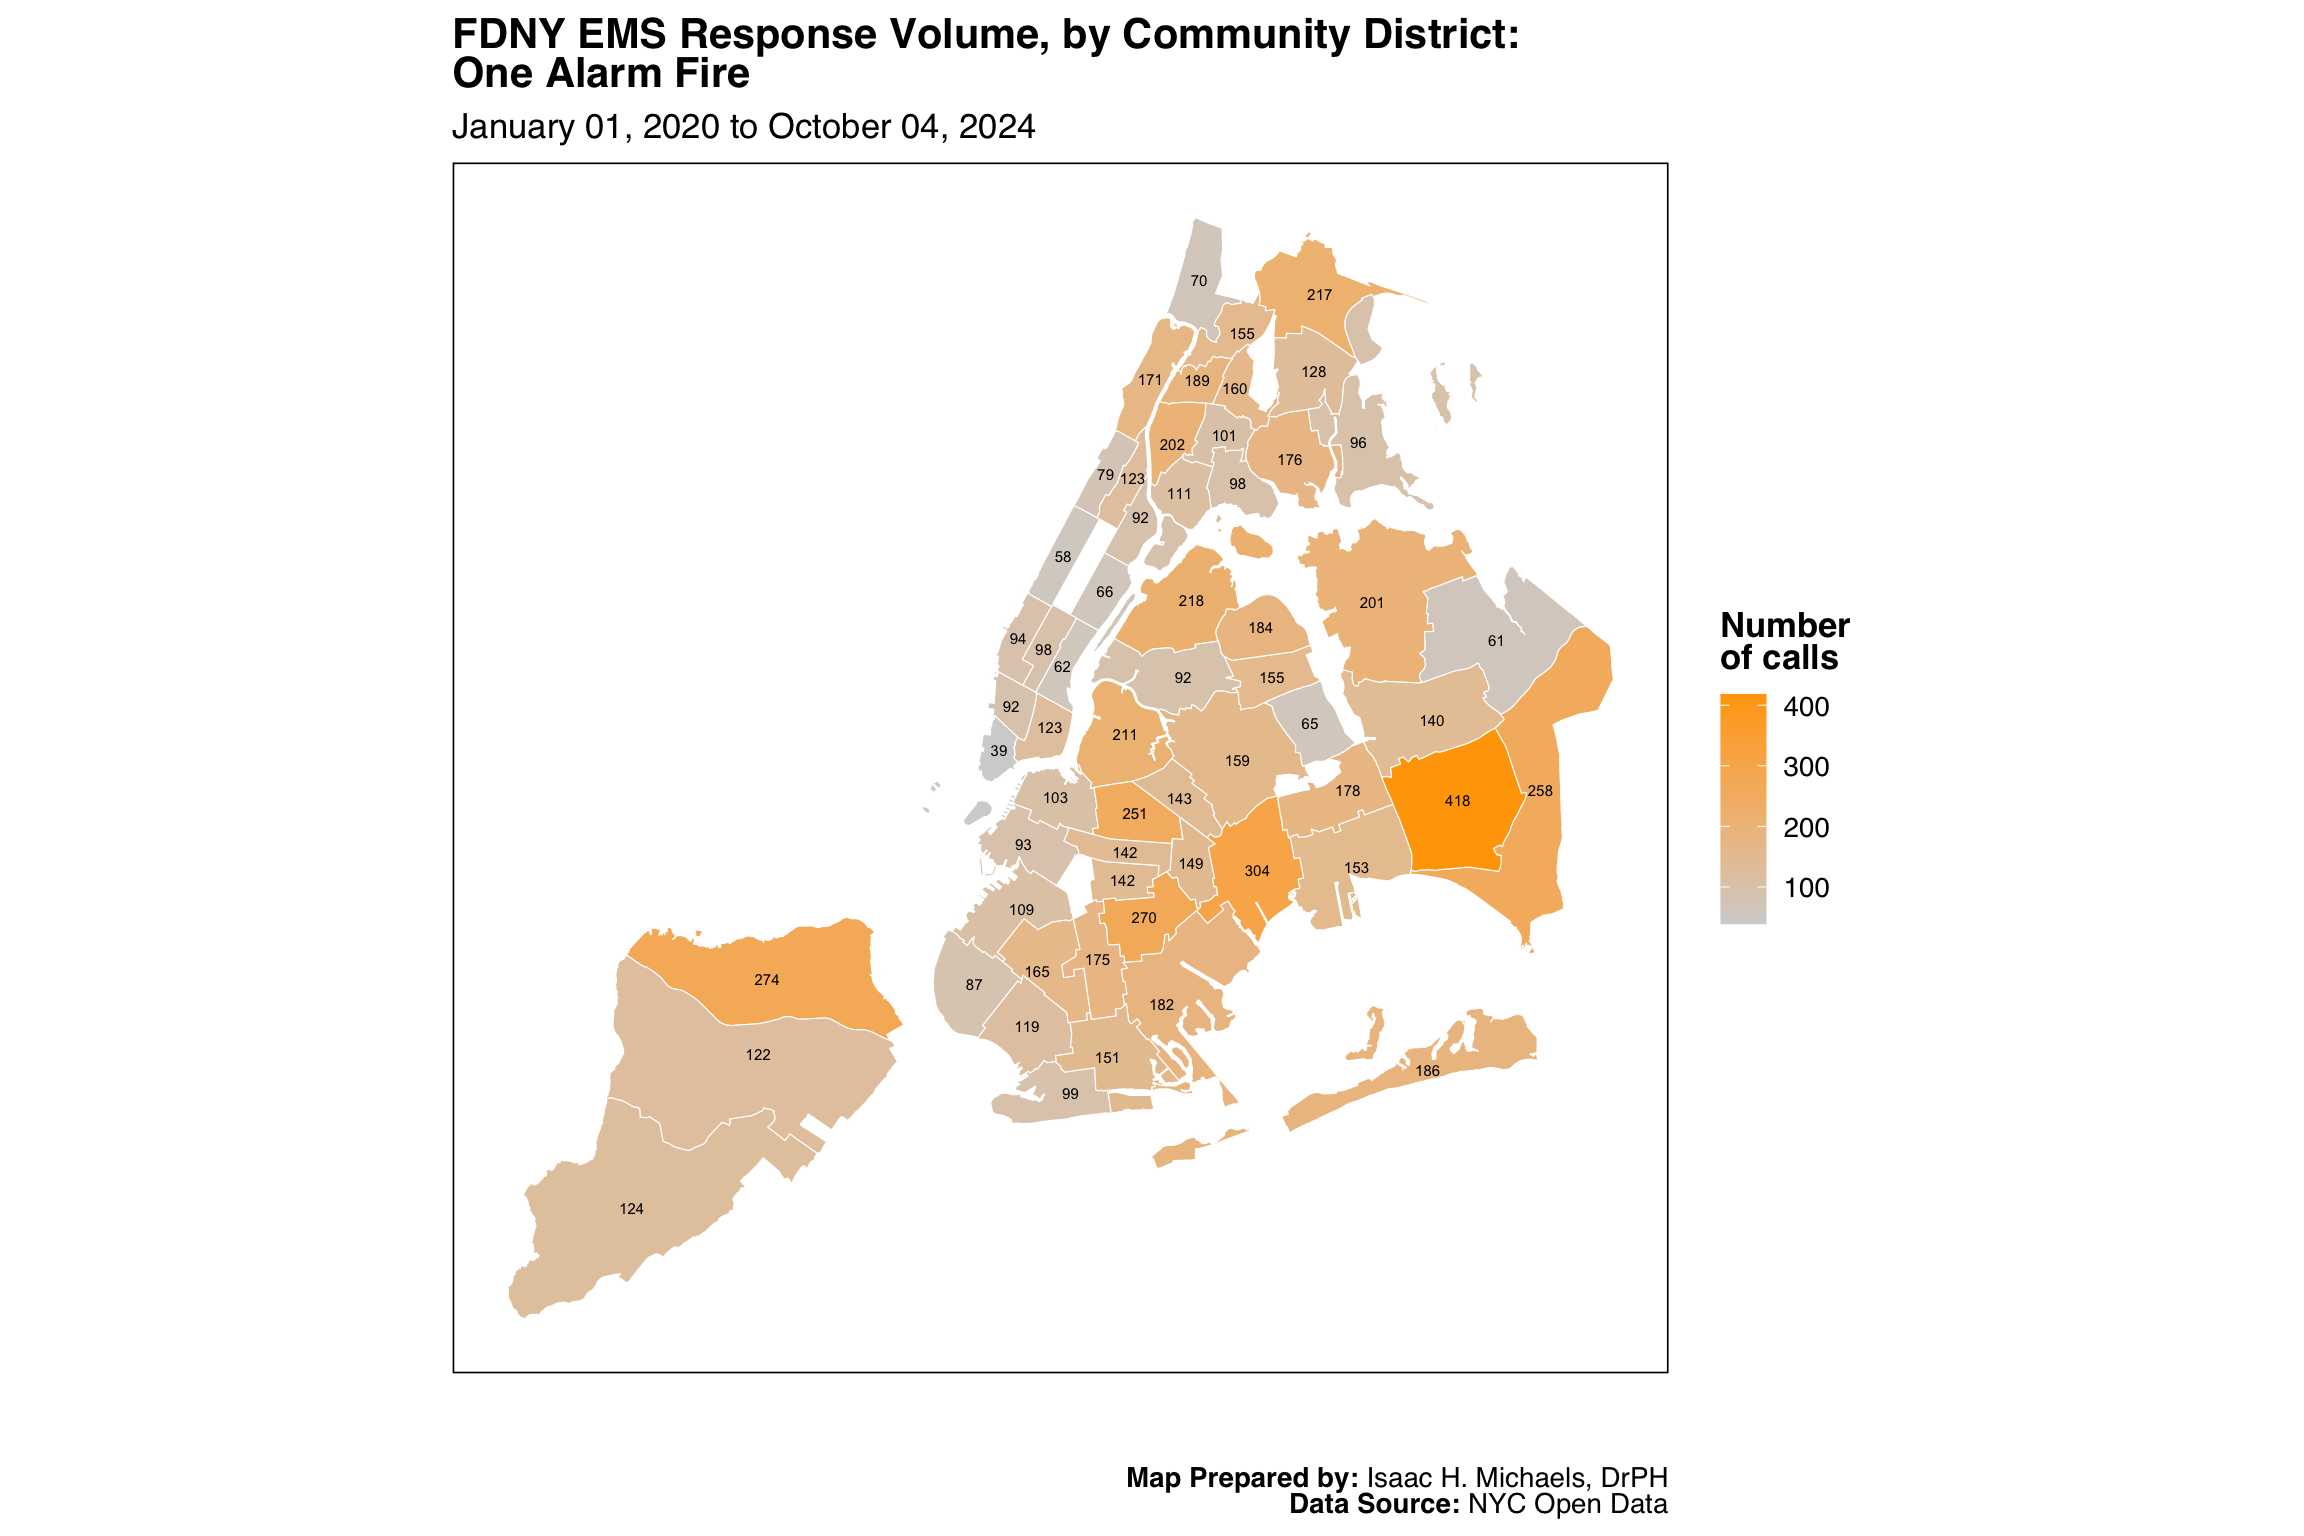
Map Prepared by: Isaac H. Michaels, DrPH
Data Source: NYC Open Data
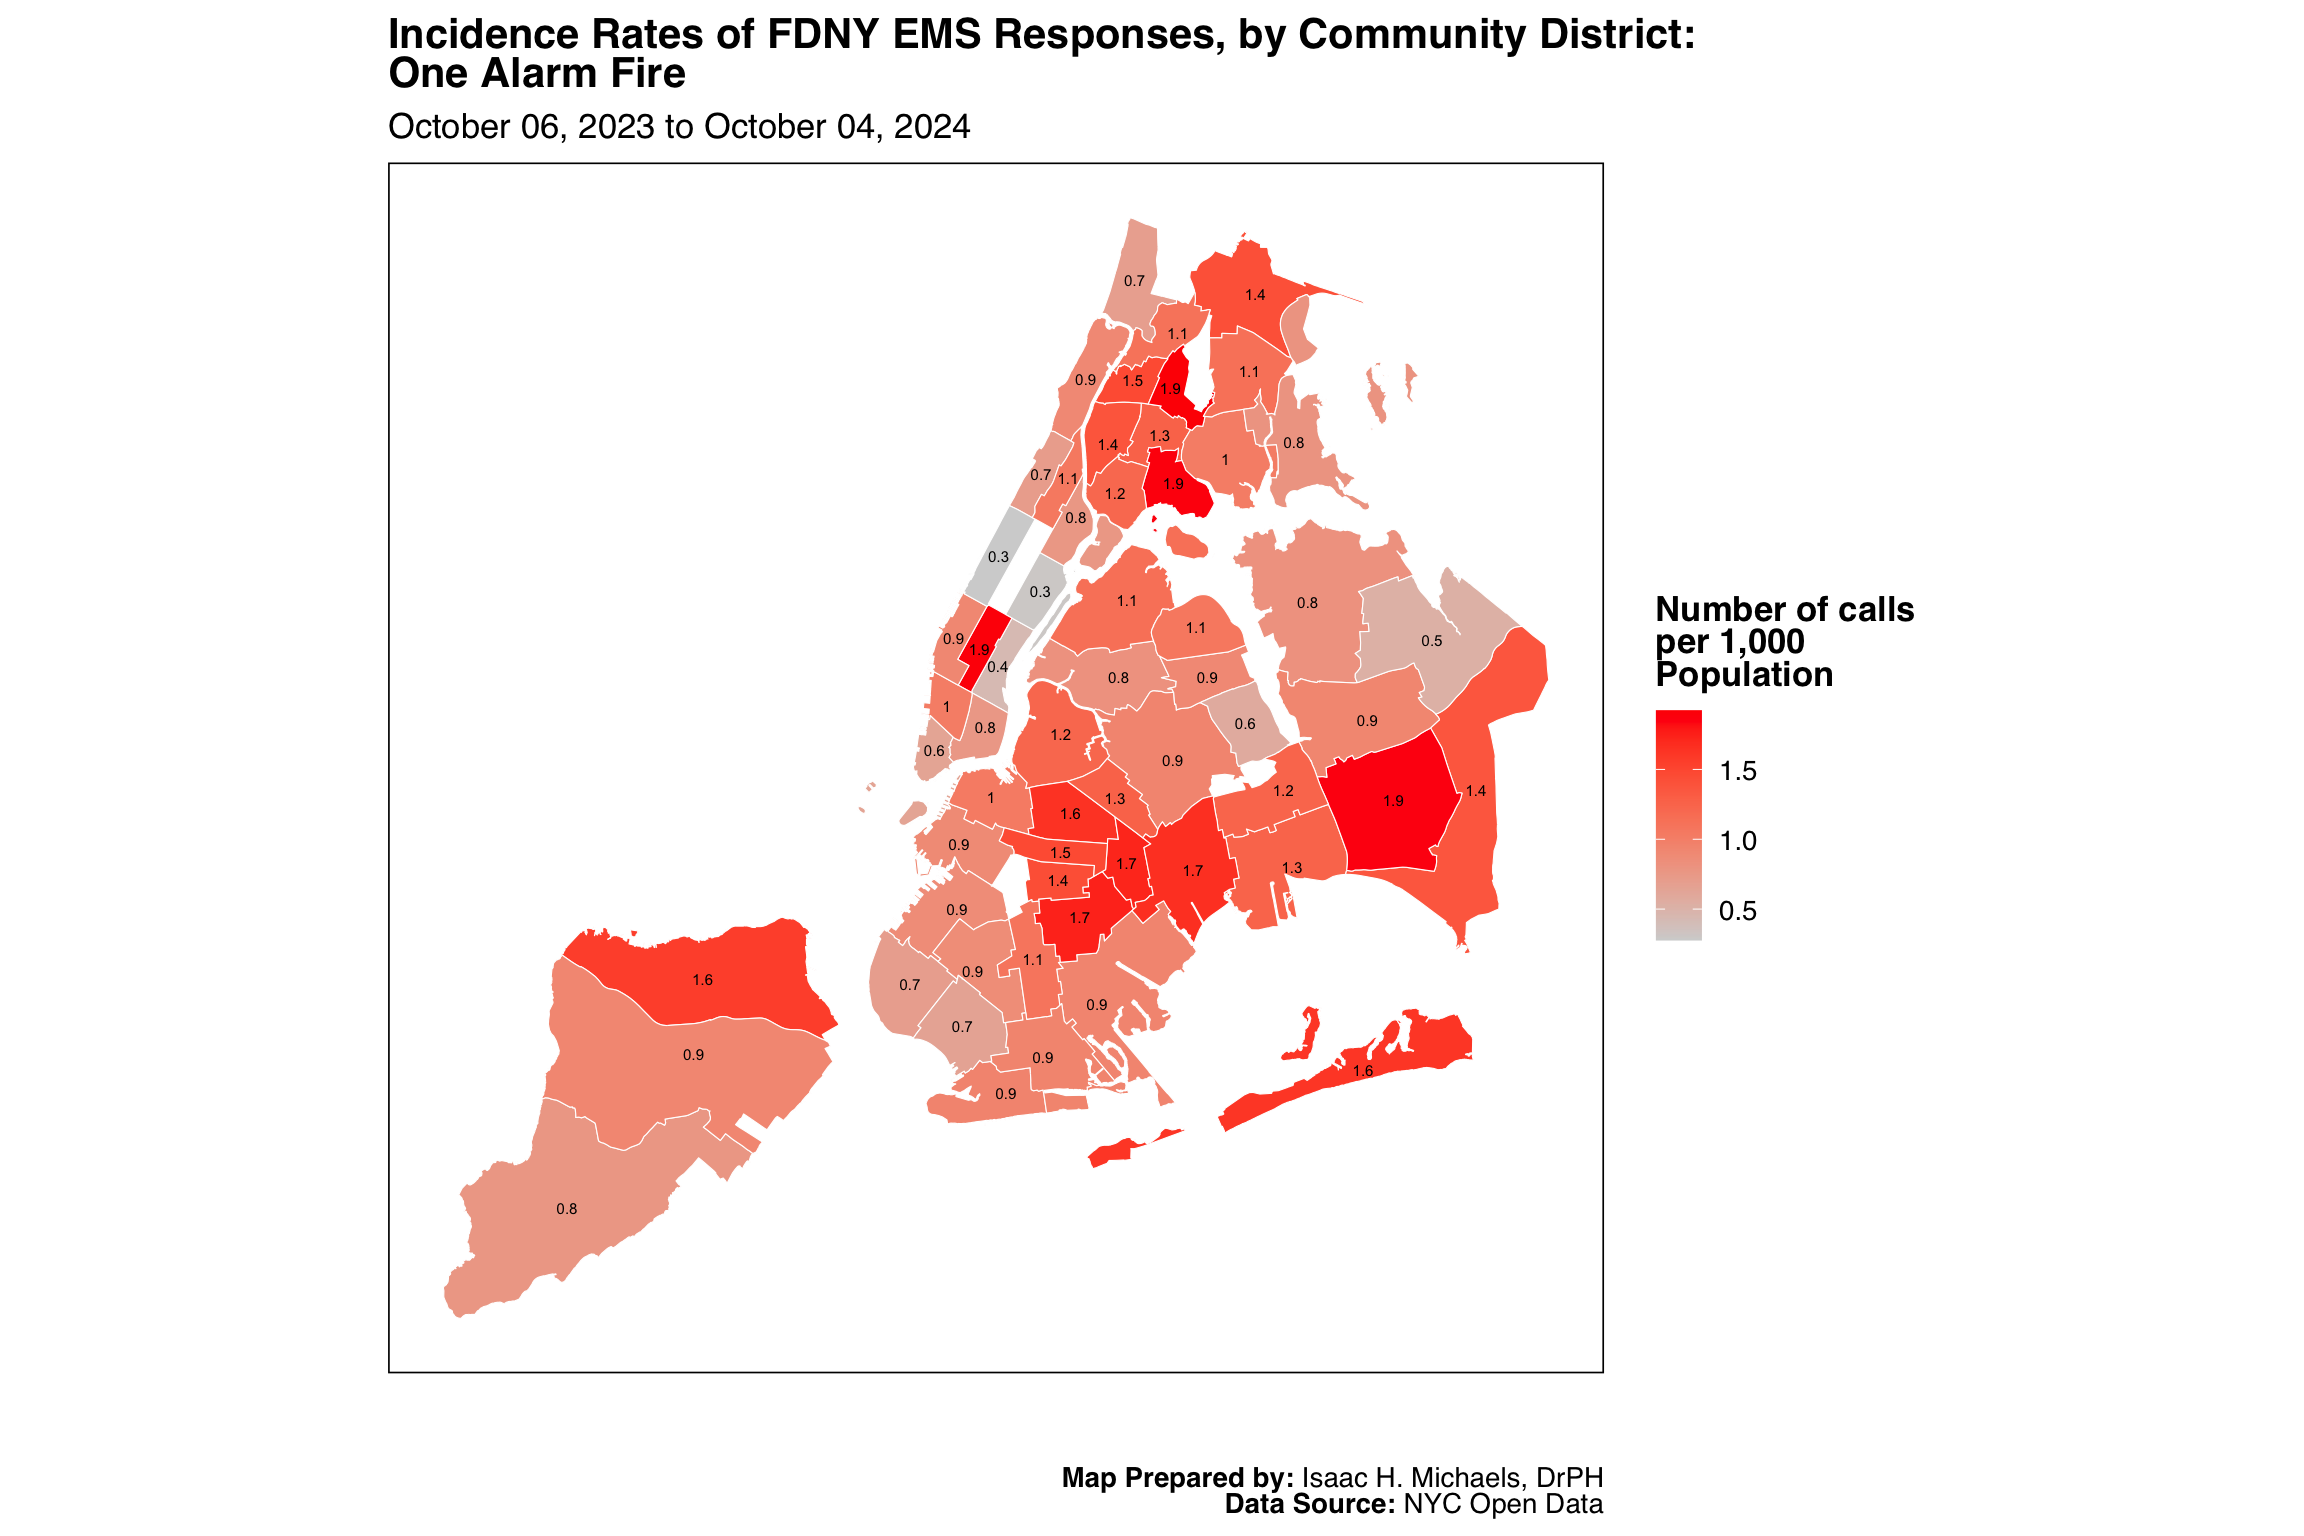
Map Prepared by: Isaac H. Michaels, DrPH
EMS Data Source: NYC Open Data
Population Data Source: NYC Open Data
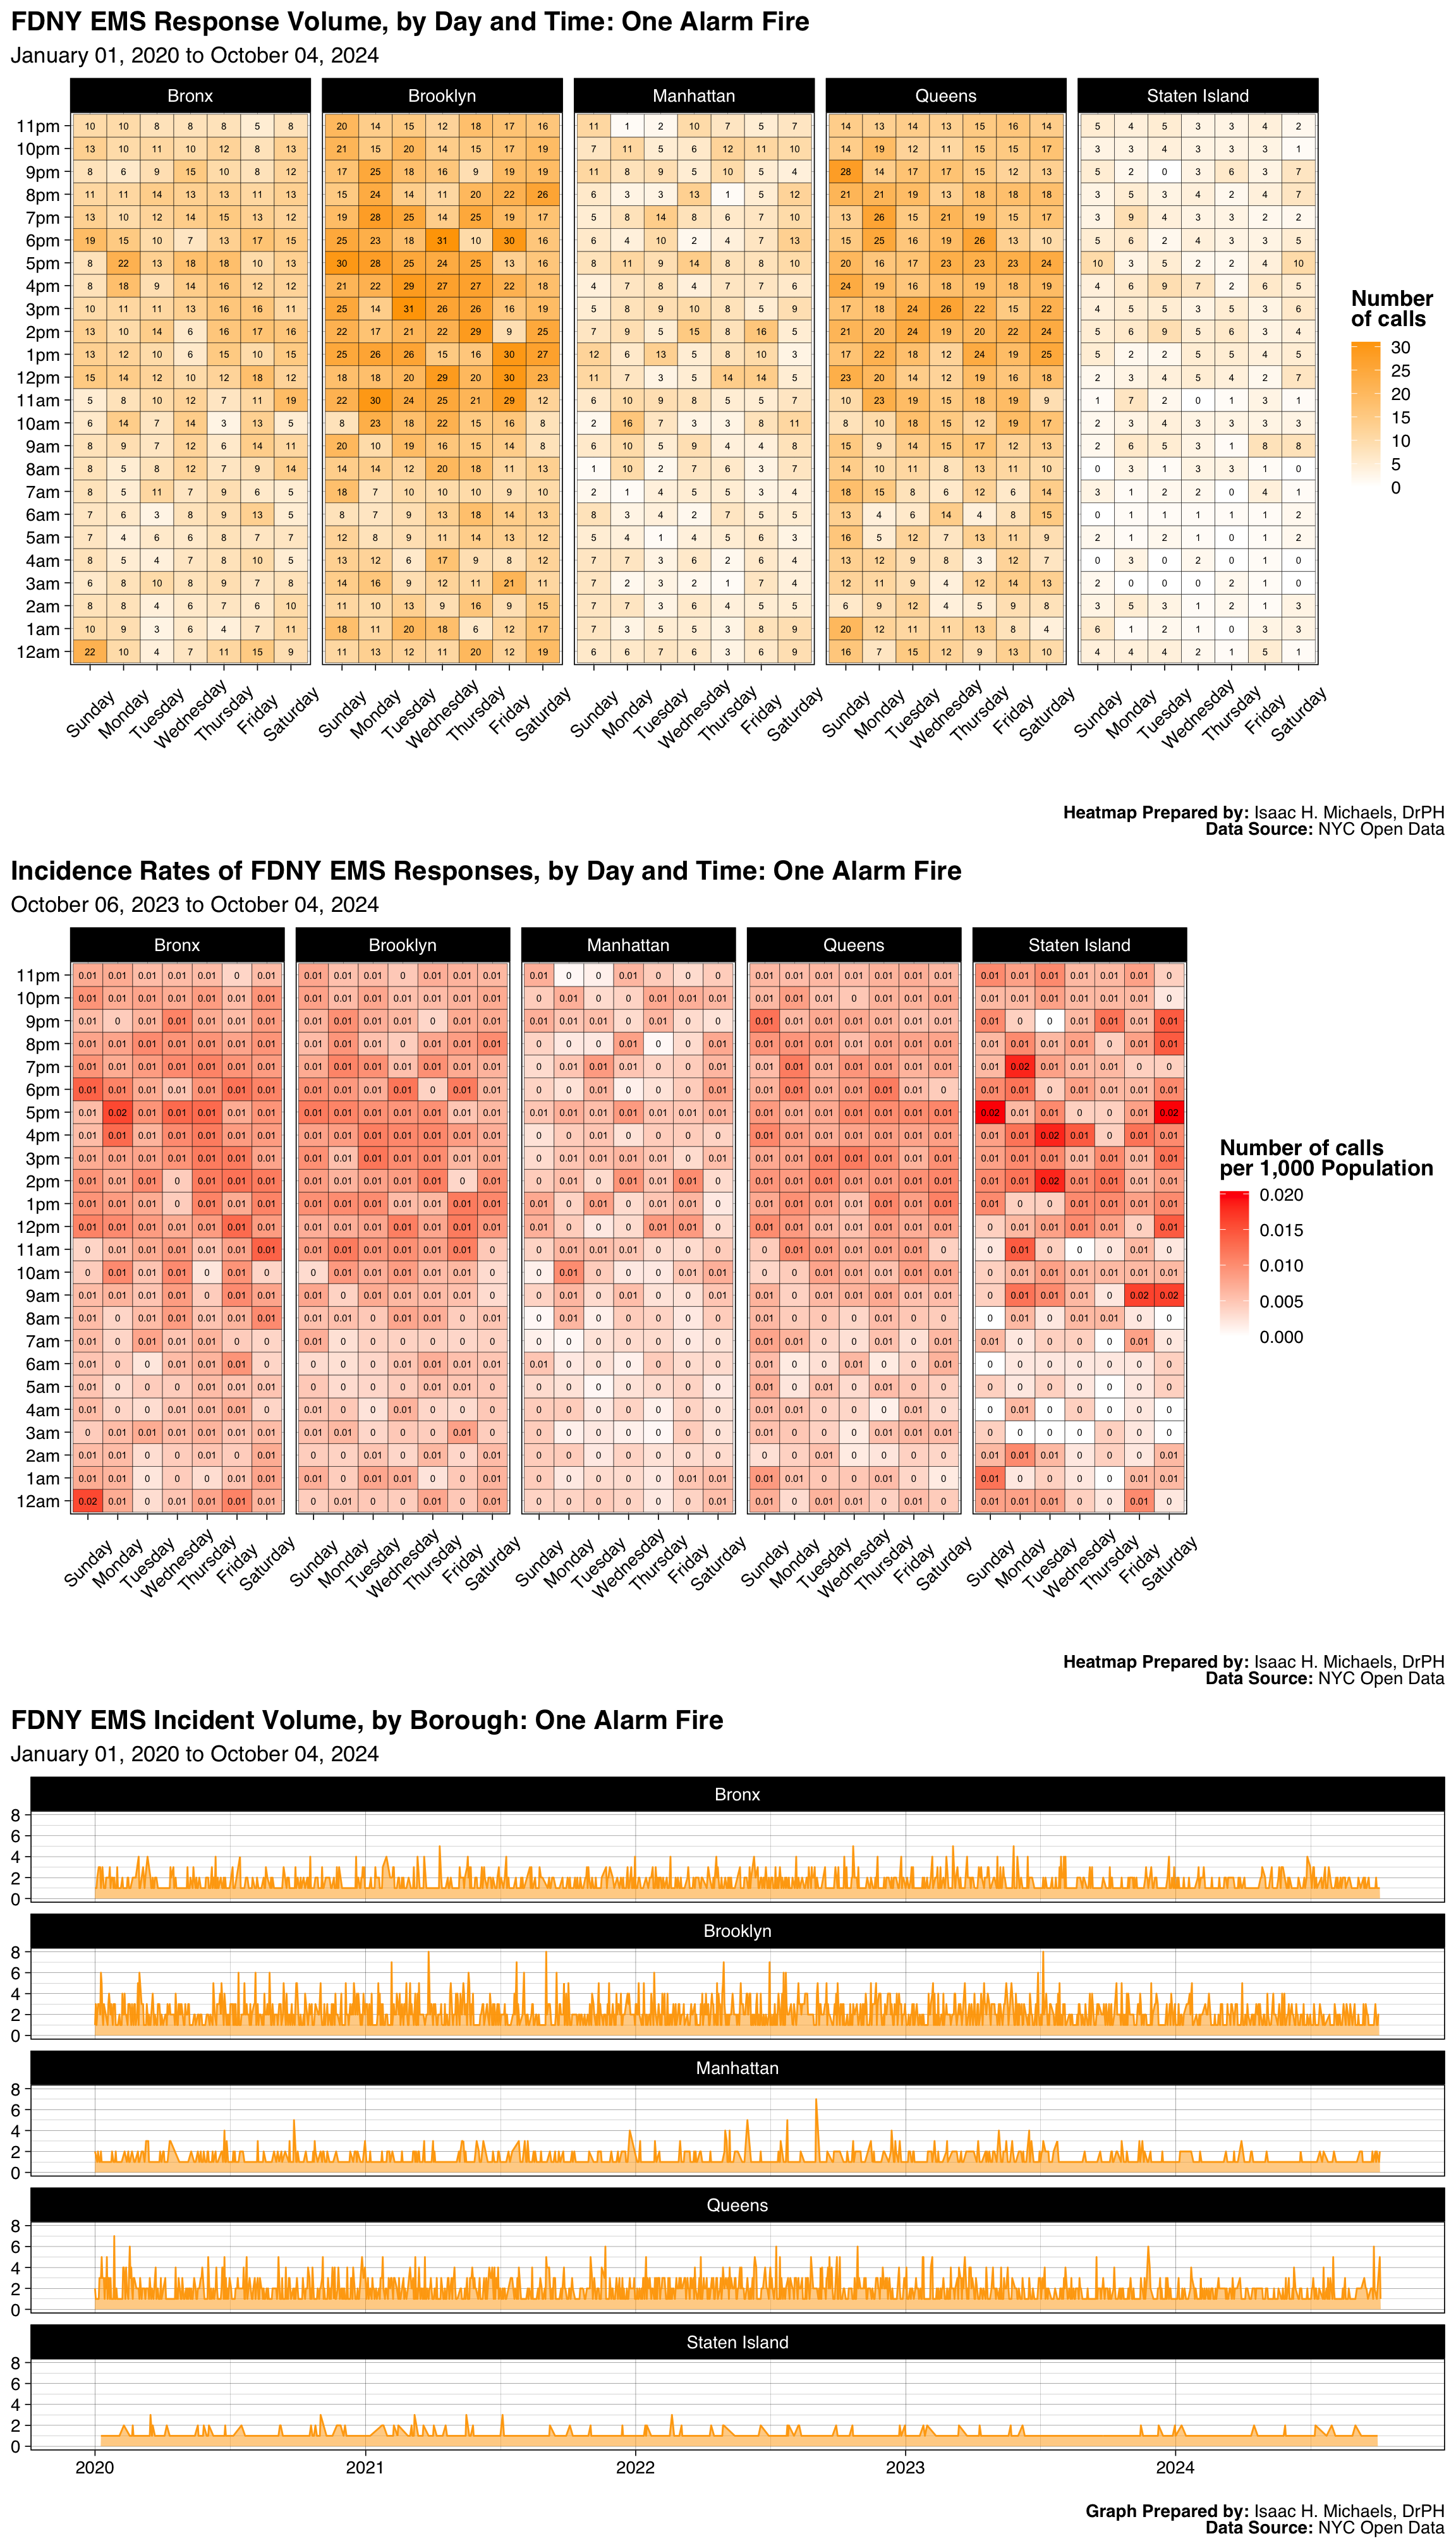
Graphs Prepared by: Isaac H. Michaels, DrPH
Data Source: NYC Open Data
| FDNY EMS Incident Volume, by Borough: Jumper Up |
||||||
| January 01, 2025 to July 01, 2026 | ||||||
| Borough |
Latest Year: 2026
|
All Years: 2025-2026
|
||||
|---|---|---|---|---|---|---|
| Incidents | % | Rate per 1,000 Population | Total Incidents | % | Monthly Trend | |
| Bronx | 123 | 27% | 0.1 | 369 | 25% | |
| Brooklyn | 117 | 25% | 0.0 | 380 | 26% | |
| Manhattan | 136 | 29% | 0.1 | 468 | 31% | |
| Queens | 66 | 14% | 0.0 | 225 | 15% | |
| Staten Island | 20 | 4% | 0.0 | 47 | 3% | |
| Table Prepred by: Isaac H. Michaels, DrPH | ||||||
| Data Source: NYC Open Data | ||||||
Table Prepared by: Isaac H. Michaels, DrPH
EMS Data Source: NYC Open Data
Population Data Source: Health Data NY
| FDNY EMS Incident Volume, by Severity Level: Jumper Up |
||||
| January 01, 2025 to July 01, 2026 | ||||
| Final Severity Level |
Latest Year: 2026
|
All Years: 2025-2026
|
||
|---|---|---|---|---|
| Incidents | % | Incidents | % | |
| 1 | 0 | 0% | 0 | 0% |
| 2 | 0 | 0% | 0 | 0% |
| 3 | 3 | 1% | 10 | 1% |
| 4 | 2 | 0% | 5 | 0% |
| 5 | 456 | 99% | 1,473 | 99% |
| 6 | 0 | 0% | 0 | 0% |
| 7 | 1 | 0% | 1 | 0% |
| 8 | 0 | 0% | 0 | 0% |
| Table Prepred by: Isaac H. Michaels, DrPH | ||||
| Data Source: NYC Open Data | ||||
Table Prepared by: Isaac H. Michaels, DrPH
Data Source: NYC Open Data
| FDNY EMS Incident Volume, by Disposition: Jumper Up |
||||
| January 01, 2025 to July 01, 2026 | ||||
| Disposition |
Latest Year: 2026
|
All Years: 2025-2026
|
||
|---|---|---|---|---|
| Incidents | % | Incidents | % | |
| Cancelled | 33 | 7% | 105 | 7% |
| Condition Corrected | 18 | 4% | 96 | 6% |
| Patient Gone on Arrival | 27 | 6% | 79 | 5% |
| Refused Medical Aid | 20 | 4% | 52 | 3% |
| Transporting Patient | 142 | 31% | 508 | 34% |
| Unfounded | 146 | 32% | 501 | 34% |
| NA | 76 | 16% | 145 | 10% |
| Table Prepred by: Isaac H. Michaels, DrPH | ||||
| Data Source: NYC Open Data | ||||
Table Prepared by: Isaac H. Michaels, DrPH
Data Source: NYC Open Data
Back to top
Electrocution

Map Prepared by: Isaac H. Michaels, DrPH
Data Source: NYC Open Data
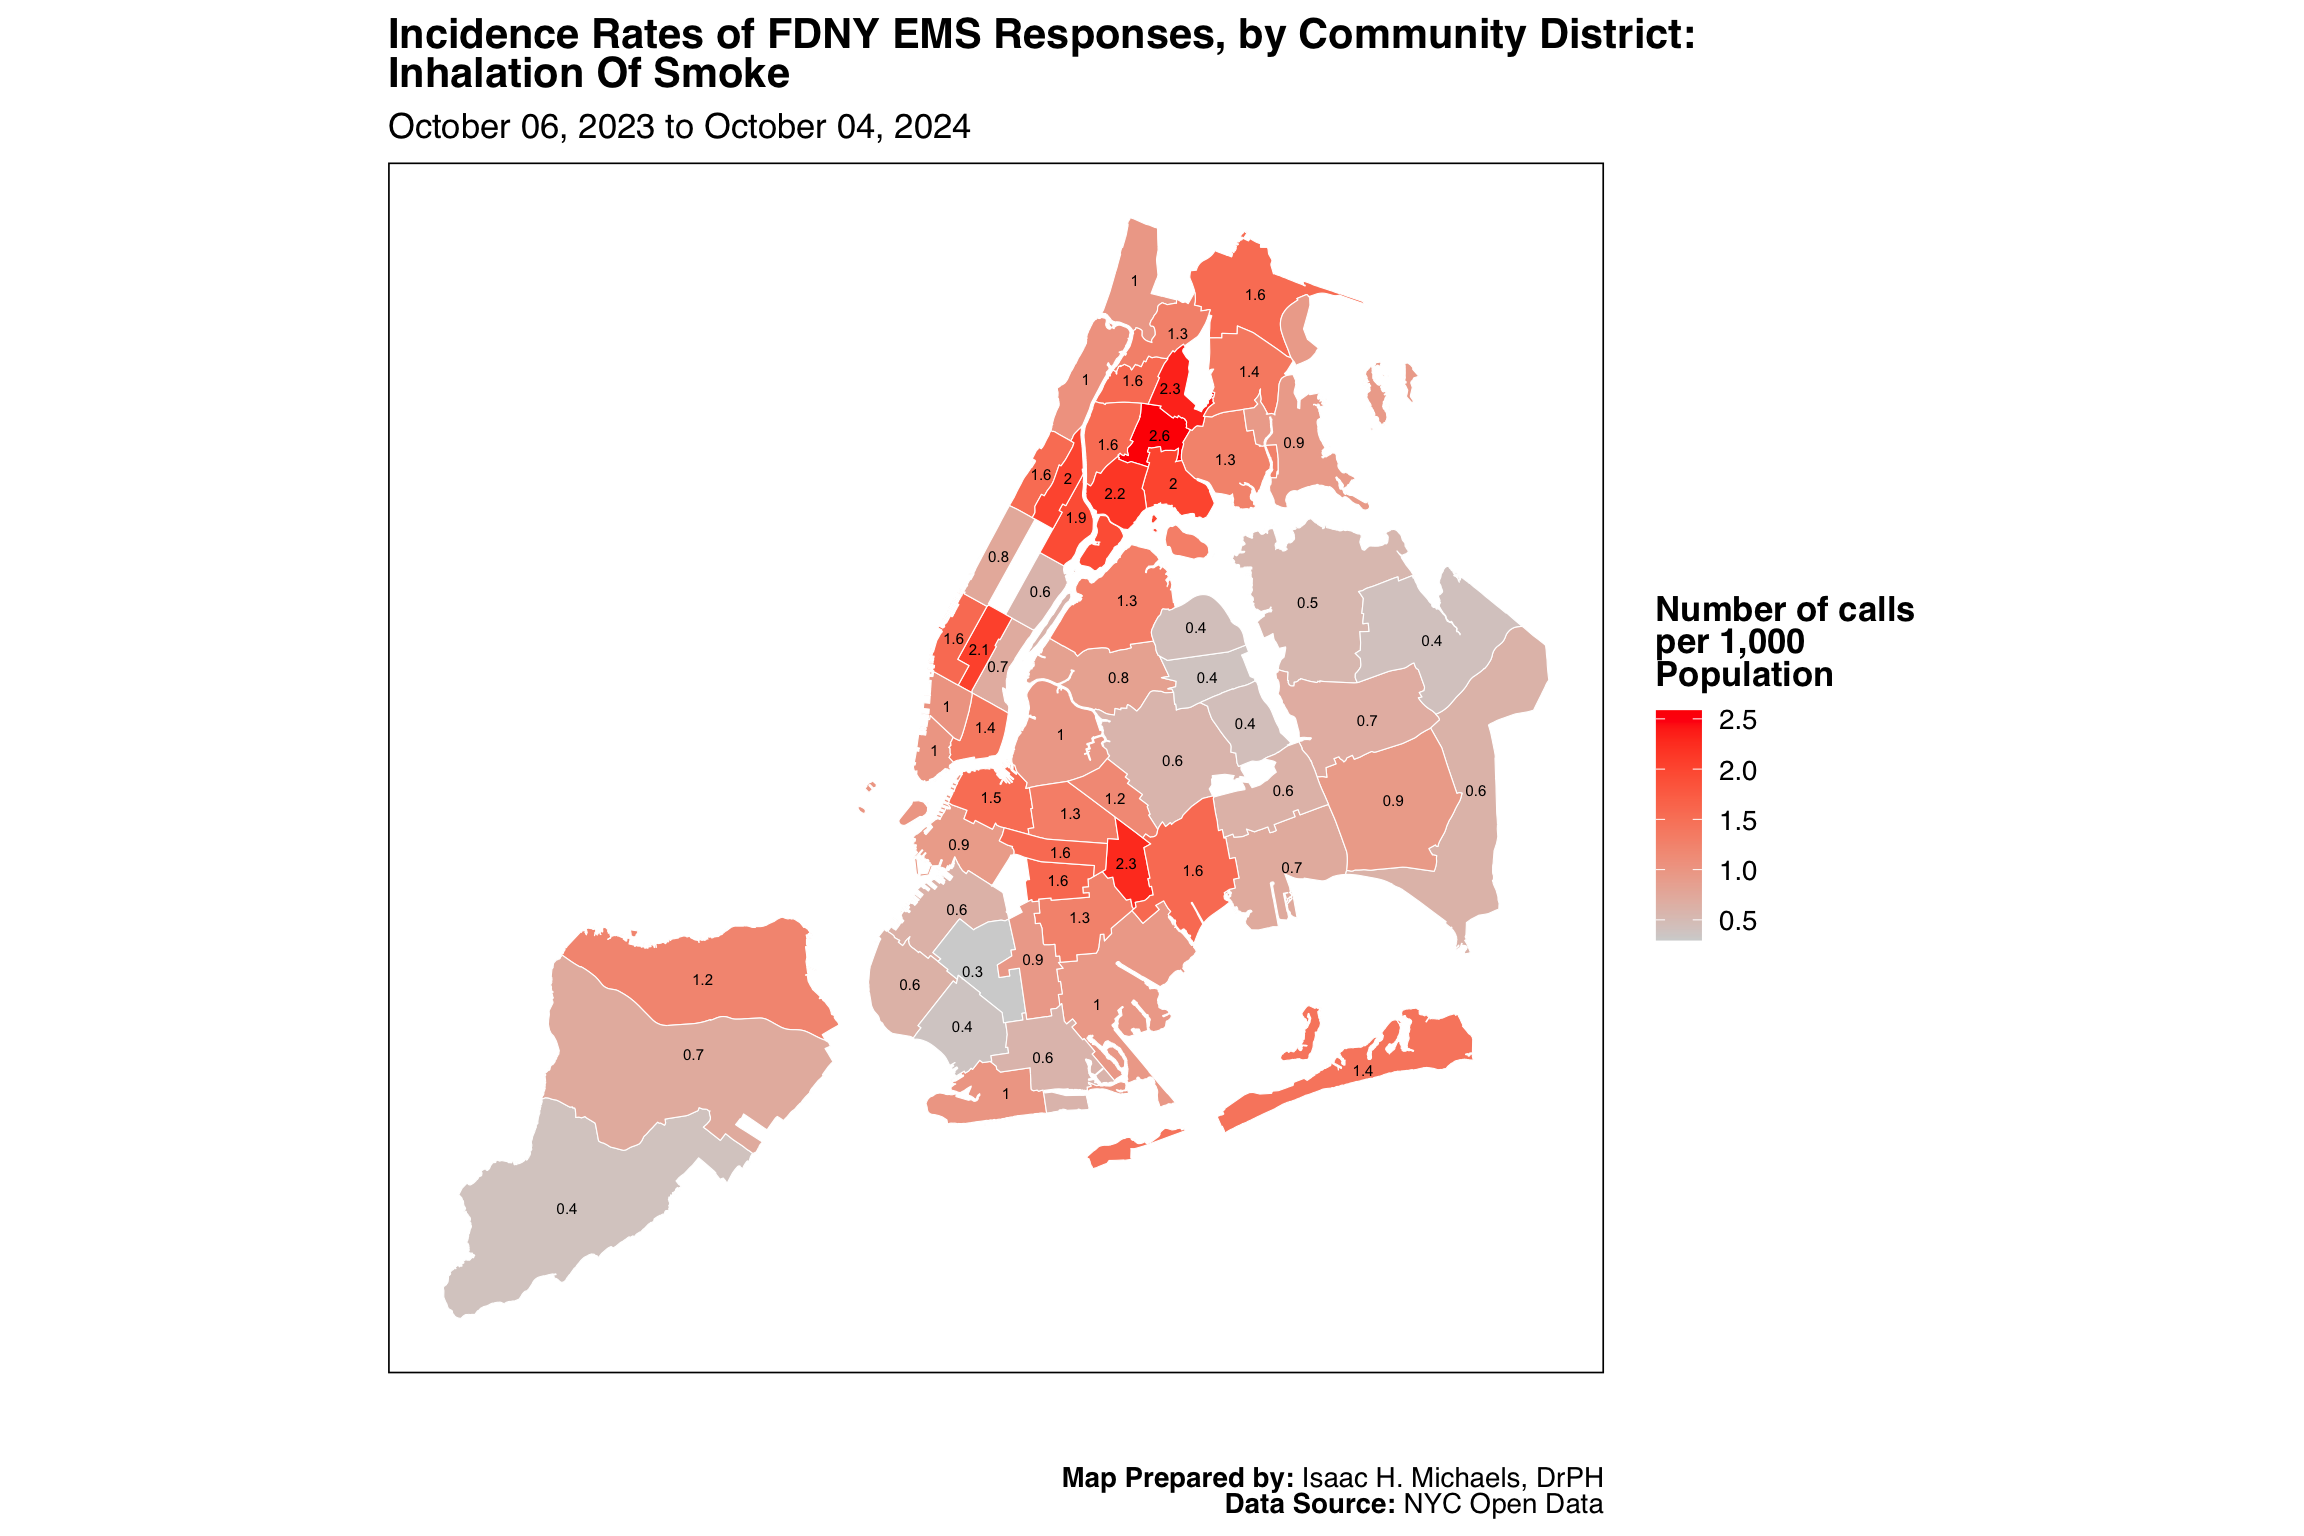
Map Prepared by: Isaac H. Michaels, DrPH
EMS Data Source: NYC Open Data
Population Data Source: NYC Open Data
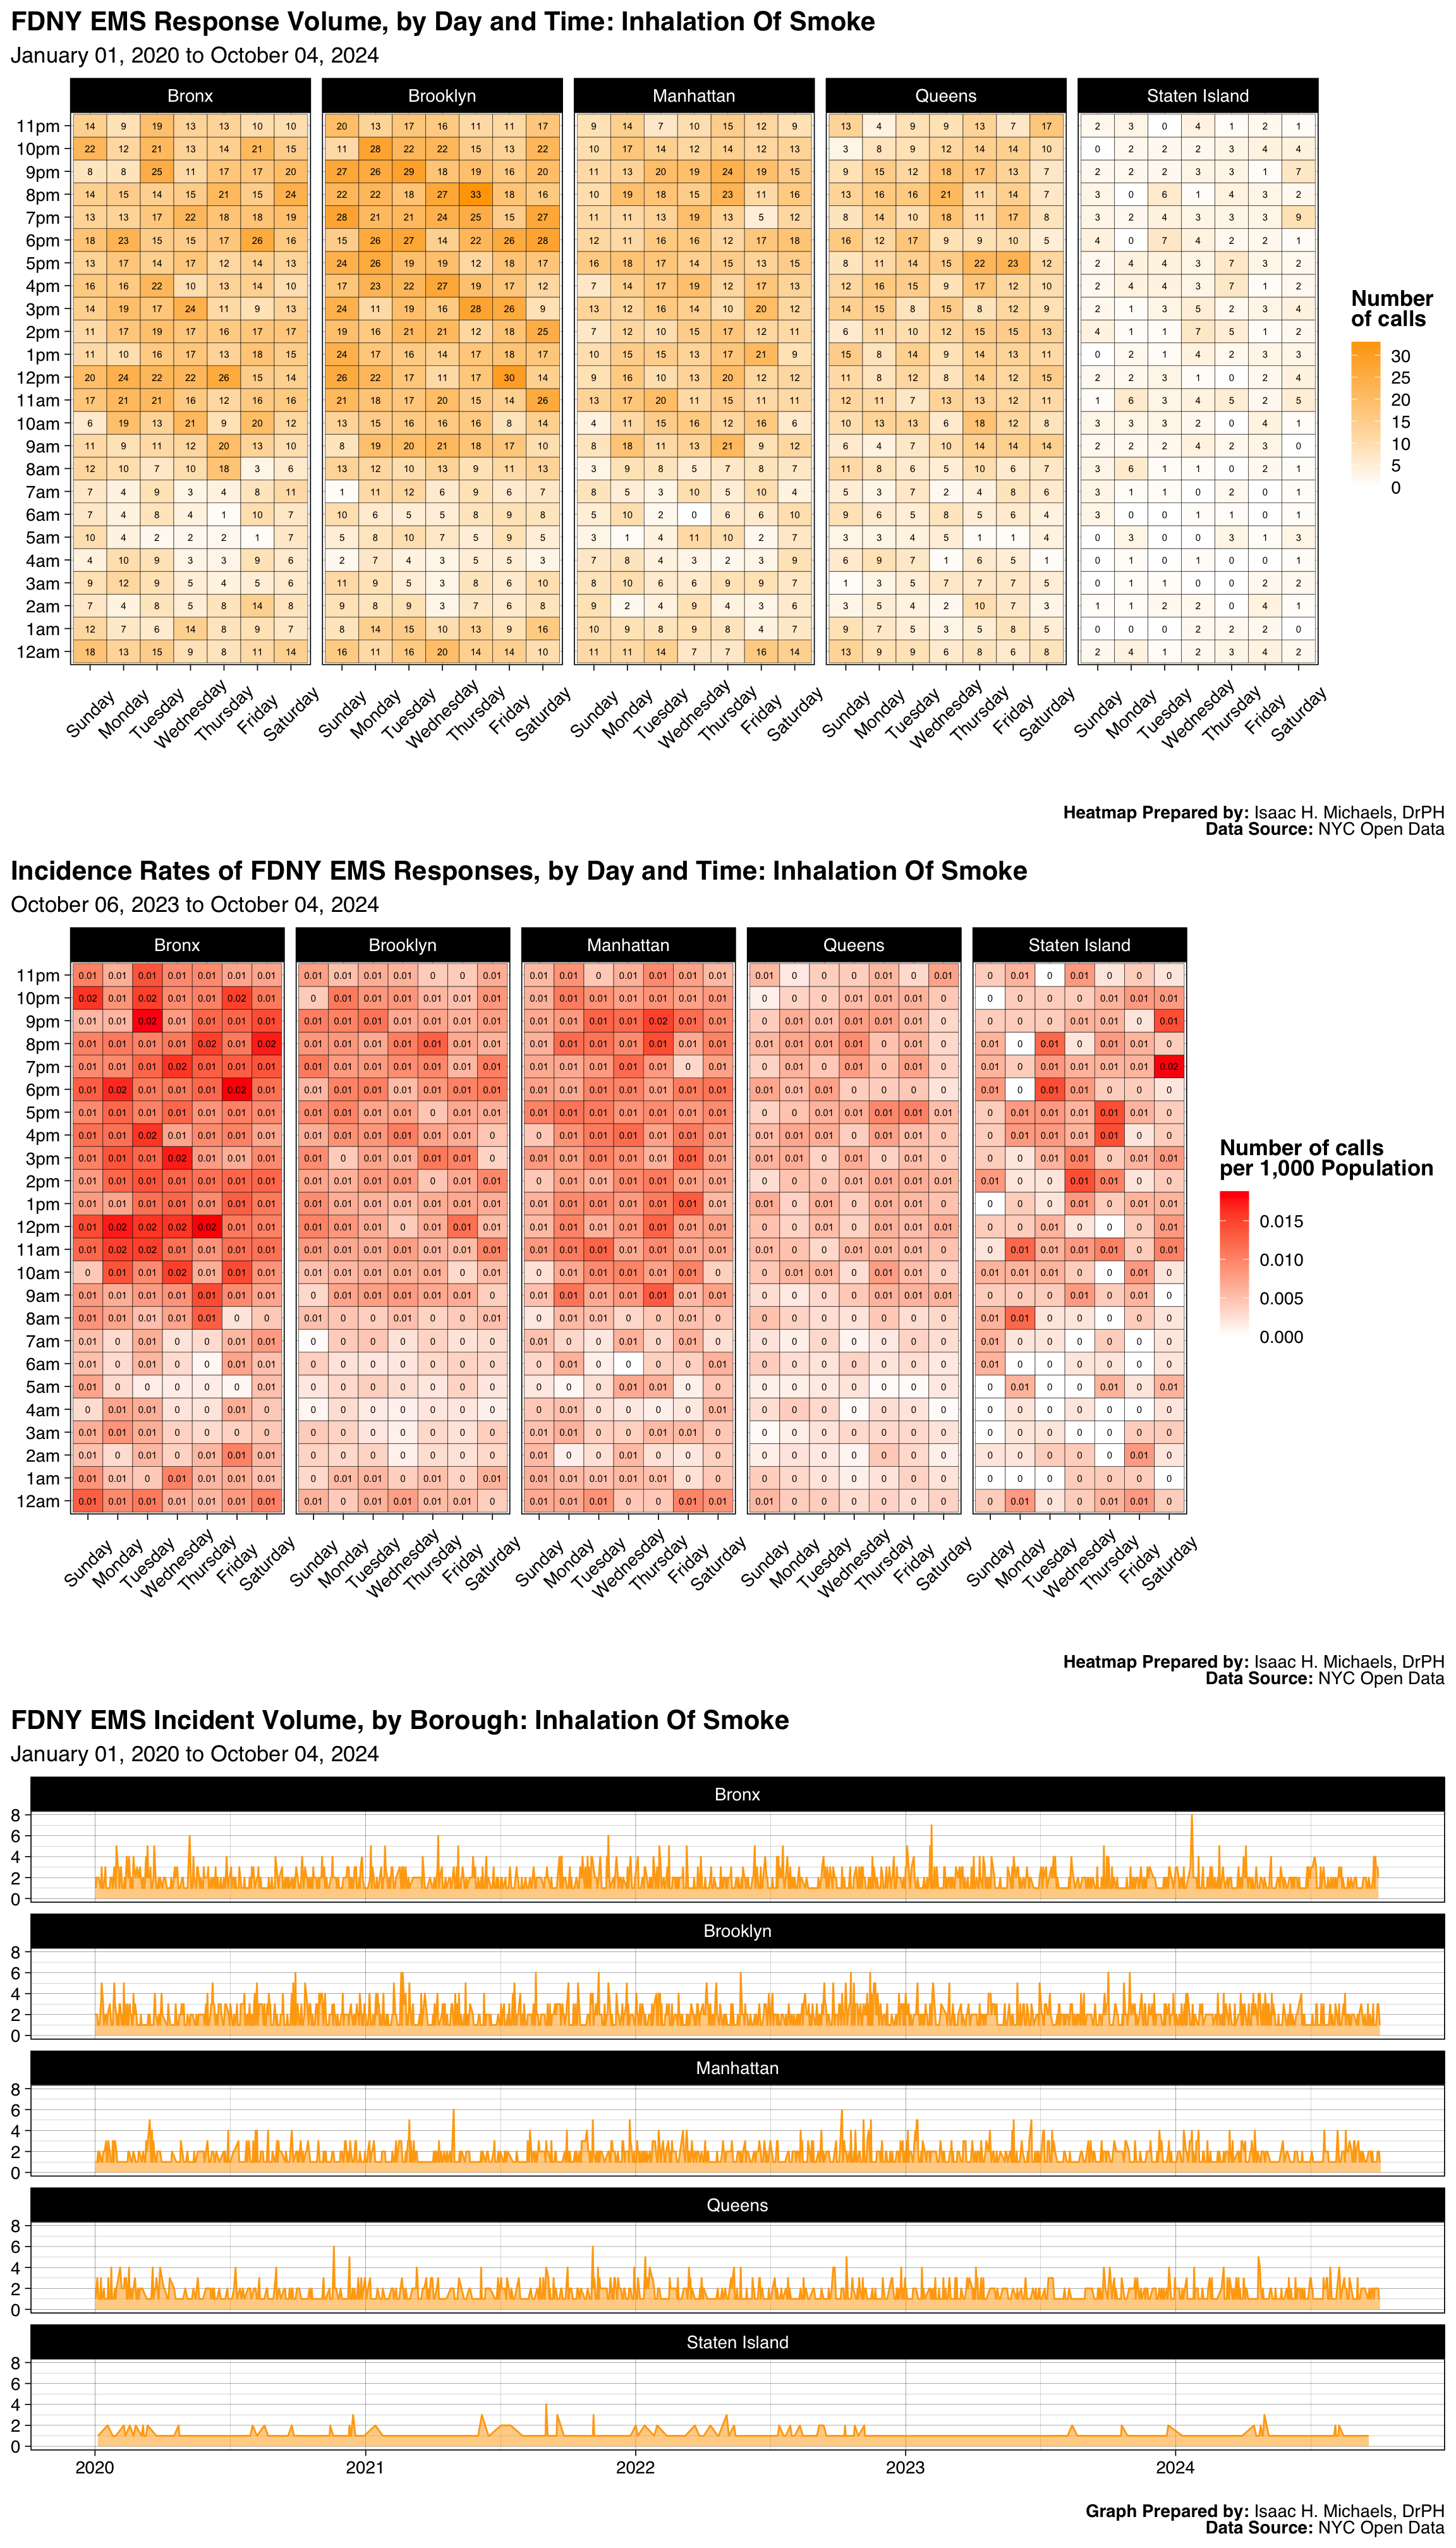
Graphs Prepared by: Isaac H. Michaels, DrPH
Data Source: NYC Open Data
| FDNY EMS Incident Volume, by Borough: Electrocution |
||||||
| January 01, 2025 to July 01, 2026 | ||||||
| Borough |
Latest Year: 2026
|
All Years: 2025-2026
|
||||
|---|---|---|---|---|---|---|
| Incidents | % | Rate per 1,000 Population | Total Incidents | % | Monthly Trend | |
| Bronx | 80 | 26% | 0.1 | 291 | 30% | |
| Brooklyn | 70 | 23% | 0.0 | 227 | 23% | |
| Manhattan | 91 | 30% | 0.1 | 281 | 29% | |
| Queens | 53 | 17% | 0.0 | 153 | 16% | |
| Staten Island | 11 | 4% | 0.0 | 26 | 3% | |
| Table Prepred by: Isaac H. Michaels, DrPH | ||||||
| Data Source: NYC Open Data | ||||||
Table Prepared by: Isaac H. Michaels, DrPH
EMS Data Source: NYC Open Data
Population Data Source: Health Data NY
| FDNY EMS Incident Volume, by Severity Level: Electrocution |
||||
| January 01, 2025 to July 01, 2026 | ||||
| Final Severity Level |
Latest Year: 2026
|
All Years: 2025-2026
|
||
|---|---|---|---|---|
| Incidents | % | Incidents | % | |
| 1 | 0 | 0% | 0 | 0% |
| 2 | 0 | 0% | 0 | 0% |
| 3 | 305 | 100% | 978 | 100% |
| 4 | 0 | 0% | 0 | 0% |
| 5 | 0 | 0% | 0 | 0% |
| 6 | 0 | 0% | 0 | 0% |
| 7 | 0 | 0% | 0 | 0% |
| 8 | 0 | 0% | 0 | 0% |
| Table Prepred by: Isaac H. Michaels, DrPH | ||||
| Data Source: NYC Open Data | ||||
Table Prepared by: Isaac H. Michaels, DrPH
Data Source: NYC Open Data
| FDNY EMS Incident Volume, by Disposition: Electrocution |
||||
| January 01, 2025 to July 01, 2026 | ||||
| Disposition |
Latest Year: 2026
|
All Years: 2025-2026
|
||
|---|---|---|---|---|
| Incidents | % | Incidents | % | |
| Cancelled | 6 | 2% | 24 | 2% |
| Condition Corrected | 8 | 3% | 21 | 2% |
| Patient Gone on Arrival | 11 | 4% | 37 | 4% |
| Refused Medical Aid | 53 | 17% | 167 | 17% |
| Transporting Patient | 208 | 68% | 677 | 69% |
| Triaged at Scene No Transport | 1 | 0% | 1 | 0% |
| Unfounded | 17 | 6% | 44 | 4% |
| NA | 1 | 0% | 5 | 1% |
| Table Prepred by: Isaac H. Michaels, DrPH | ||||
| Data Source: NYC Open Data | ||||
Table Prepared by: Isaac H. Michaels, DrPH
Data Source: NYC Open Data
Back to top
Jumper Down

Map Prepared by: Isaac H. Michaels, DrPH
Data Source: NYC Open Data

Map Prepared by: Isaac H. Michaels, DrPH
EMS Data Source: NYC Open Data
Population Data Source: NYC Open Data
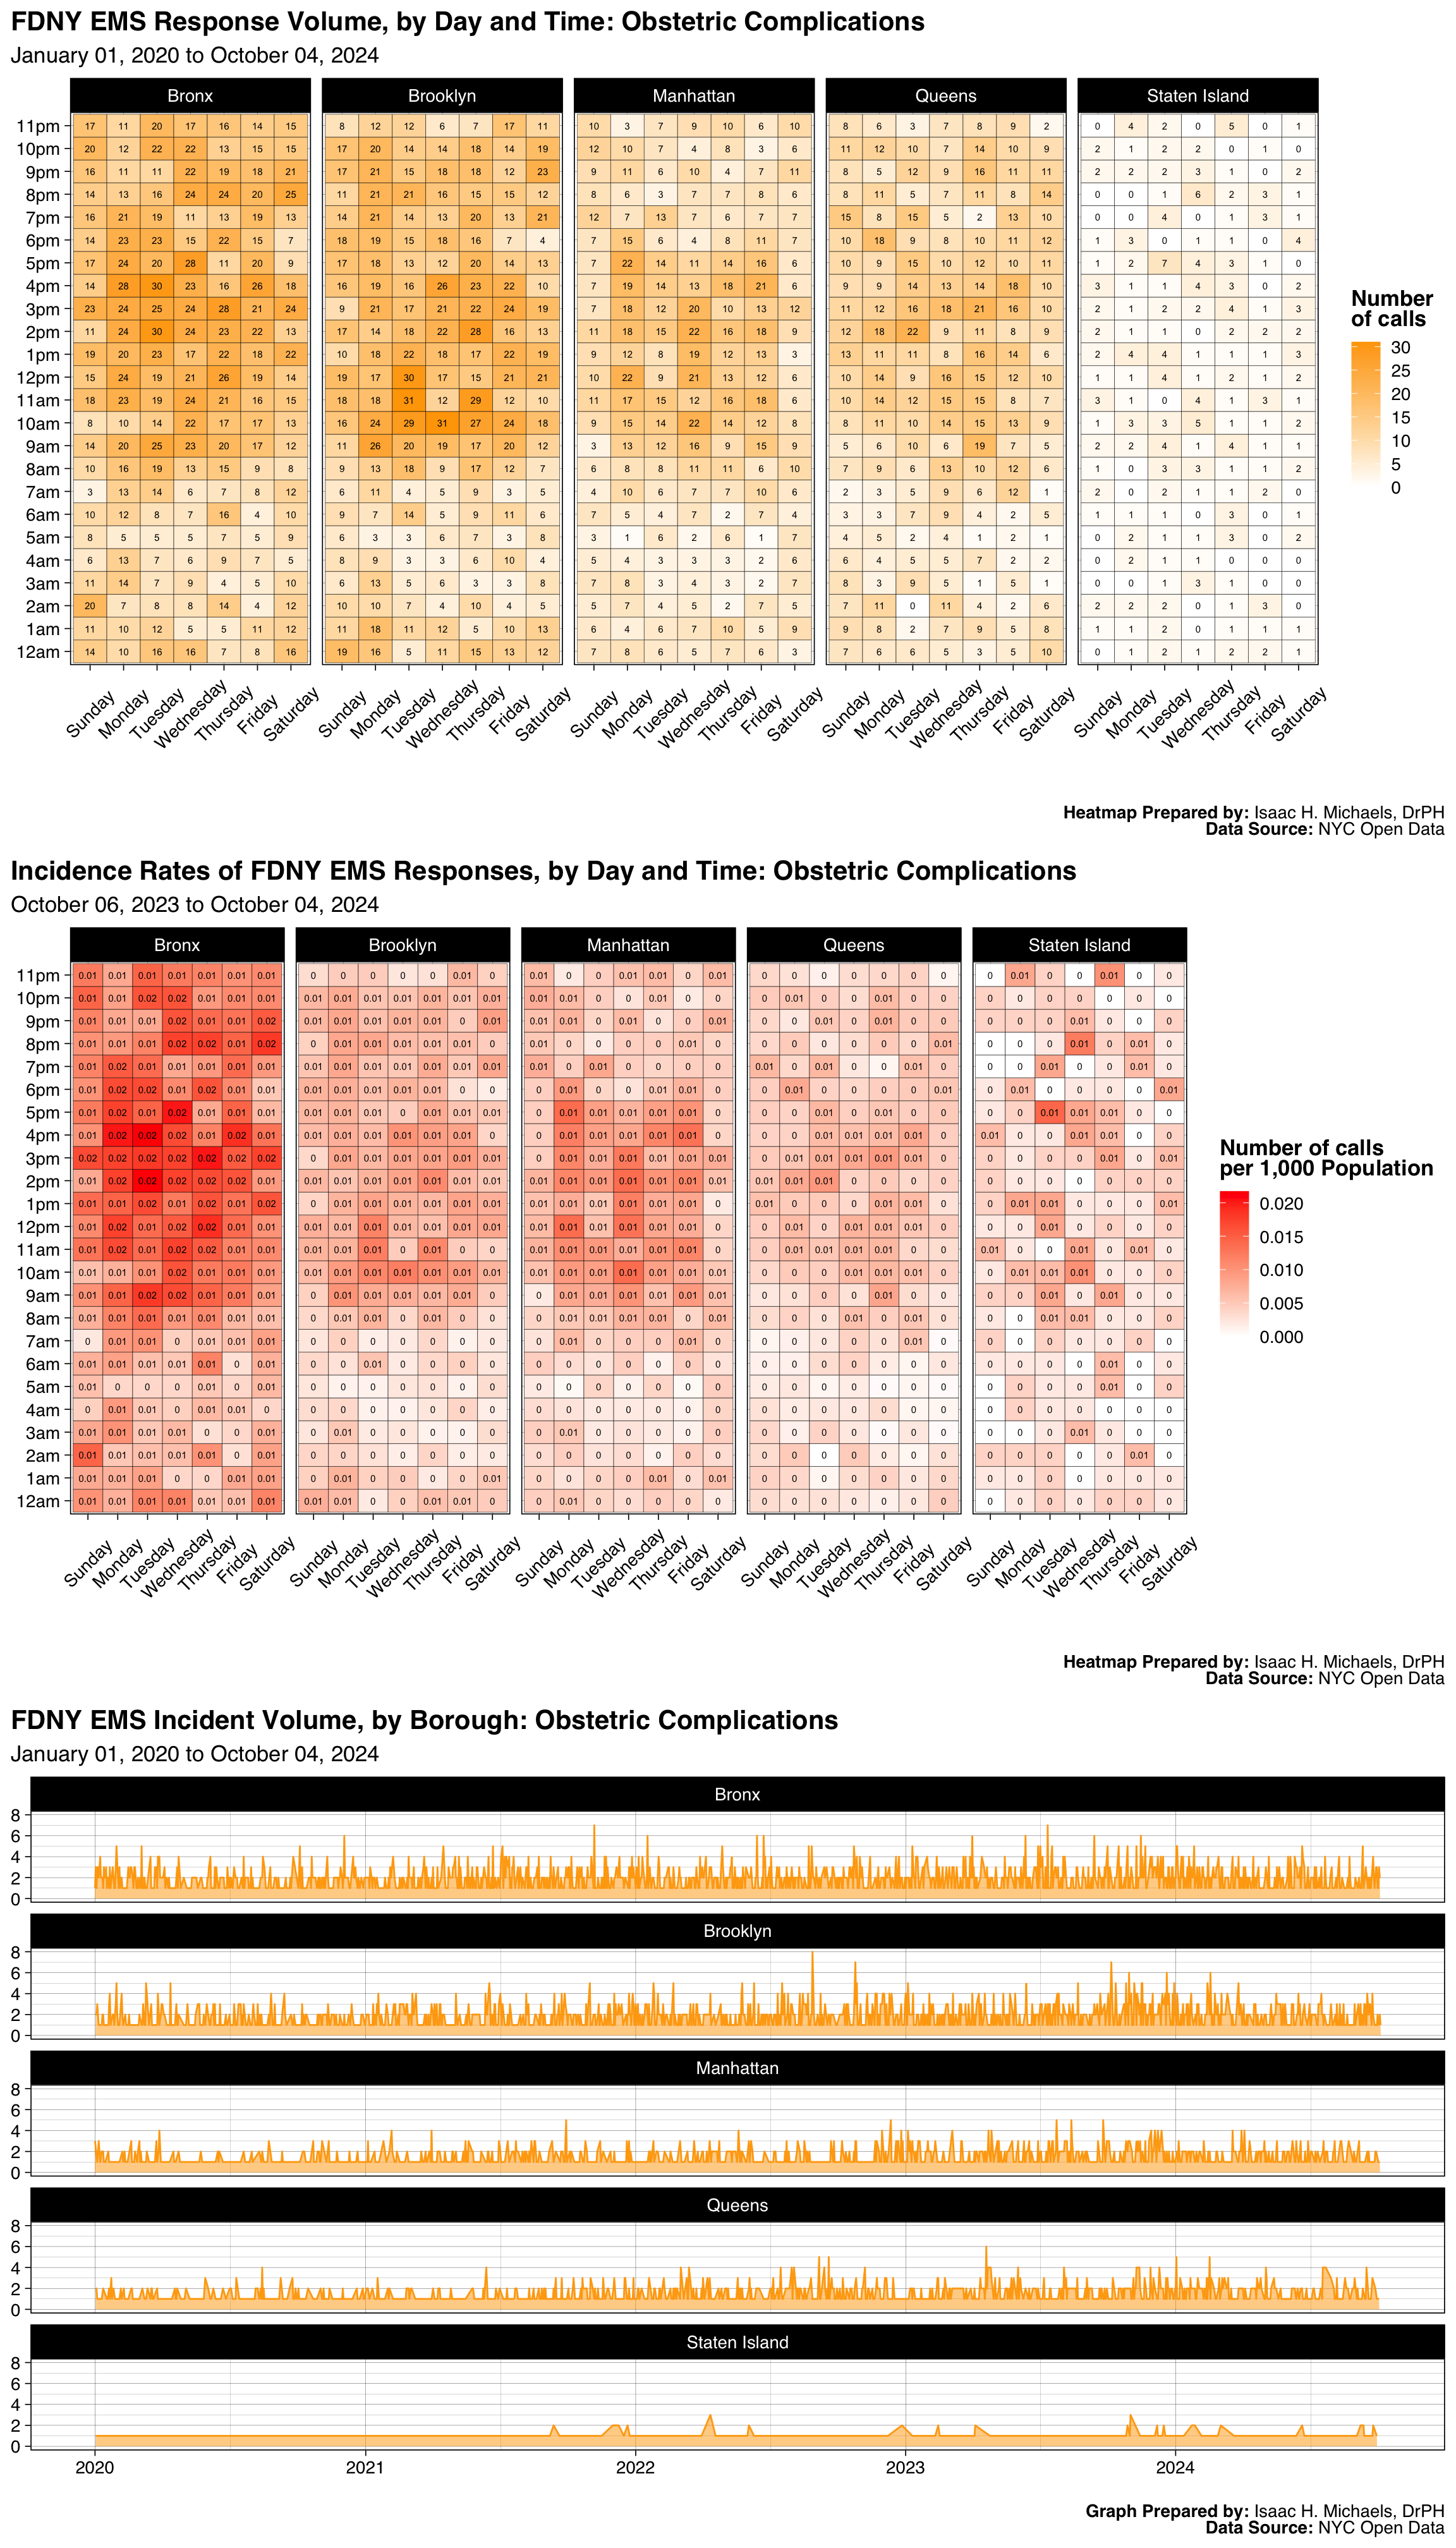
Graphs Prepared by: Isaac H. Michaels, DrPH
Data Source: NYC Open Data
| FDNY EMS Incident Volume, by Borough: Jumper Down |
||||||
| January 01, 2025 to July 01, 2026 | ||||||
| Borough |
Latest Year: 2026
|
All Years: 2025-2026
|
||||
|---|---|---|---|---|---|---|
| Incidents | % | Rate per 1,000 Population | Total Incidents | % | Monthly Trend | |
| Bronx | 48 | 16% | 0.0 | 170 | 18% | |
| Brooklyn | 104 | 34% | 0.0 | 300 | 31% | |
| Manhattan | 71 | 23% | 0.0 | 218 | 23% | |
| Queens | 66 | 21% | 0.0 | 212 | 22% | |
| Staten Island | 20 | 6% | 0.0 | 63 | 7% | |
| Table Prepred by: Isaac H. Michaels, DrPH | ||||||
| Data Source: NYC Open Data | ||||||
Table Prepared by: Isaac H. Michaels, DrPH
EMS Data Source: NYC Open Data
Population Data Source: Health Data NY
| FDNY EMS Incident Volume, by Severity Level: Jumper Down |
||||
| January 01, 2025 to July 01, 2026 | ||||
| Final Severity Level |
Latest Year: 2026
|
All Years: 2025-2026
|
||
|---|---|---|---|---|
| Incidents | % | Incidents | % | |
| 1 | 0 | 0% | 1 | 0% |
| 2 | 307 | 99% | 959 | 100% |
| 3 | 2 | 1% | 2 | 0% |
| 4 | 0 | 0% | 1 | 0% |
| 5 | 0 | 0% | 0 | 0% |
| 6 | 0 | 0% | 0 | 0% |
| 7 | 0 | 0% | 0 | 0% |
| 8 | 0 | 0% | 0 | 0% |
| Table Prepred by: Isaac H. Michaels, DrPH | ||||
| Data Source: NYC Open Data | ||||
Table Prepared by: Isaac H. Michaels, DrPH
Data Source: NYC Open Data
| FDNY EMS Incident Volume, by Disposition: Jumper Down |
||||
| January 01, 2025 to July 01, 2026 | ||||
| Disposition |
Latest Year: 2026
|
All Years: 2025-2026
|
||
|---|---|---|---|---|
| Incidents | % | Incidents | % | |
| Cancelled | 4 | 1% | 18 | 2% |
| Condition Corrected | 3 | 1% | 10 | 1% |
| Patient Gone on Arrival | 6 | 2% | 19 | 2% |
| Patient Pronounced Dead | 4 | 1% | 15 | 2% |
| Refused Medical Aid | 11 | 4% | 44 | 5% |
| Transporting Patient | 262 | 85% | 778 | 81% |
| Treated and Transported | 1 | 0% | 2 | 0% |
| Unfounded | 16 | 5% | 71 | 7% |
| NA | 2 | 1% | 5 | 1% |
| Table Prepred by: Isaac H. Michaels, DrPH | ||||
| Data Source: NYC Open Data | ||||
Table Prepared by: Isaac H. Michaels, DrPH
Data Source: NYC Open Data
Back to top
Drowning
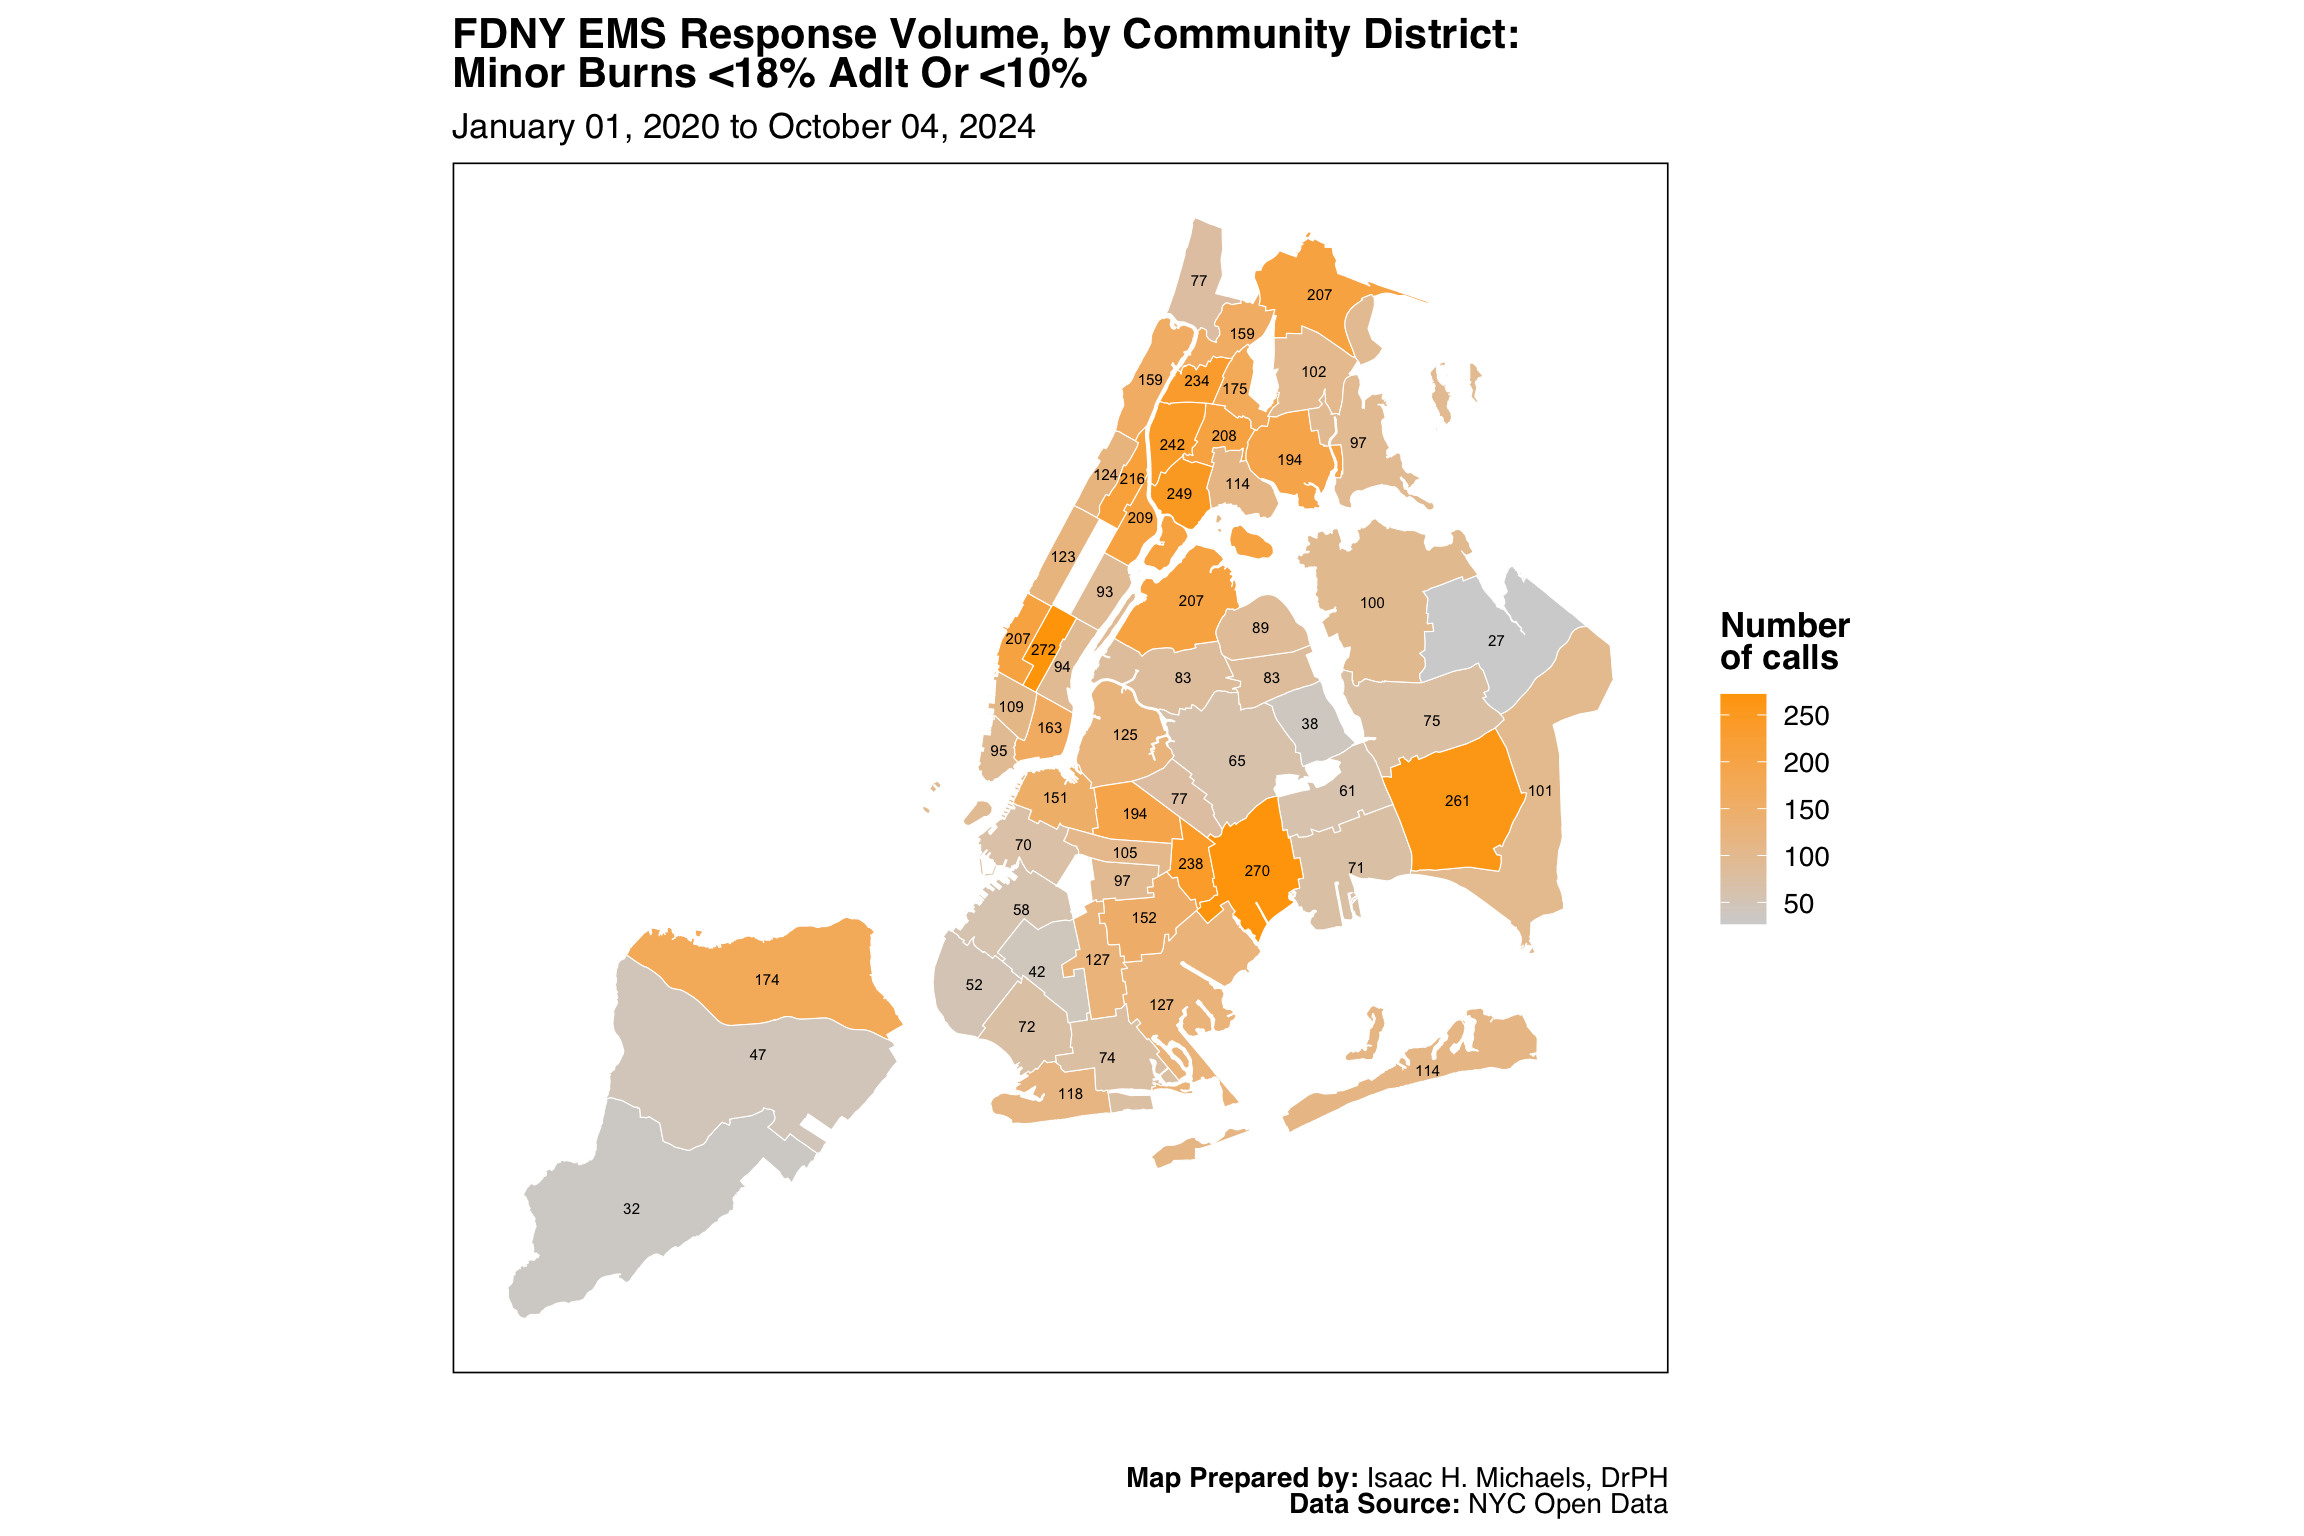
Map Prepared by: Isaac H. Michaels, DrPH
Data Source: NYC Open Data
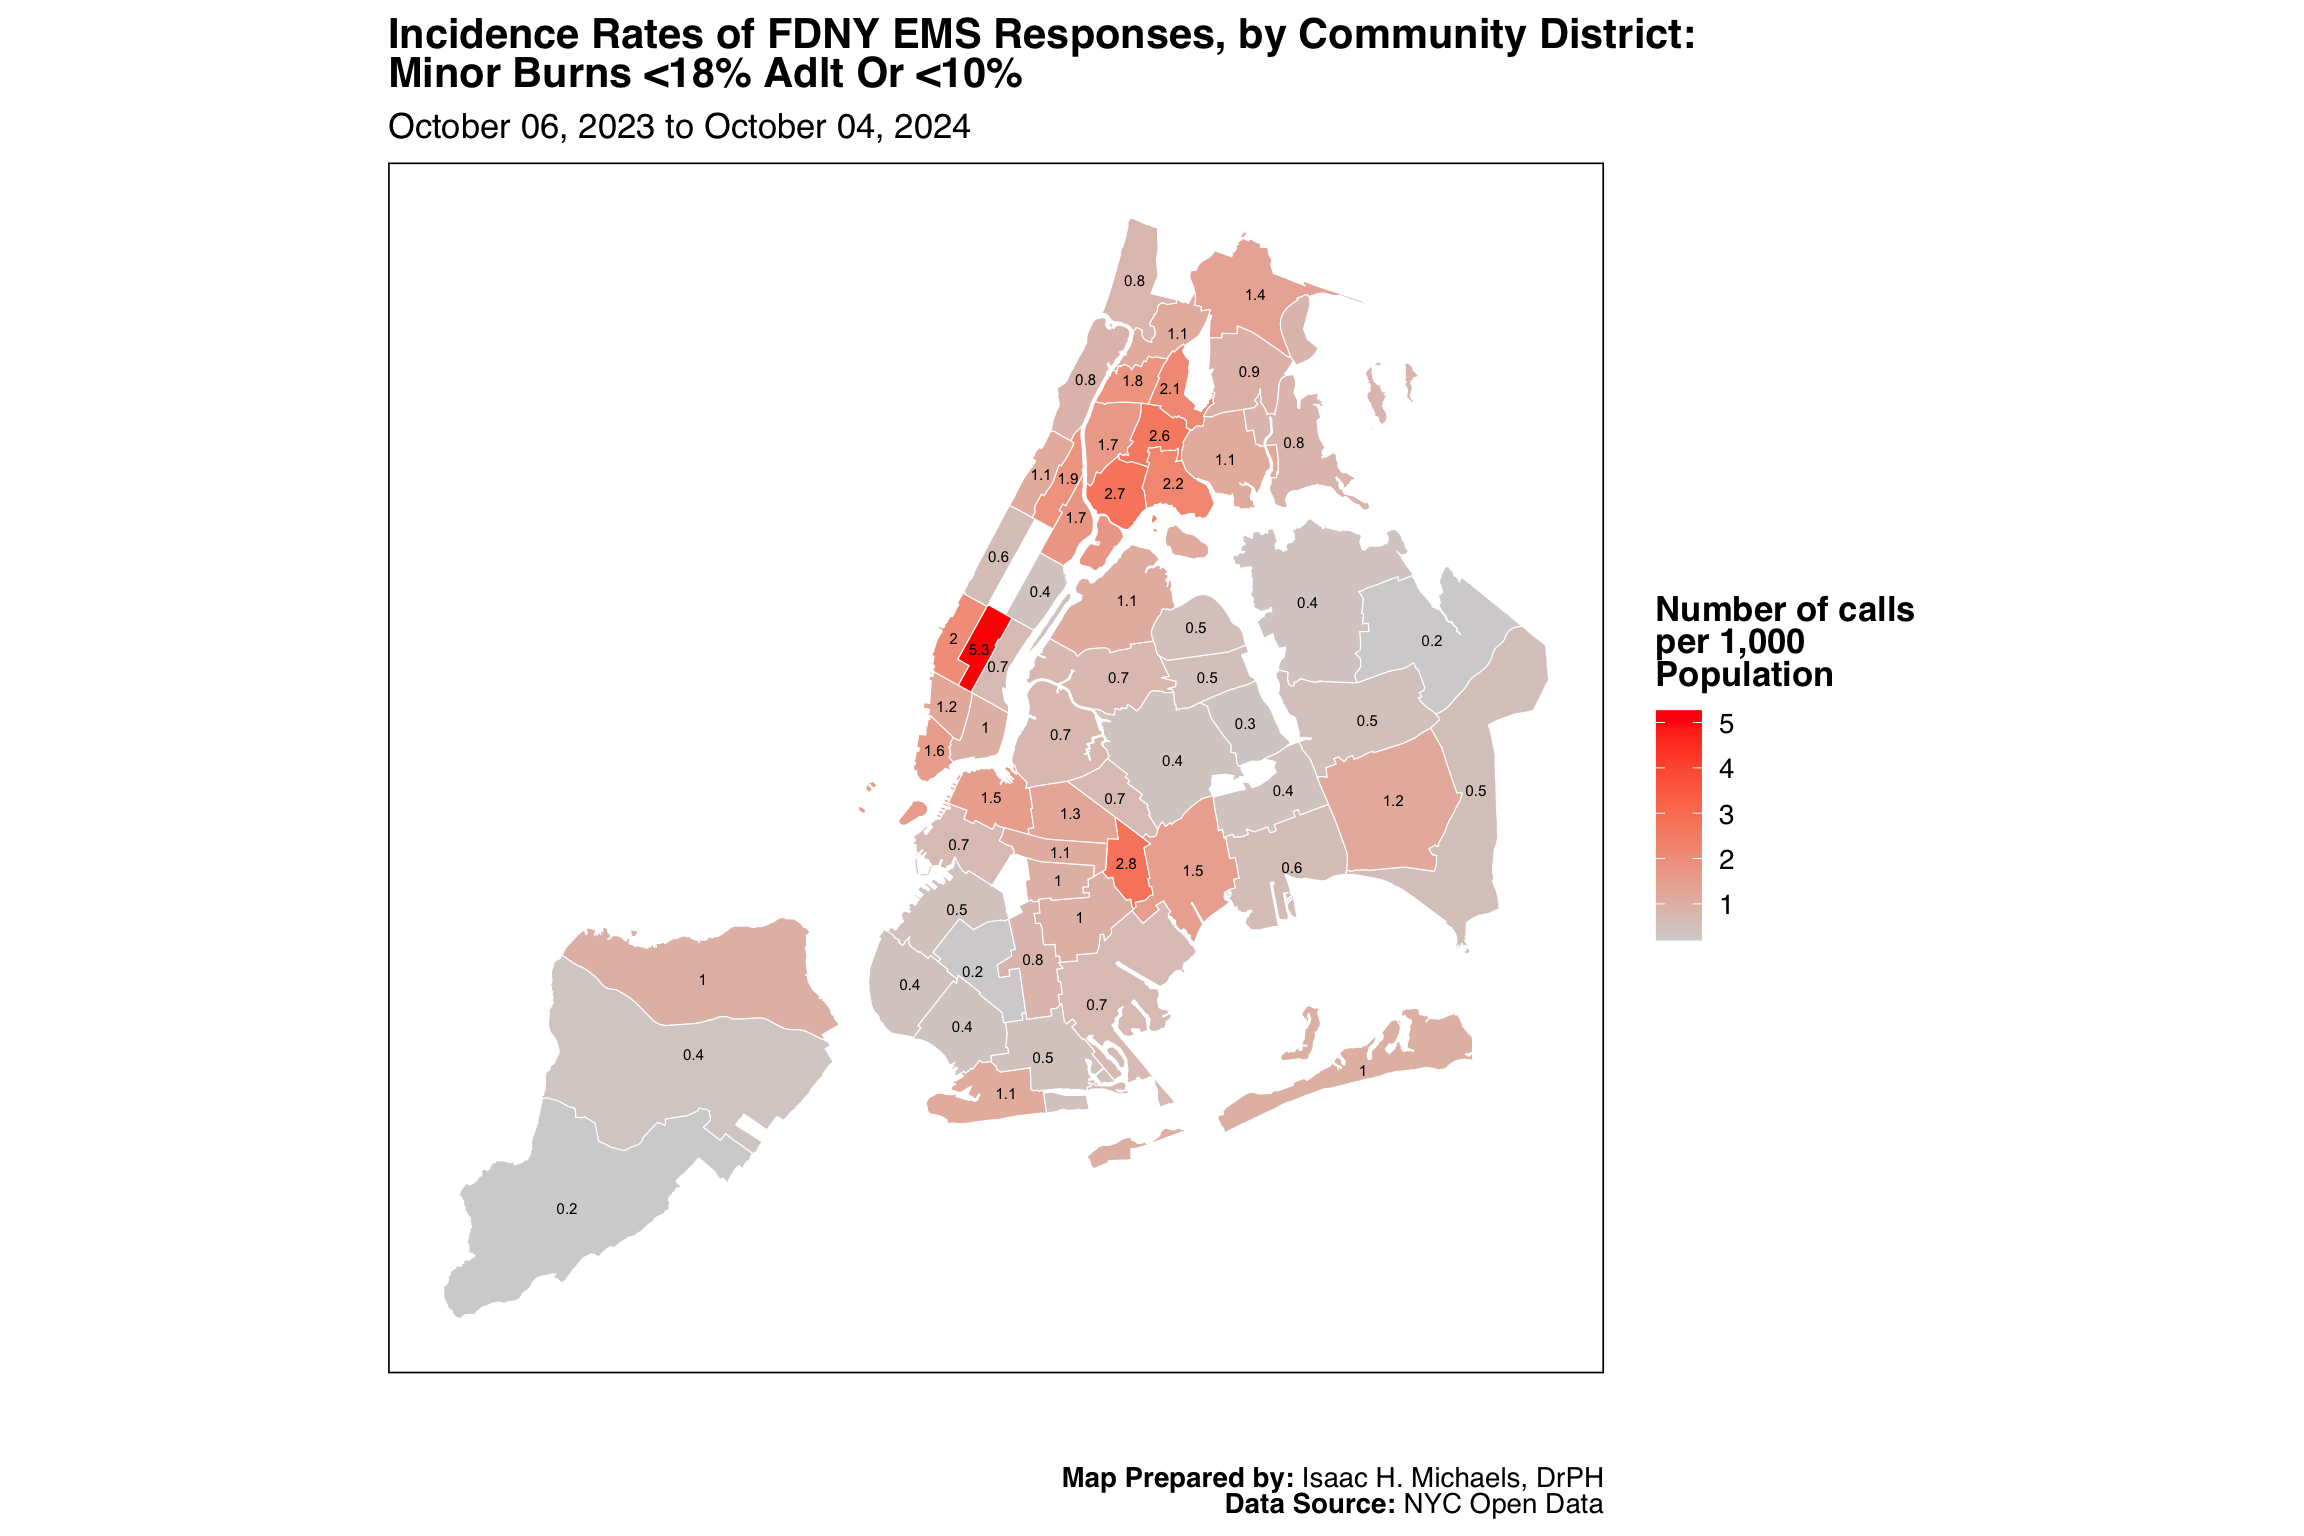
Map Prepared by: Isaac H. Michaels, DrPH
EMS Data Source: NYC Open Data
Population Data Source: NYC Open Data
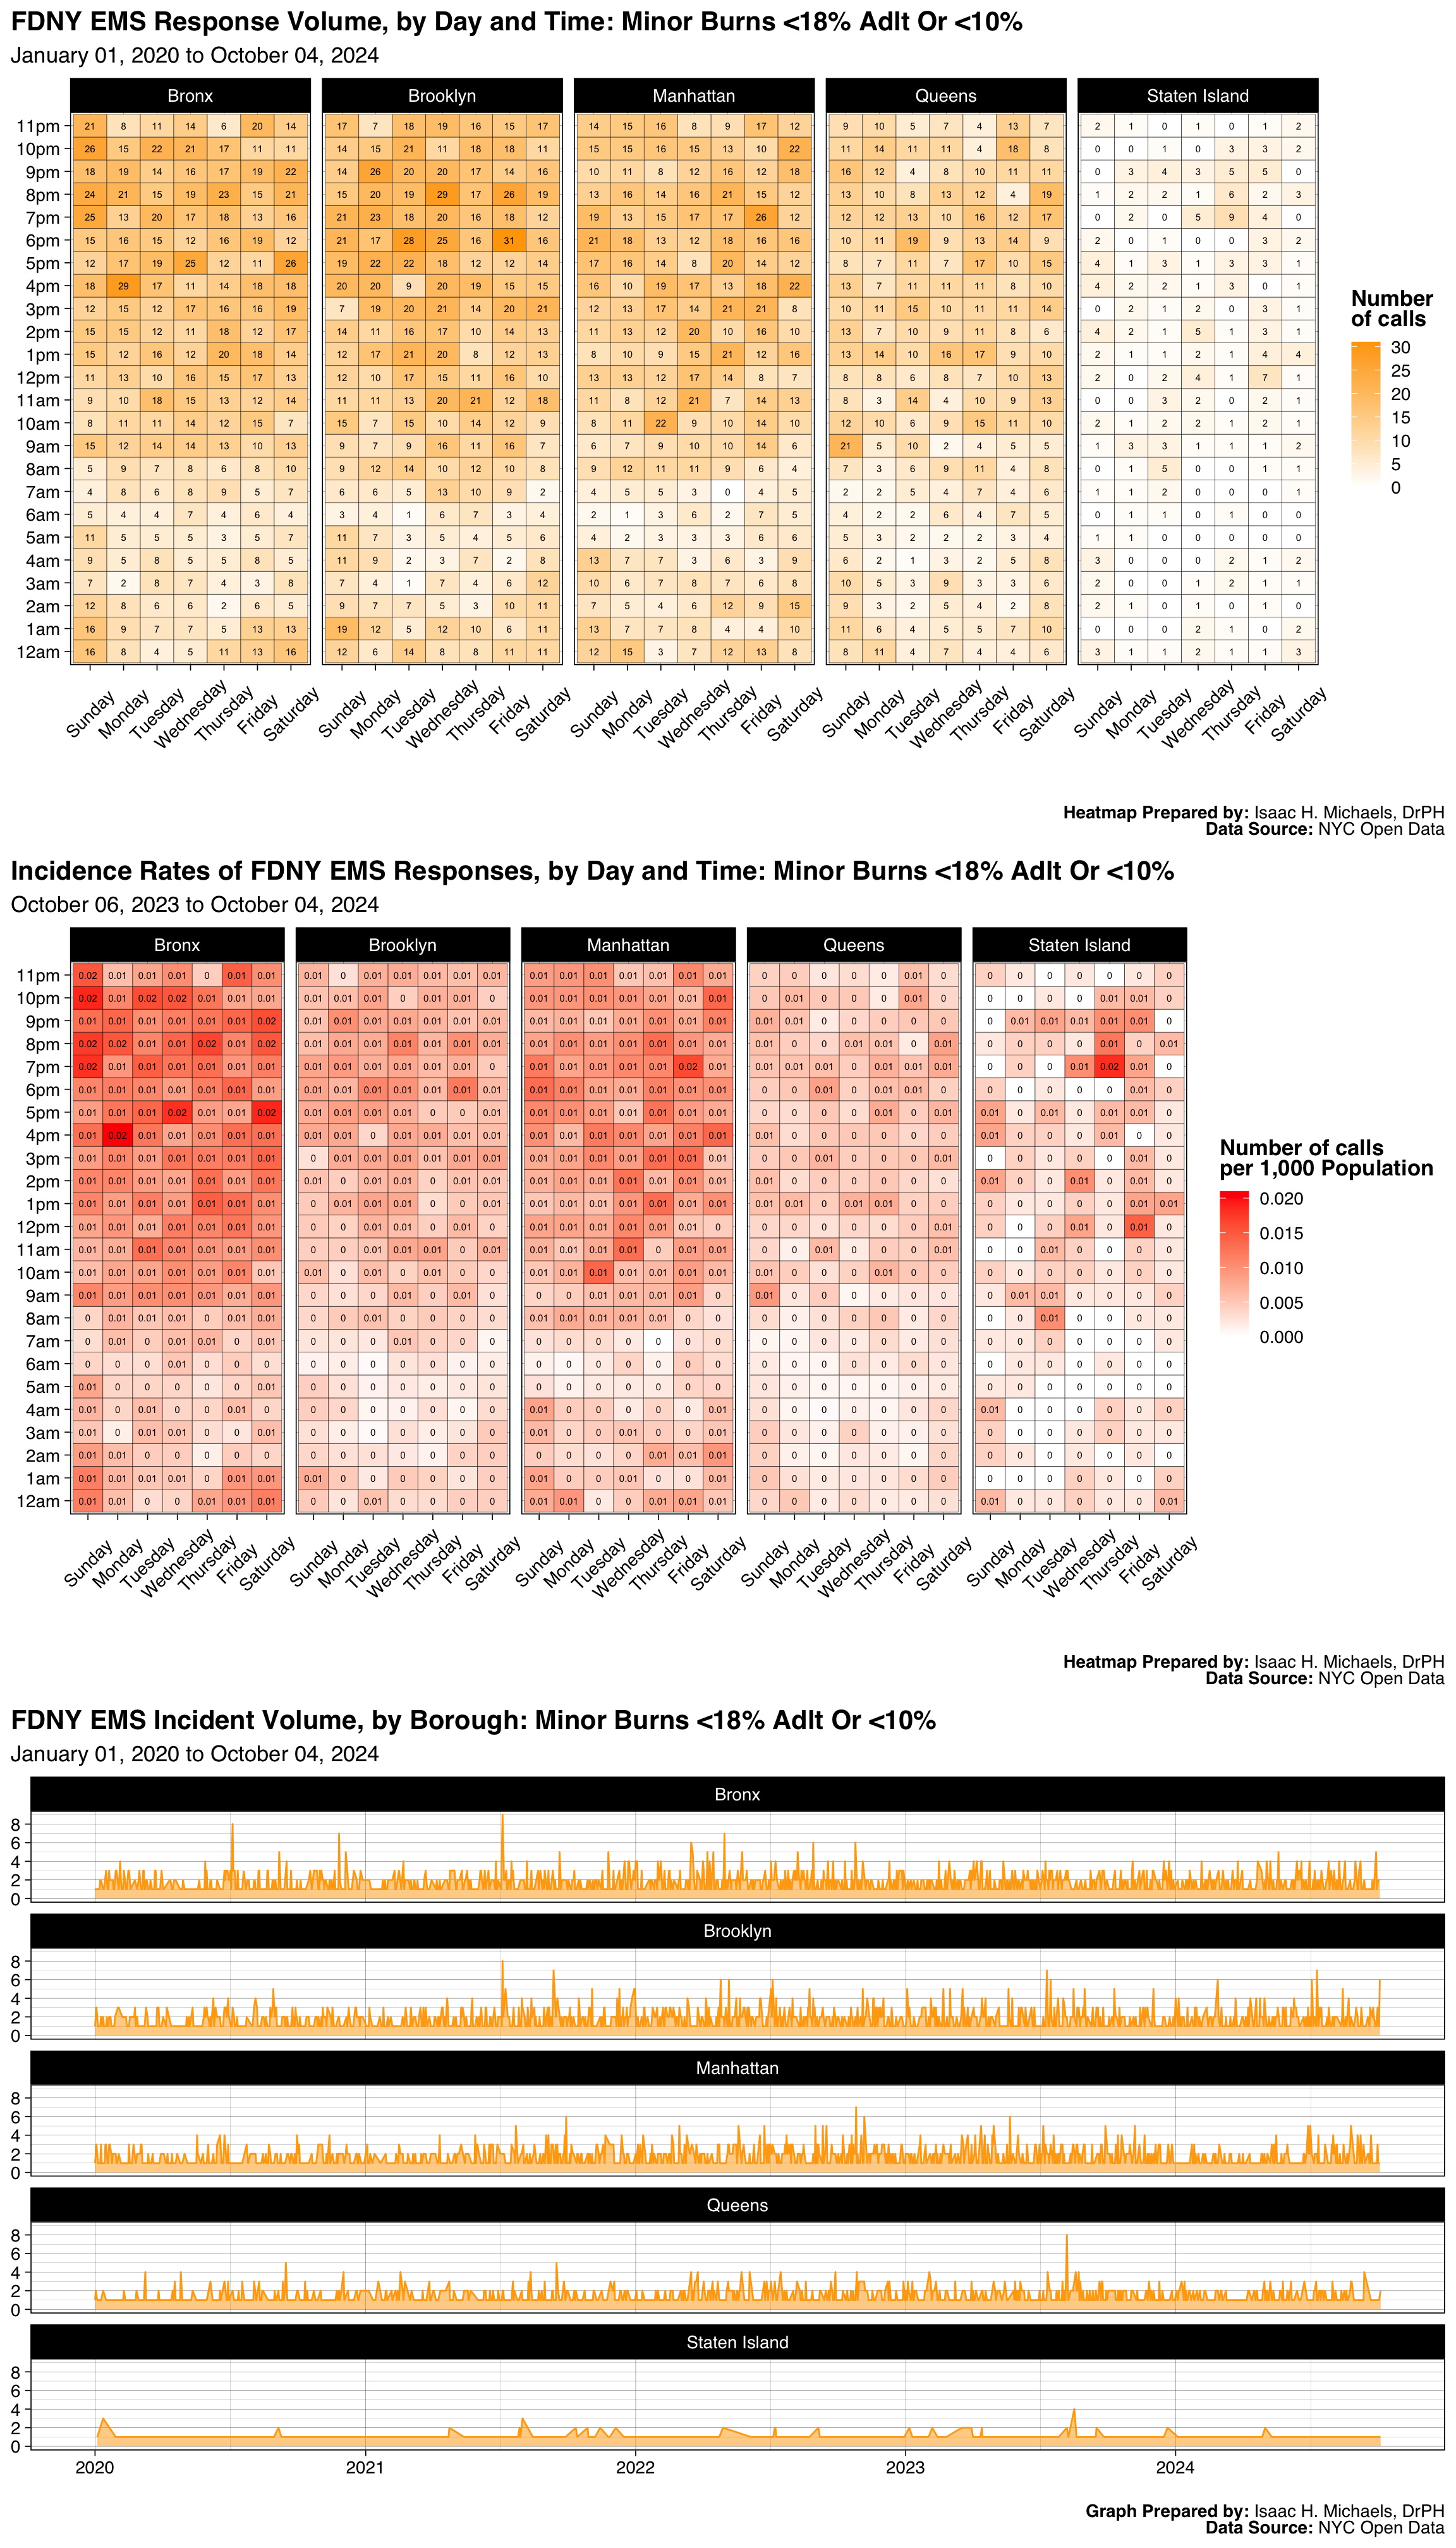
Graphs Prepared by: Isaac H. Michaels, DrPH
Data Source: NYC Open Data
| FDNY EMS Incident Volume, by Borough: Drowning |
||||||
| January 01, 2025 to July 01, 2026 | ||||||
| Borough |
Latest Year: 2026
|
All Years: 2025-2026
|
||||
|---|---|---|---|---|---|---|
| Incidents | % | Rate per 1,000 Population | Total Incidents | % | Monthly Trend | |
| Bronx | 22 | 10% | 0.0 | 80 | 11% | |
| Brooklyn | 37 | 17% | 0.0 | 171 | 23% | |
| Manhattan | 57 | 27% | 0.0 | 217 | 29% | |
| Queens | 83 | 39% | 0.0 | 216 | 29% | |
| Staten Island | 14 | 7% | 0.0 | 53 | 7% | |
| Table Prepred by: Isaac H. Michaels, DrPH | ||||||
| Data Source: NYC Open Data | ||||||
Table Prepared by: Isaac H. Michaels, DrPH
EMS Data Source: NYC Open Data
Population Data Source: Health Data NY
| FDNY EMS Incident Volume, by Severity Level: Drowning |
||||
| January 01, 2025 to July 01, 2026 | ||||
| Final Severity Level |
Latest Year: 2026
|
All Years: 2025-2026
|
||
|---|---|---|---|---|
| Incidents | % | Incidents | % | |
| 1 | 0 | 0% | 0 | 0% |
| 2 | 213 | 100% | 737 | 100% |
| 3 | 0 | 0% | 0 | 0% |
| 4 | 0 | 0% | 0 | 0% |
| 5 | 0 | 0% | 0 | 0% |
| 6 | 0 | 0% | 0 | 0% |
| 7 | 0 | 0% | 0 | 0% |
| 8 | 0 | 0% | 0 | 0% |
| Table Prepred by: Isaac H. Michaels, DrPH | ||||
| Data Source: NYC Open Data | ||||
Table Prepared by: Isaac H. Michaels, DrPH
Data Source: NYC Open Data
| FDNY EMS Incident Volume, by Disposition: Drowning |
||||
| January 01, 2025 to July 01, 2026 | ||||
| Disposition |
Latest Year: 2026
|
All Years: 2025-2026
|
||
|---|---|---|---|---|
| Incidents | % | Incidents | % | |
| Cancelled | 30 | 14% | 108 | 15% |
| Condition Corrected | 28 | 13% | 70 | 9% |
| Patient Gone on Arrival | 5 | 2% | 14 | 2% |
| Patient Pronounced Dead | 16 | 8% | 52 | 7% |
| Refused Medical Aid | 9 | 4% | 28 | 4% |
| Transporting Patient | 34 | 16% | 112 | 15% |
| Unfounded | 84 | 39% | 342 | 46% |
| NA | 7 | 3% | 11 | 1% |
| Table Prepred by: Isaac H. Michaels, DrPH | ||||
| Data Source: NYC Open Data | ||||
Table Prepared by: Isaac H. Michaels, DrPH
Data Source: NYC Open Data
Back to top
Hostage Situation / Barricaded
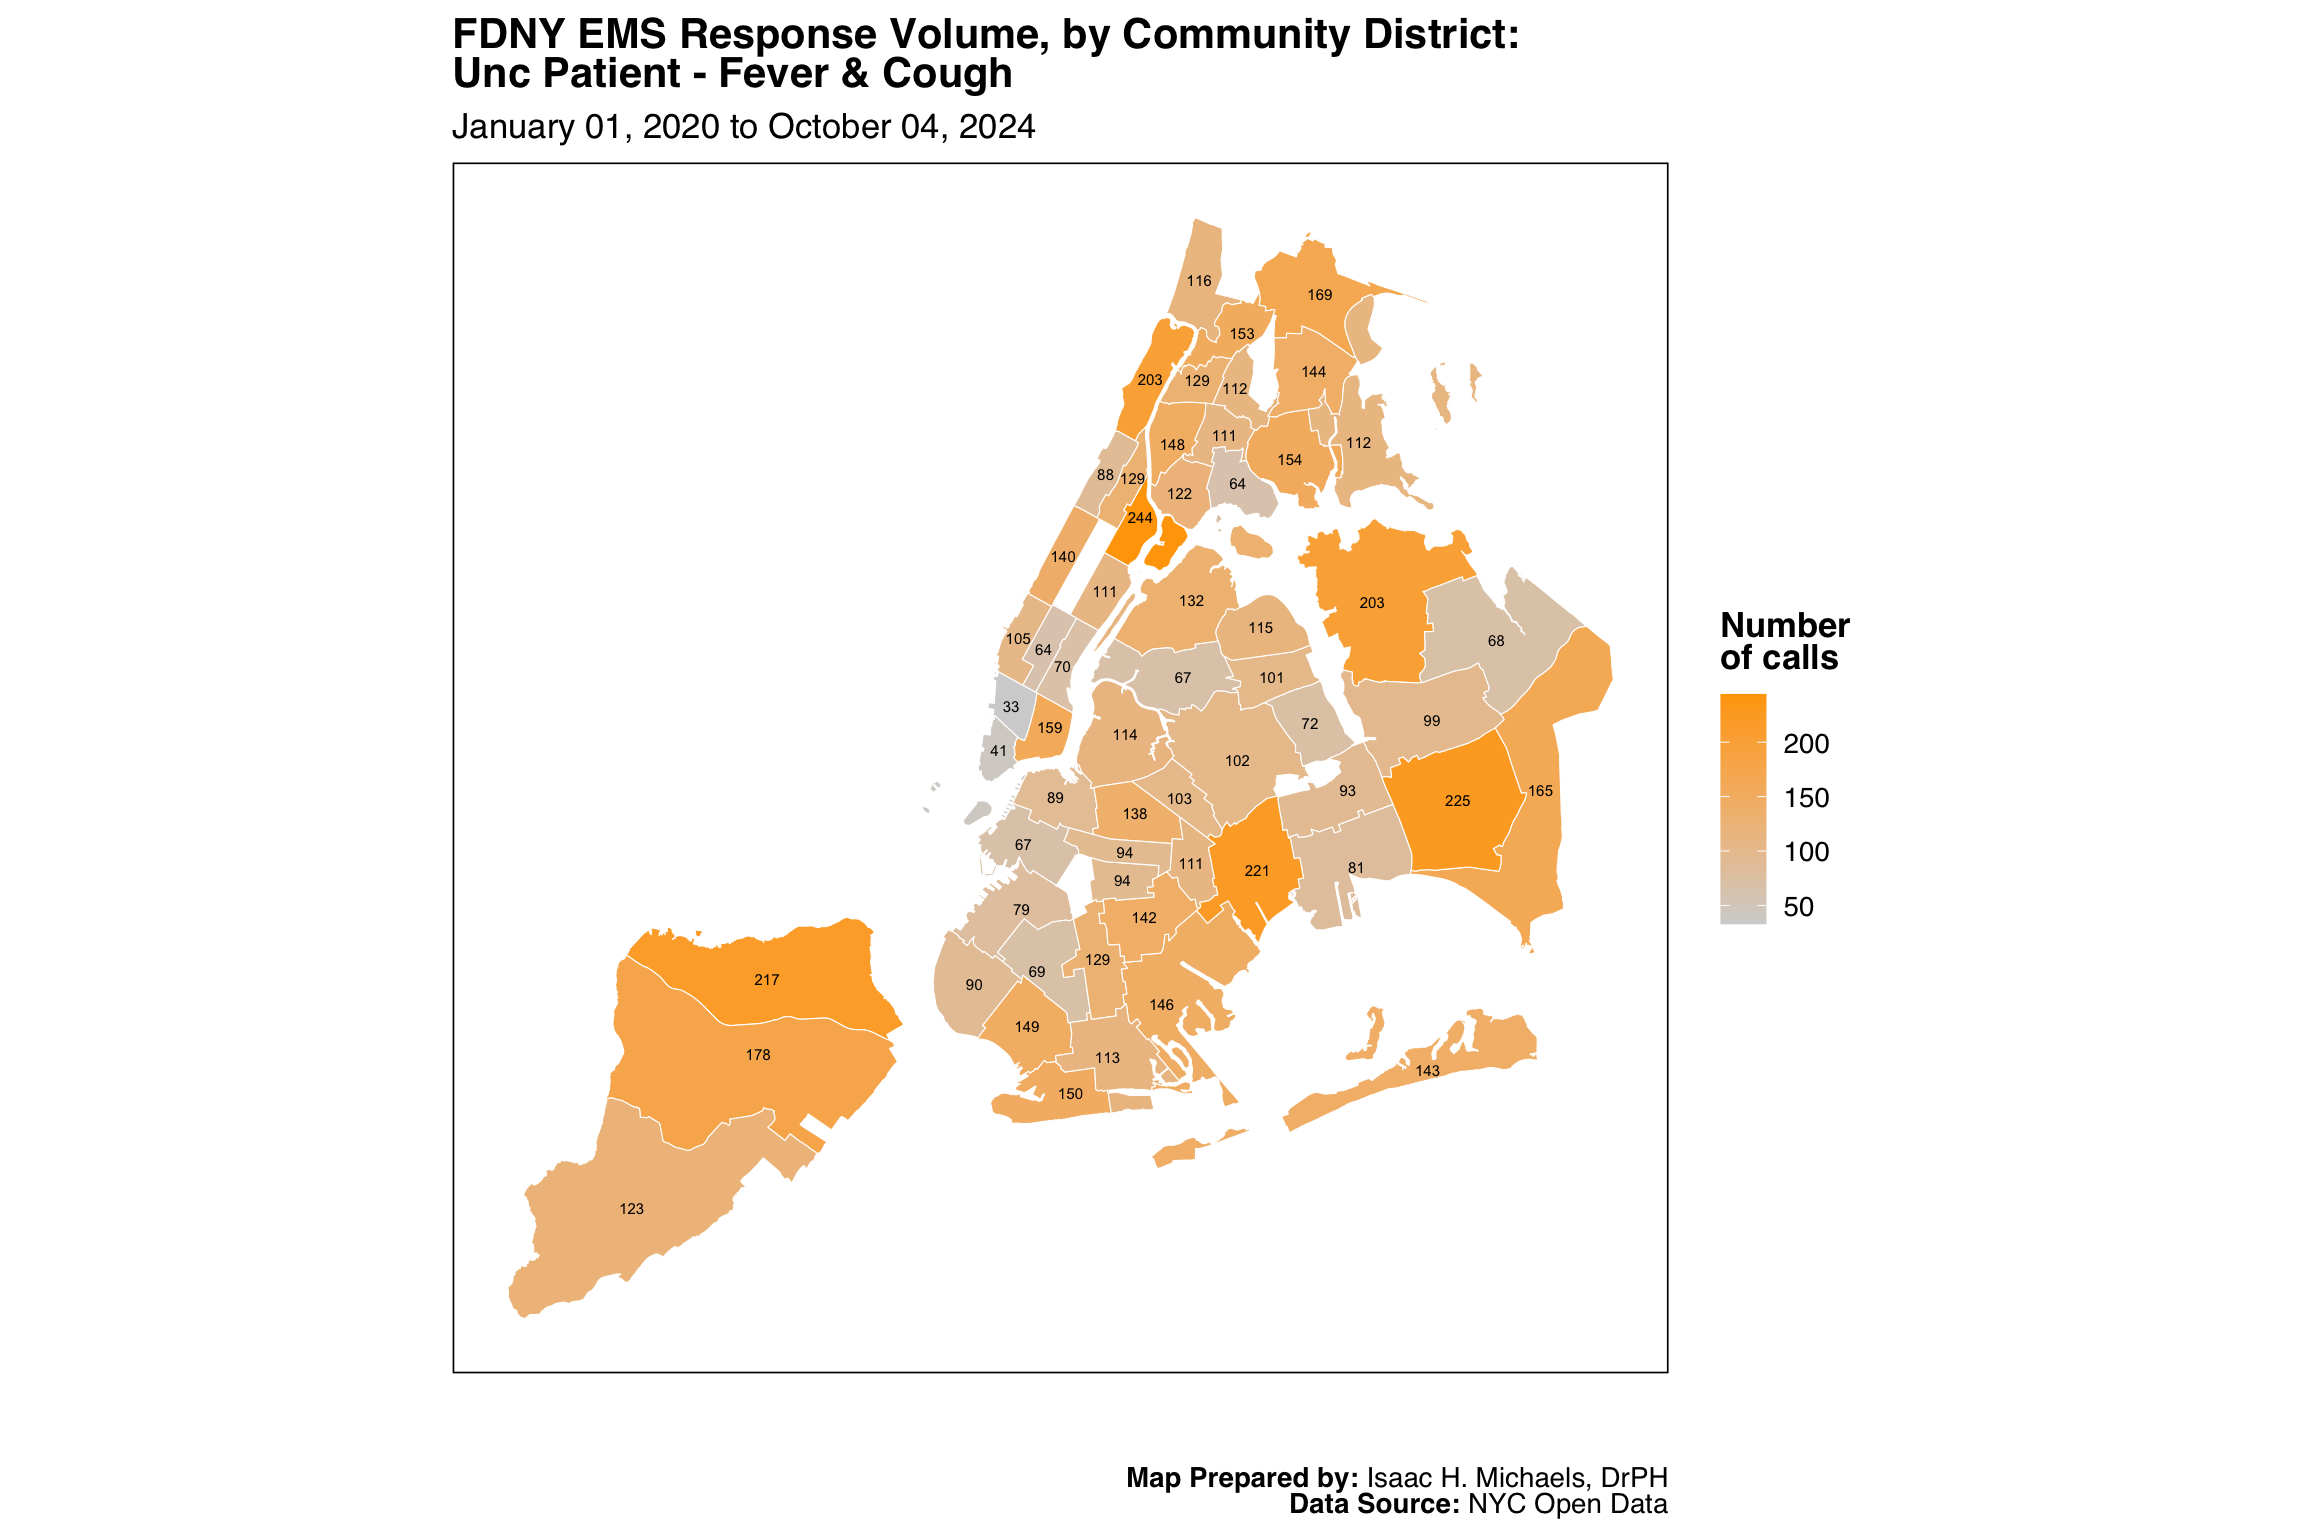
Map Prepared by: Isaac H. Michaels, DrPH
Data Source: NYC Open Data

Map Prepared by: Isaac H. Michaels, DrPH
EMS Data Source: NYC Open Data
Population Data Source: NYC Open Data
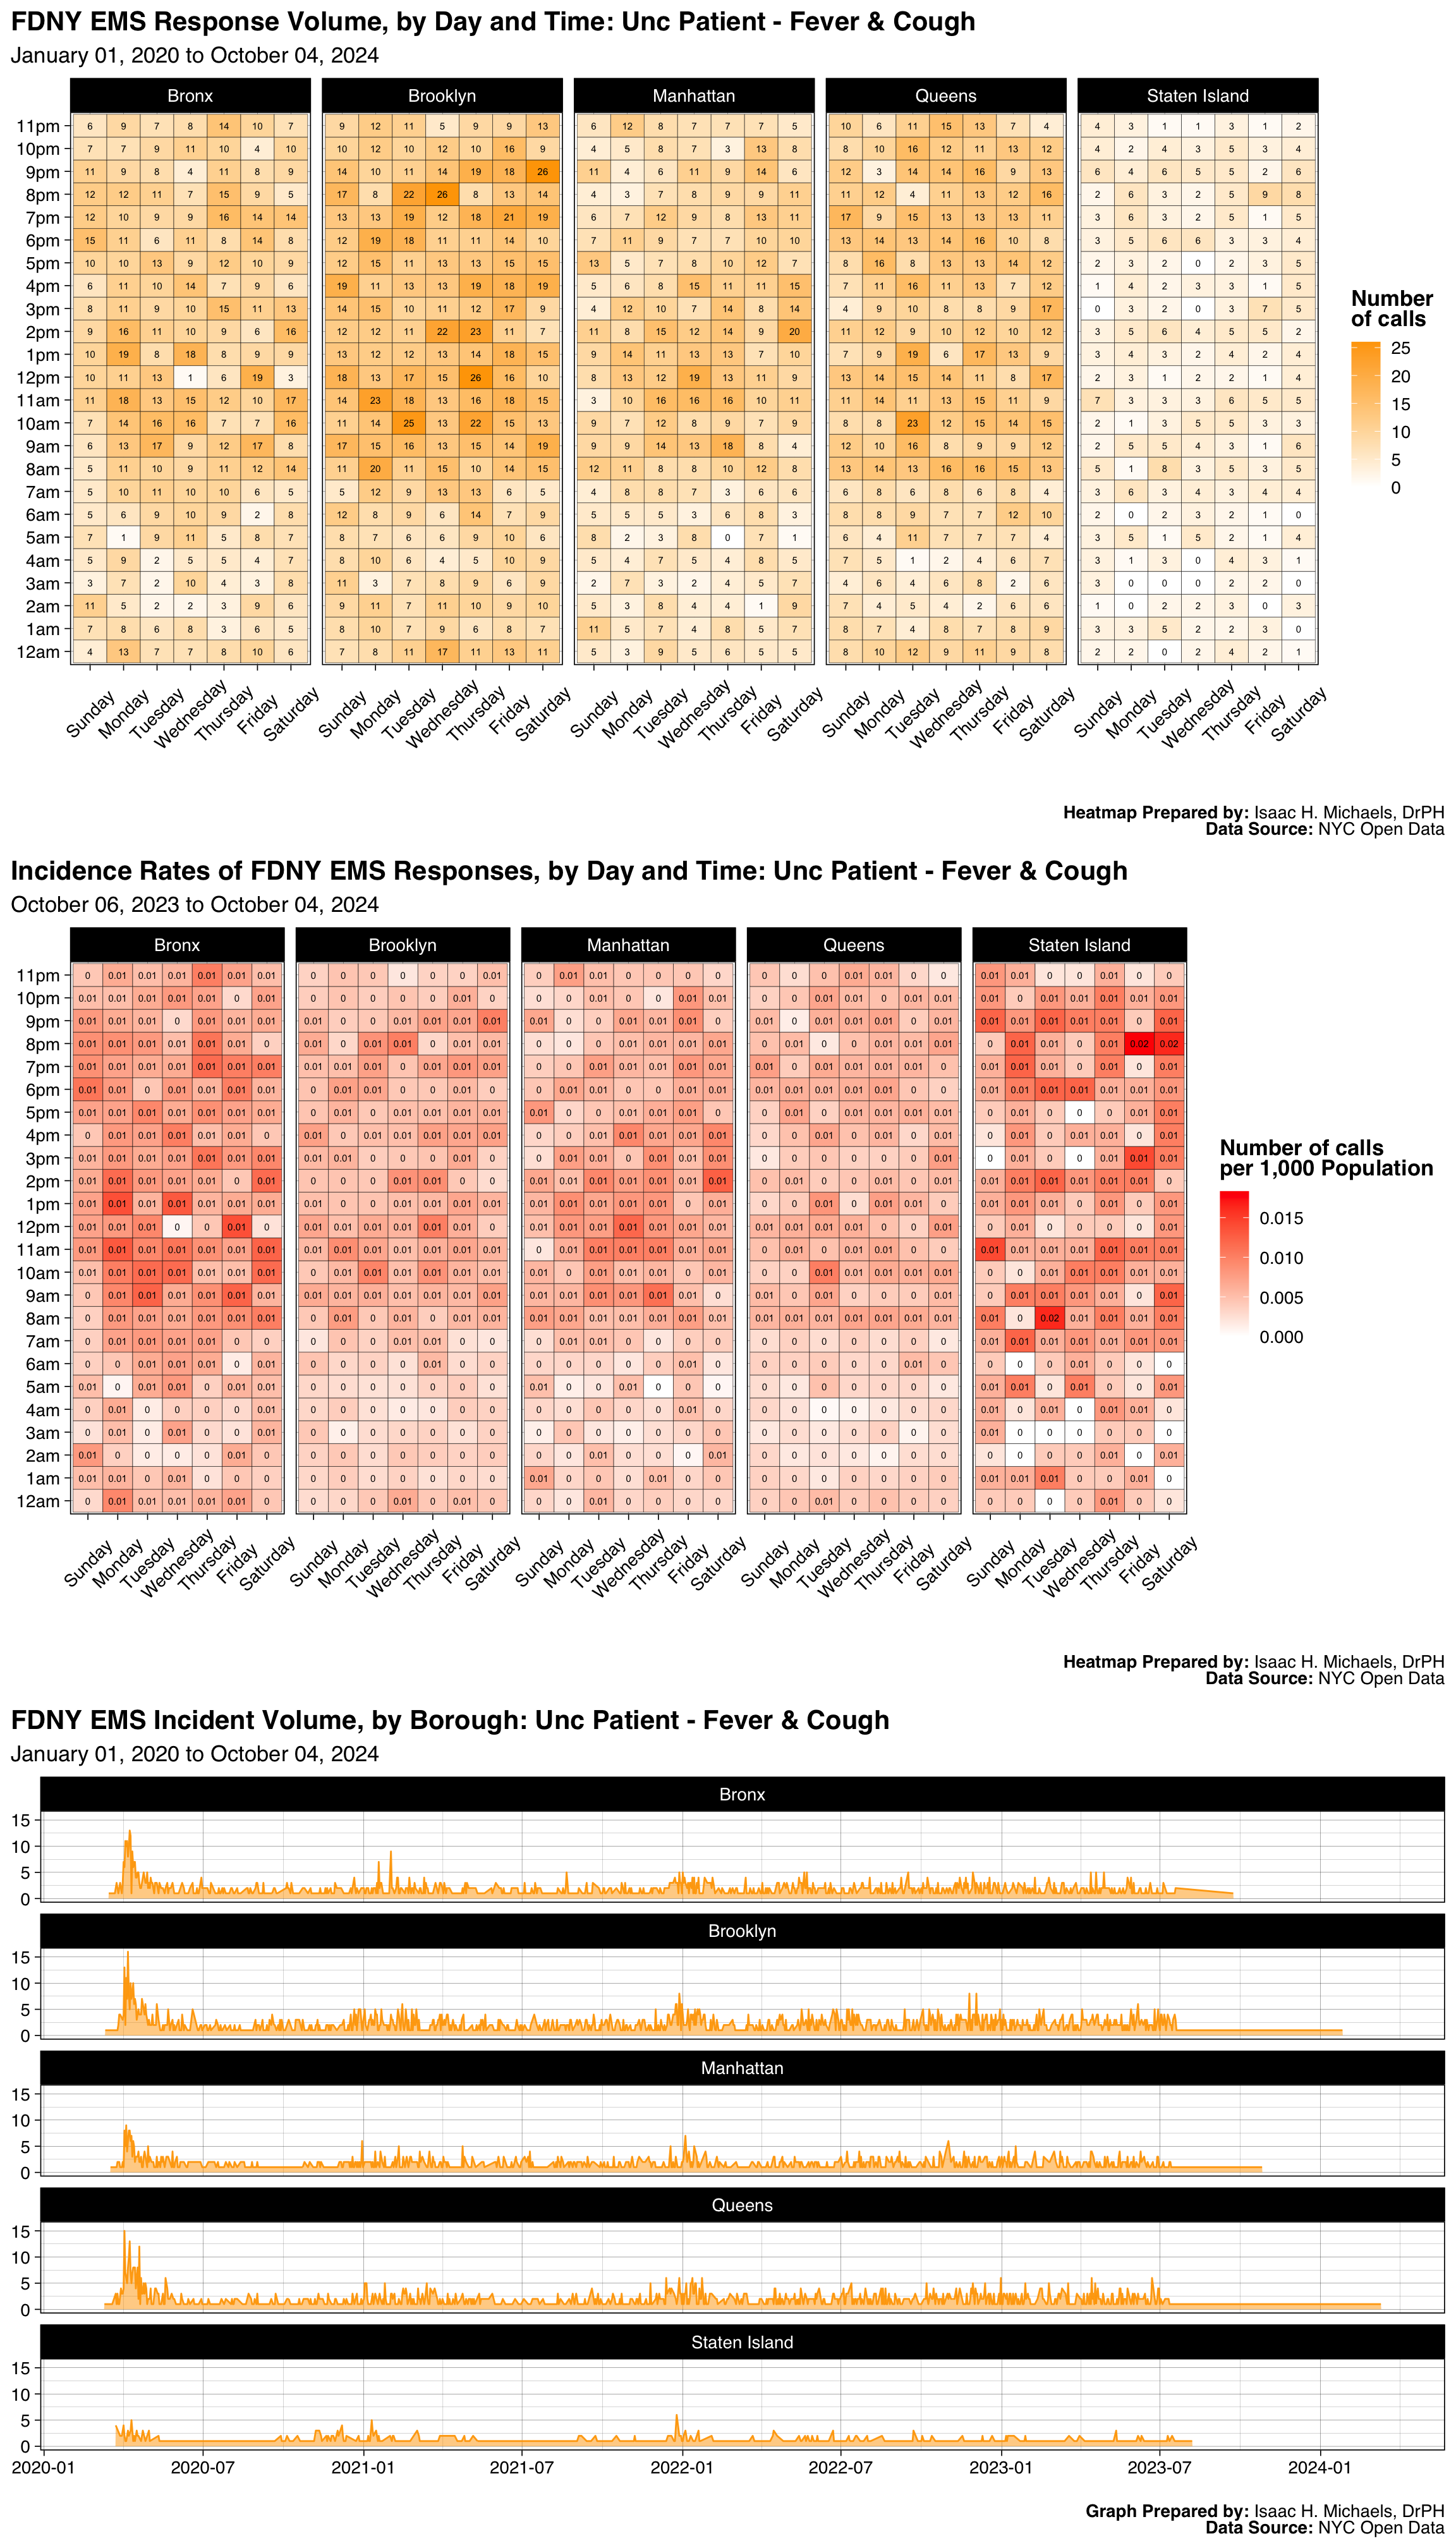
Graphs Prepared by: Isaac H. Michaels, DrPH
Data Source: NYC Open Data
| FDNY EMS Incident Volume, by Borough: Hostage Situation / Barricaded |
||||||
| January 01, 2025 to July 01, 2026 | ||||||
| Borough |
Latest Year: 2026
|
All Years: 2025-2026
|
||||
|---|---|---|---|---|---|---|
| Incidents | % | Rate per 1,000 Population | Total Incidents | % | Monthly Trend | |
| Bronx | 45 | 21% | 0.0 | 176 | 25% | |
| Brooklyn | 83 | 38% | 0.0 | 230 | 33% | |
| Manhattan | 37 | 17% | 0.0 | 141 | 20% | |
| Queens | 41 | 19% | 0.0 | 118 | 17% | |
| Staten Island | 12 | 6% | 0.0 | 38 | 5% | |
| Table Prepred by: Isaac H. Michaels, DrPH | ||||||
| Data Source: NYC Open Data | ||||||
Table Prepared by: Isaac H. Michaels, DrPH
EMS Data Source: NYC Open Data
Population Data Source: Health Data NY
| FDNY EMS Incident Volume, by Severity Level: Hostage Situation / Barricaded |
||||
| January 01, 2025 to July 01, 2026 | ||||
| Final Severity Level |
Latest Year: 2026
|
All Years: 2025-2026
|
||
|---|---|---|---|---|
| Incidents | % | Incidents | % | |
| 1 | 0 | 0% | 0 | 0% |
| 2 | 202 | 93% | 653 | 93% |
| 3 | 12 | 6% | 44 | 6% |
| 4 | 1 | 0% | 3 | 0% |
| 5 | 3 | 1% | 3 | 0% |
| 6 | 0 | 0% | 0 | 0% |
| 7 | 0 | 0% | 0 | 0% |
| 8 | 0 | 0% | 0 | 0% |
| Table Prepred by: Isaac H. Michaels, DrPH | ||||
| Data Source: NYC Open Data | ||||
Table Prepared by: Isaac H. Michaels, DrPH
Data Source: NYC Open Data
| FDNY EMS Incident Volume, by Disposition: Hostage Situation / Barricaded |
||||
| January 01, 2025 to July 01, 2026 | ||||
| Disposition |
Latest Year: 2026
|
All Years: 2025-2026
|
||
|---|---|---|---|---|
| Incidents | % | Incidents | % | |
| Cancelled | 12 | 6% | 26 | 4% |
| Condition Corrected | 28 | 13% | 72 | 10% |
| Patient Pronounced Dead | 3 | 1% | 4 | 1% |
| Refused Medical Aid | 15 | 7% | 40 | 6% |
| Transporting Patient | 153 | 70% | 537 | 76% |
| Treated and Transported | 1 | 0% | 3 | 0% |
| Unfounded | 6 | 3% | 14 | 2% |
| Table Prepred by: Isaac H. Michaels, DrPH | ||||
| Data Source: NYC Open Data | ||||
Table Prepared by: Isaac H. Michaels, DrPH
Data Source: NYC Open Data
Back to top
Auto Accident, No Confirmd Inj
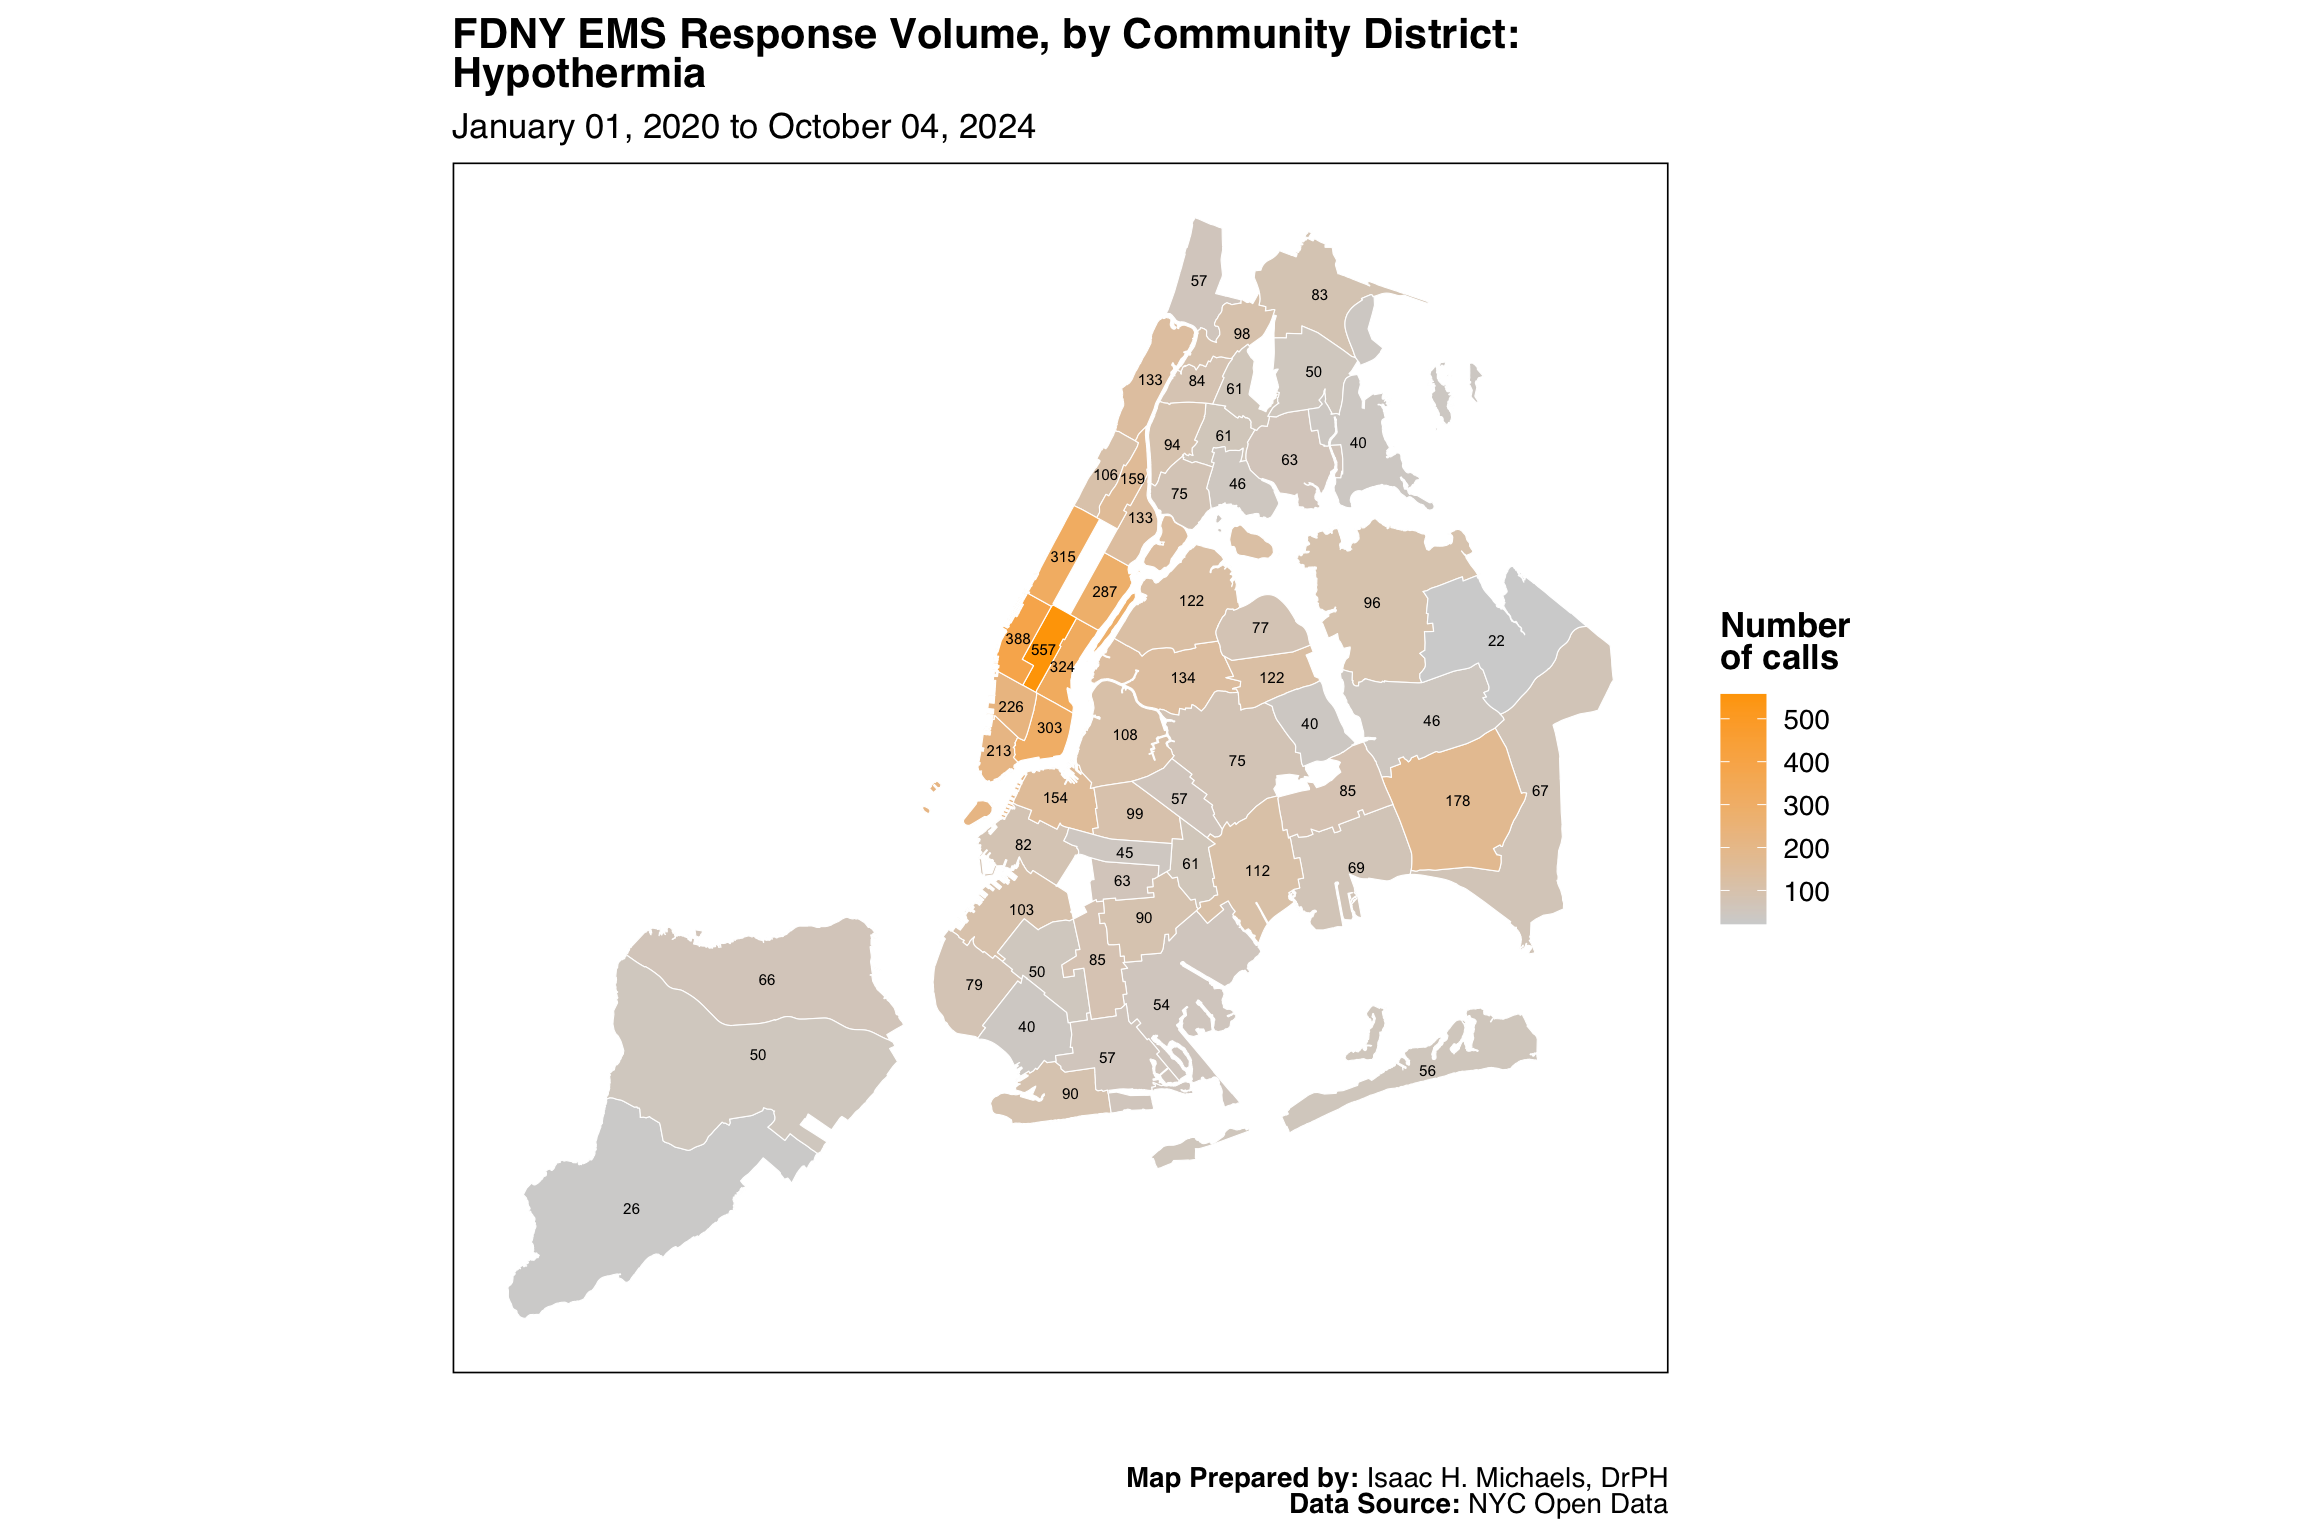
Map Prepared by: Isaac H. Michaels, DrPH
Data Source: NYC Open Data
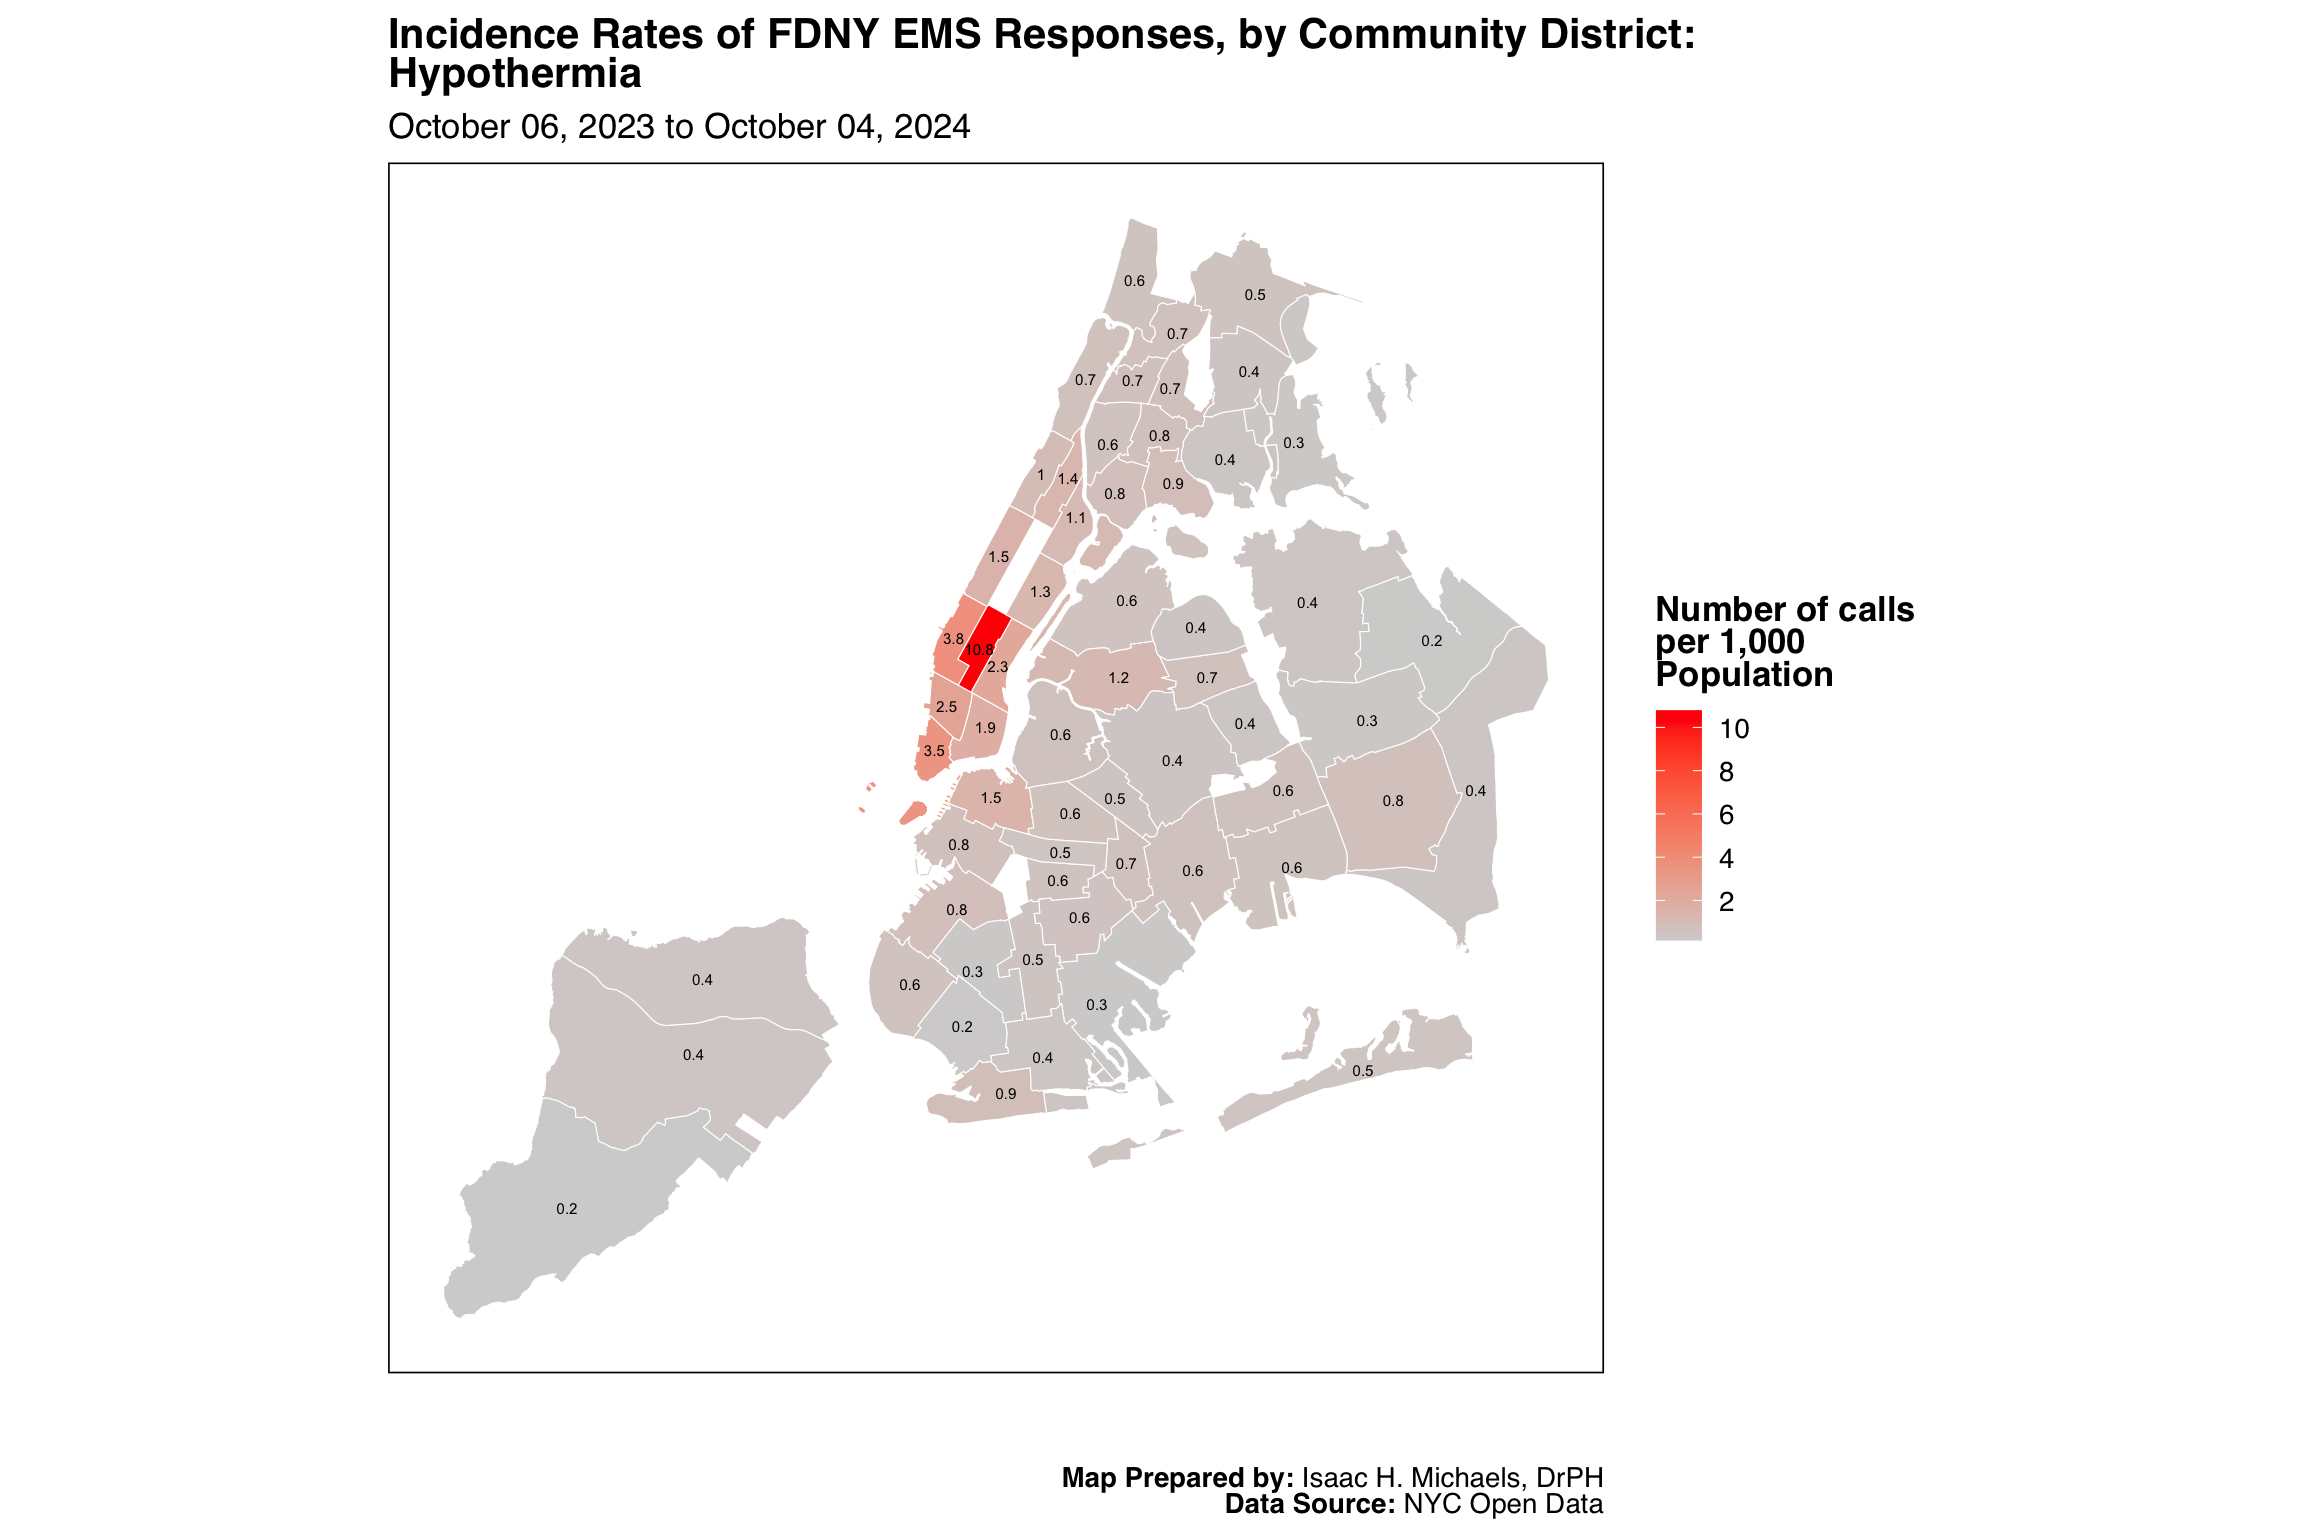
Map Prepared by: Isaac H. Michaels, DrPH
EMS Data Source: NYC Open Data
Population Data Source: NYC Open Data
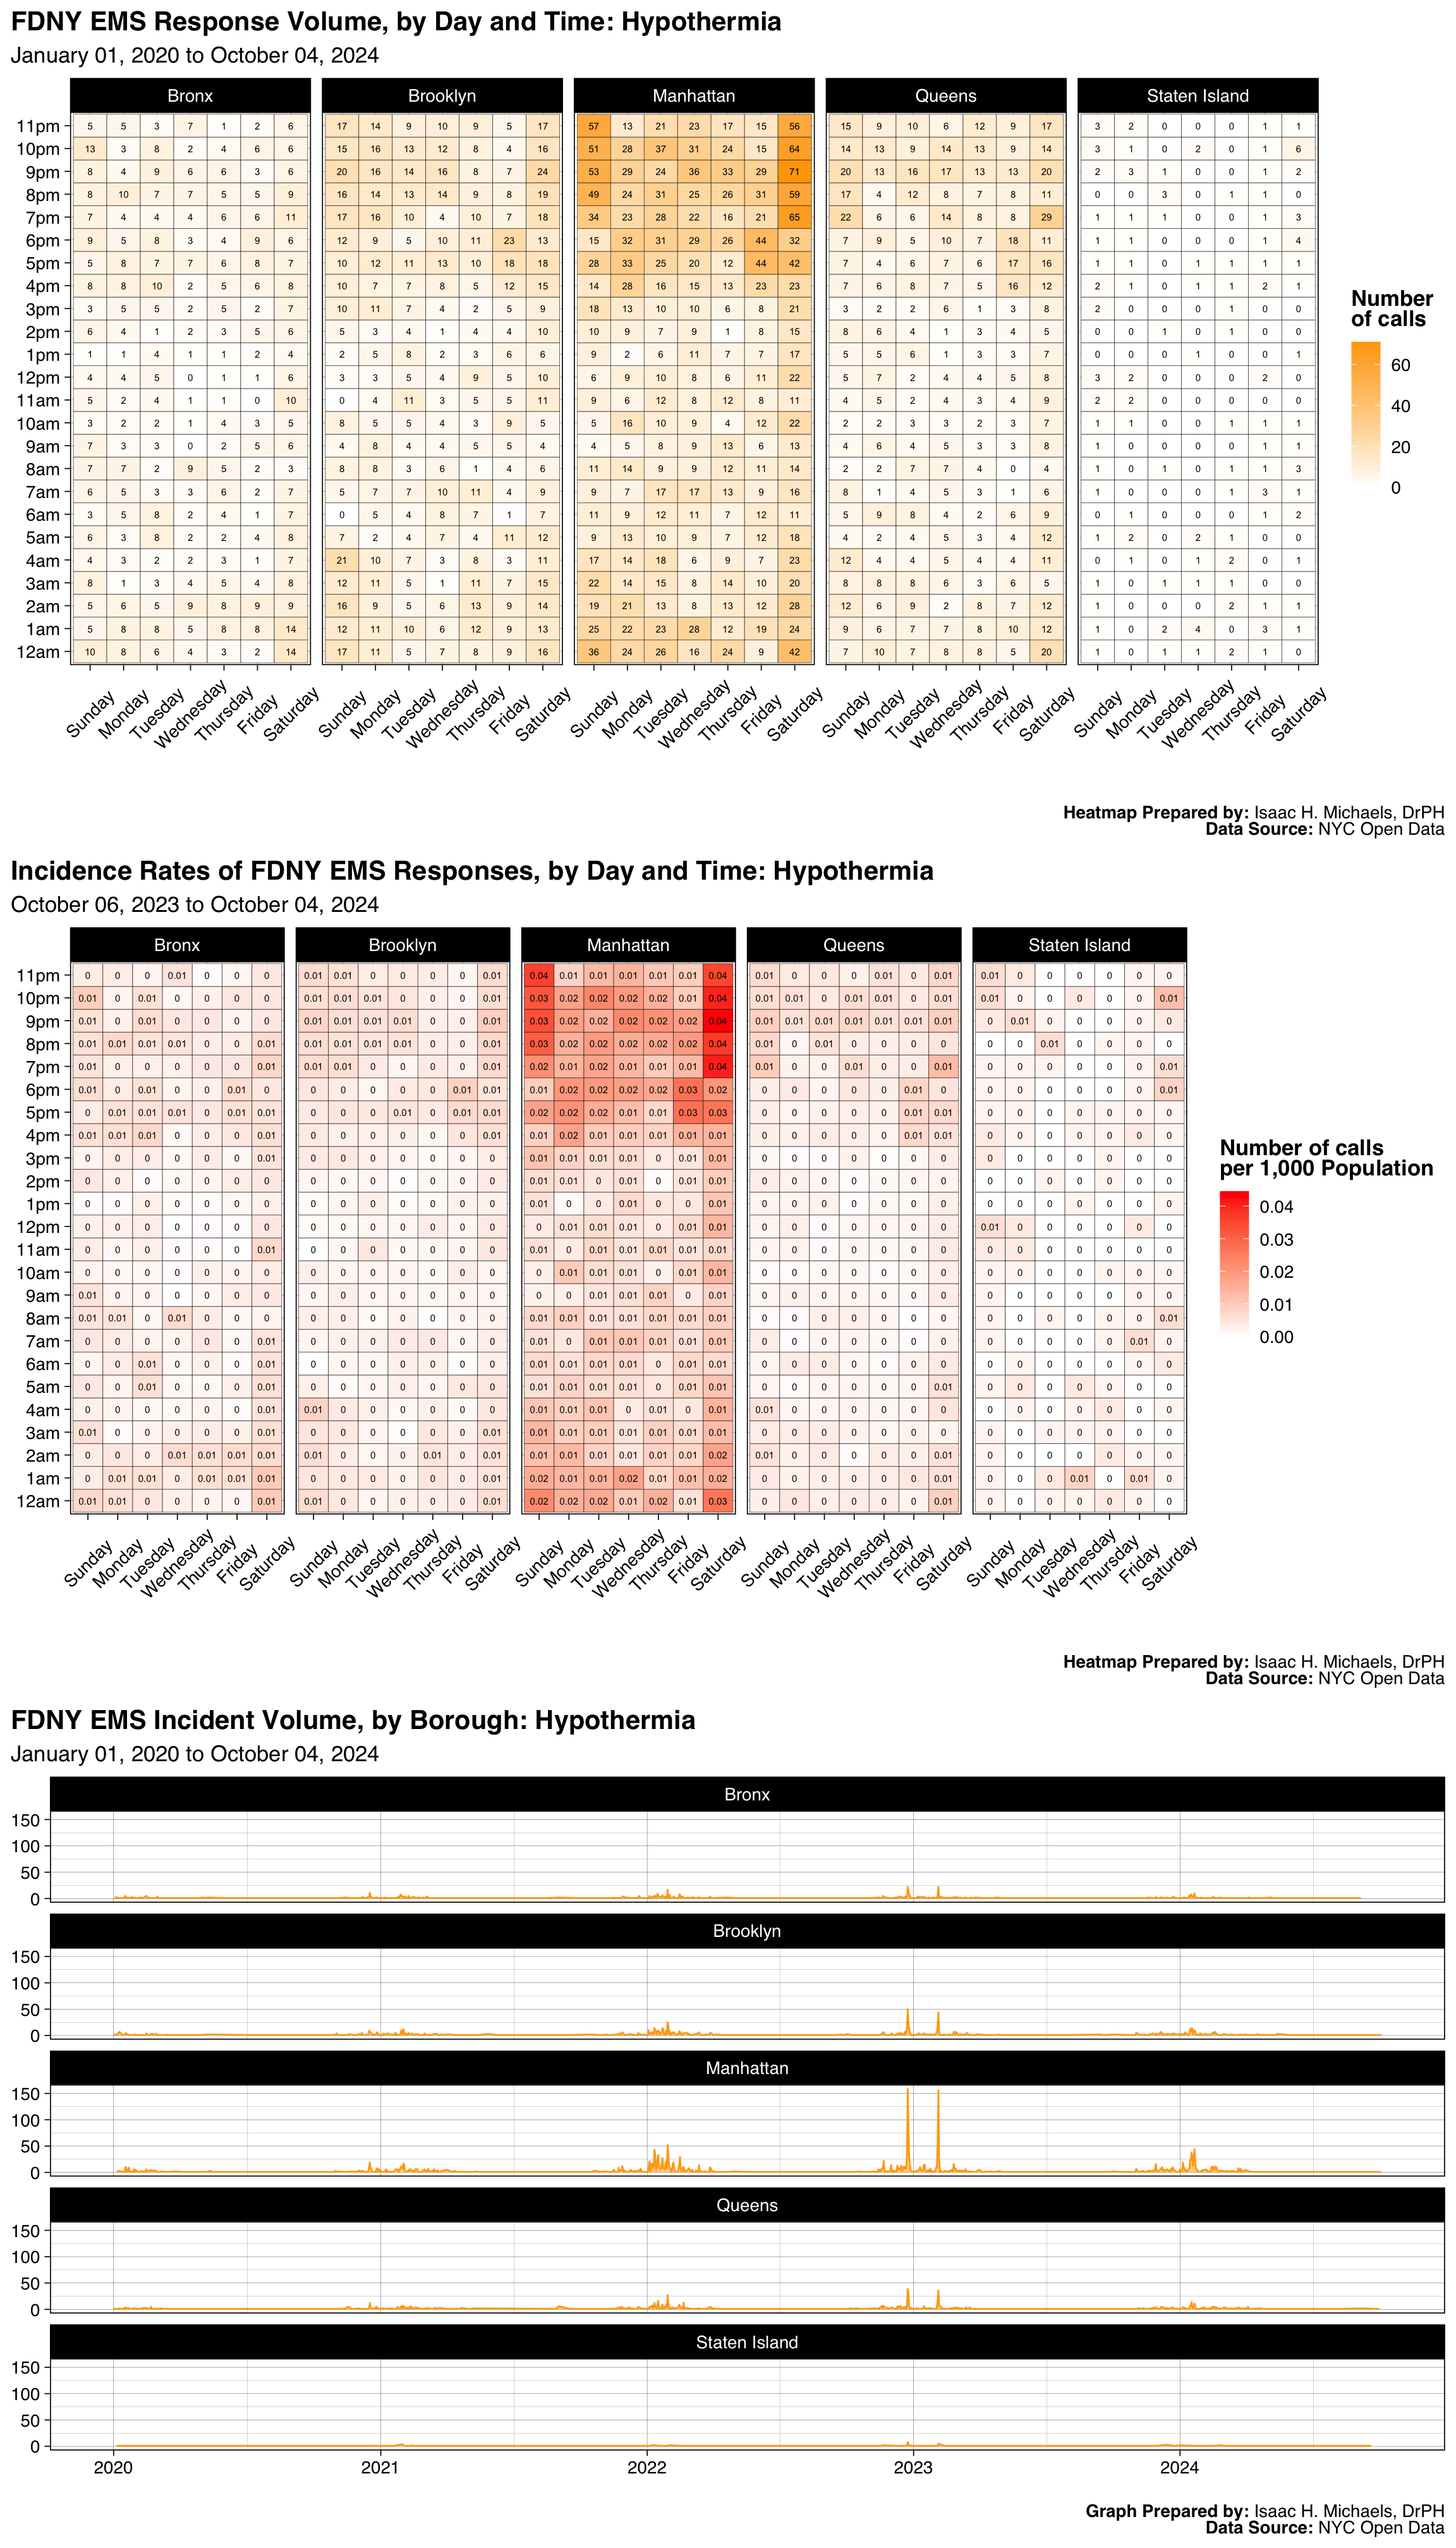
Graphs Prepared by: Isaac H. Michaels, DrPH
Data Source: NYC Open Data
| FDNY EMS Incident Volume, by Borough: Auto Accident, No Confirmd Inj |
||||||
| January 01, 2025 to July 01, 2026 | ||||||
| Borough |
Latest Year: 2026
|
All Years: 2025-2026
|
||||
|---|---|---|---|---|---|---|
| Incidents | % | Rate per 1,000 Population | Total Incidents | % | Monthly Trend | |
| Bronx | 29 | 17% | 0.0 | 88 | 17% | |
| Brooklyn | 34 | 20% | 0.0 | 104 | 21% | |
| Manhattan | 29 | 17% | 0.0 | 69 | 14% | |
| Queens | 68 | 40% | 0.0 | 227 | 45% | |
| Staten Island | 8 | 5% | 0.0 | 18 | 4% | |
| Table Prepred by: Isaac H. Michaels, DrPH | ||||||
| Data Source: NYC Open Data | ||||||
Table Prepared by: Isaac H. Michaels, DrPH
EMS Data Source: NYC Open Data
Population Data Source: Health Data NY
| FDNY EMS Incident Volume, by Severity Level: Auto Accident, No Confirmd Inj |
||||
| January 01, 2025 to July 01, 2026 | ||||
| Final Severity Level |
Latest Year: 2026
|
All Years: 2025-2026
|
||
|---|---|---|---|---|
| Incidents | % | Incidents | % | |
| 1 | 0 | 0% | 0 | 0% |
| 2 | 0 | 0% | 0 | 0% |
| 3 | 1 | 1% | 1 | 0% |
| 4 | 0 | 0% | 1 | 0% |
| 5 | 0 | 0% | 0 | 0% |
| 6 | 167 | 99% | 504 | 100% |
| 7 | 0 | 0% | 0 | 0% |
| 8 | 0 | 0% | 0 | 0% |
| Table Prepred by: Isaac H. Michaels, DrPH | ||||
| Data Source: NYC Open Data | ||||
Table Prepared by: Isaac H. Michaels, DrPH
Data Source: NYC Open Data
| FDNY EMS Incident Volume, by Disposition: Auto Accident, No Confirmd Inj |
||||
| January 01, 2025 to July 01, 2026 | ||||
| Disposition |
Latest Year: 2026
|
All Years: 2025-2026
|
||
|---|---|---|---|---|
| Incidents | % | Incidents | % | |
| Cancelled | 17 | 10% | 49 | 10% |
| Condition Corrected | 36 | 21% | 124 | 25% |
| Patient Gone on Arrival | 2 | 1% | 6 | 1% |
| Refused Medical Aid | 53 | 32% | 164 | 32% |
| Transporting Patient | 31 | 18% | 100 | 20% |
| Unfounded | 10 | 6% | 29 | 6% |
| NA | 19 | 11% | 34 | 7% |
| Table Prepred by: Isaac H. Michaels, DrPH | ||||
| Data Source: NYC Open Data | ||||
Table Prepared by: Isaac H. Michaels, DrPH
Data Source: NYC Open Data
Back to top
Child Abuse
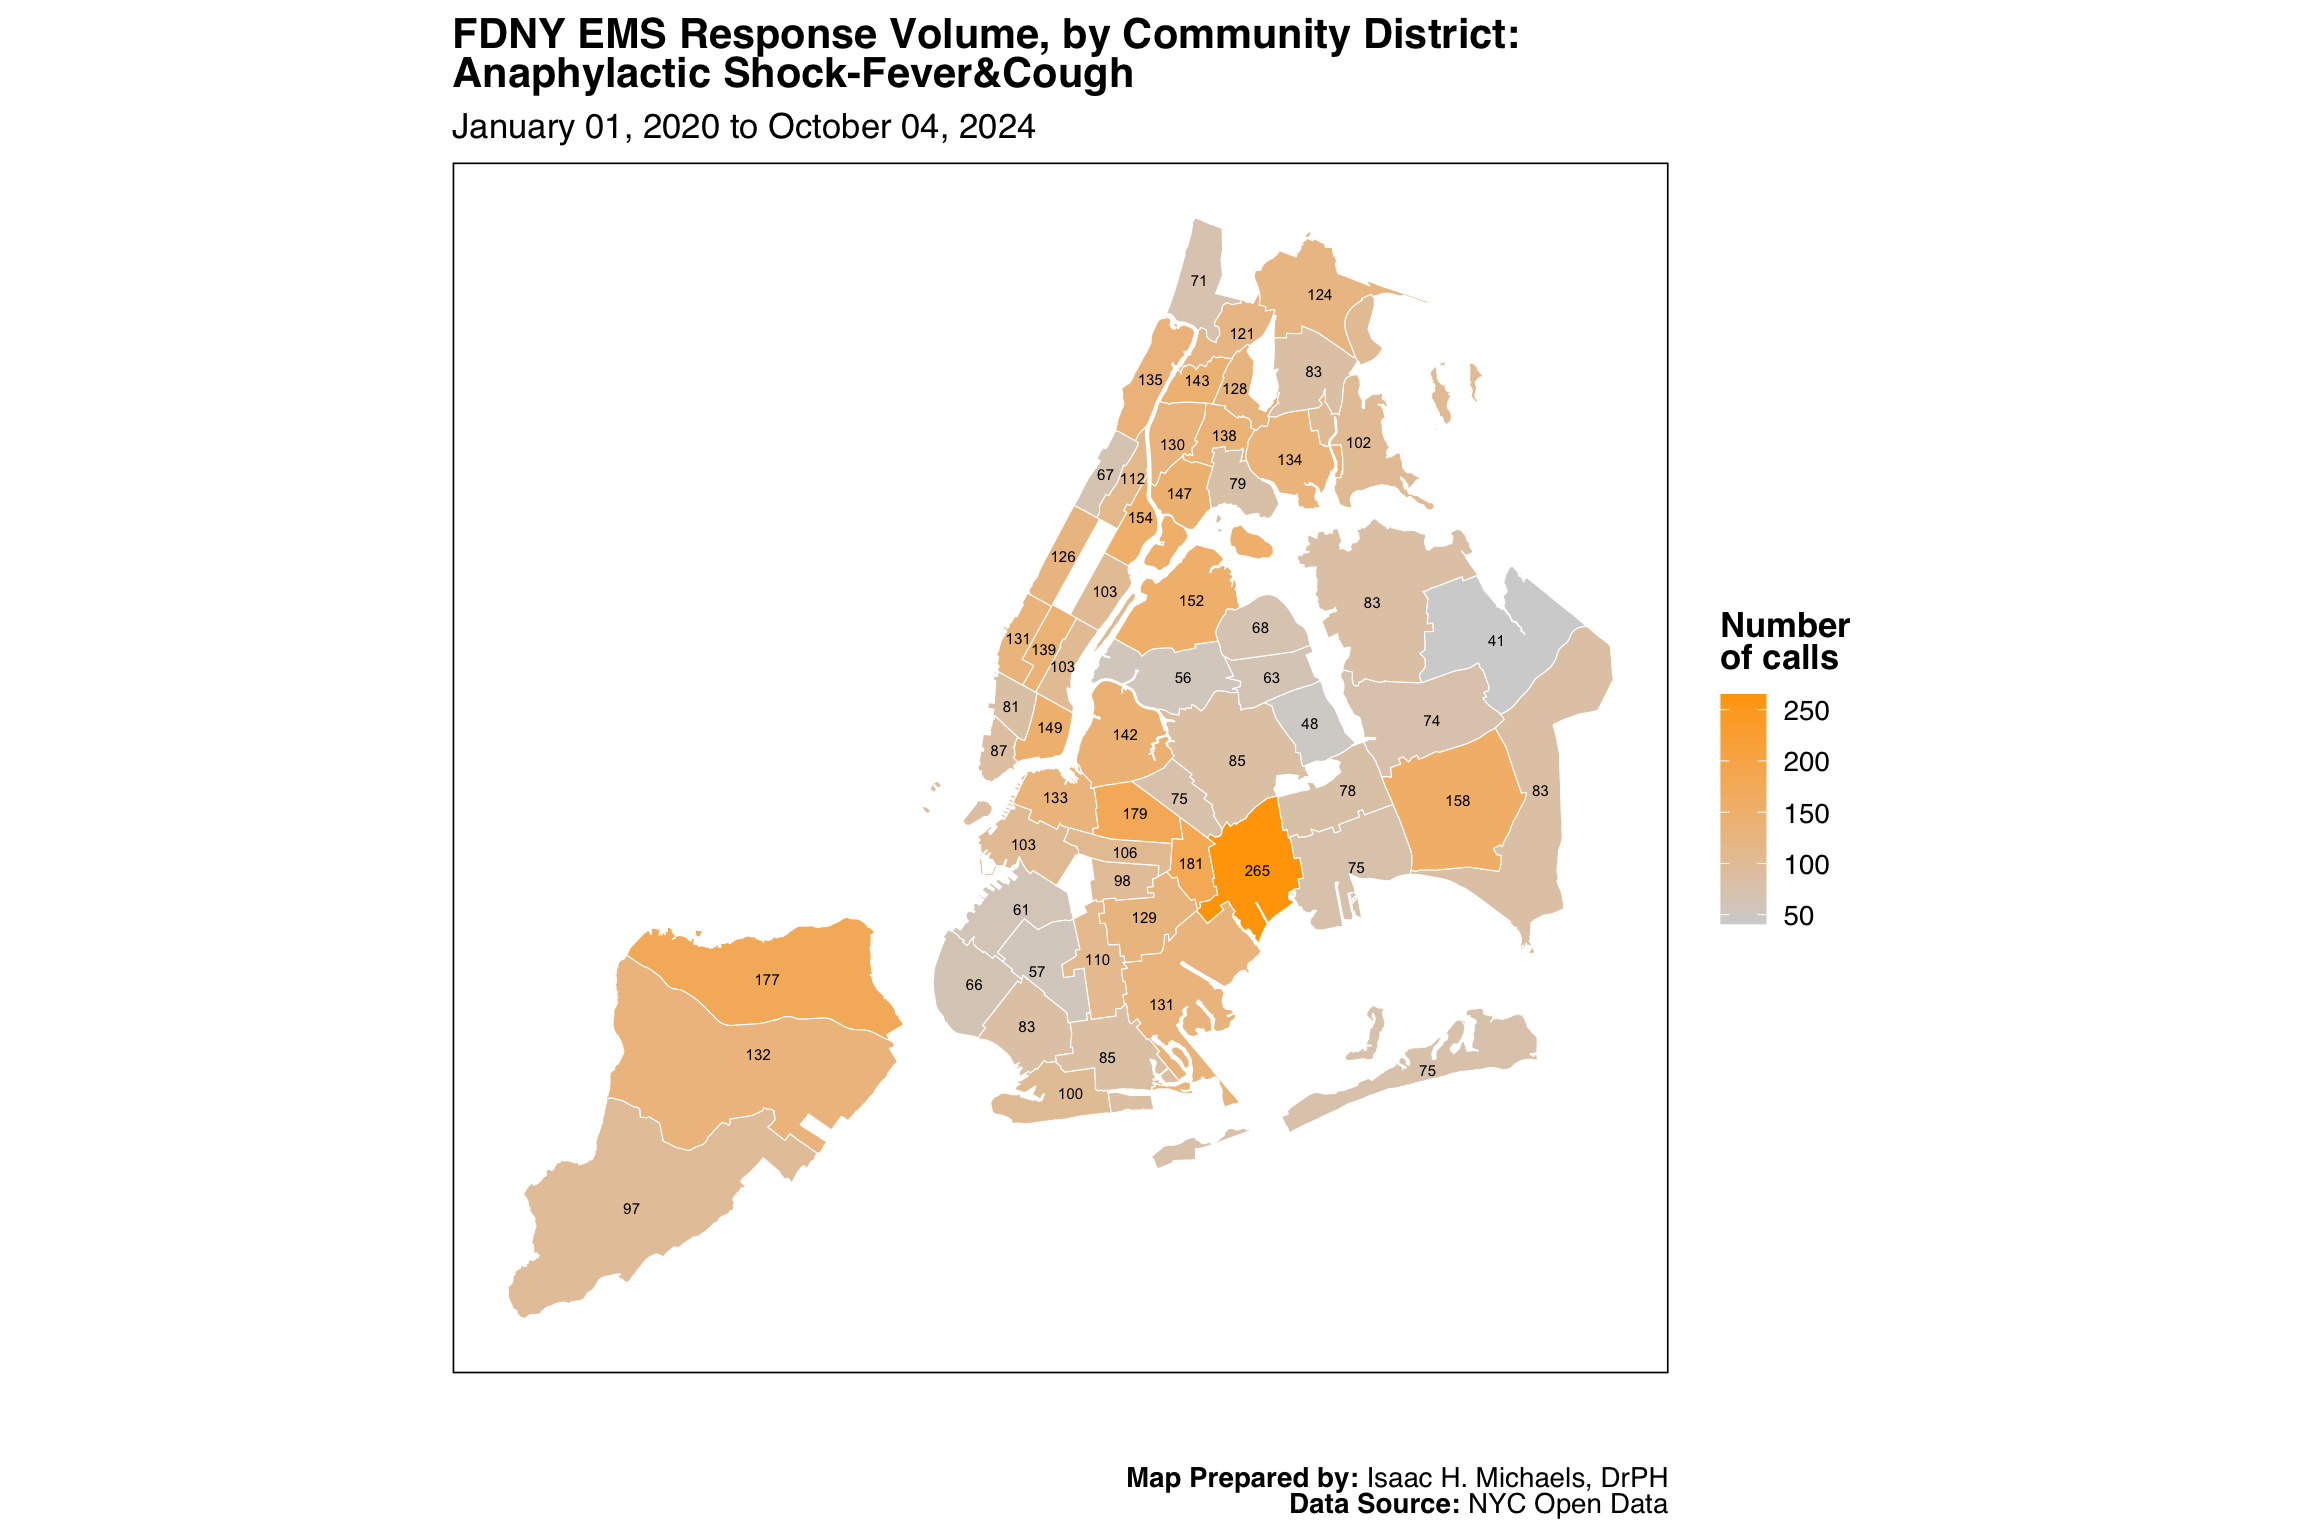
Map Prepared by: Isaac H. Michaels, DrPH
Data Source: NYC Open Data

Map Prepared by: Isaac H. Michaels, DrPH
EMS Data Source: NYC Open Data
Population Data Source: NYC Open Data
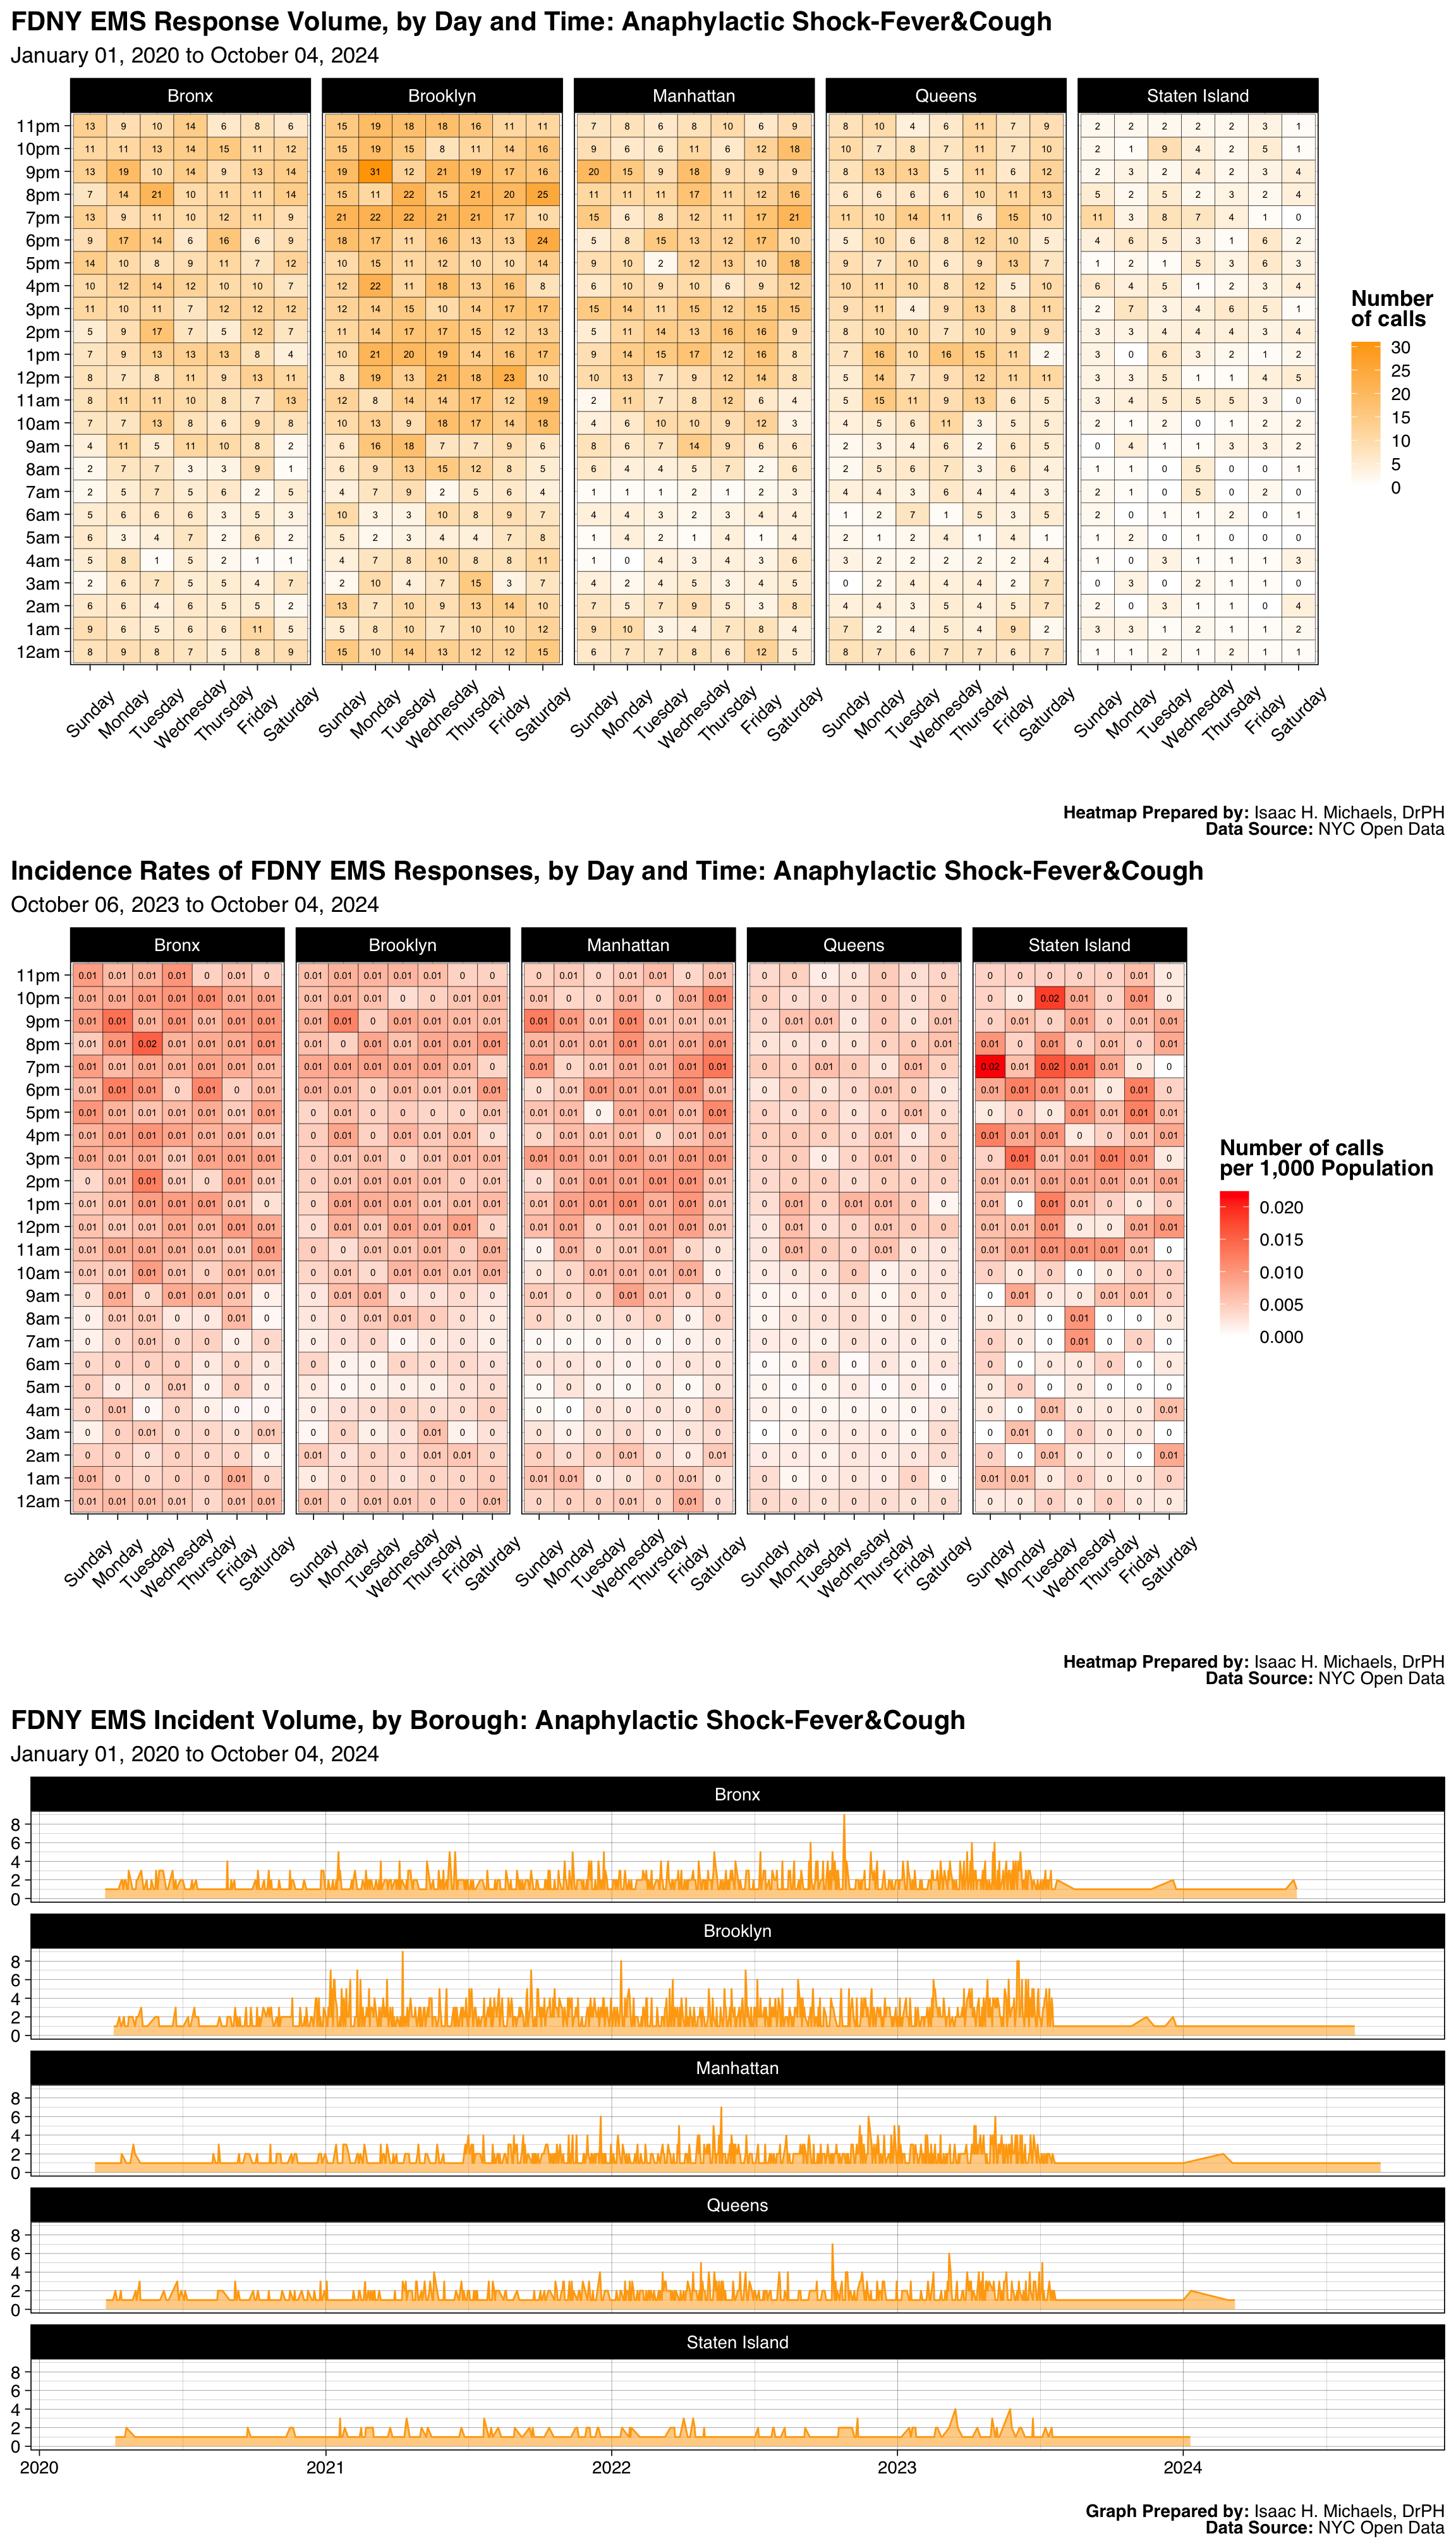
Graphs Prepared by: Isaac H. Michaels, DrPH
Data Source: NYC Open Data
| FDNY EMS Incident Volume, by Borough: Child Abuse |
||||||
| January 01, 2025 to July 01, 2026 | ||||||
| Borough |
Latest Year: 2026
|
All Years: 2025-2026
|
||||
|---|---|---|---|---|---|---|
| Incidents | % | Rate per 1,000 Population | Total Incidents | % | Monthly Trend | |
| Bronx | 40 | 27% | 0.0 | 143 | 30% | |
| Brooklyn | 40 | 27% | 0.0 | 122 | 26% | |
| Manhattan | 17 | 12% | 0.0 | 61 | 13% | |
| Queens | 45 | 31% | 0.0 | 119 | 25% | |
| Staten Island | 5 | 3% | 0.0 | 30 | 6% | |
| Table Prepred by: Isaac H. Michaels, DrPH | ||||||
| Data Source: NYC Open Data | ||||||
Table Prepared by: Isaac H. Michaels, DrPH
EMS Data Source: NYC Open Data
Population Data Source: Health Data NY
| FDNY EMS Incident Volume, by Severity Level: Child Abuse |
||||
| January 01, 2025 to July 01, 2026 | ||||
| Final Severity Level |
Latest Year: 2026
|
All Years: 2025-2026
|
||
|---|---|---|---|---|
| Incidents | % | Incidents | % | |
| 1 | 0 | 0% | 0 | 0% |
| 2 | 0 | 0% | 0 | 0% |
| 3 | 0 | 0% | 0 | 0% |
| 4 | 22 | 15% | 86 | 18% |
| 5 | 0 | 0% | 1 | 0% |
| 6 | 125 | 85% | 388 | 82% |
| 7 | 0 | 0% | 0 | 0% |
| 8 | 0 | 0% | 0 | 0% |
| Table Prepred by: Isaac H. Michaels, DrPH | ||||
| Data Source: NYC Open Data | ||||
Table Prepared by: Isaac H. Michaels, DrPH
Data Source: NYC Open Data
| FDNY EMS Incident Volume, by Disposition: Child Abuse |
||||
| January 01, 2025 to July 01, 2026 | ||||
| Disposition |
Latest Year: 2026
|
All Years: 2025-2026
|
||
|---|---|---|---|---|
| Incidents | % | Incidents | % | |
| Cancelled | 11 | 7% | 24 | 5% |
| Condition Corrected | 13 | 9% | 40 | 8% |
| Patient Gone on Arrival | 12 | 8% | 31 | 7% |
| Refused Medical Aid | 22 | 15% | 86 | 18% |
| Transporting Patient | 61 | 41% | 202 | 43% |
| Unfounded | 17 | 12% | 64 | 13% |
| NA | 11 | 7% | 28 | 6% |
| Table Prepred by: Isaac H. Michaels, DrPH | ||||
| Data Source: NYC Open Data | ||||
Table Prepared by: Isaac H. Michaels, DrPH
Data Source: NYC Open Data
Back to top
Baby Out Or Imminent Birth
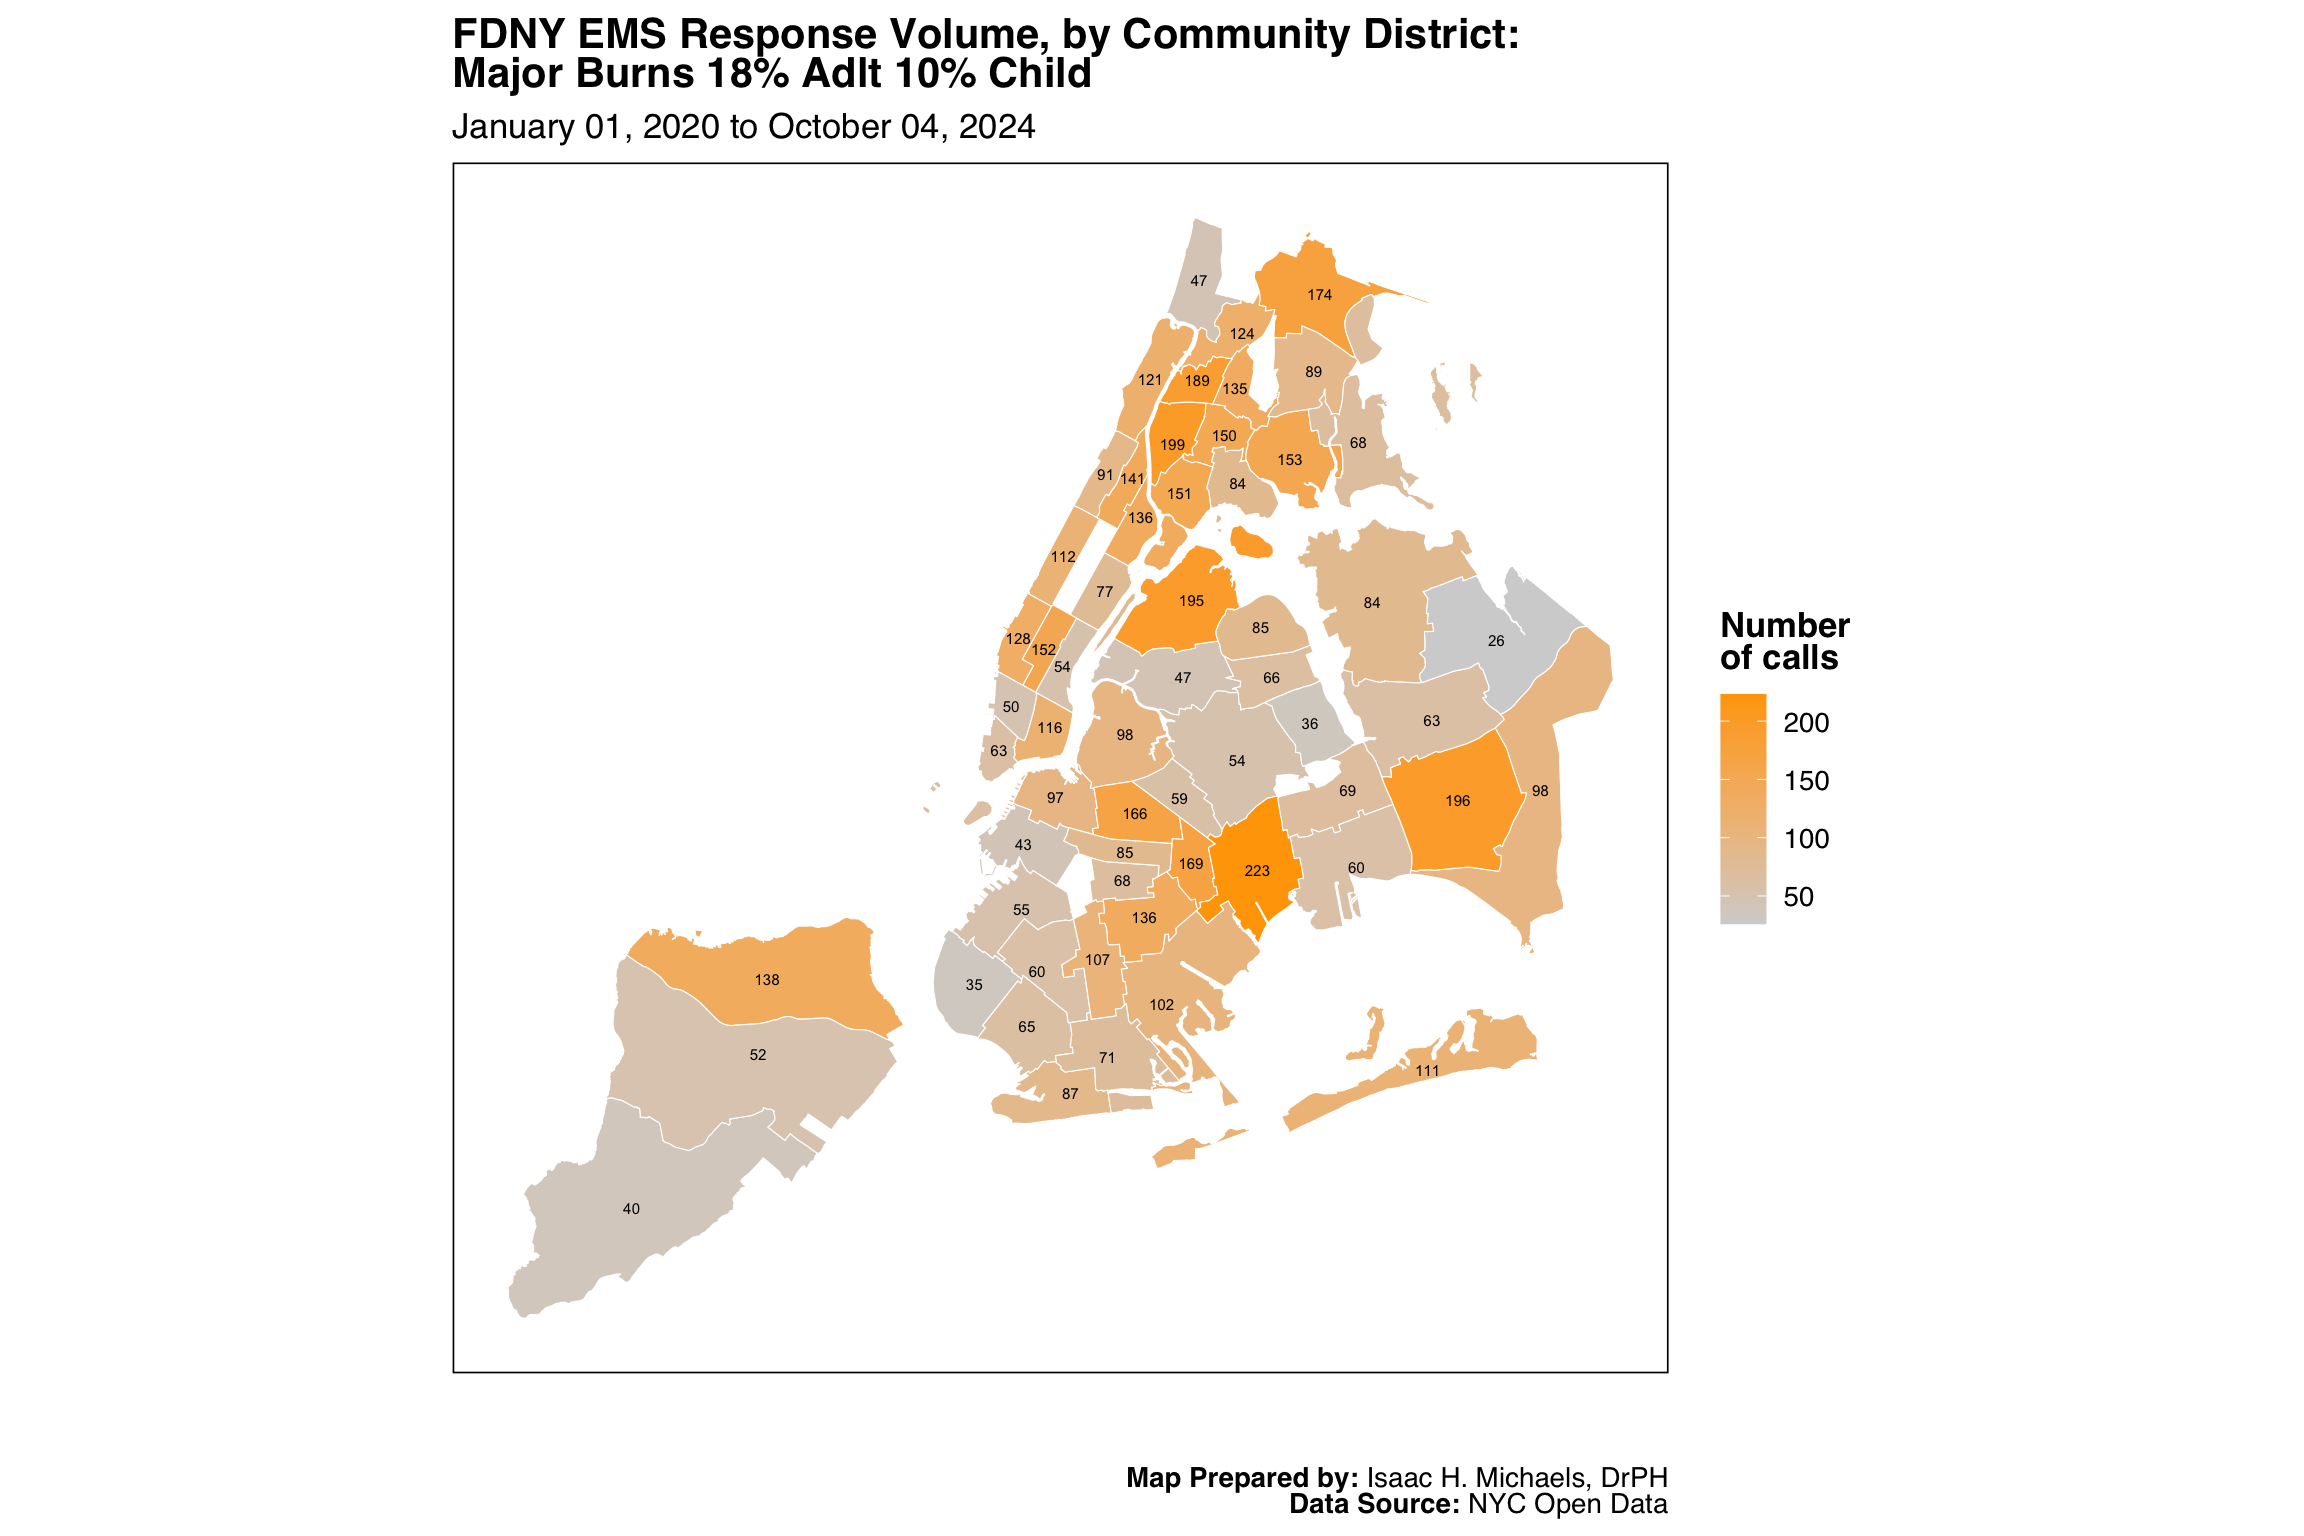
Map Prepared by: Isaac H. Michaels, DrPH
Data Source: NYC Open Data
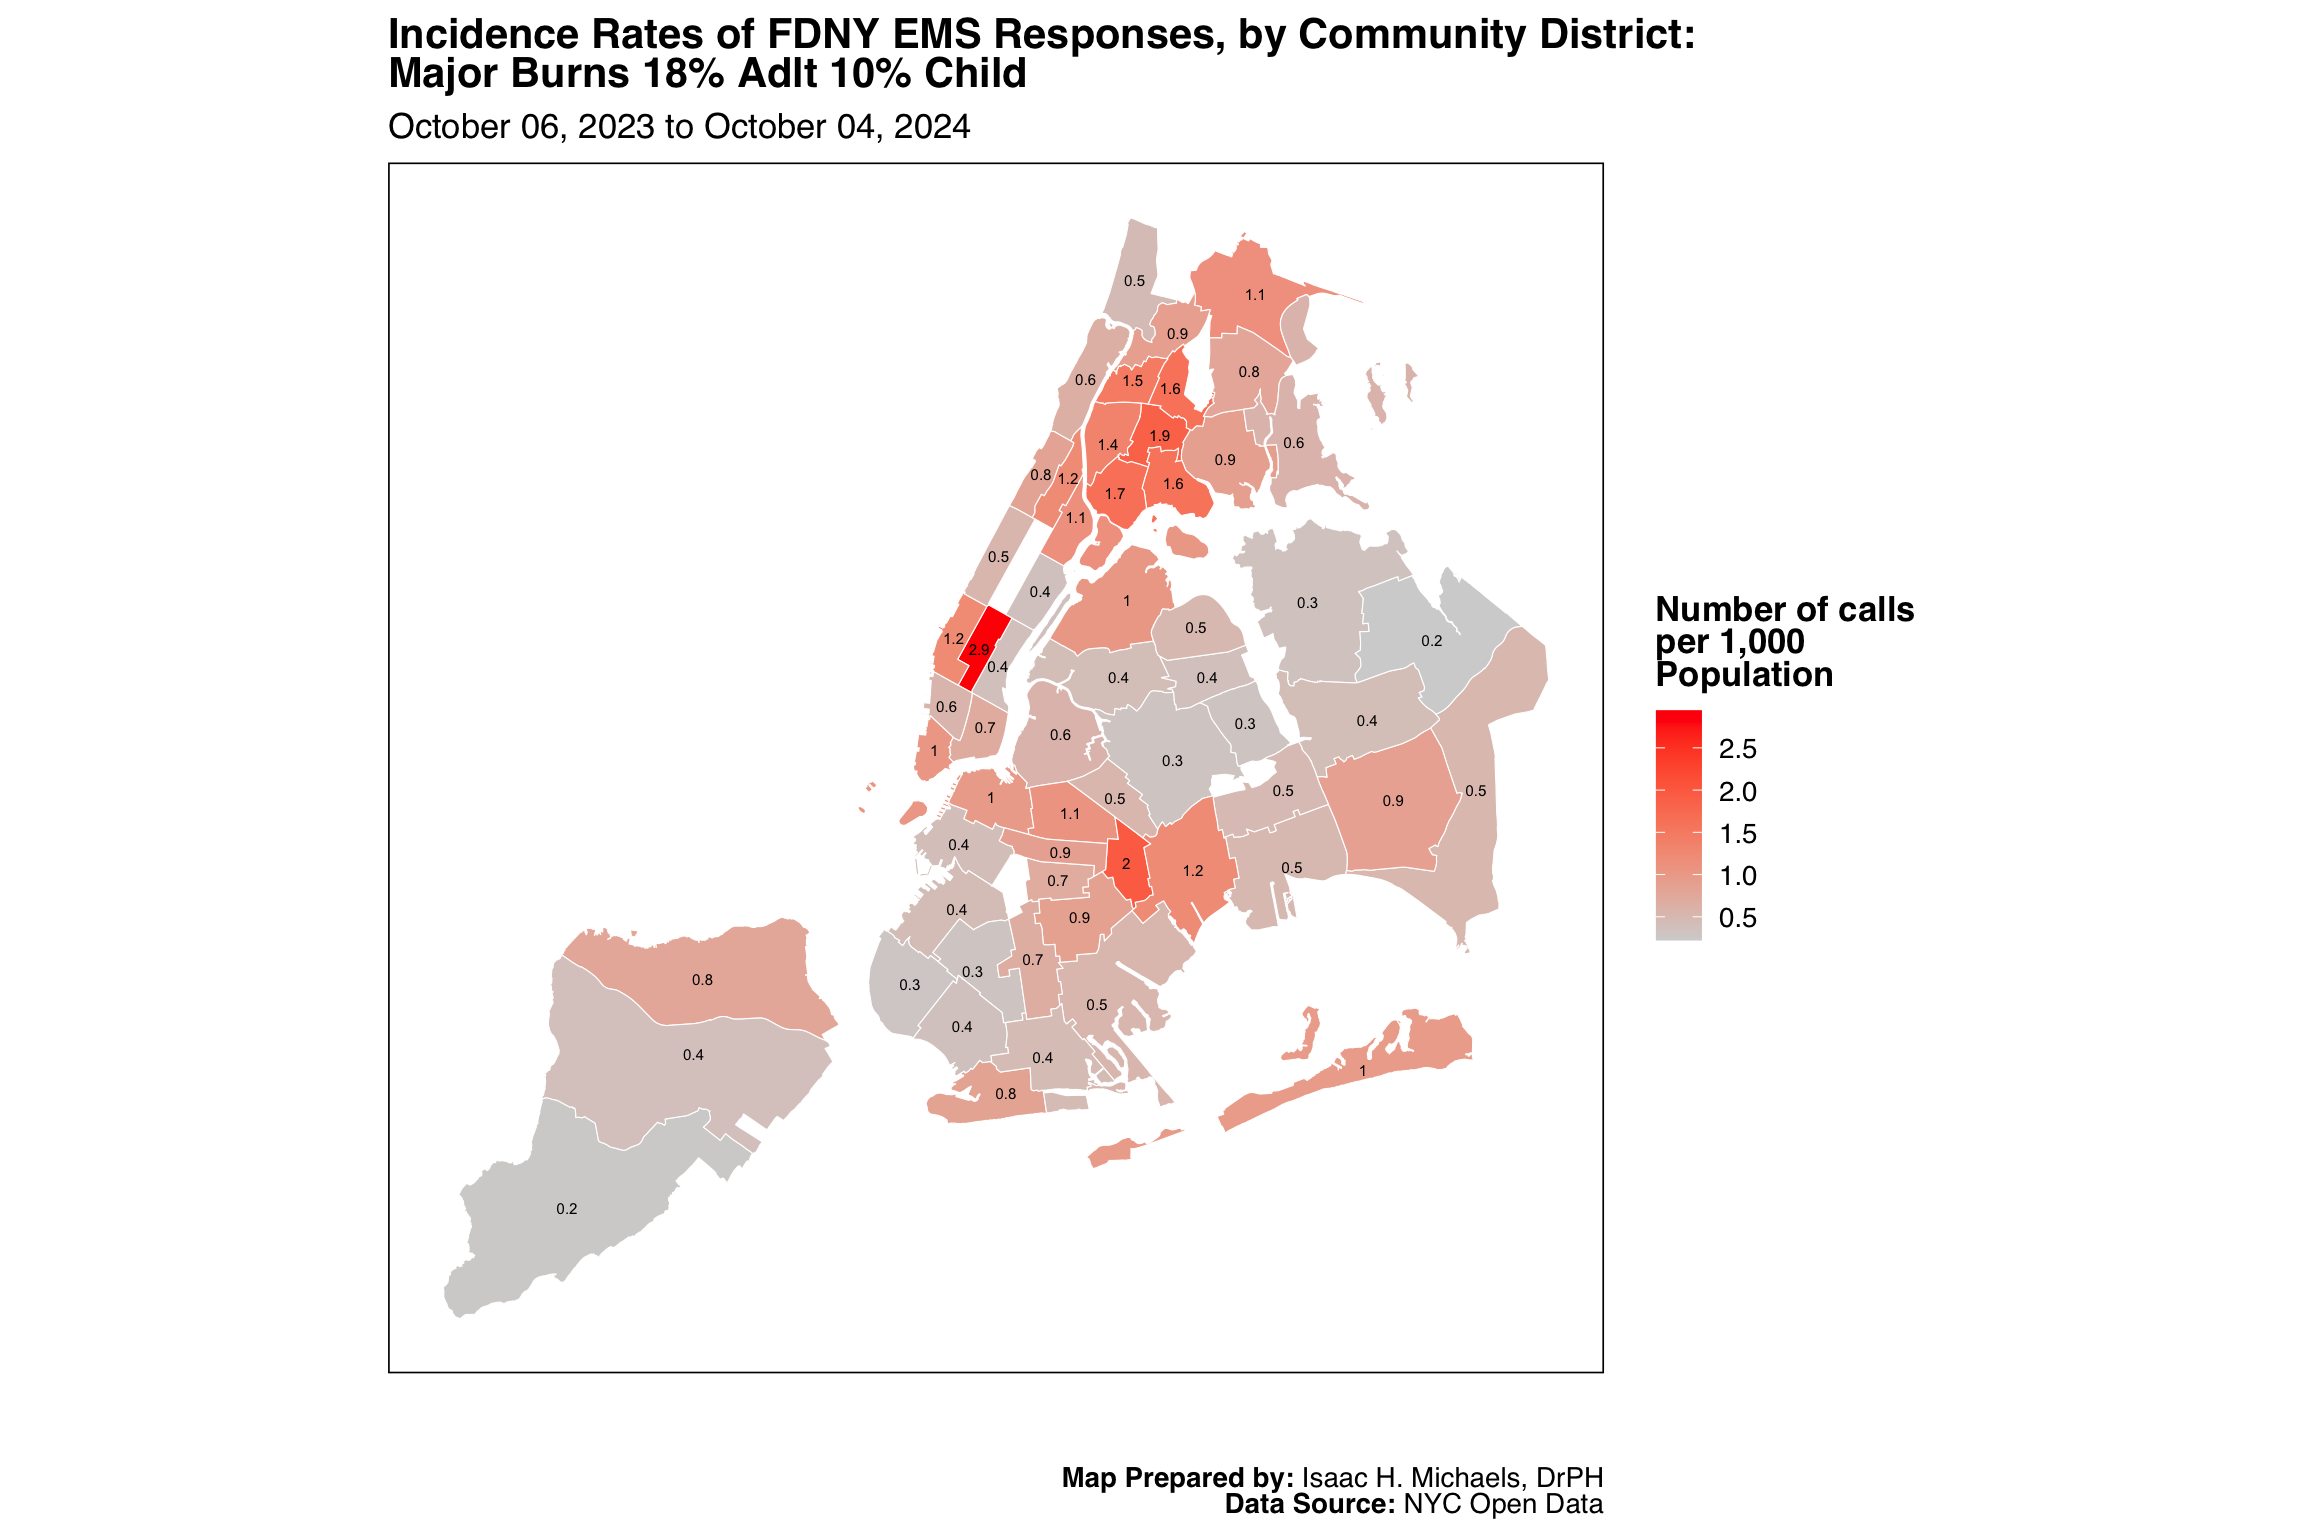
Map Prepared by: Isaac H. Michaels, DrPH
EMS Data Source: NYC Open Data
Population Data Source: NYC Open Data
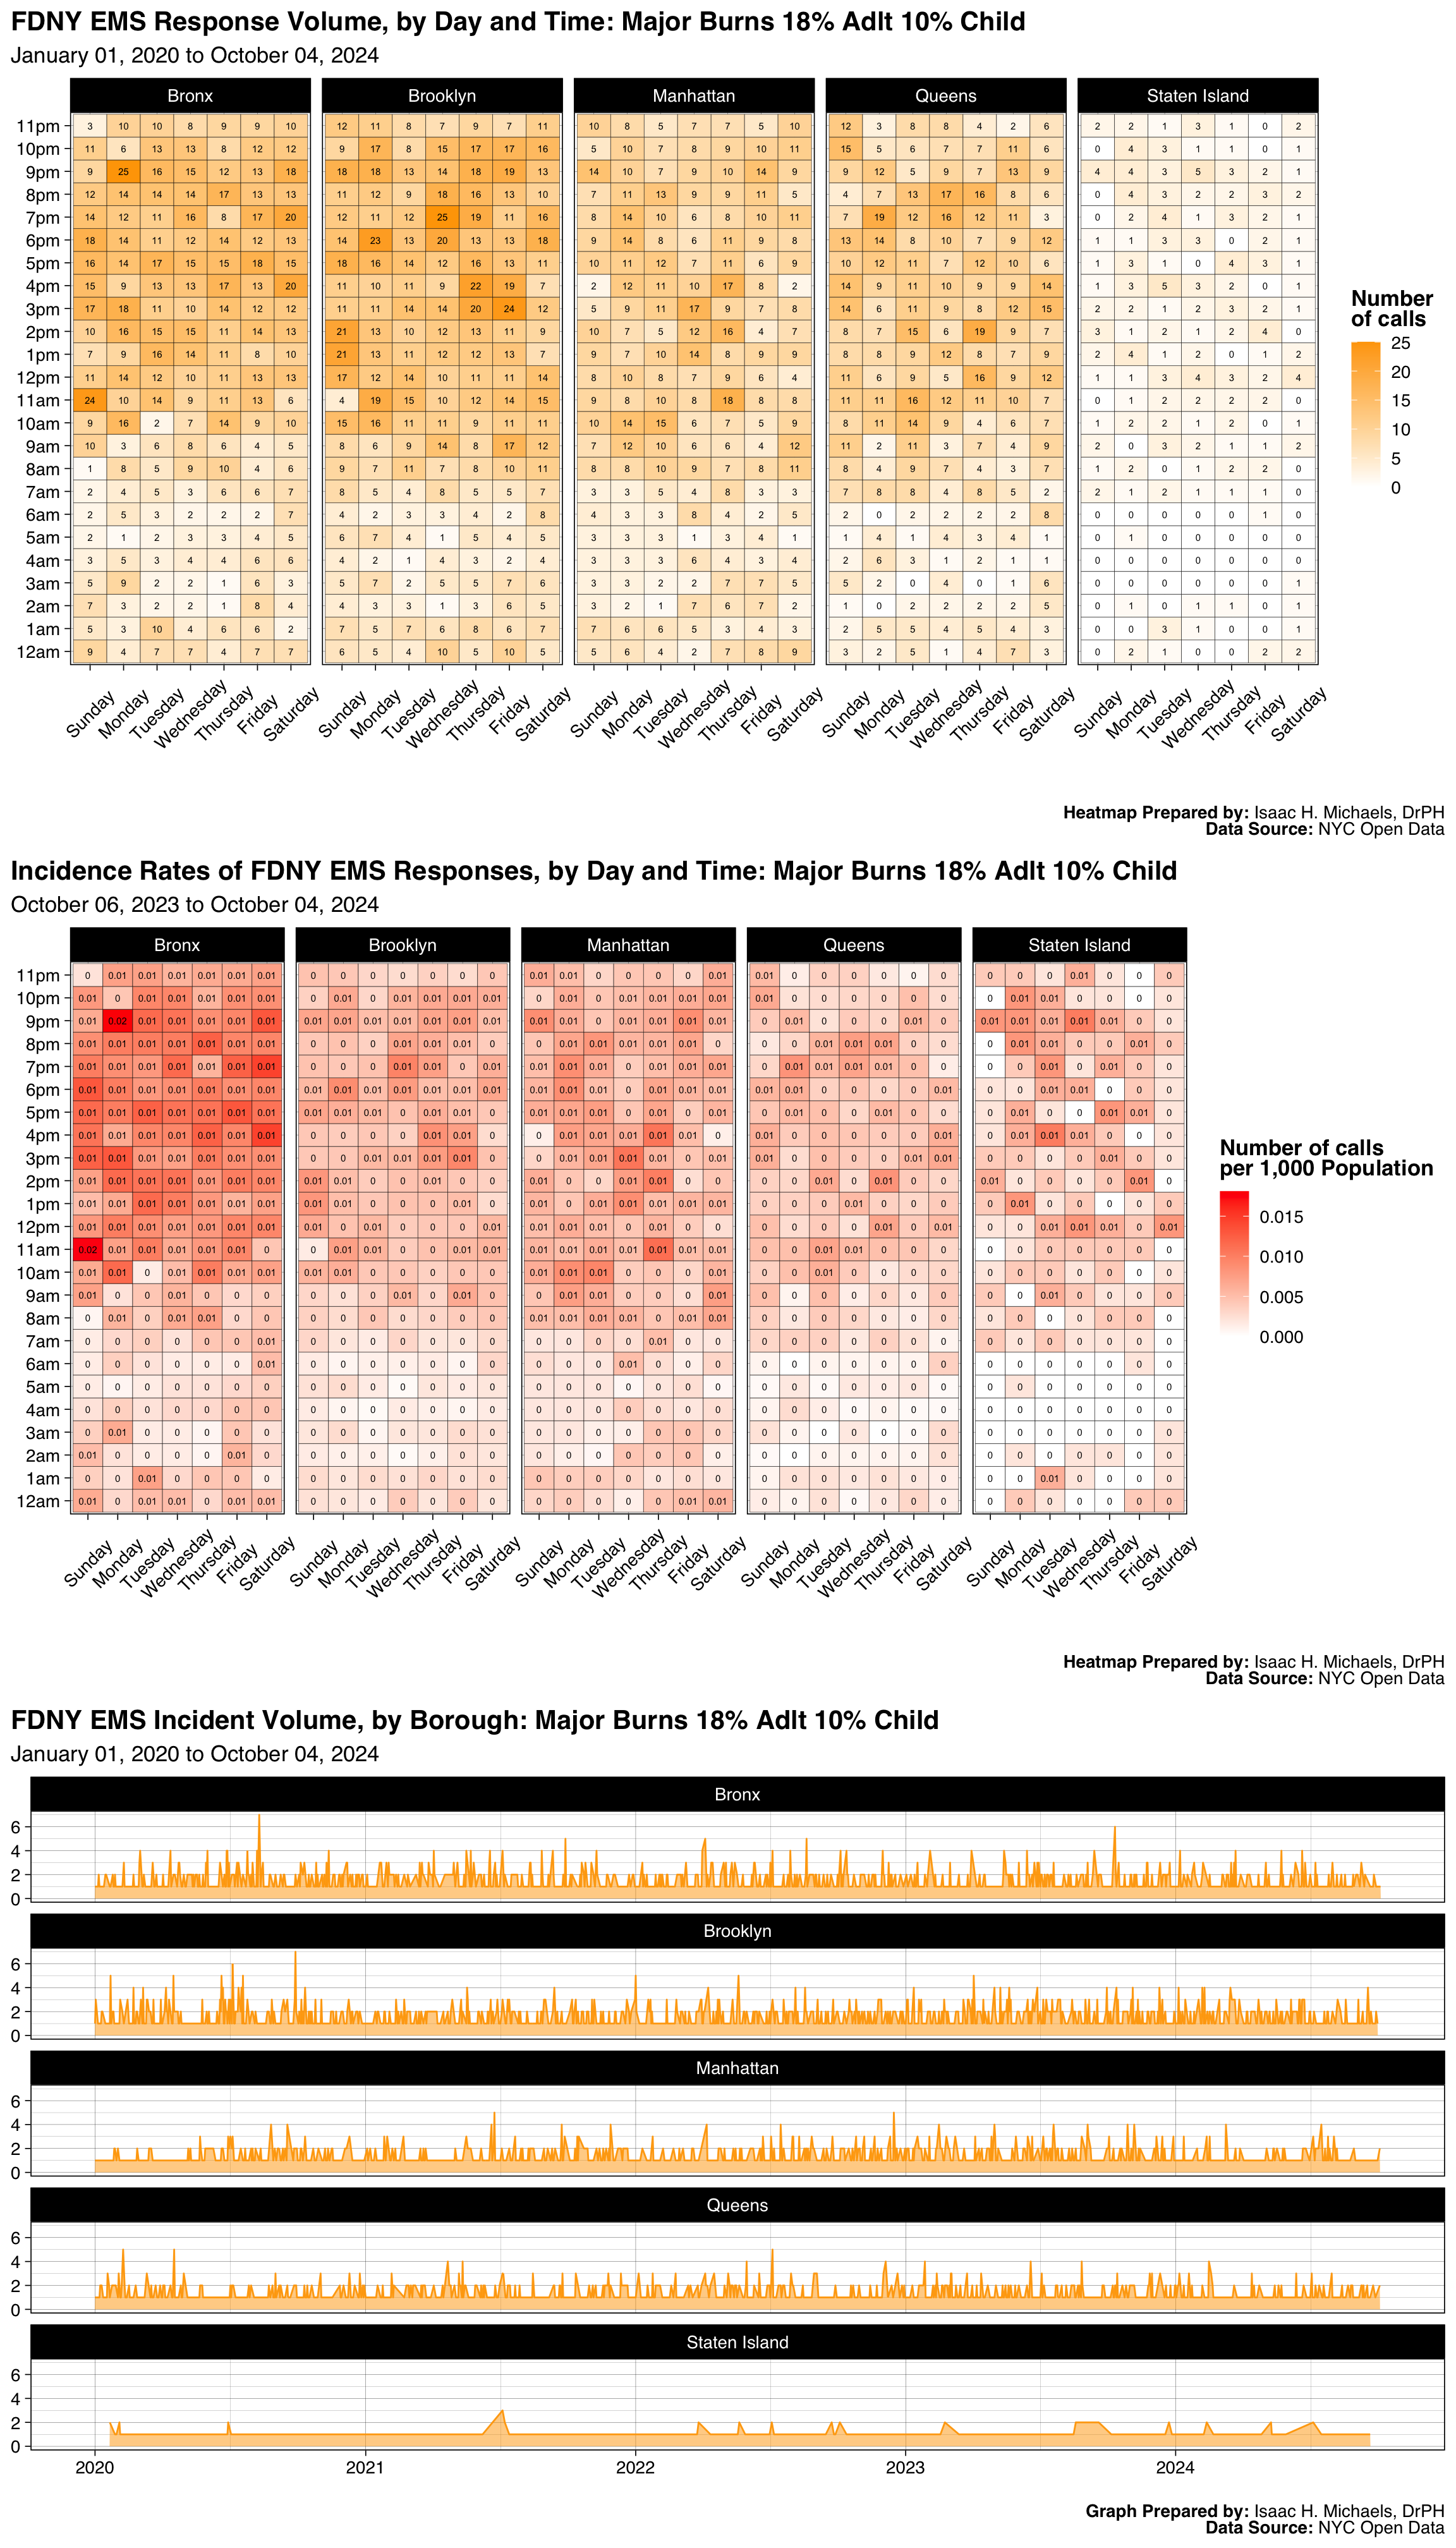
Graphs Prepared by: Isaac H. Michaels, DrPH
Data Source: NYC Open Data
| FDNY EMS Incident Volume, by Borough: Baby Out Or Imminent Birth |
||||||
| January 01, 2025 to July 01, 2026 | ||||||
| Borough |
Latest Year: 2026
|
All Years: 2025-2026
|
||||
|---|---|---|---|---|---|---|
| Incidents | % | Rate per 1,000 Population | Total Incidents | % | Monthly Trend | |
| Bronx | 50 | 31% | 0.0 | 147 | 31% | |
| Brooklyn | 55 | 34% | 0.0 | 143 | 30% | |
| Manhattan | 16 | 10% | 0.0 | 67 | 14% | |
| Queens | 35 | 22% | 0.0 | 97 | 21% | |
| Staten Island | 6 | 4% | 0.0 | 19 | 4% | |
| Table Prepred by: Isaac H. Michaels, DrPH | ||||||
| Data Source: NYC Open Data | ||||||
Table Prepared by: Isaac H. Michaels, DrPH
EMS Data Source: NYC Open Data
Population Data Source: Health Data NY
| FDNY EMS Incident Volume, by Severity Level: Baby Out Or Imminent Birth |
||||
| January 01, 2025 to July 01, 2026 | ||||
| Final Severity Level |
Latest Year: 2026
|
All Years: 2025-2026
|
||
|---|---|---|---|---|
| Incidents | % | Incidents | % | |
| 1 | 0 | 0% | 0 | 0% |
| 2 | 0 | 0% | 0 | 0% |
| 3 | 160 | 99% | 470 | 99% |
| 4 | 2 | 1% | 3 | 1% |
| 5 | 0 | 0% | 0 | 0% |
| 6 | 0 | 0% | 0 | 0% |
| 7 | 0 | 0% | 0 | 0% |
| 8 | 0 | 0% | 0 | 0% |
| Table Prepred by: Isaac H. Michaels, DrPH | ||||
| Data Source: NYC Open Data | ||||
Table Prepared by: Isaac H. Michaels, DrPH
Data Source: NYC Open Data
| FDNY EMS Incident Volume, by Disposition: Baby Out Or Imminent Birth |
||||
| January 01, 2025 to July 01, 2026 | ||||
| Disposition |
Latest Year: 2026
|
All Years: 2025-2026
|
||
|---|---|---|---|---|
| Incidents | % | Incidents | % | |
| Cancelled | 1 | 1% | 4 | 1% |
| Condition Corrected | 1 | 1% | 1 | 0% |
| Patient Gone on Arrival | 3 | 2% | 4 | 1% |
| Refused Medical Aid | 3 | 2% | 5 | 1% |
| Transporting Patient | 147 | 91% | 445 | 94% |
| Unfounded | 7 | 4% | 13 | 3% |
| Table Prepred by: Isaac H. Michaels, DrPH | ||||
| Data Source: NYC Open Data | ||||
Table Prepared by: Isaac H. Michaels, DrPH
Data Source: NYC Open Data
Back to top
Amputation, Fingers Or Toes
Map Prepared by: Isaac H. Michaels, DrPH
Data Source: NYC Open Data
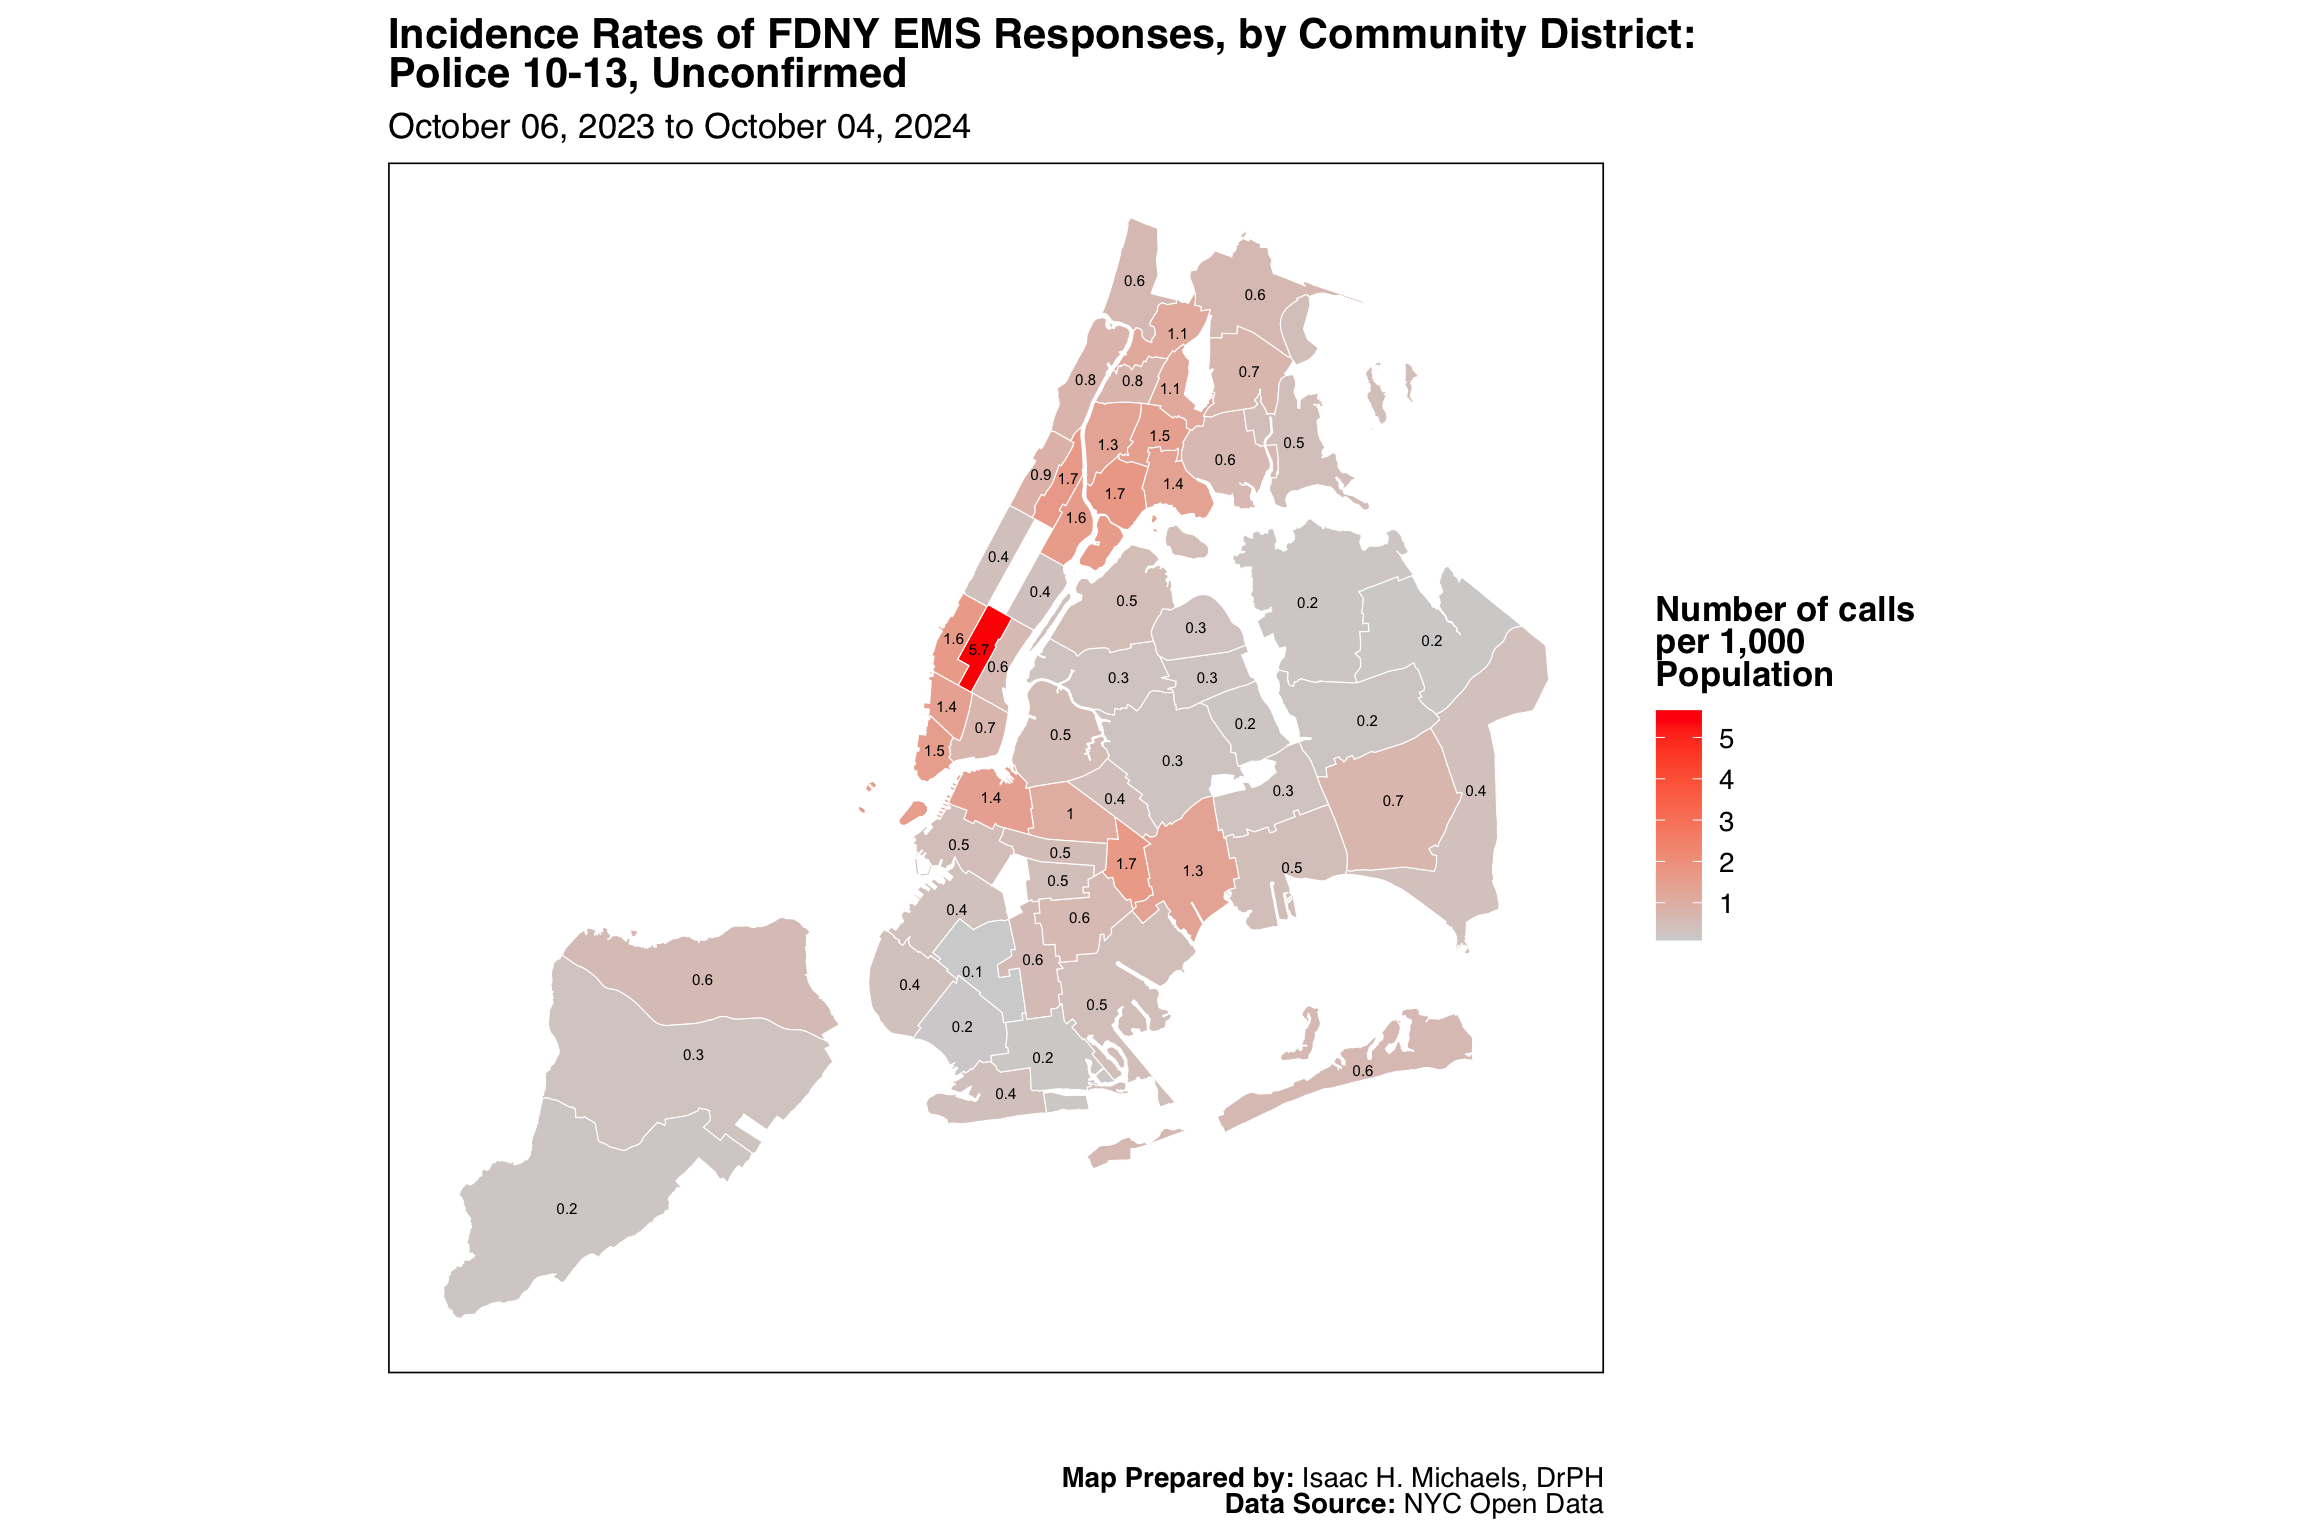
Map Prepared by: Isaac H. Michaels, DrPH
EMS Data Source: NYC Open Data
Population Data Source: NYC Open Data
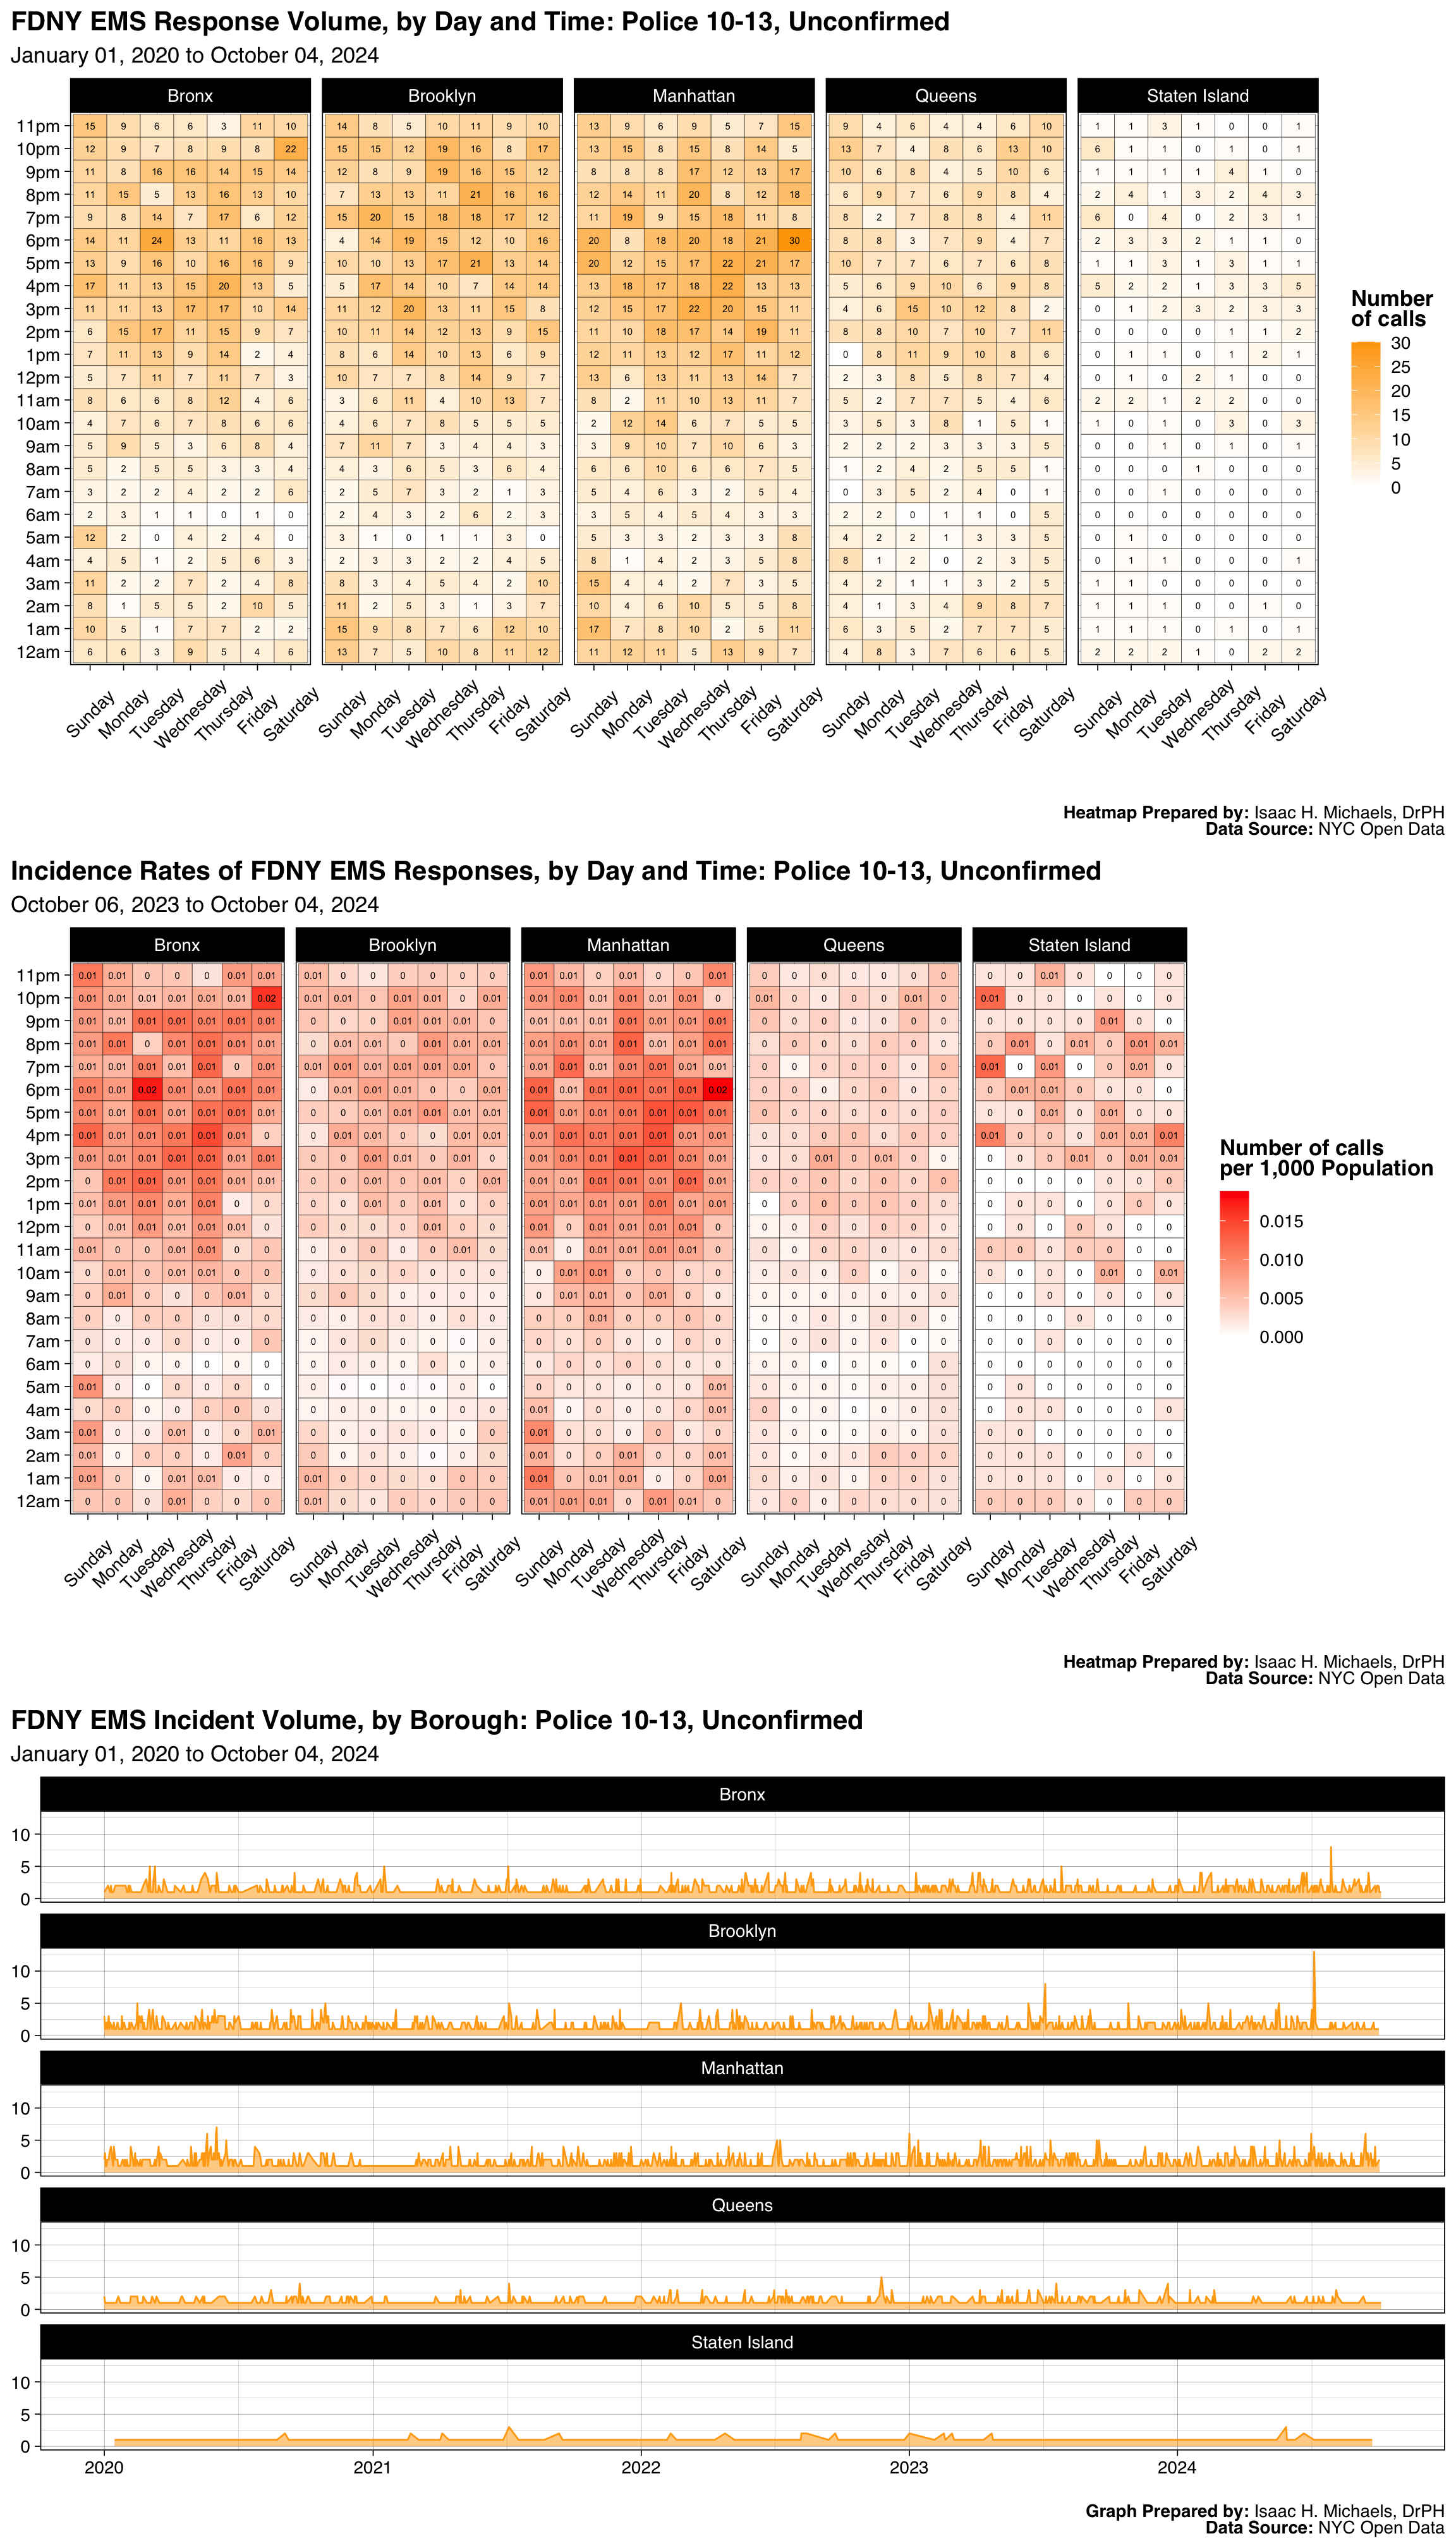
Graphs Prepared by: Isaac H. Michaels, DrPH
Data Source: NYC Open Data
| FDNY EMS Incident Volume, by Borough: Amputation, Fingers Or Toes |
||||||
| January 01, 2025 to July 01, 2026 | ||||||
| Borough |
Latest Year: 2026
|
All Years: 2025-2026
|
||||
|---|---|---|---|---|---|---|
| Incidents | % | Rate per 1,000 Population | Total Incidents | % | Monthly Trend | |
| Bronx | 12 | 16% | 0.0 | 39 | 17% | |
| Brooklyn | 19 | 25% | 0.0 | 58 | 25% | |
| Manhattan | 25 | 33% | 0.0 | 69 | 30% | |
| Queens | 15 | 20% | 0.0 | 49 | 21% | |
| Staten Island | 4 | 5% | 0.0 | 18 | 8% | |
| Table Prepred by: Isaac H. Michaels, DrPH | ||||||
| Data Source: NYC Open Data | ||||||
Table Prepared by: Isaac H. Michaels, DrPH
EMS Data Source: NYC Open Data
Population Data Source: Health Data NY
| FDNY EMS Incident Volume, by Severity Level: Amputation, Fingers Or Toes |
||||
| January 01, 2025 to July 01, 2026 | ||||
| Final Severity Level |
Latest Year: 2026
|
All Years: 2025-2026
|
||
|---|---|---|---|---|
| Incidents | % | Incidents | % | |
| 1 | 0 | 0% | 0 | 0% |
| 2 | 0 | 0% | 0 | 0% |
| 3 | 1 | 1% | 1 | 0% |
| 4 | 74 | 99% | 232 | 100% |
| 5 | 0 | 0% | 0 | 0% |
| 6 | 0 | 0% | 0 | 0% |
| 7 | 0 | 0% | 0 | 0% |
| 8 | 0 | 0% | 0 | 0% |
| Table Prepred by: Isaac H. Michaels, DrPH | ||||
| Data Source: NYC Open Data | ||||
Table Prepared by: Isaac H. Michaels, DrPH
Data Source: NYC Open Data
| FDNY EMS Incident Volume, by Disposition: Amputation, Fingers Or Toes |
||||
| January 01, 2025 to July 01, 2026 | ||||
| Disposition |
Latest Year: 2026
|
All Years: 2025-2026
|
||
|---|---|---|---|---|
| Incidents | % | Incidents | % | |
| Cancelled | 1 | 1% | 5 | 2% |
| Patient Gone on Arrival | 3 | 4% | 12 | 5% |
| Refused Medical Aid | 5 | 7% | 9 | 4% |
| Transporting Patient | 61 | 81% | 196 | 84% |
| Unfounded | 3 | 4% | 8 | 3% |
| NA | 2 | 3% | 3 | 1% |
| Table Prepred by: Isaac H. Michaels, DrPH | ||||
| Data Source: NYC Open Data | ||||
Table Prepared by: Isaac H. Michaels, DrPH
Data Source: NYC Open Data
Back to top
Two Alarm Fire
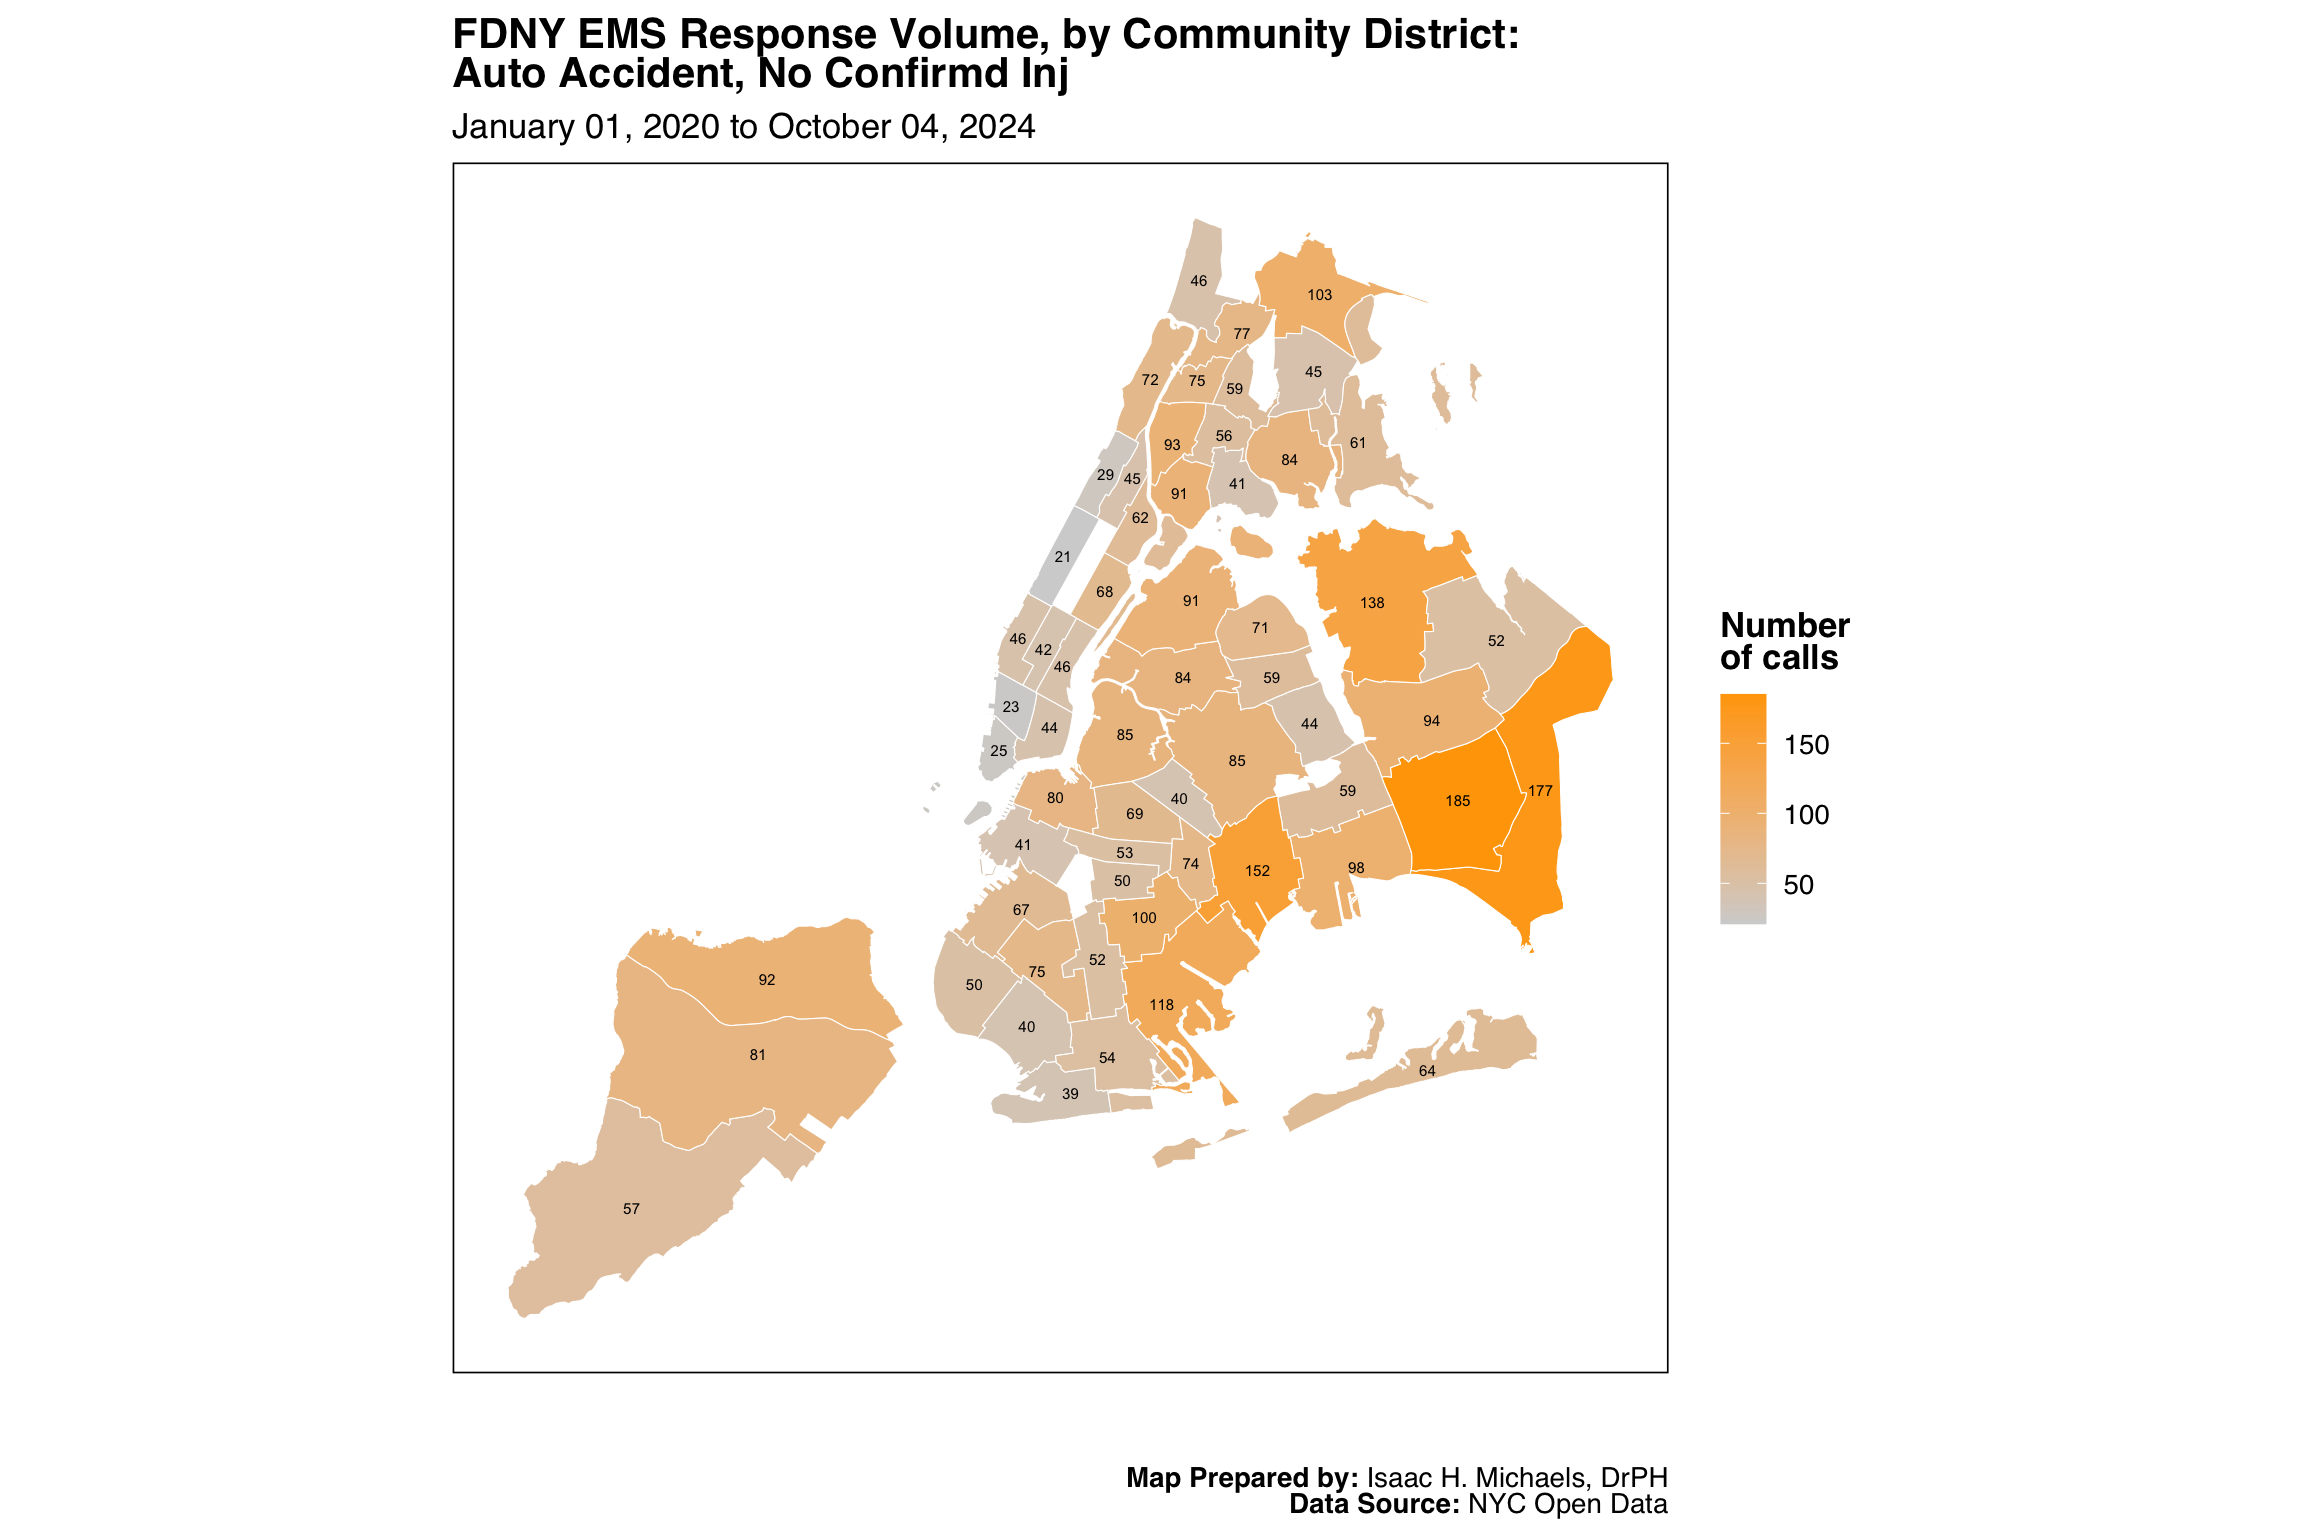
Map Prepared by: Isaac H. Michaels, DrPH
Data Source: NYC Open Data
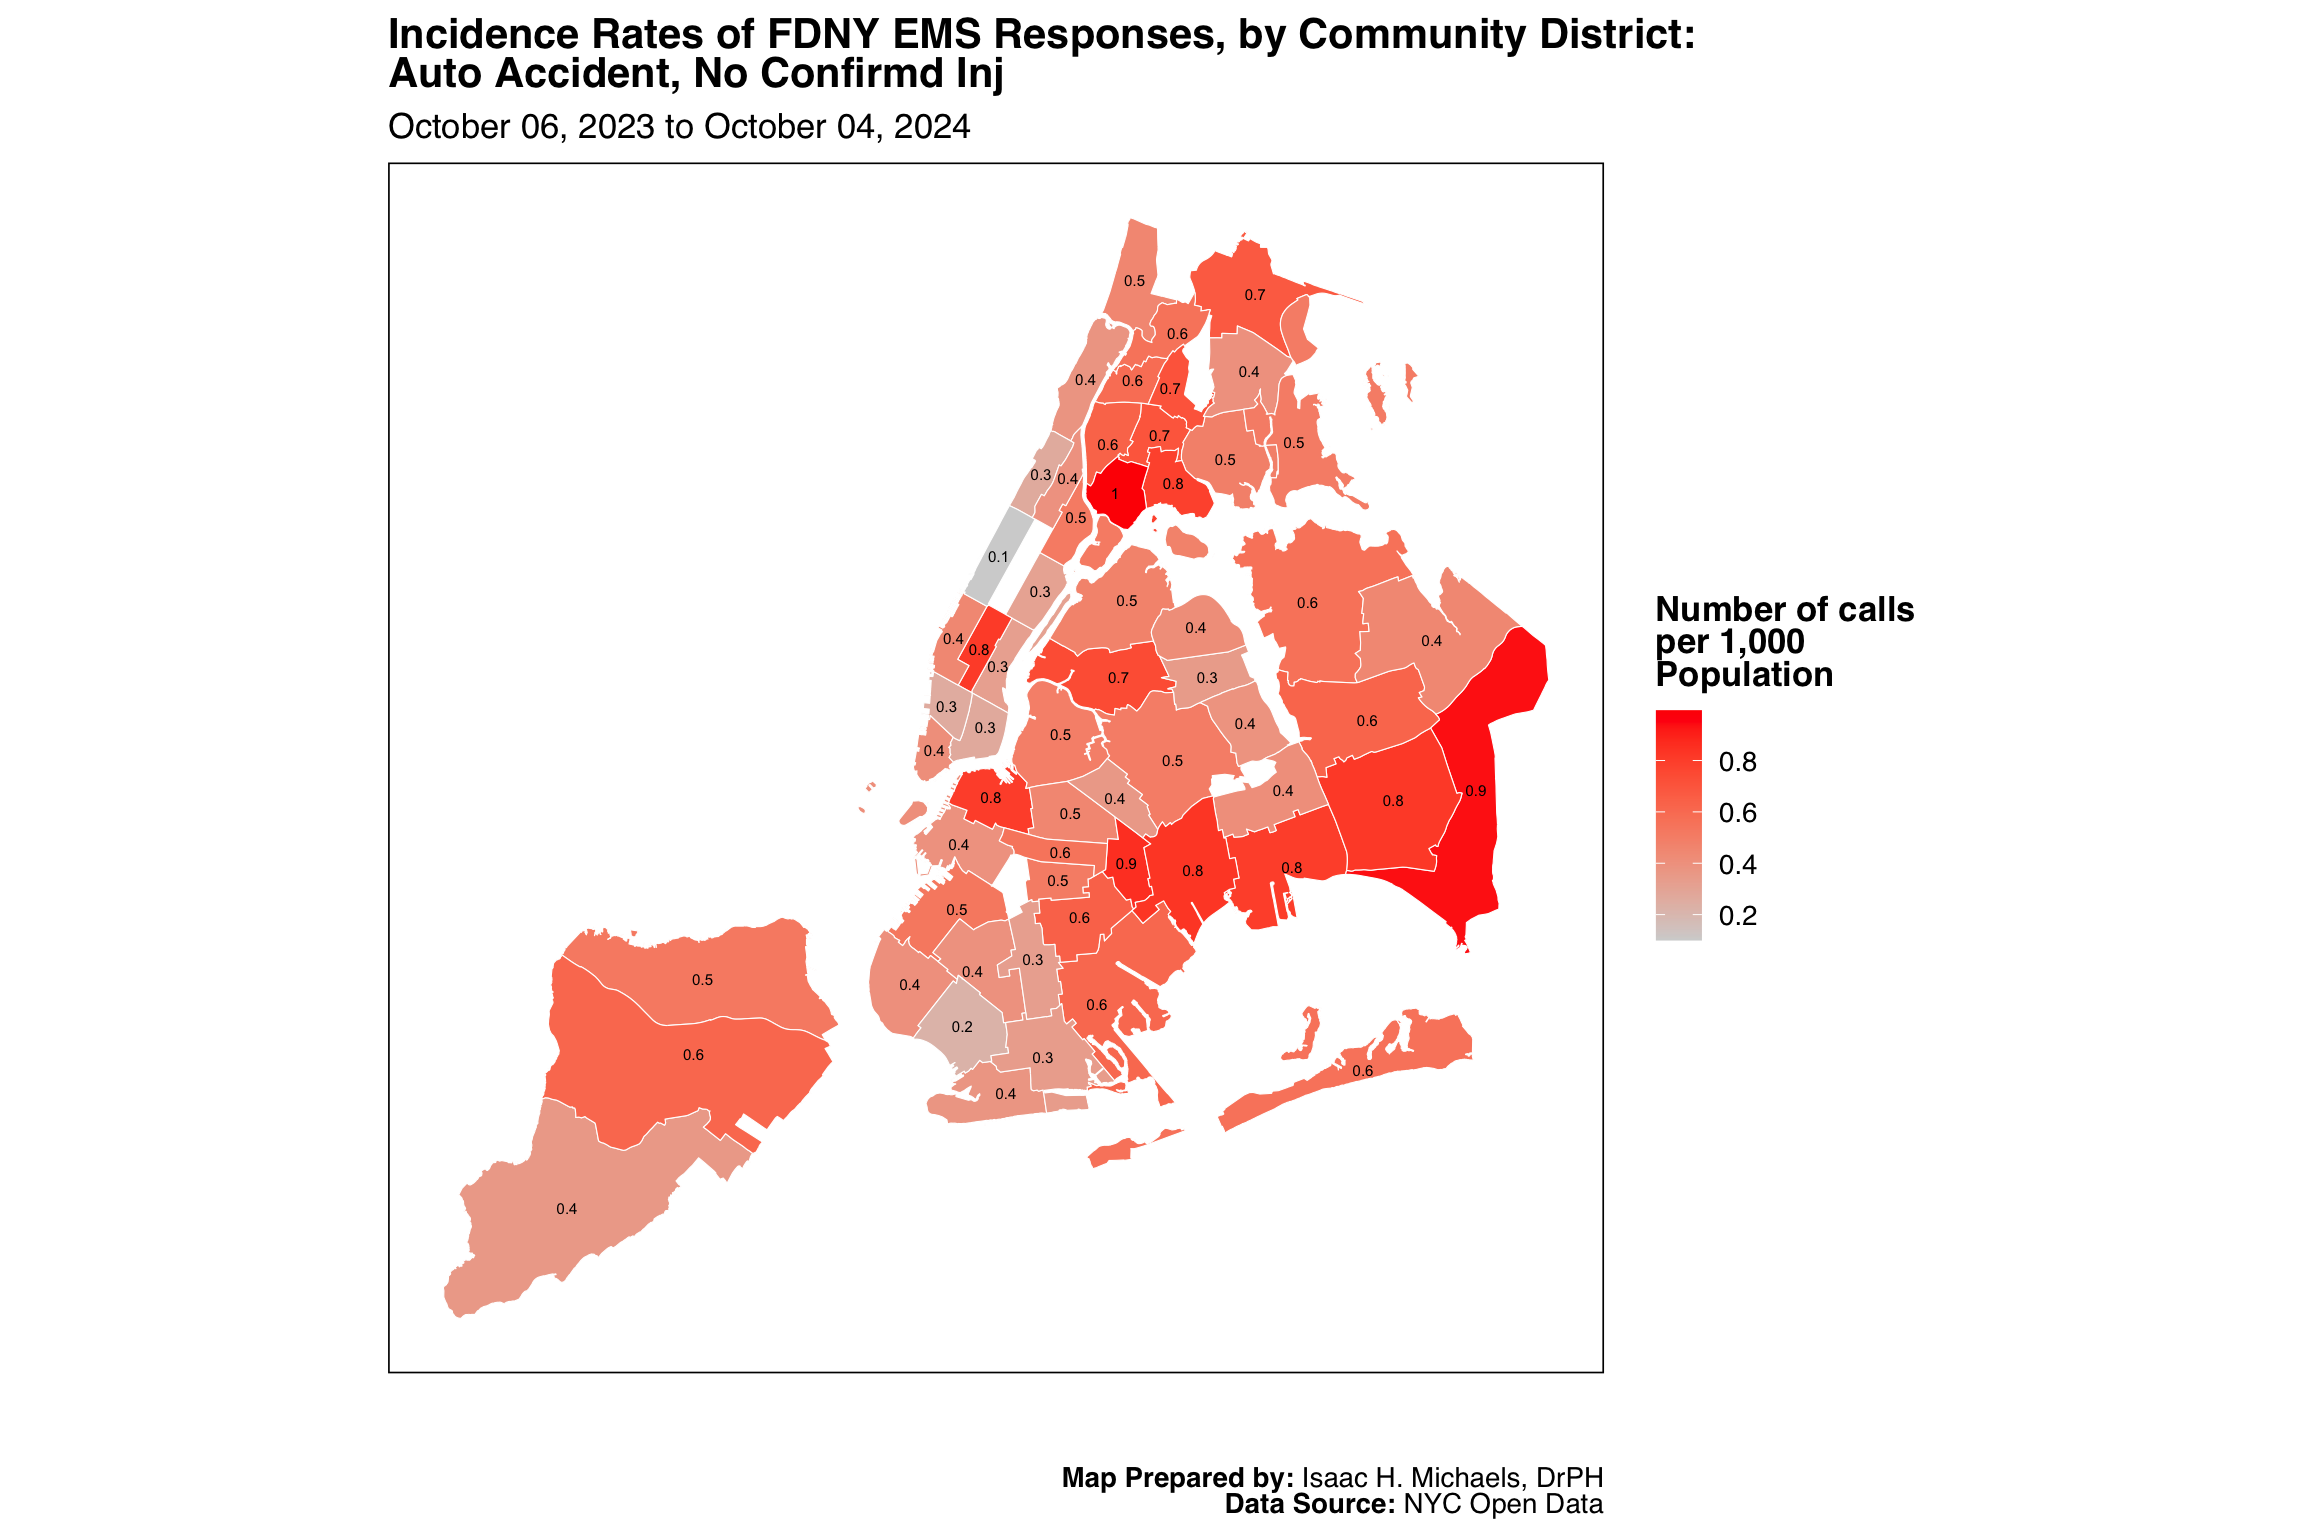
Map Prepared by: Isaac H. Michaels, DrPH
EMS Data Source: NYC Open Data
Population Data Source: NYC Open Data
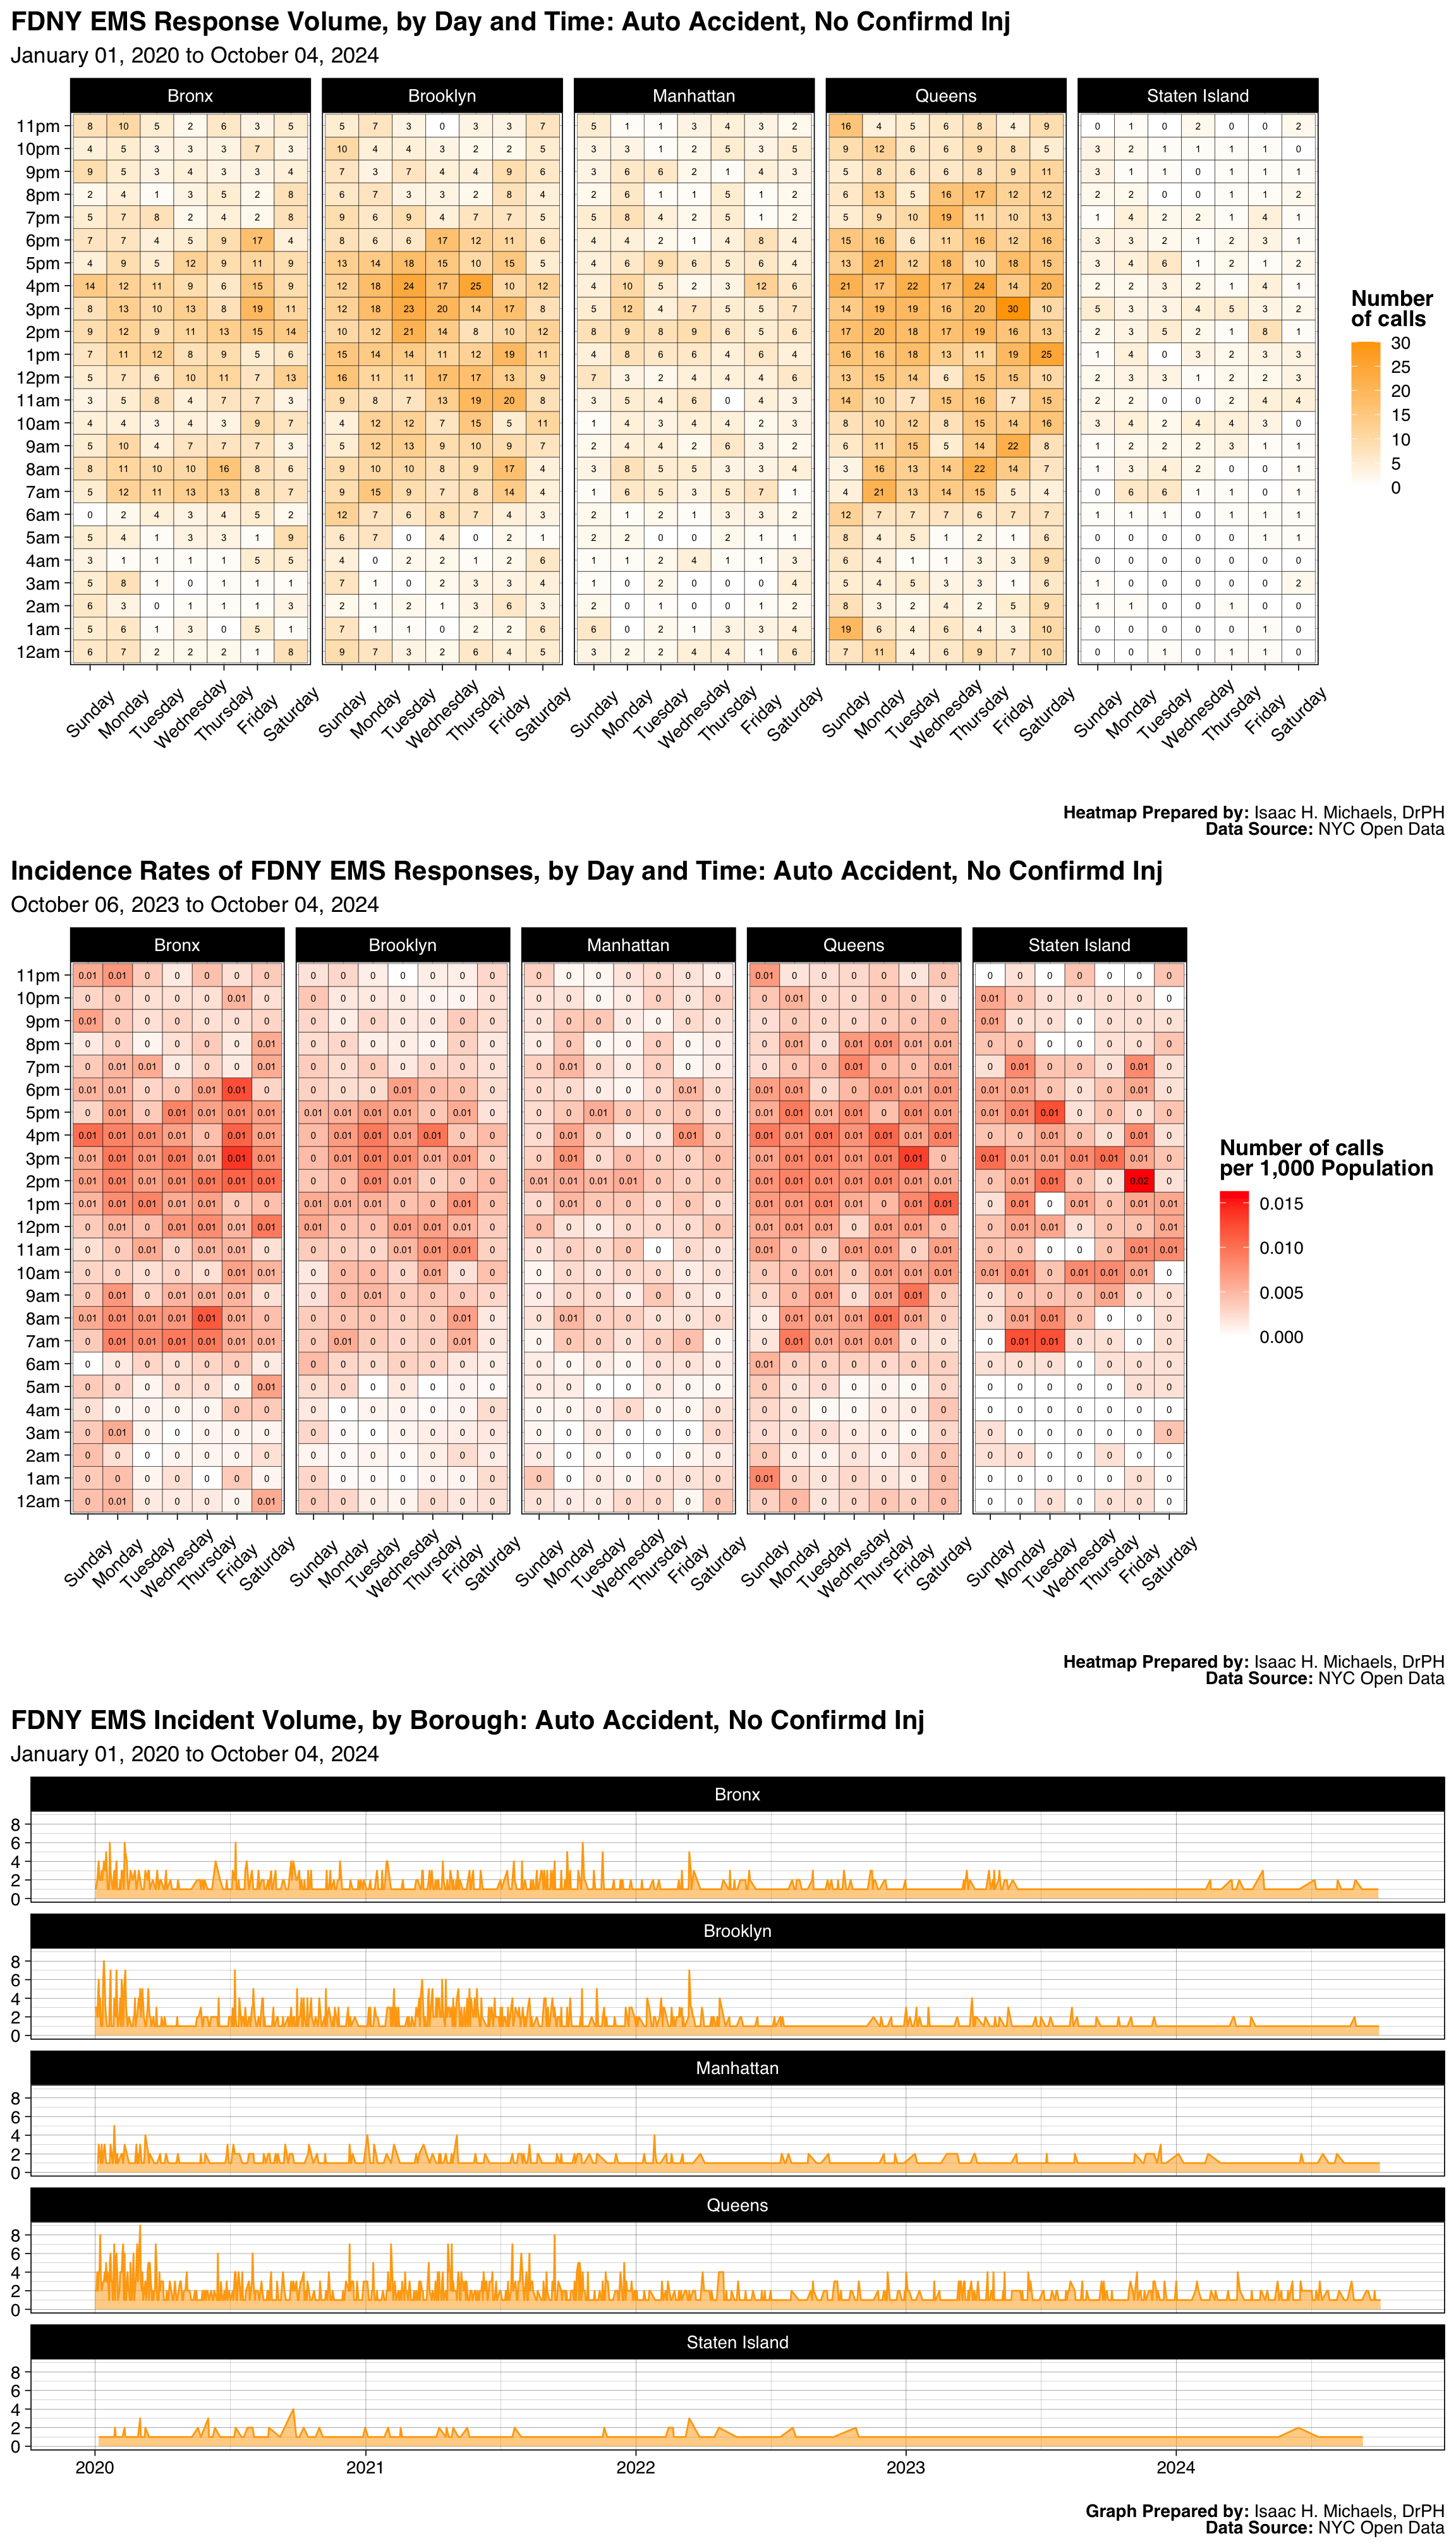
Graphs Prepared by: Isaac H. Michaels, DrPH
Data Source: NYC Open Data
| FDNY EMS Incident Volume, by Borough: Two Alarm Fire |
||||||
| January 01, 2025 to July 01, 2026 | ||||||
| Borough |
Latest Year: 2026
|
All Years: 2025-2026
|
||||
|---|---|---|---|---|---|---|
| Incidents | % | Rate per 1,000 Population | Total Incidents | % | Monthly Trend | |
| Bronx | 20 | 23% | 0.0 | 51 | 23% | |
| Brooklyn | 28 | 32% | 0.0 | 71 | 32% | |
| Manhattan | 8 | 9% | 0.0 | 25 | 11% | |
| Queens | 25 | 28% | 0.0 | 58 | 26% | |
| Staten Island | 7 | 8% | 0.0 | 15 | 7% | |
| Table Prepred by: Isaac H. Michaels, DrPH | ||||||
| Data Source: NYC Open Data | ||||||
Table Prepared by: Isaac H. Michaels, DrPH
EMS Data Source: NYC Open Data
Population Data Source: Health Data NY
| FDNY EMS Incident Volume, by Severity Level: Two Alarm Fire |
||||
| January 01, 2025 to July 01, 2026 | ||||
| Final Severity Level |
Latest Year: 2026
|
All Years: 2025-2026
|
||
|---|---|---|---|---|
| Incidents | % | Incidents | % | |
| 1 | 0 | 0% | 0 | 0% |
| 2 | 88 | 100% | 220 | 100% |
| 3 | 0 | 0% | 0 | 0% |
| 4 | 0 | 0% | 0 | 0% |
| 5 | 0 | 0% | 0 | 0% |
| 6 | 0 | 0% | 0 | 0% |
| 7 | 0 | 0% | 0 | 0% |
| 8 | 0 | 0% | 0 | 0% |
| Table Prepred by: Isaac H. Michaels, DrPH | ||||
| Data Source: NYC Open Data | ||||
Table Prepared by: Isaac H. Michaels, DrPH
Data Source: NYC Open Data
| FDNY EMS Incident Volume, by Disposition: Two Alarm Fire |
||||
| January 01, 2025 to July 01, 2026 | ||||
| Disposition |
Latest Year: 2026
|
All Years: 2025-2026
|
||
|---|---|---|---|---|
| Incidents | % | Incidents | % | |
| Cancelled | 27 | 31% | 61 | 28% |
| Condition Corrected | 5 | 6% | 11 | 5% |
| Transporting Patient | 55 | 62% | 142 | 65% |
| Unfounded | 1 | 1% | 3 | 1% |
| Table Prepred by: Isaac H. Michaels, DrPH | ||||
| Data Source: NYC Open Data | ||||
Table Prepared by: Isaac H. Michaels, DrPH
Data Source: NYC Open Data
Back to top
Amputation, Arm, Hand,Leg,Foot
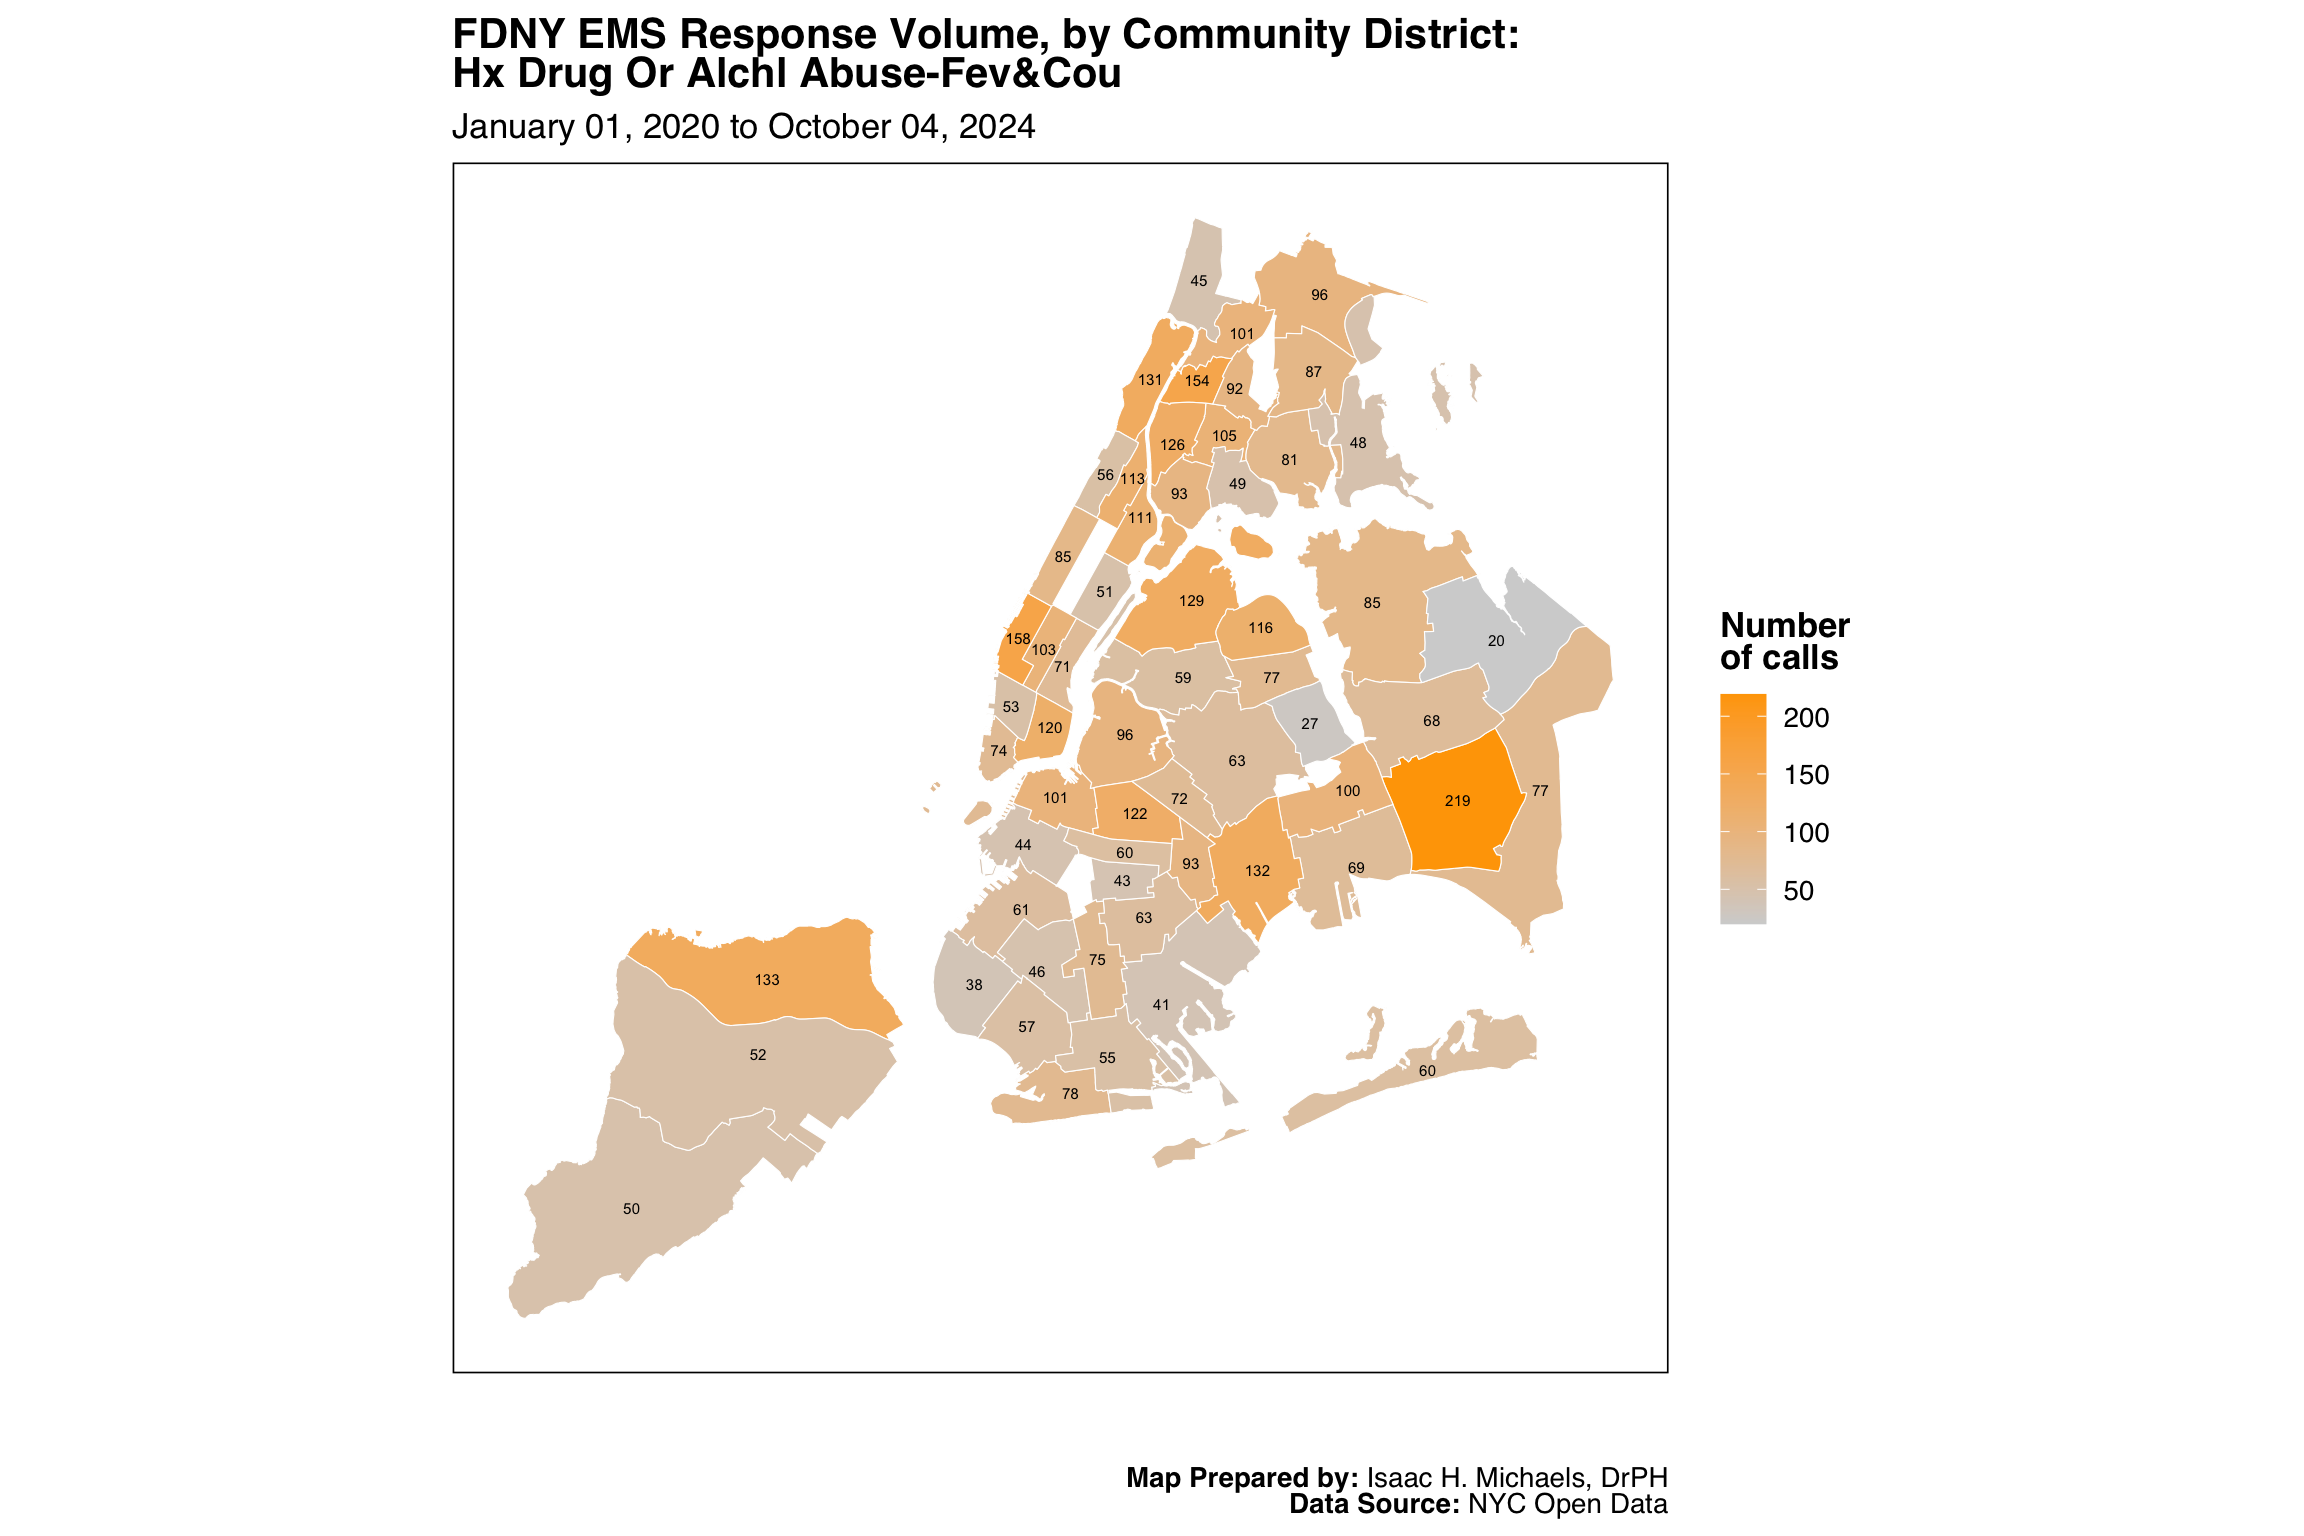
Map Prepared by: Isaac H. Michaels, DrPH
Data Source: NYC Open Data
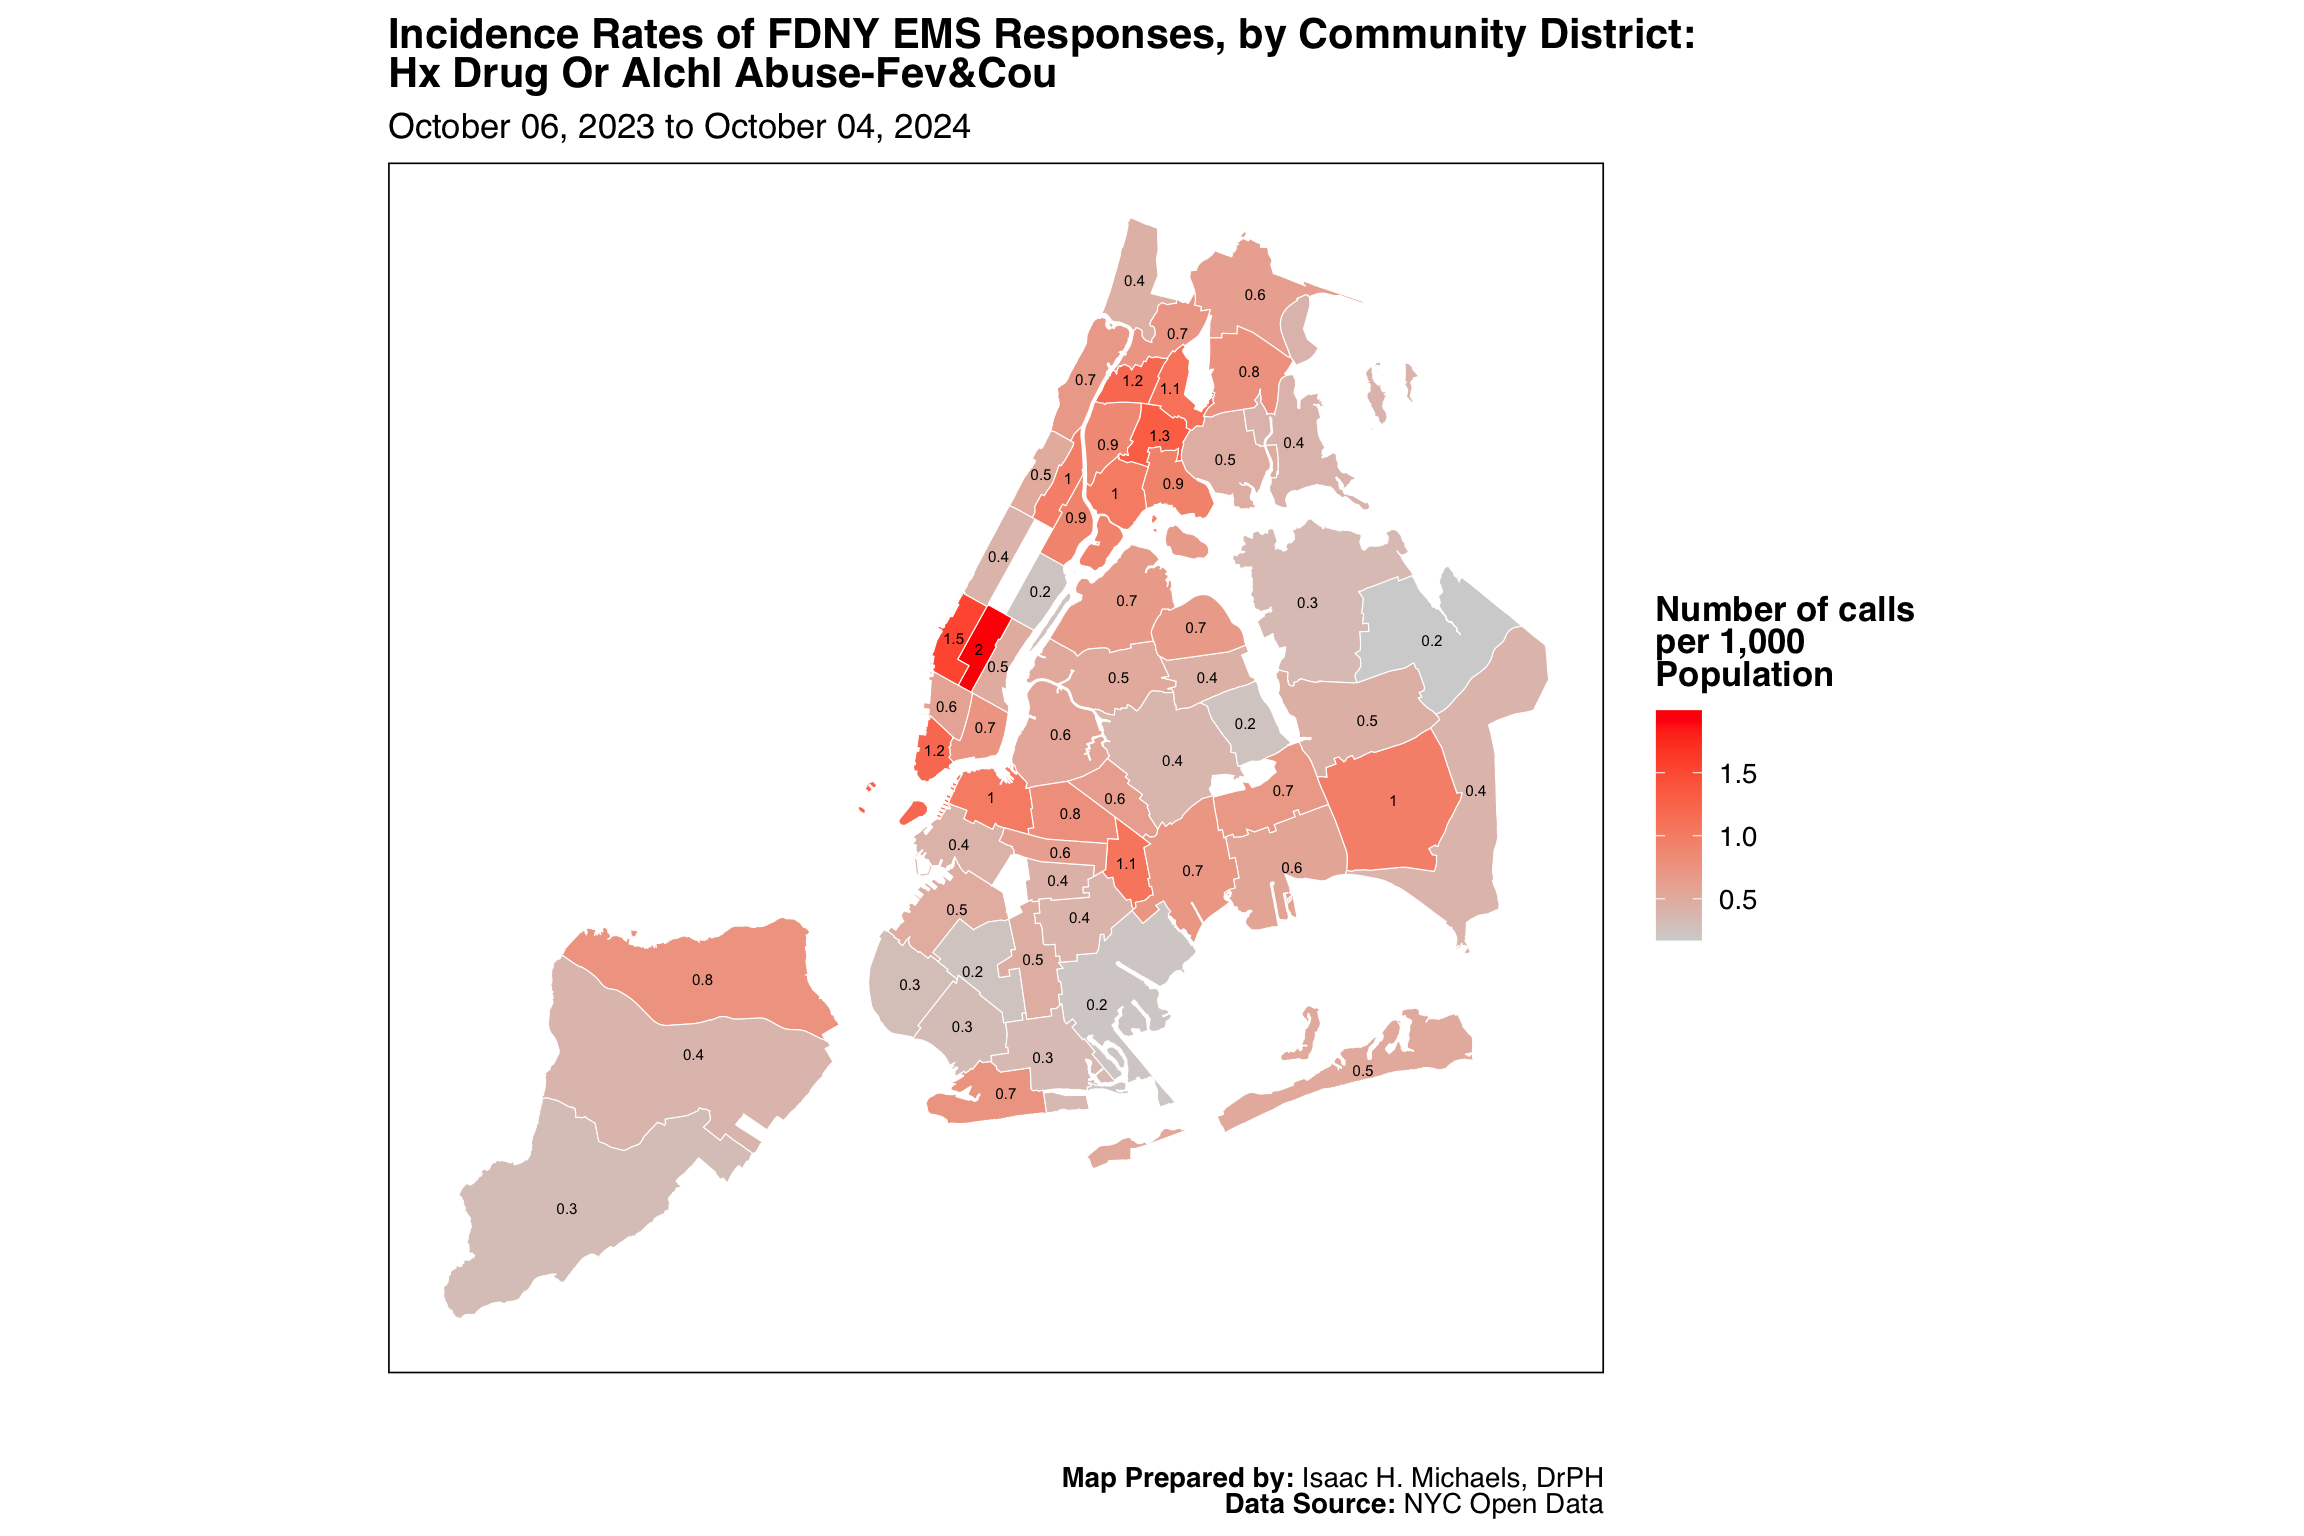
Map Prepared by: Isaac H. Michaels, DrPH
EMS Data Source: NYC Open Data
Population Data Source: NYC Open Data
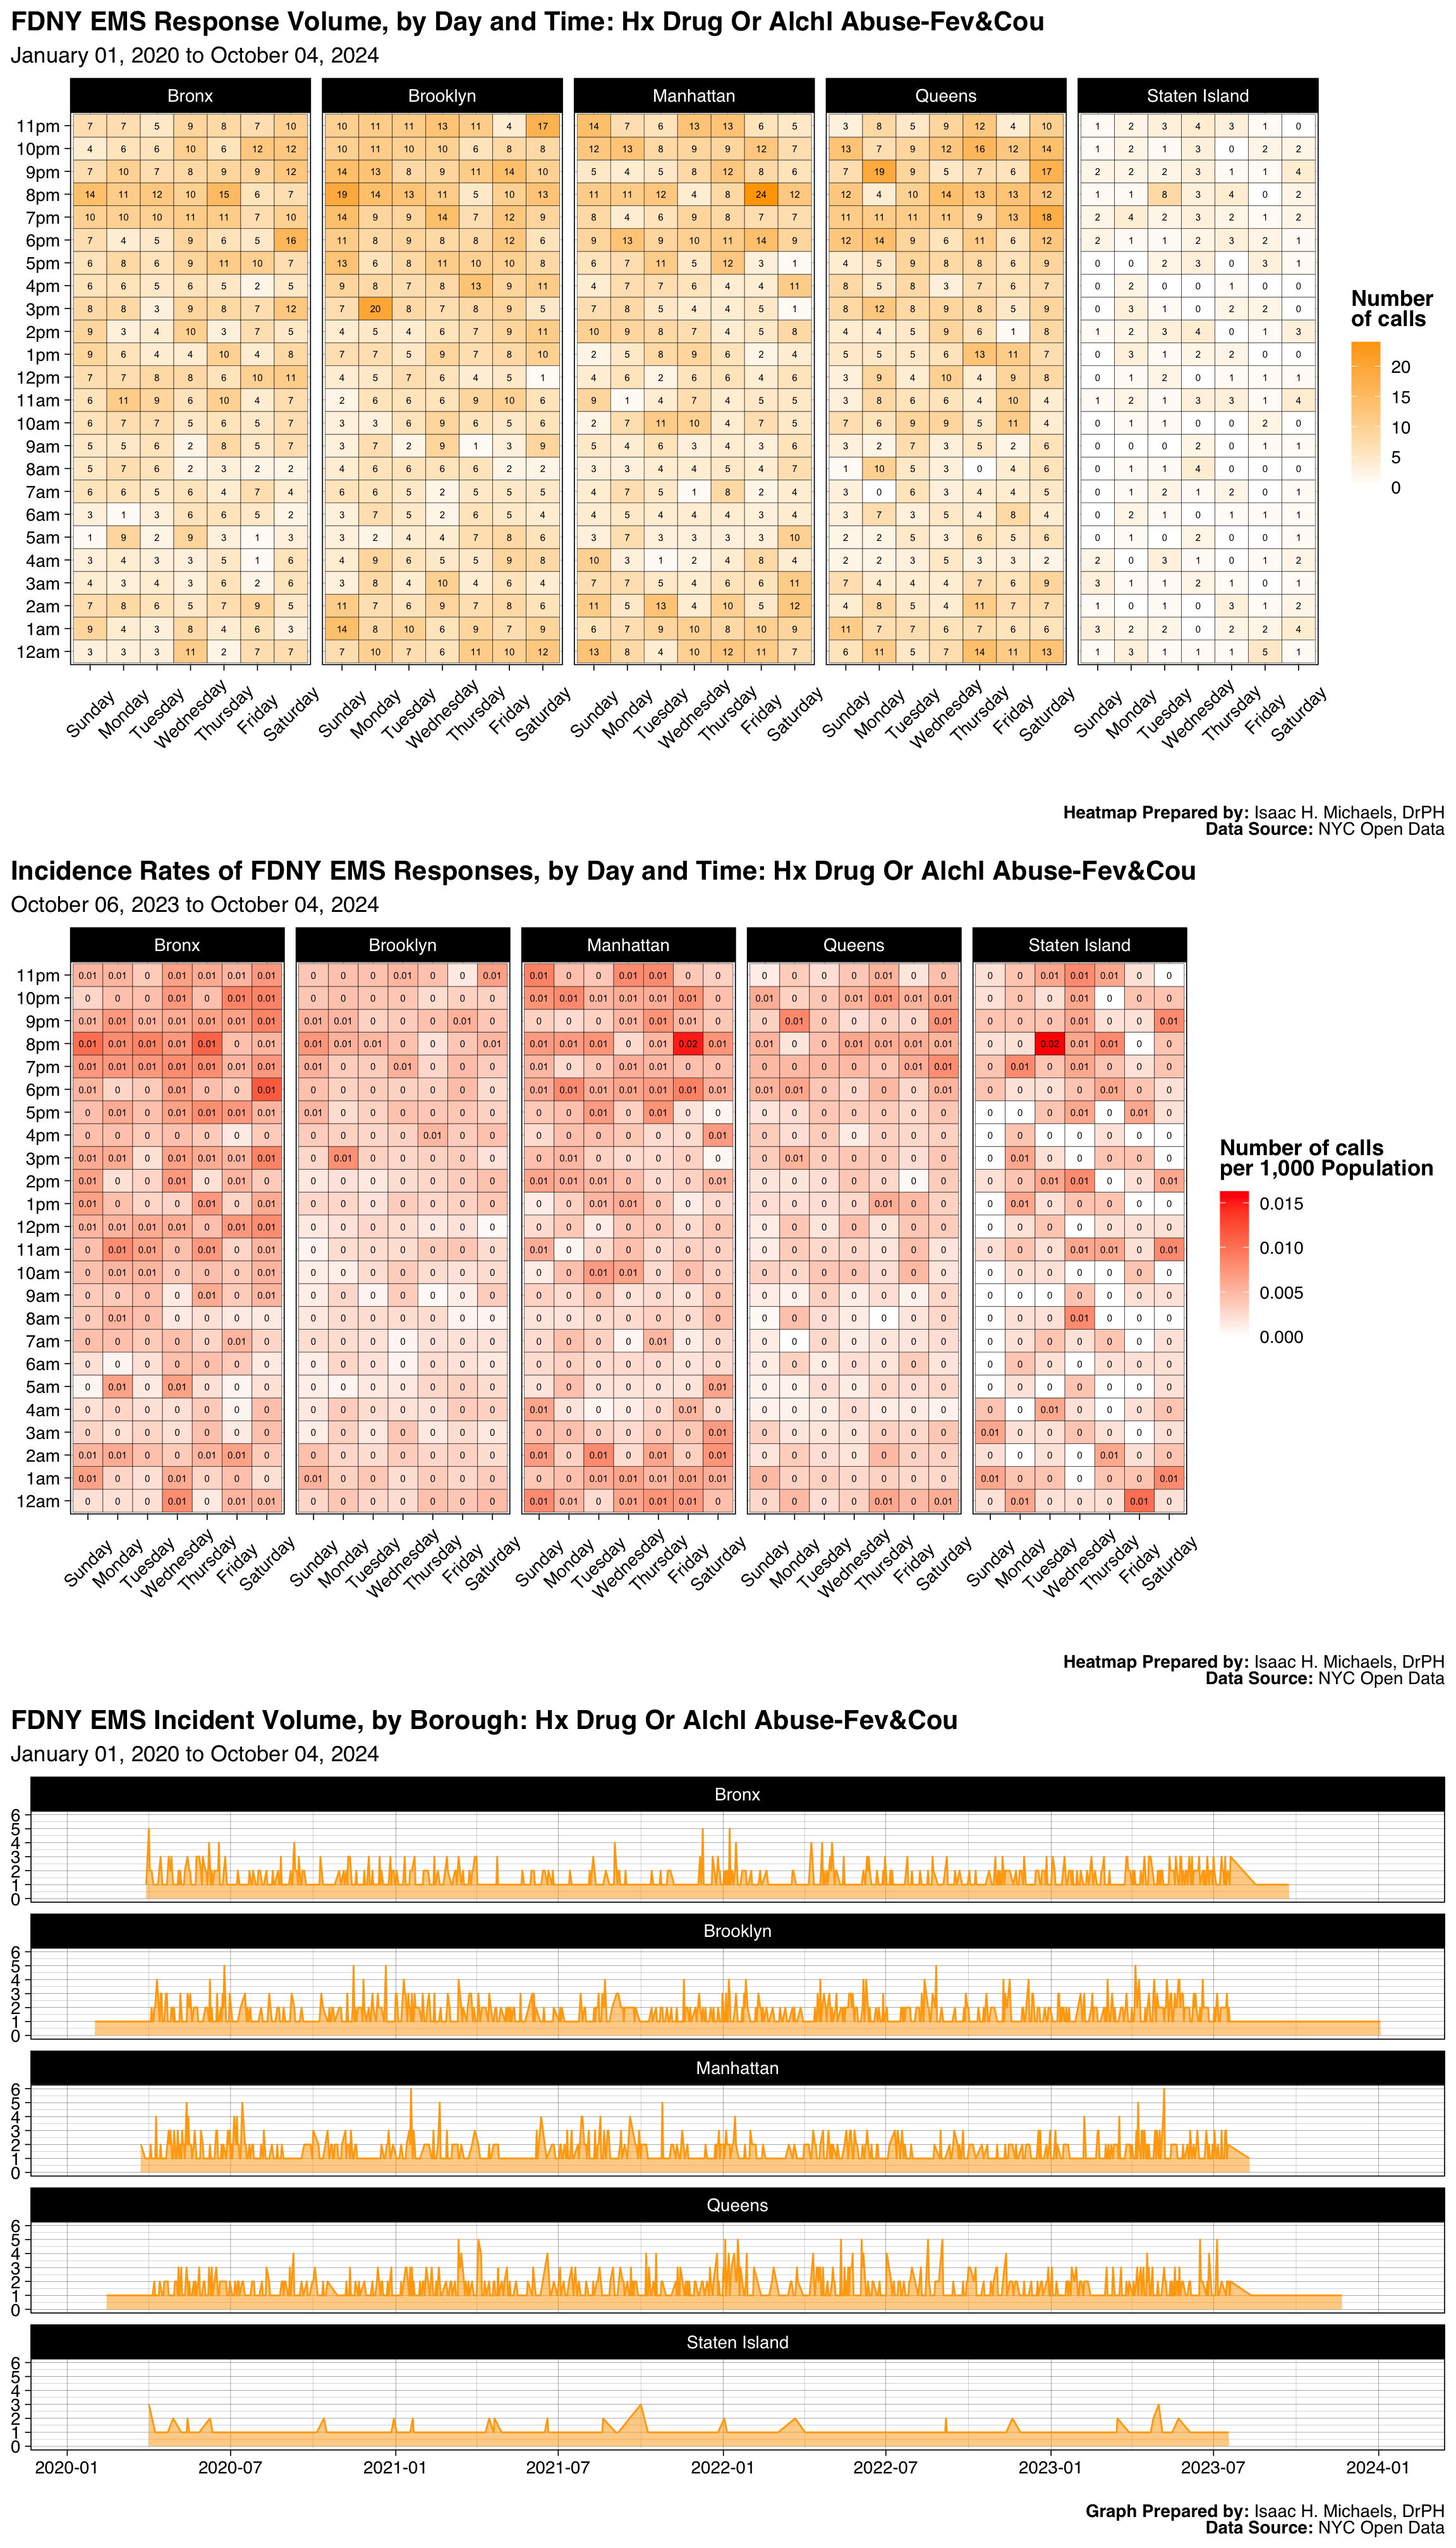
Graphs Prepared by: Isaac H. Michaels, DrPH
Data Source: NYC Open Data
| FDNY EMS Incident Volume, by Borough: Amputation, Arm, Hand,Leg,Foot |
||||||
| January 01, 2025 to July 01, 2026 | ||||||
| Borough |
Latest Year: 2026
|
All Years: 2025-2026
|
||||
|---|---|---|---|---|---|---|
| Incidents | % | Rate per 1,000 Population | Total Incidents | % | Monthly Trend | |
| Bronx | 17 | 18% | 0.0 | 48 | 23% | |
| Brooklyn | 34 | 37% | 0.0 | 73 | 35% | |
| Manhattan | 18 | 20% | 0.0 | 36 | 17% | |
| Queens | 22 | 24% | 0.0 | 47 | 23% | |
| Staten Island | 1 | 1% | 0.0 | 4 | 2% | |
| Table Prepred by: Isaac H. Michaels, DrPH | ||||||
| Data Source: NYC Open Data | ||||||
Table Prepared by: Isaac H. Michaels, DrPH
EMS Data Source: NYC Open Data
Population Data Source: Health Data NY
| FDNY EMS Incident Volume, by Severity Level: Amputation, Arm, Hand,Leg,Foot |
||||
| January 01, 2025 to July 01, 2026 | ||||
| Final Severity Level |
Latest Year: 2026
|
All Years: 2025-2026
|
||
|---|---|---|---|---|
| Incidents | % | Incidents | % | |
| 1 | 0 | 0% | 0 | 0% |
| 2 | 0 | 0% | 0 | 0% |
| 3 | 91 | 99% | 207 | 100% |
| 4 | 1 | 1% | 1 | 0% |
| 5 | 0 | 0% | 0 | 0% |
| 6 | 0 | 0% | 0 | 0% |
| 7 | 0 | 0% | 0 | 0% |
| 8 | 0 | 0% | 0 | 0% |
| Table Prepred by: Isaac H. Michaels, DrPH | ||||
| Data Source: NYC Open Data | ||||
Table Prepared by: Isaac H. Michaels, DrPH
Data Source: NYC Open Data
| FDNY EMS Incident Volume, by Disposition: Amputation, Arm, Hand,Leg,Foot |
||||
| January 01, 2025 to July 01, 2026 | ||||
| Disposition |
Latest Year: 2026
|
All Years: 2025-2026
|
||
|---|---|---|---|---|
| Incidents | % | Incidents | % | |
| Cancelled | 1 | 1% | 2 | 1% |
| Condition Corrected | 1 | 1% | 1 | 0% |
| Patient Gone on Arrival | 5 | 5% | 11 | 5% |
| Refused Medical Aid | 6 | 7% | 9 | 4% |
| Transporting Patient | 73 | 79% | 169 | 81% |
| Unfounded | 6 | 7% | 15 | 7% |
| Table Prepred by: Isaac H. Michaels, DrPH | ||||
| Data Source: NYC Open Data | ||||
Table Prepared by: Isaac H. Michaels, DrPH
Data Source: NYC Open Data
Back to top
Ground Transport Incident
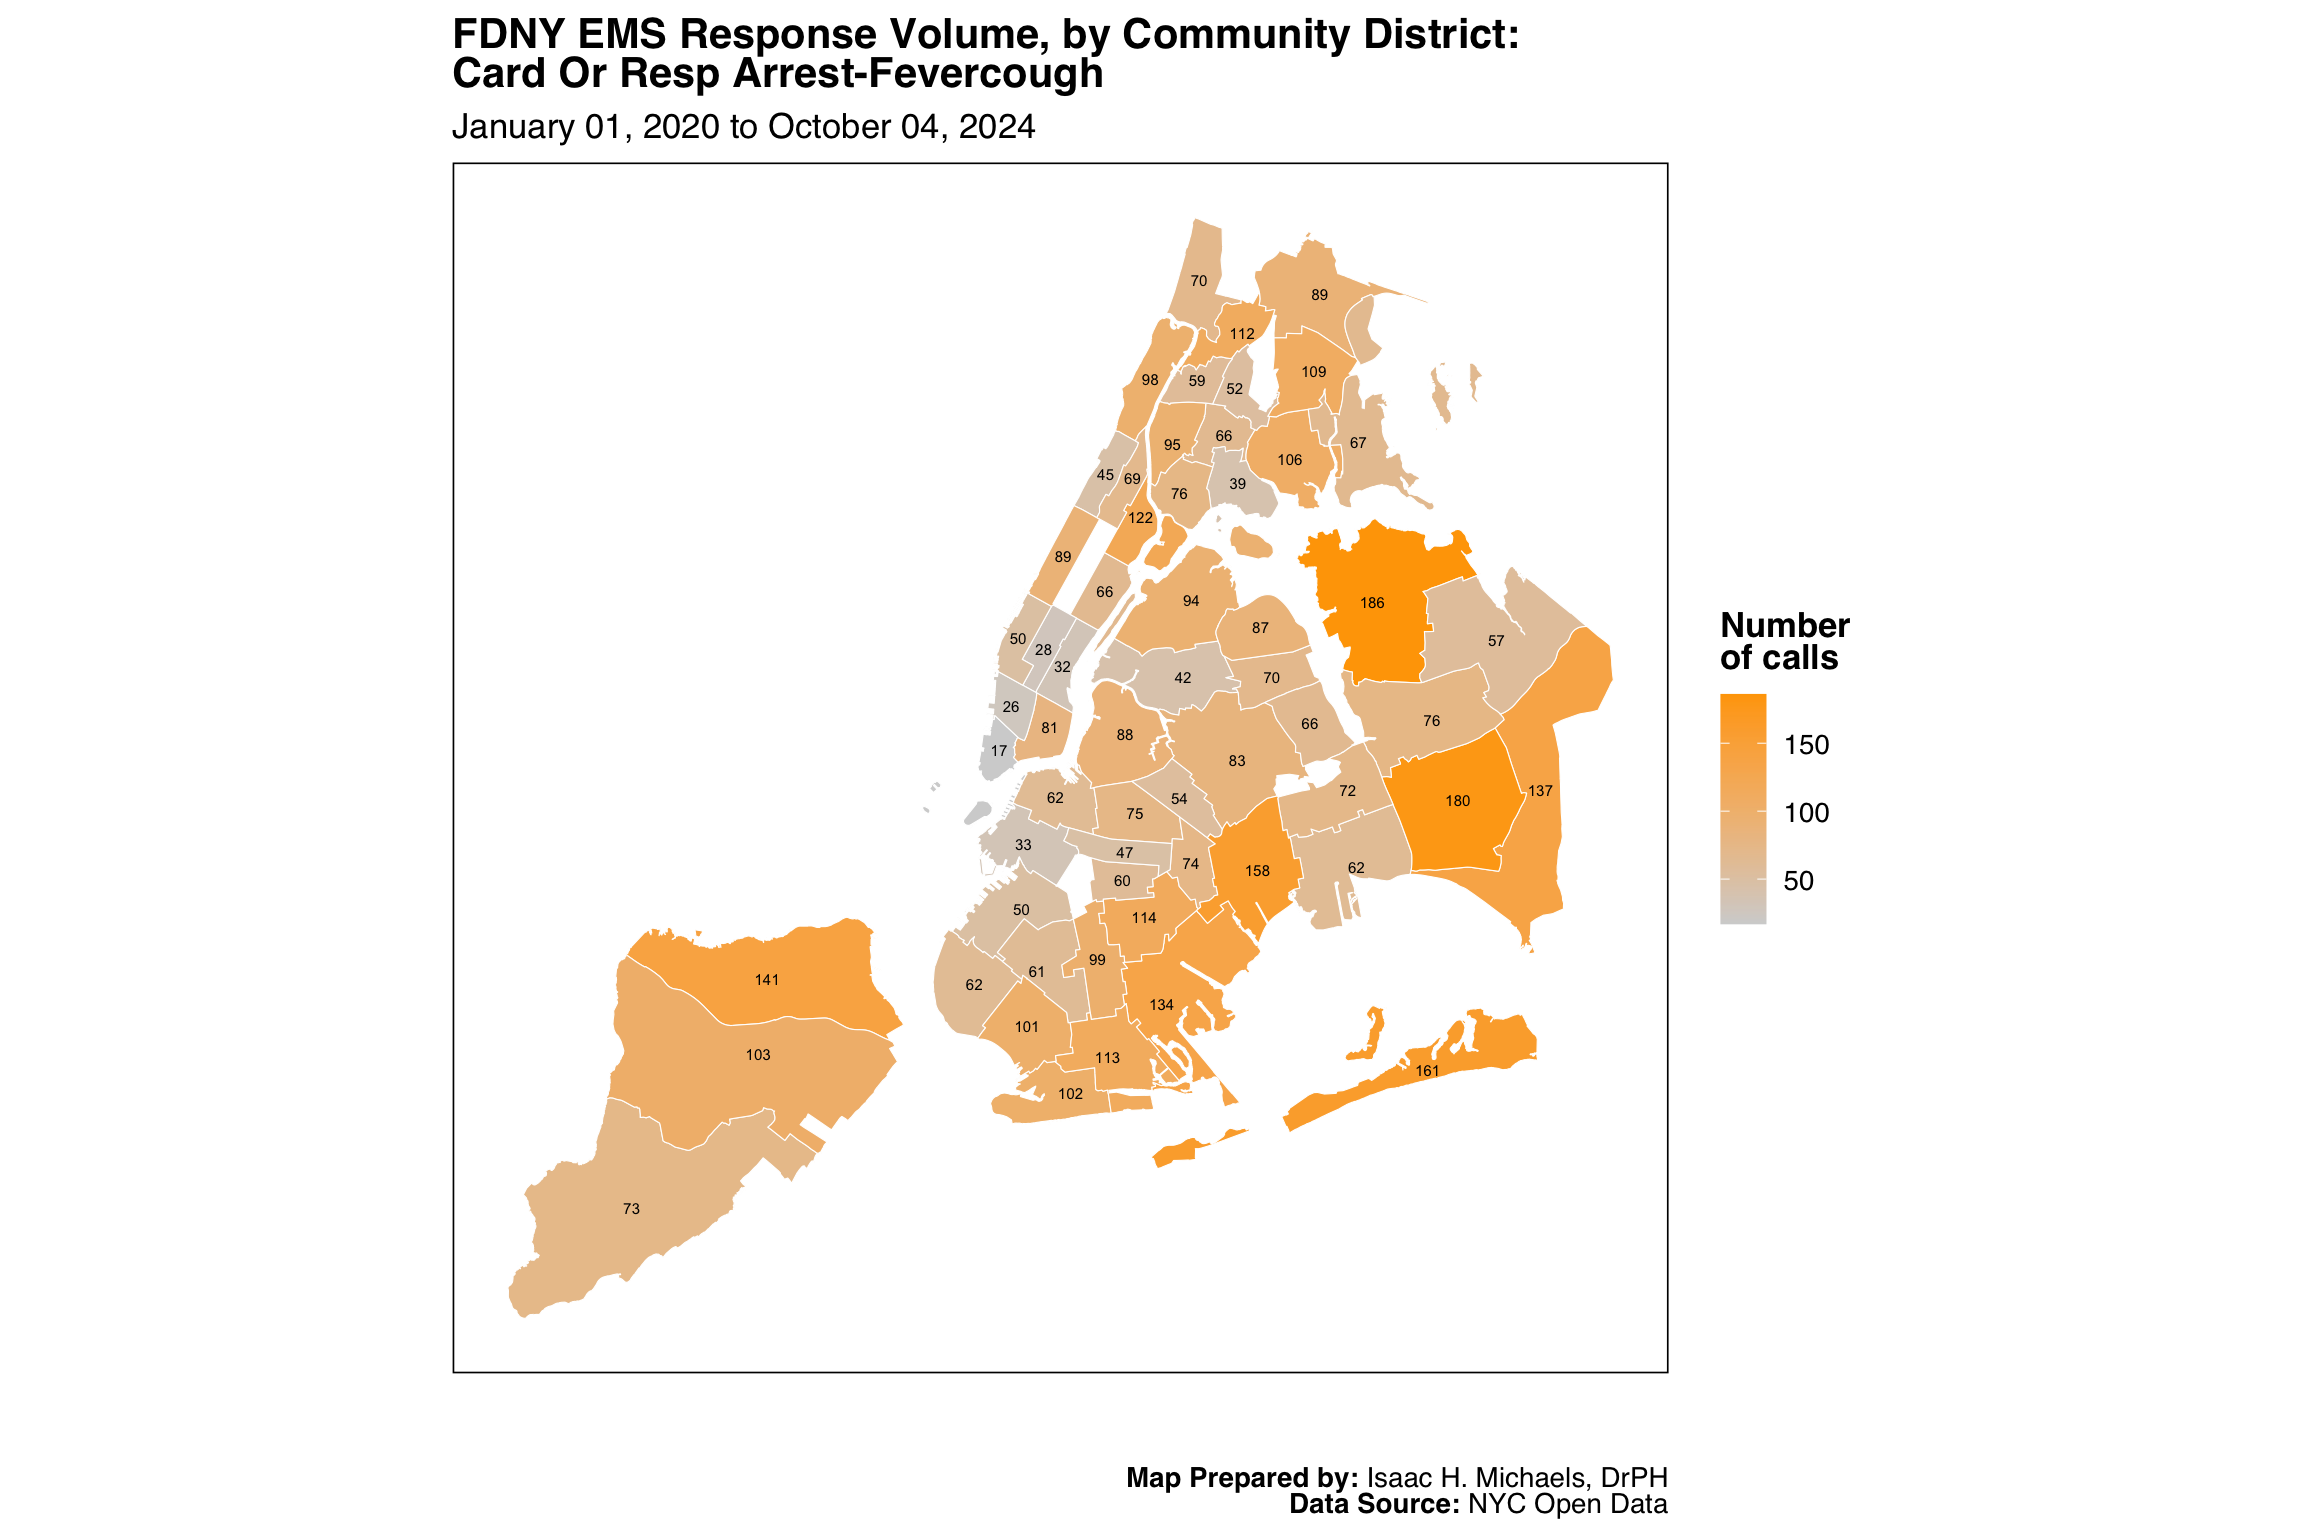
Map Prepared by: Isaac H. Michaels, DrPH
Data Source: NYC Open Data
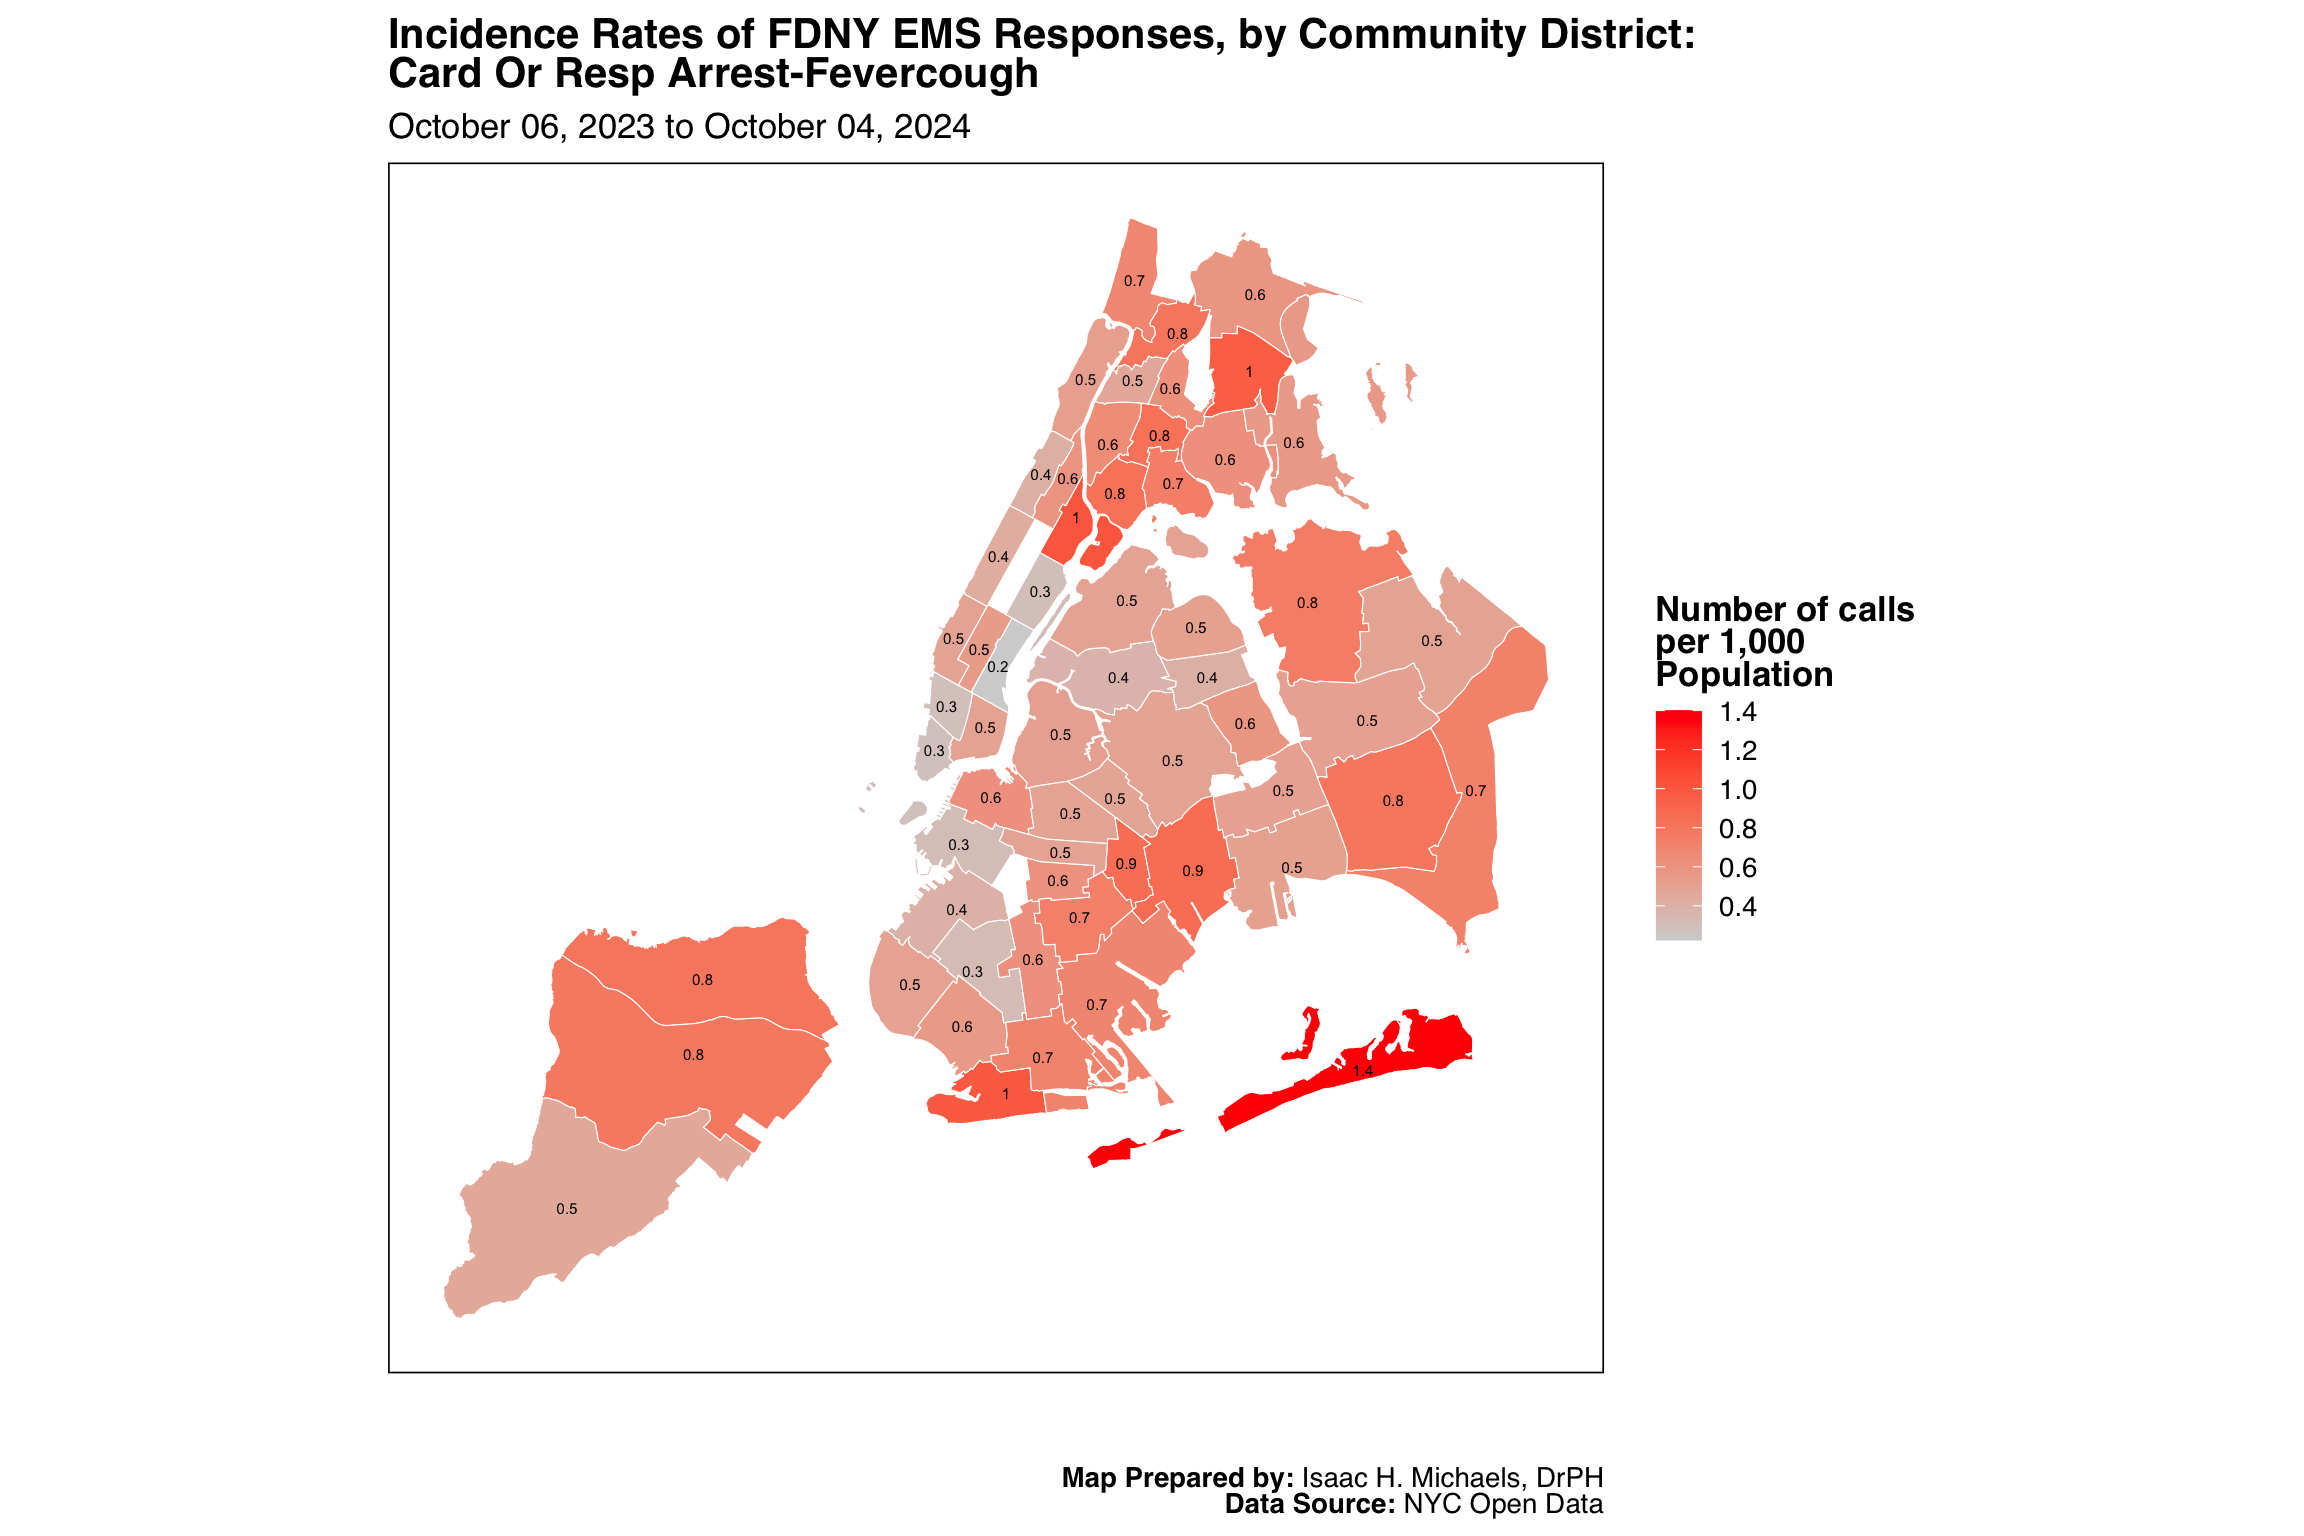
Map Prepared by: Isaac H. Michaels, DrPH
EMS Data Source: NYC Open Data
Population Data Source: NYC Open Data
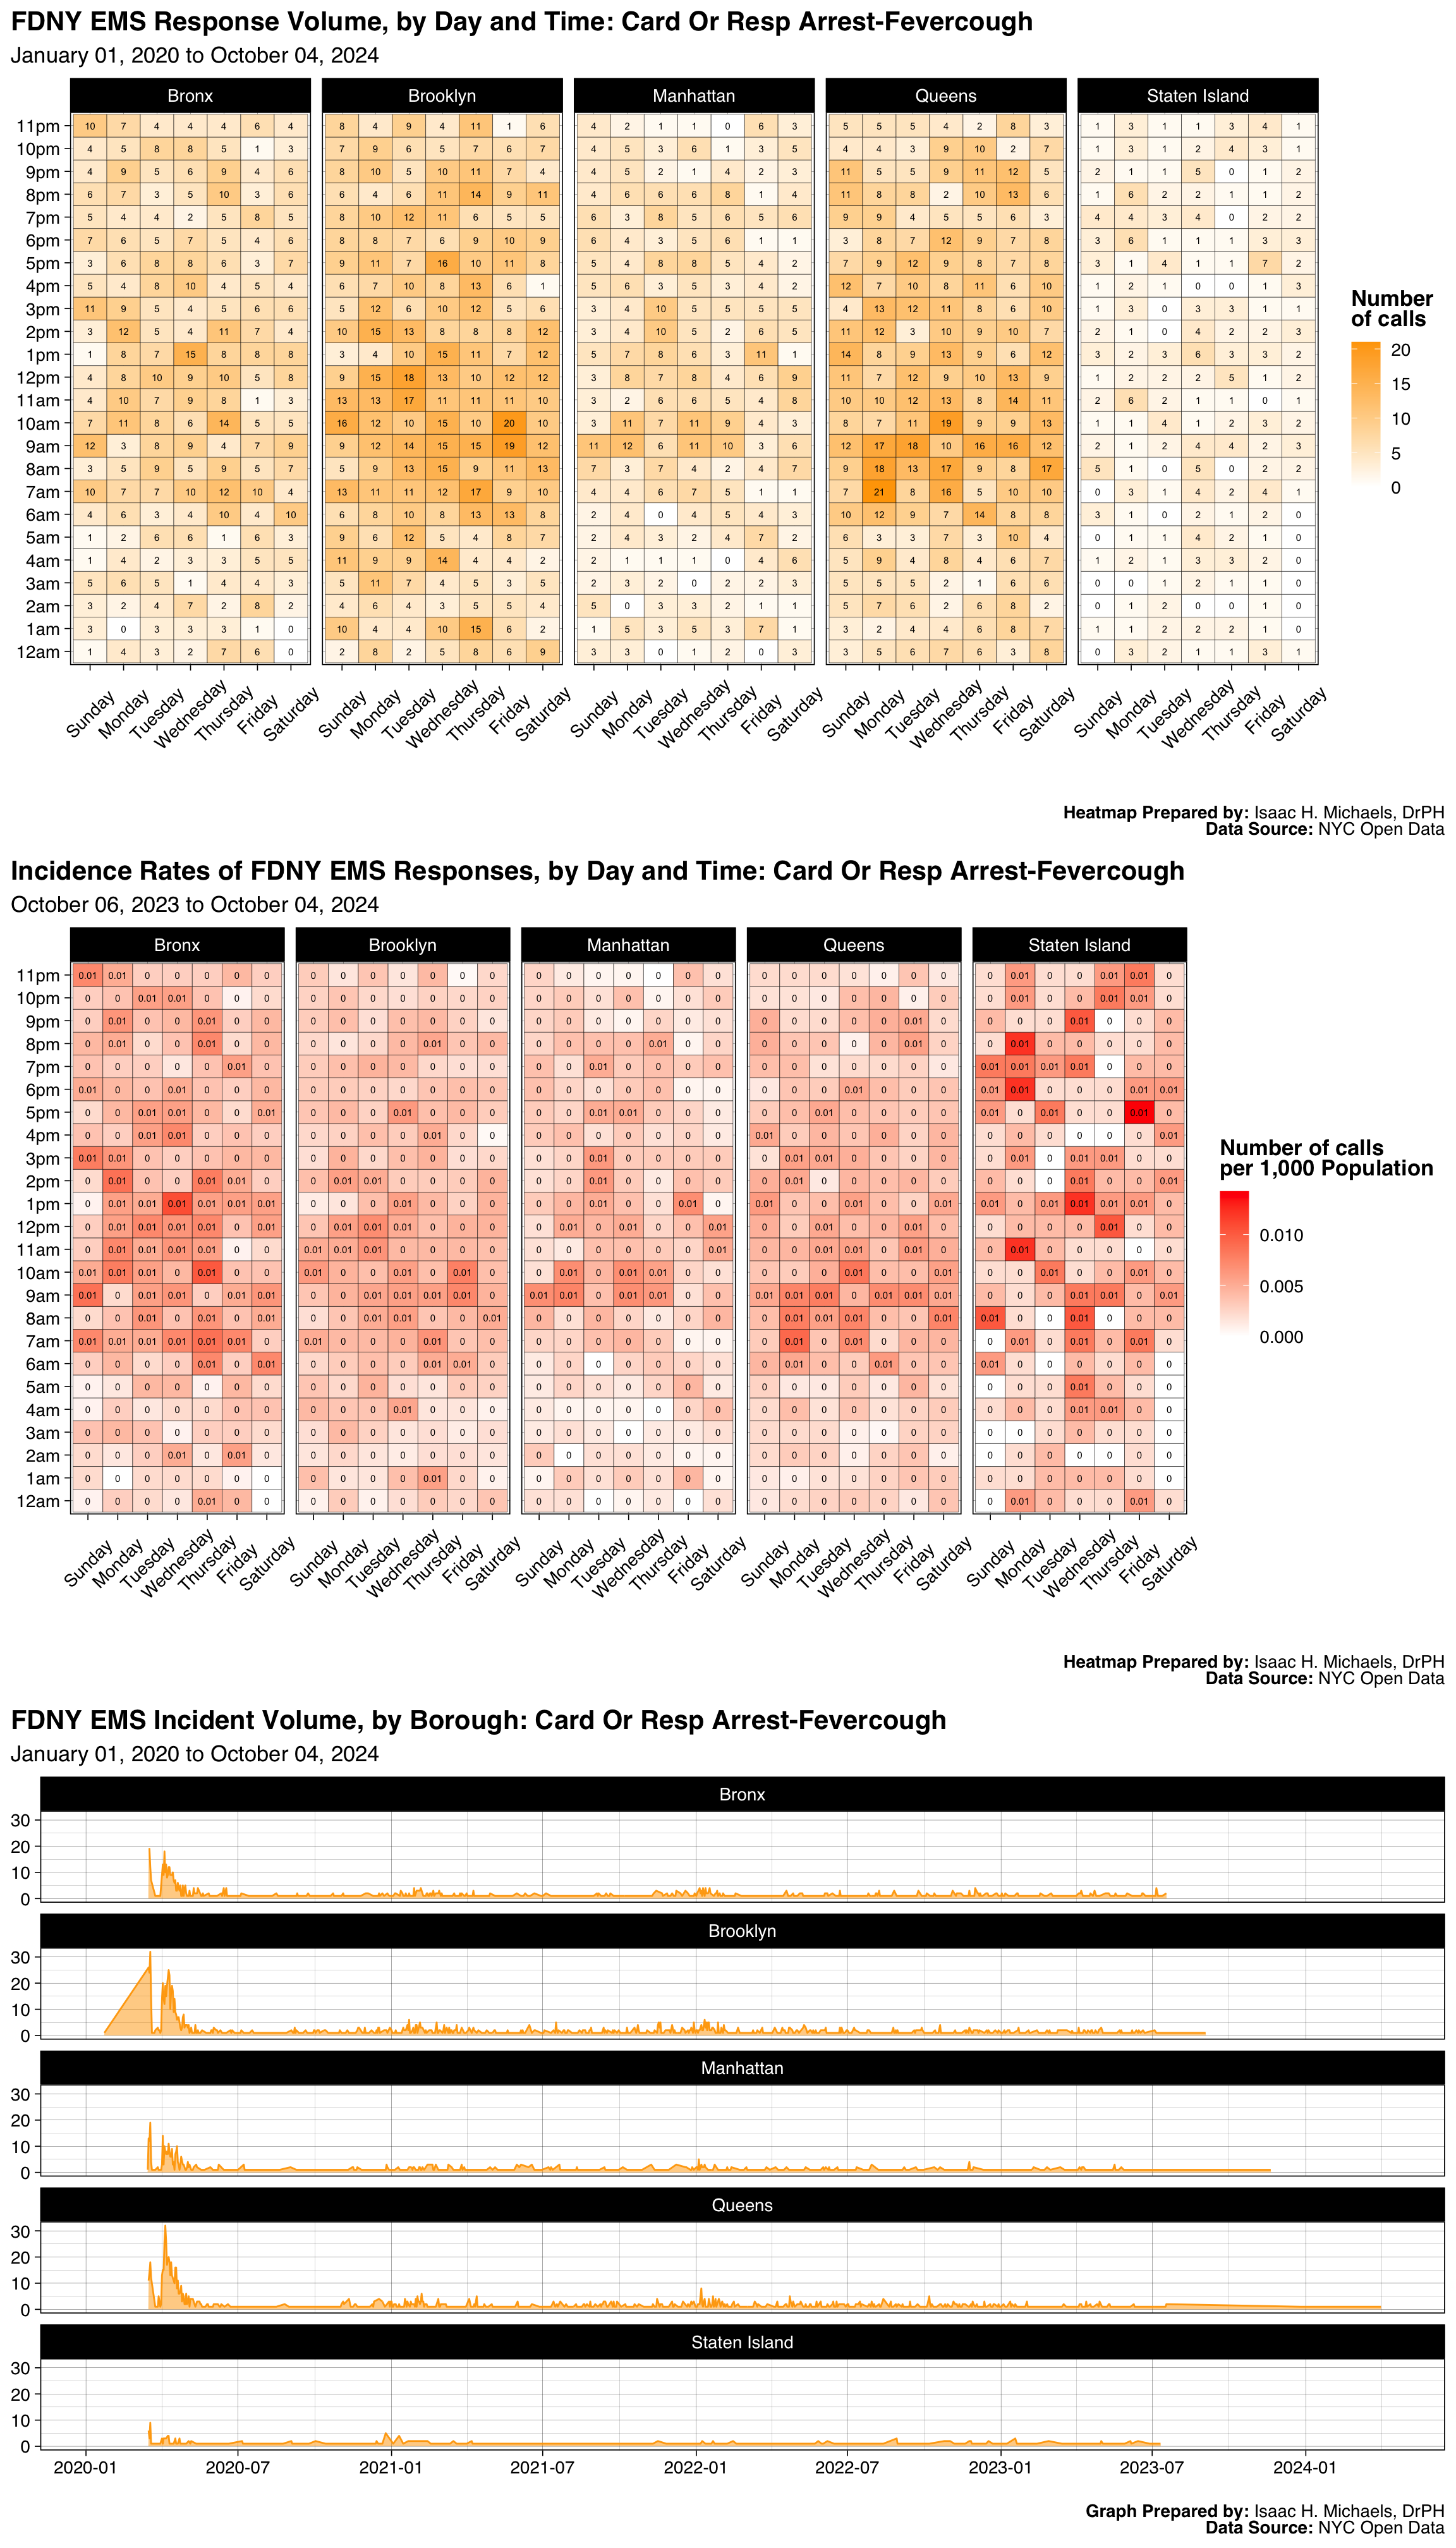
Graphs Prepared by: Isaac H. Michaels, DrPH
Data Source: NYC Open Data
| FDNY EMS Incident Volume, by Borough: Ground Transport Incident |
||||||
| January 01, 2025 to July 01, 2026 | ||||||
| Borough |
Latest Year: 2026
|
All Years: 2025-2026
|
||||
|---|---|---|---|---|---|---|
| Incidents | % | Rate per 1,000 Population | Total Incidents | % | Monthly Trend | |
| Bronx | 10 | 22% | 0.0 | 34 | 24% | |
| Brooklyn | 18 | 39% | 0.0 | 54 | 38% | |
| Manhattan | 5 | 11% | 0.0 | 11 | 8% | |
| Queens | 12 | 26% | 0.0 | 38 | 26% | |
| Staten Island | 1 | 2% | 0.0 | 7 | 5% | |
| Table Prepred by: Isaac H. Michaels, DrPH | ||||||
| Data Source: NYC Open Data | ||||||
Table Prepared by: Isaac H. Michaels, DrPH
EMS Data Source: NYC Open Data
Population Data Source: Health Data NY
| FDNY EMS Incident Volume, by Severity Level: Ground Transport Incident |
||||
| January 01, 2025 to July 01, 2026 | ||||
| Final Severity Level |
Latest Year: 2026
|
All Years: 2025-2026
|
||
|---|---|---|---|---|
| Incidents | % | Incidents | % | |
| 1 | 0 | 0% | 0 | 0% |
| 2 | 46 | 100% | 139 | 97% |
| 3 | 0 | 0% | 0 | 0% |
| 4 | 0 | 0% | 5 | 3% |
| 5 | 0 | 0% | 0 | 0% |
| 6 | 0 | 0% | 0 | 0% |
| 7 | 0 | 0% | 0 | 0% |
| 8 | 0 | 0% | 0 | 0% |
| Table Prepred by: Isaac H. Michaels, DrPH | ||||
| Data Source: NYC Open Data | ||||
Table Prepared by: Isaac H. Michaels, DrPH
Data Source: NYC Open Data
| FDNY EMS Incident Volume, by Disposition: Ground Transport Incident |
||||
| January 01, 2025 to July 01, 2026 | ||||
| Disposition |
Latest Year: 2026
|
All Years: 2025-2026
|
||
|---|---|---|---|---|
| Incidents | % | Incidents | % | |
| Refused Medical Aid | 1 | 2% | 6 | 4% |
| Transporting Patient | 45 | 98% | 135 | 94% |
| Table Prepred by: Isaac H. Michaels, DrPH | ||||
| Data Source: NYC Open Data | ||||
Table Prepared by: Isaac H. Michaels, DrPH
Data Source: NYC Open Data
Back to top
Active Shooter
Map Prepared by: Isaac H. Michaels, DrPH
Data Source: NYC Open Data
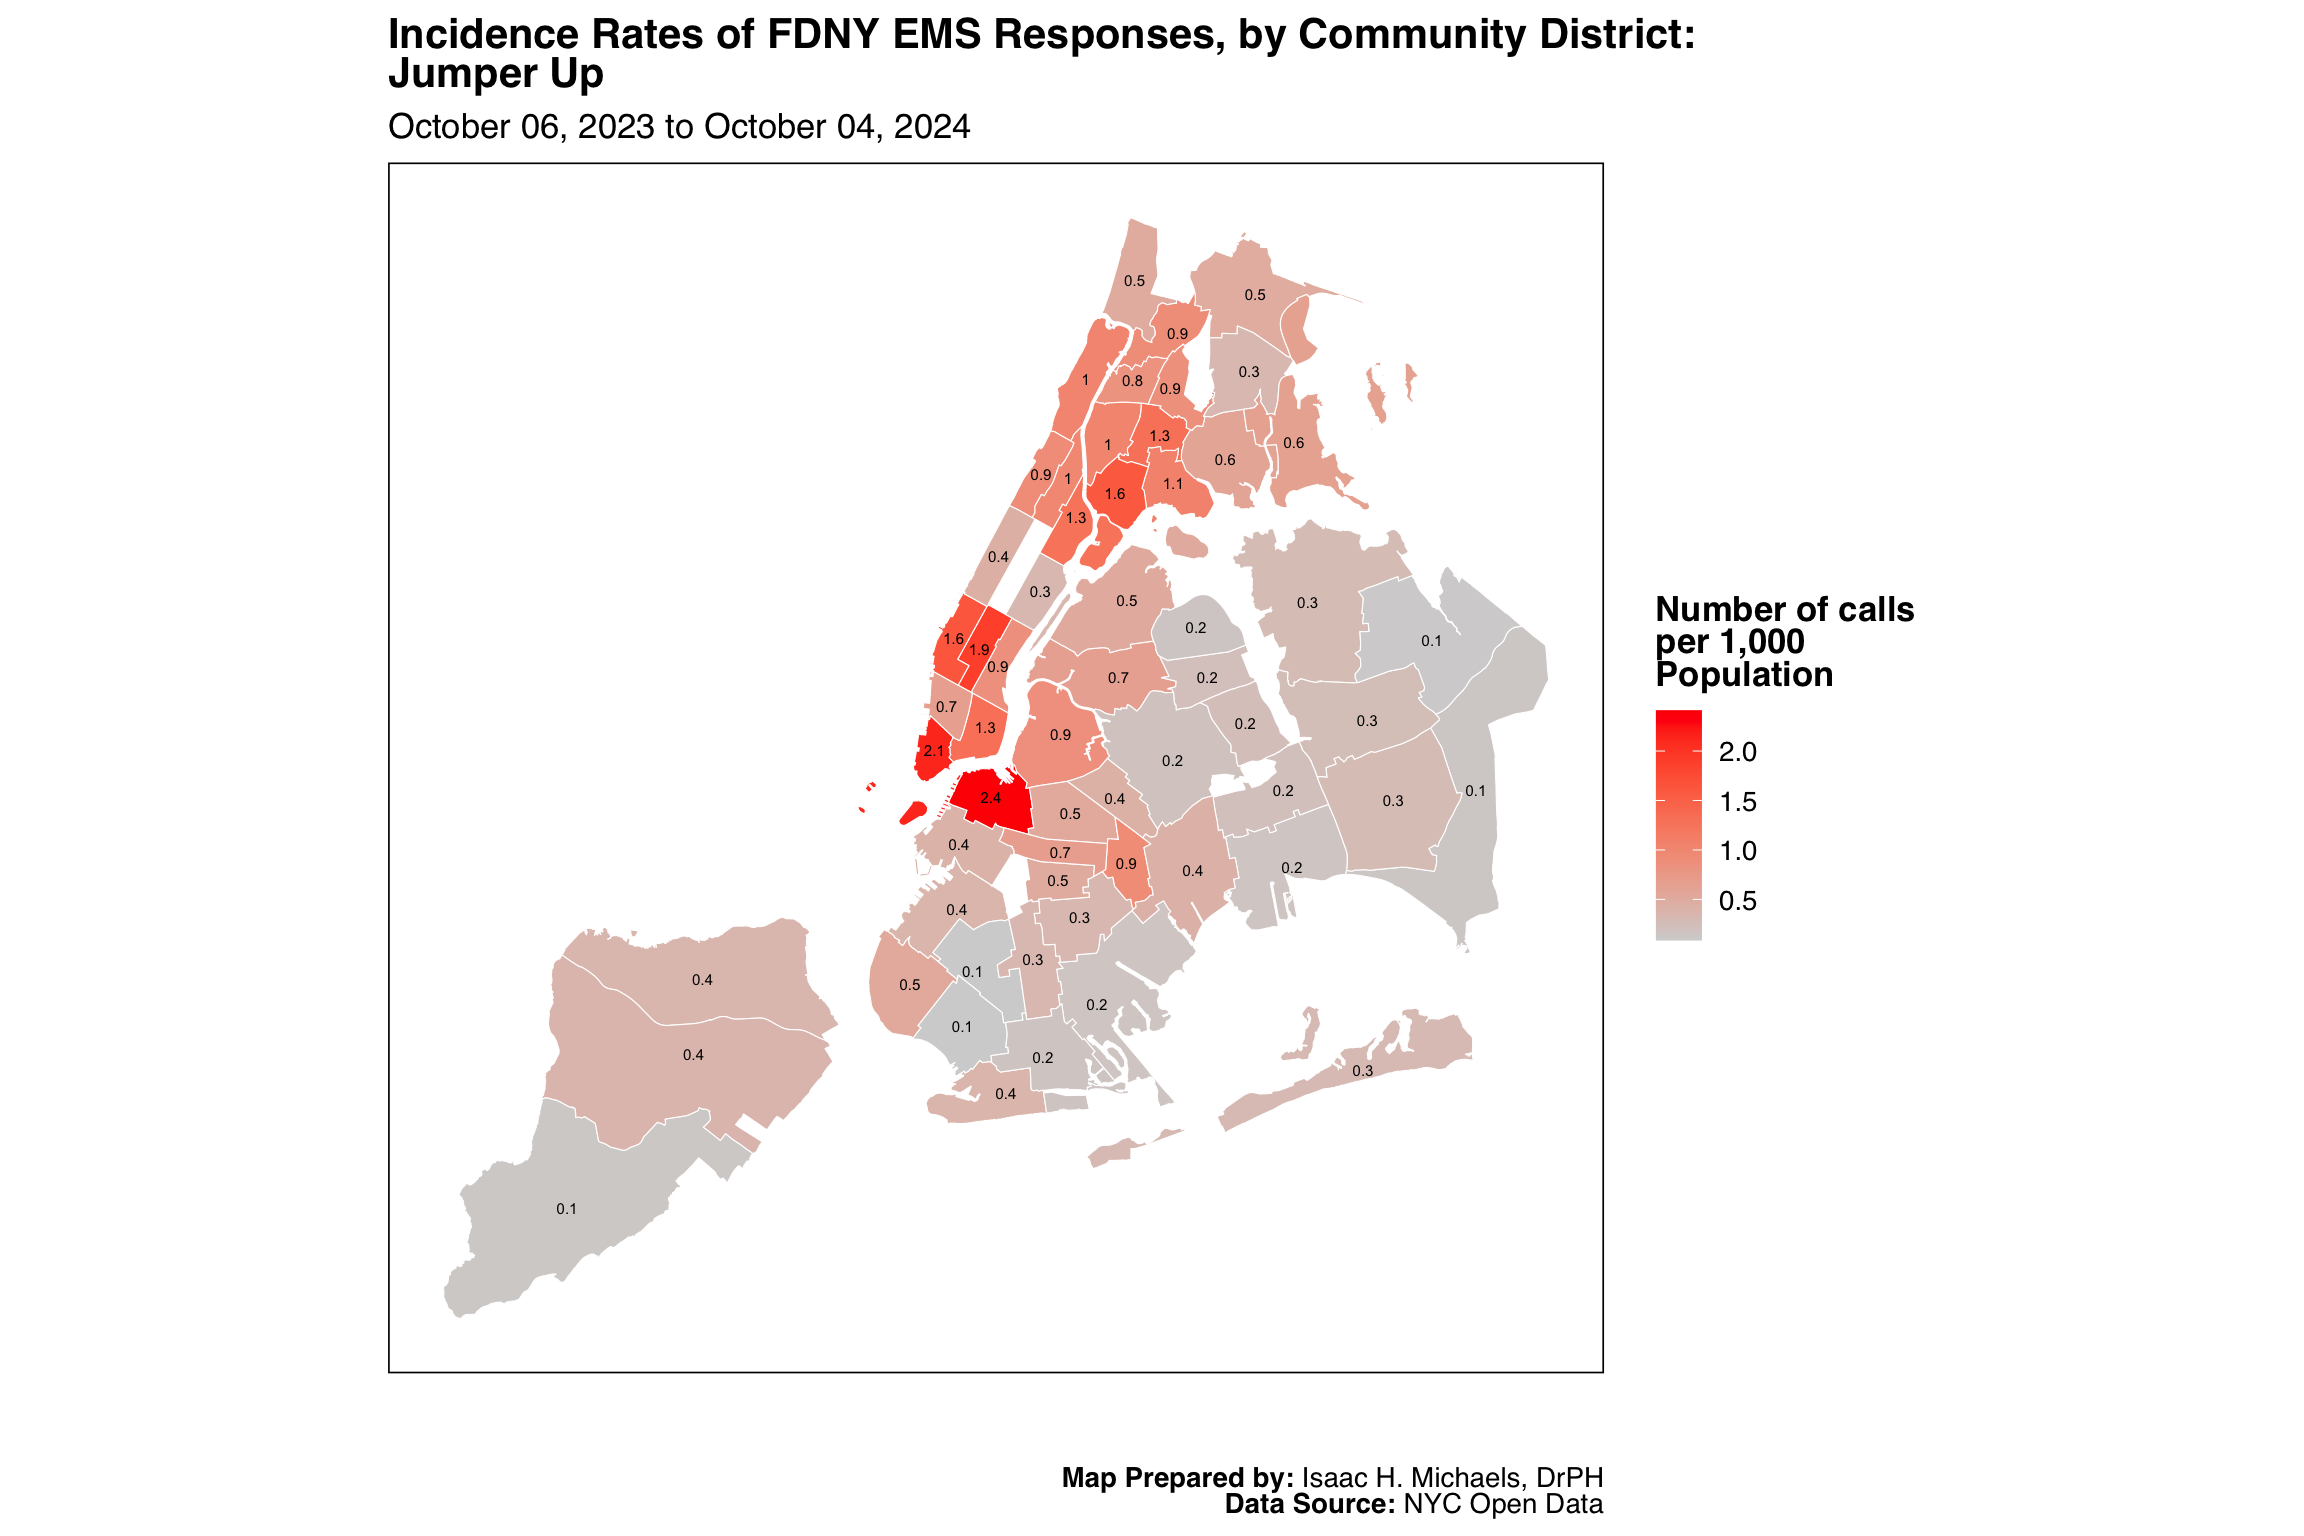
Map Prepared by: Isaac H. Michaels, DrPH
EMS Data Source: NYC Open Data
Population Data Source: NYC Open Data
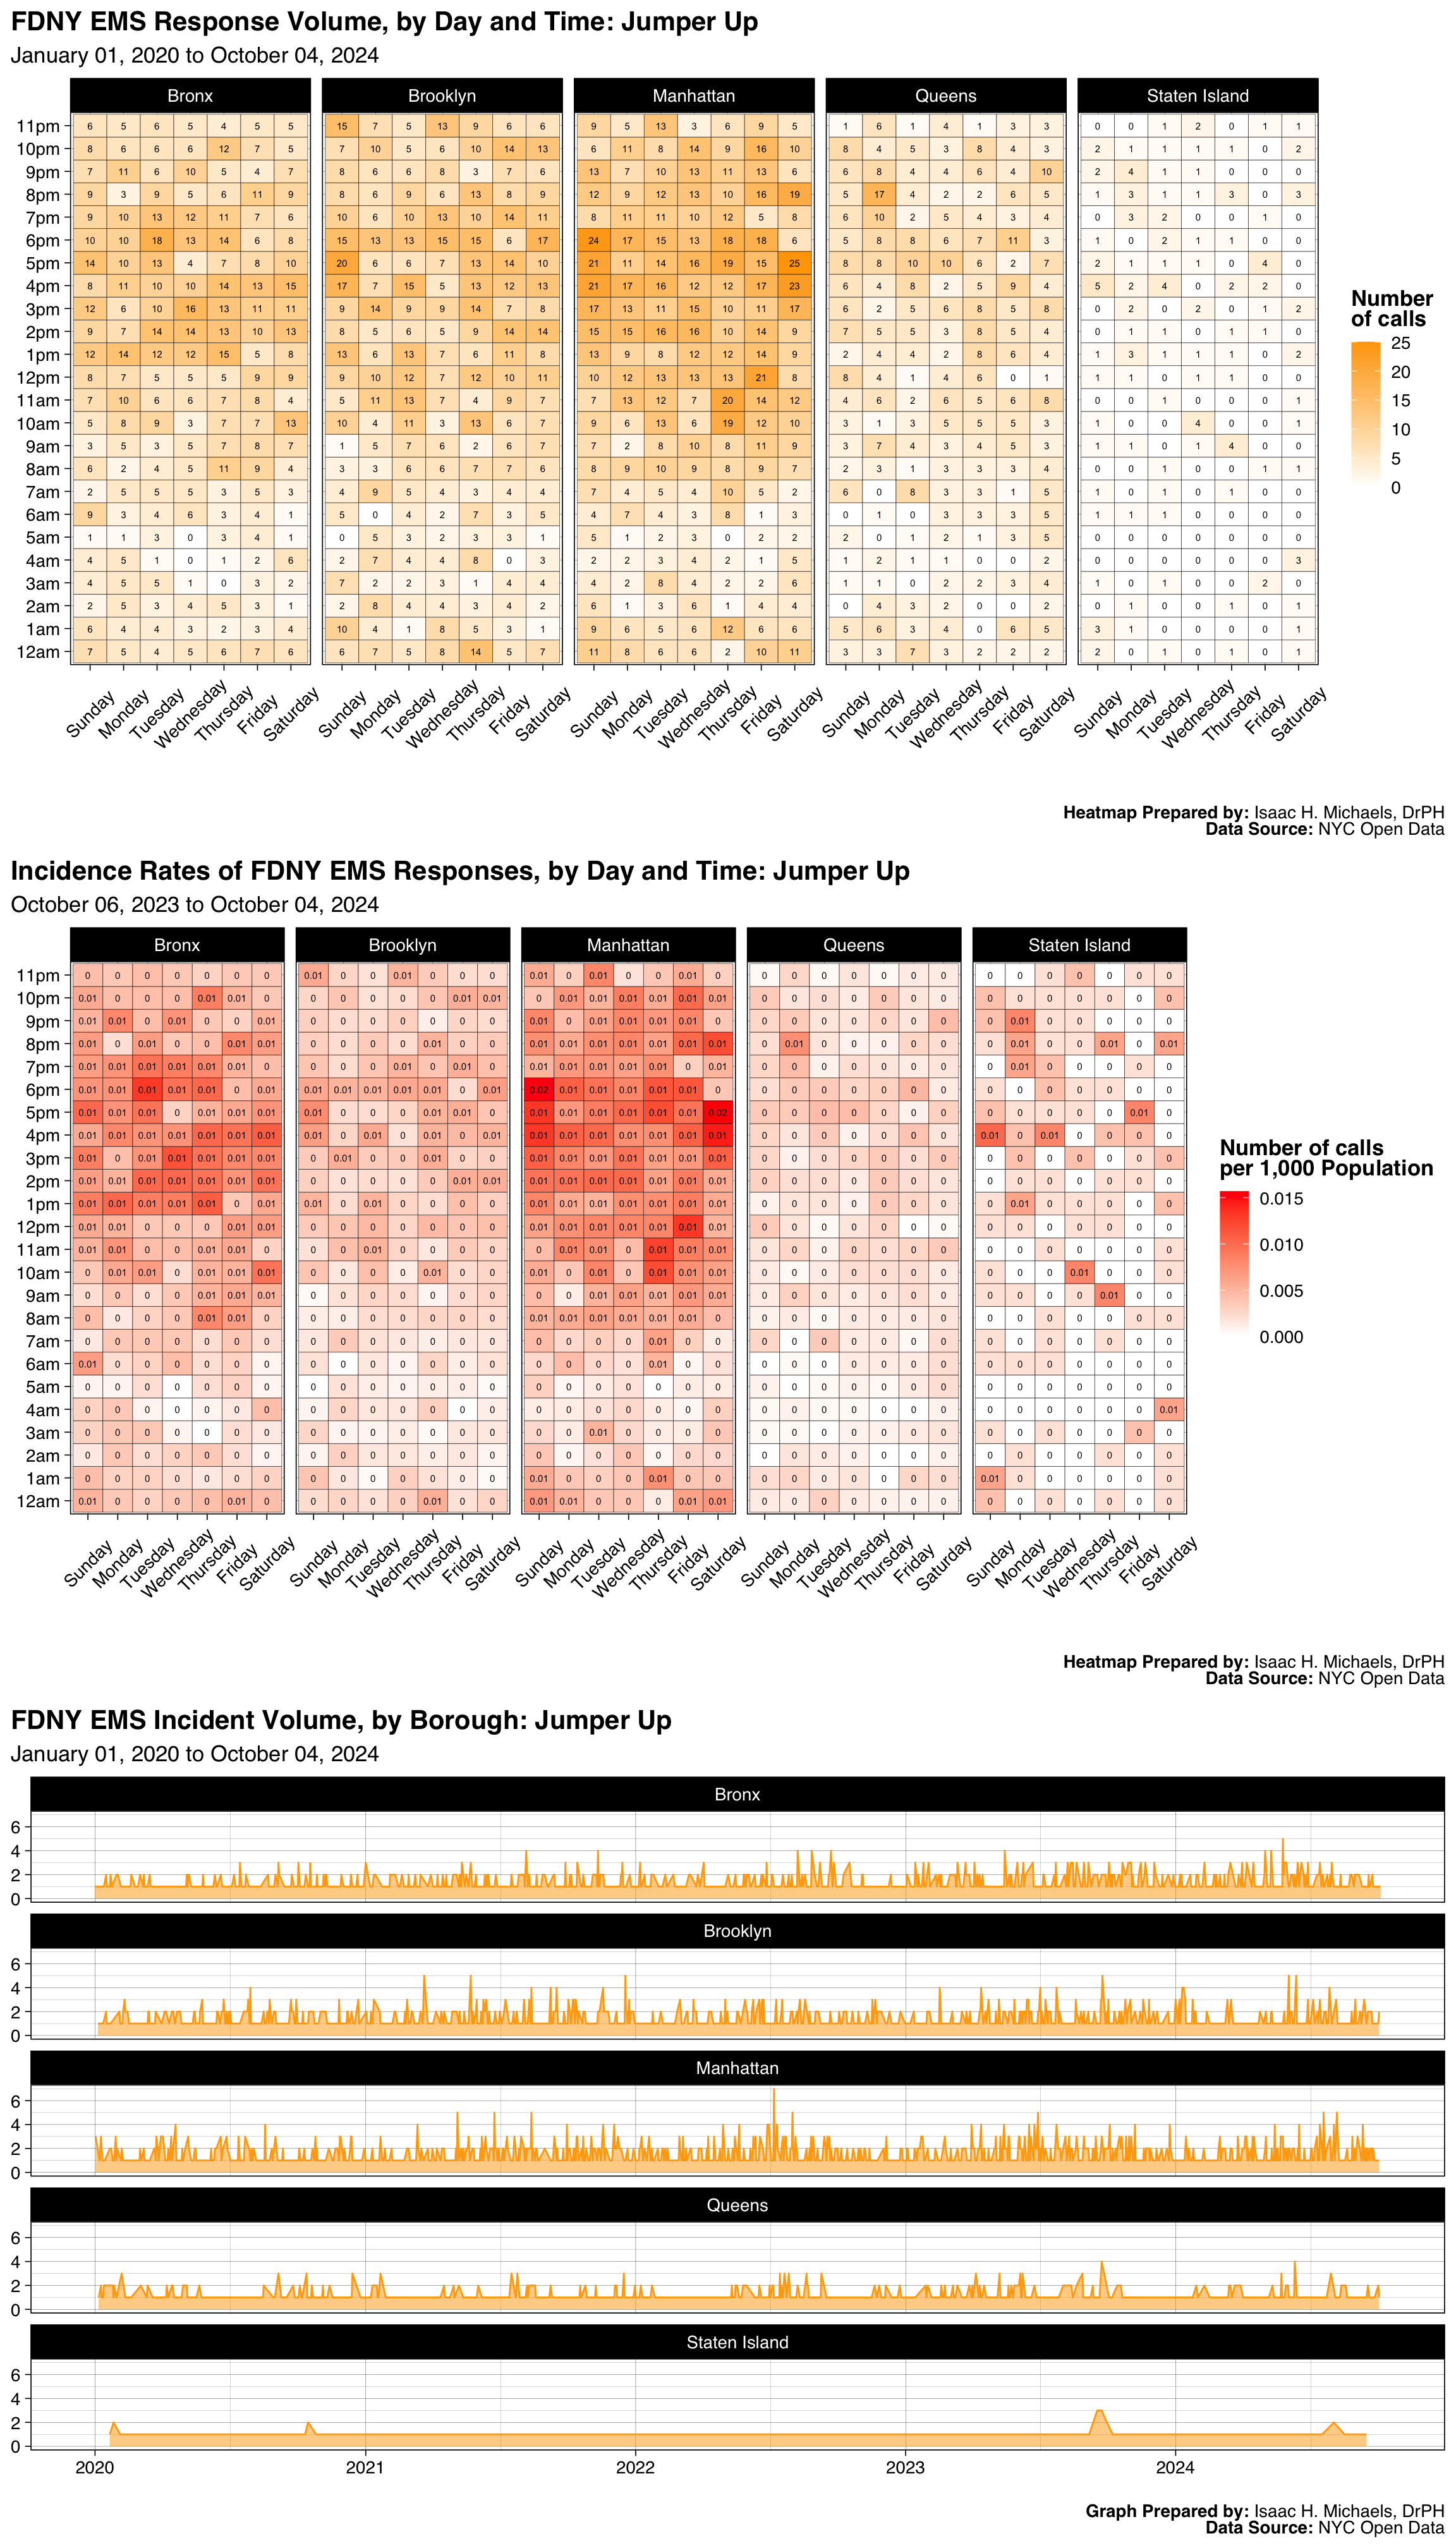
Graphs Prepared by: Isaac H. Michaels, DrPH
Data Source: NYC Open Data
| FDNY EMS Incident Volume, by Borough: Active Shooter |
||||||
| January 01, 2025 to July 01, 2026 | ||||||
| Borough |
Latest Year: 2026
|
All Years: 2025-2026
|
||||
|---|---|---|---|---|---|---|
| Incidents | % | Rate per 1,000 Population | Total Incidents | % | Monthly Trend | |
| Bronx | 4 | 10% | 0.0 | 7 | 6% | |
| Brooklyn | 14 | 35% | 0.0 | 33 | 26% | |
| Manhattan | 13 | 32% | 0.0 | 66 | 53% | |
| Queens | 7 | 18% | 0.0 | 17 | 14% | |
| Staten Island | 2 | 5% | 0.0 | 2 | 2% | |
| Table Prepred by: Isaac H. Michaels, DrPH | ||||||
| Data Source: NYC Open Data | ||||||
Table Prepared by: Isaac H. Michaels, DrPH
EMS Data Source: NYC Open Data
Population Data Source: Health Data NY
| FDNY EMS Incident Volume, by Severity Level: Active Shooter |
||||
| January 01, 2025 to July 01, 2026 | ||||
| Final Severity Level |
Latest Year: 2026
|
All Years: 2025-2026
|
||
|---|---|---|---|---|
| Incidents | % | Incidents | % | |
| 1 | 0 | 0% | 0 | 0% |
| 2 | 40 | 100% | 125 | 100% |
| 3 | 0 | 0% | 0 | 0% |
| 4 | 0 | 0% | 0 | 0% |
| 5 | 0 | 0% | 0 | 0% |
| 6 | 0 | 0% | 0 | 0% |
| 7 | 0 | 0% | 0 | 0% |
| 8 | 0 | 0% | 0 | 0% |
| Table Prepred by: Isaac H. Michaels, DrPH | ||||
| Data Source: NYC Open Data | ||||
Table Prepared by: Isaac H. Michaels, DrPH
Data Source: NYC Open Data
| FDNY EMS Incident Volume, by Disposition: Active Shooter |
||||
| January 01, 2025 to July 01, 2026 | ||||
| Disposition |
Latest Year: 2026
|
All Years: 2025-2026
|
||
|---|---|---|---|---|
| Incidents | % | Incidents | % | |
| Cancelled | 6 | 15% | 36 | 29% |
| Condition Corrected | 6 | 15% | 13 | 10% |
| Transporting Patient | 2 | 5% | 2 | 2% |
| Treated Not Transported | 1 | 2% | 1 | 1% |
| Unfounded | 22 | 55% | 50 | 40% |
| NA | 3 | 8% | 23 | 18% |
| Table Prepred by: Isaac H. Michaels, DrPH | ||||
| Data Source: NYC Open Data | ||||
Table Prepared by: Isaac H. Michaels, DrPH
Data Source: NYC Open Data
Back to top
Special Event
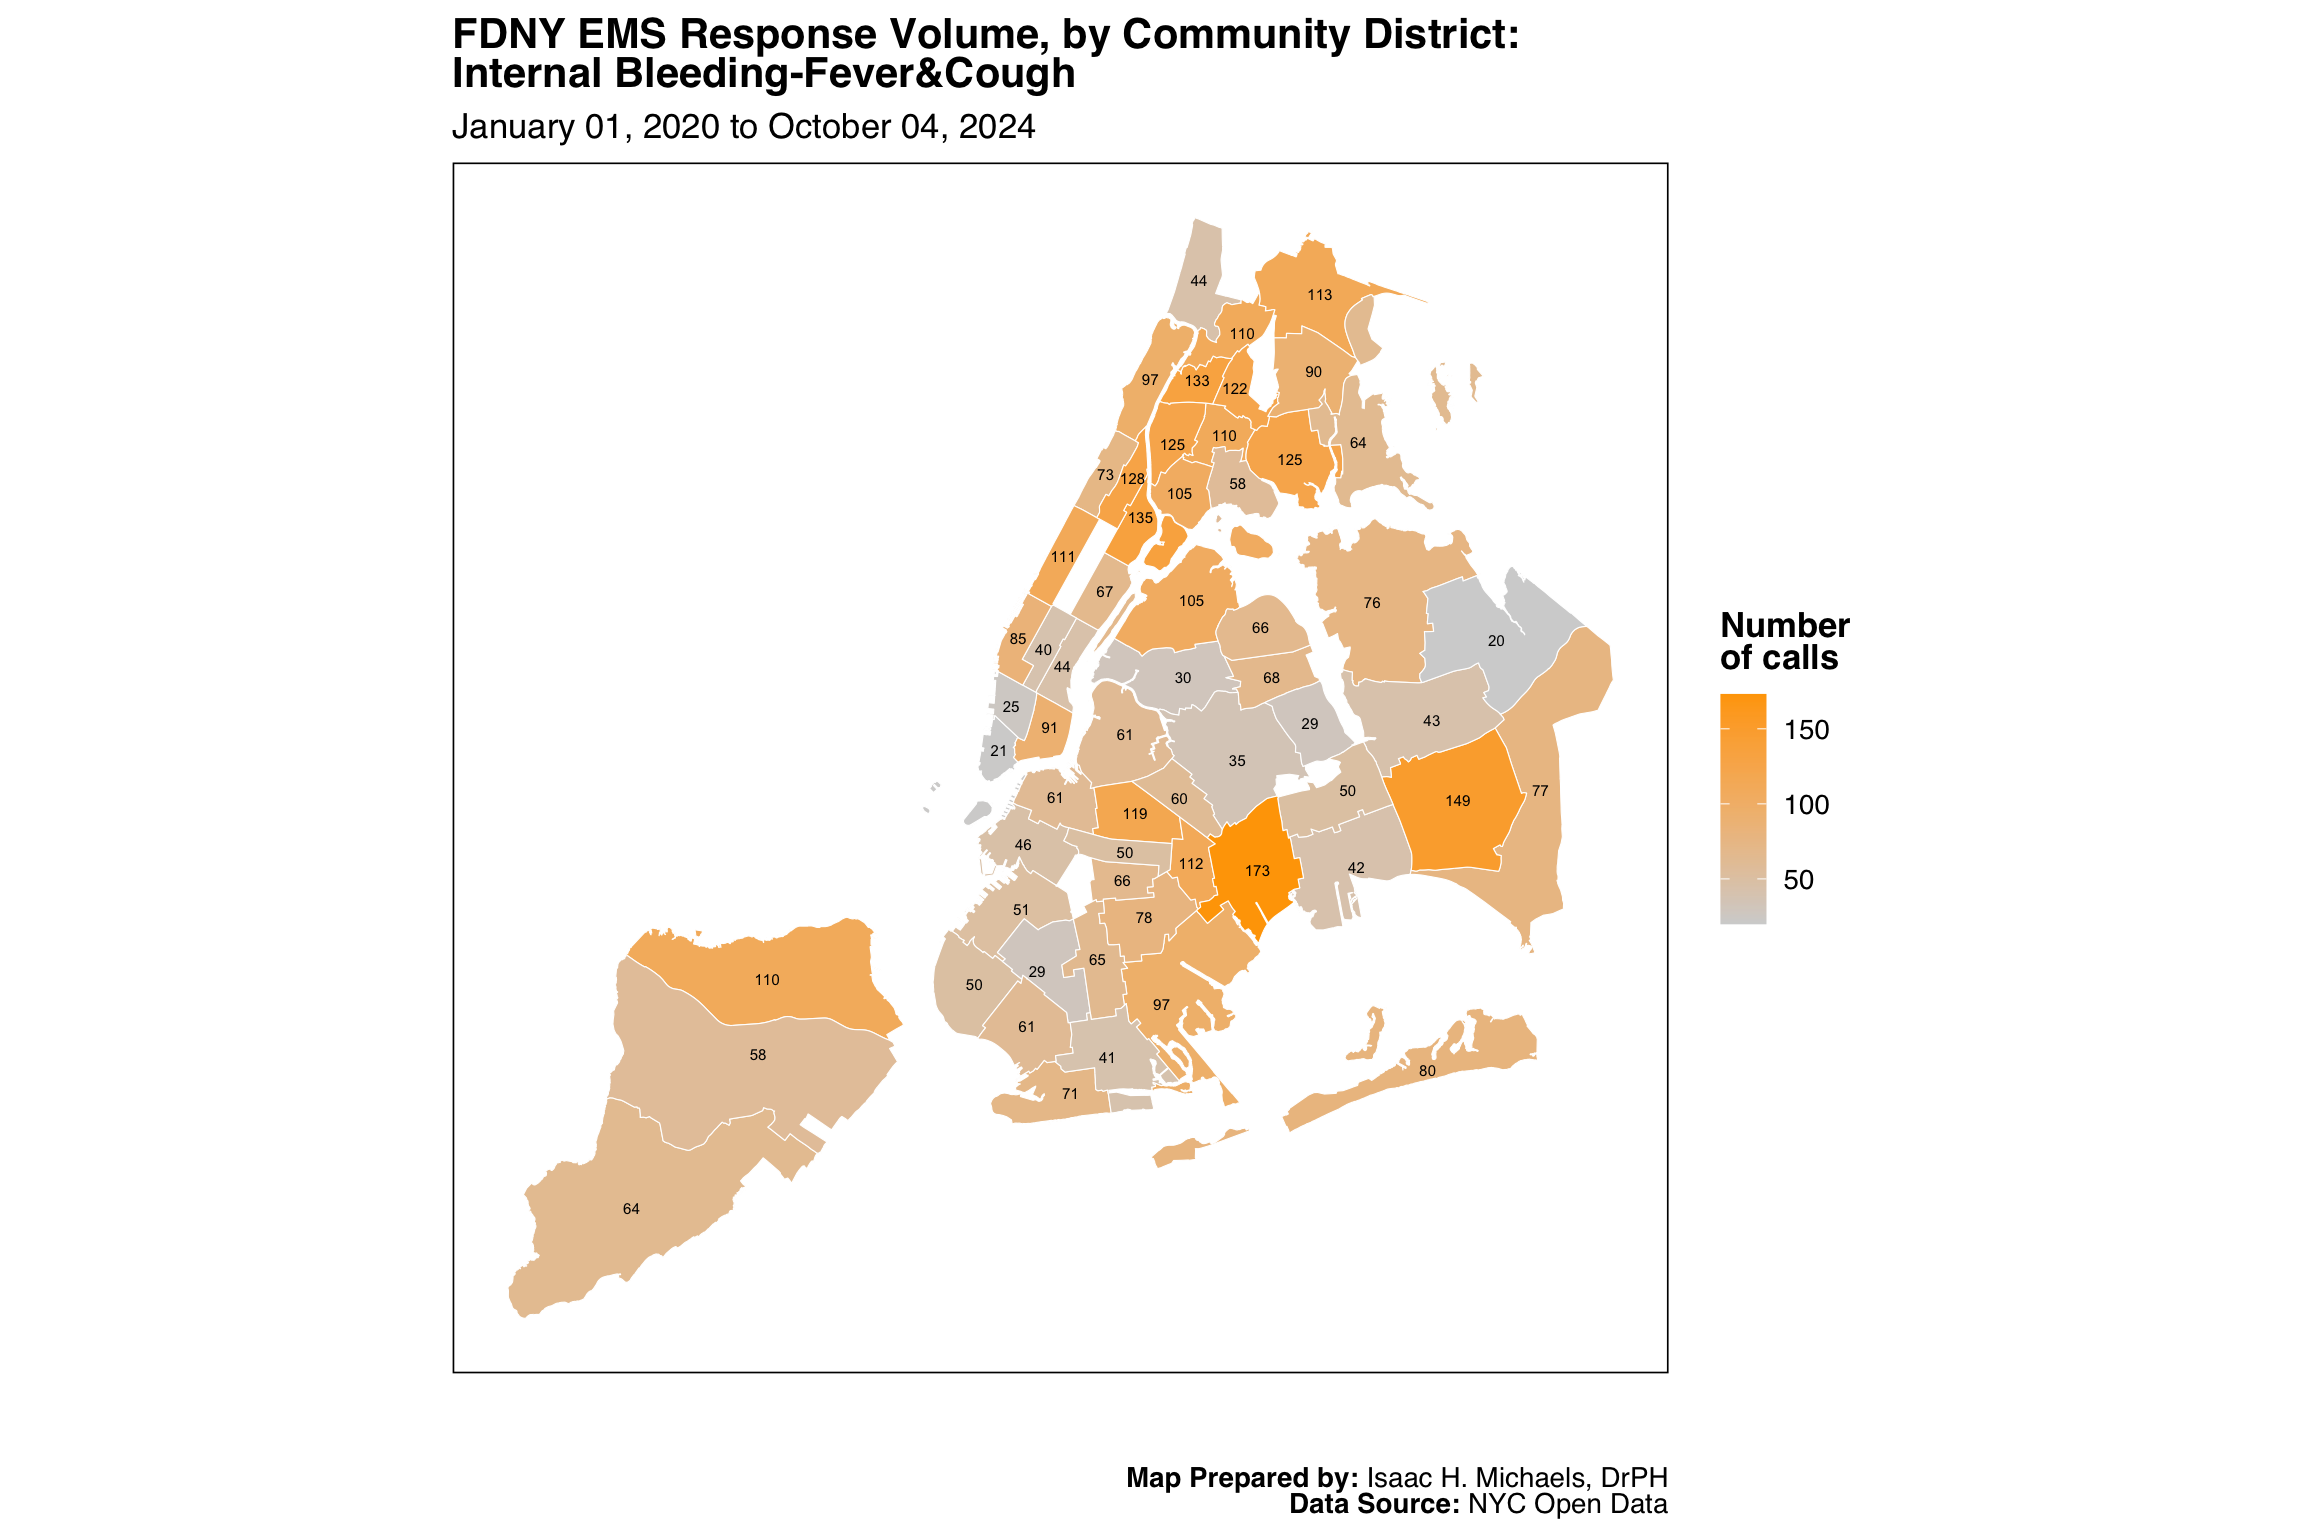
Map Prepared by: Isaac H. Michaels, DrPH
Data Source: NYC Open Data

Map Prepared by: Isaac H. Michaels, DrPH
EMS Data Source: NYC Open Data
Population Data Source: NYC Open Data
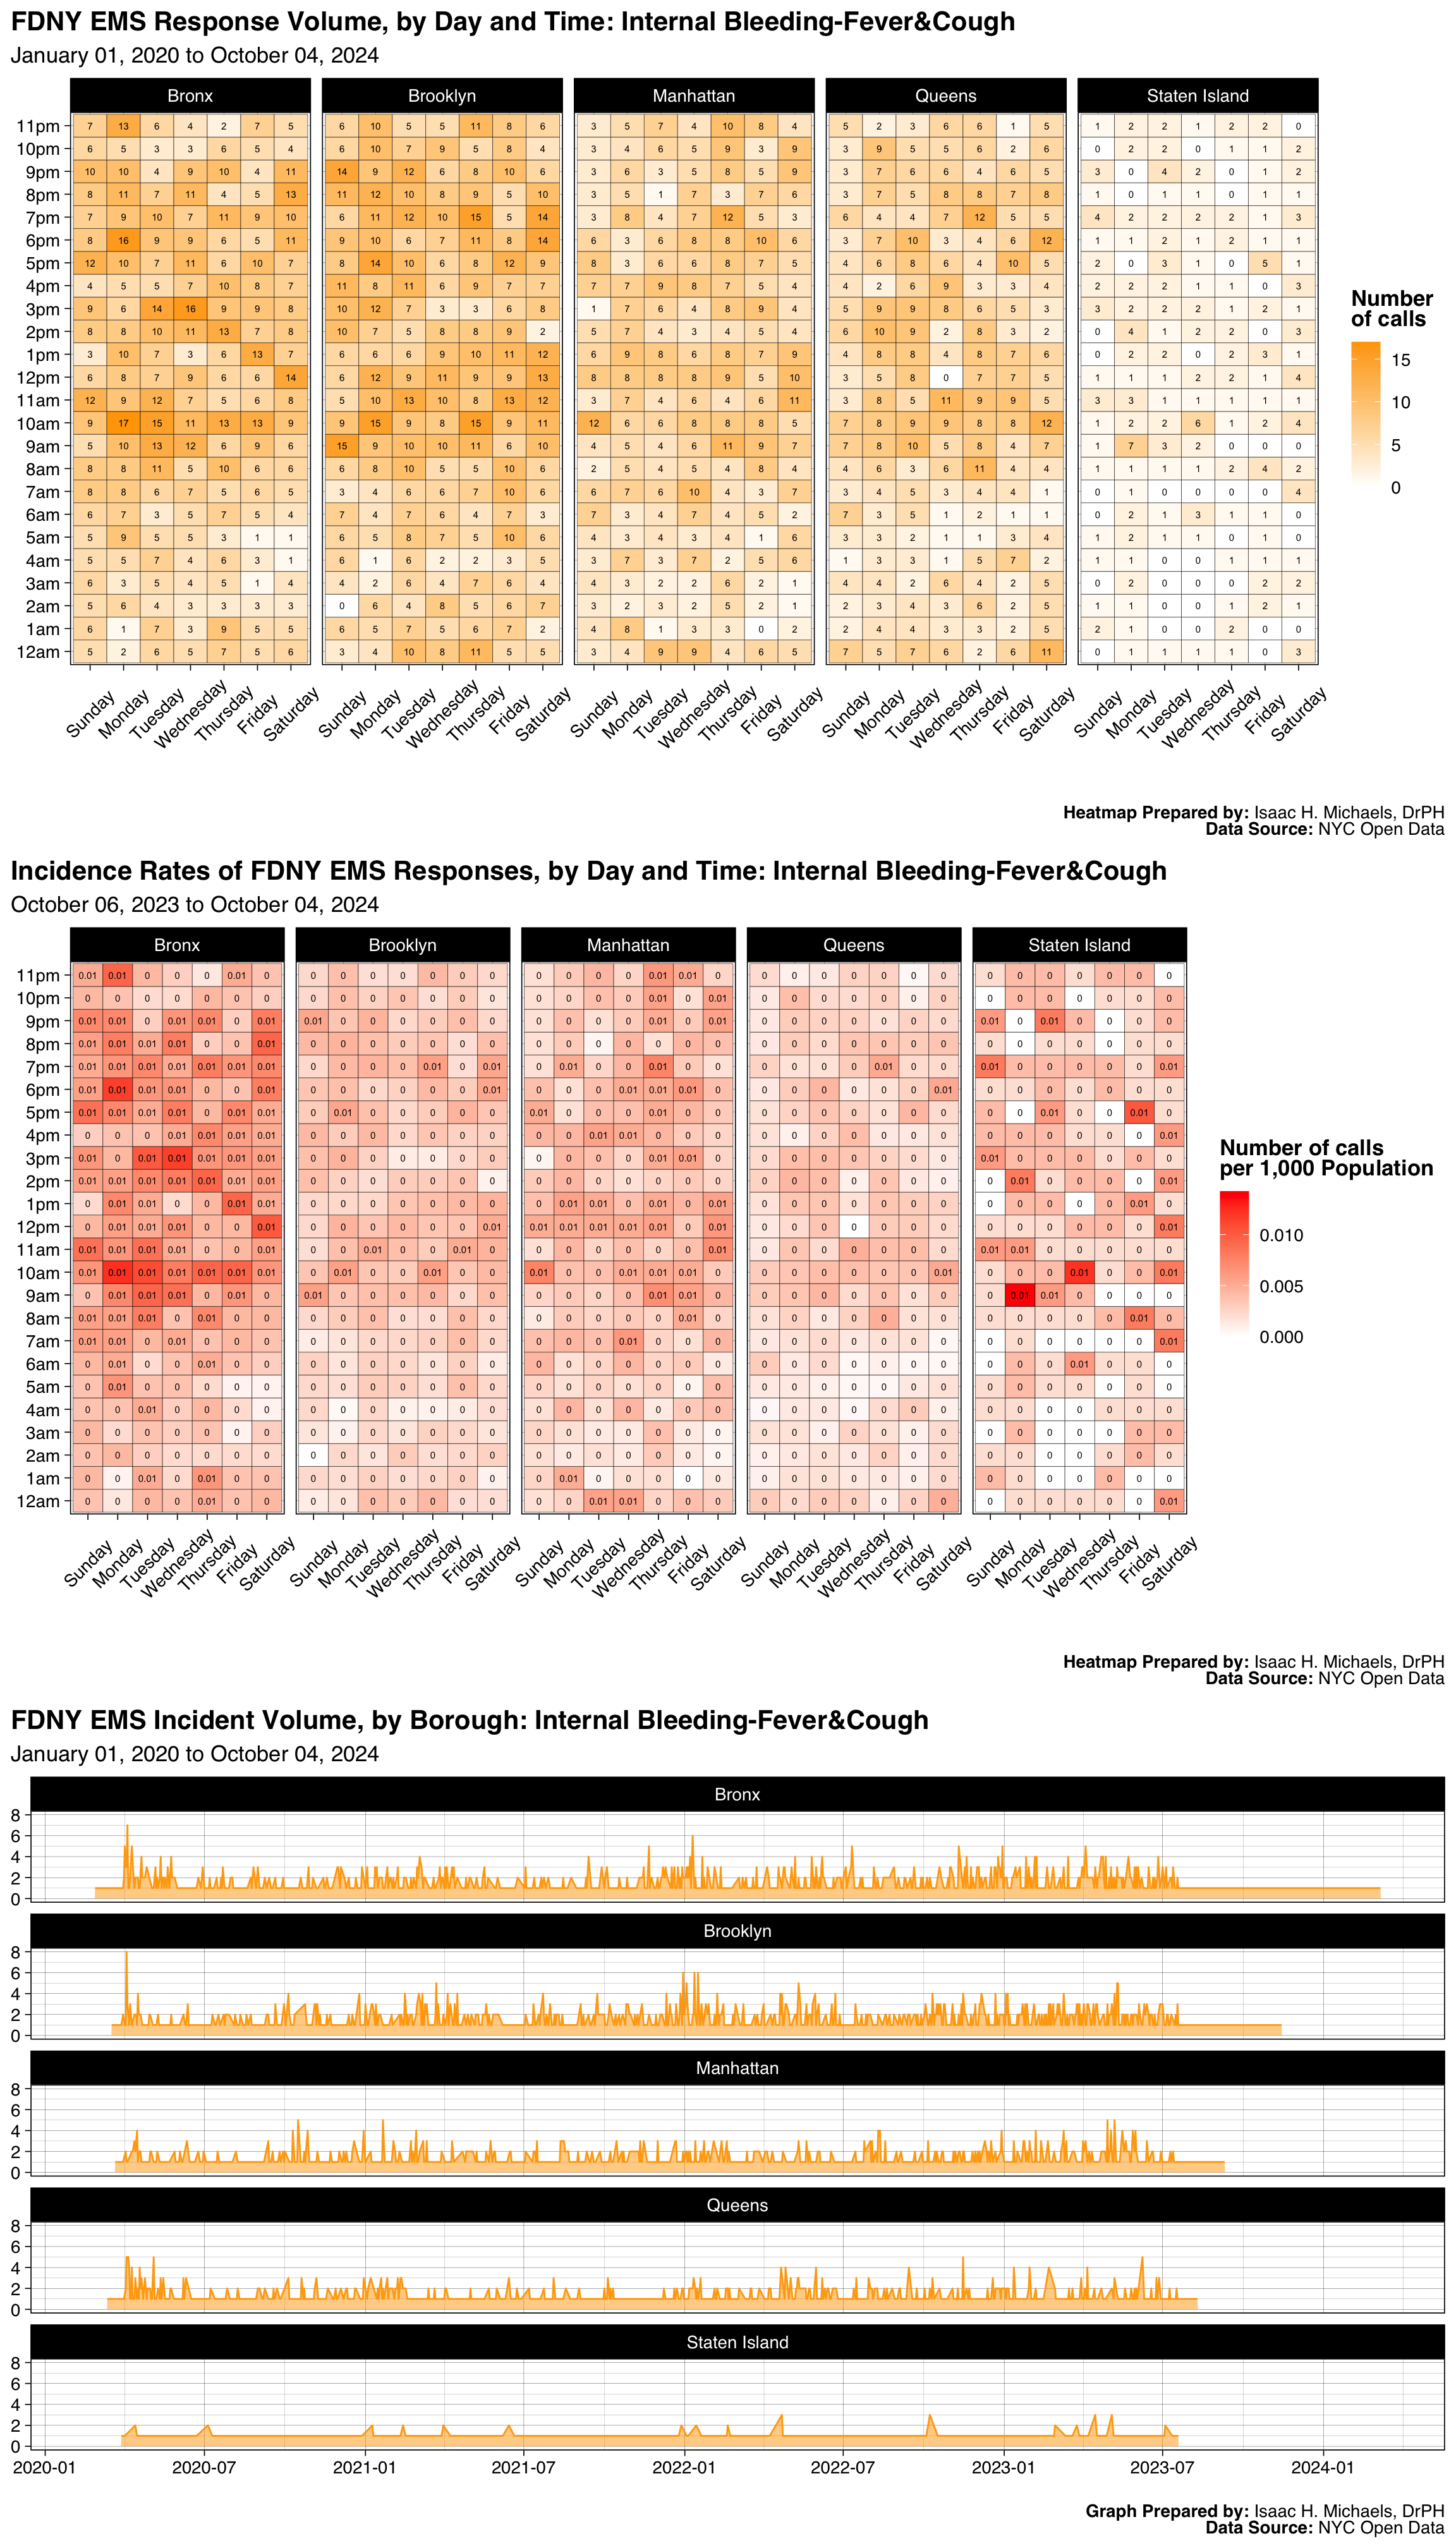
Graphs Prepared by: Isaac H. Michaels, DrPH
Data Source: NYC Open Data
| FDNY EMS Incident Volume, by Borough: Special Event |
||||||
| January 01, 2025 to July 01, 2026 | ||||||
| Borough |
Latest Year: 2026
|
All Years: 2025-2026
|
||||
|---|---|---|---|---|---|---|
| Incidents | % | Rate per 1,000 Population | Total Incidents | % | Monthly Trend | |
| Bronx | 2 | 3% | 0.0 | 5 | 4% | |
| Brooklyn | 22 | 35% | 0.0 | 31 | 27% | |
| Manhattan | 19 | 31% | 0.0 | 50 | 44% | |
| Queens | 17 | 27% | 0.0 | 21 | 18% | |
| Staten Island | 2 | 3% | 0.0 | 6 | 5% | |
| Table Prepred by: Isaac H. Michaels, DrPH | ||||||
| Data Source: NYC Open Data | ||||||
Table Prepared by: Isaac H. Michaels, DrPH
EMS Data Source: NYC Open Data
Population Data Source: Health Data NY
| FDNY EMS Incident Volume, by Severity Level: Special Event |
||||
| January 01, 2025 to July 01, 2026 | ||||
| Final Severity Level |
Latest Year: 2026
|
All Years: 2025-2026
|
||
|---|---|---|---|---|
| Incidents | % | Incidents | % | |
| 1 | 0 | 0% | 0 | 0% |
| 2 | 0 | 0% | 0 | 0% |
| 3 | 0 | 0% | 0 | 0% |
| 4 | 0 | 0% | 0 | 0% |
| 5 | 0 | 0% | 0 | 0% |
| 6 | 0 | 0% | 0 | 0% |
| 7 | 0 | 0% | 0 | 0% |
| 8 | 62 | 100% | 114 | 100% |
| Table Prepred by: Isaac H. Michaels, DrPH | ||||
| Data Source: NYC Open Data | ||||
Table Prepared by: Isaac H. Michaels, DrPH
Data Source: NYC Open Data
| FDNY EMS Incident Volume, by Disposition: Special Event |
||||
| January 01, 2025 to July 01, 2026 | ||||
| Disposition |
Latest Year: 2026
|
All Years: 2025-2026
|
||
|---|---|---|---|---|
| Incidents | % | Incidents | % | |
| Cancelled | 11 | 18% | 26 | 23% |
| Condition Corrected | 45 | 73% | 67 | 59% |
| Patient Gone on Arrival | 1 | 2% | 1 | 1% |
| Transporting Patient | 1 | 2% | 5 | 4% |
| Unfounded | 3 | 5% | 4 | 4% |
| NA | 1 | 2% | 4 | 4% |
| Table Prepred by: Isaac H. Michaels, DrPH | ||||
| Data Source: NYC Open Data | ||||
Table Prepared by: Isaac H. Michaels, DrPH
Data Source: NYC Open Data
Back to top
This executive summary was generated by an AI summarizer agent and reviewed by an editor agent. I review any summaries flagged for revision.↩︎