Data Visualization: Physical Inactivity and Heart Disease Mortality among Texas Counties

September 1, 2019
Texas Chronic Disease Physical Activity Heart Disease Data Visualization


Description: Data visualization by Isaac H. Michaels, MPH showing county-level data on physical inactivity and heart disease mortality in Texas. Distributions are presented geographically (maps), univariately (histograms), and bivariately (scatter plot). The county-level association between physical inactivity and heart disease mortality is presented by reporting and visualizing a simple linear regression model. The dataset was provided by the American Heart Association. This was entered as a static visualization in the student division for the Heart of Texas Data Visualization Contest at the 2019 Healthier Texas Summit.


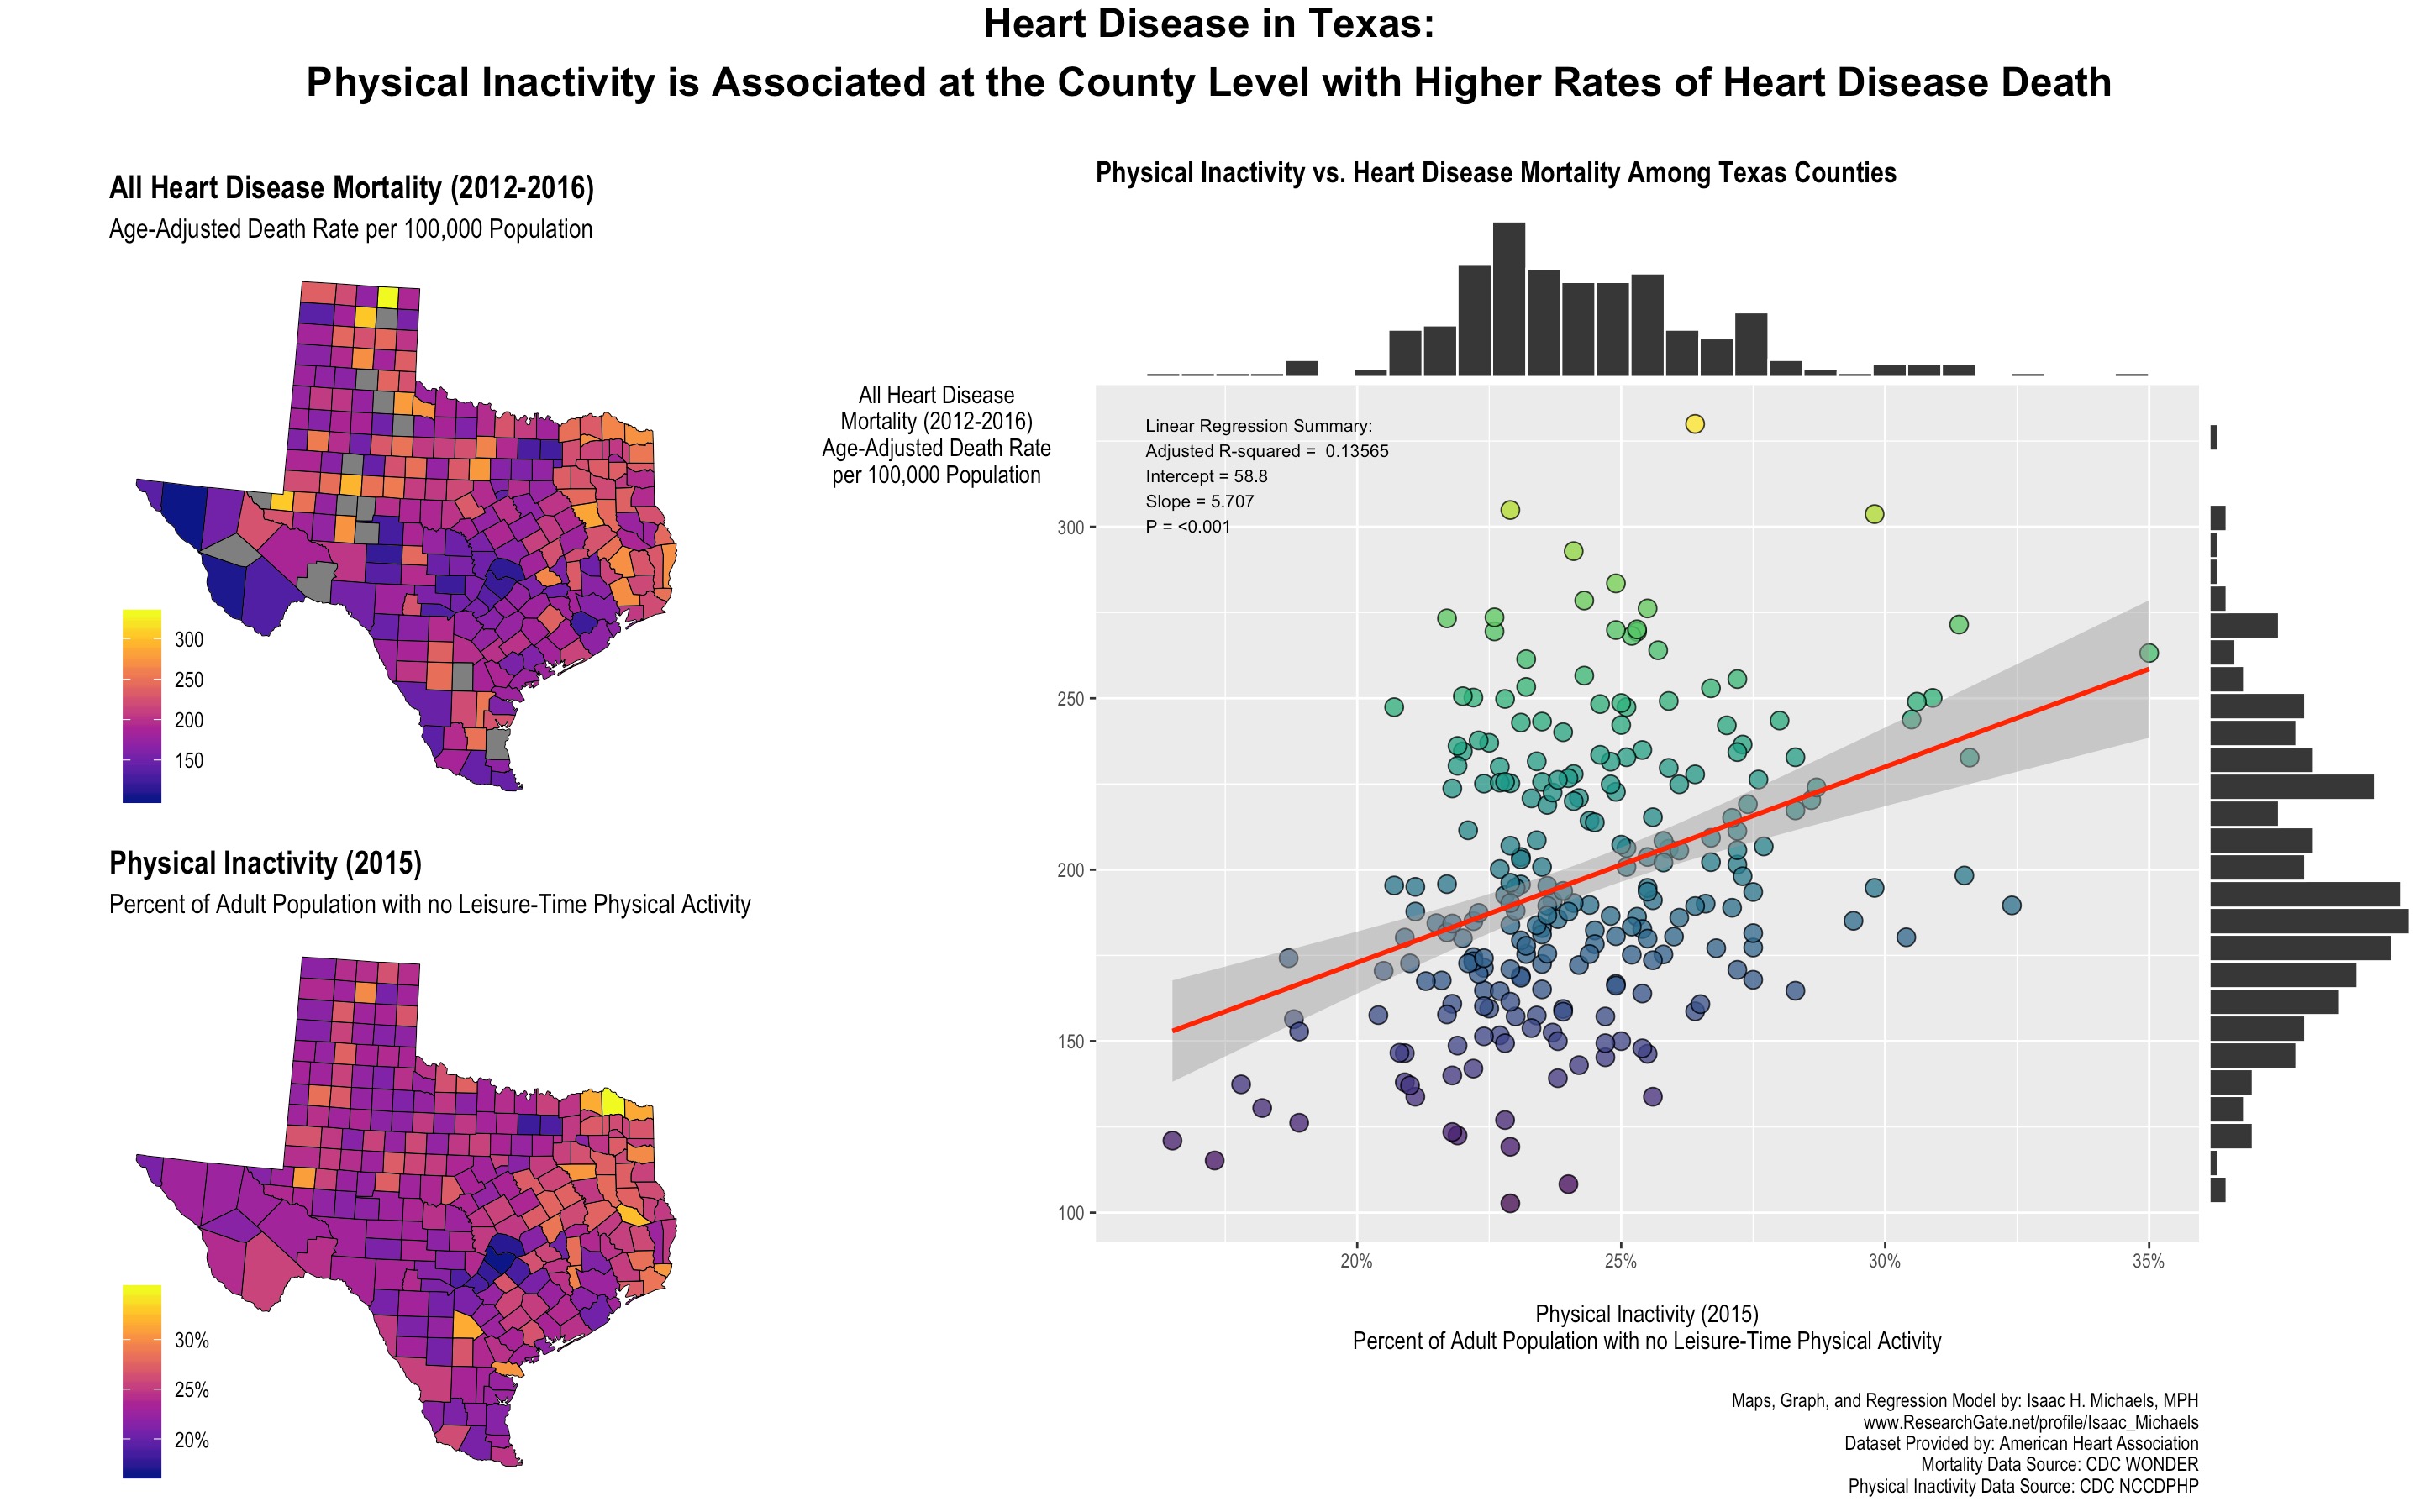
Maps, Graphs, and Regression Model by: Isaac H. Michaels, MPH
Dataset Provided by: American Heart Association


Baseball Season Tracking Analysis

April 14, 2026
Baseball Sports Data Visualization

Explore my detailed MLB season insights through interactive visualizations and data tables. I’ve included animations of cumulative wins, trend graphs, scatter plots of runs scored vs. runs allowed, and bar graphs of run differentials. Updated daily during baseball season, this page provides a compre…

Read more →

Basketball Season Tracking Analysis

April 14, 2026
Basketball Sports Data Visualization

Discover my in-depth NBA season analysis with dynamic visualizations and data tables. This page features animations of cumulative wins, trend graphs, scatter plots of points scored vs. points allowed, and bar graphs of point differentials. Regularly updated during basketball season, it offers a thor…

Read more →

New York Flu Watch: Real-Time Tracking and Analysis of Influenza Data

April 10, 2026
New York State New York City Influenza Communicable Diseases Epidemiology Data Visualization

Explore the New York Flu Watch, a comprehensive real-time tracker for influenza data across New York State and New York City. Updated routinely, this tool offers detailed insights into laboratory-confirmed cases, emergency department visits, hospitalizations, and flu vaccination coverage. Developed …

Read more →