Published: January 5, 2020
Updated: May 29, 2026 at 03:58PM
Background
Shooting incidents have long been a significant public safety concern in New York City. According to data from the New York City Police Department (NYPD), the number of shooting incidents in the city has fluctuated over time, with some years seeing higher levels of gun violence than others. In recent years, there has been a general trend of declining shooting incidents in the city, though there have been some spikes in certain years, such as in 2020 and 2021.
In addition to the overall number of shooting incidents, there are also significant disparities in the distribution of gun violence across different neighborhoods and boroughs in the city. Some neighborhoods and boroughs have consistently higher rates of shooting incidents than others, and these patterns of violence often disproportionately affect marginalized and low-income communities.
Understanding the patterns and trends of shooting incidents in New York City is crucial for developing effective strategies to address and prevent such incidents. By analyzing data on shooting incidents in the city, we can gain insights into the factors that contribute to gun violence and identify opportunities for intervention.
Data Overview
The data on this website is sourced from the NYPD Shooting Incident Data (Year To Date) and covers shooting incidents in New York City from 2006 to the present. The data includes information on the location, date, and time of the incident, as well as age, gender, and race/ethnicity for both perpetrators and victims. This data is manually extracted every quarter and reviewed by the Office of Management Analysis and Planning before being posted on the NYPD website.
How to Use These Data
On this website, you can explore the data through various visualizations, including a citywide point map, trend graphs, heat maps, bar graphs, and borough-specific maps. These visualizations allow you to easily identify patterns and trends in the data, such as the number of incidents by year, month, weekday, and hour, as well as the characteristics of both the perpetrators and victims.
Why These Data are Important
Understanding the patterns and trends of shooting incidents in New York City is crucial for informing public health practice and crime prevention efforts. By analyzing the data, we can identify high-risk areas, times, and populations and target interventions accordingly. Additionally, understanding the characteristics of both the perpetrators and victims can help us address underlying social determinants of health that contribute to violence.
Implications for Public Health Practice
The data on this website can be used by public health practitioners, policymakers, and community leaders to develop and implement evidence-based interventions to reduce the incidence of shootings in New York City. By identifying high-risk areas, times, and populations, interventions can be targeted to specific locations and populations, and be tailored to address the underlying social determinants of health that contribute to violence. Additionally, by understanding the characteristics of both the perpetrators and victims, interventions can also be tailored to address the specific needs of these groups.
Key Takeaways
The findings of this analysis of shooting incidents in New York City have several important implications for understanding and addressing gun violence in the city. Some key points to consider include:
- The overall trend of declining shooting incidents in the city in recent years is encouraging, but there have been some spikes in certain years that warrant further examination. Understanding the factors that contribute to these spikes in gun violence could help inform interventions and prevention efforts.
- Disparities in the distribution of shooting incidents across different neighborhoods and boroughs suggest that gun violence is not evenly distributed throughout the city. Targeting interventions and prevention efforts in areas with higher rates of gun violence may be particularly effective in reducing the overall incidence of shooting incidents.
- Examining the characteristics of shooting incidents, such as the location type and whether the shooting resulted in a victim’s death, can provide insights into the nature of gun violence in the city. For example, understanding the types of locations where shootings are more likely to occur could inform strategies for preventing such incidents.
- Analyzing the demographics of suspects and victims can also shed light on the factors that may contribute to gun violence in the city. For example, examining the relationship between perpetrator and victim characteristics (e.g. gender, race/ethnicity) can help identify patterns and trends that could inform targeted interventions.
Overall, this analysis provides a detailed and nuanced understanding of shooting incidents in New York City, and can inform efforts to address and prevent such incidents from occurring in the future.
Citywide Data
Maps
Interactive
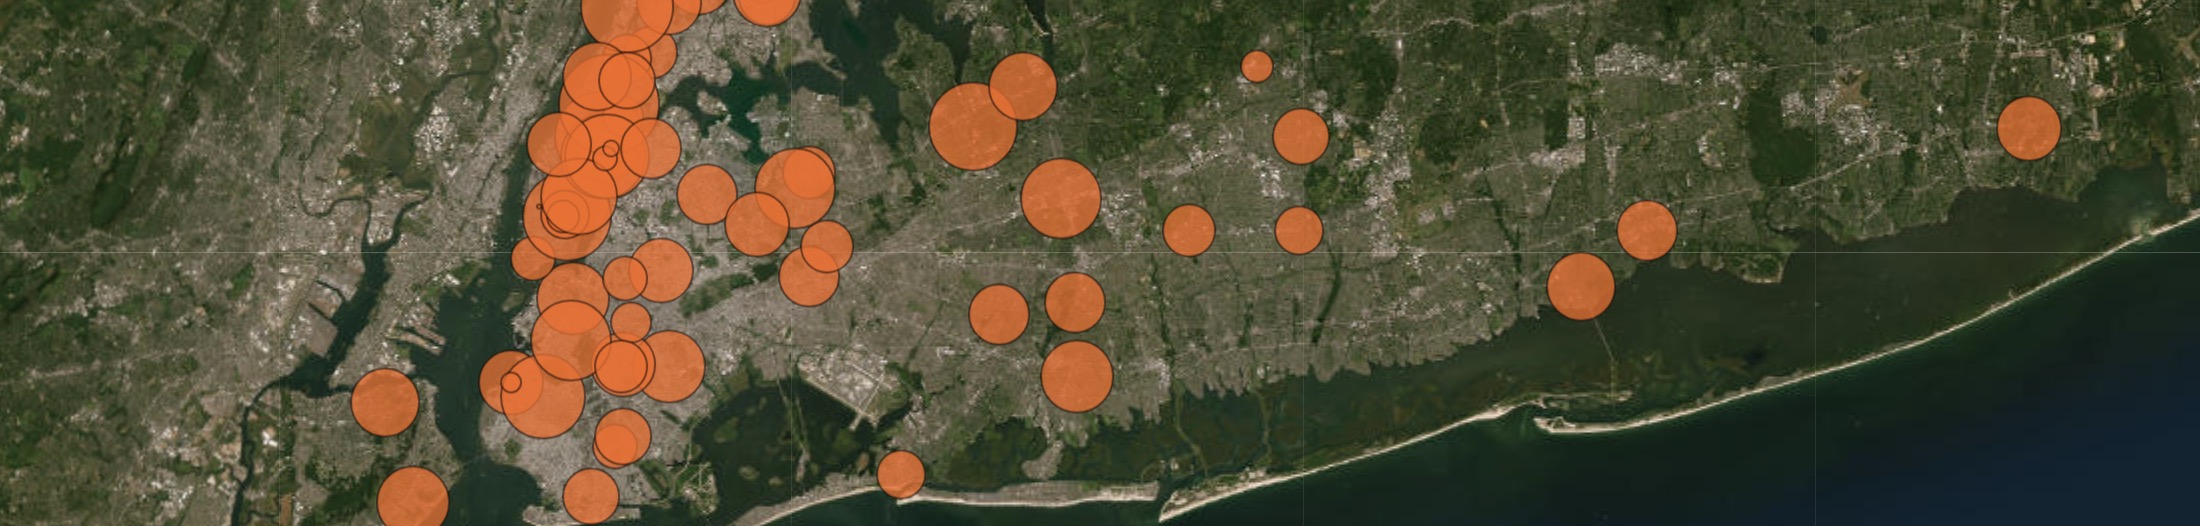
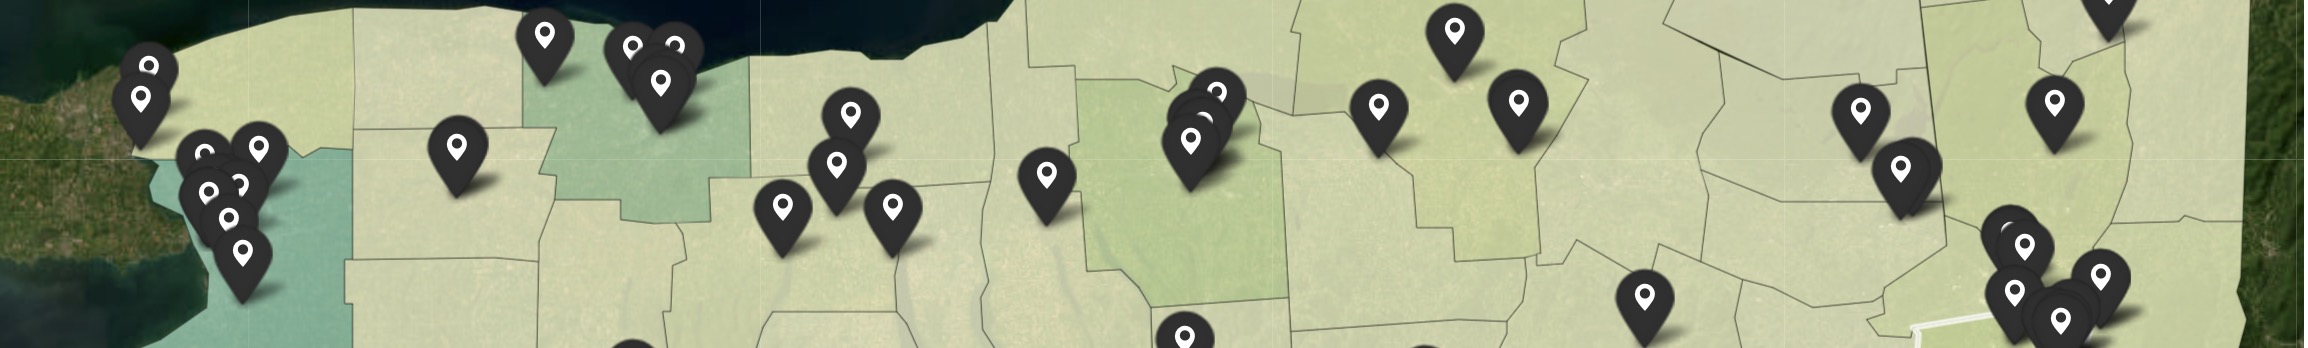
This interactive map provides you with a highly granular, street-level visualization of shooting incidents across New York City. By zooming into specific neighborhoods, intersections, or public spaces, you can identify geospatial micro-clusters of violence that may be obscured in broader aggregate data. Clicking on an individual data point reveals a tooltip containing the incident’s date, time, specific location description, outcome, and the recorded demographics for all involved victims and perpetrators. You can use this functionality to understand the immediate environmental context of specific incidents and guide highly localized public safety interventions.
Map Prepared By: Isaac H. Michaels, DrPH
Data Source: NYC Open Data (Current, Historical)
Static
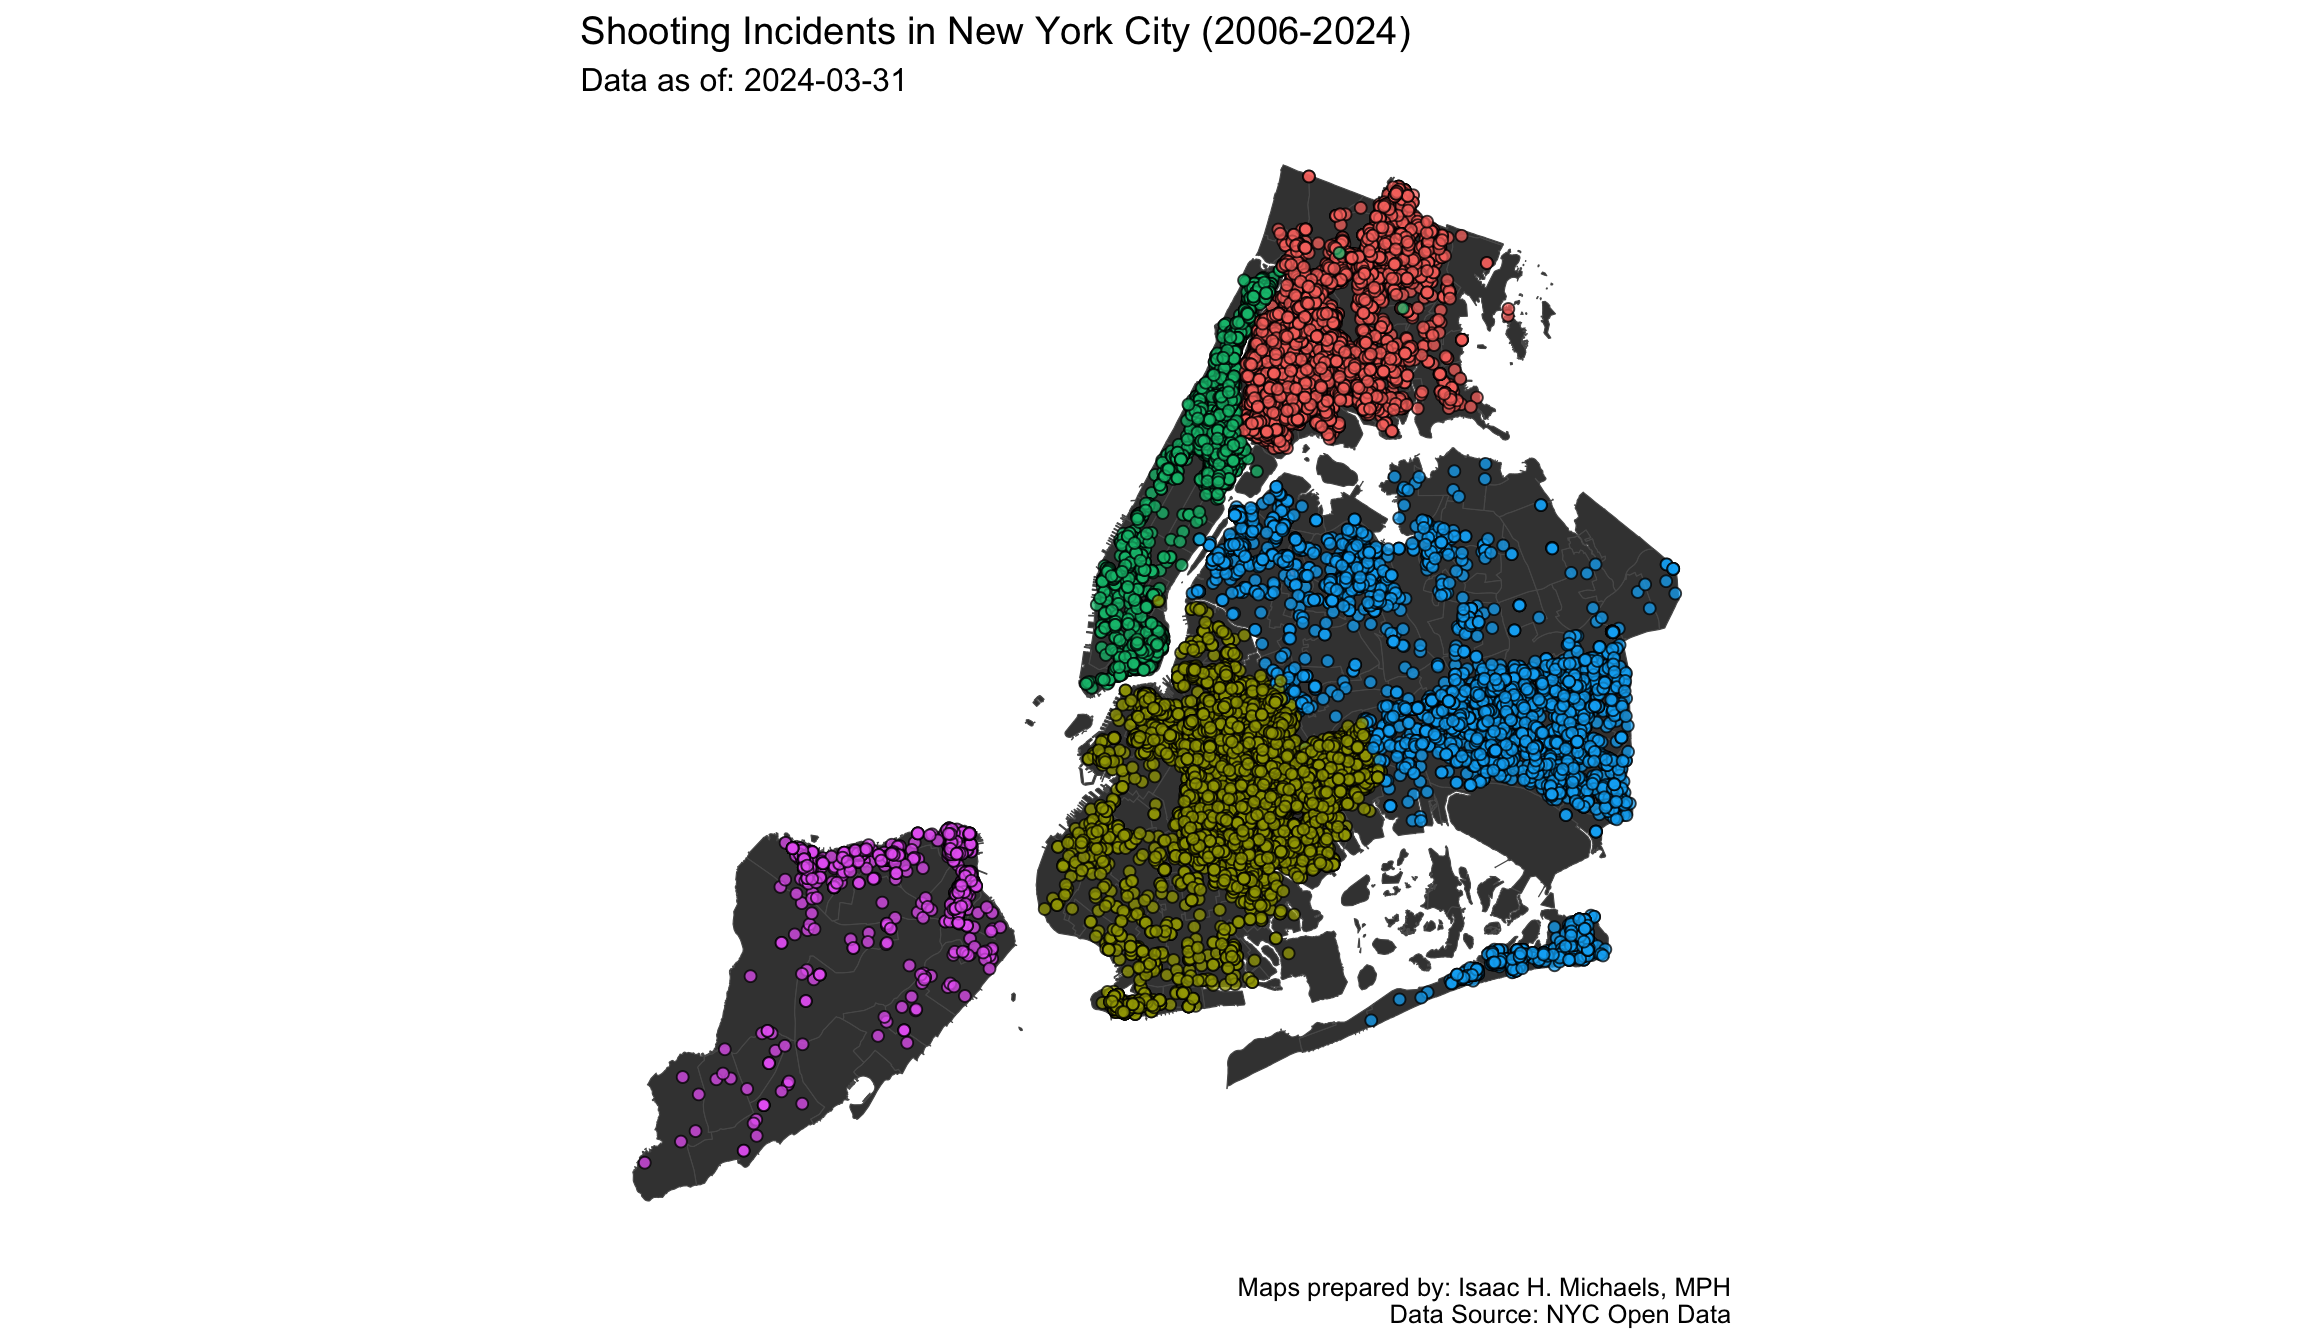
This static point-density map offers you a high-level, aggregate view of geospatial distribution across the city’s Neighborhood Tabulation Areas (NTAs). Because overlapping incidents create a denser, darker visual footprint on the map, this visualization serves as an immediate indicator of historical concentration. You can refer to this map to quickly identify macro-level geographic disparities, highlighting the specific regions and precincts that consistently shoulder the heaviest burden of gun violence over the dataset’s entire lifespan.
 Map Prepared By: Isaac H. Michaels, DrPH
Data Source: NYC Open Data (Current, Historical)
Trend
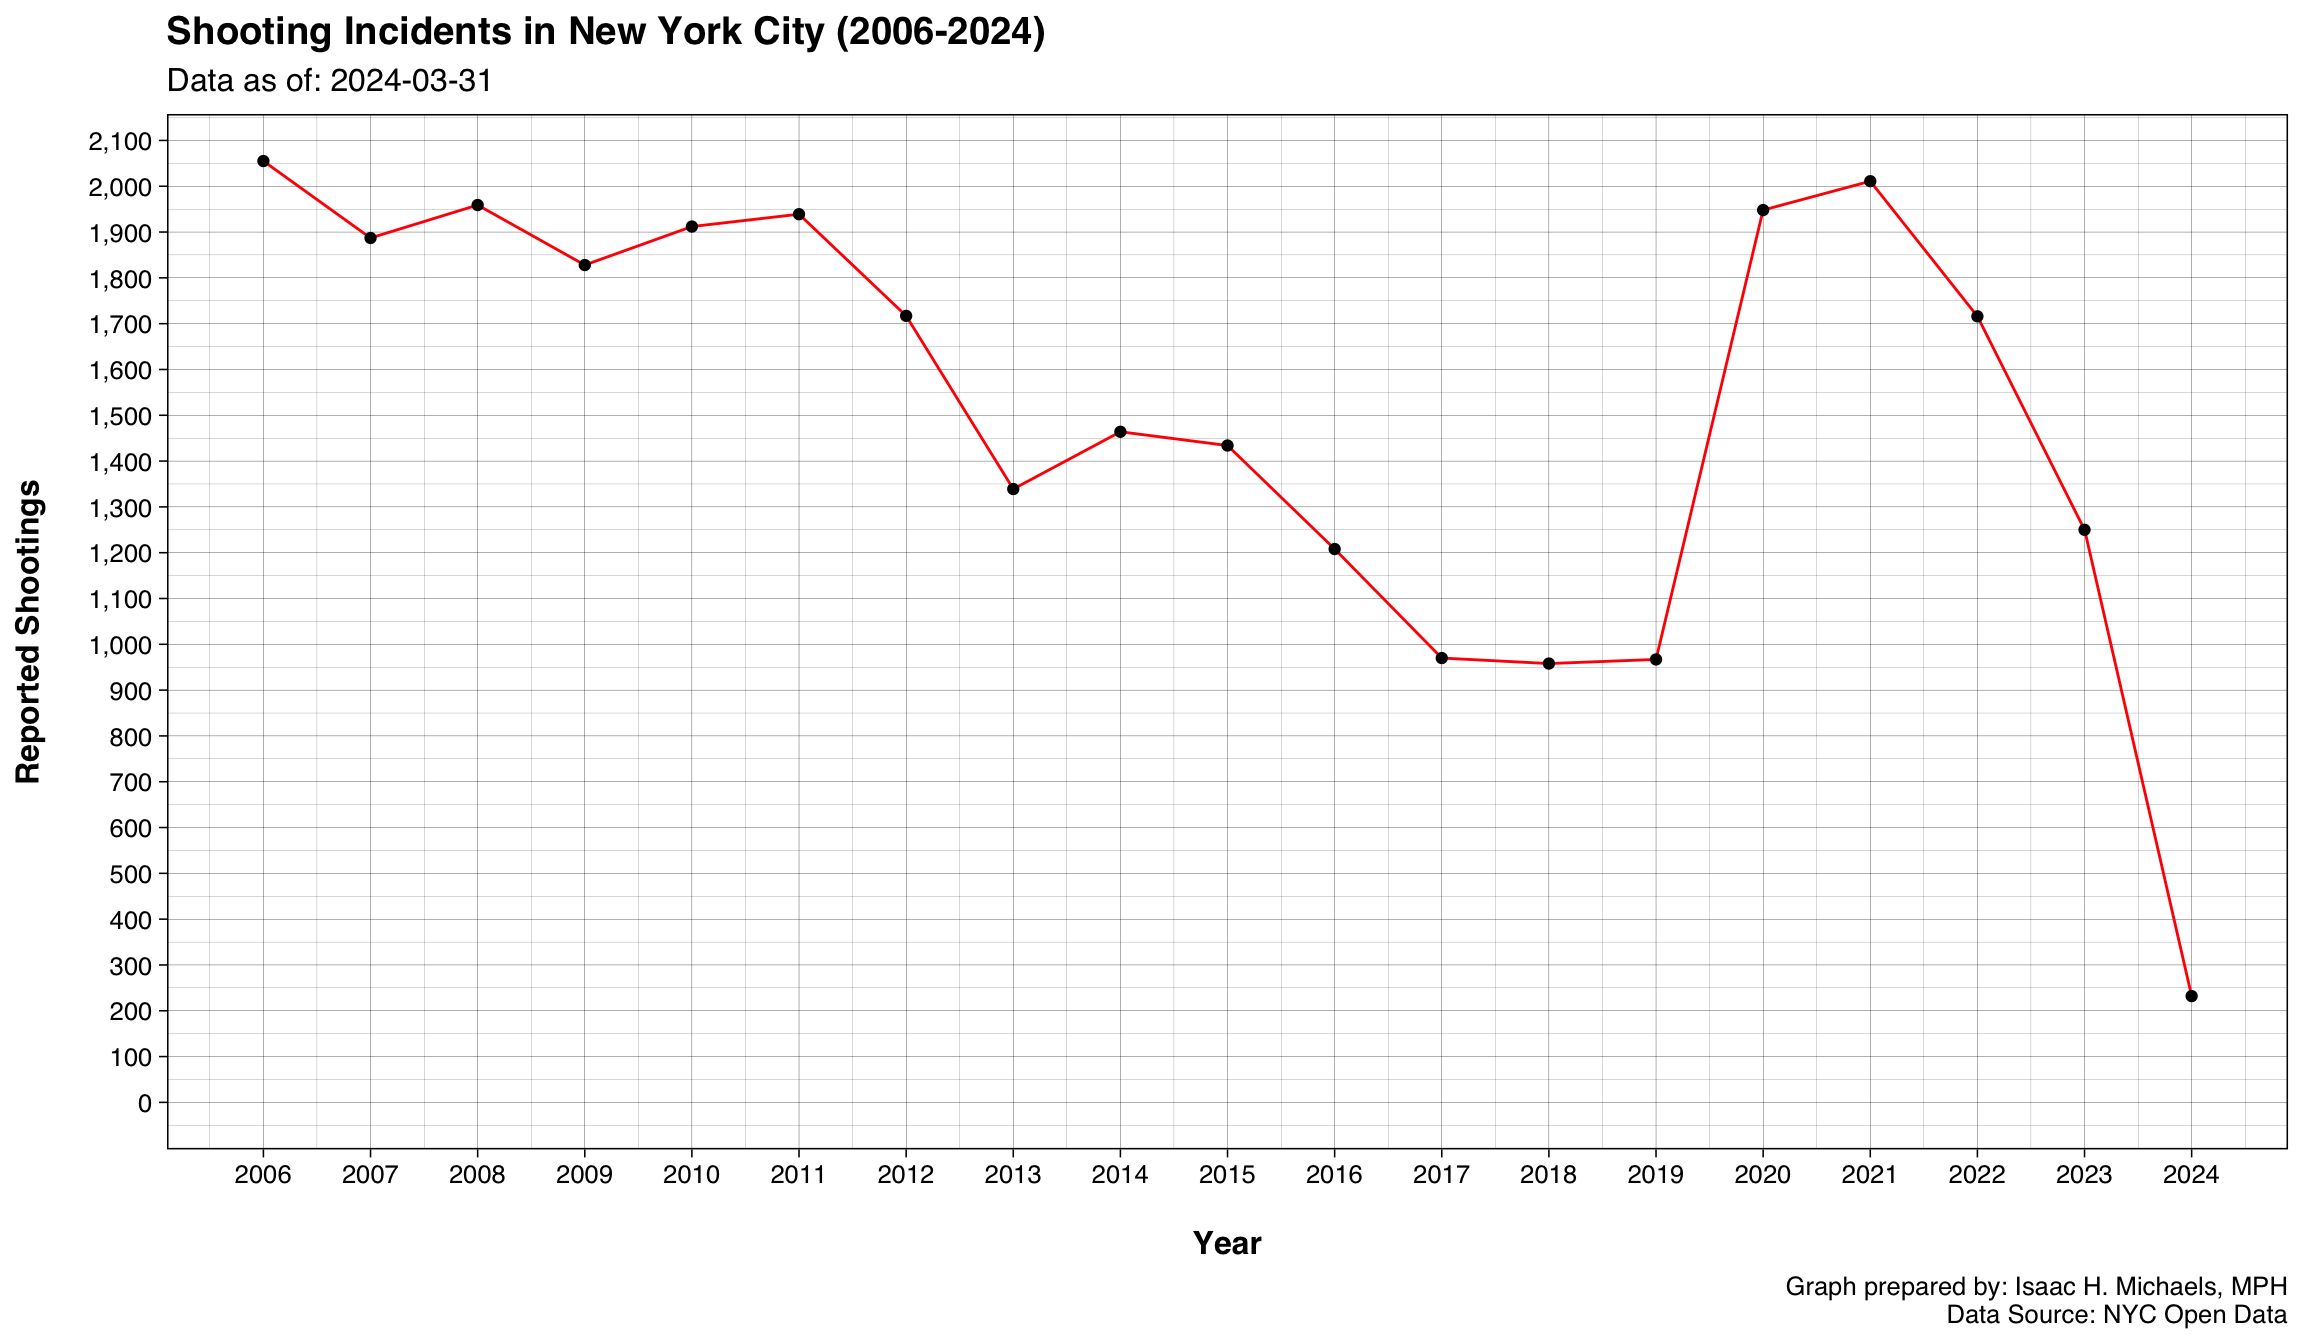
This trend graph and the accompanying table track the longitudinal volume of shooting incidents in New York City from 2006 to the present. By examining structural inflection points in the trend line, you can evaluate the macro-trajectory of gun violence to determine whether incidents are trending downward over the long term or exhibiting distinct multi-year spikes. To ensure you do not misinterpret a mid-year data drop as a sudden decline in violence, the final calendar year is visually separated by a dashed line segment, a hollow data point, and a corresponding footnote indicating an incomplete, year-to-date total.
 Graph Prepared By: Isaac H. Michaels, DrPH
Data Source: NYC Open Data (Current, Historical)
| Shooting Incidents in New York City | |
| Total incidents by year (2006 - 2026) | |
| Year | Reported Shootings |
|---|---|
| 2006 | 1,566 |
| 2007 | 1,442 |
| 2008 | 1,520 |
| 2009 | 1,420 |
| 2010 | 1,473 |
| 2011 | 1,510 |
| 2012 | 1,373 |
| 2013 | 1,103 |
| 2014 | 1,172 |
| 2015 | 1,138 |
| 2016 | 997 |
| 2017 | 789 |
| 2018 | 754 |
| 2019 | 777 |
| 2020 | 1,532 |
| 2021 | 1,562 |
| 2022 | 1,294 |
| 2023 | 974 |
| 2024 | 904 |
| 2025 | 688 |
| 20261 | 139 |
| Data as of: 2026-03-31 | Data Source: NYC Open Data | Table prepared by: Isaac H. Michaels, DrPH | |
| 1 Indicates an incomplete, year-to-date total. | |
Table Prepared By: Isaac H. Michaels, DrPH
Data Source: NYC Open Data (Current, Historical)
Months
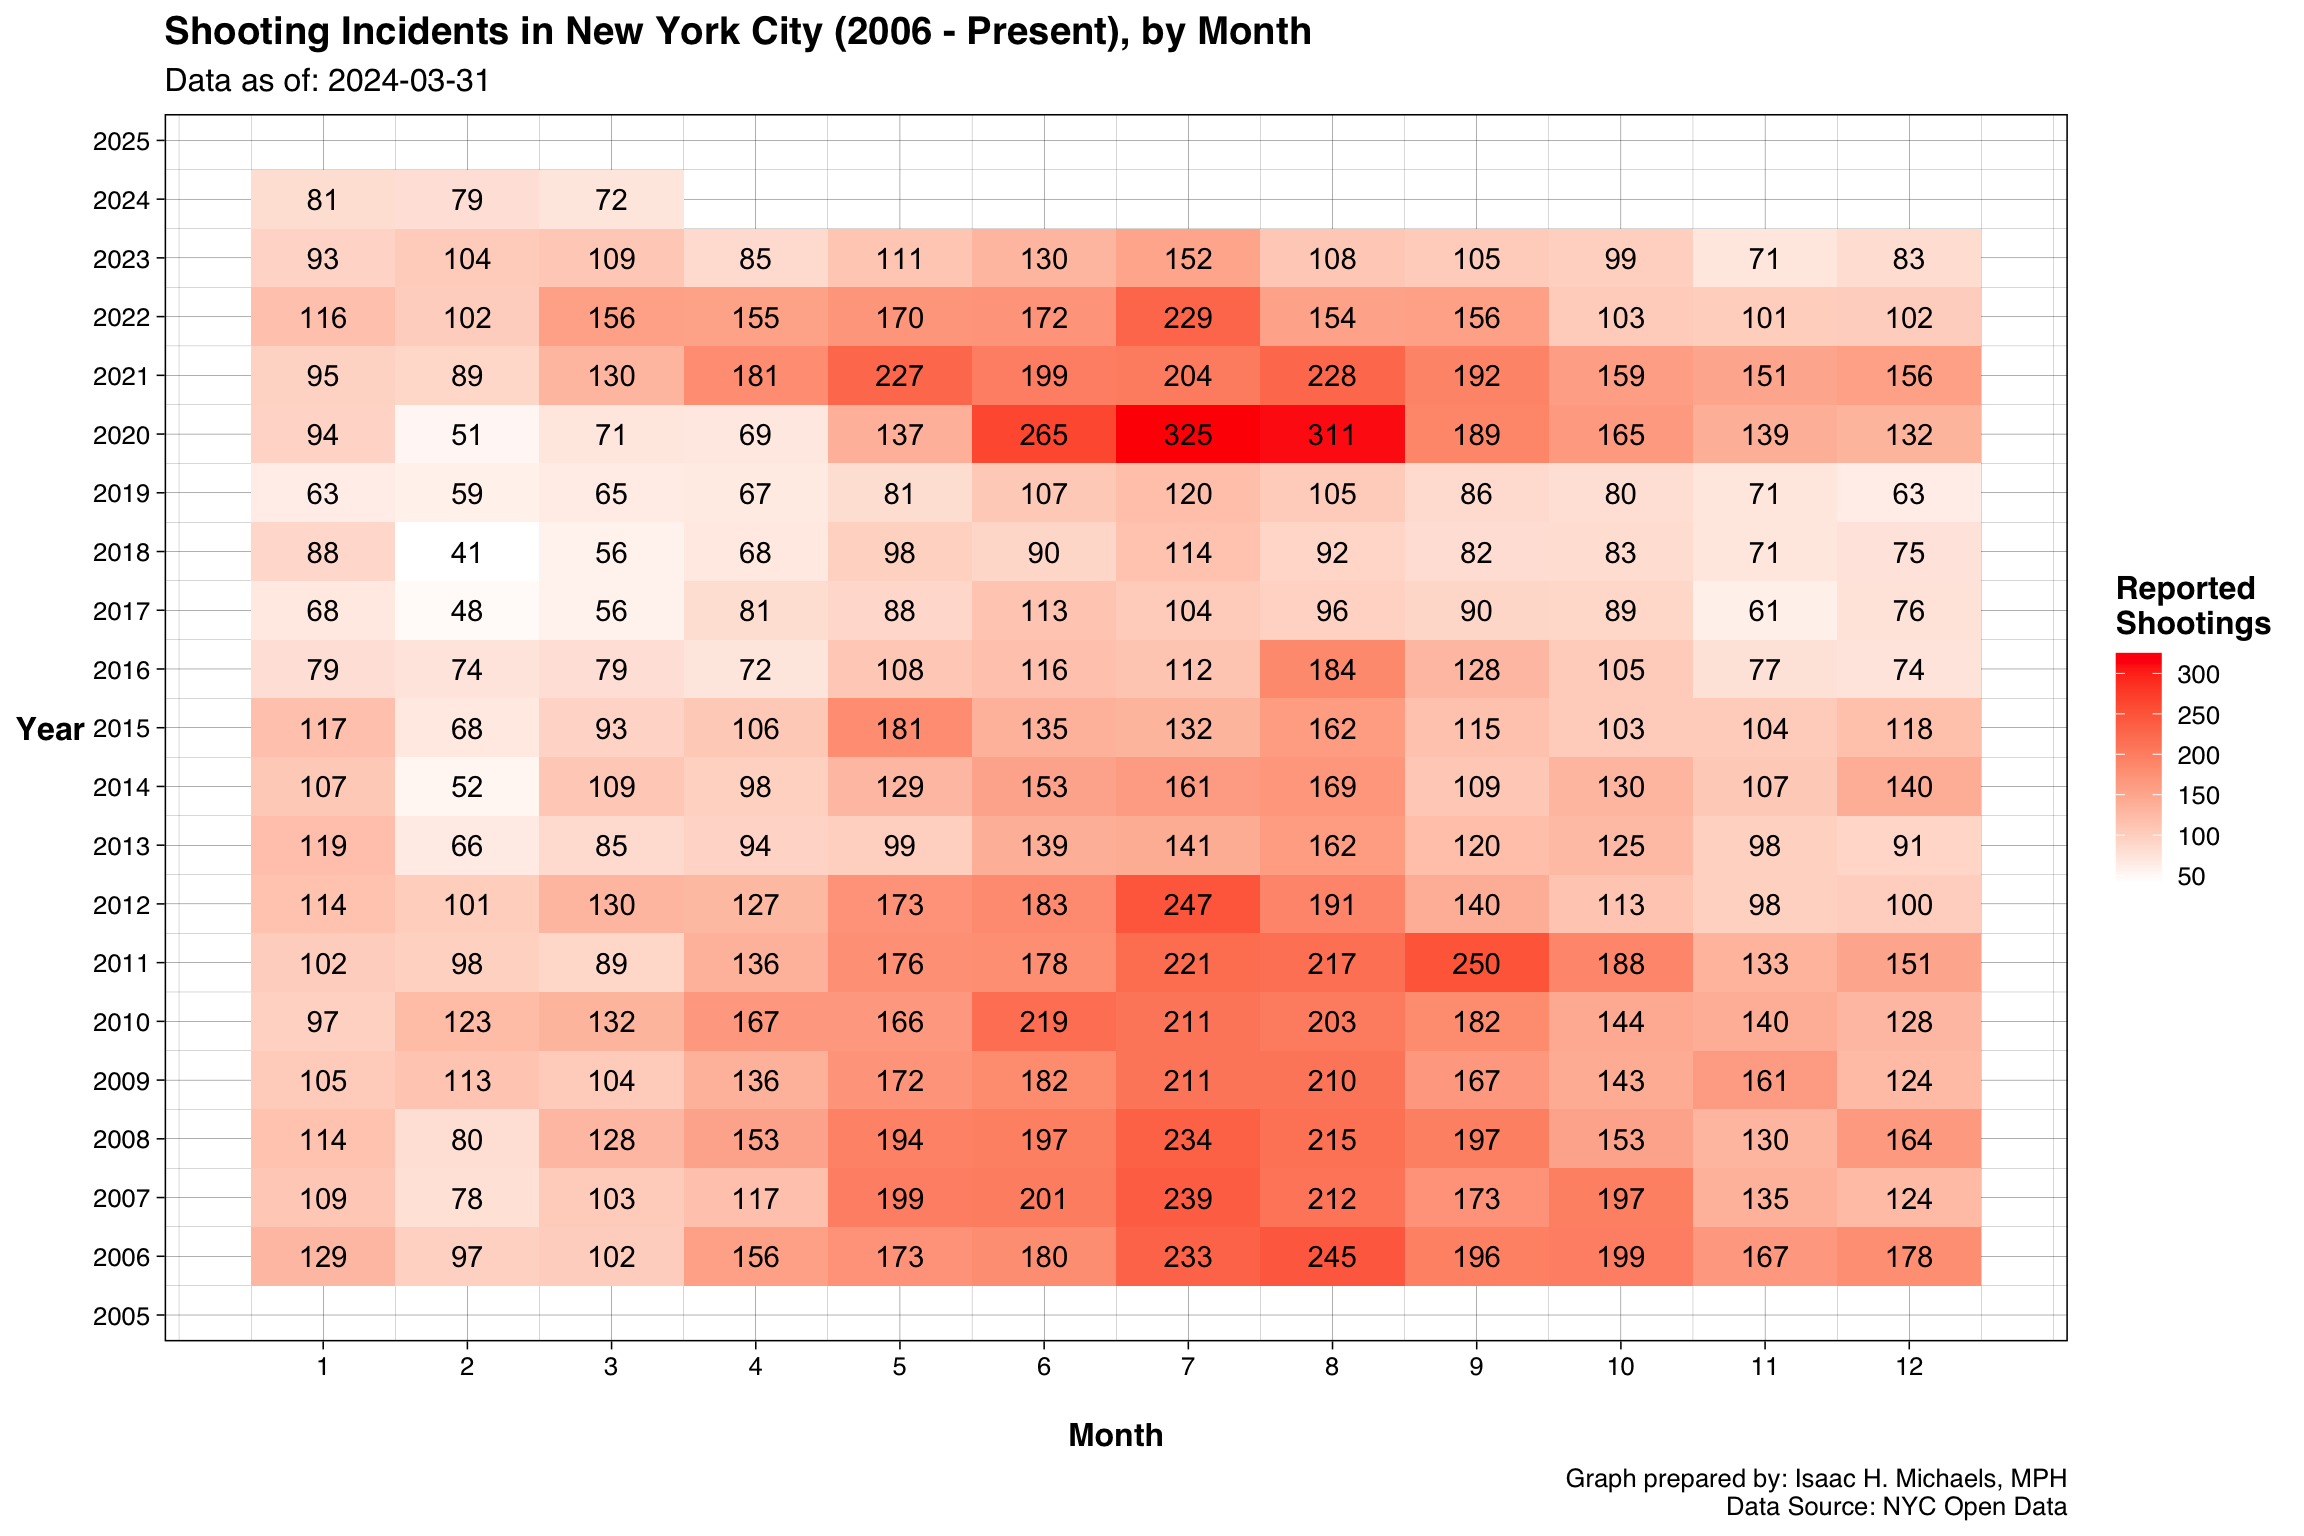
This heatmap visualizes the seasonality of gun violence by aggregating historical incidents by year and month. The vertical axis represents the years, while the horizontal axis displays the months, with darker shades of red indicating a higher volume of incidents. You can scan vertically down a specific month to determine if it consistently experiences elevated violence across different years, or scan horizontally across a single year to identify the seasonal peak of that specific timeframe. You may find these emerging seasonal patterns particularly useful for timing the deployment of interventions, such as summer youth programs or targeted community outreach.
 Graph Prepared By: Isaac H. Michaels, DrPH
Data Source: NYC Open Data (Current, Historical)
Weekdays and Times
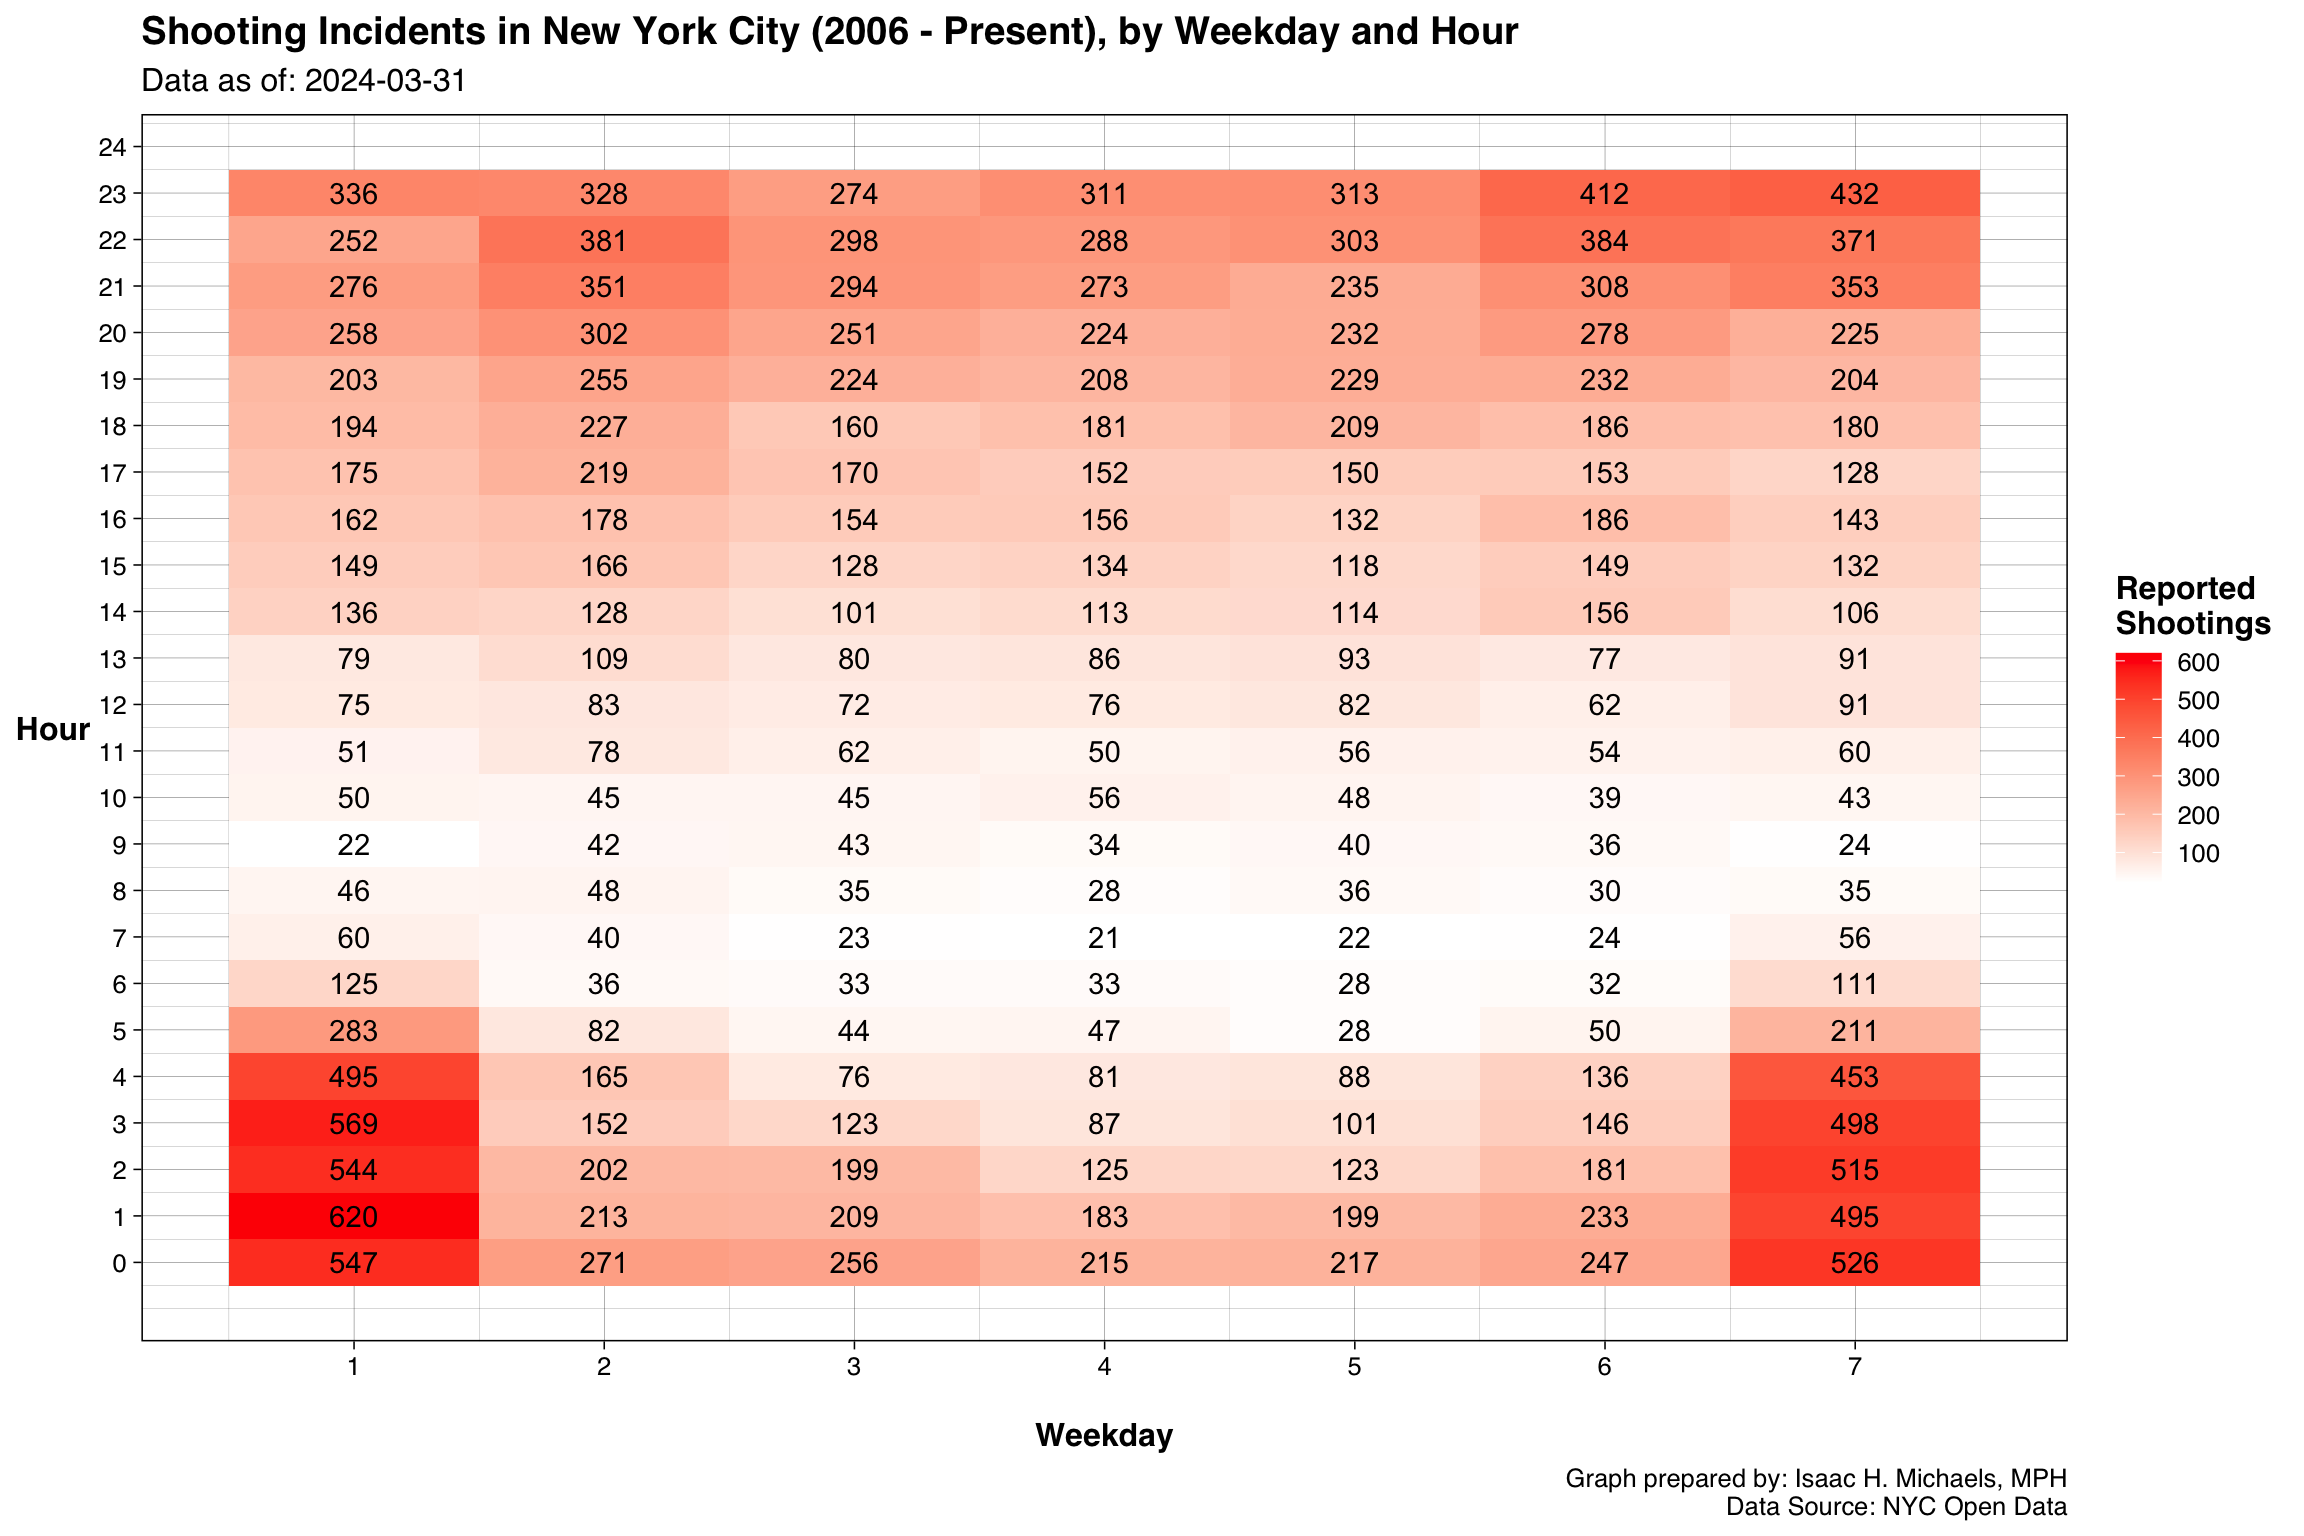
This temporal heatmap isolates the density of shootings by mapping the time of day against the day of the week, aggregating all historical data into a single weekly matrix. The darkest red tiles pinpoint the absolute highest-risk periods for gun violence during a standard week. This information serves as a critical metric for operational resource allocation. Hospital administrators can use this matrix to optimize emergency department and trauma center staffing, while law enforcement and community violence interruptor programs can align their shift deployments with the periods of highest expected need.
 Graph Prepared By: Isaac H. Michaels, DrPH
Data Source: NYC Open Data (Current, Historical)
Fatal vs. Non-Fatal
Cumulative Counts
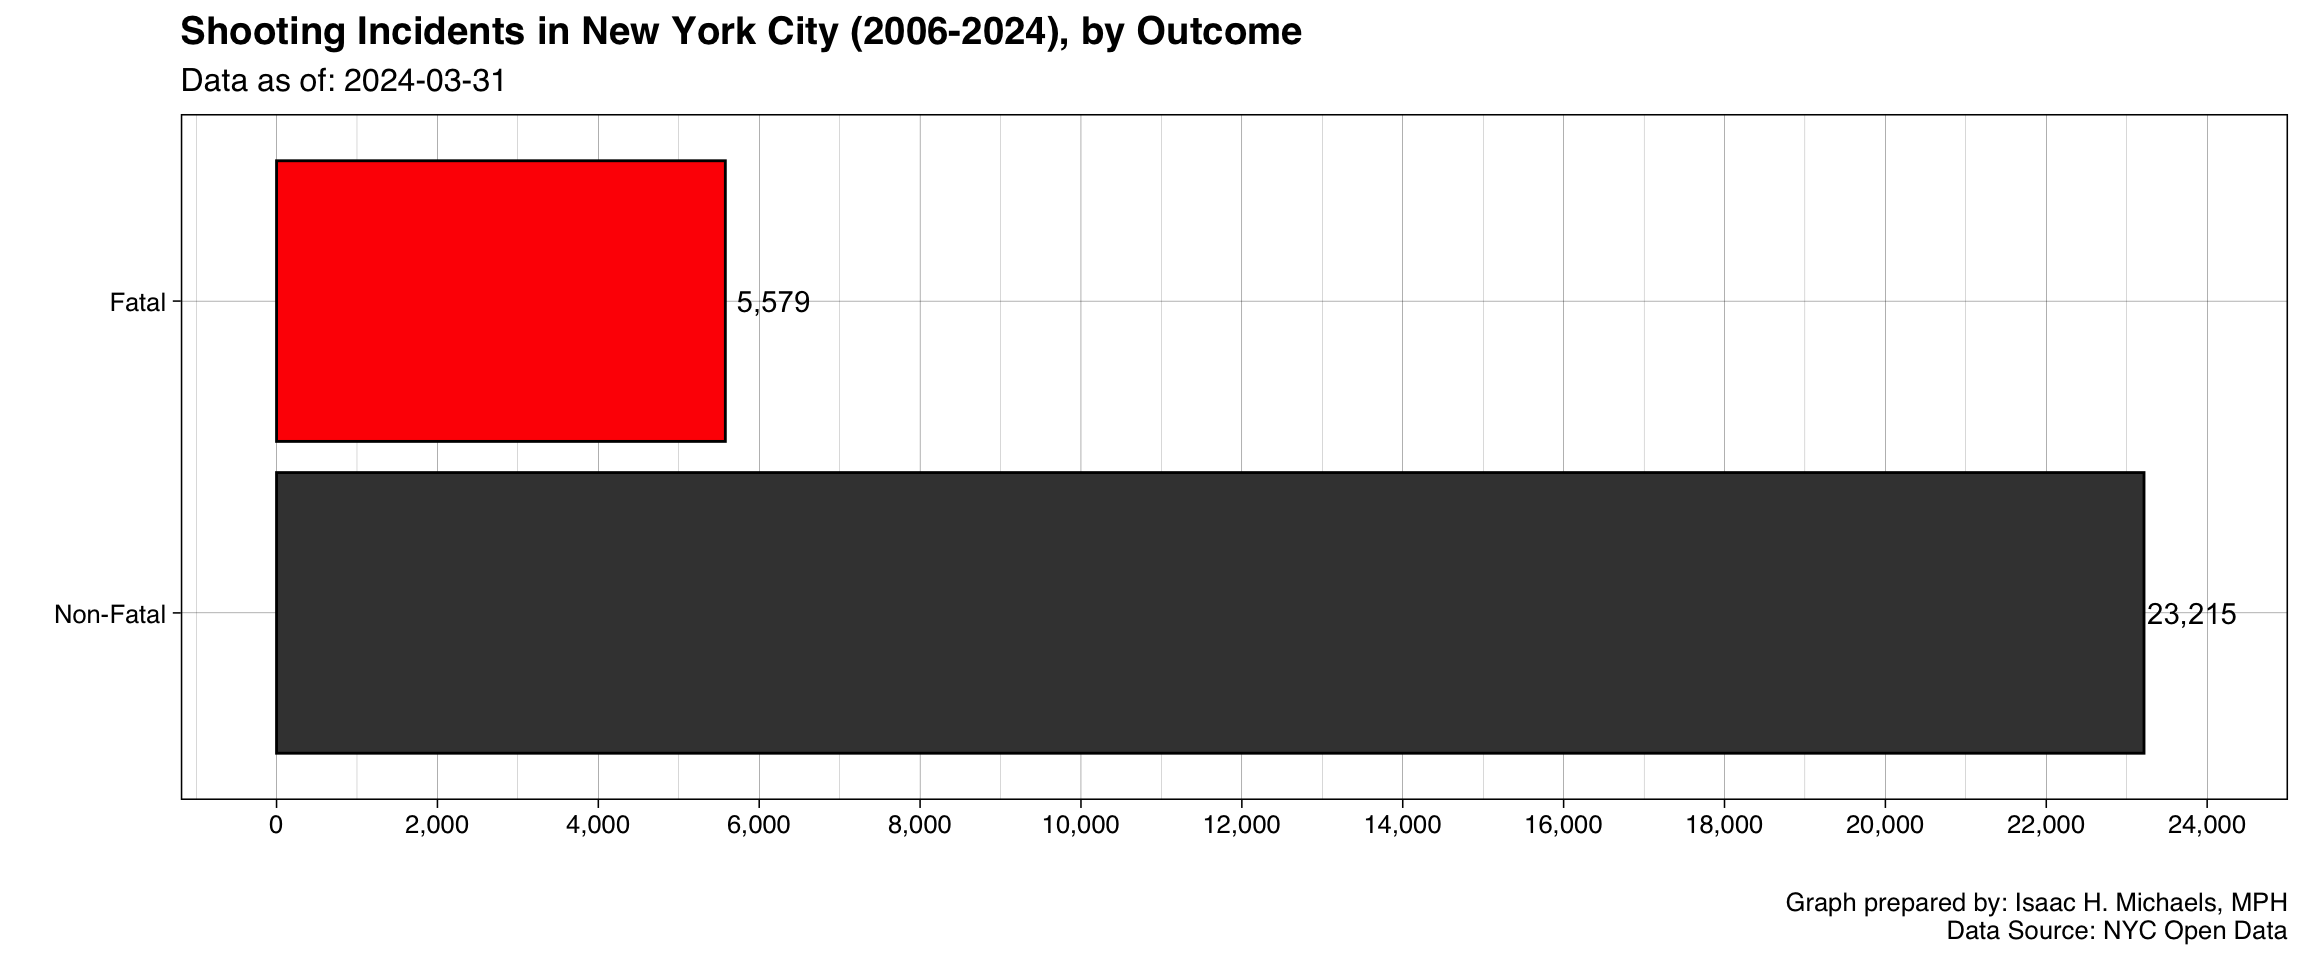
Because not all shooting incidents result in a homicide, this horizontal bar chart stratifies historical incidents by outcome, defining an incident as “Fatal” if at least one victim died as a result of their injuries. This chart establishes the overall baseline ratio of fatal to non-fatal shootings, immediately conveying the prevailing lethality rate of gun violence in the city.
 Graph Prepared By: Isaac H. Michaels, DrPH
Data Source: NYC Open Data (Current, Historical)
Trends
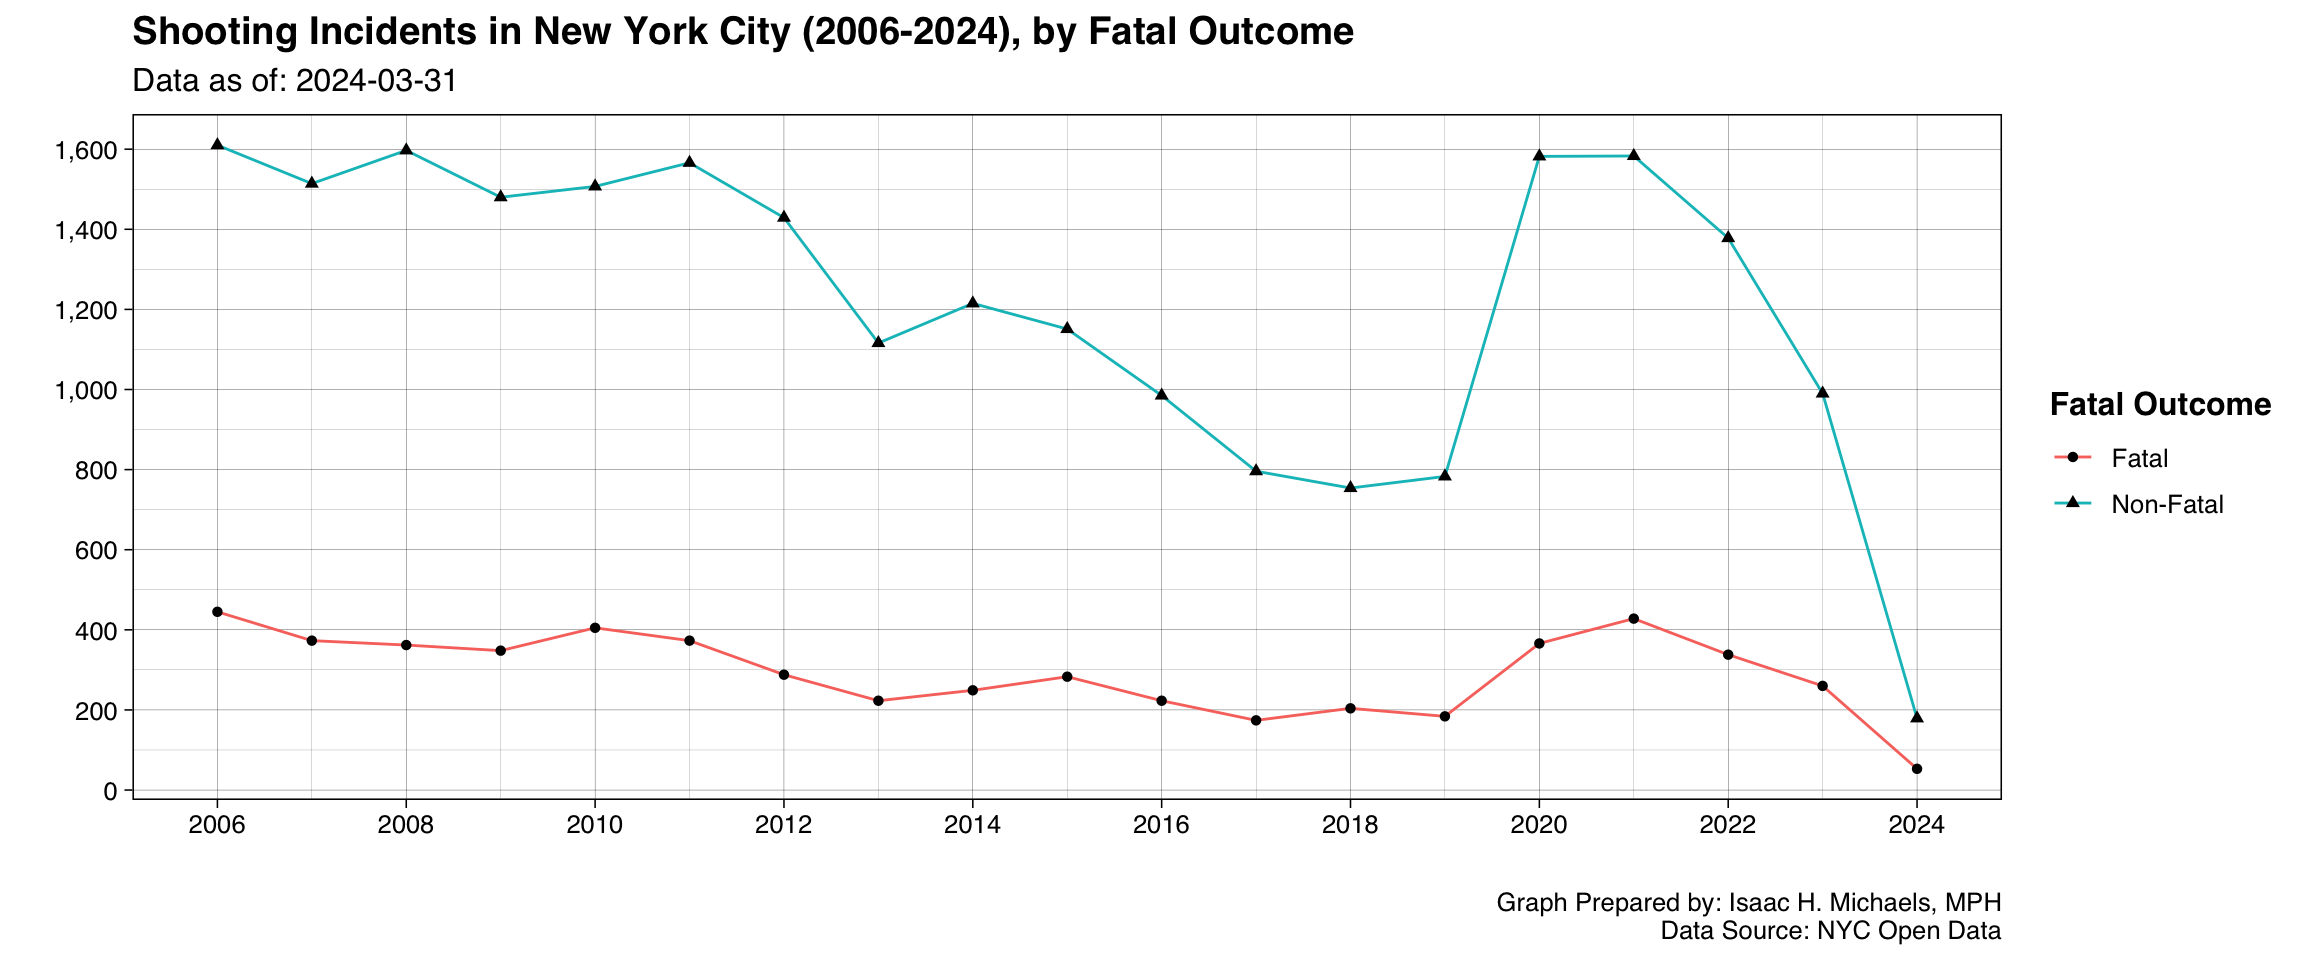
These faceted trend lines allow you to track whether the proportion of fatal incidents is shifting over time. By comparing the trajectory of fatal outcomes against non-fatal outcomes, you can identify underlying systemic changes. For example, if non-fatal shootings decrease while fatal shootings remain stable or rise, it may indicate critical shifts in weapon lethality, emergency medical response times, or trauma care efficacy.
 Graph Prepared By: Isaac H. Michaels, DrPH
Data Source: NYC Open Data (Current, Historical)
Location Types
Cumulative Counts
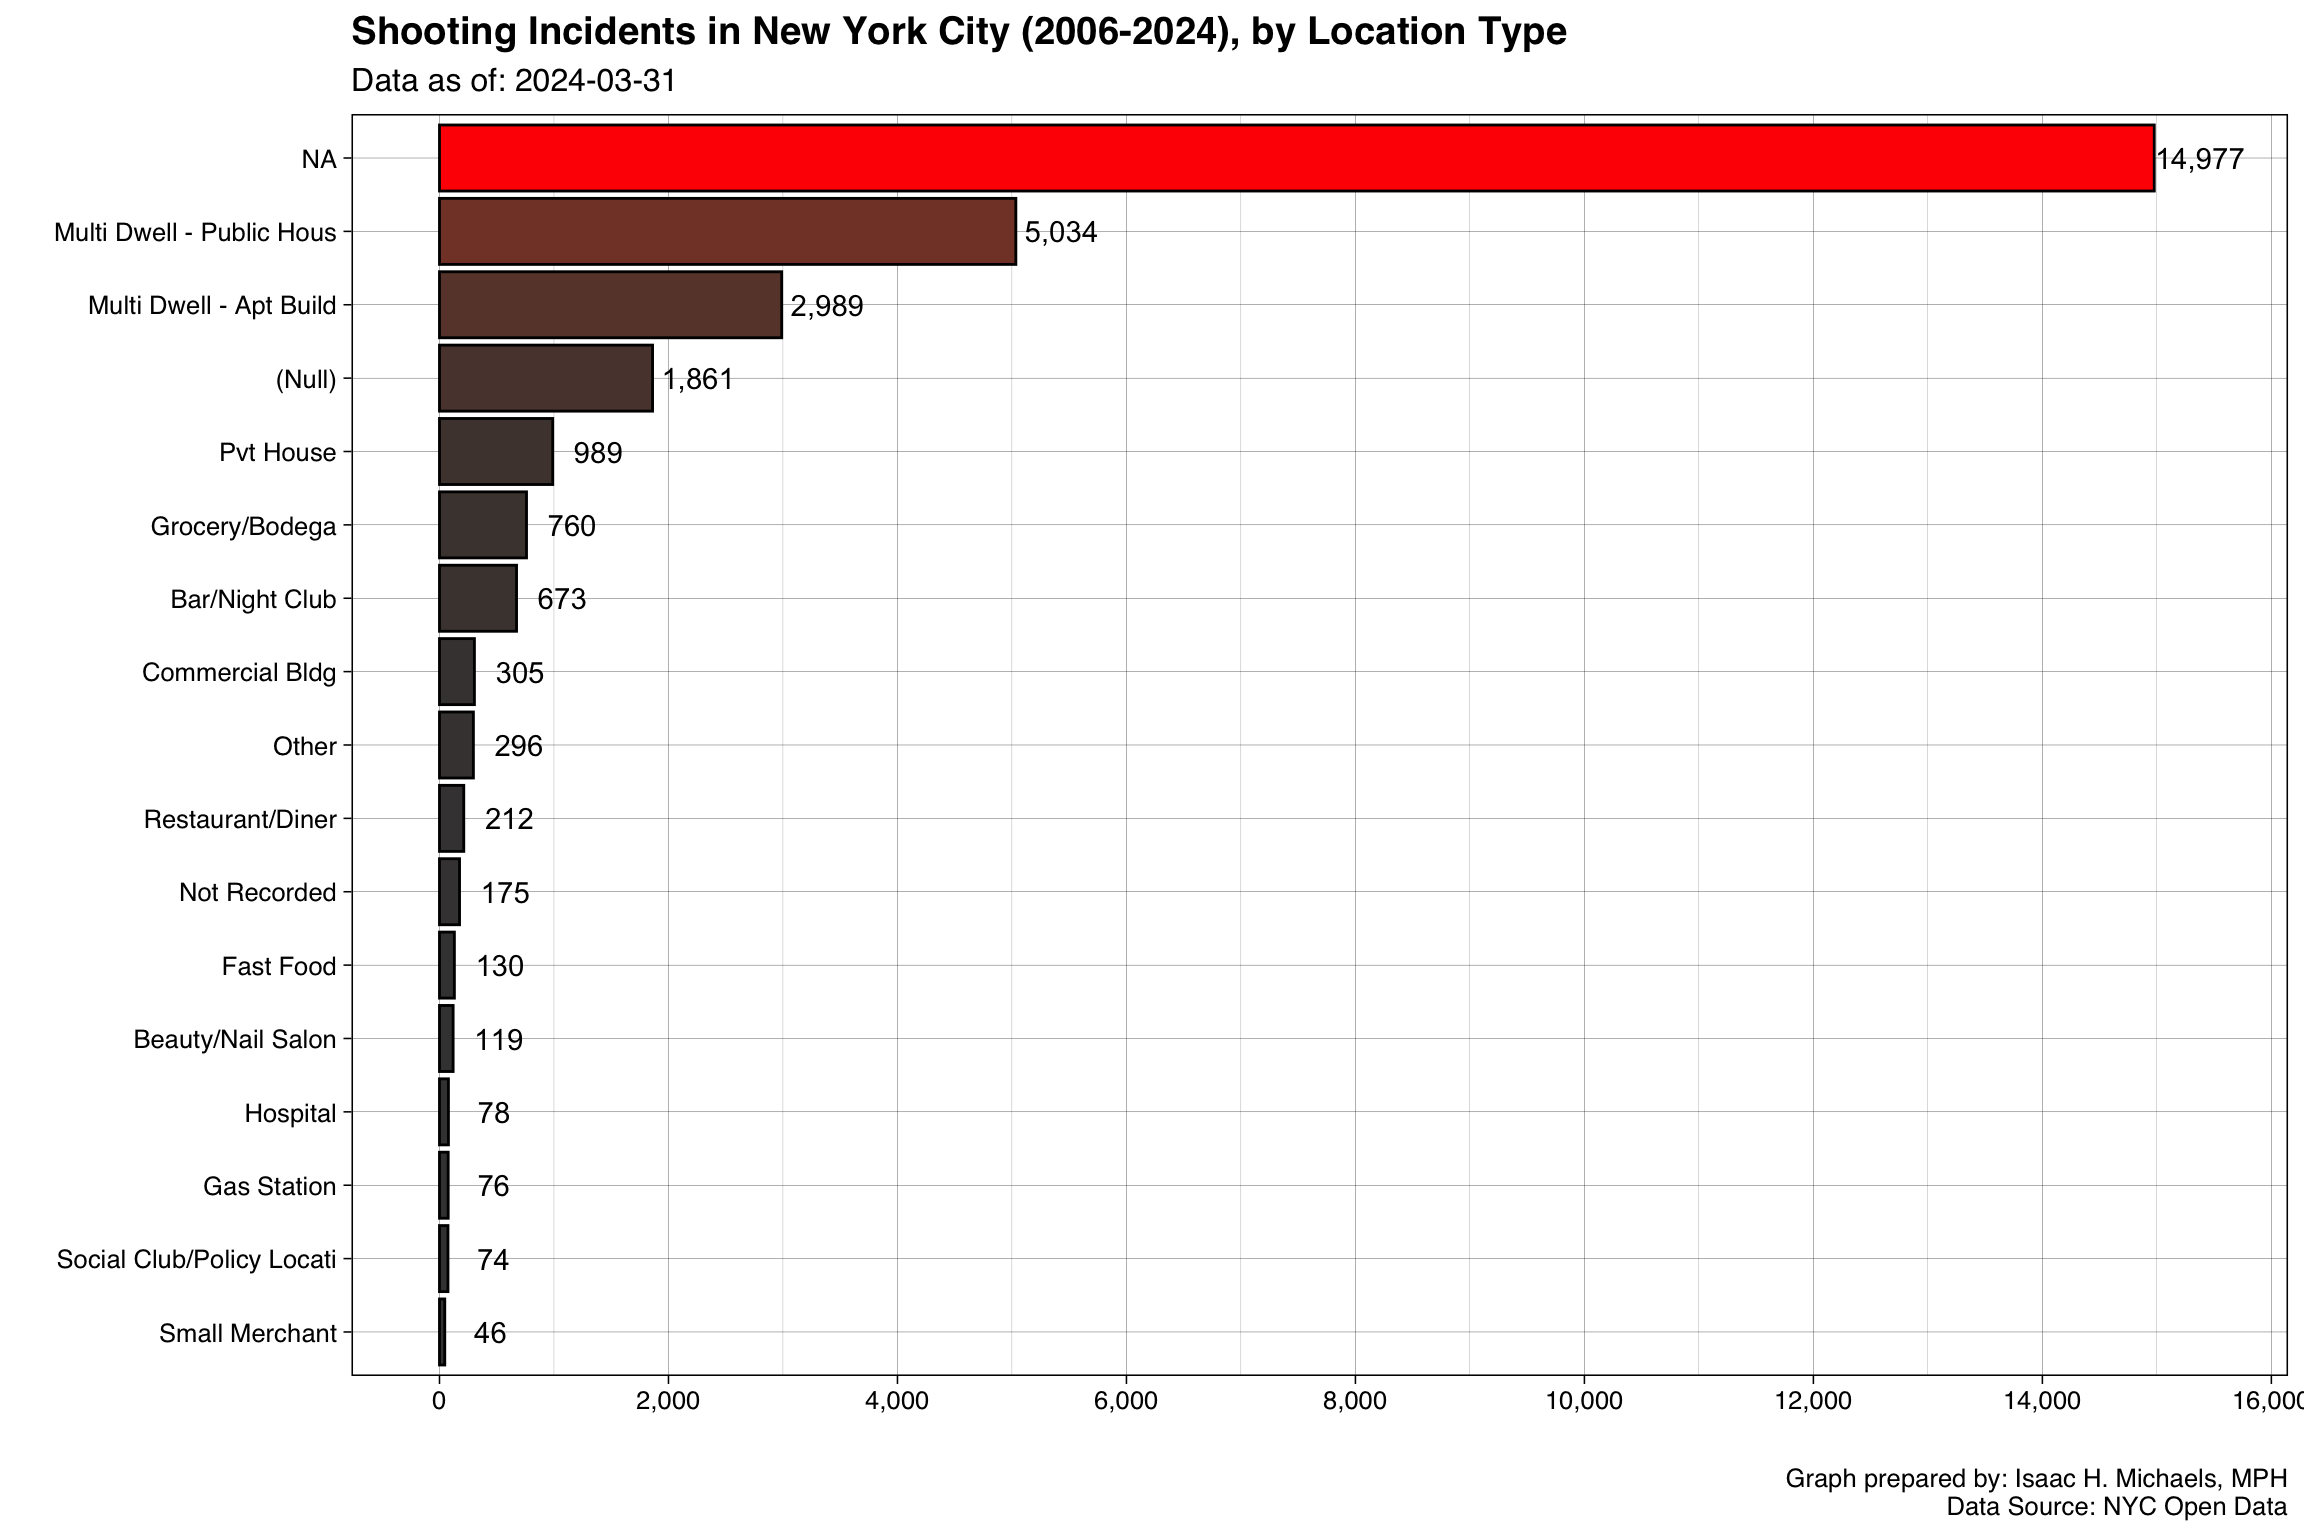
The environmental context of a shooting plays a major role in determining how it is policed and prevented. This horizontal bar chart categorizes incidents by the specific type of location where they occurred, ranging from open streets to public housing and commercial establishments. By comparing the lengths of the bars, you can understand where gun violence is most heavily concentrated. This data is vital for designing place-based interventions; a high concentration of street-level incidents might prompt investments in Crime Prevention Through Environmental Design (CPTED), whereas violence in commercial venues might require distinct regulatory approaches.
 Graph Prepared By: Isaac H. Michaels, DrPH
Data Source: NYC Open Data (Current, Historical)
Age Groups, Genders, and Races/Ethnicities
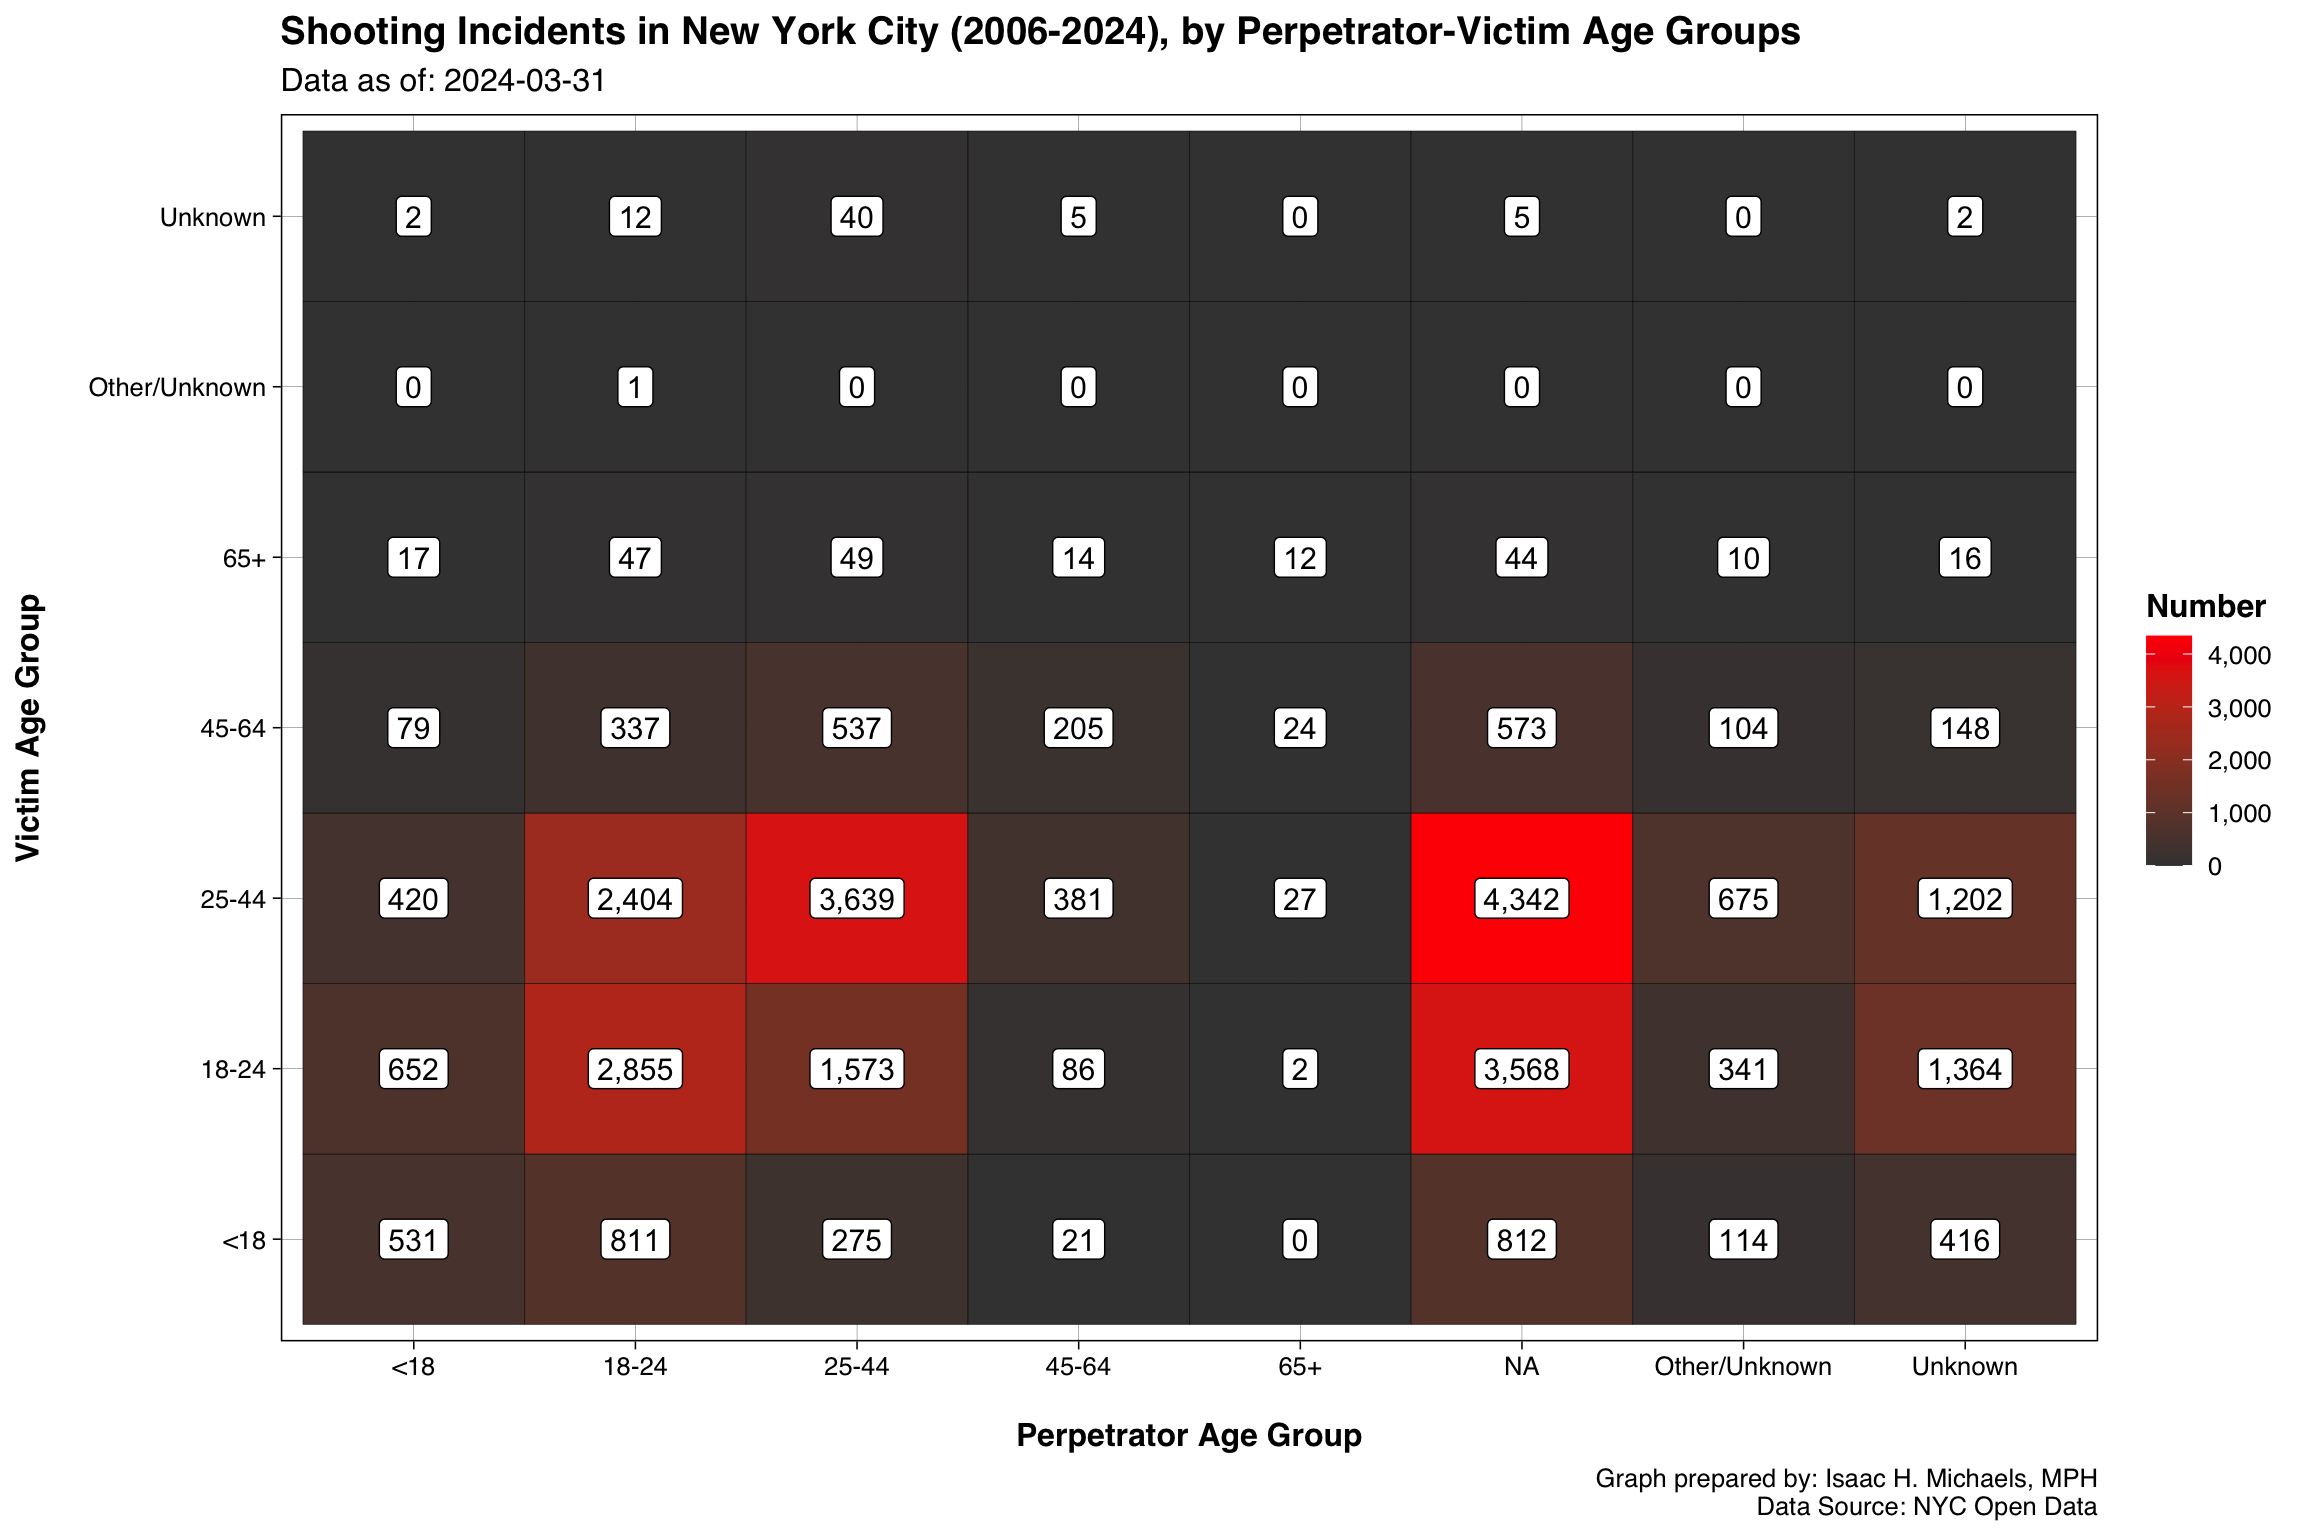
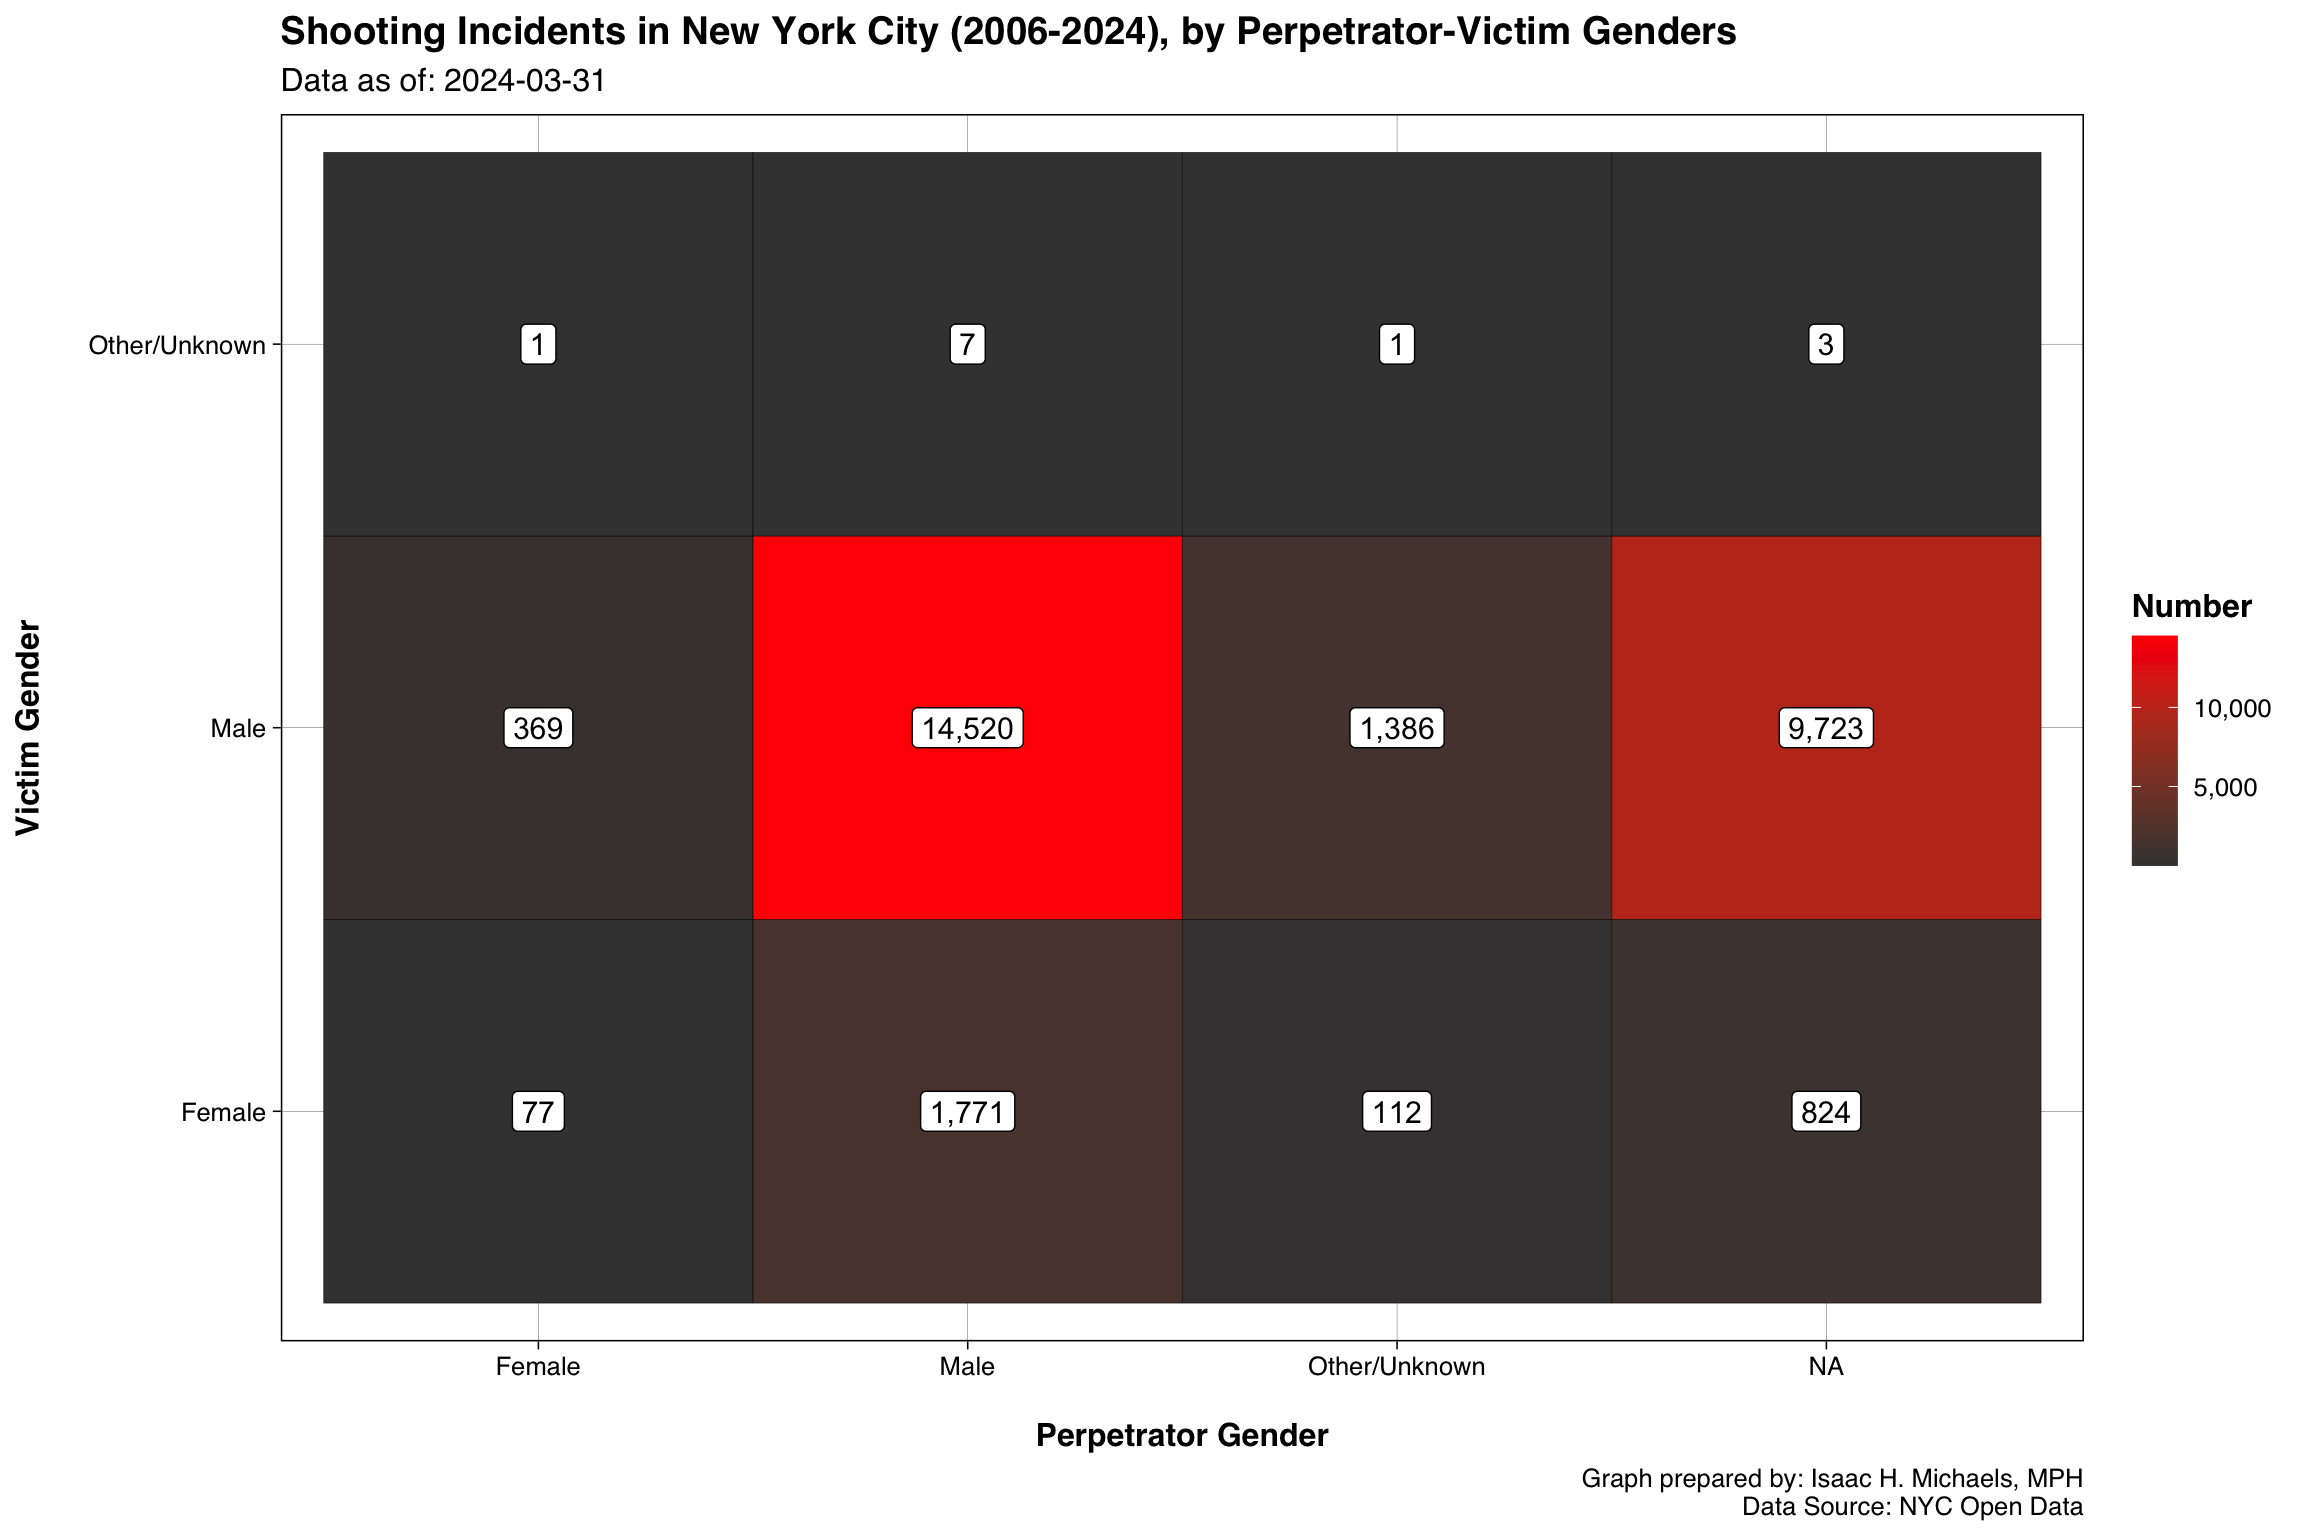
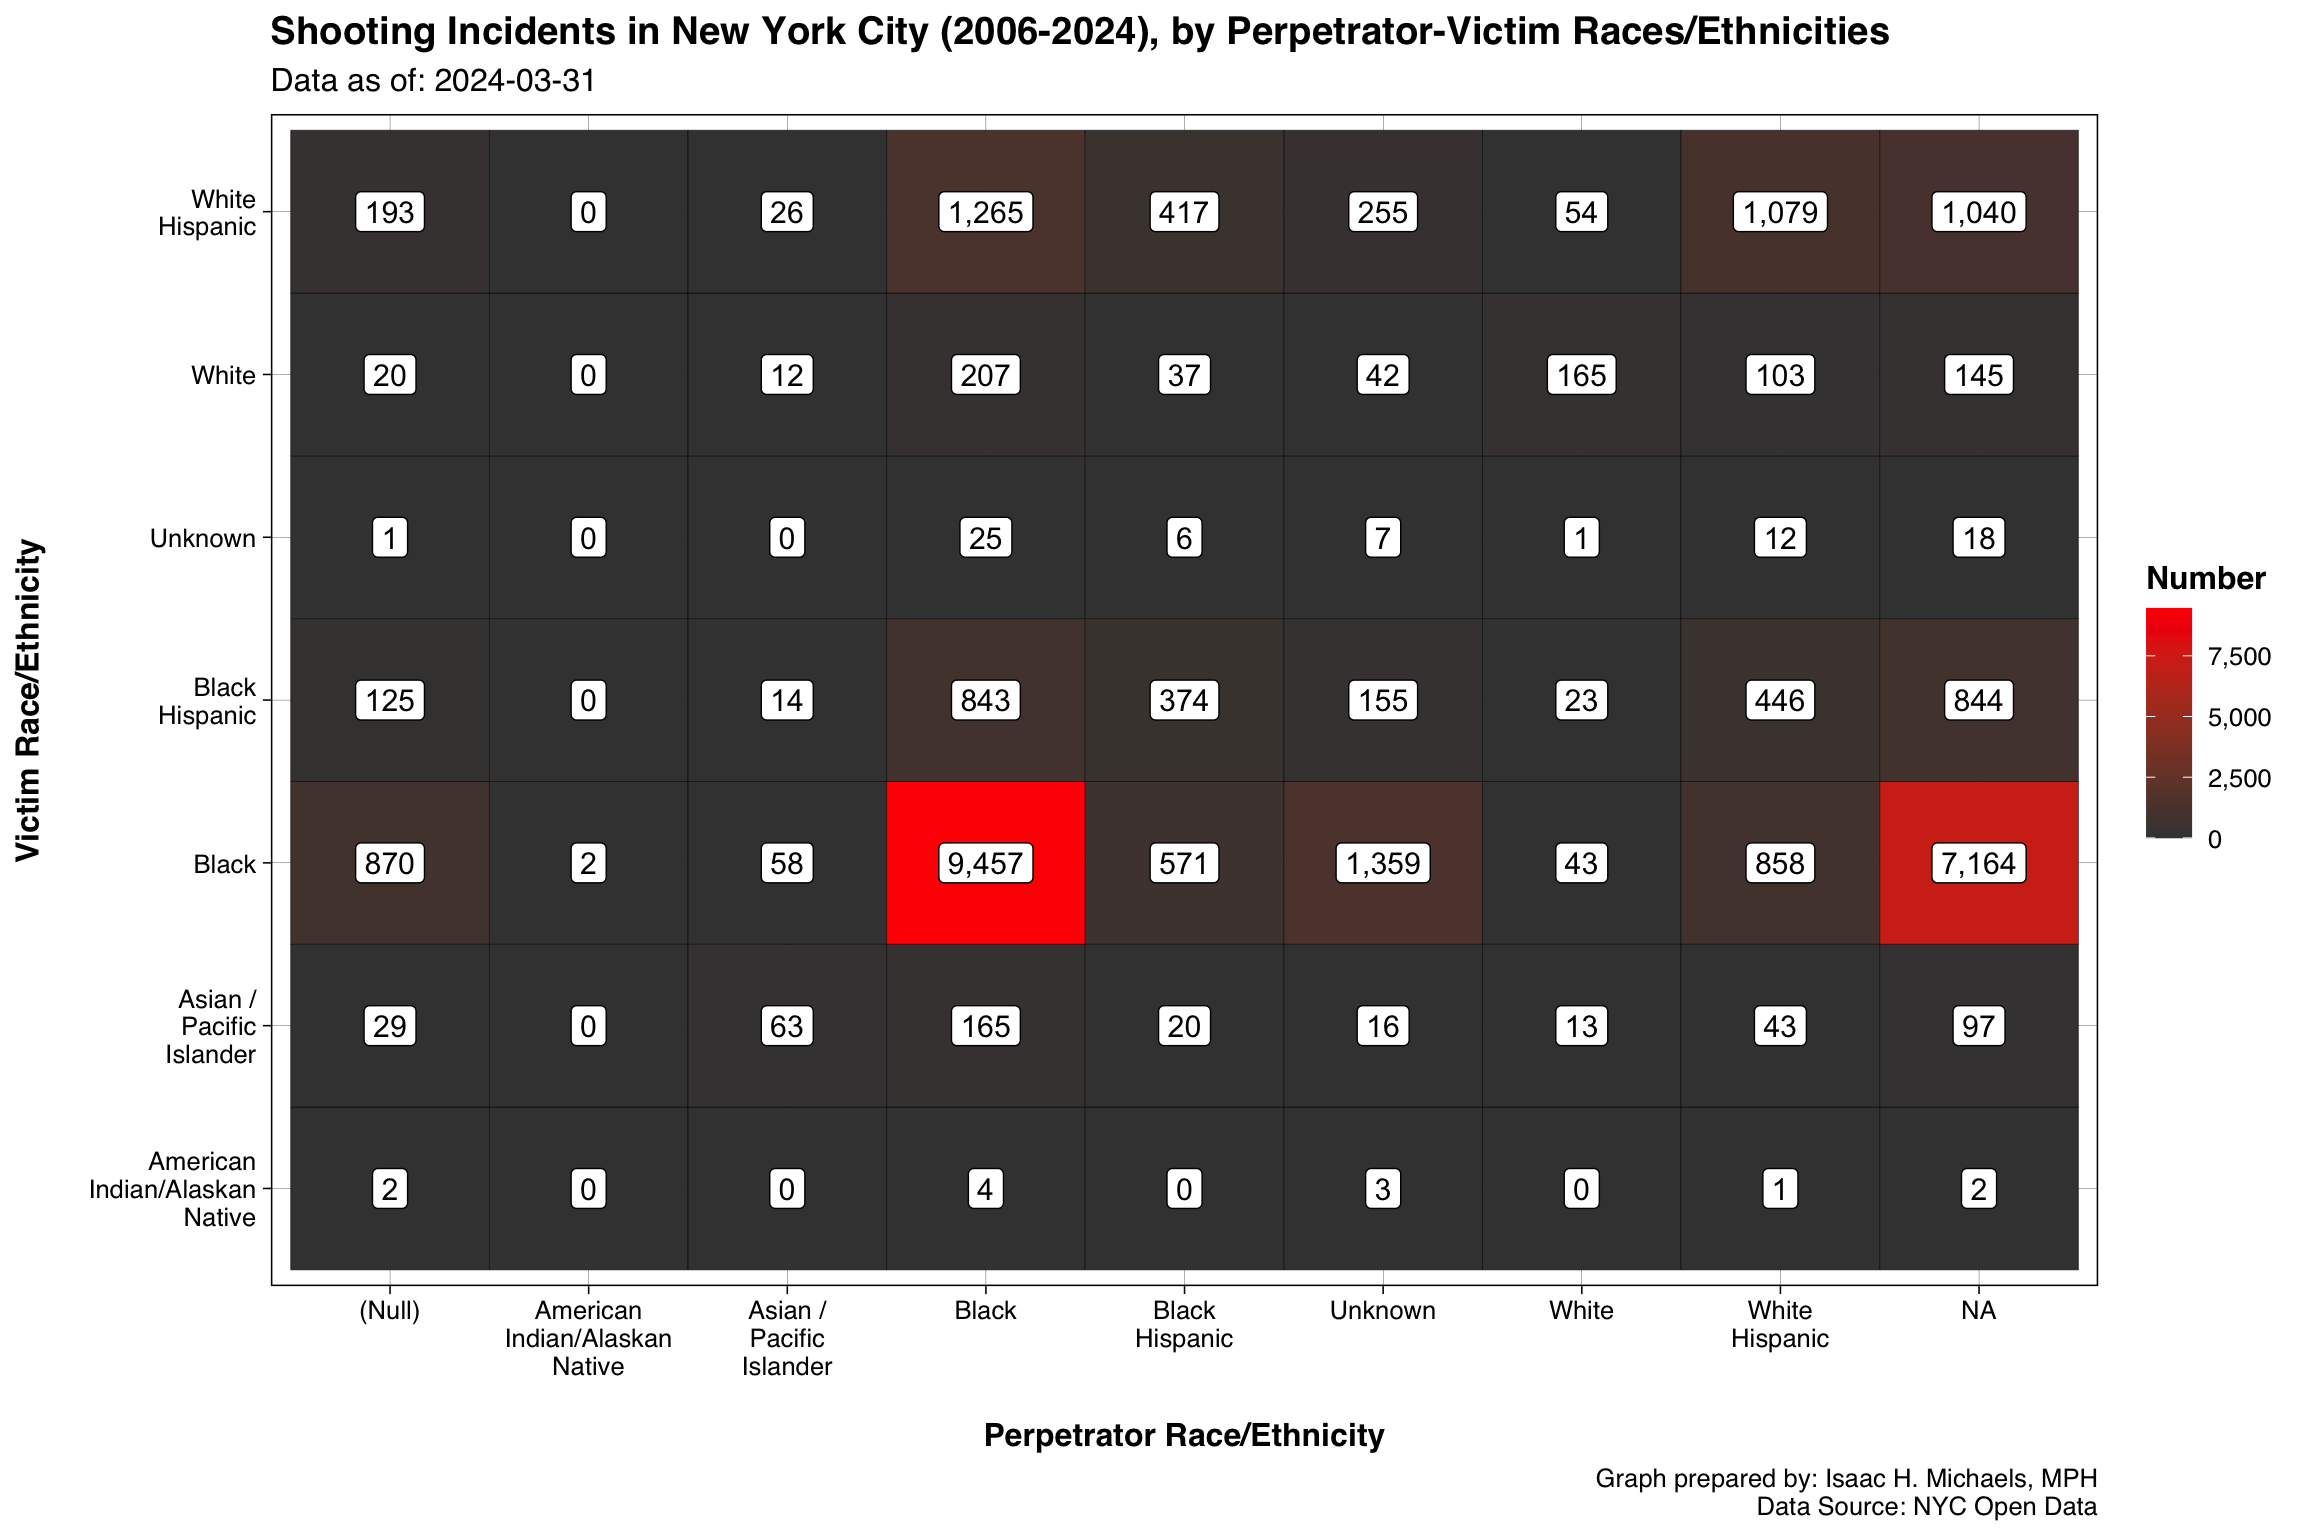
Because a single shooting incident can involve multiple perpetrators and multiple victims, the demographic analyses presented in the following sections utilize “Victim-Offender Pairings” as the primary unit of analysis. Consequently, you will find that the total number of demographic pairings mathematically exceeds the total number of unique shooting incidents. This methodology ensures that incidents with multiple actors are accurately represented without being undercounted or misattributed.
Cumulative Matrices
These demographic matrices visualize the intersection of victim and perpetrator characteristics across age groups, genders, and races/ethnicities. The darkest red tiles indicate the most frequent demographic pairings, revealing the primary networks of violence within the city. You can refer to these grids to determine the extent to which incidents occur between individuals of similar or differing backgrounds. Furthermore, the explicit inclusion of the “Unknown” categories visually quantifies the challenge of unsolved incidents and unidentified suspects, providing you with a critical metric for evaluating investigative outcomes and data quality.
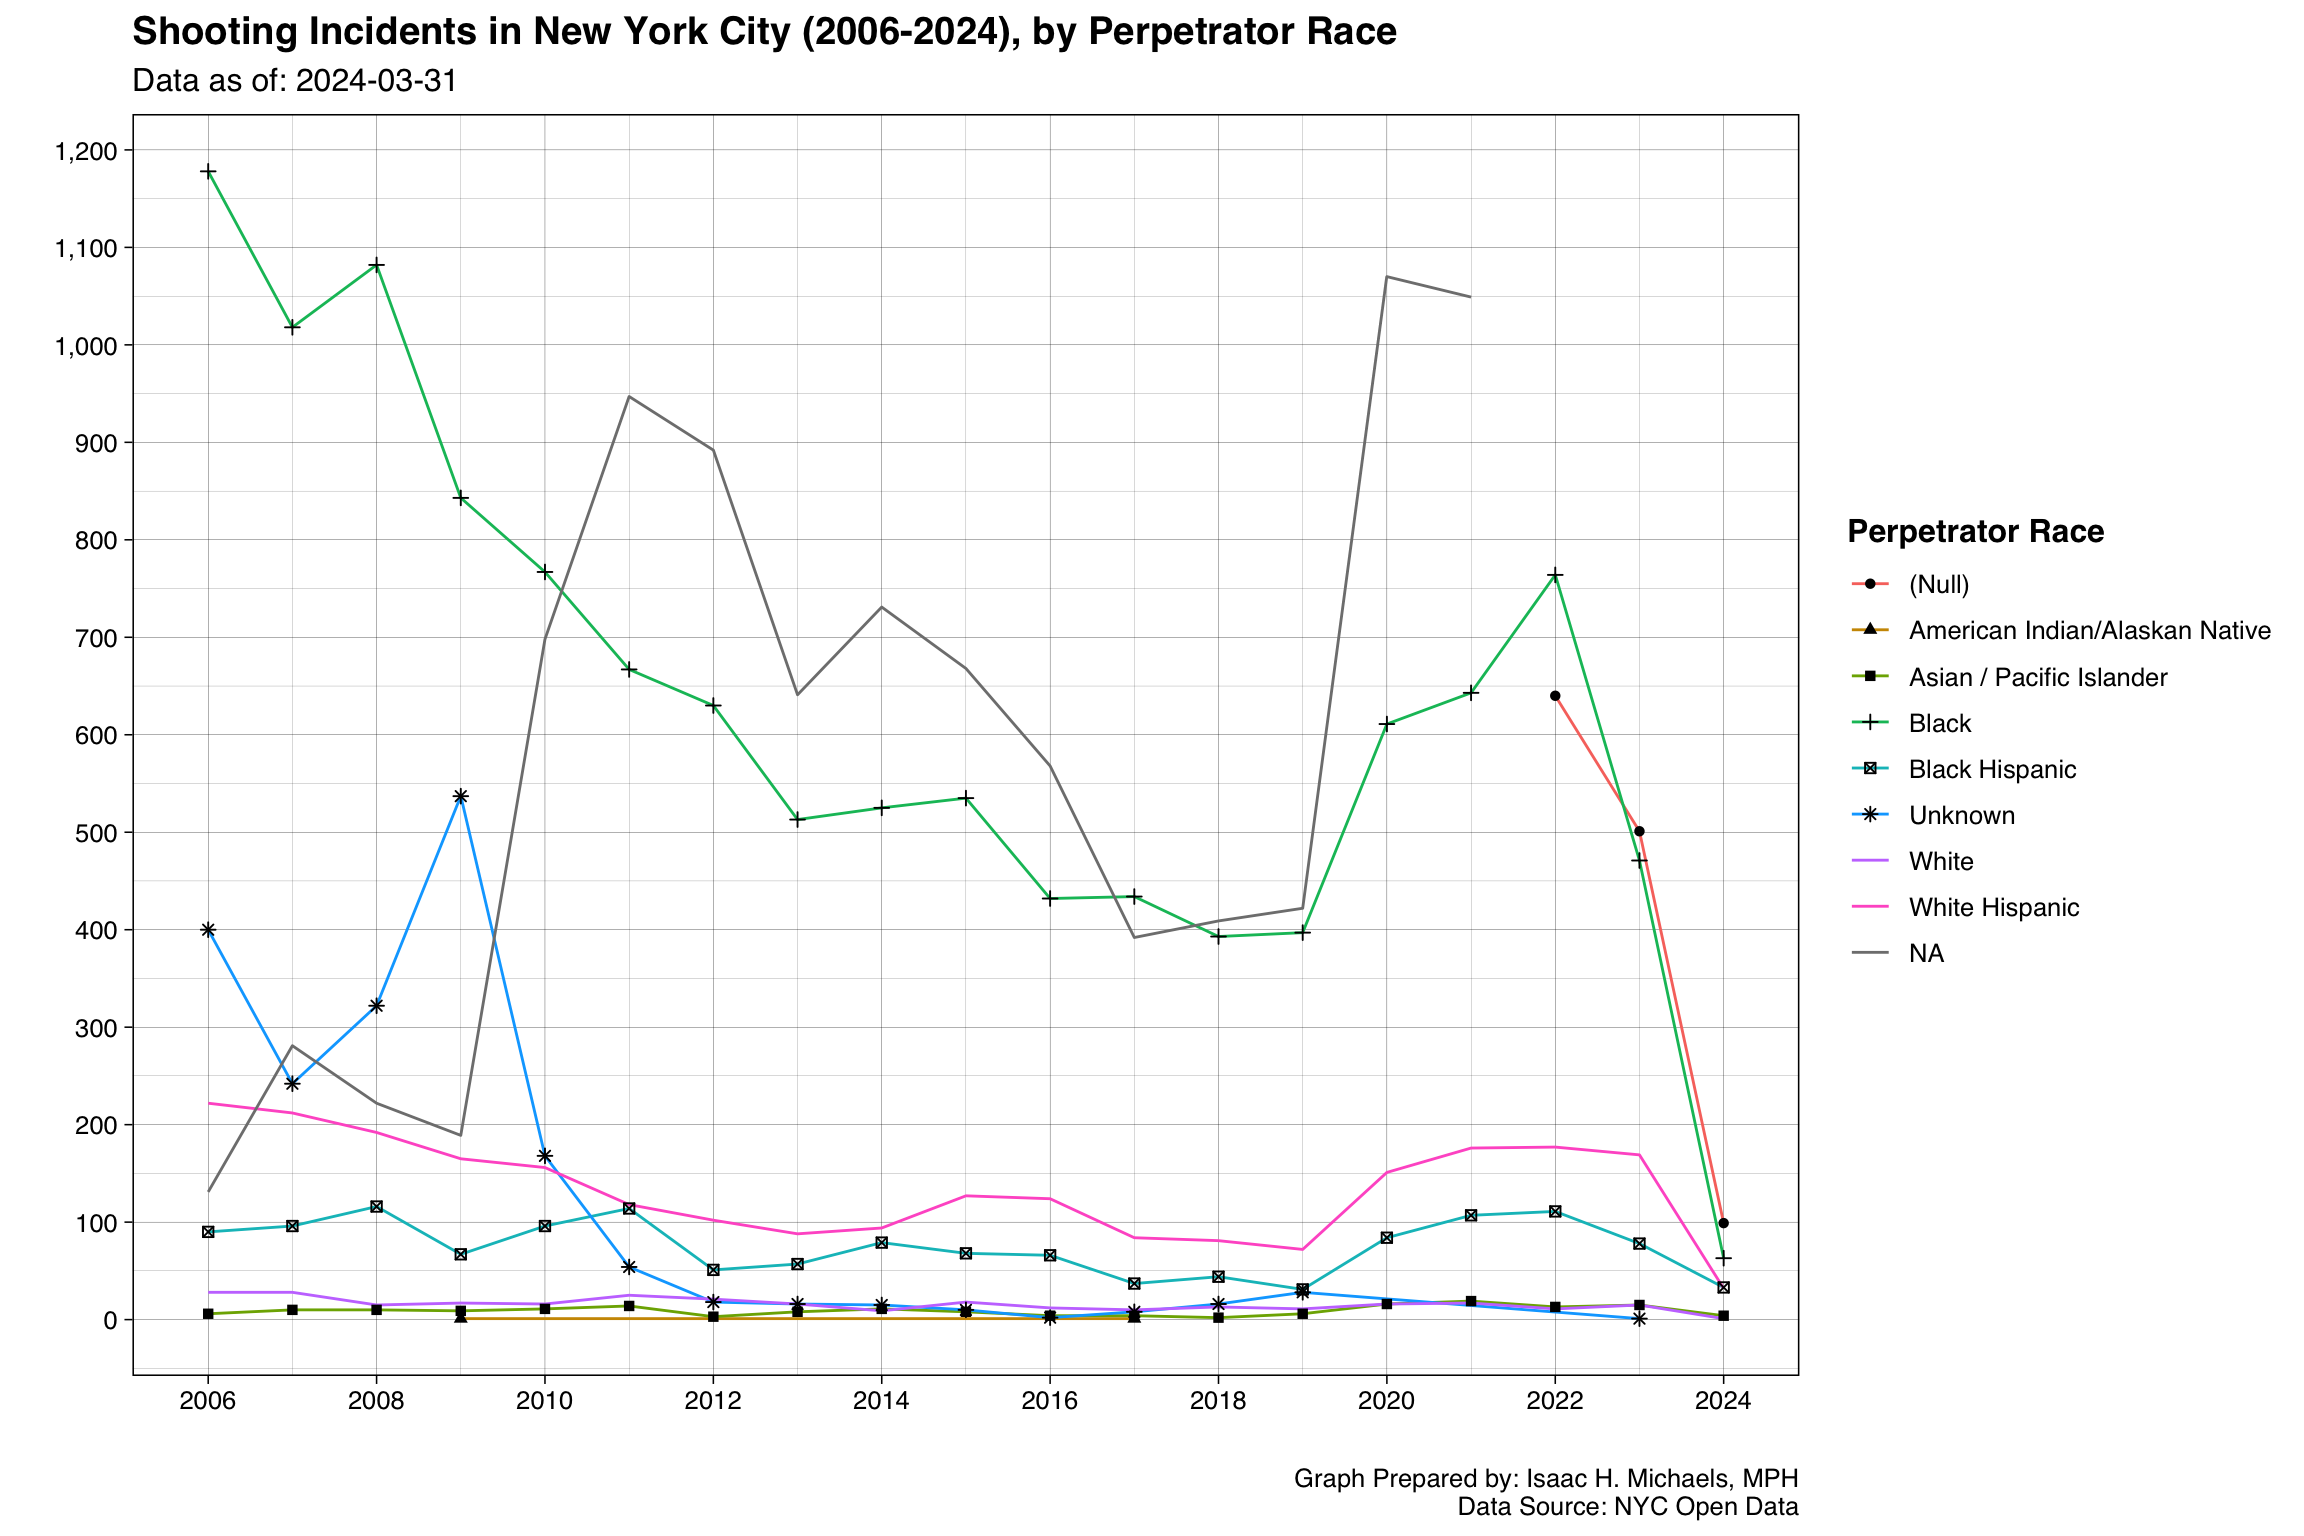
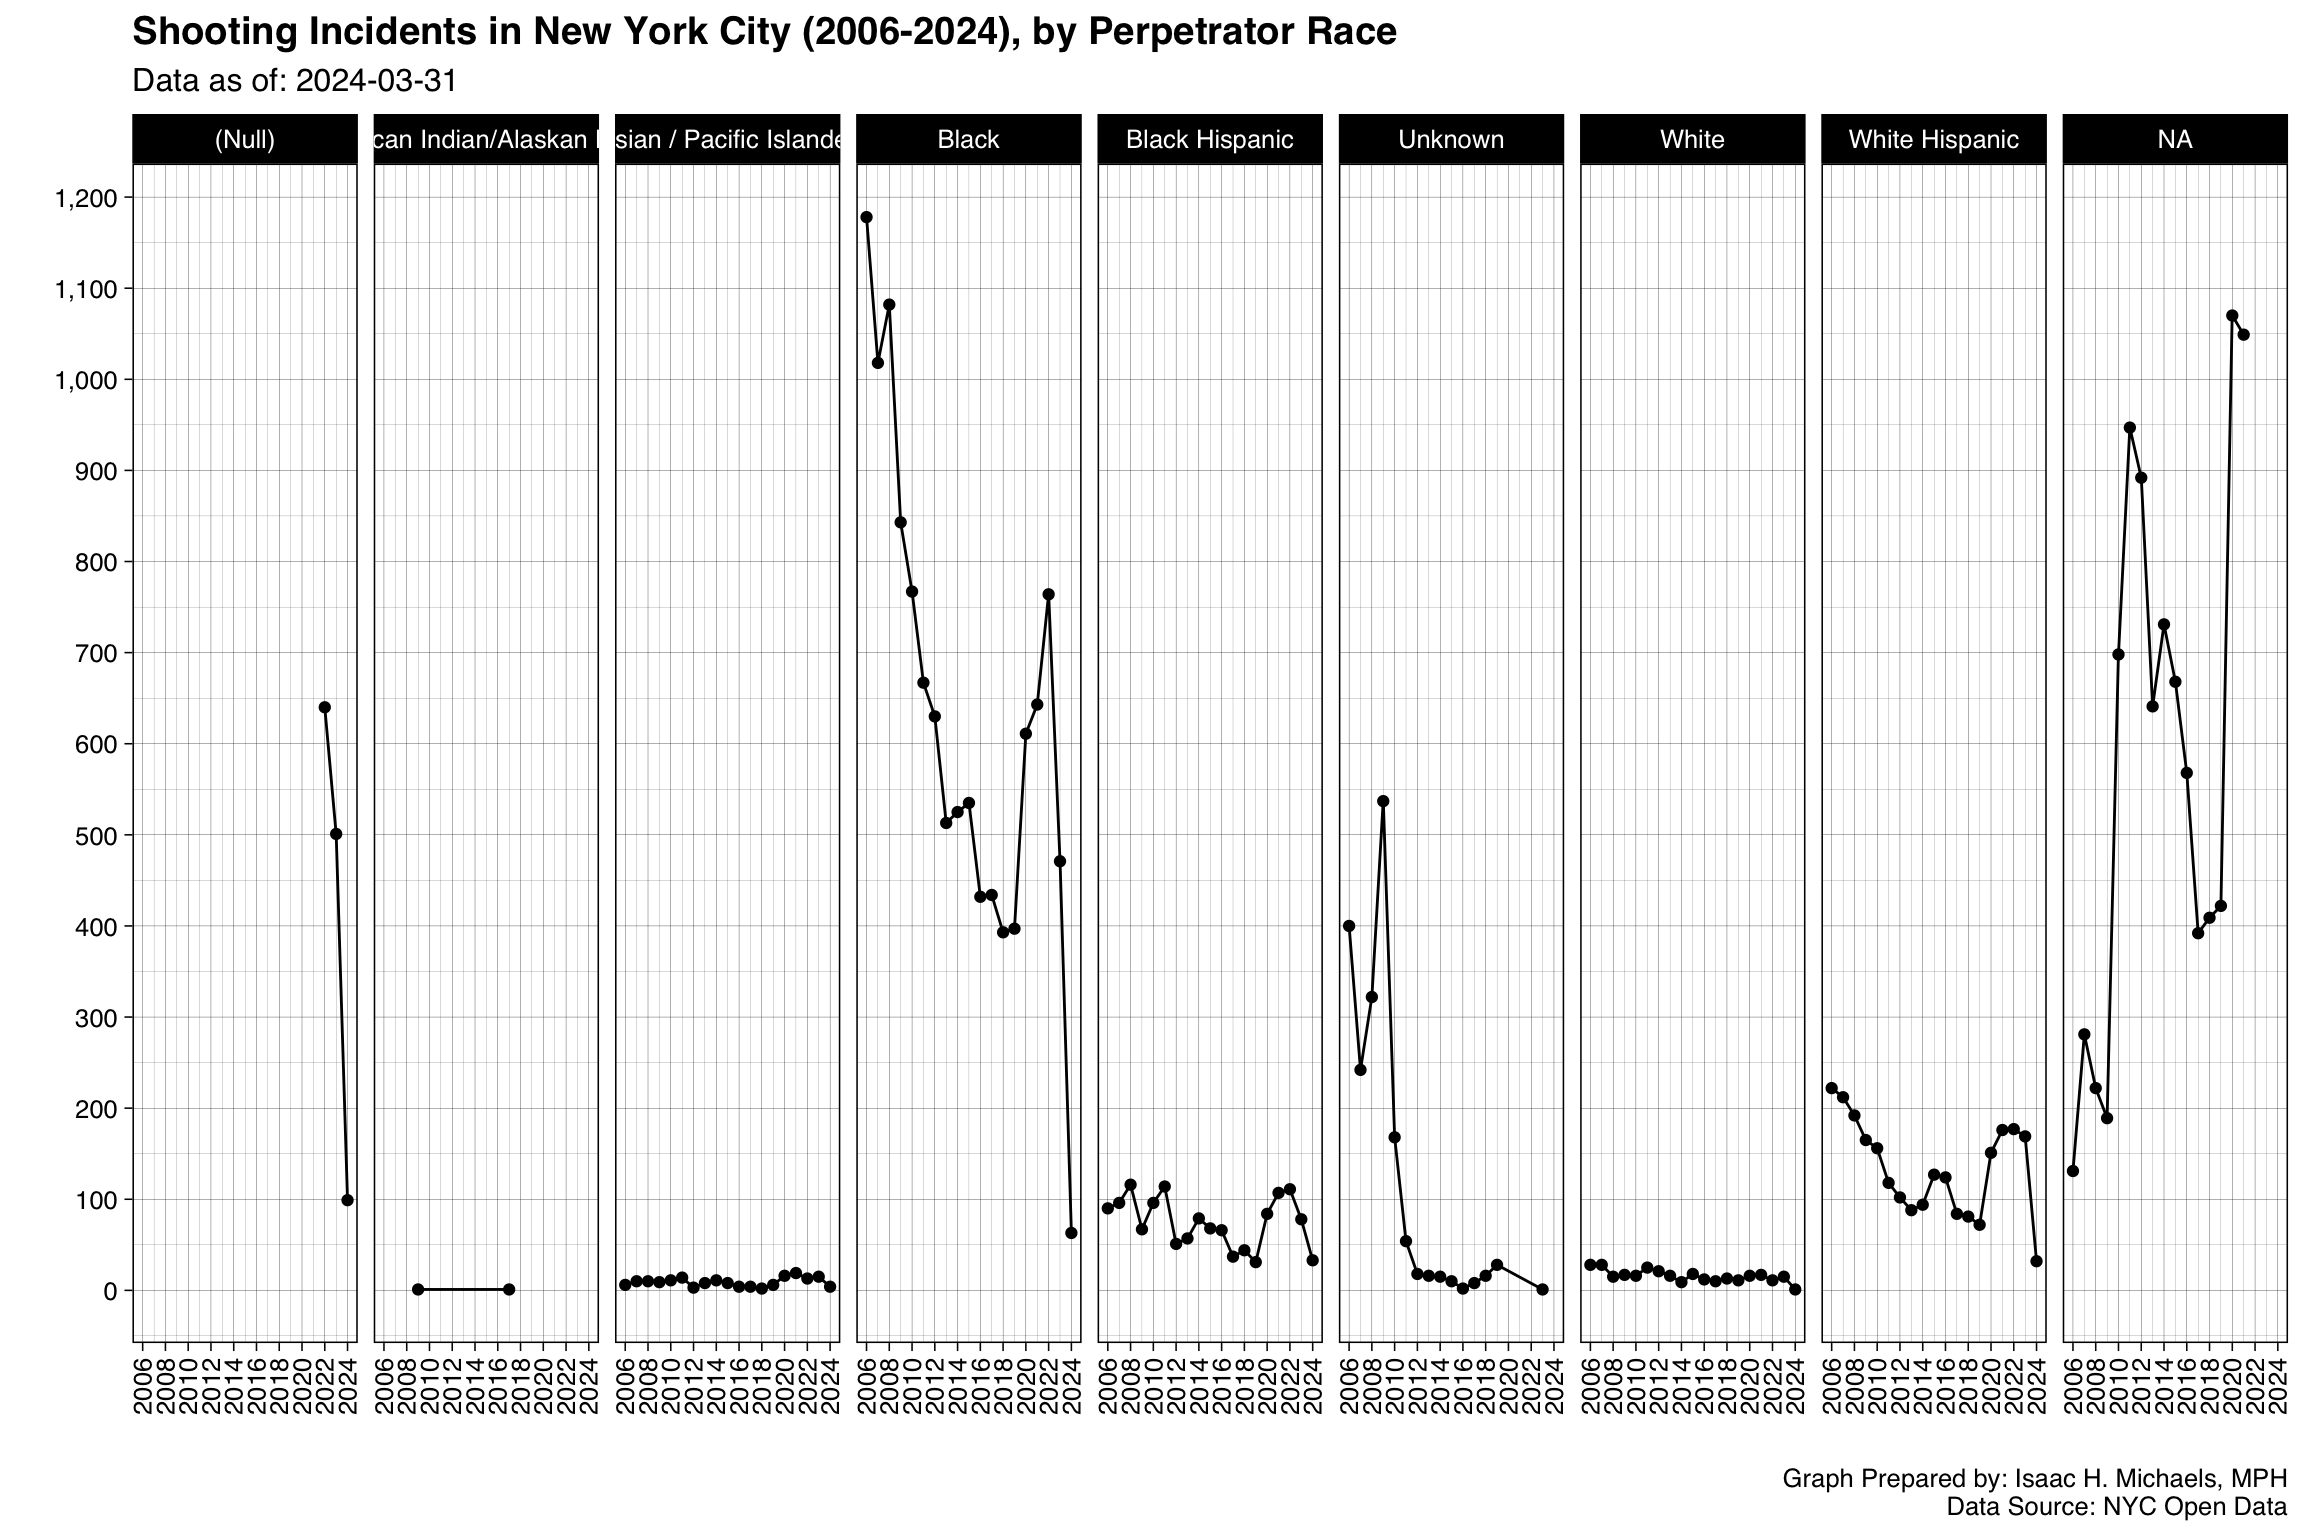
Trends: Perpetrators
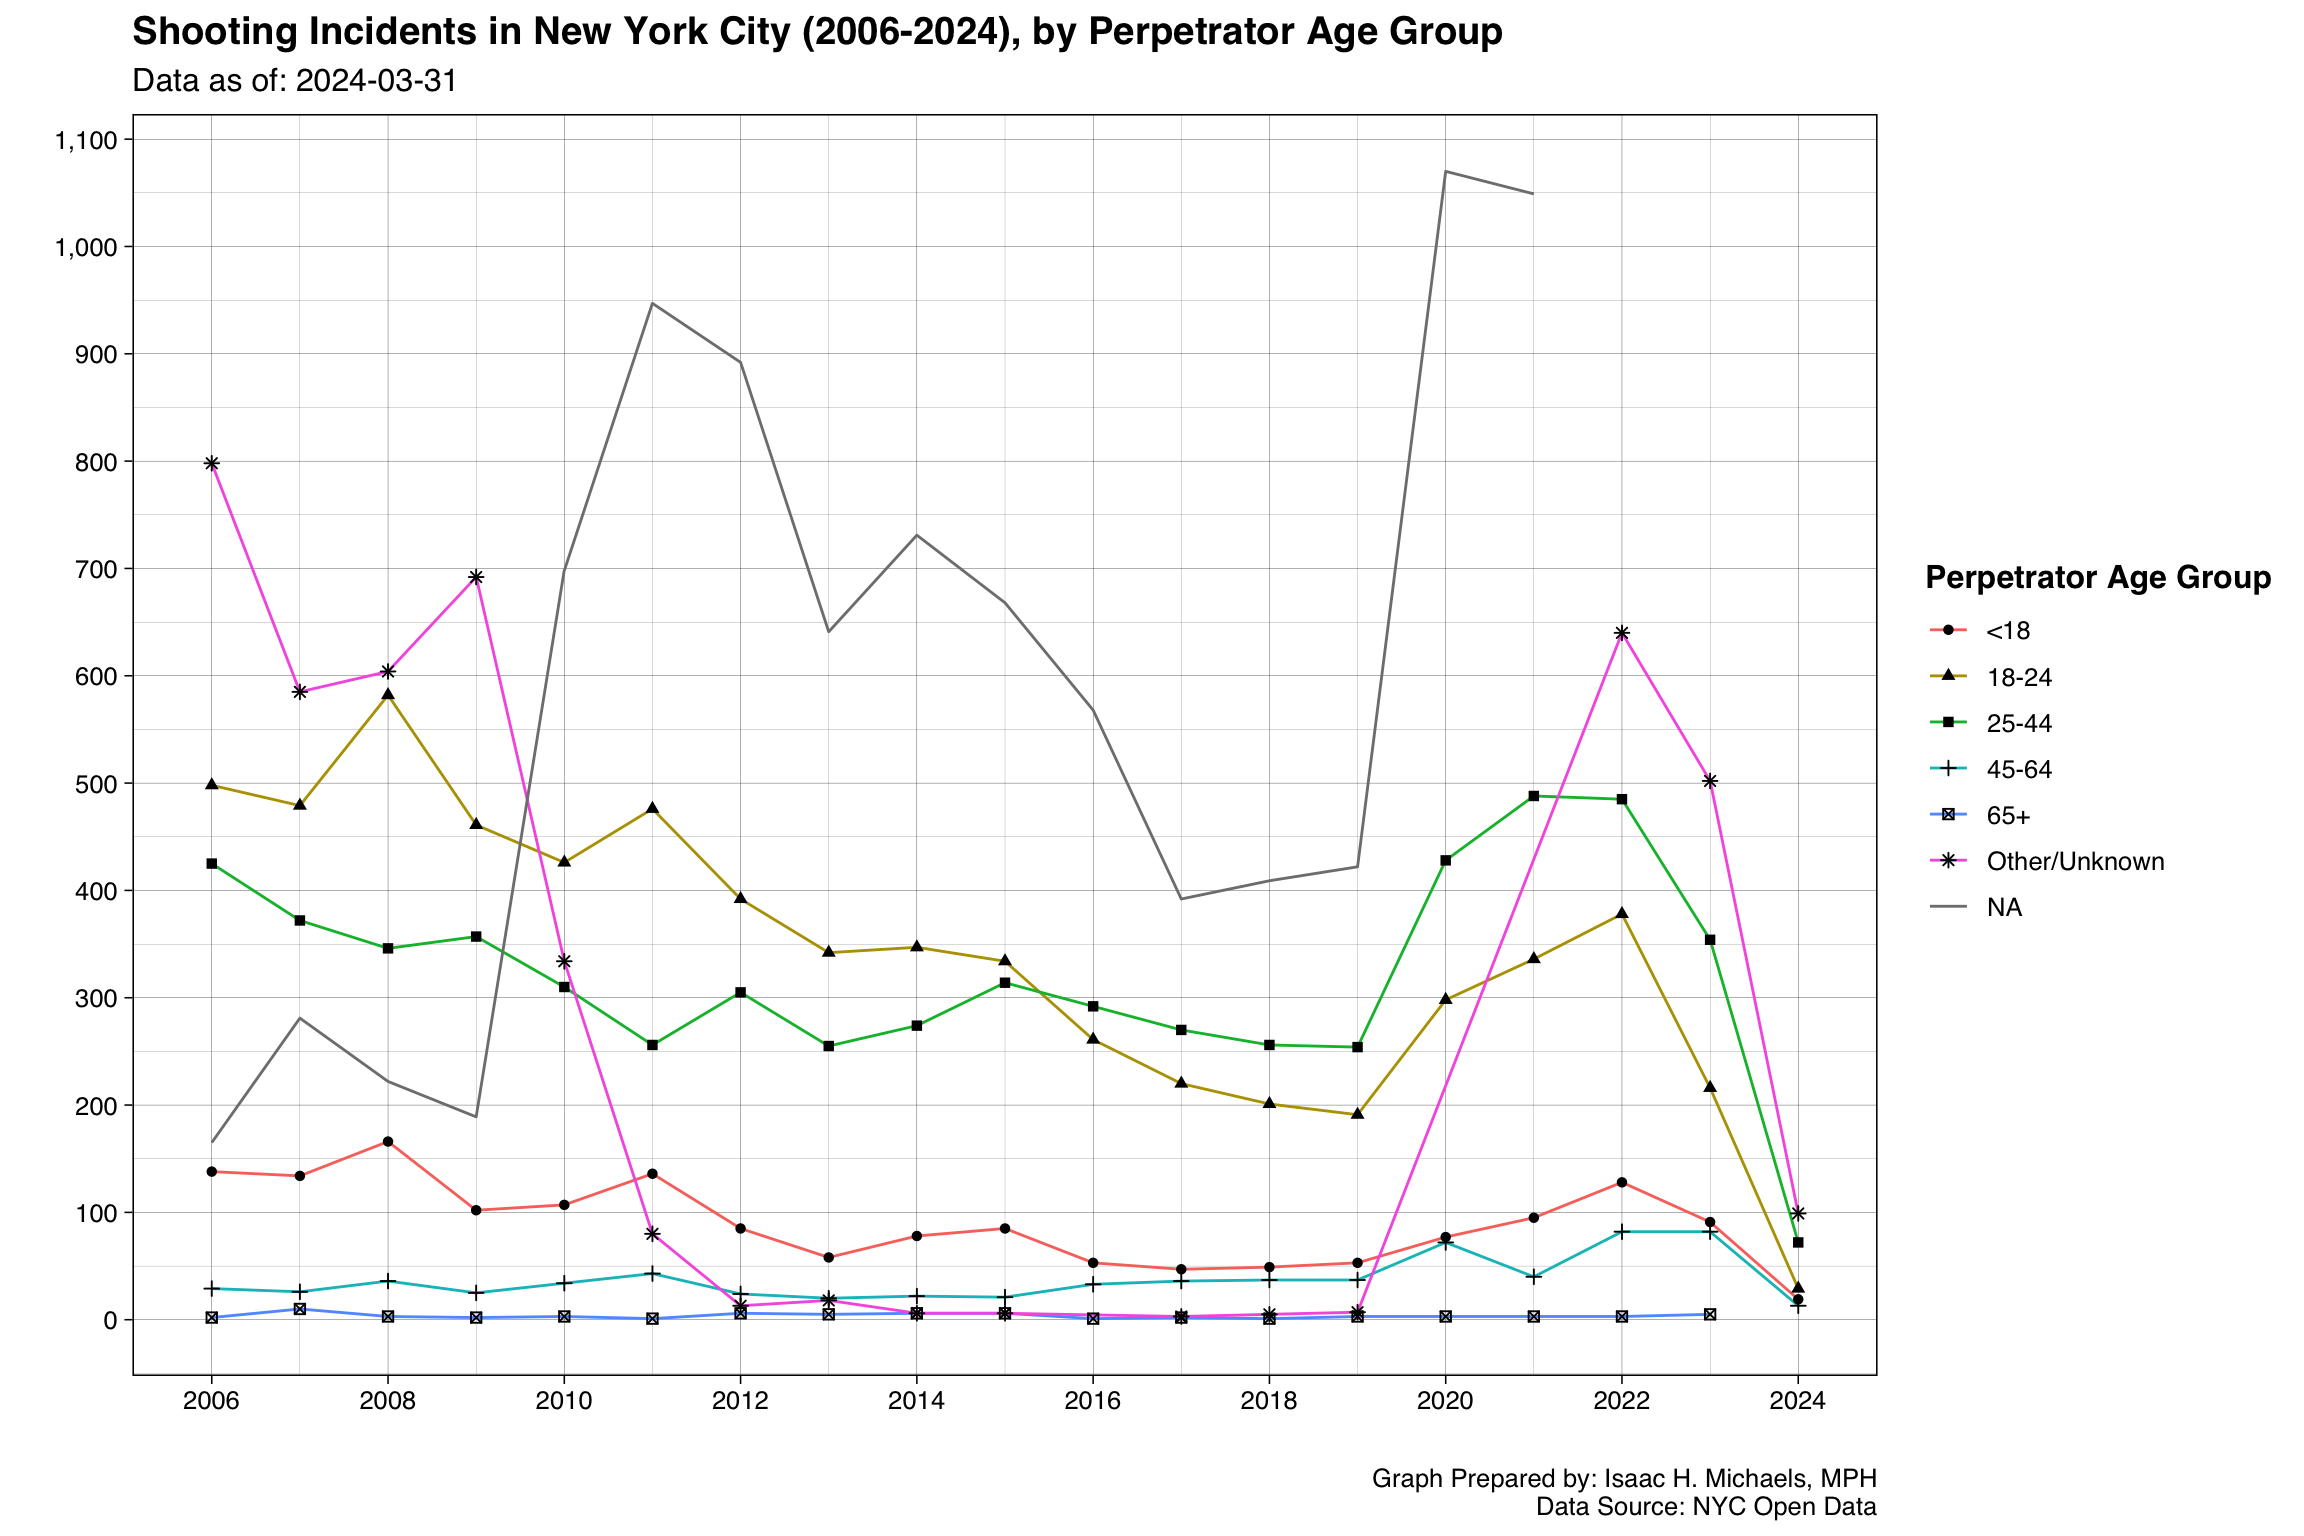
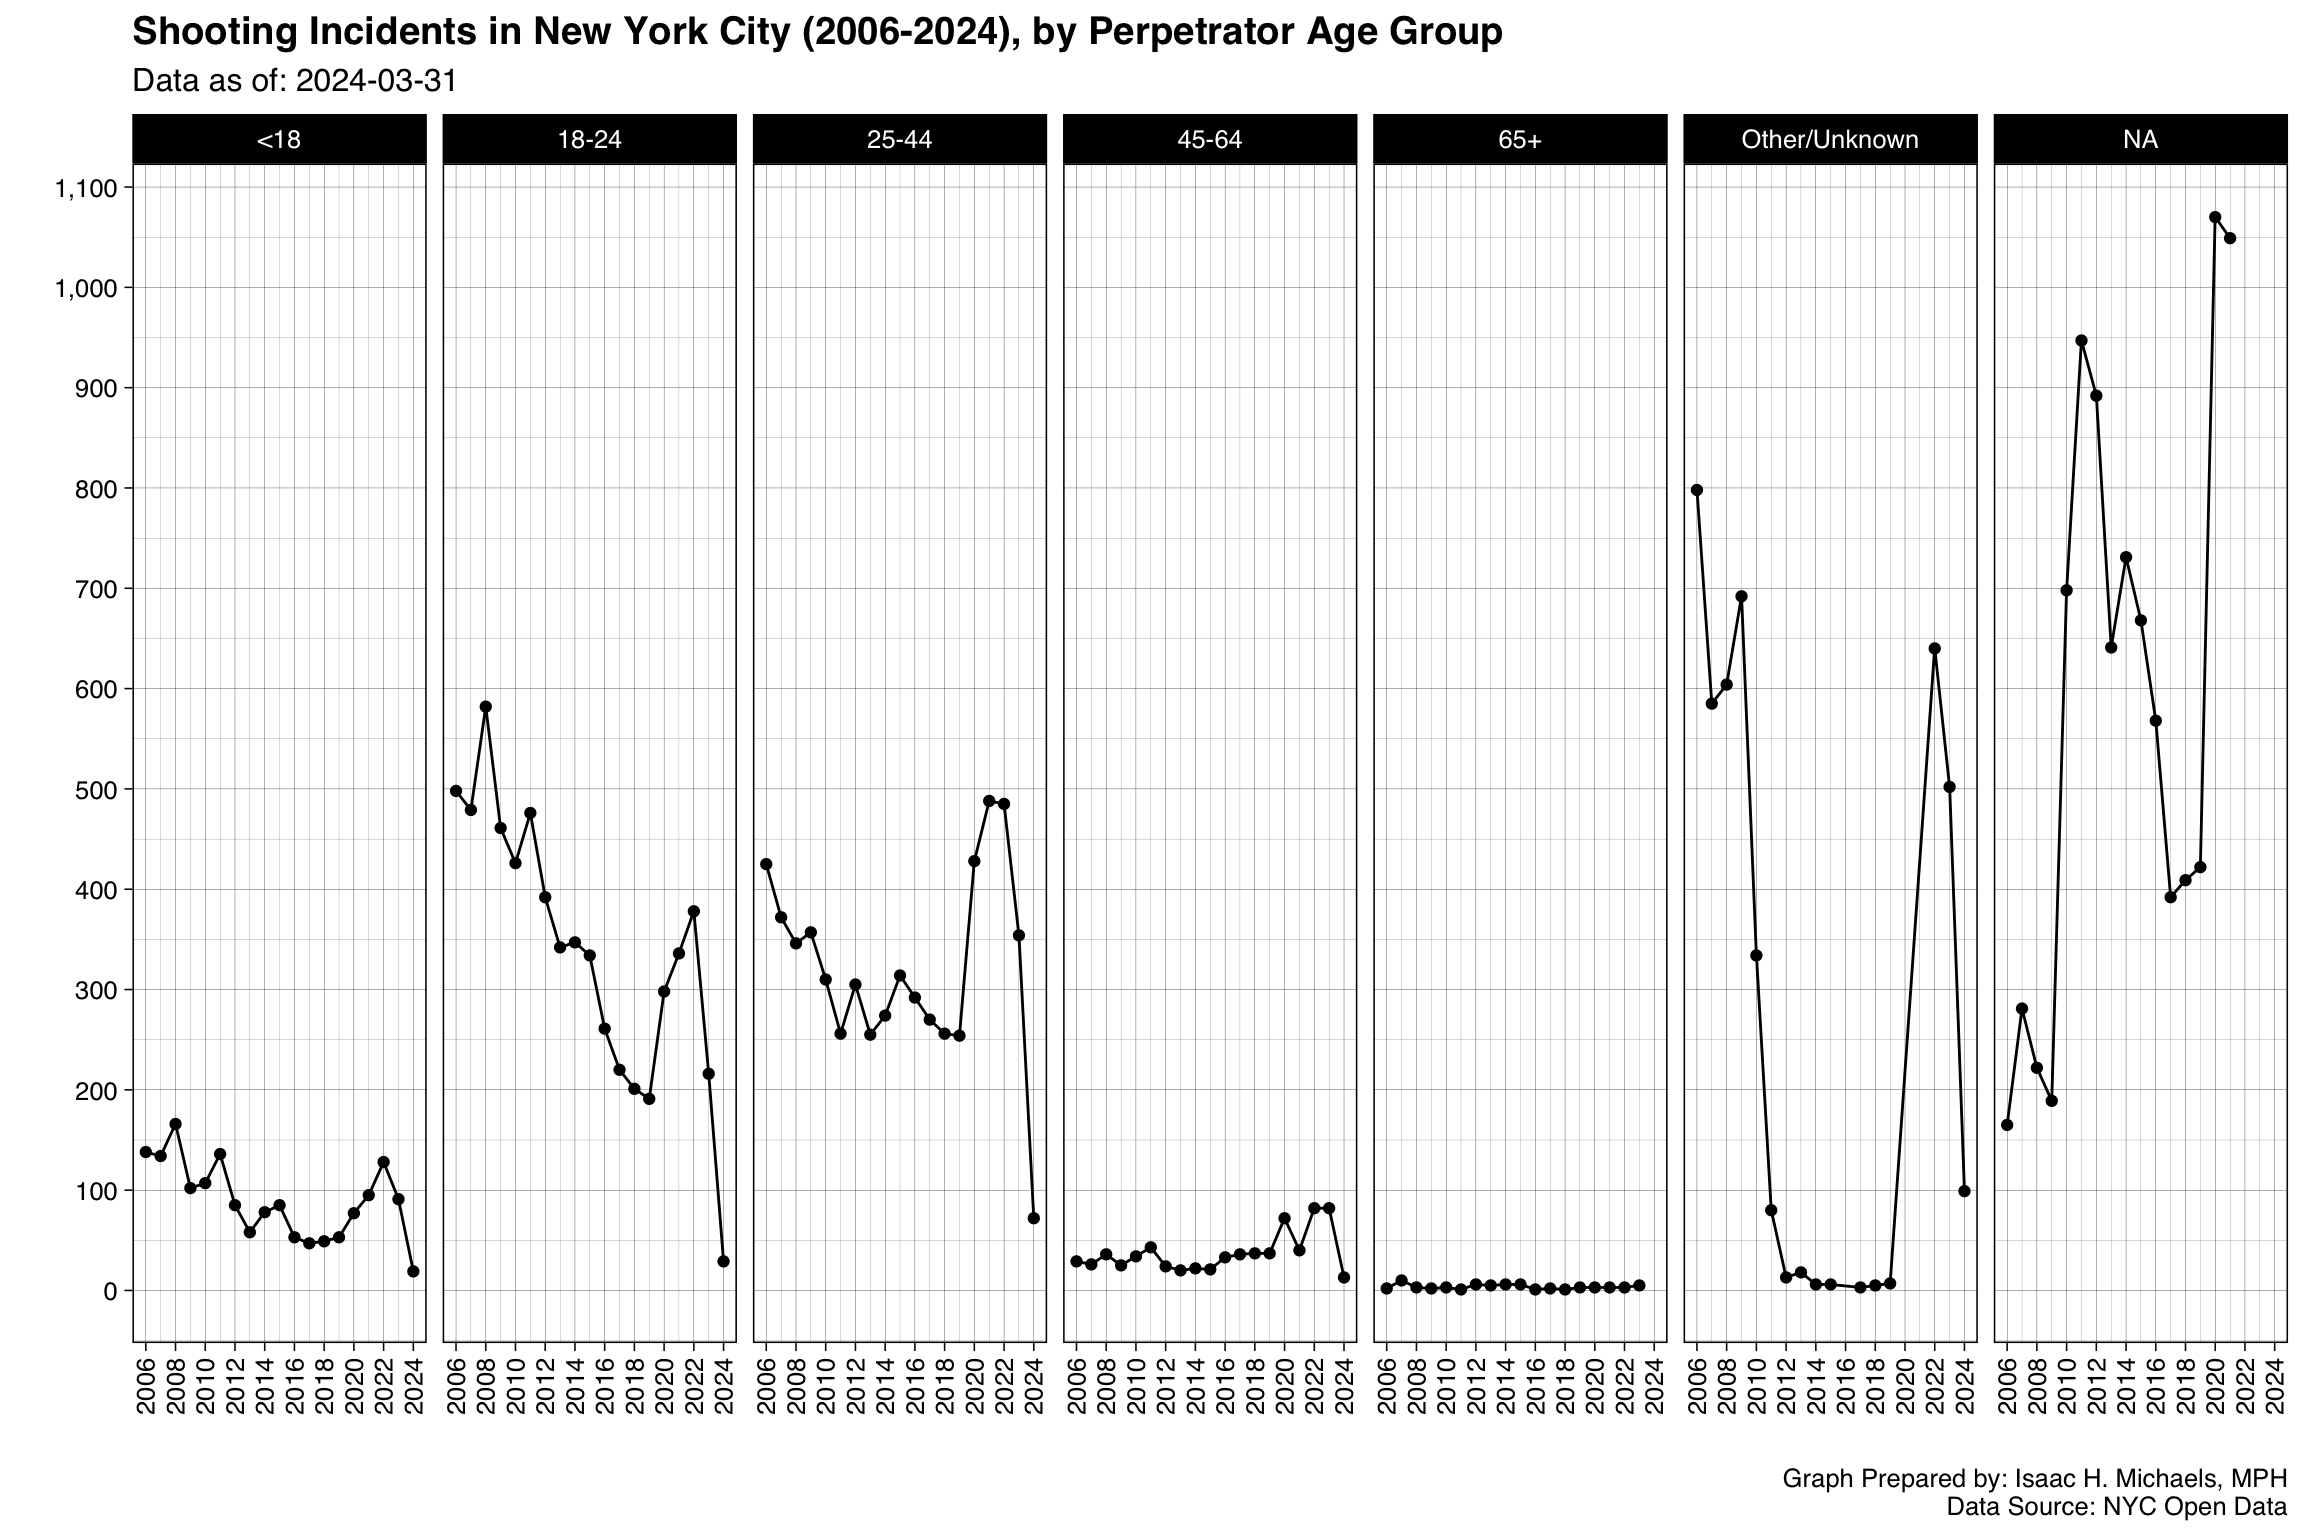
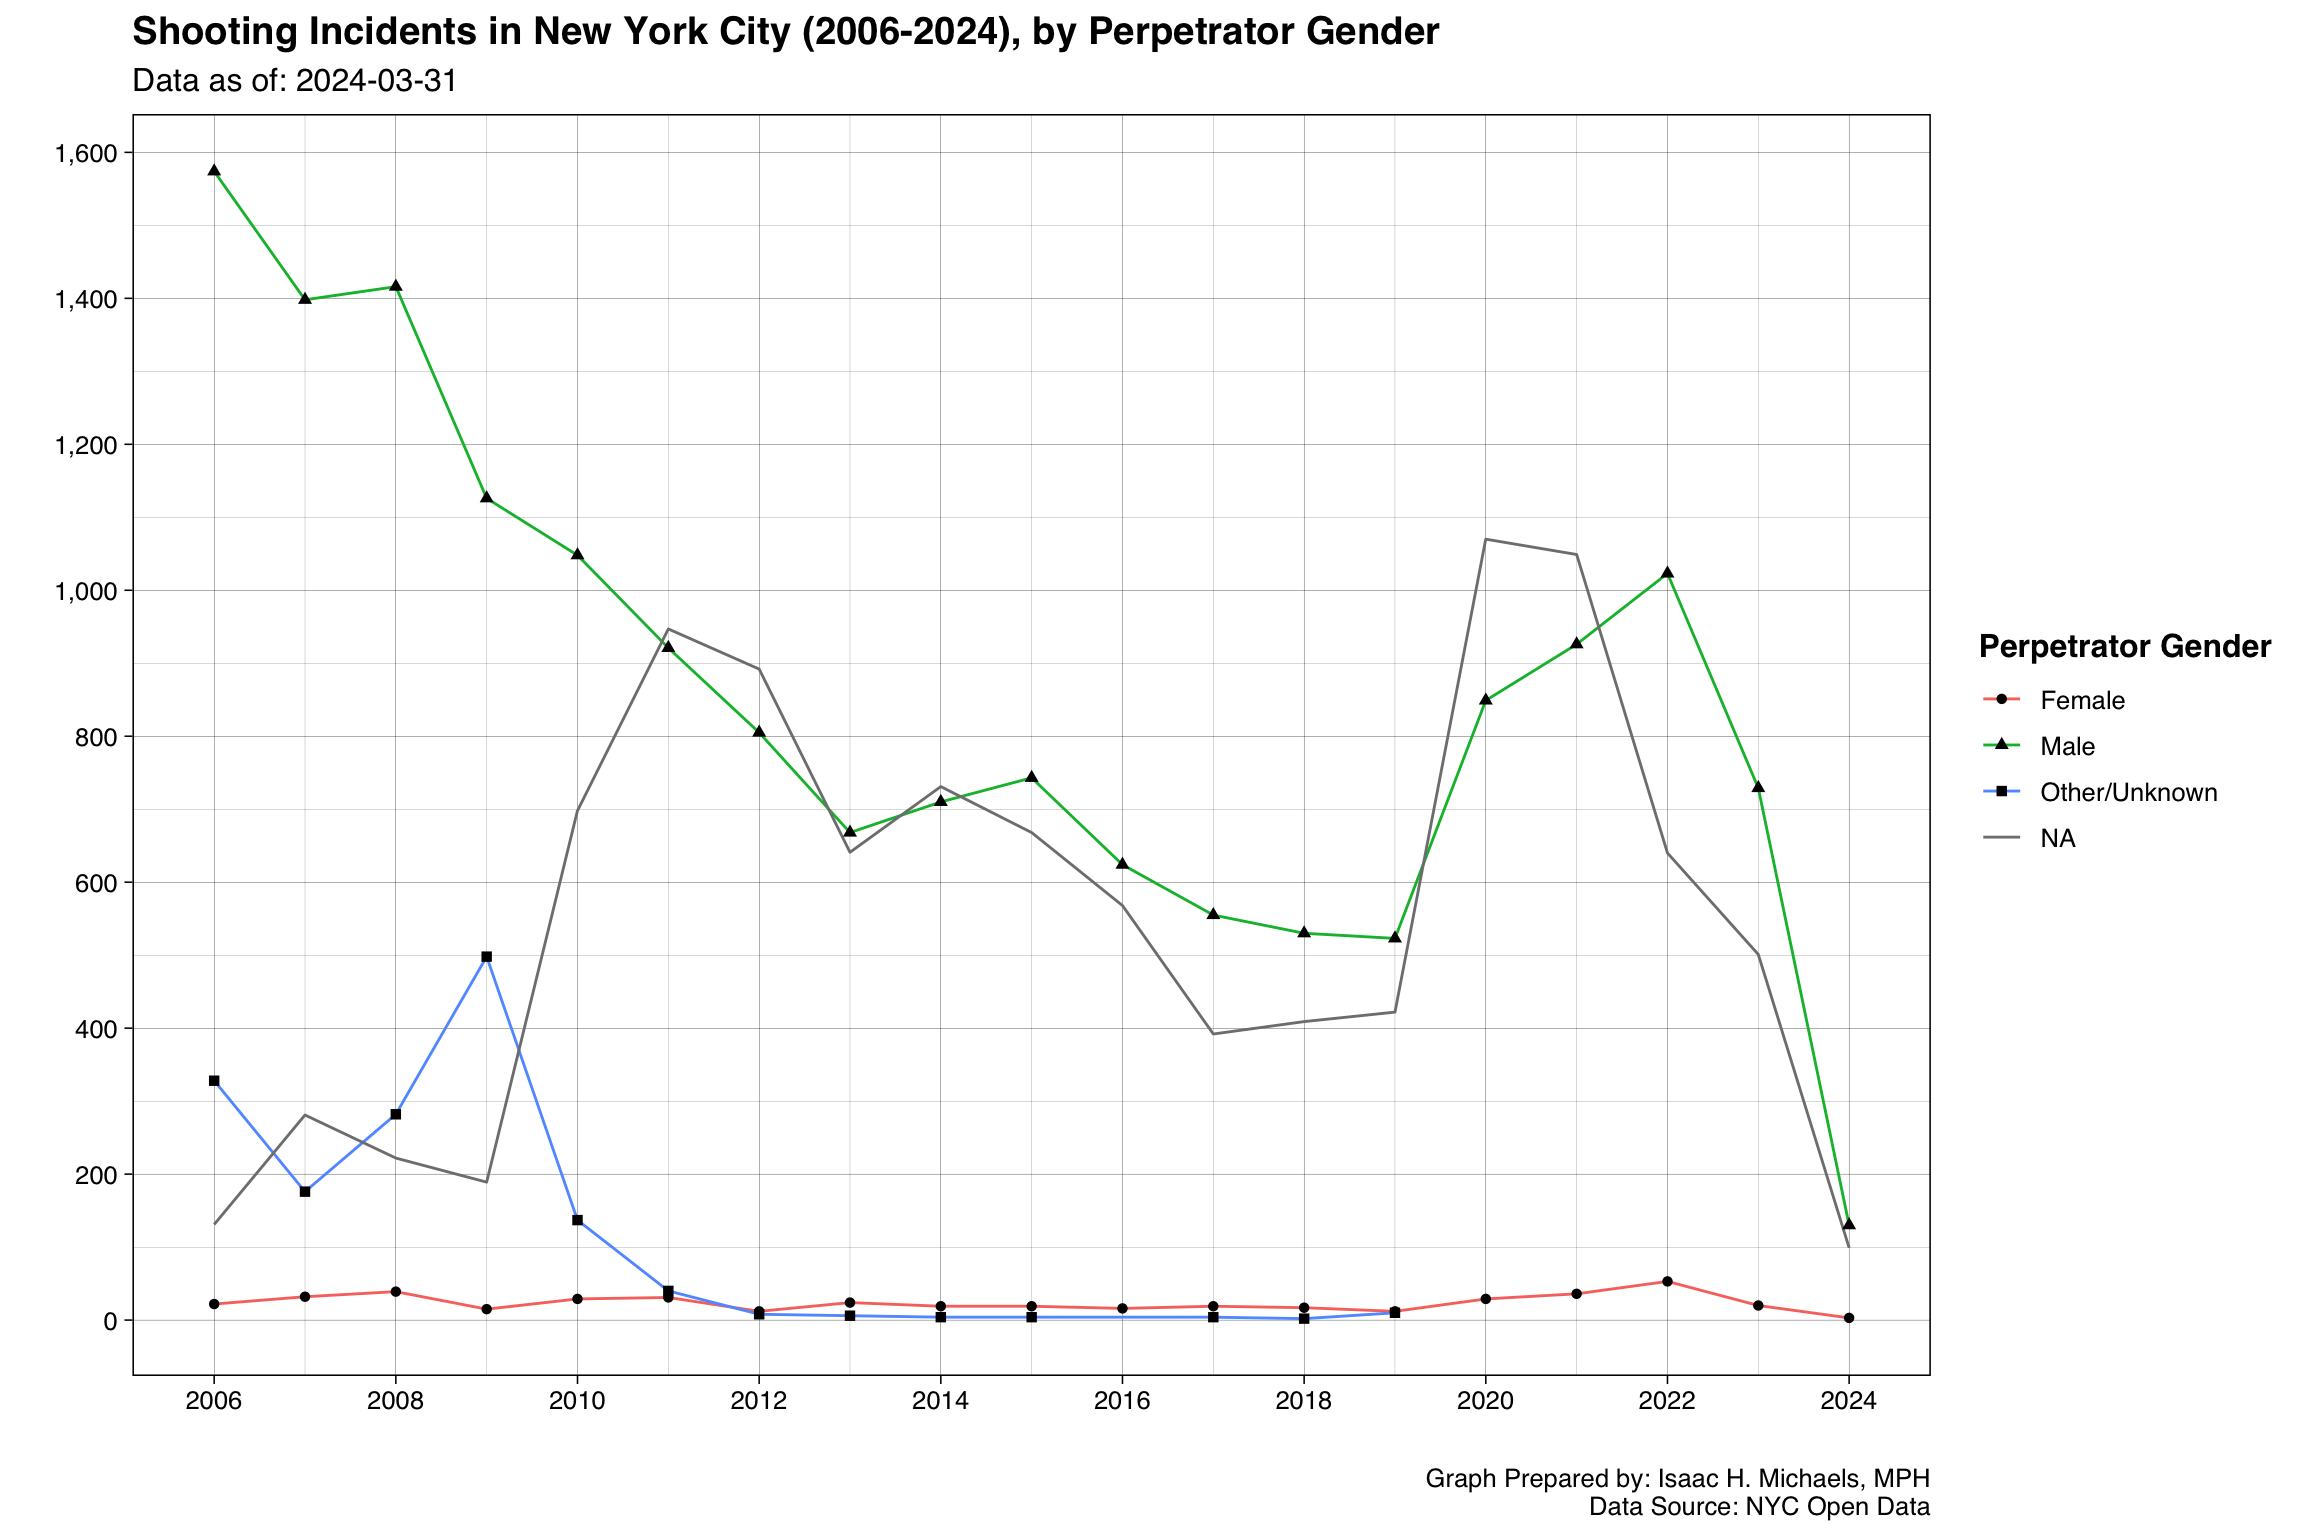
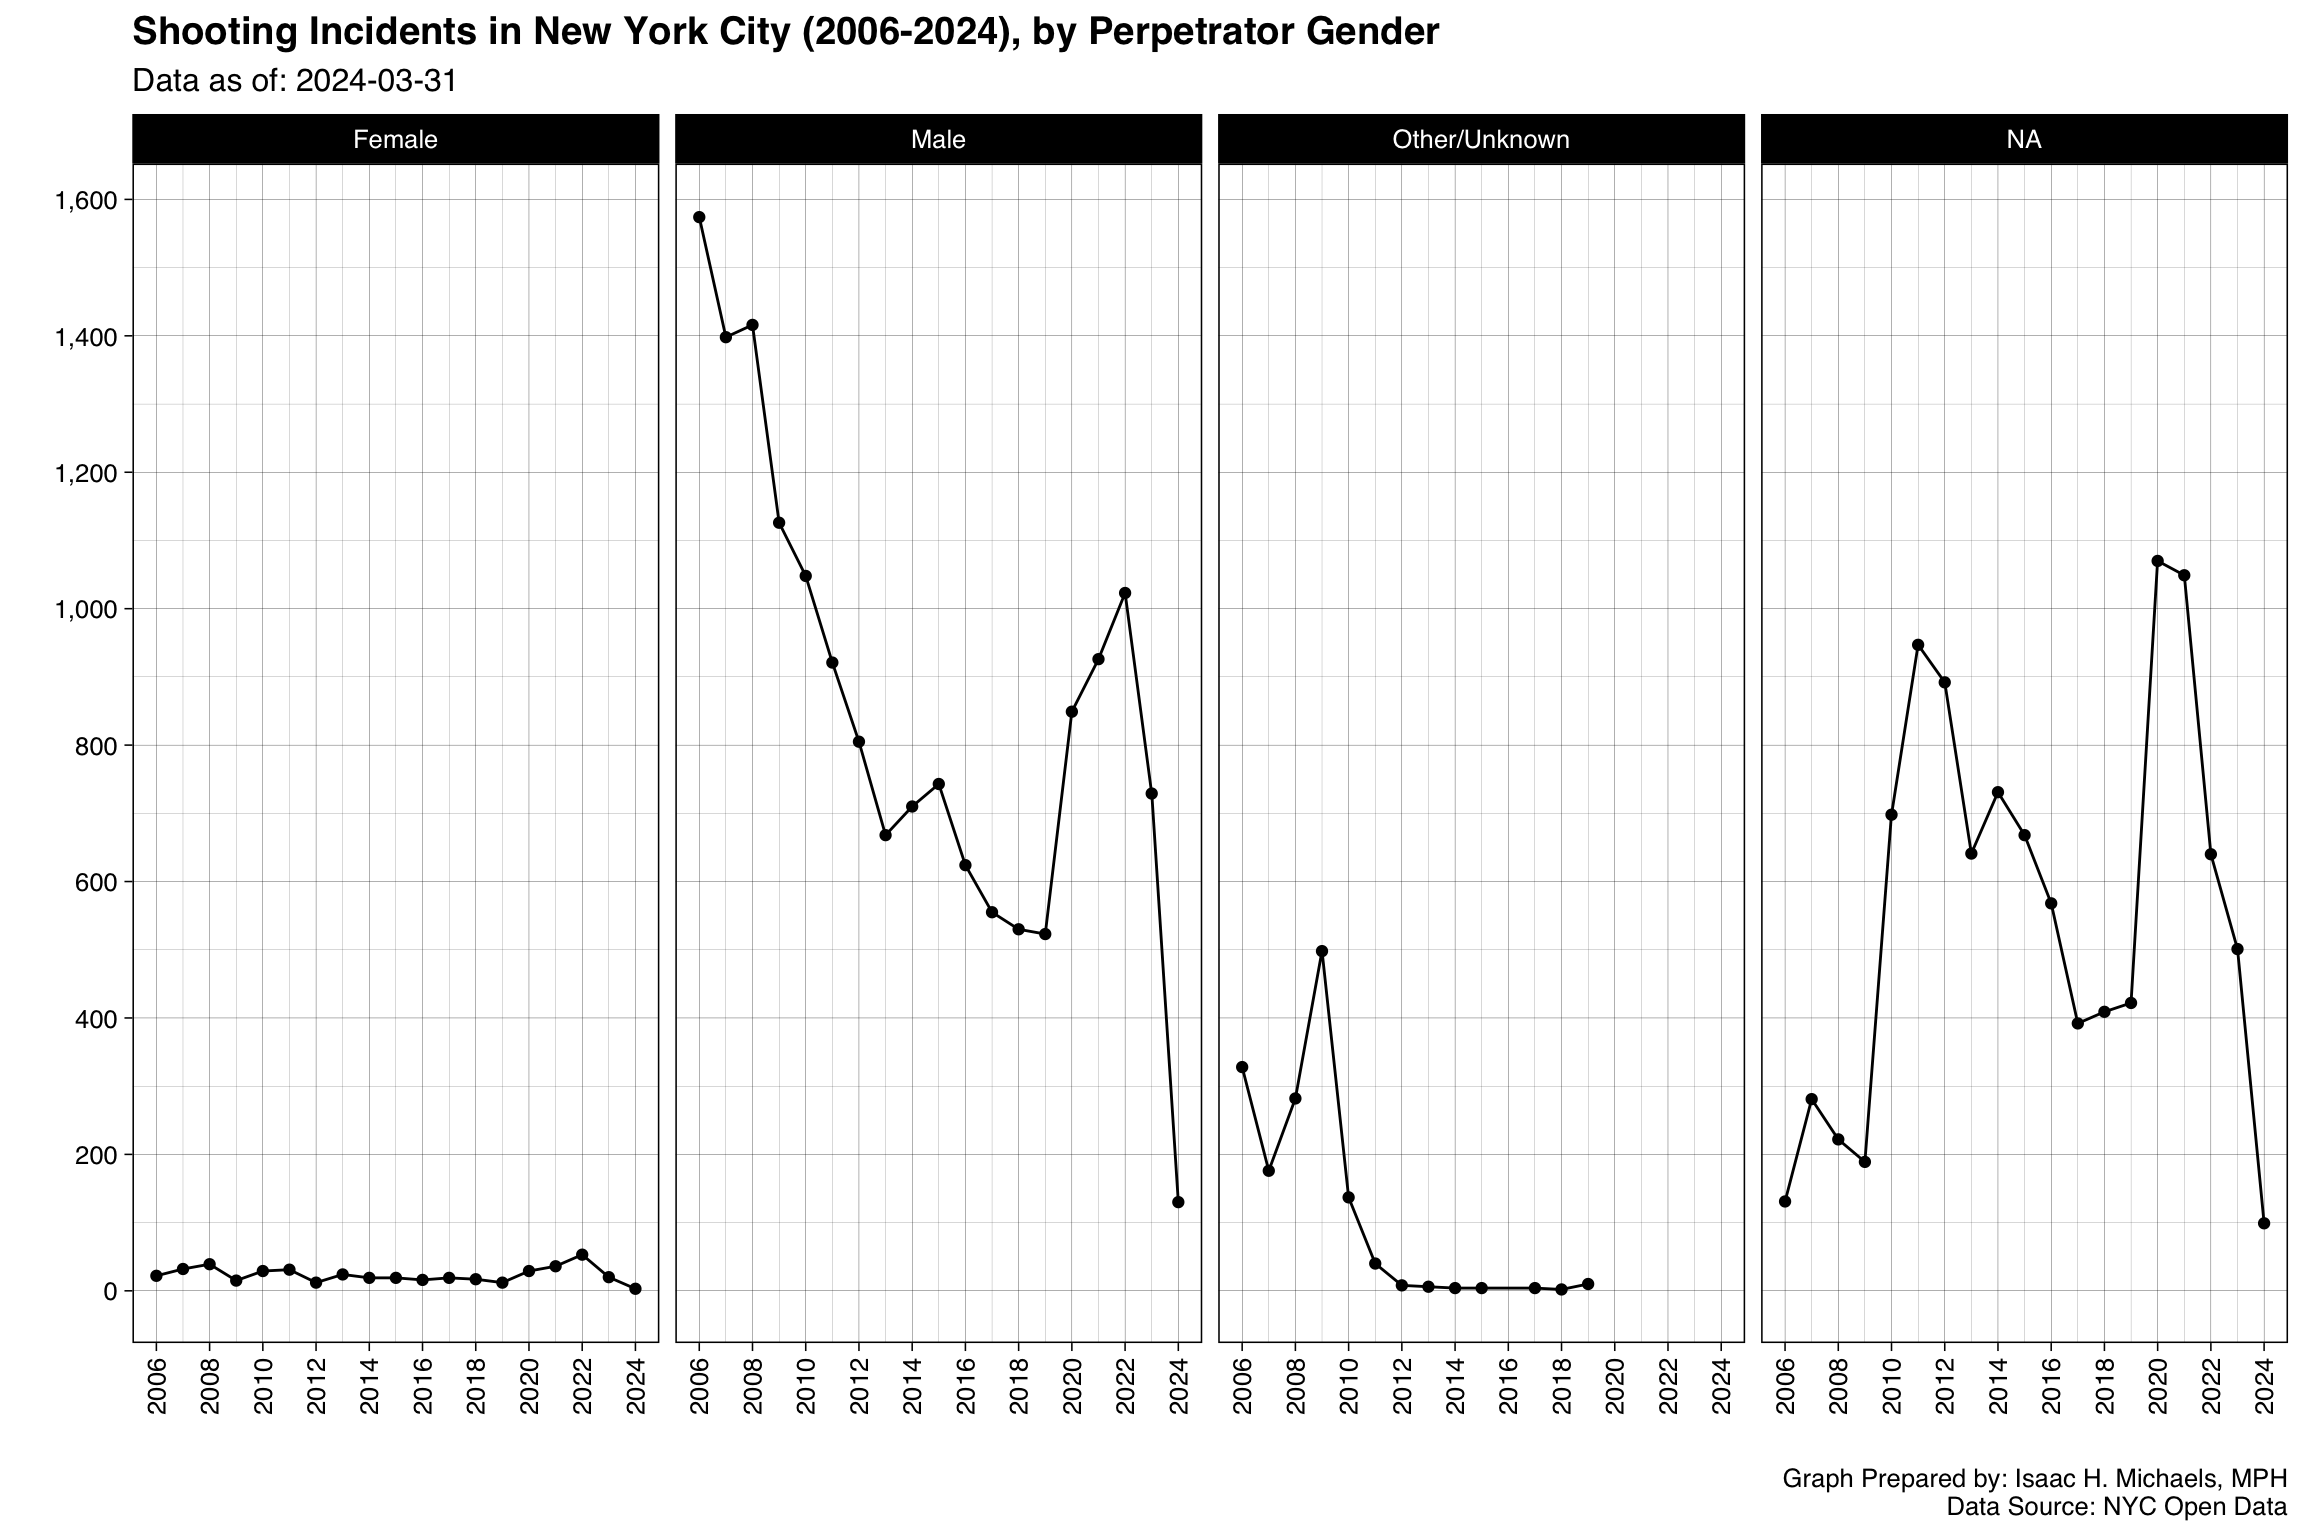
These charts break down the longitudinal trajectory of gun violence by specific demographic groups for perpetrators. The overlay chart allows you to easily compare the relative incident volume between groups in any given year, while the faceted small multiples isolate each demographic group’s unique historical trend. You can look for diverging lines to determine if a specific demographic group of offenders is driving a recent citywide spike while others remain stable.
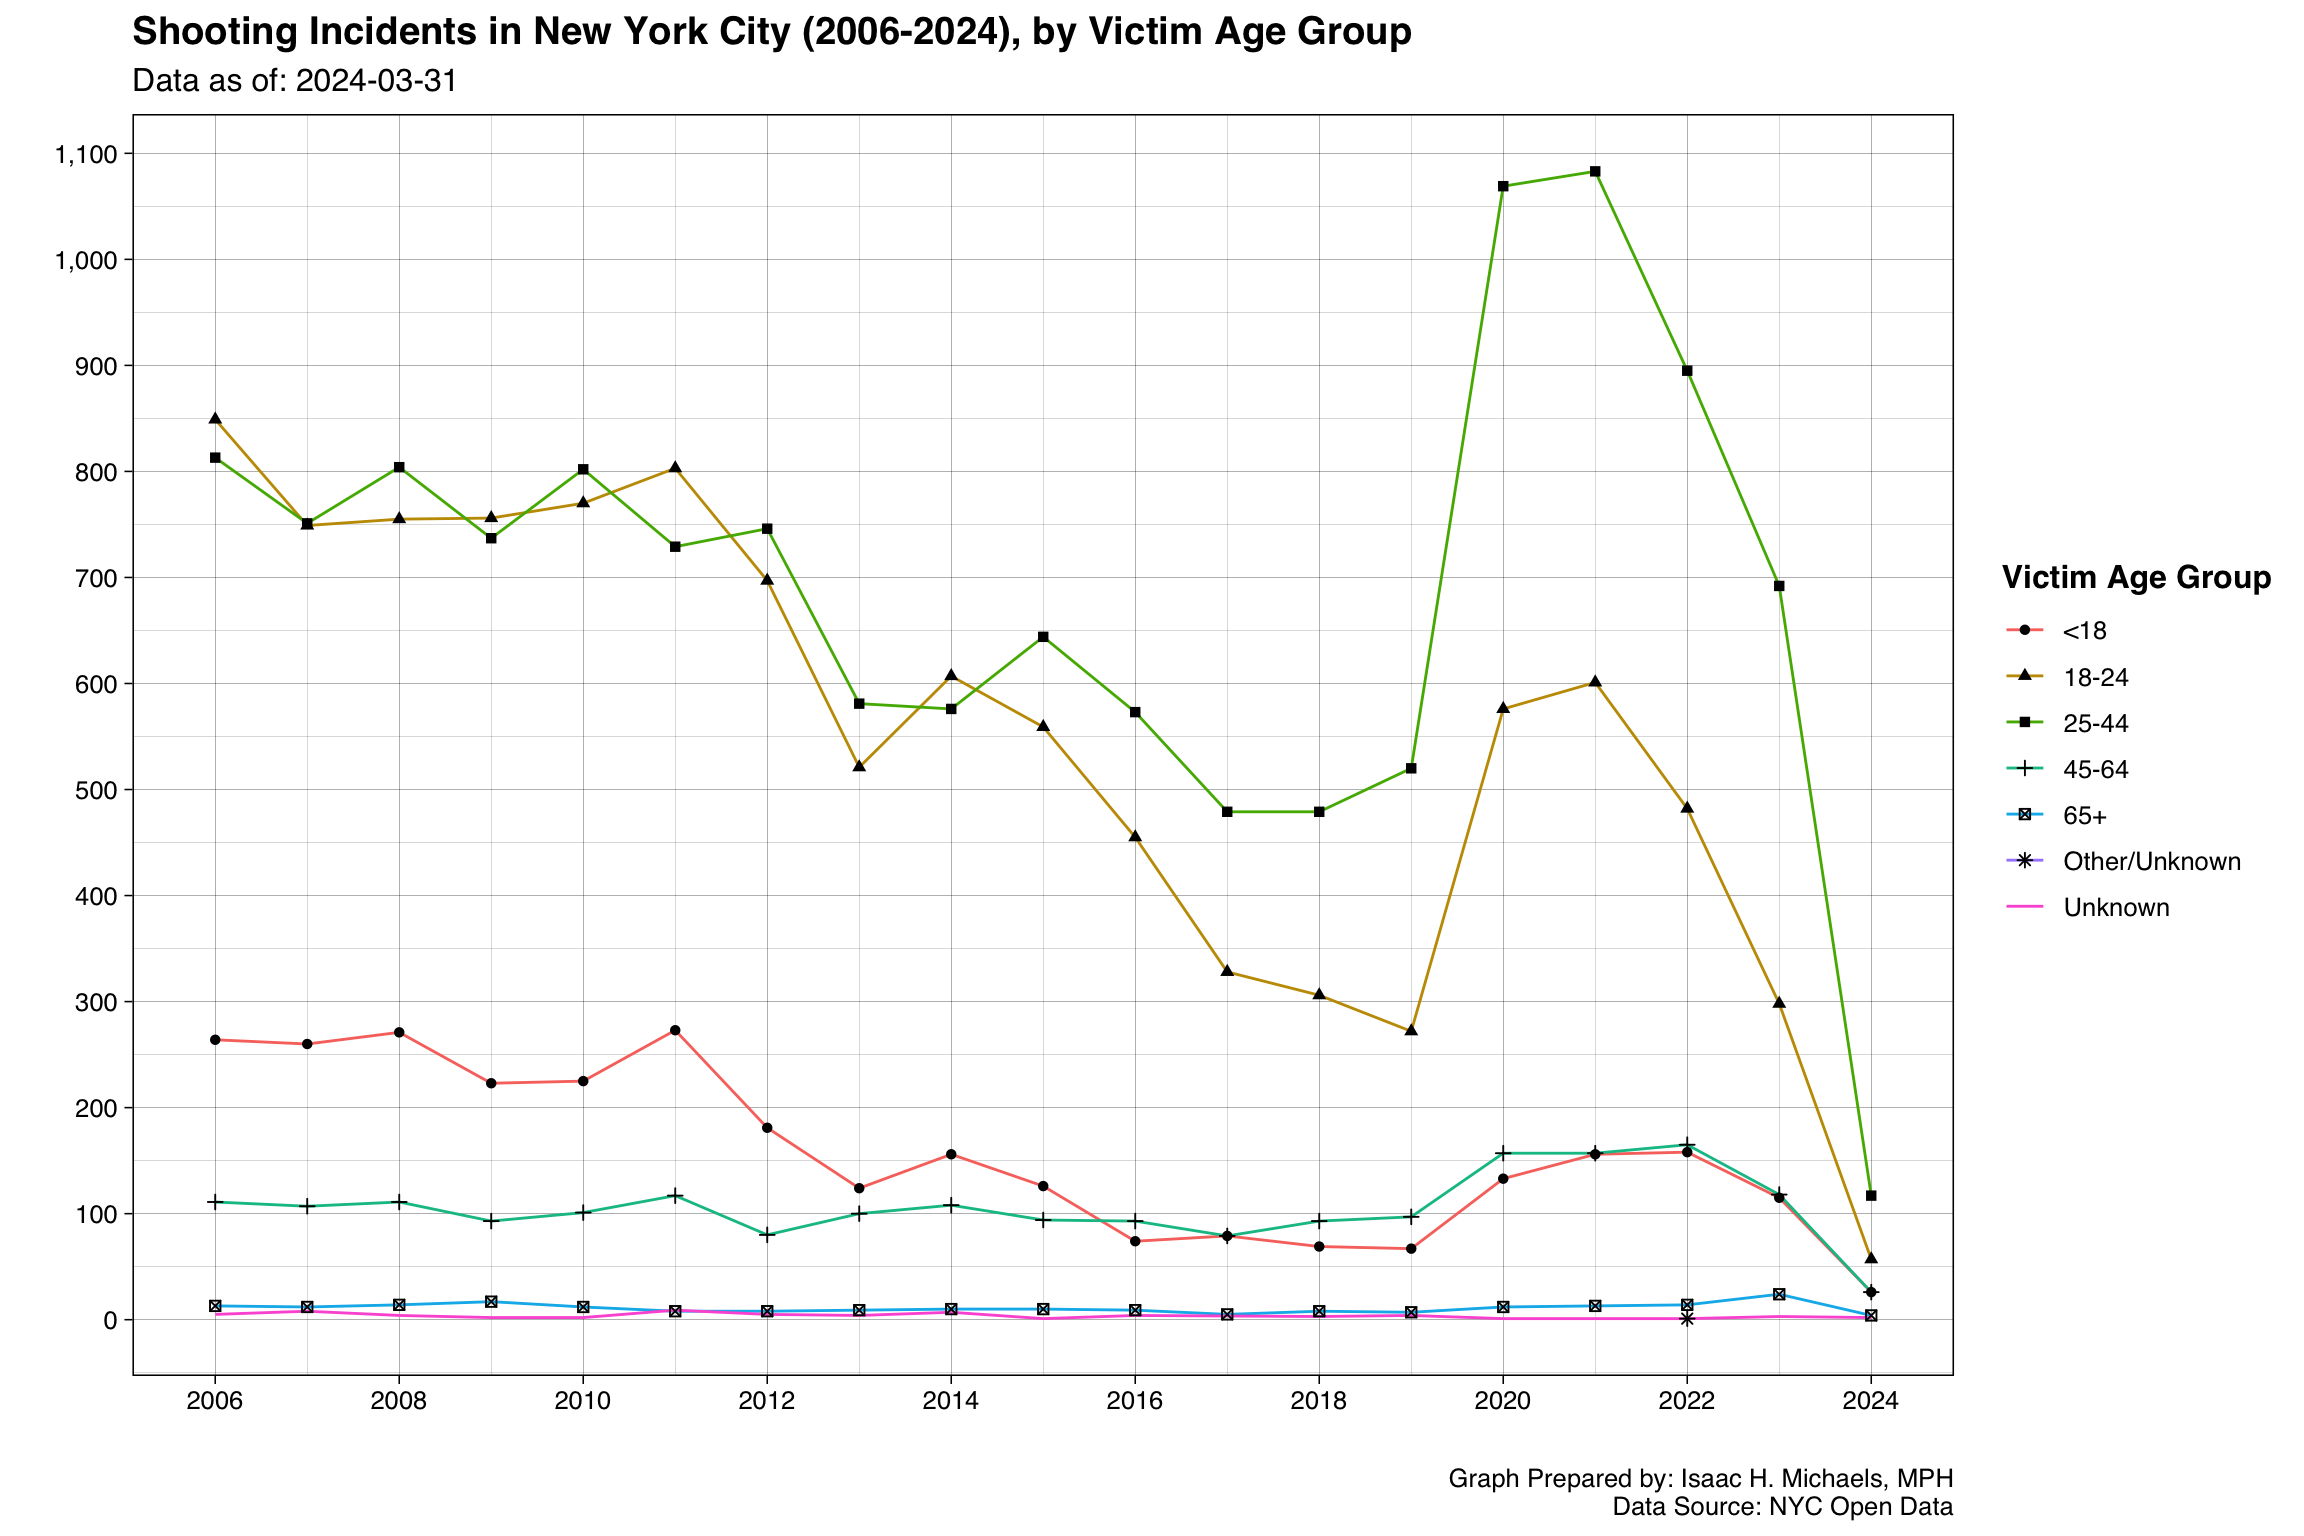
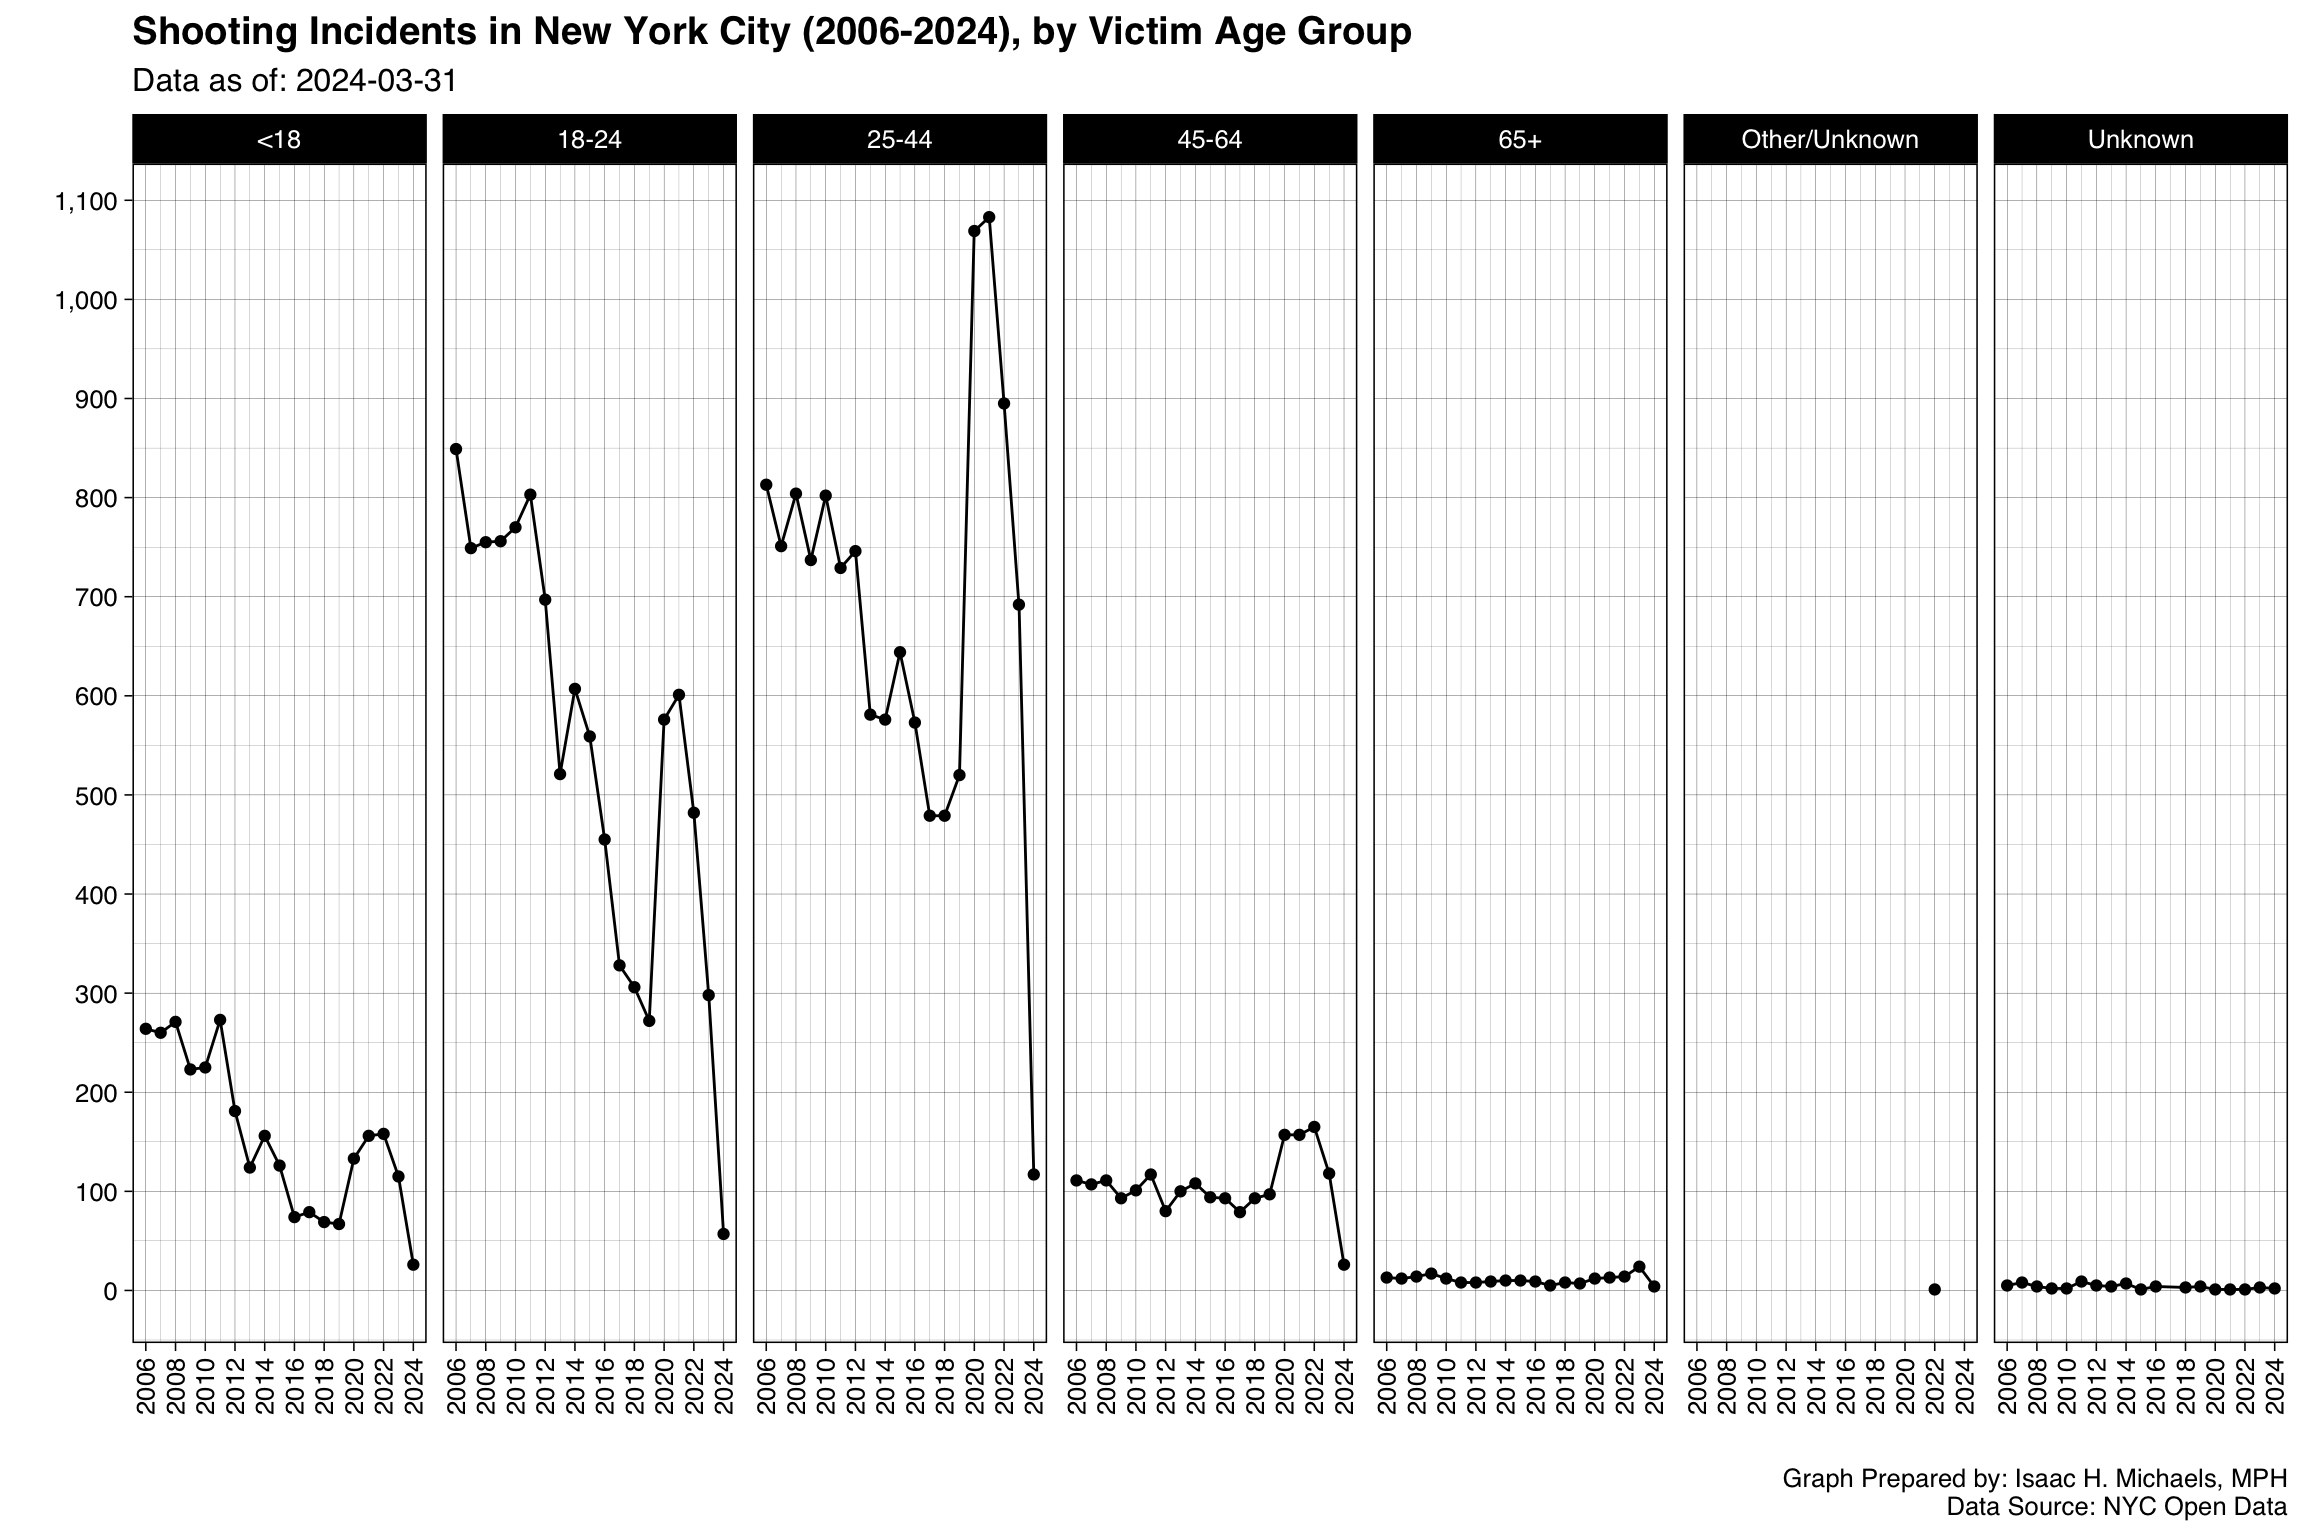
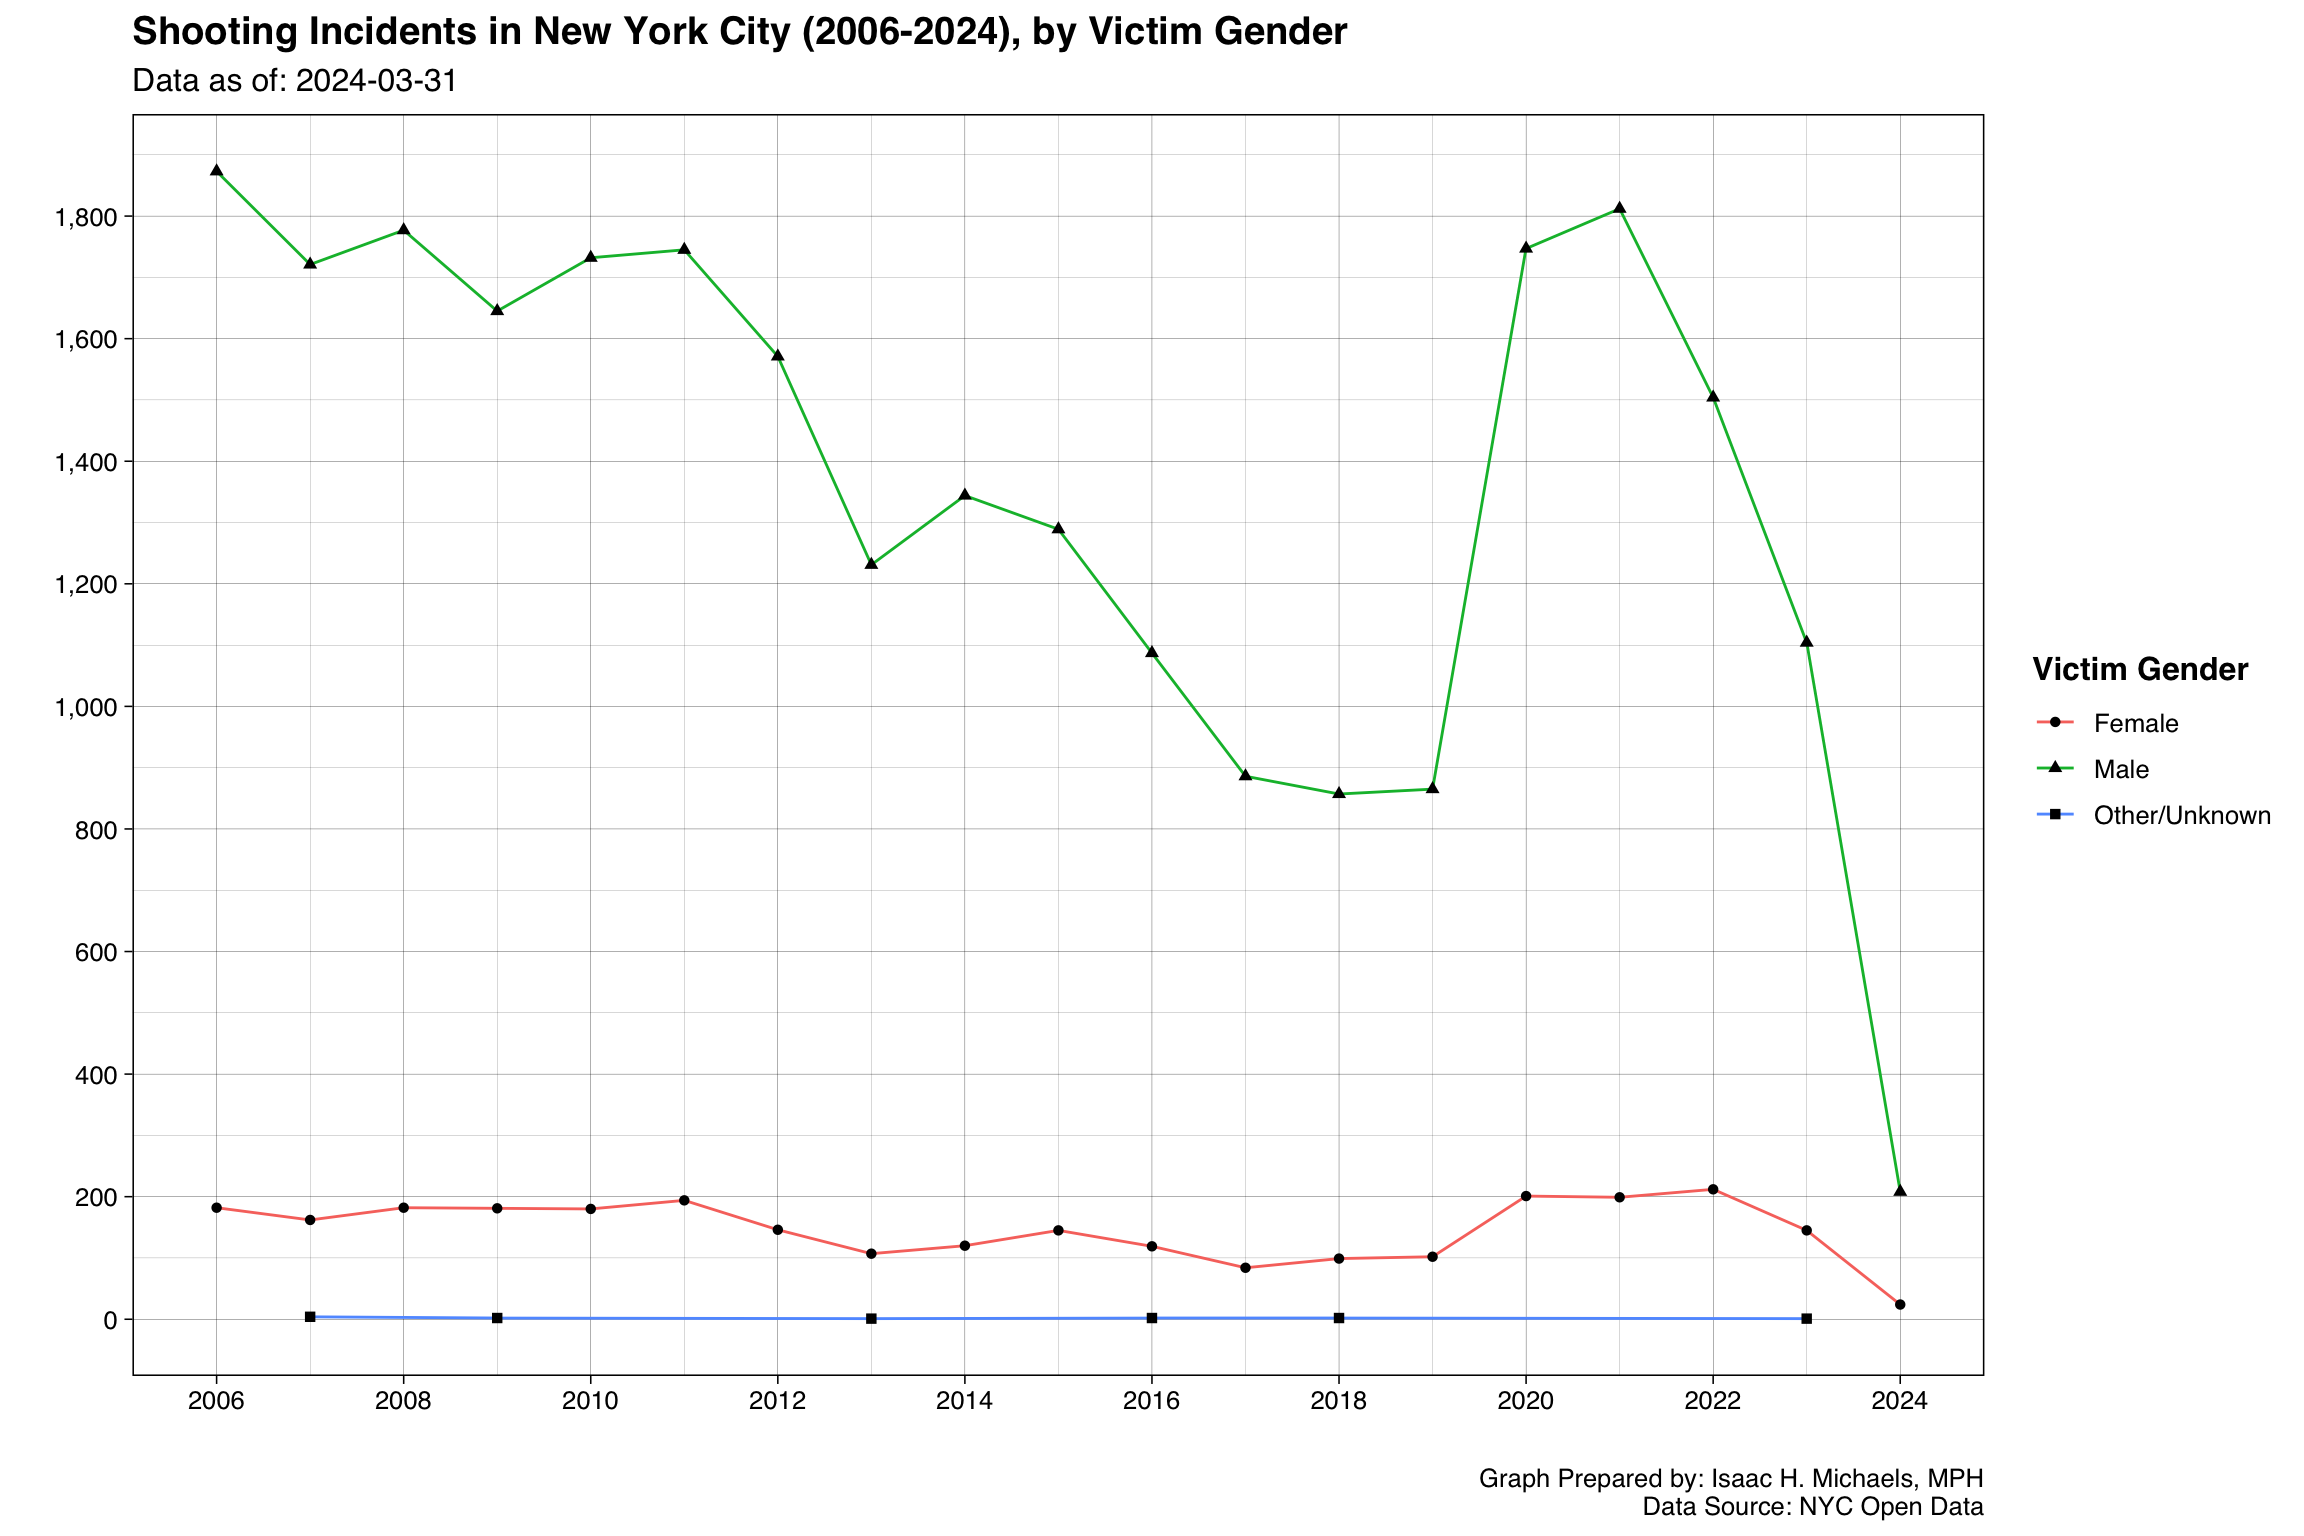
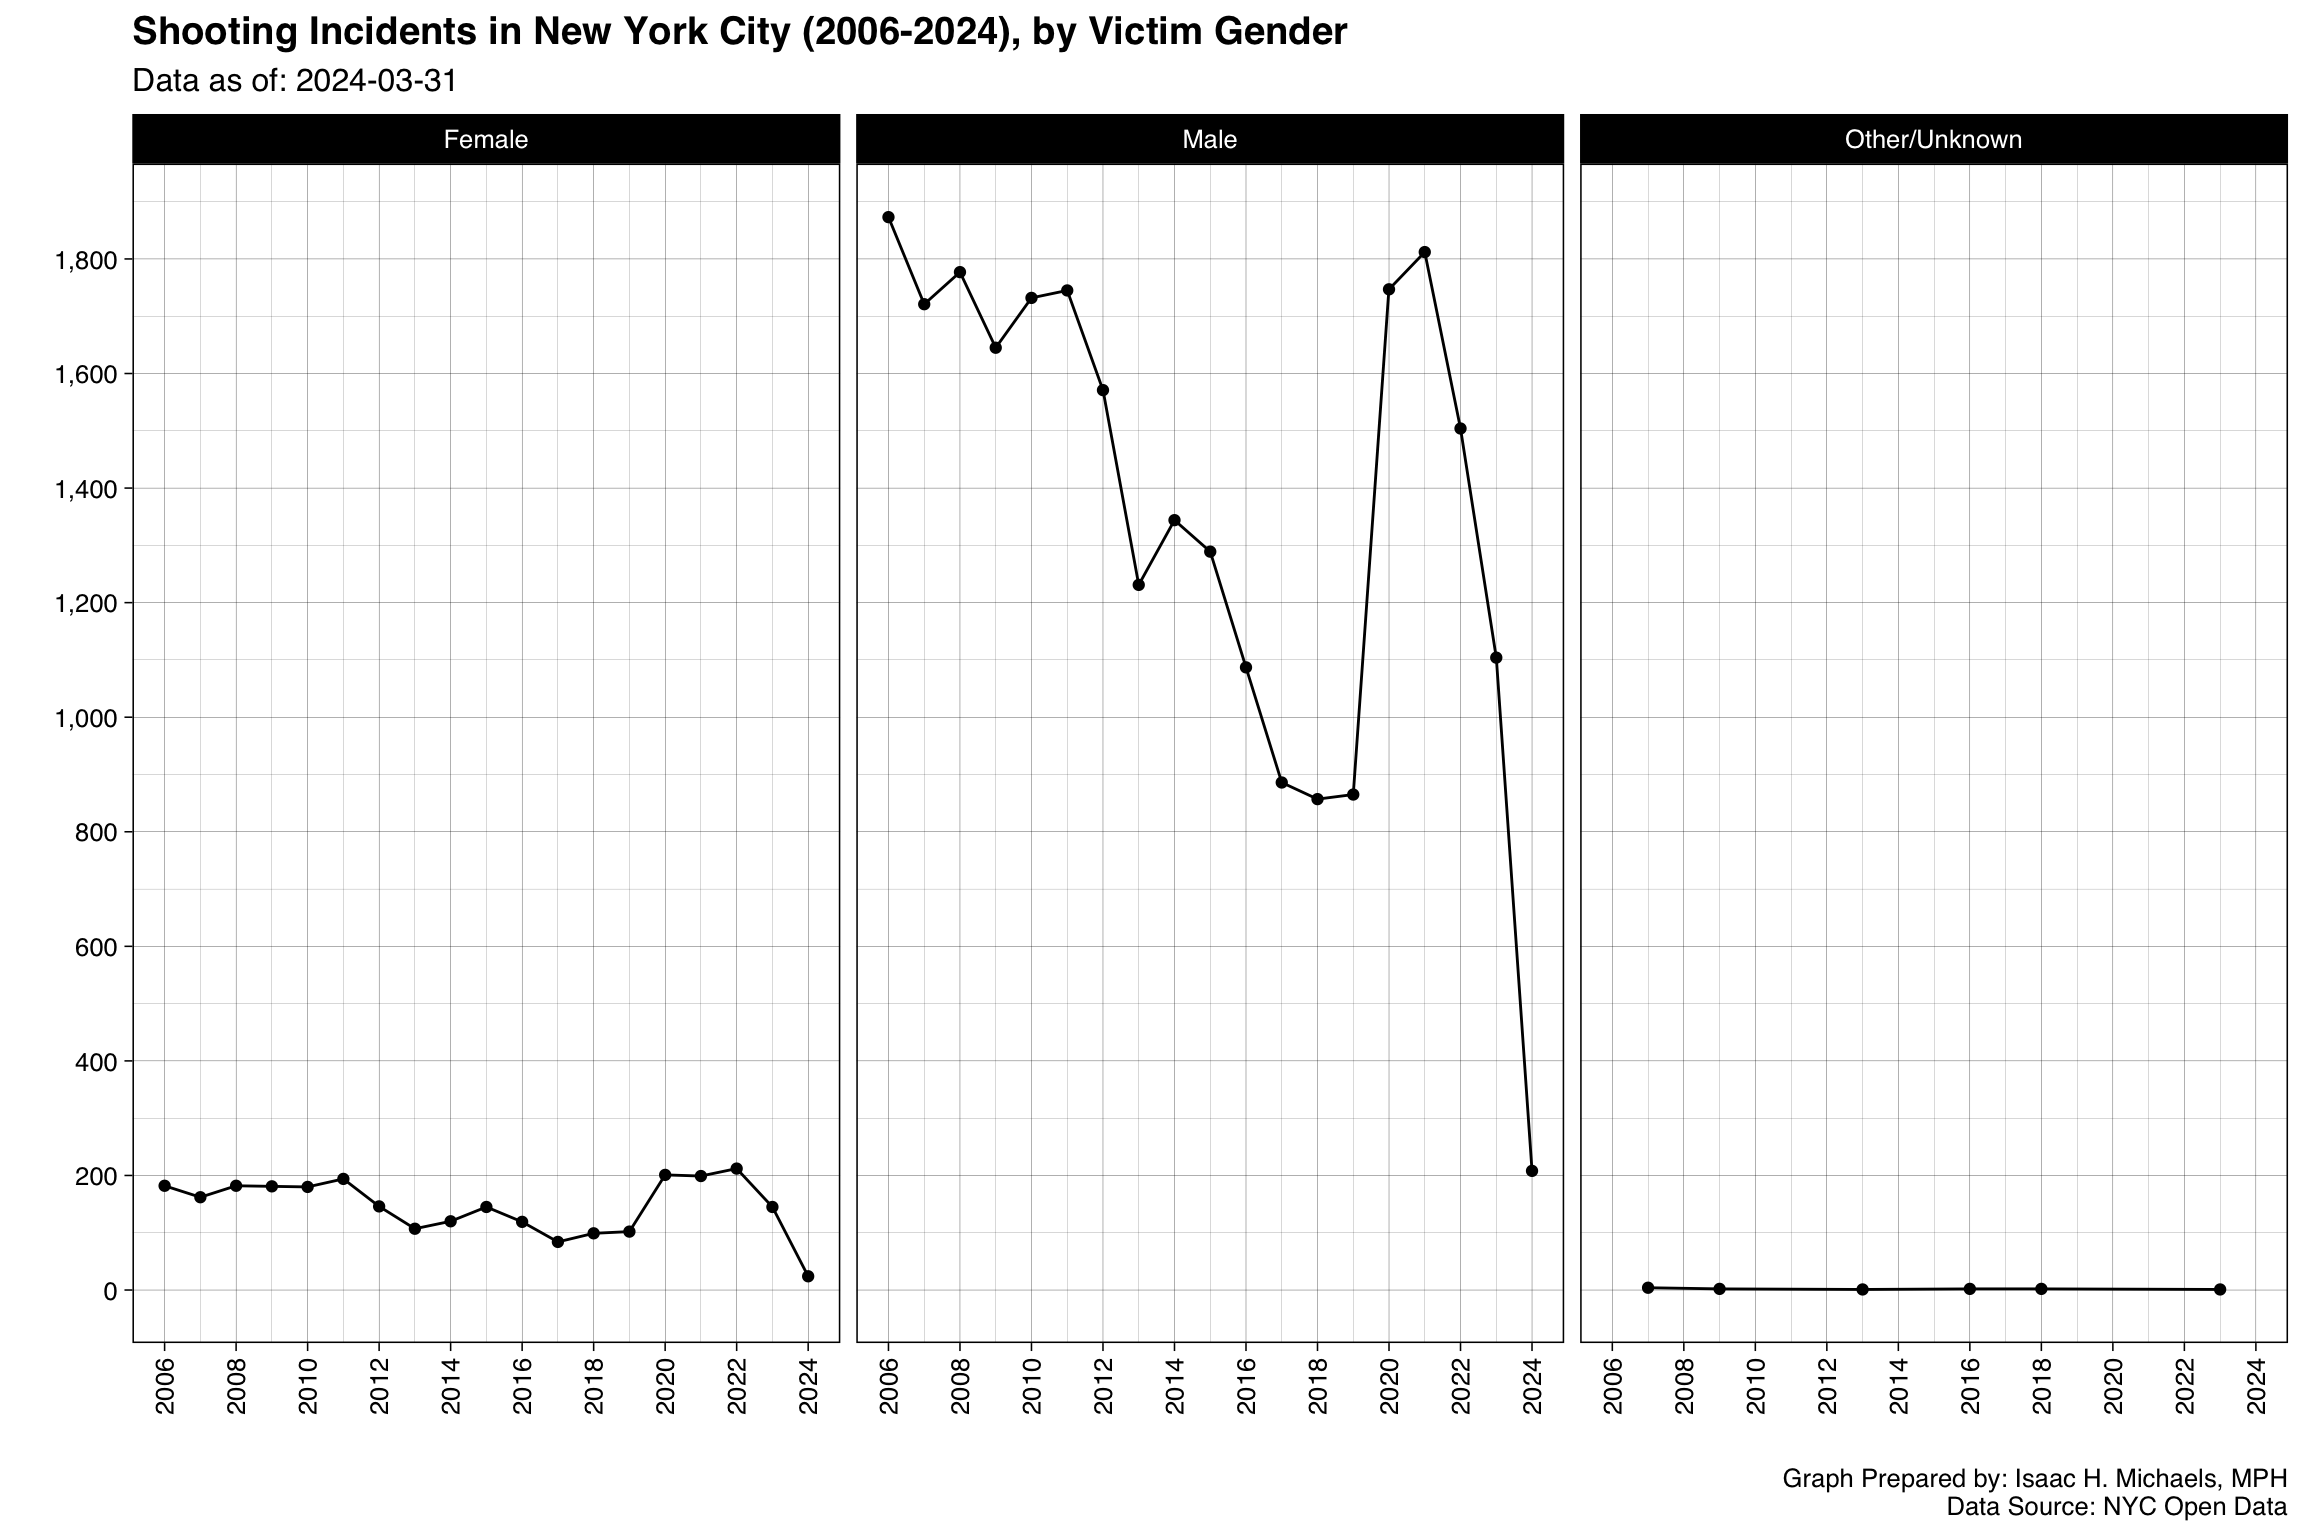
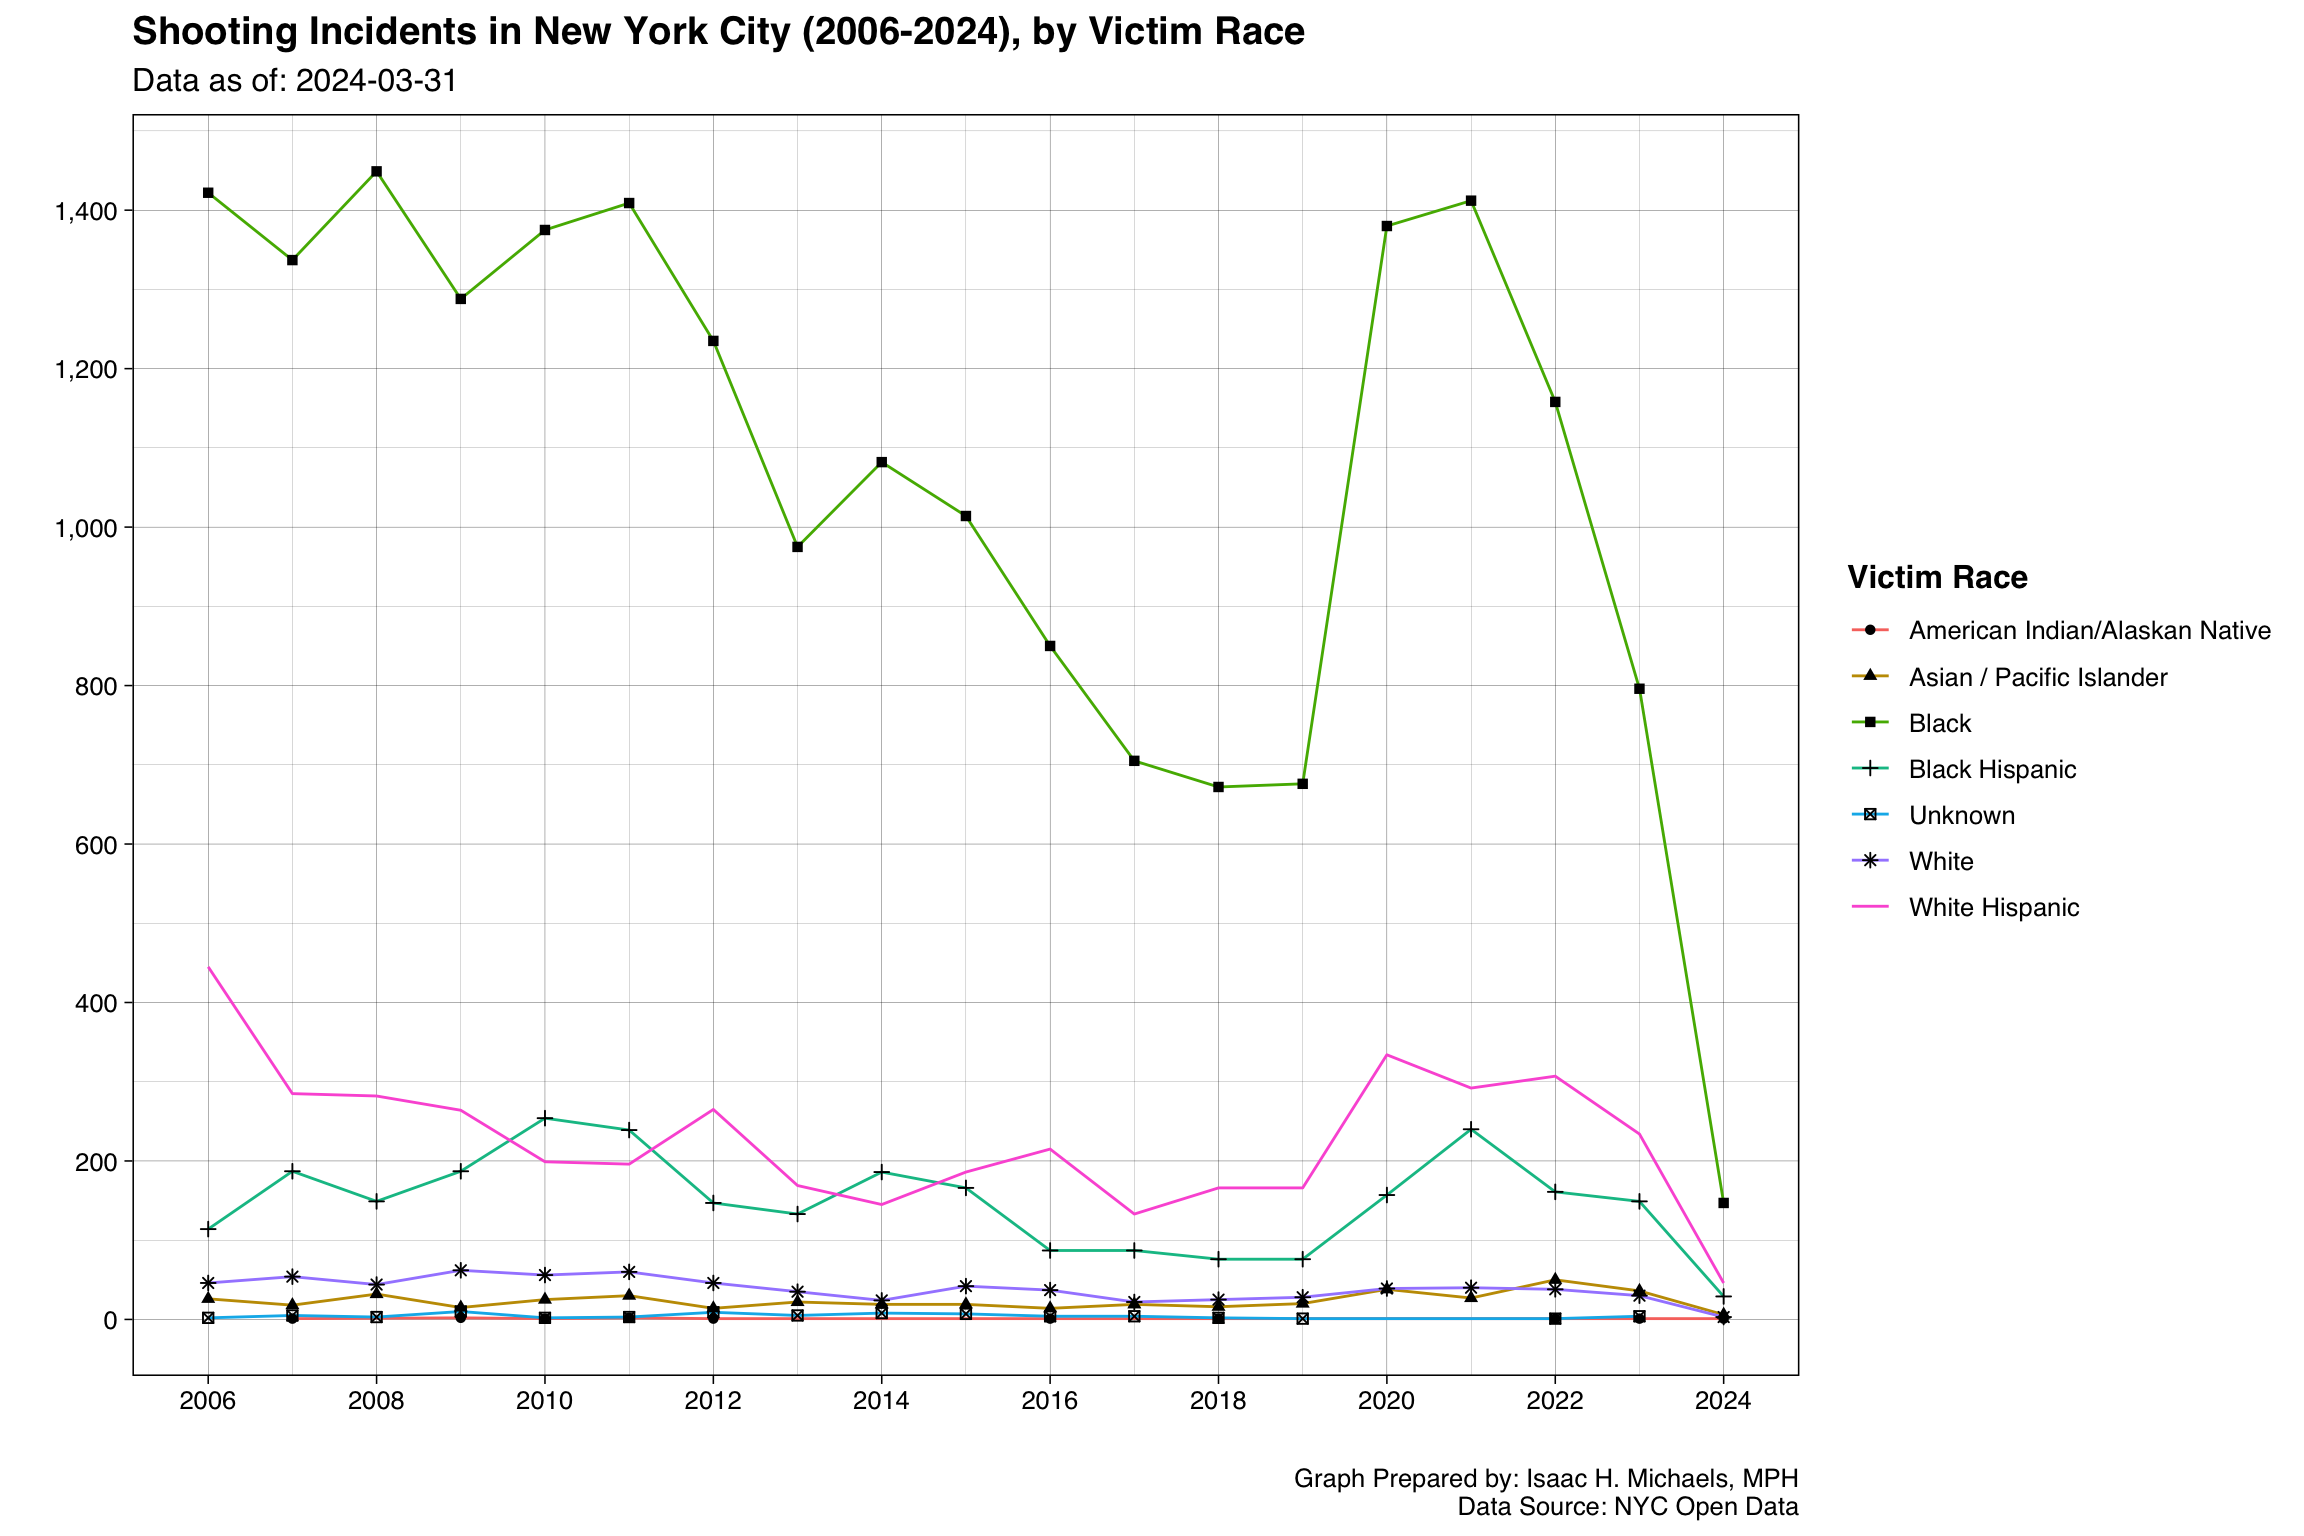
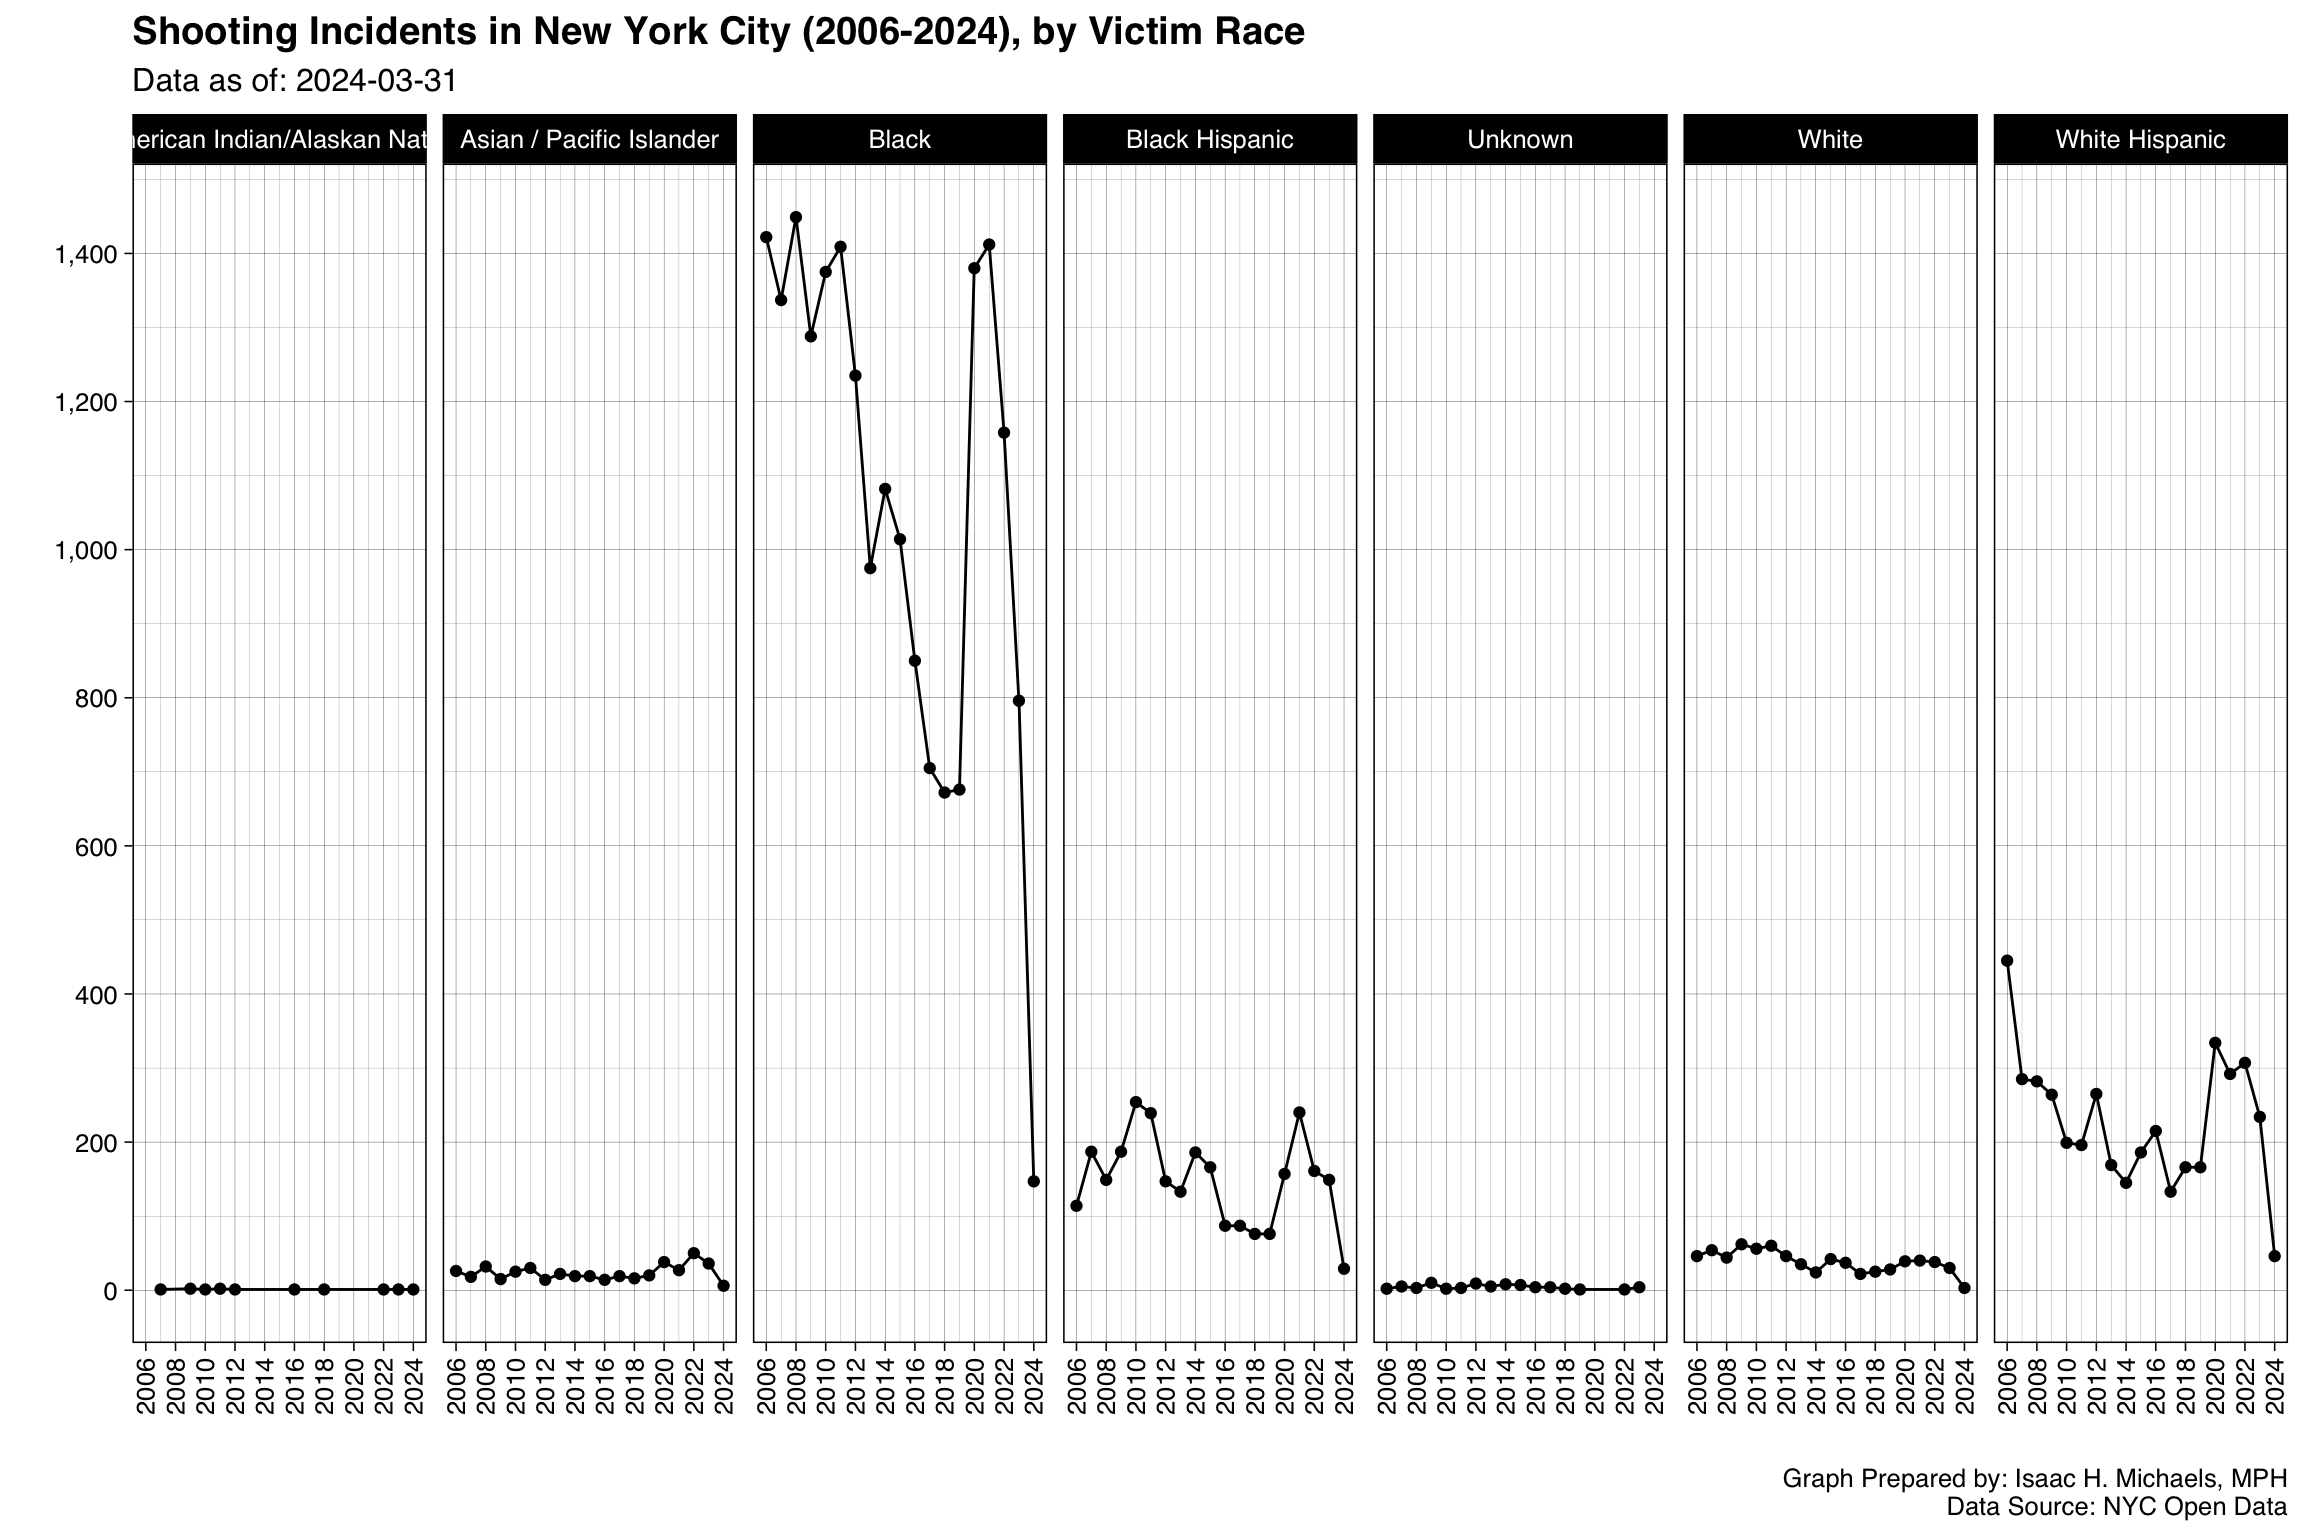
Trends: Victims
These charts mirror the perpetrator analysis by isolating the longitudinal trajectory of violence experienced by specific demographic groups of victims. By evaluating both the overlay and faceted trend lines, you can ensure that public health messaging, victim support services, and preventative resources are reaching the specific populations most heavily impacted by shifts in community violence over time.
Age Groups
Cumulative Counts
 Graph Prepared By: Isaac H. Michaels, DrPH
Data Source: NYC Open Data (Current, Historical)
Trends
Perpetrators
 Graph Prepared By: Isaac H. Michaels, DrPH
Data Source: NYC Open Data (Current, Historical)
 Graph Prepared By: Isaac H. Michaels, DrPH
Data Source: NYC Open Data (Current, Historical)
Victims
 Graph Prepared By: Isaac H. Michaels, DrPH
Data Source: NYC Open Data (Current, Historical)
 Graph Prepared By: Isaac H. Michaels, DrPH
Data Source: NYC Open Data (Current, Historical)
Genders
Cumulative Counts
 Graph Prepared By: Isaac H. Michaels, DrPH
Data Source: NYC Open Data (Current, Historical)
Trends
Perpetrators
 Graph Prepared By: Isaac H. Michaels, DrPH
Data Source: NYC Open Data (Current, Historical)
 Graph Prepared By: Isaac H. Michaels, DrPH
Data Source: NYC Open Data (Current, Historical)
Victims
 Graph Prepared By: Isaac H. Michaels, DrPH
Data Source: NYC Open Data (Current, Historical)
 Graph Prepared By: Isaac H. Michaels, DrPH
Data Source: NYC Open Data (Current, Historical)
Races/Ethnicities
Cumulative Counts
 Graph Prepared By: Isaac H. Michaels, DrPH
Data Source: NYC Open Data (Current, Historical)
Trends
Perpetrators
 Graph Prepared By: Isaac H. Michaels, DrPH
Data Source: NYC Open Data (Current, Historical)
 Graph Prepared By: Isaac H. Michaels, DrPH
Data Source: NYC Open Data (Current, Historical)
Victims
 Graph Prepared By: Isaac H. Michaels, DrPH
Data Source: NYC Open Data (Current, Historical)
 Graph Prepared By: Isaac H. Michaels, DrPH
Data Source: NYC Open Data (Current, Historical)
Boroughs – All Years
All Boroughs
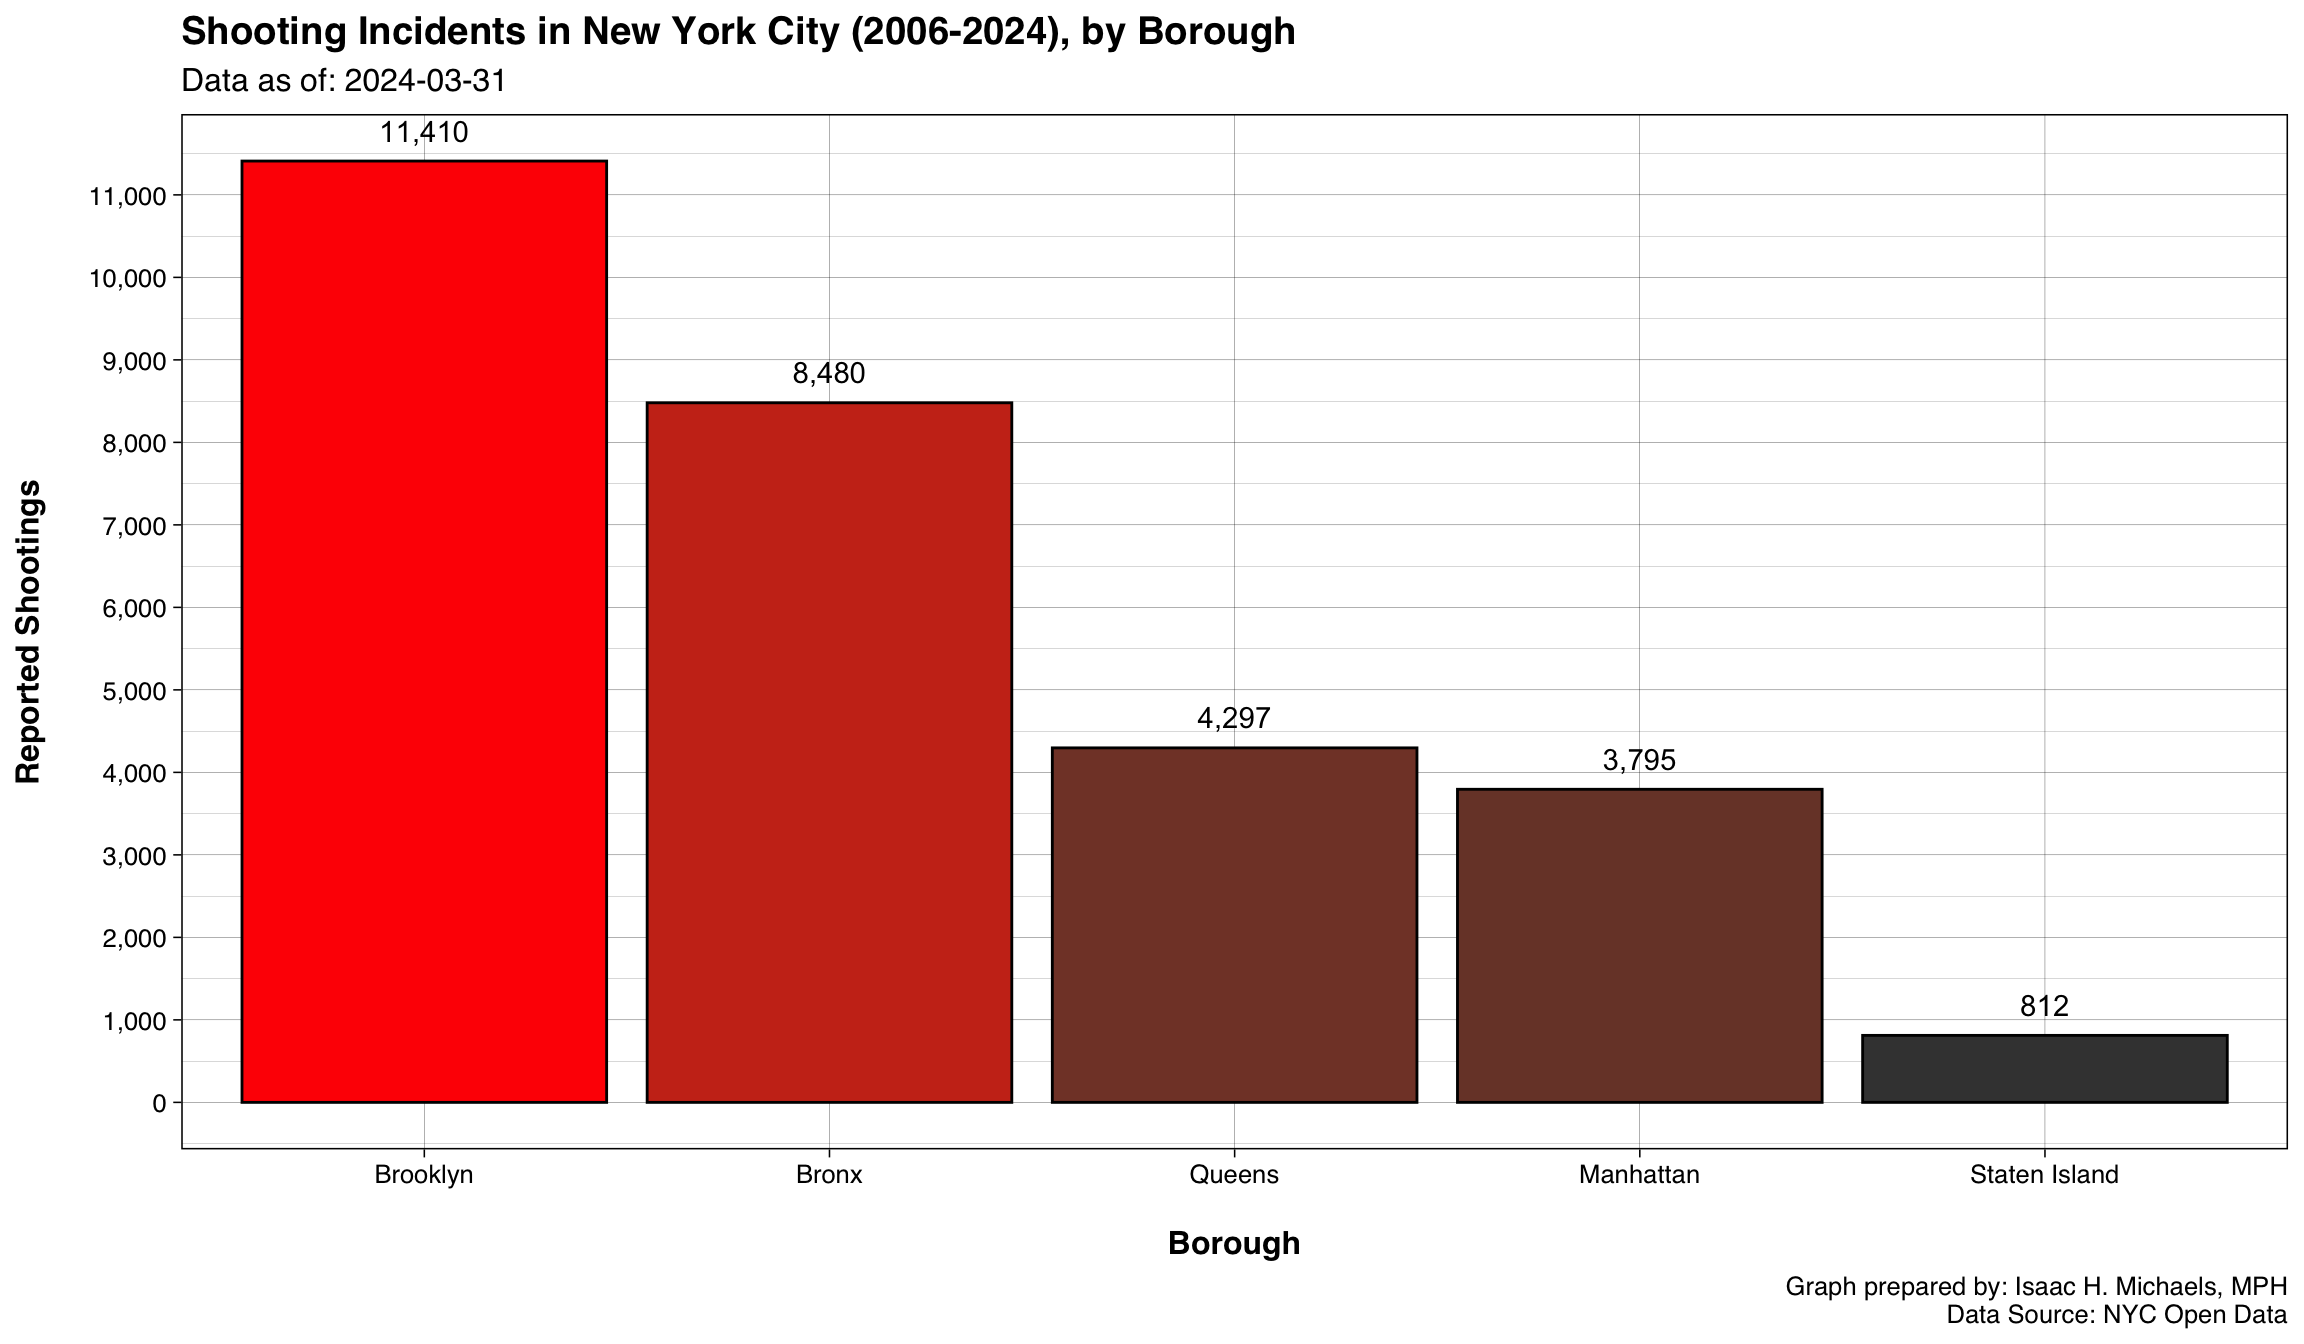
While citywide data provides a necessary macro perspective, the reality of gun violence is intensely local. This cumulative bar chart establishes the historical baseline of violence distribution across New York City’s five boroughs. By evaluating these baseline volumes, you can better determine which boroughs require the highest sustained levels of public health and safety investments.
 Graph Prepared By: Isaac H. Michaels, DrPH
Data Source: NYC Open Data (Current, Historical)
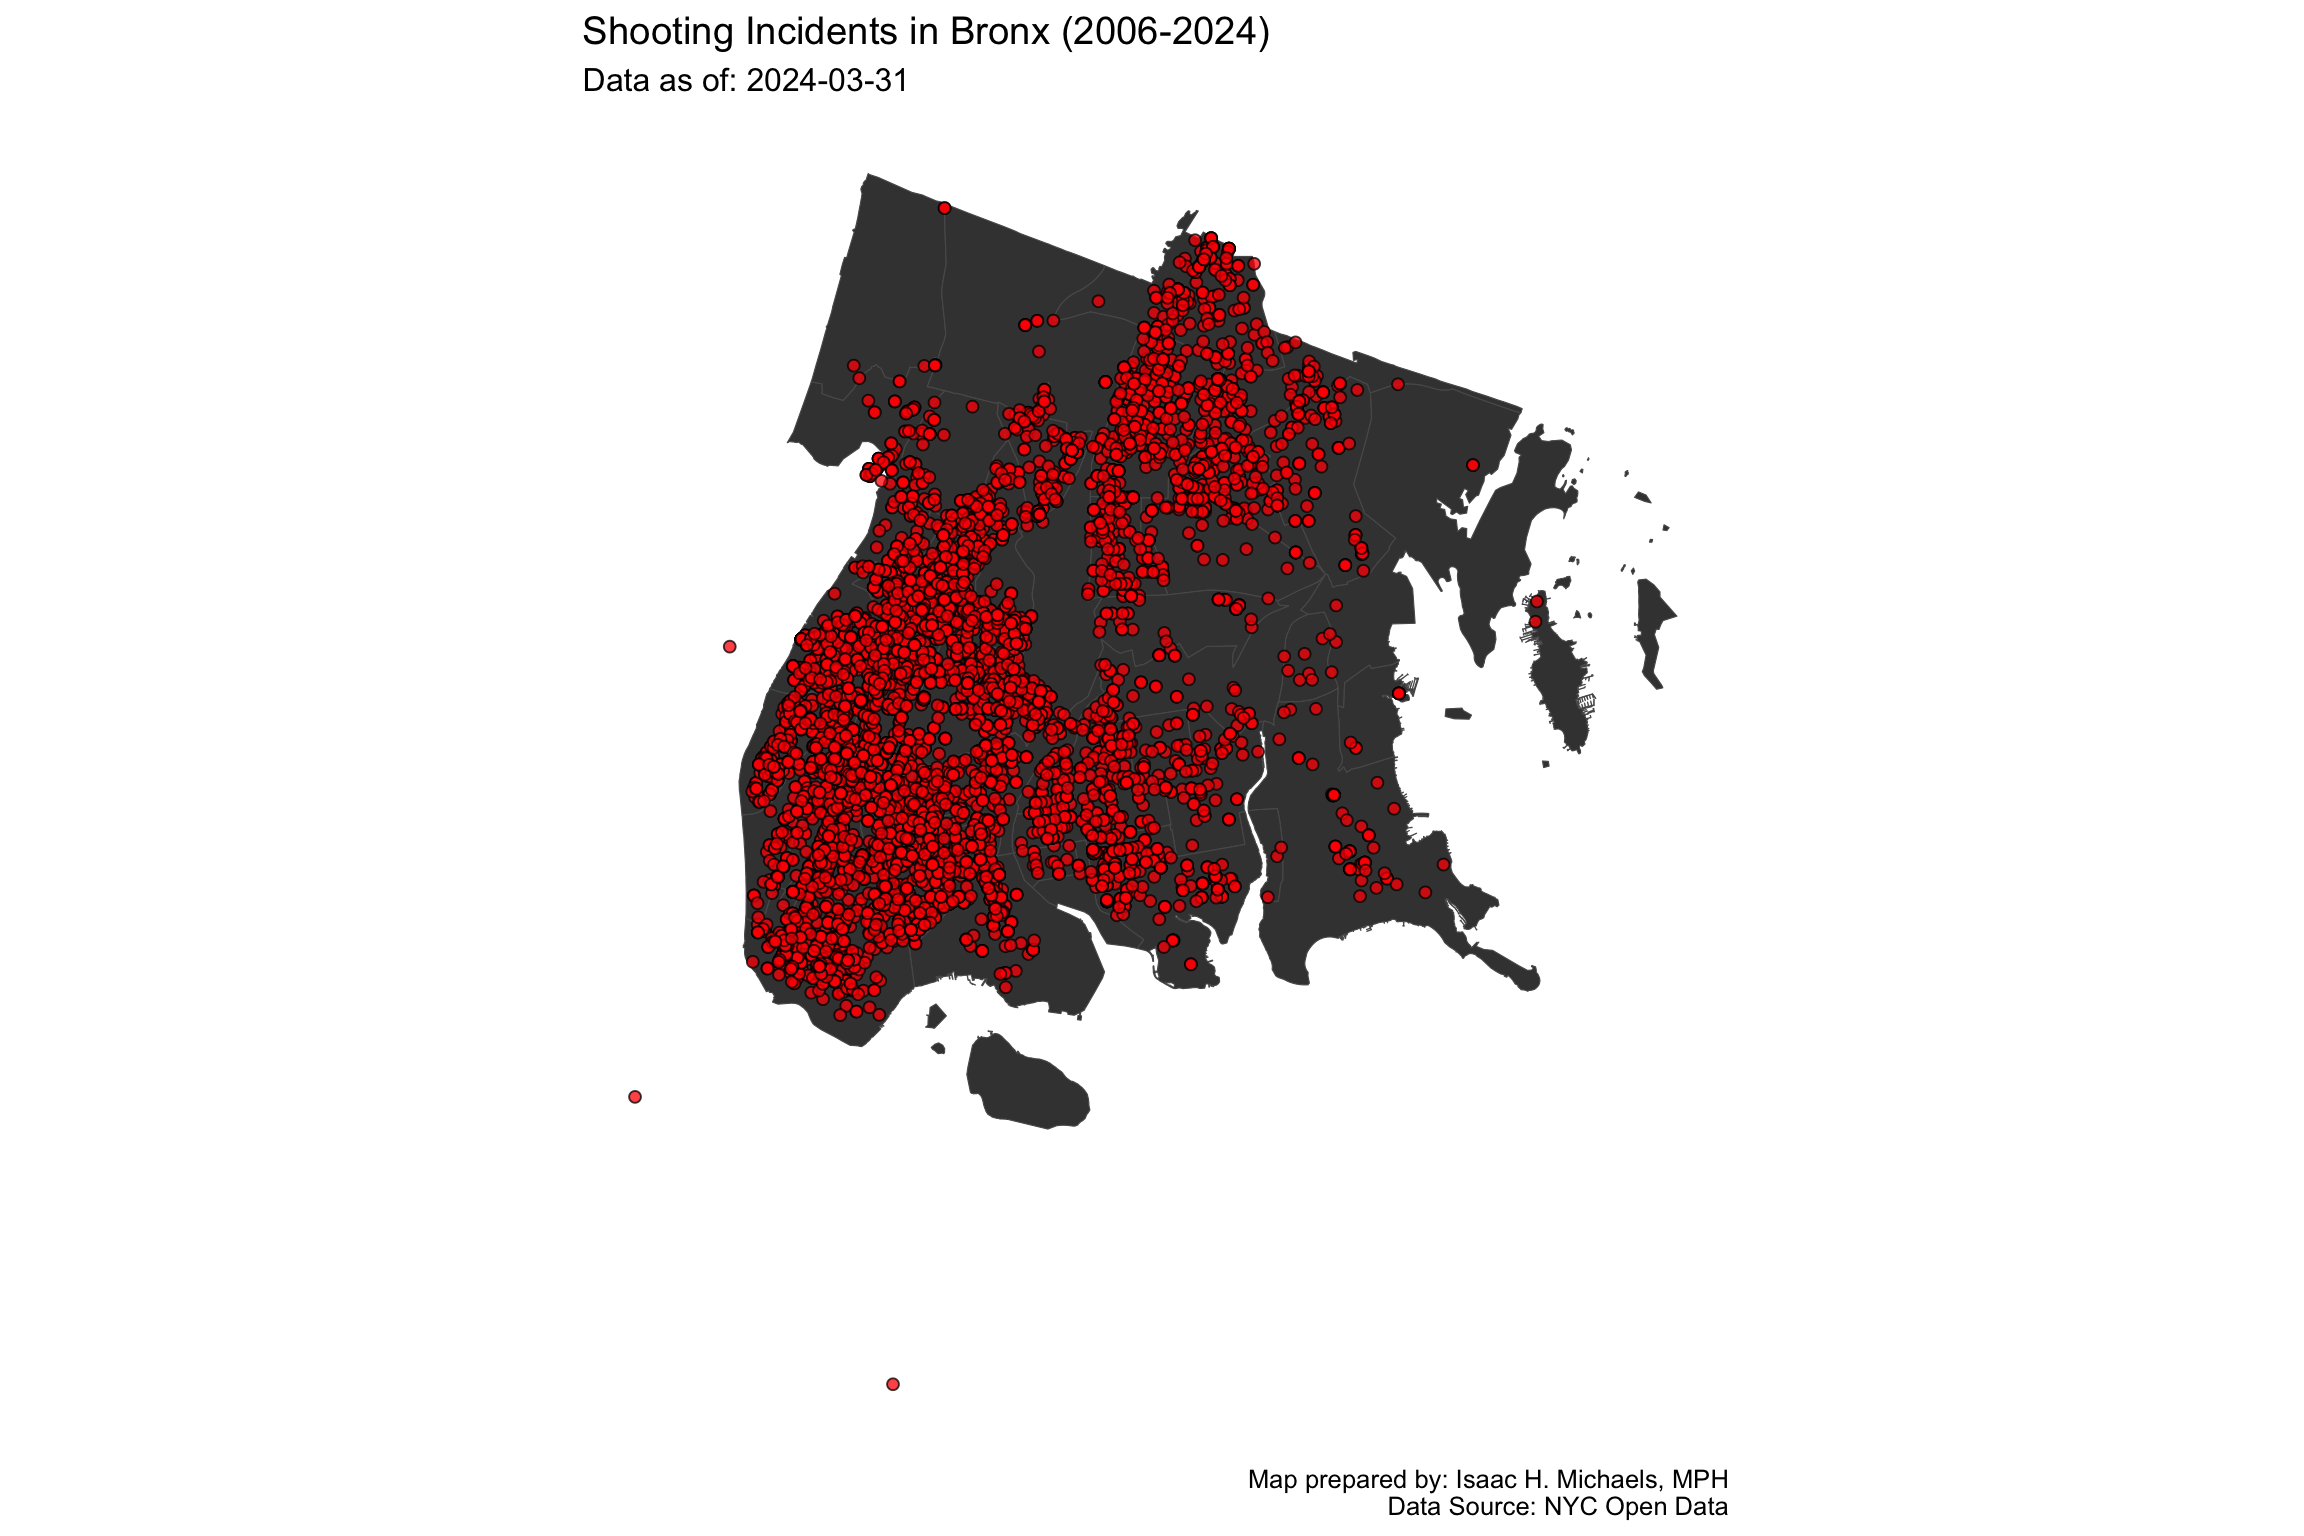
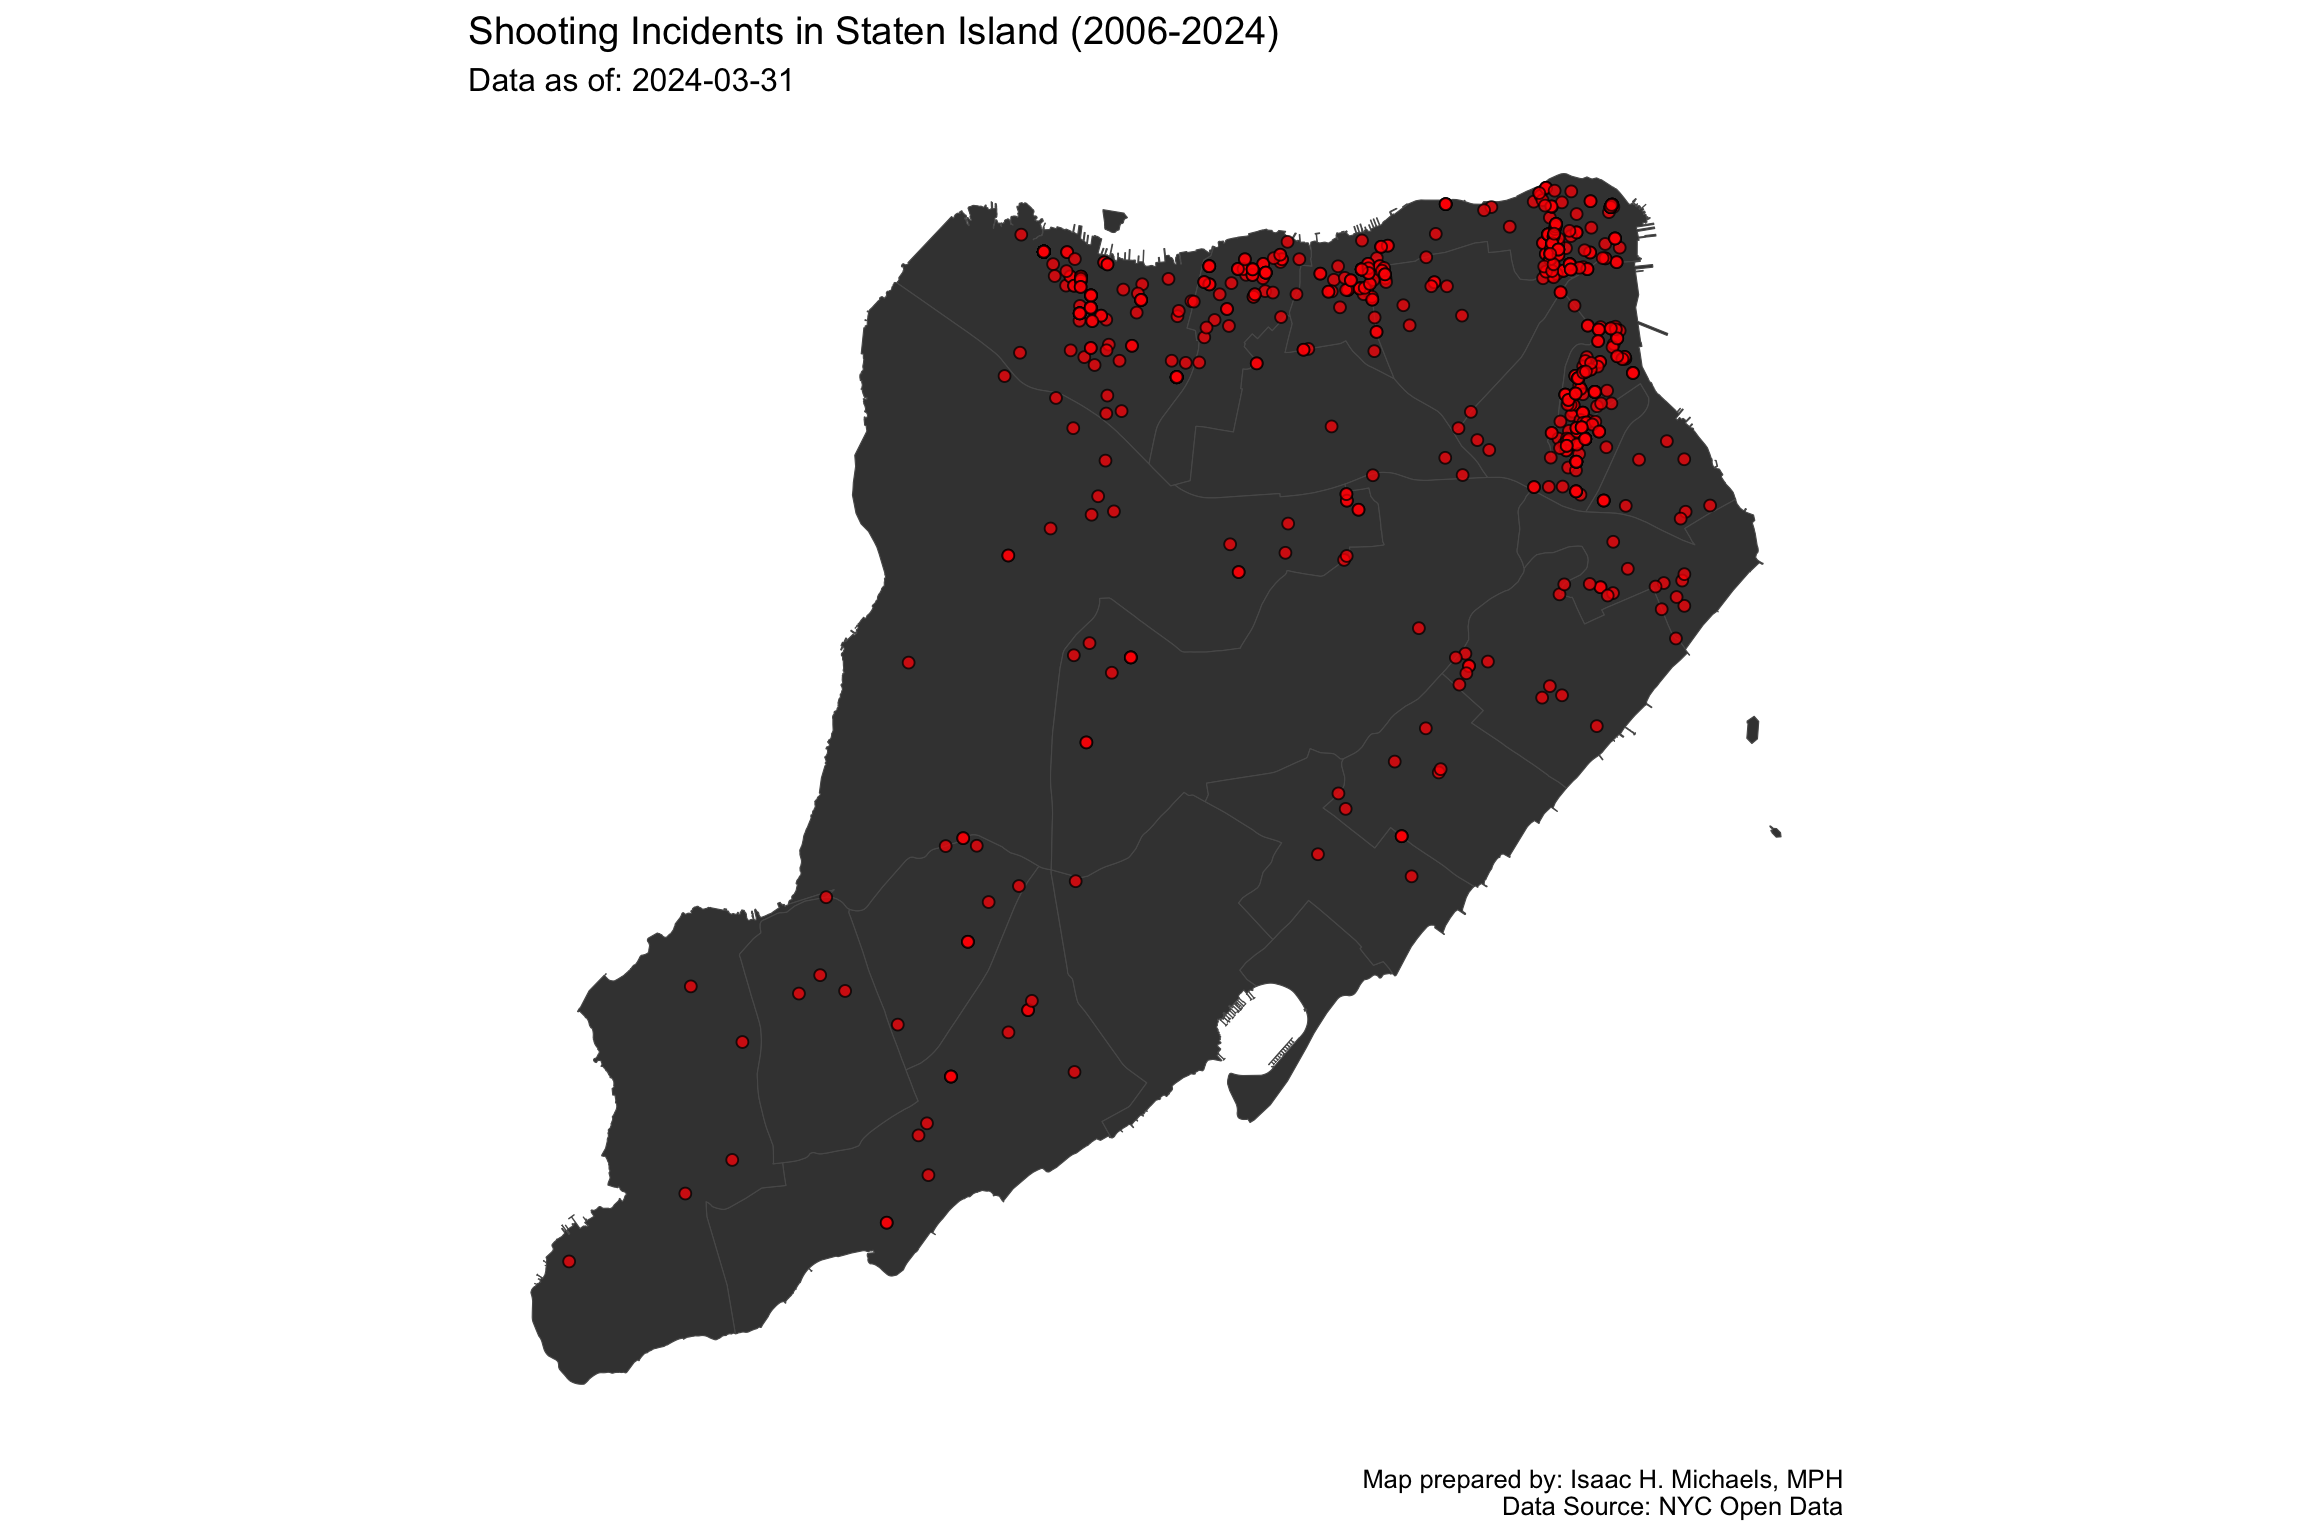
These individual static maps isolate the geographic footprint of gun violence within specific borough boundaries. By viewing the spatial concentration of historical incidents at the borough level, you can identify regional hot spots that warrant targeted, neighborhood-level interventions and resource allocation.
 Map Prepared By:
 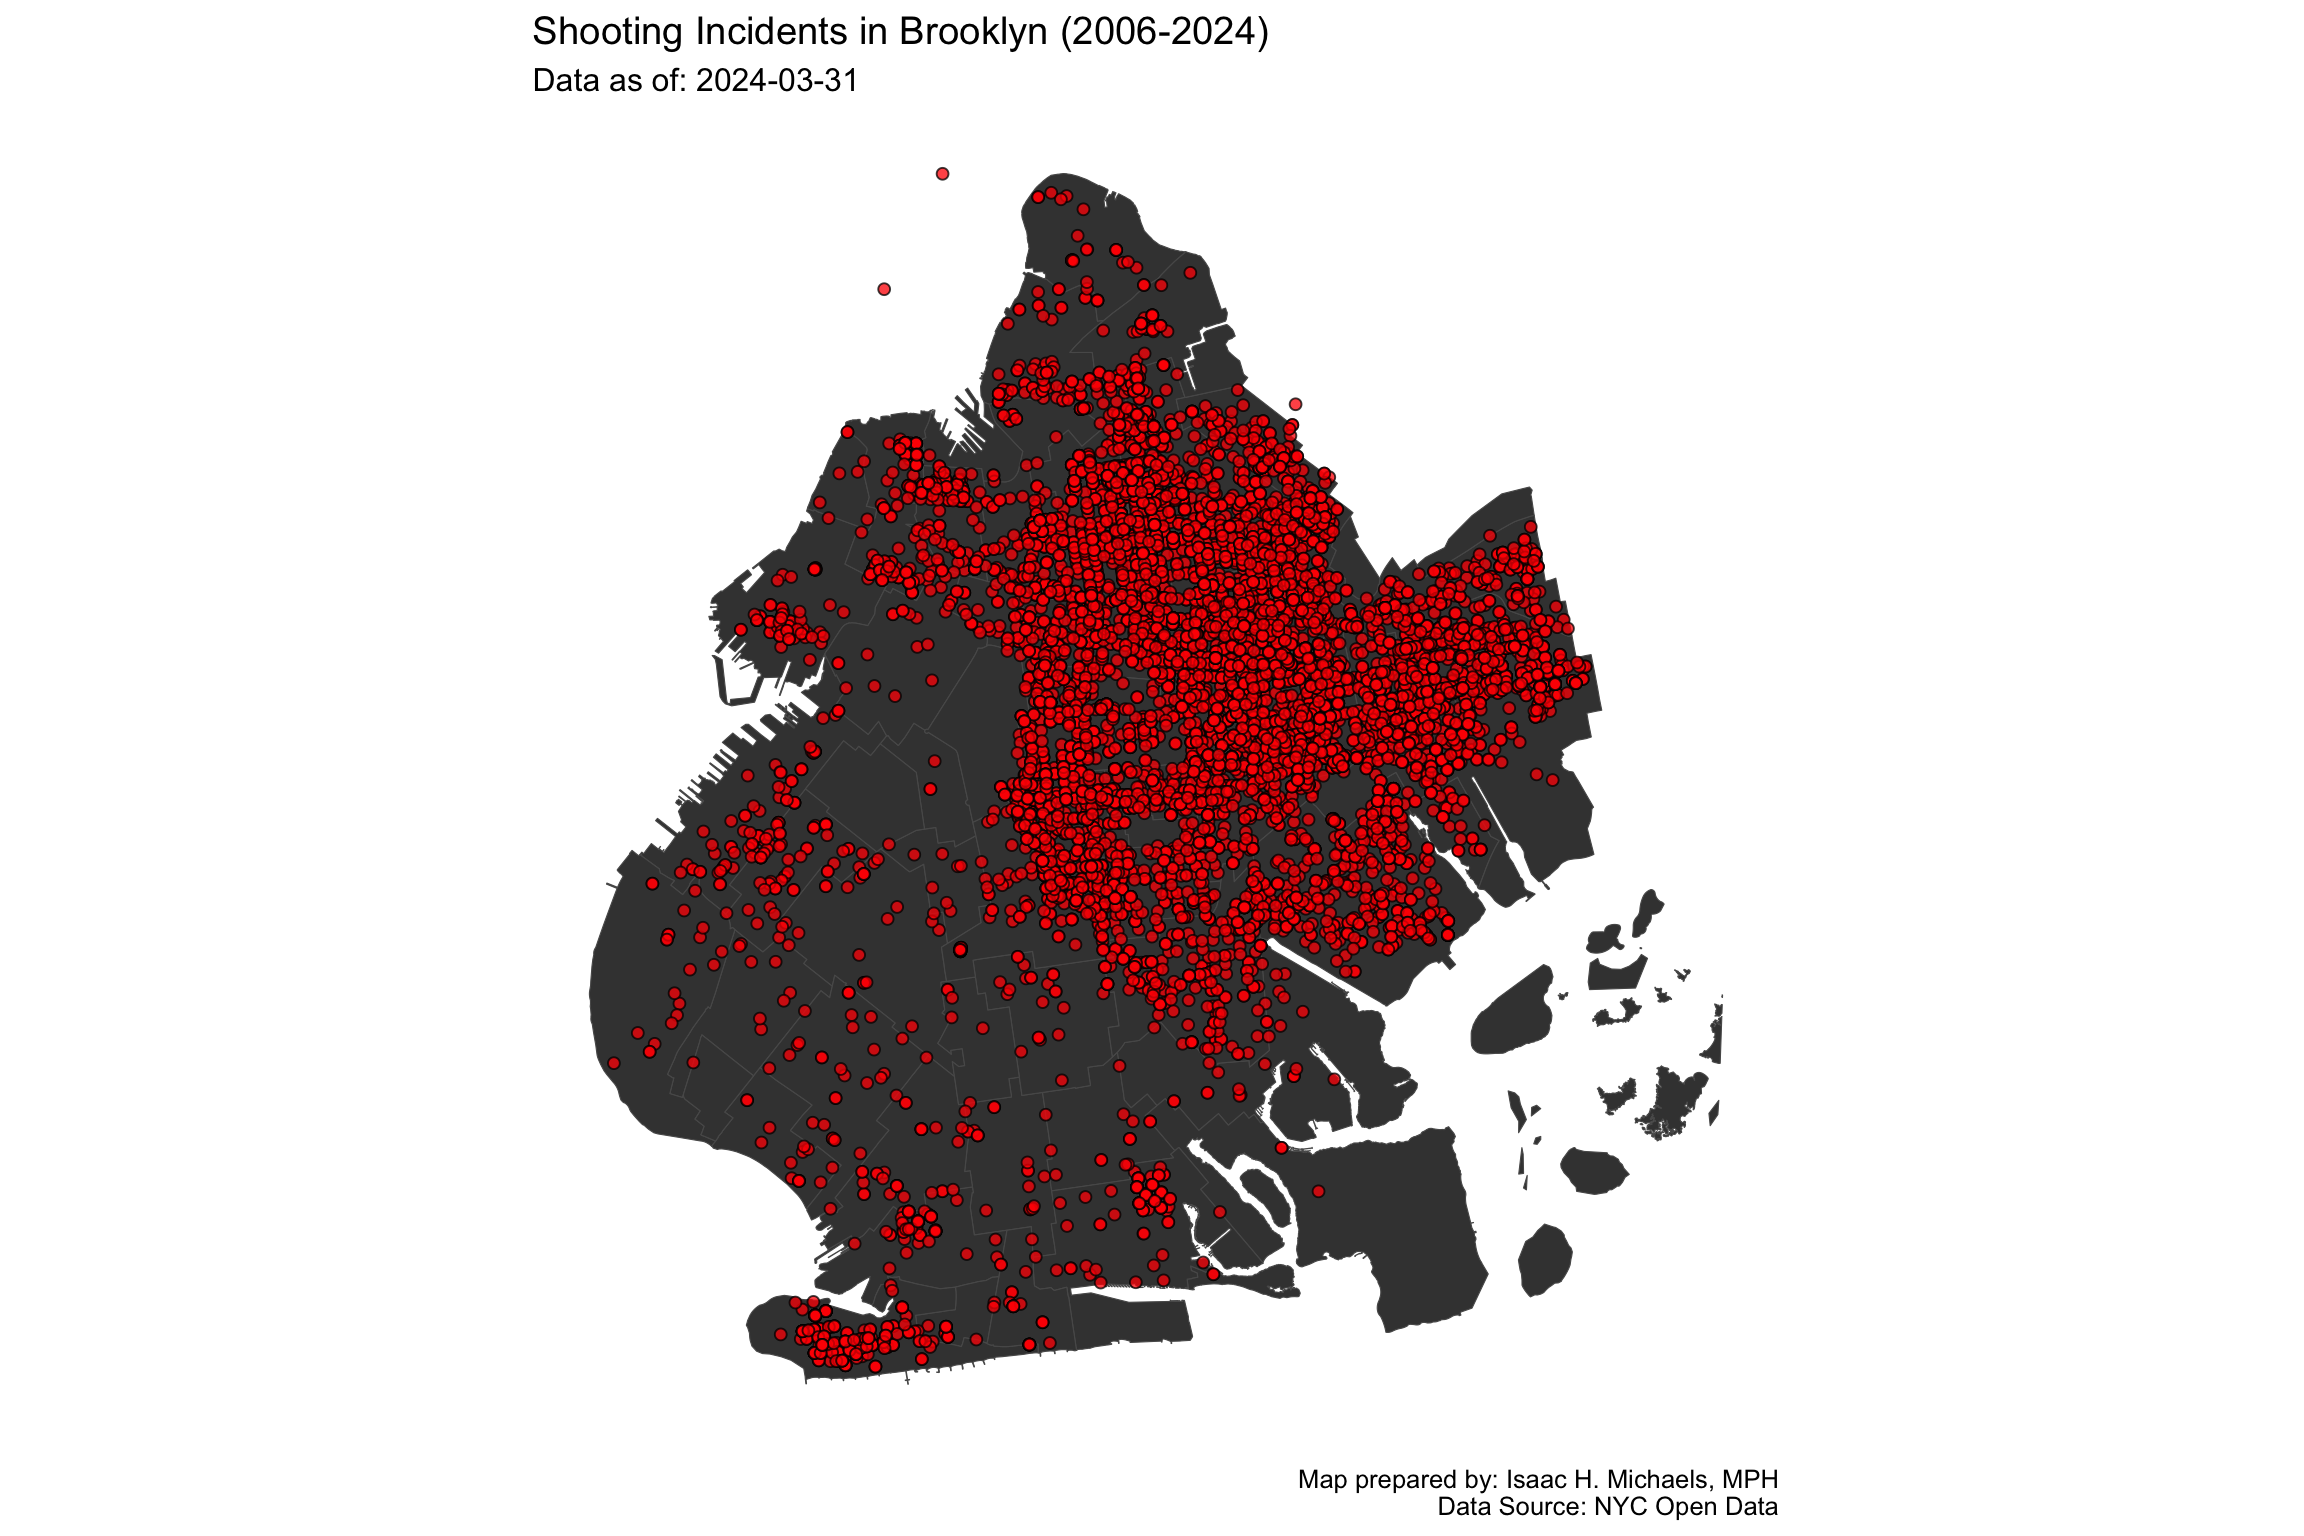 Map Prepared By:
 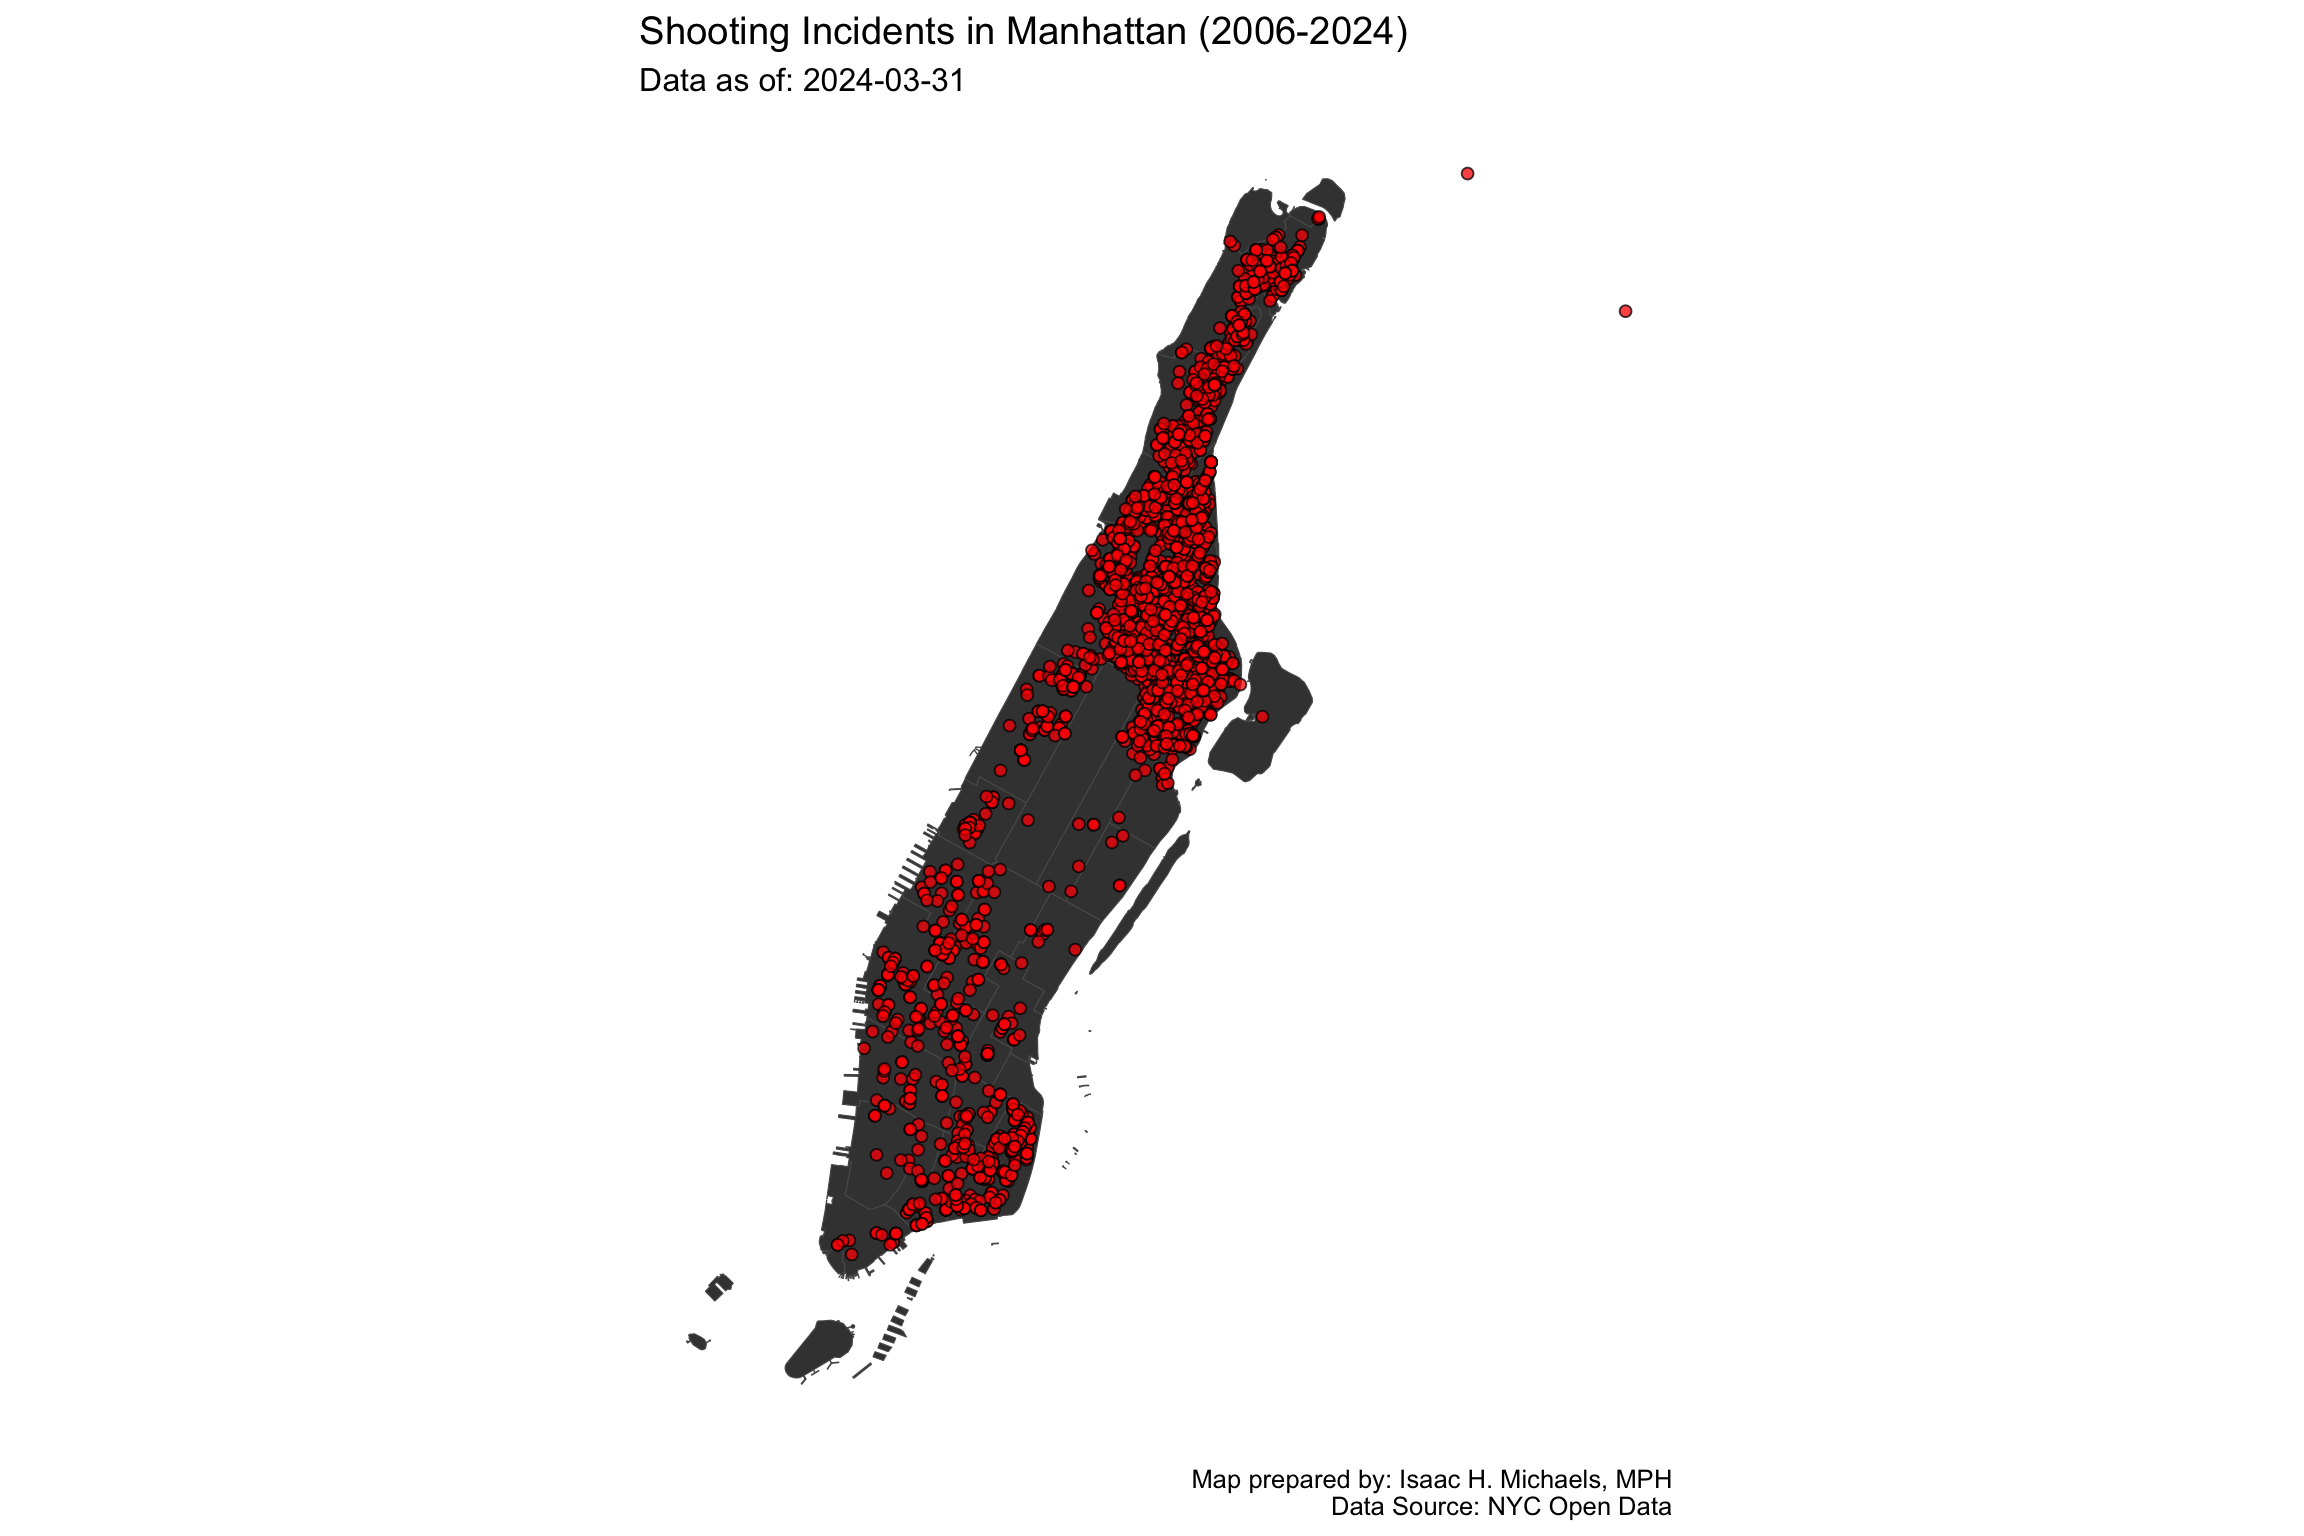 Map Prepared By:
 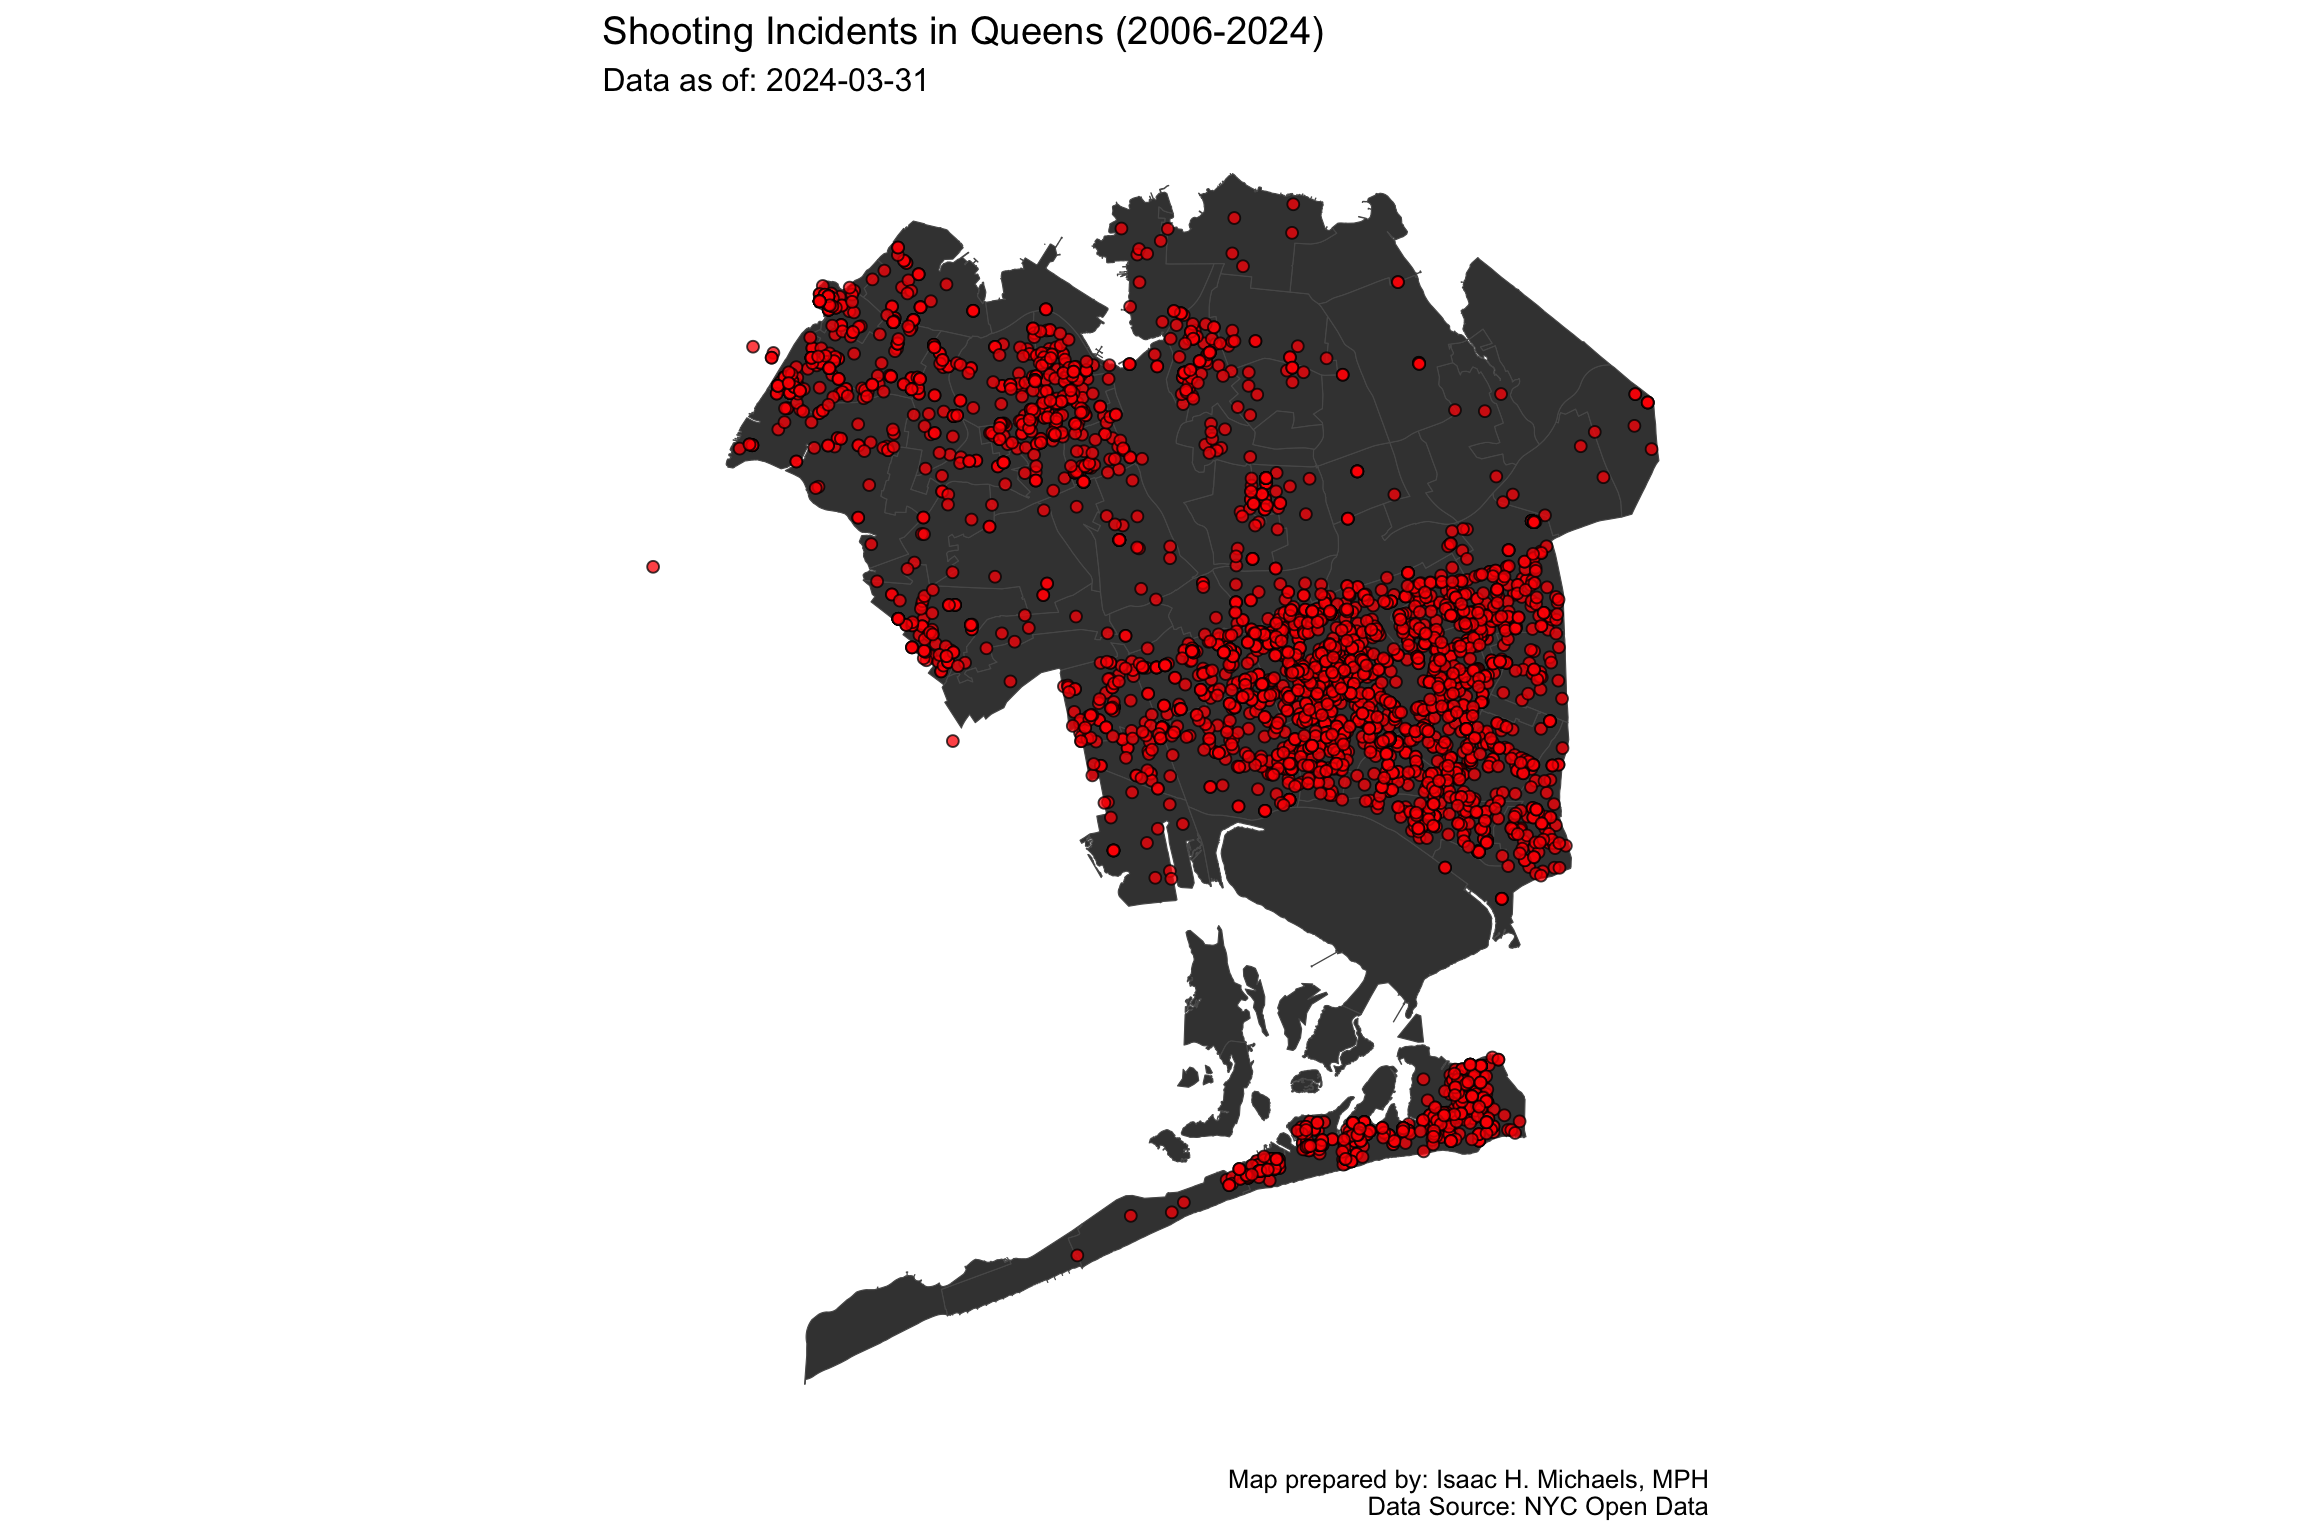 Map Prepared By:
 Staten Island
 Map Prepared By: Isaac H. Michaels, DrPH
Data Source: NYC Open Data (Current, Historical)
Boroughs – Annual Trends
Trends
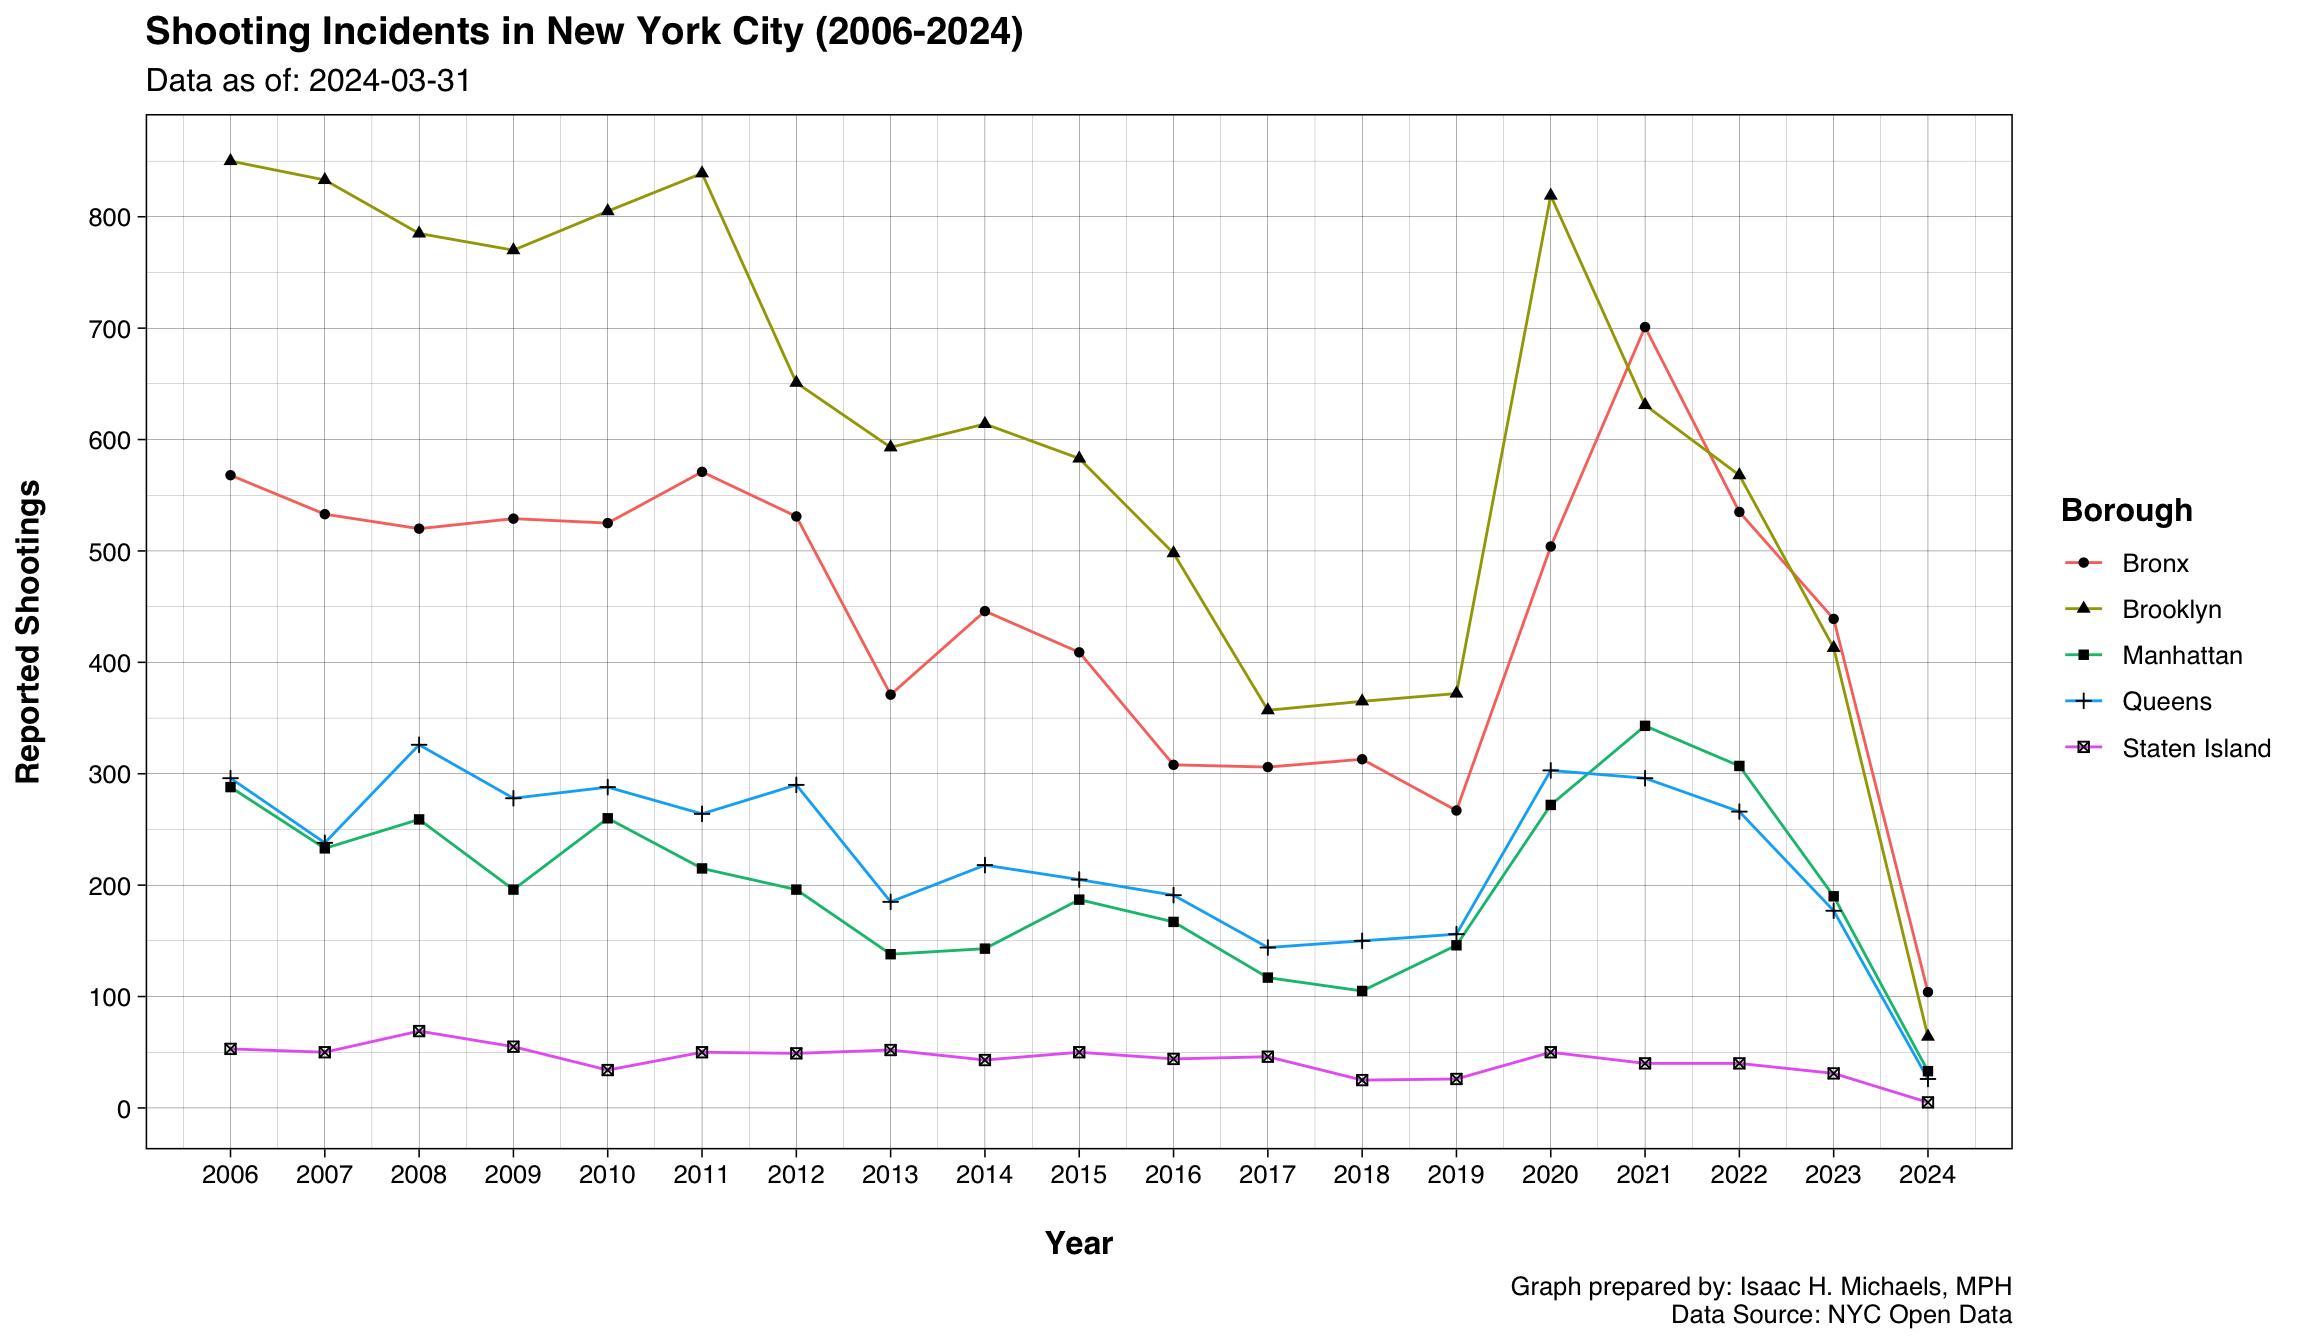
This trend graph and accompanying table disaggregate the longitudinal data by borough to track how each region is performing relative to the others. Because a citywide reduction in violence might mask a localized spike in a single borough, the overlay trend lines serve as an early warning system for diverging regional trajectories.
 Graph Prepared By: Isaac H. Michaels, DrPH
Data Source: NYC Open Data (Current, Historical)
| Shooting Incidents by Borough | |||||
| Total incidents by year (2006 - 2026) | |||||
| Year | Bronx | Brooklyn | Manhattan | Queens | Staten Island |
|---|---|---|---|---|---|
| 2006 | 398 | 673 | 220 | 240 | 35 |
| 2007 | 373 | 658 | 177 | 195 | 39 |
| 2008 | 406 | 625 | 187 | 252 | 50 |
| 2009 | 404 | 612 | 146 | 217 | 41 |
| 2010 | 409 | 639 | 198 | 200 | 27 |
| 2011 | 431 | 653 | 176 | 214 | 36 |
| 2012 | 402 | 543 | 151 | 236 | 41 |
| 2013 | 302 | 481 | 115 | 162 | 43 |
| 2014 | 346 | 520 | 107 | 161 | 38 |
| 2015 | 320 | 473 | 137 | 166 | 42 |
| 2016 | 247 | 415 | 142 | 157 | 36 |
| 2017 | 231 | 294 | 101 | 122 | 41 |
| 2018 | 227 | 311 | 86 | 110 | 20 |
| 2019 | 218 | 290 | 120 | 125 | 24 |
| 2020 | 389 | 652 | 212 | 238 | 41 |
| 2021 | 508 | 519 | 262 | 237 | 36 |
| 2022 | 408 | 449 | 211 | 198 | 28 |
| 2023 | 316 | 338 | 162 | 131 | 27 |
| 2024 | 338 | 287 | 145 | 119 | 15 |
| 2025 | 252 | 245 | 90 | 90 | 11 |
| 20261 | 54 | 49 | 16 | 17 | 3 |
| Data as of: 2026-03-31 | Data Source: NYC Open Data | Table prepared by: Isaac H. Michaels, DrPH | |||||
| 1 Indicates an incomplete, year-to-date total. | |||||
Table Prepared By: Isaac H. Michaels, DrPH
Data Source: NYC Open Data (Current, Historical)
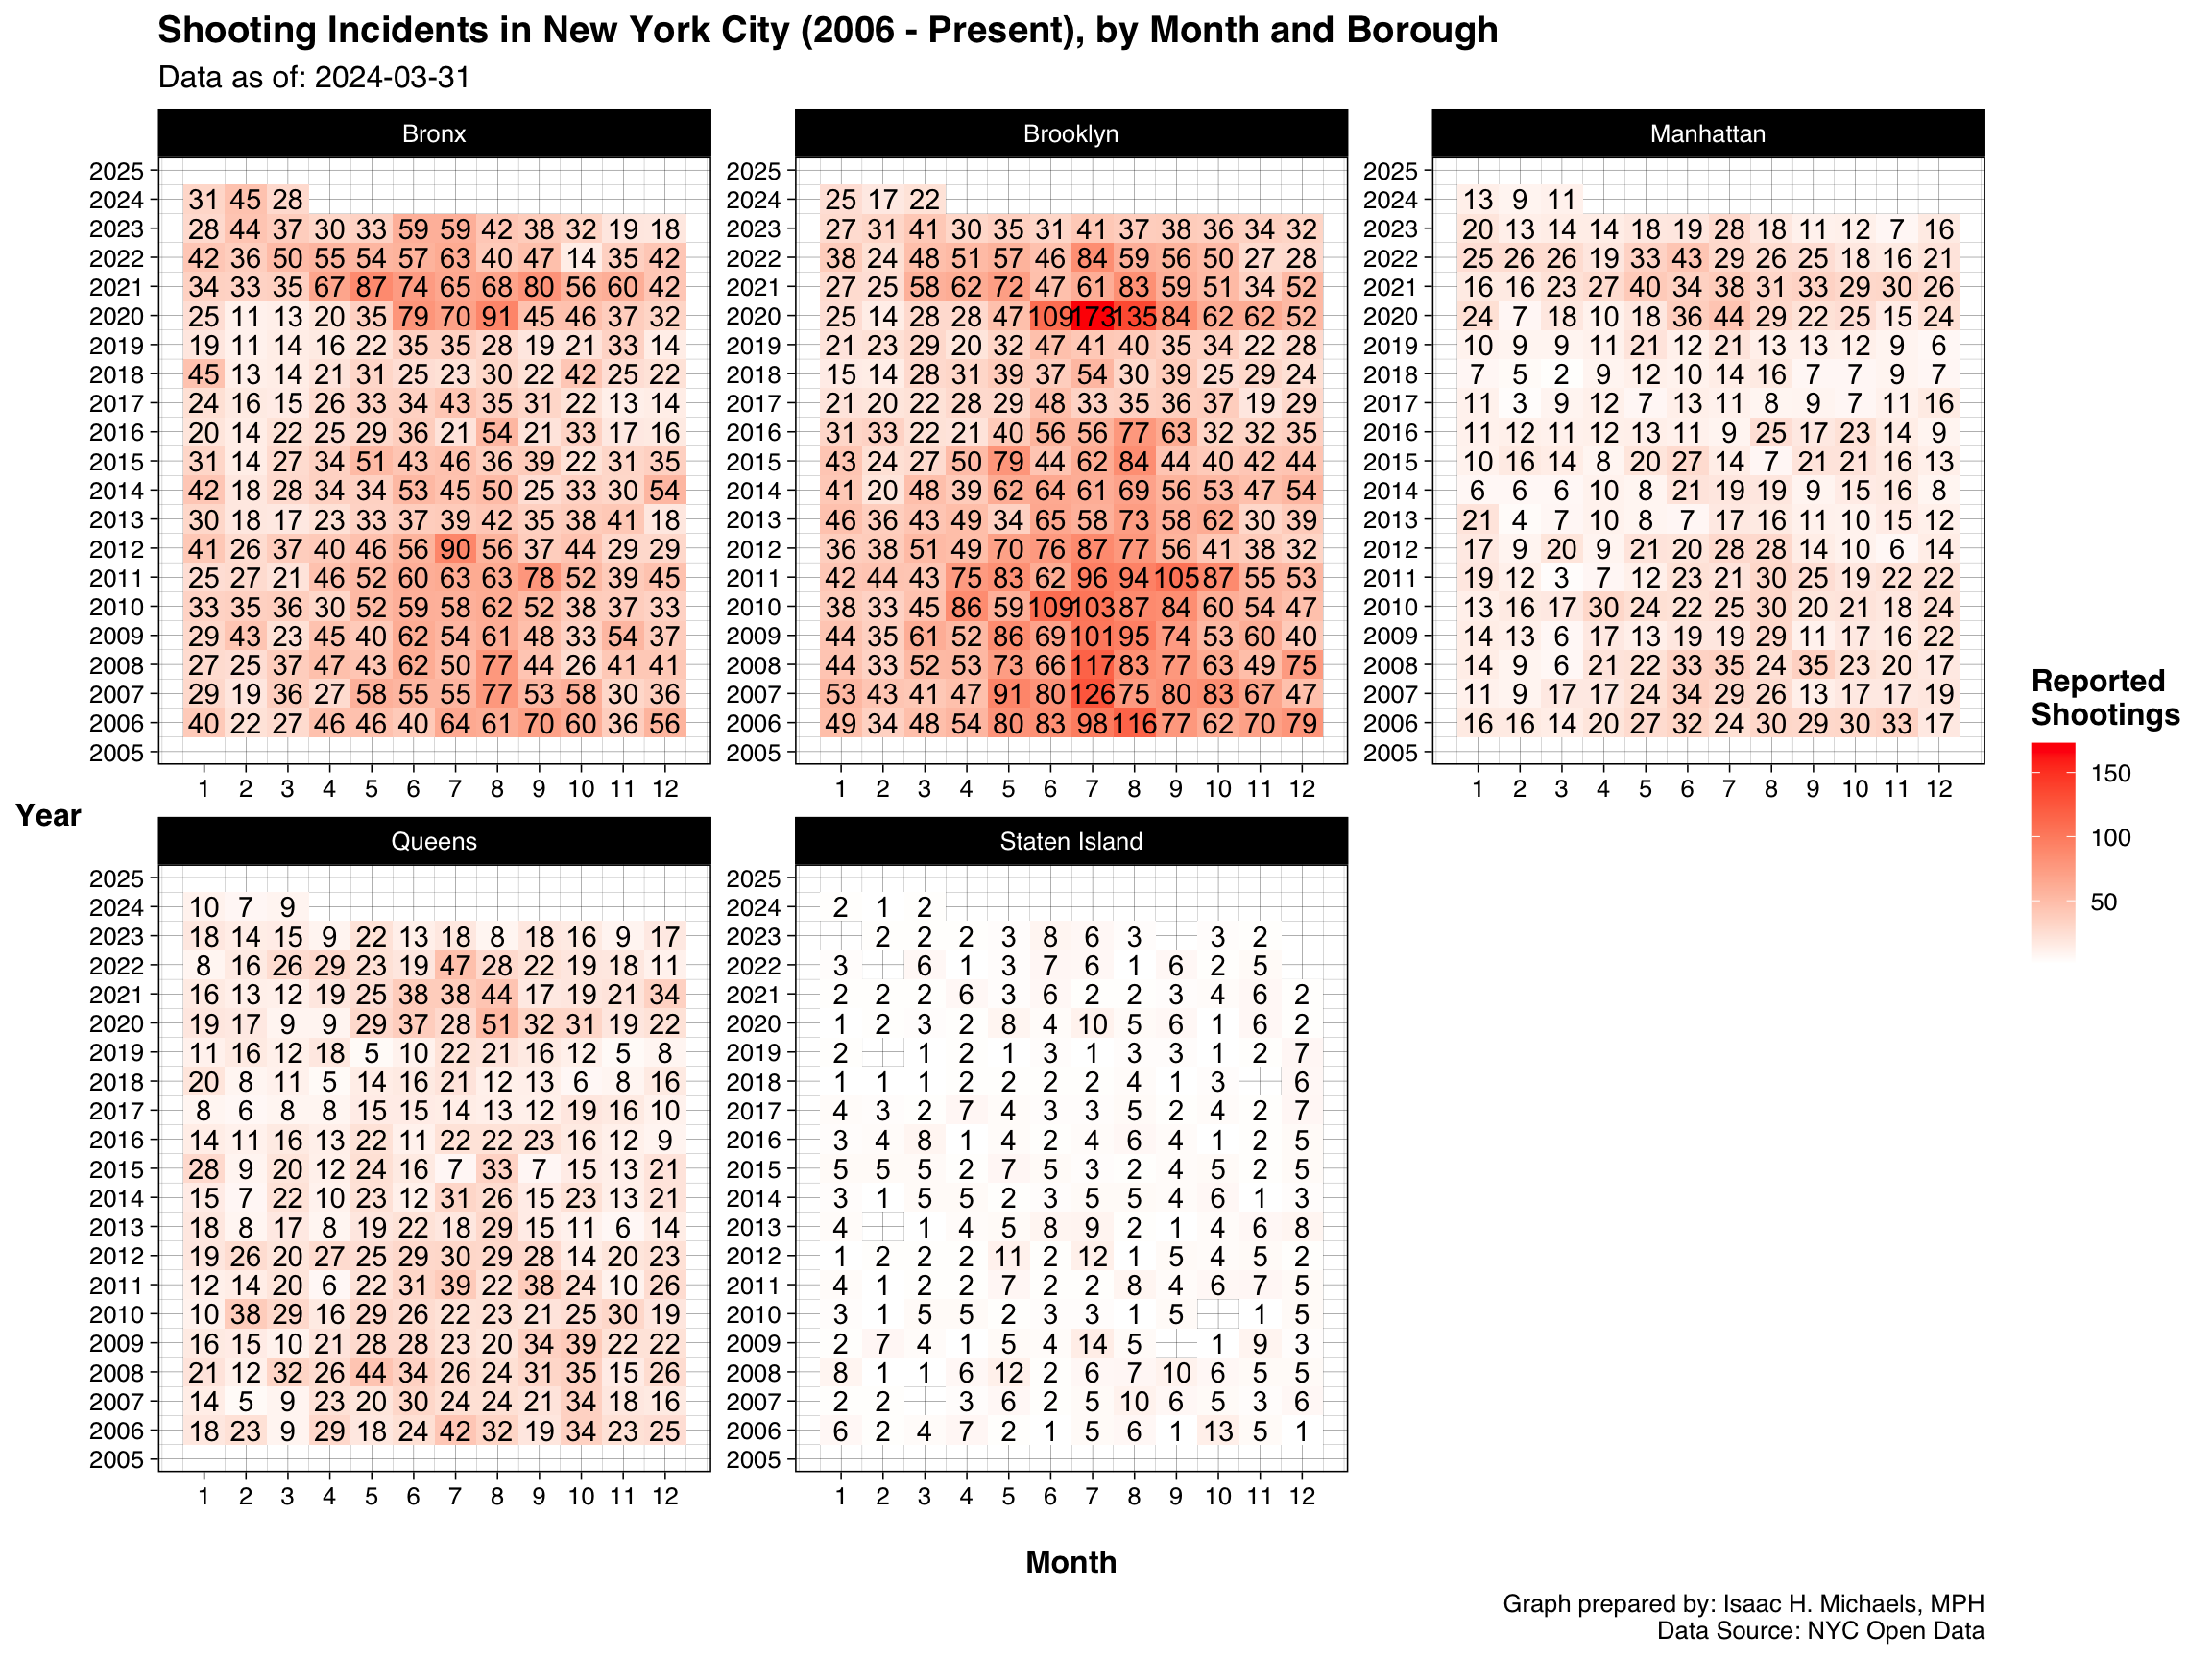
Months
These faceted monthly heatmaps refine the seasonal analysis by revealing whether the established seasonality of gun violence holds true across all geographic regions. If a highly successful intervention drastically alters the seasonal pattern of violence in one borough, these charts will highlight that localized success, potentially providing a blueprint for the rest of the city.
 Graph Prepared By: Isaac H. Michaels, DrPH
Data Source: NYC Open Data (Current, Historical)
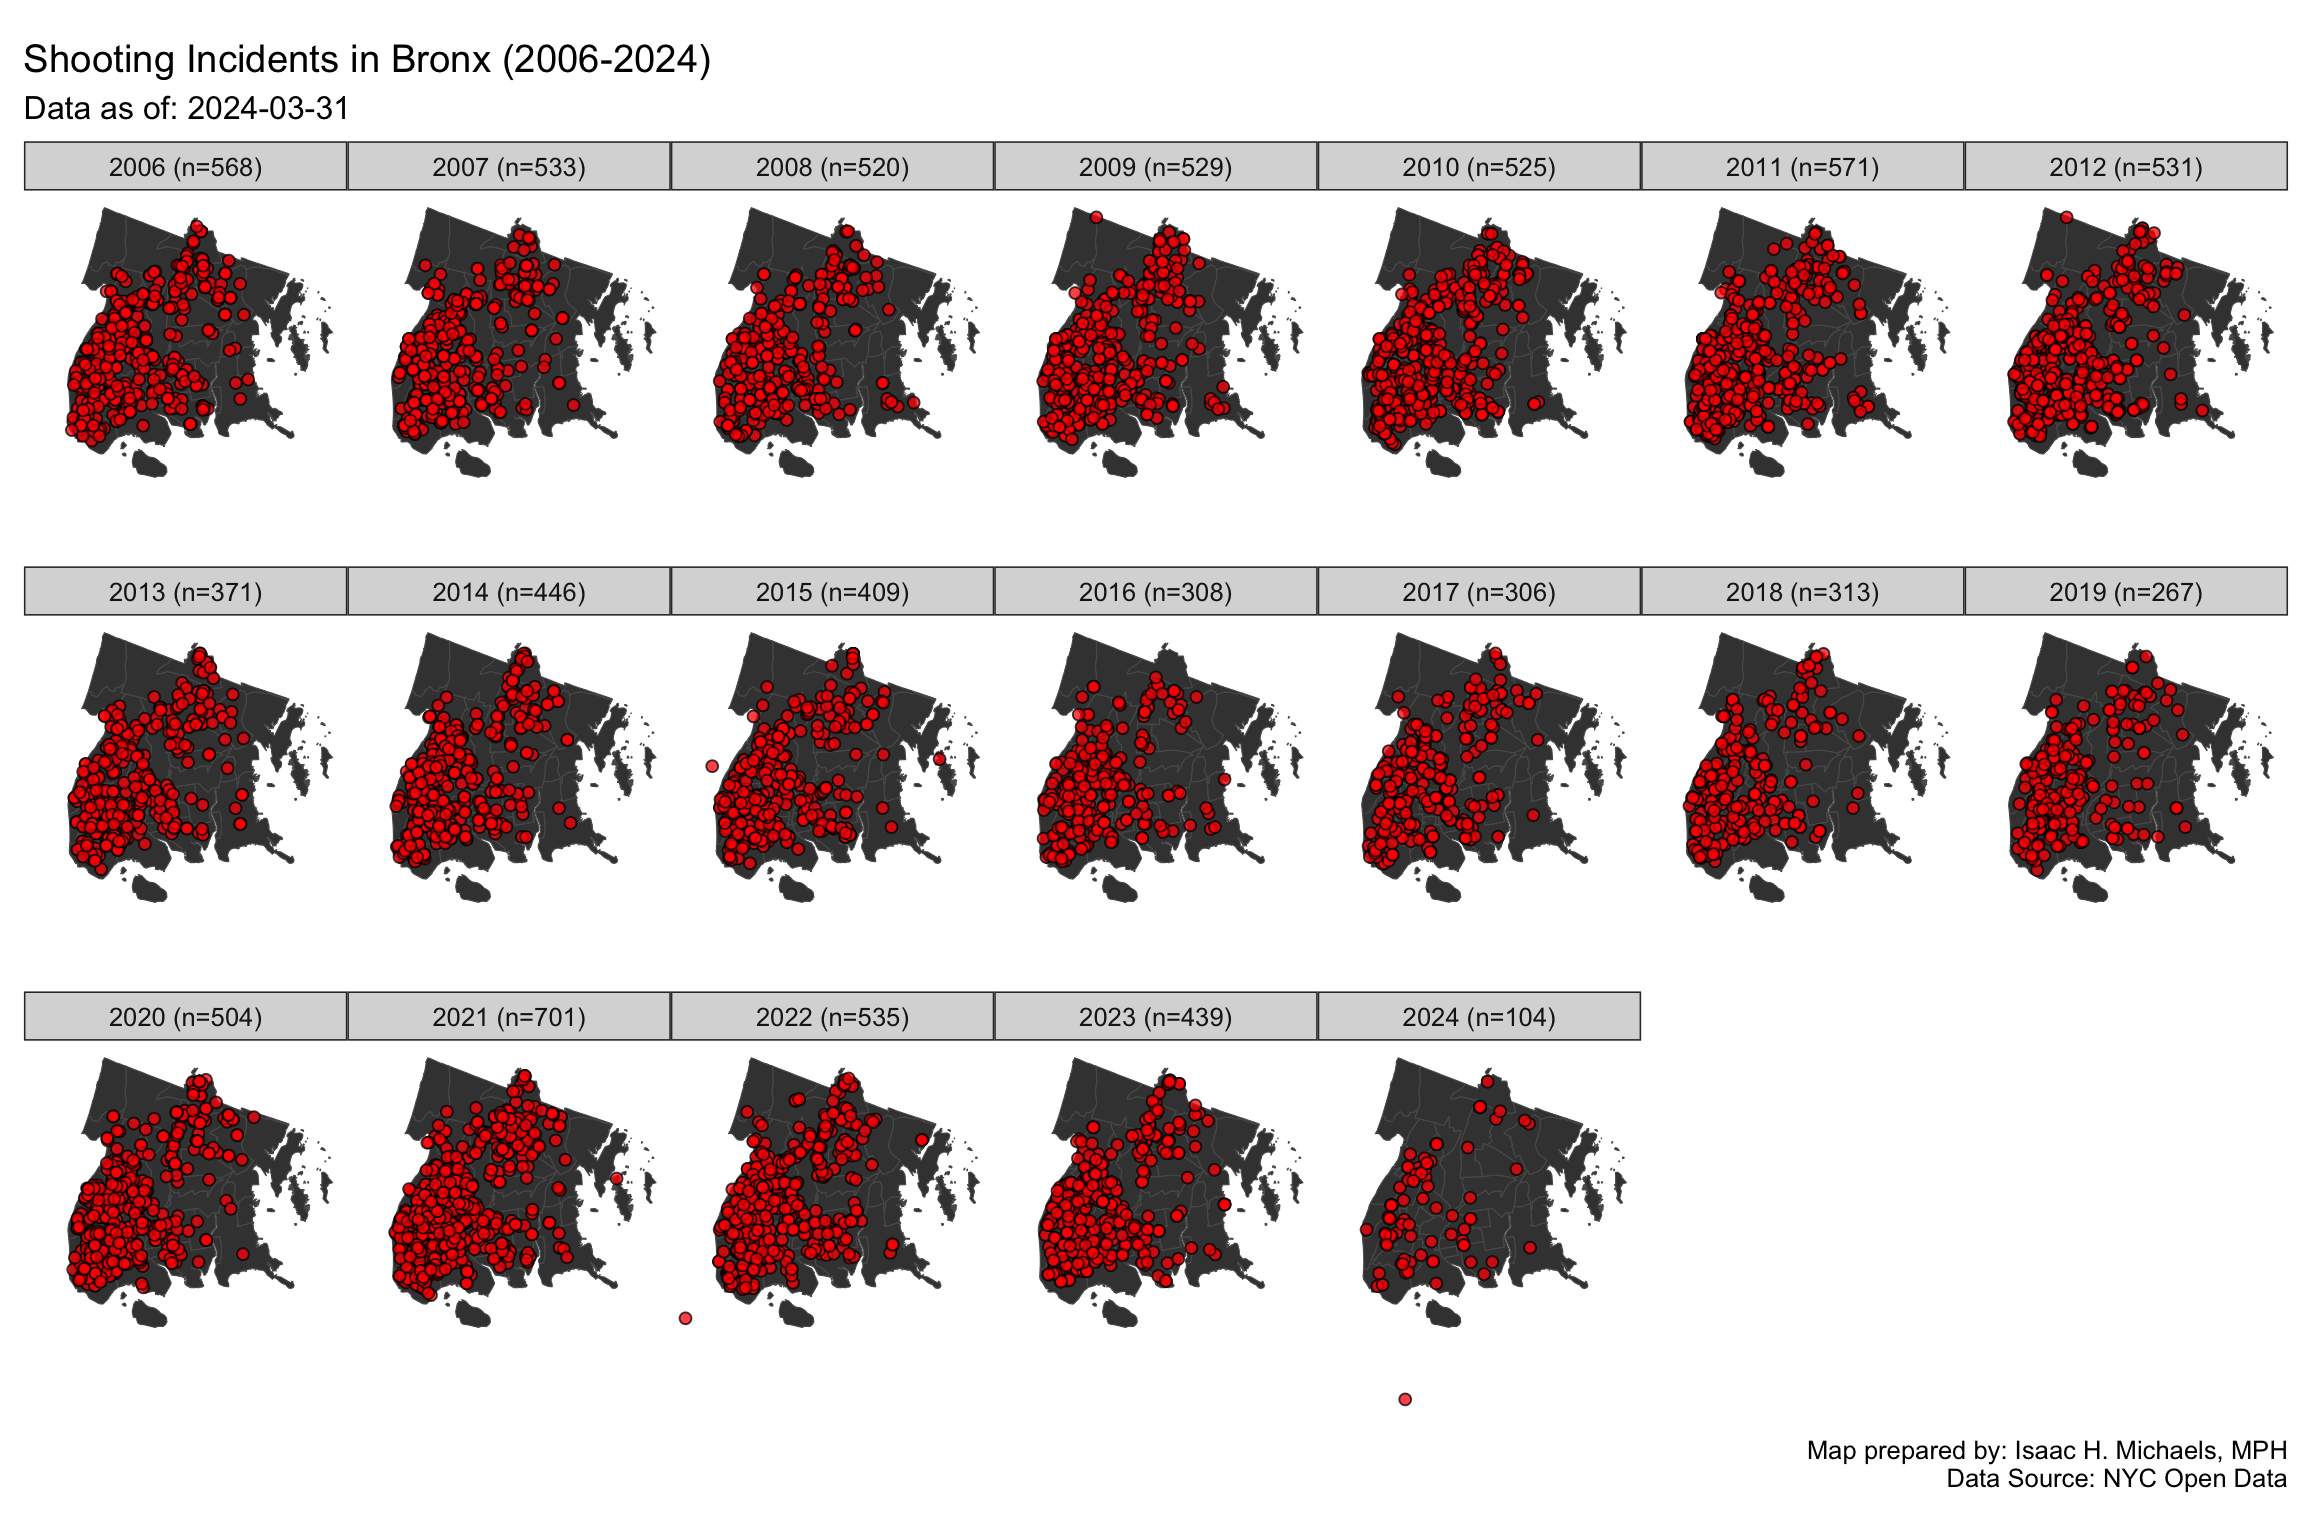
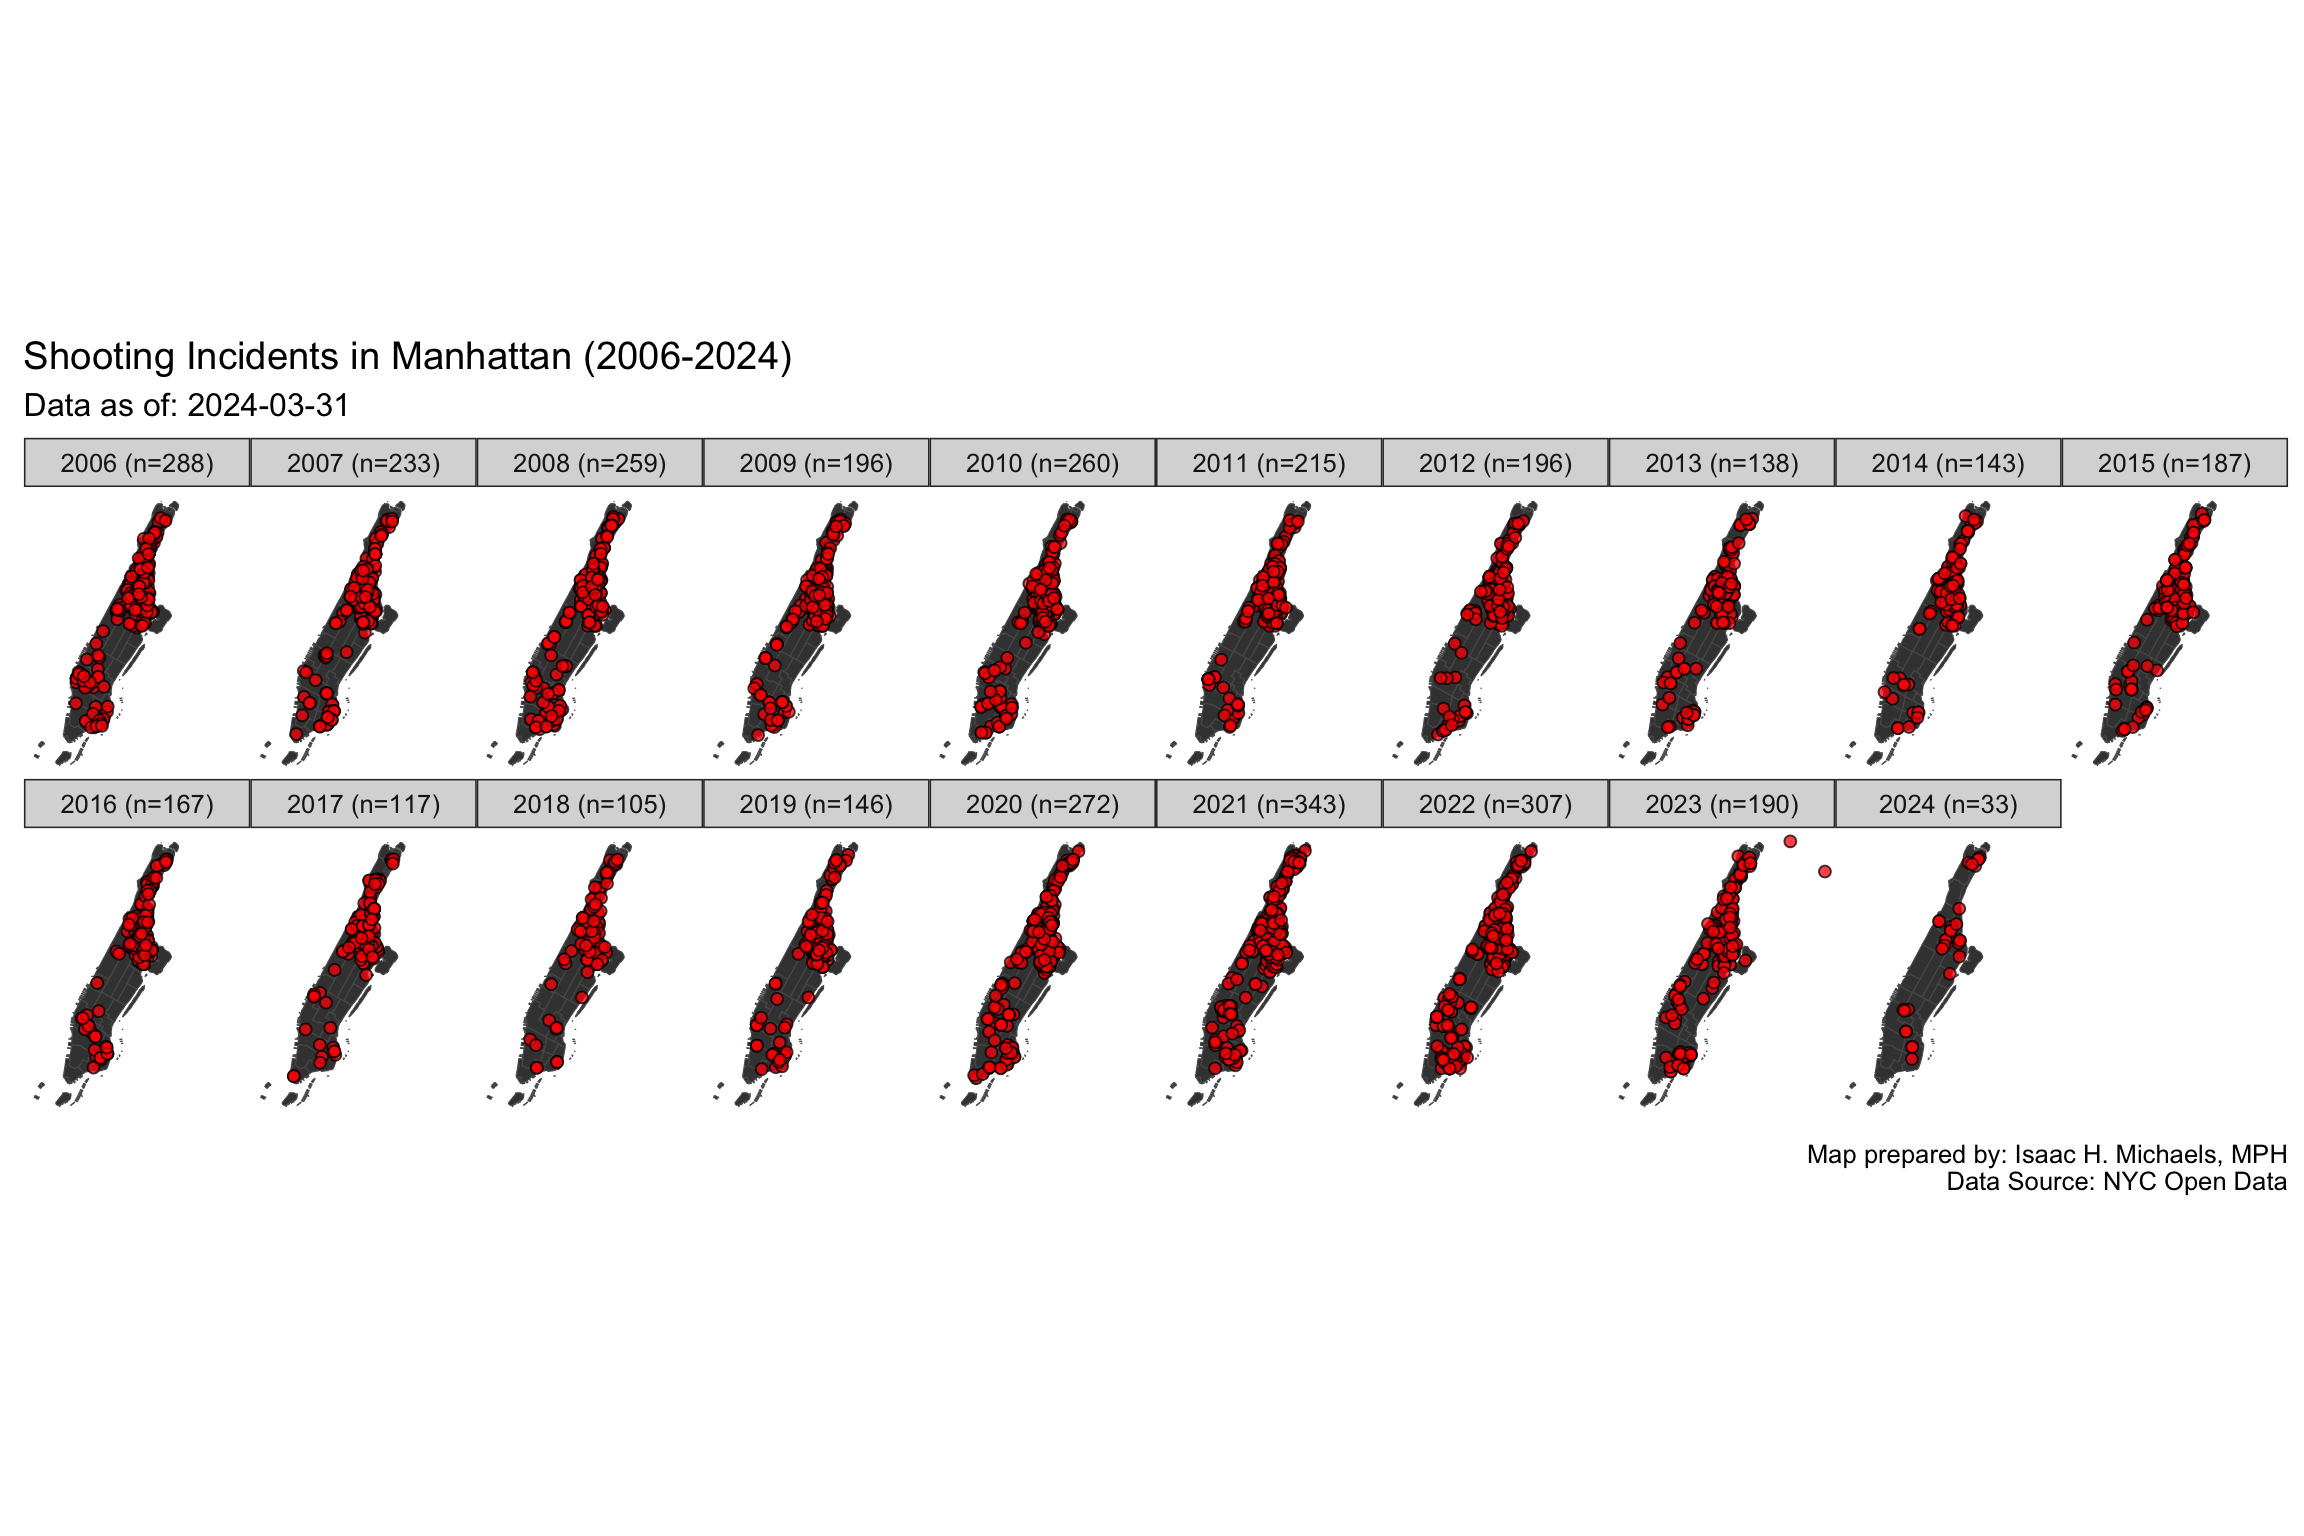
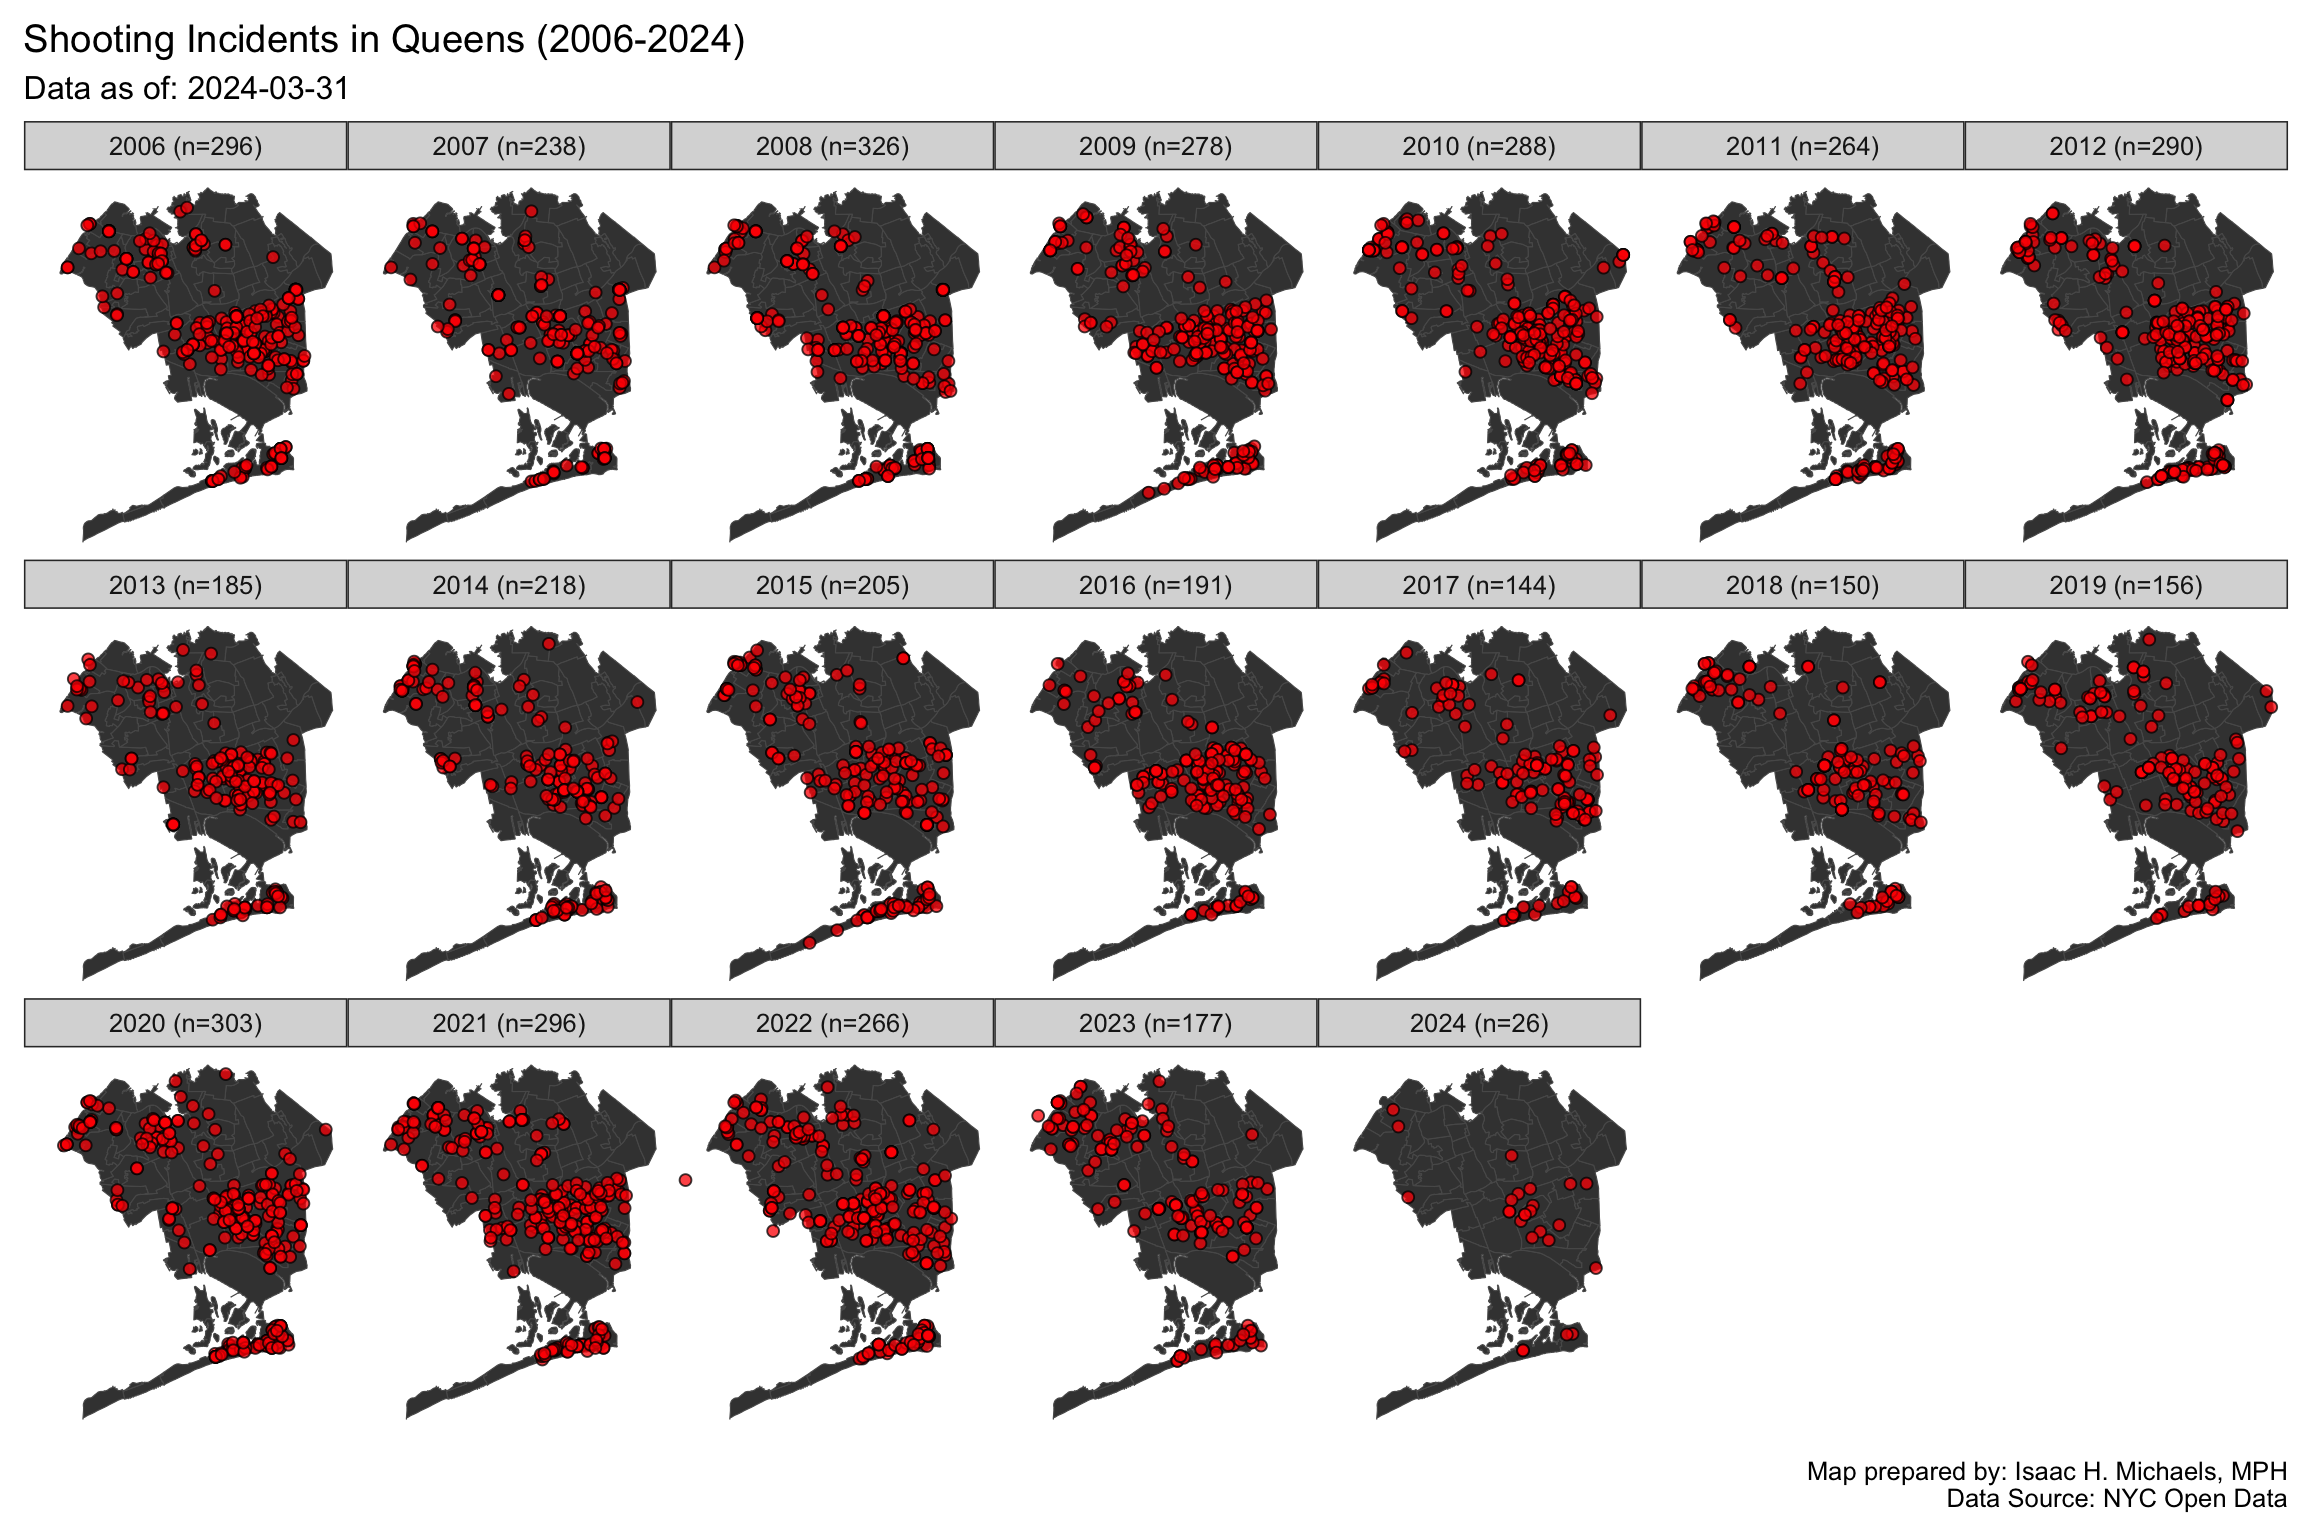
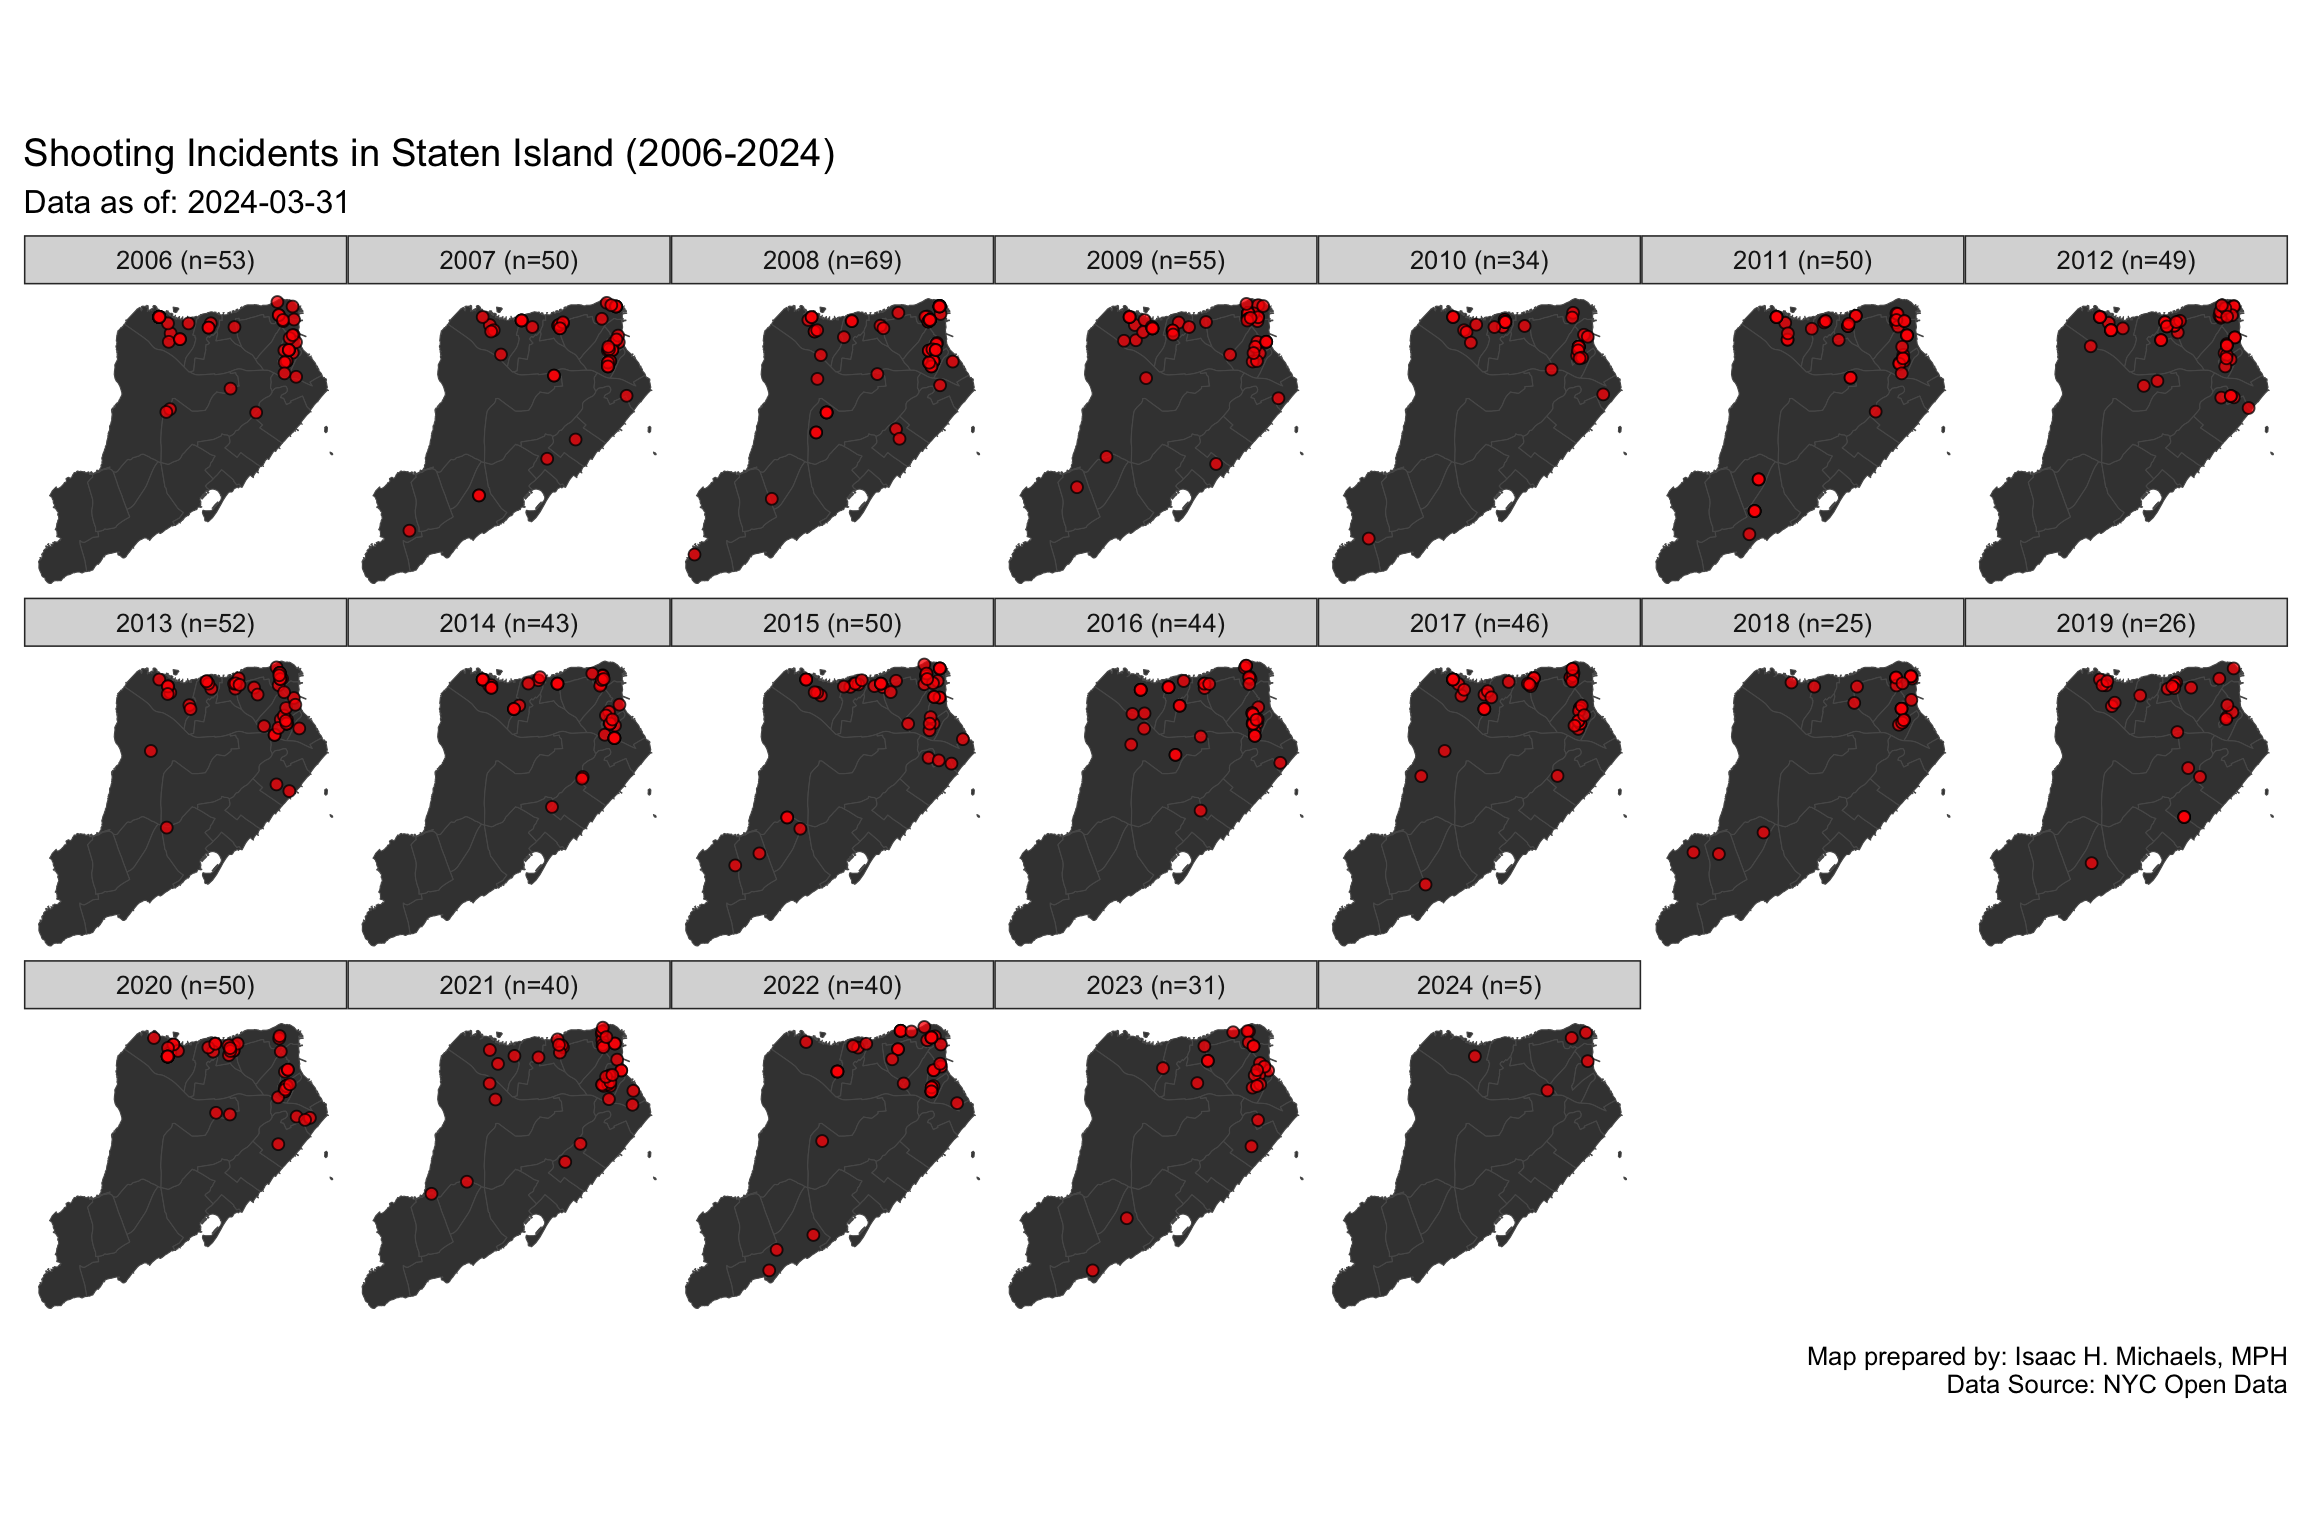
These faceted annual maps track the geographic migration of gun violence over time within each individual borough. By presenting a chronological series of spatial distributions, you can observe whether violence is persistently concentrated in the same neighborhoods year after year, or if clusters are diffusing, shifting, or shrinking in response to changing demographics, gentrification, or targeted community interventions.
 Maps Prepared By:
 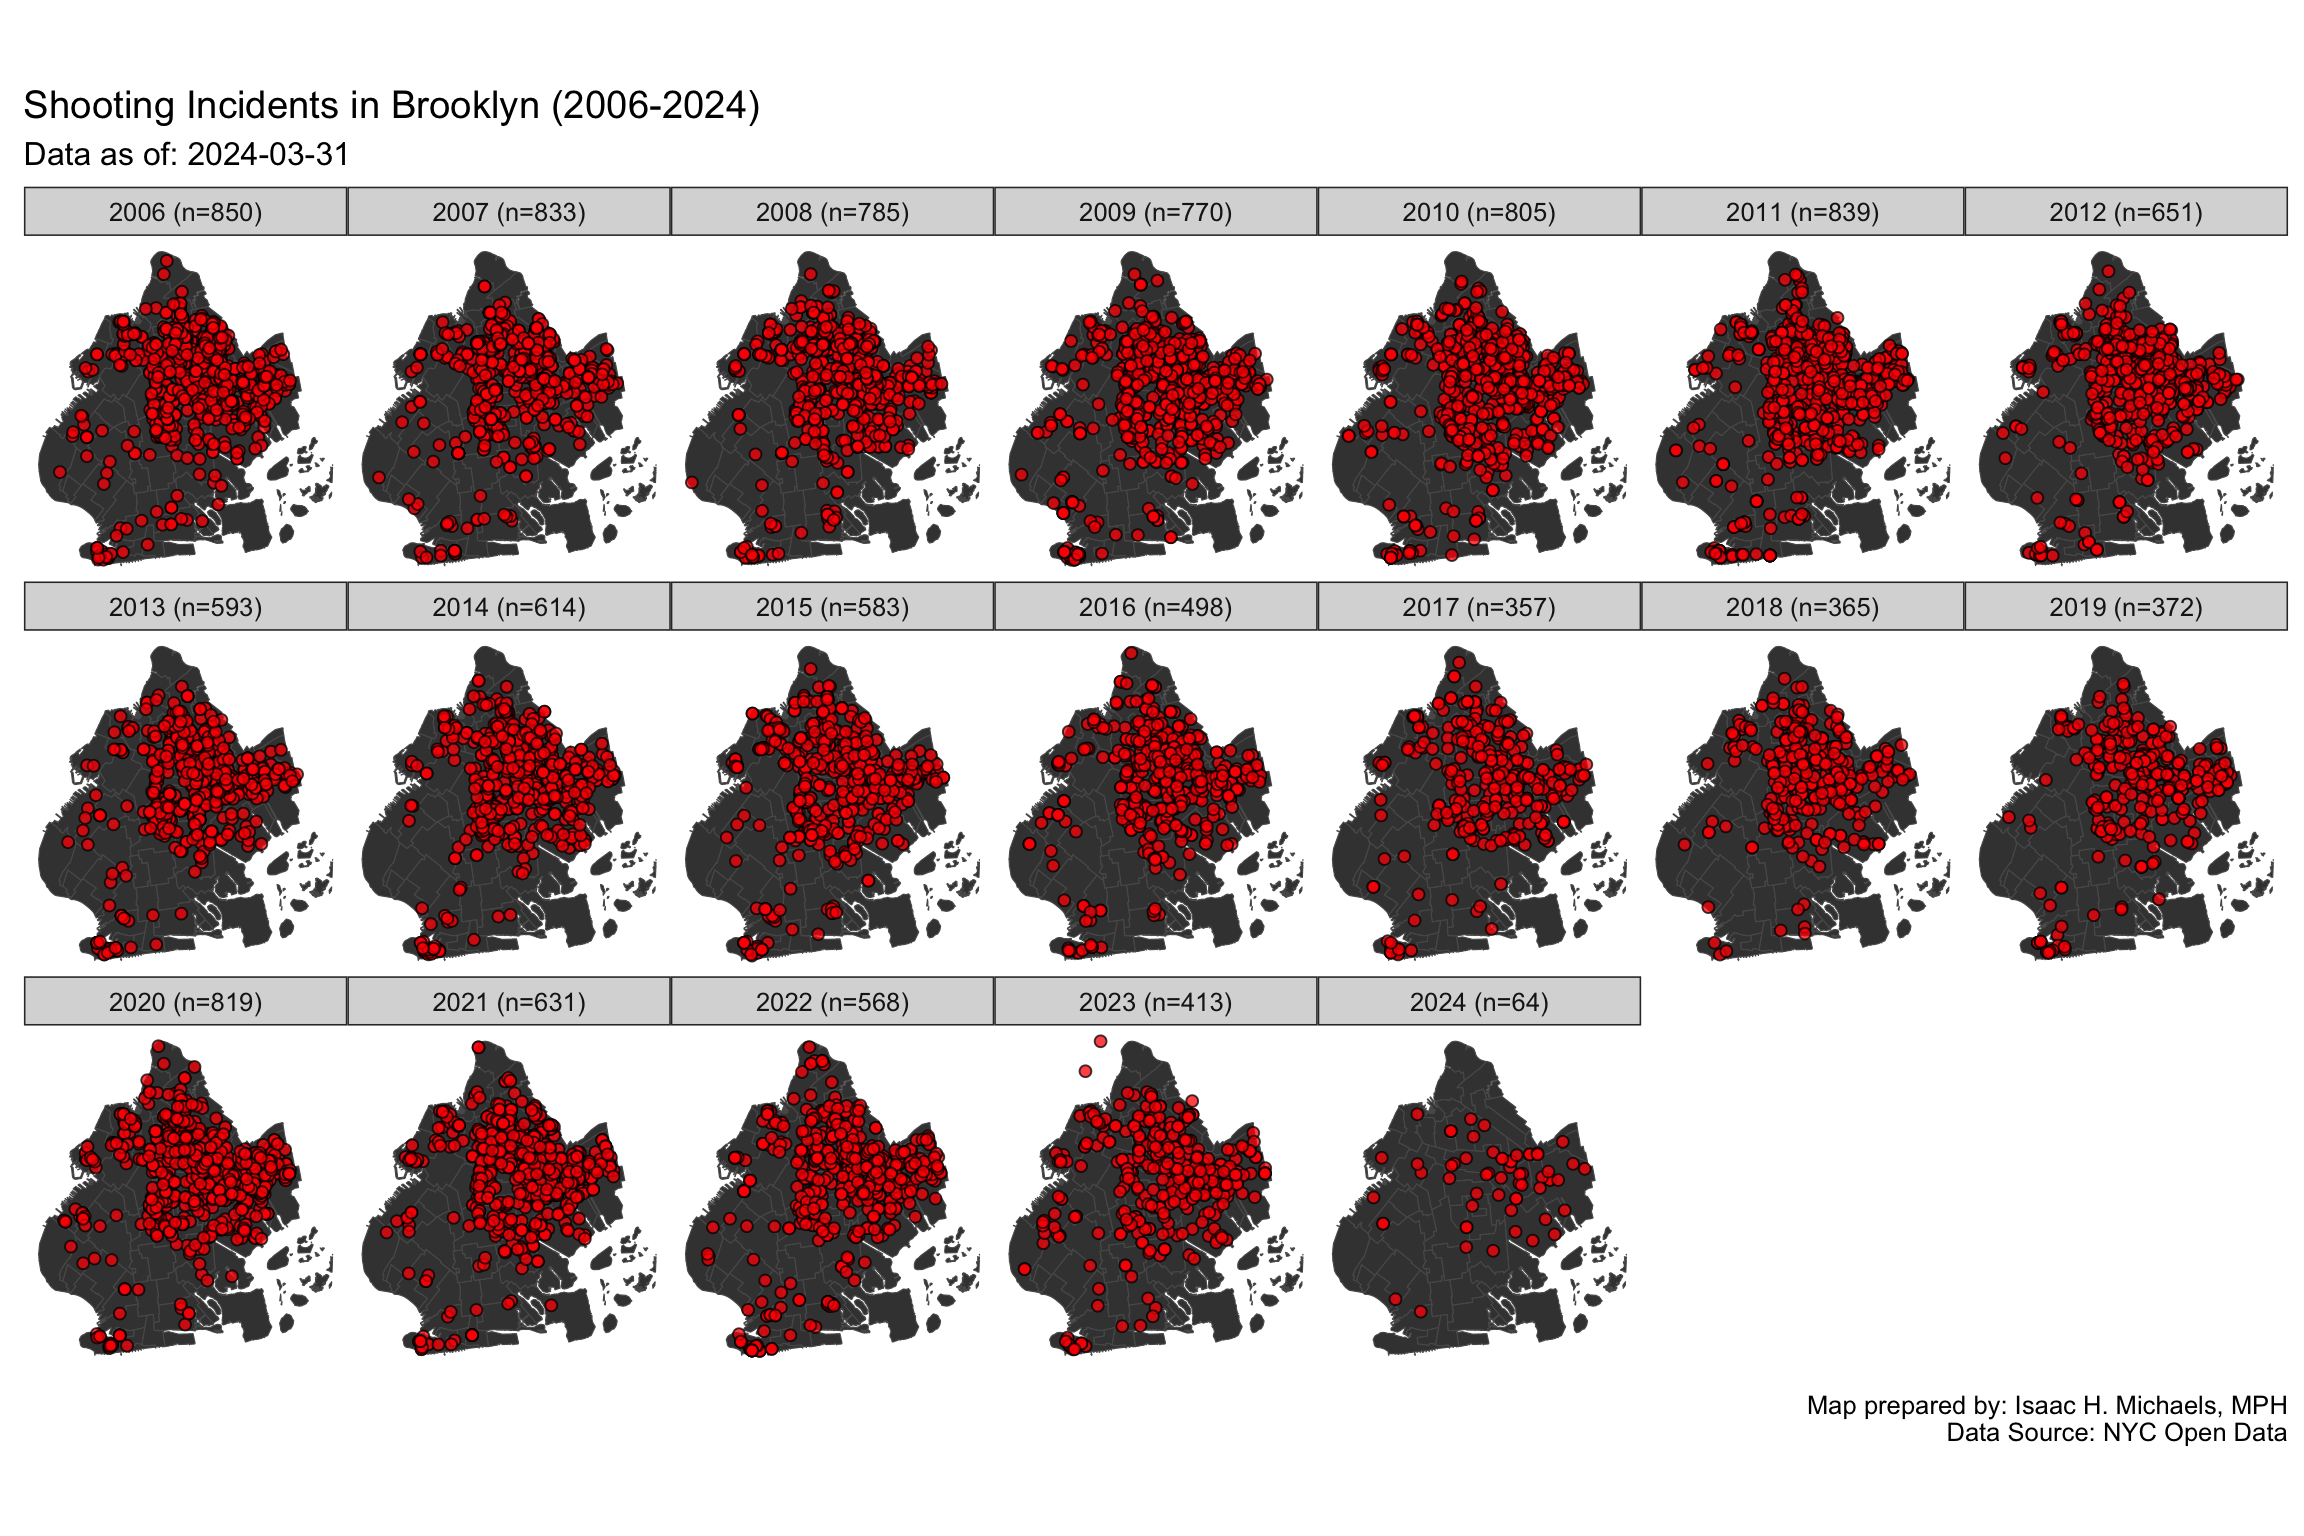 Maps Prepared By:
 Manhattan
 Maps Prepared By: Isaac H. Michaels, DrPH
Data Source: NYC Open Data (Current, Historical)
 Maps Prepared By:
 Staten Island
 Maps Prepared By: Isaac H. Michaels, DrPH
Data Source: NYC Open Data (Current, Historical)
Technical Notes
Dataset Description
Description excerpted from https://data.cityofnewyork.us/Public-Safety/NYPD-Shooting-Incident-Data-Historic-/833y-fsy8:
List of every shooting incident that occurred in NYC going back to 2006 through the end of the previous calendar year. This is a breakdown of every shooting incident that occurred in NYC going back to 2006 through the end of the previous calendar year. This data is manually extracted every quarter and reviewed by the Office of Management Analysis and Planning before being posted on the NYPD website. Each record represents a shooting incident in NYC and includes information about the event, the location and time of occurrence. In addition, information related to suspect and victim demographics is also included. This data can be used by the public to explore the nature of shooting/criminal activity. Please refer to the attached data footnotes for additional information about this dataset.
NYPD Shooting Incident Level Data Footnotes
Select footnotes excerpted from https://data.cityofnewyork.us/api/views/833y-fsy8/files/e4e3d86c-348f-4a16-a17f-19480c089429?download=true&filename=NYPD_Shootings_Incident_Level_Data_Footnotes.pdf:
Information is accurate as of the date it was queried from the system of record, but should be considered a close approximation of current records, due to revisions and updates.
Data is available as of the date that technological enhancements to information systems allowed for data capture. Null values appearing frequently in certain fields may be attributed to changes on official department forms where data was previously not collected. Null values may also appear in instances where information was not available or unknown at the time of the report and should be considered as either “Unknown/Not Available/Not Reported.”
A shooting incident can have multiple victims involved and as a result duplicate INCIDENT_KEY’s are produced. Each INCIDENT_KEY represents a victim but similar duplicate keys are counted as one incident.
Shooting incidents occurring near an intersection are represented by the X coordinate and Y coordinates of the intersection Shooting incidents occurring anywhere other than at an intersection are geo-located to the middle of the nearest street segment where appropriate.
Any attempt to match the approximate location of the incident to an exact address or link to other datasets is not recommended.
Many other shooting incidents that were not able to be geo-coded (for example, due to an invalid address) have been located as occurring at the police station house within the precinct of occurrence.
Shooting incidents occurring in open areas such as parks or beaches may be geo-coded as occurring on streets or intersections bordering the area.
Shooting incidents occurring on a moving train on transit systems are geo-coded as occurring at the train’s next stop.
All shooting incidents occurring within the jurisdiction of the Department of Correction have been geo-coded as occurring on Riker’s Island.
X and Y Coordinates are in NAD 1983 State Plane New York Long Island Zone Feet (EPSG 2263).
latitude and longitude Coordinates are provided in Global Coordinate System WGS 1984 decimal degrees (EPSG 4326).
Errors in data transcription may result in nominal data inconsistencies.
The CSV file should be opened using an appropriate tool for data exploration, e.g. SPSS, SAS, Tableau, etc. If using MS Excel, be sure to use the tools for importing external data, otherwise inconsistencies may occur when viewing the data.
Only valid shooting incidents resulting in an injured victim are included in this release. Shooting incidents not resulting in an injured victim are classified according to the appropriate offense according to NYS Penal Law.