Health Care Charge Comparisons

December 29, 2019
health care variation cost analysis care delivery New York State


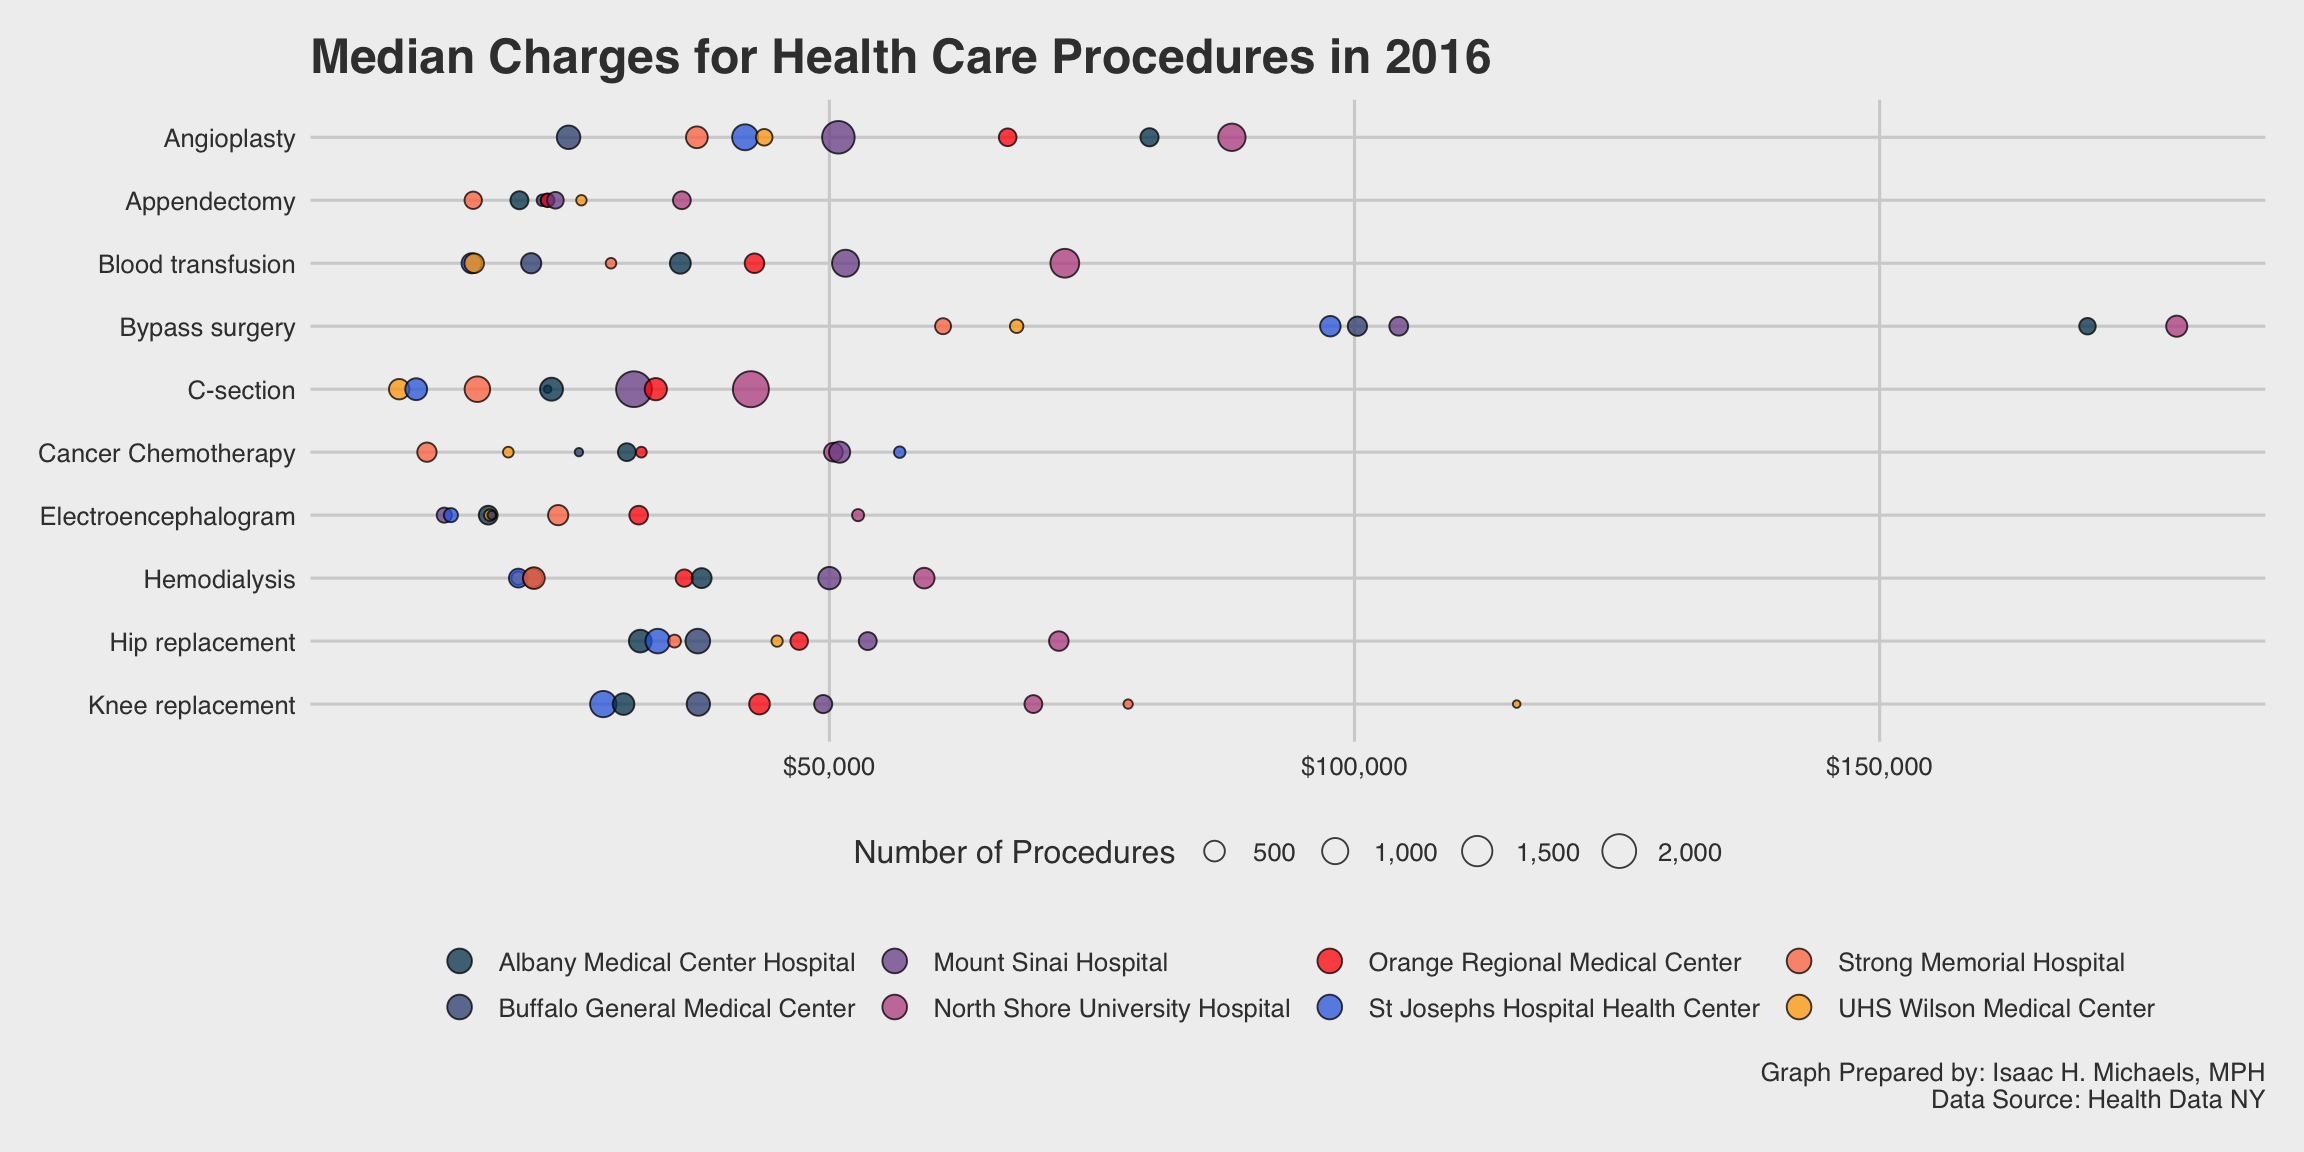
Graph Prepared By: Isaac H. Michaels, MPH
Death Source: Health Data NY


Data Visualization Inspired By:
Sanger-Katz M. In the U.S., an Angioplasty Costs $32,000. Elsewhere? Maybe $6,400. New York Times. December 27, 2019. https://www.nytimes.com/2019/12/27/upshot/expensive-health-care-world-comparison.html. Accessed December 29, 2019.


Facility Selections:
Article 28 hospital facilities with the highest number of inpatient discharges in each of eight Health Service Areas in New York State during 2016 were selected for the above graph.


Procedure Definitions:
Procedure CCS.Procedure.Code CCS.Procedure.Description
Angioplasty 45 Perc Translum Cor Angio
Appendectomy 80 Appendectomy
Blood transfusion 222 Blood Transfusion
Bypass surgery 44 Cor Artery Byp Grf-Cabg
C-section 134 Cesarean Section
Cancer Chemotherapy 224 Cancer Chemotherapy
Electroencephalogram 199 Electroencephalogram
Hemodialysis 58 Hemodialysis
Hip replacement 153 Hip Replacement,Tot/Prt
Knee replacement 152 Arthroplasty Knee

New York Racing Horse Death Report

June 12, 2026
New York State Animal Welfare Equine Fatality Analysis

This report utilizes data from the New York State Gaming Commission to analyze equine fatalities at race tracks, uncovering trends and patterns to enhance horse safety and welfare. Despite limitations like potential underreporting and data quality issues, the report offers critical insights into the…

Read more →

New York State Budget Analysis

June 11, 2026
New York State State Budget Fiscal Analysis Public Spending

Explore a detailed analysis of New York State’s budget, highlighting revenues, disbursements, and key financial trends. This comprehensive overview, updated annually, delves into the fiscal dynamics of the Empire State, including breakdowns by agency, function, and fund. Access the data to gain insi…

Read more →

Notifiable Disease Incidence in New York State

June 10, 2026
New York State Communicable Diseases Epidemiology Data Visualization

Explore comprehensive data on communicable disease incidence in New York State, featuring weekly updates and detailed analyses. This page presents visualizations including heat maps, bar graphs, and longitudinal trend graphs, derived from CDC data. Discover insights into disease patterns and trends,…

Read more →