Published: September 16, 2018
Updated: September 16, 2025 at 08:57PM
Application embedded below. Full screen version available at:
https://isaac-michaels.shinyapps.io/NYC_311_Dashboard/
Published: September 16, 2018
Updated: September 16, 2025 at 08:57PM
Application embedded below. Full screen version available at:
https://isaac-michaels.shinyapps.io/NYC_311_Dashboard/
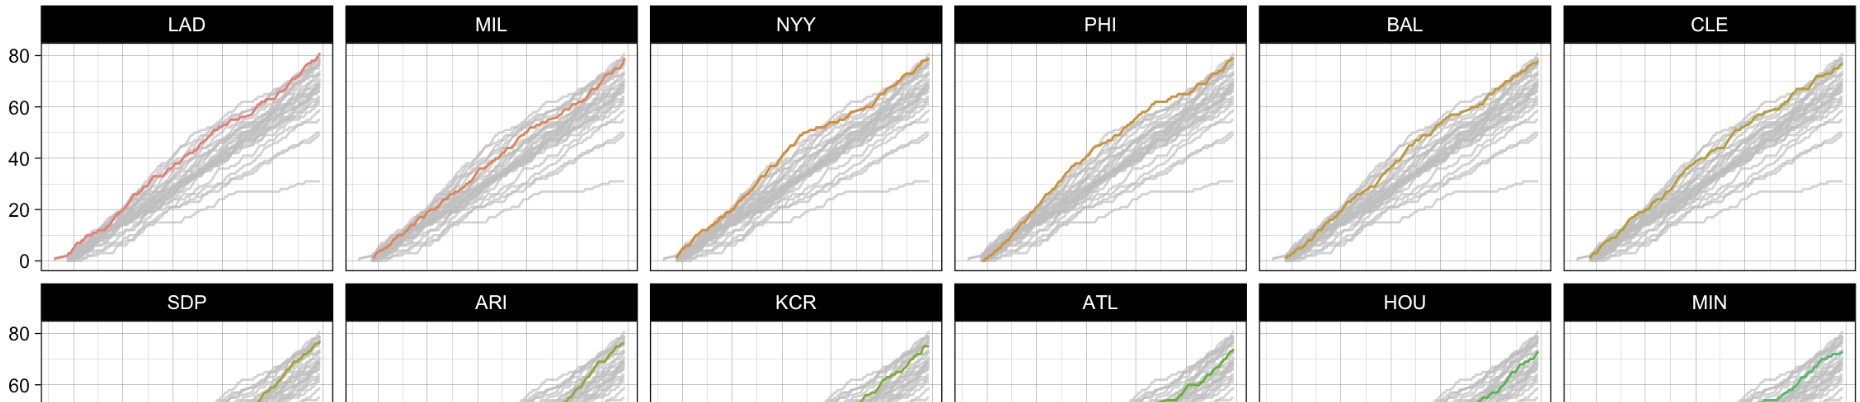
Explore my detailed MLB season insights through interactive visualizations and data tables. I’ve included animations of cumulative wins, trend graphs, scatter plots of runs scored vs. runs allowed, and bar graphs of run differentials. Updated daily during baseball season, this page provides a compre…
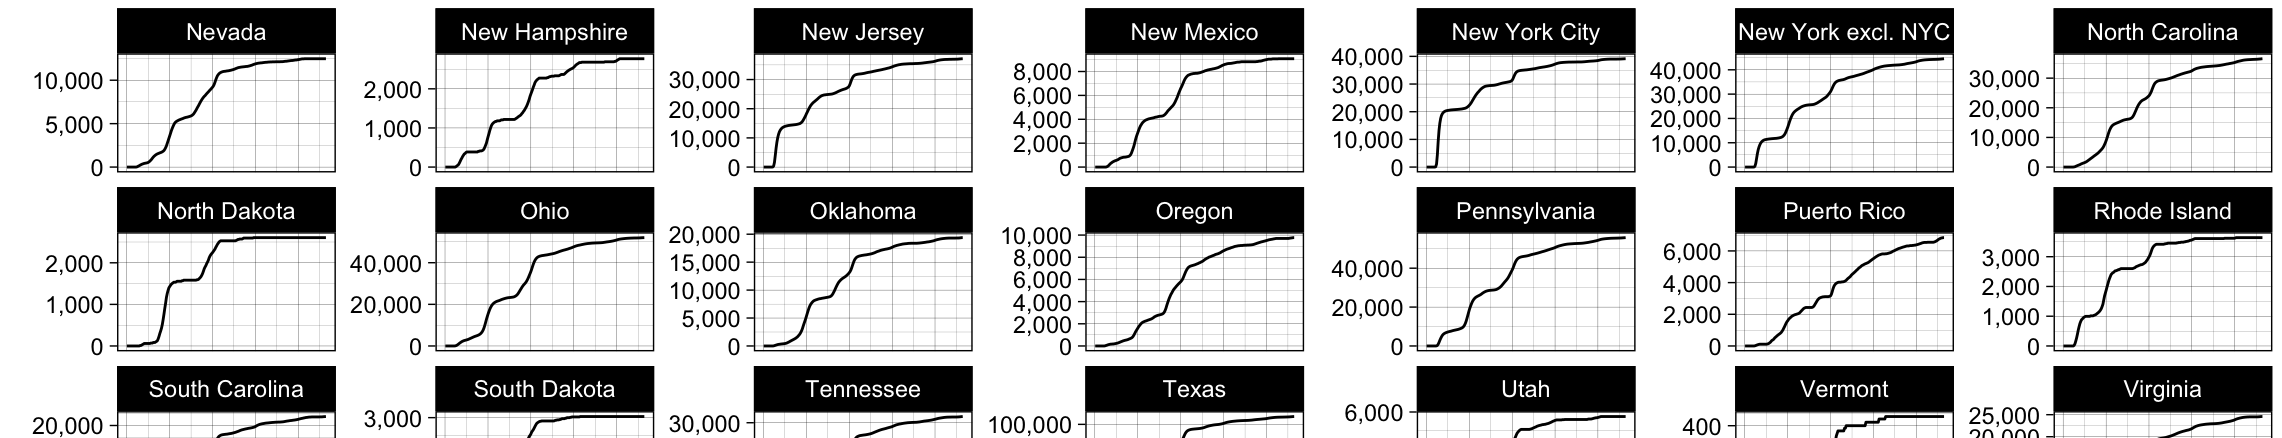
Published: March 25, 2020 Updated: September 16, 2025 at 08:56PM Welcome Welcome to this web page, which presents analyses of data on COVID-19 in the United States. I believe that data are an essential component of any public health response. The data on this page are obtained from the data.cdc.gov …
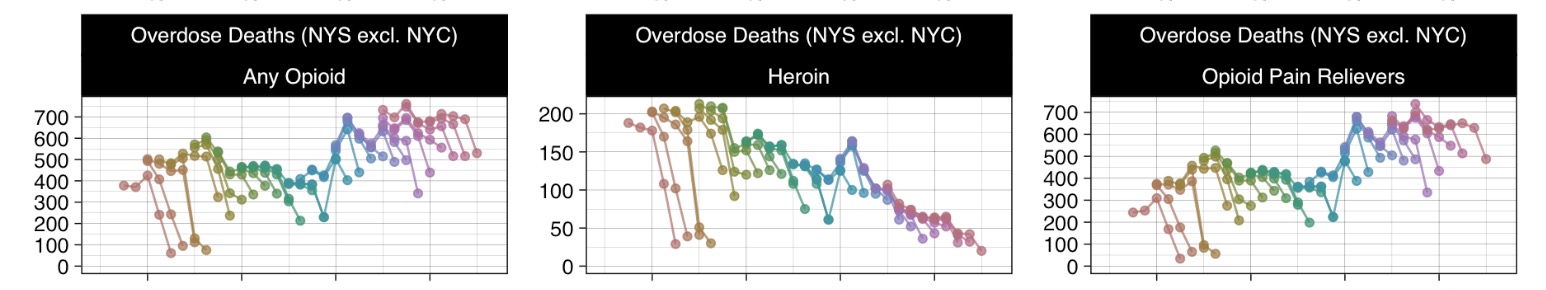
Explore the provisional data on opioid overdoses in New York State. This page offers detailed visualizations and analyses of overdose deaths, hospitalizations, emergency department visits, and naloxone administrations. Learn about state and county-level trends, and access vital information on how to…