- Welcome
- Data Overview
- How to Use These Data
- Why are these data important?
- What can you do to protect yourself and your community?
- Data Visualizations
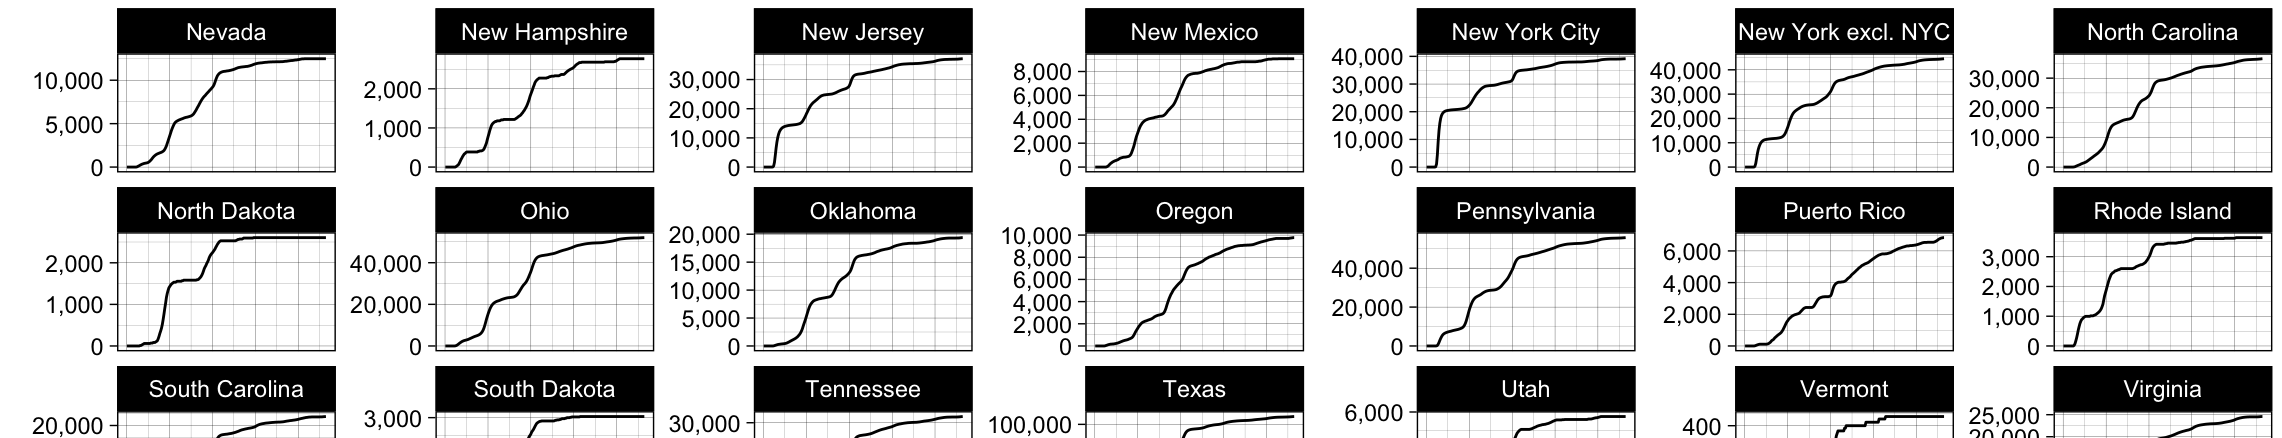
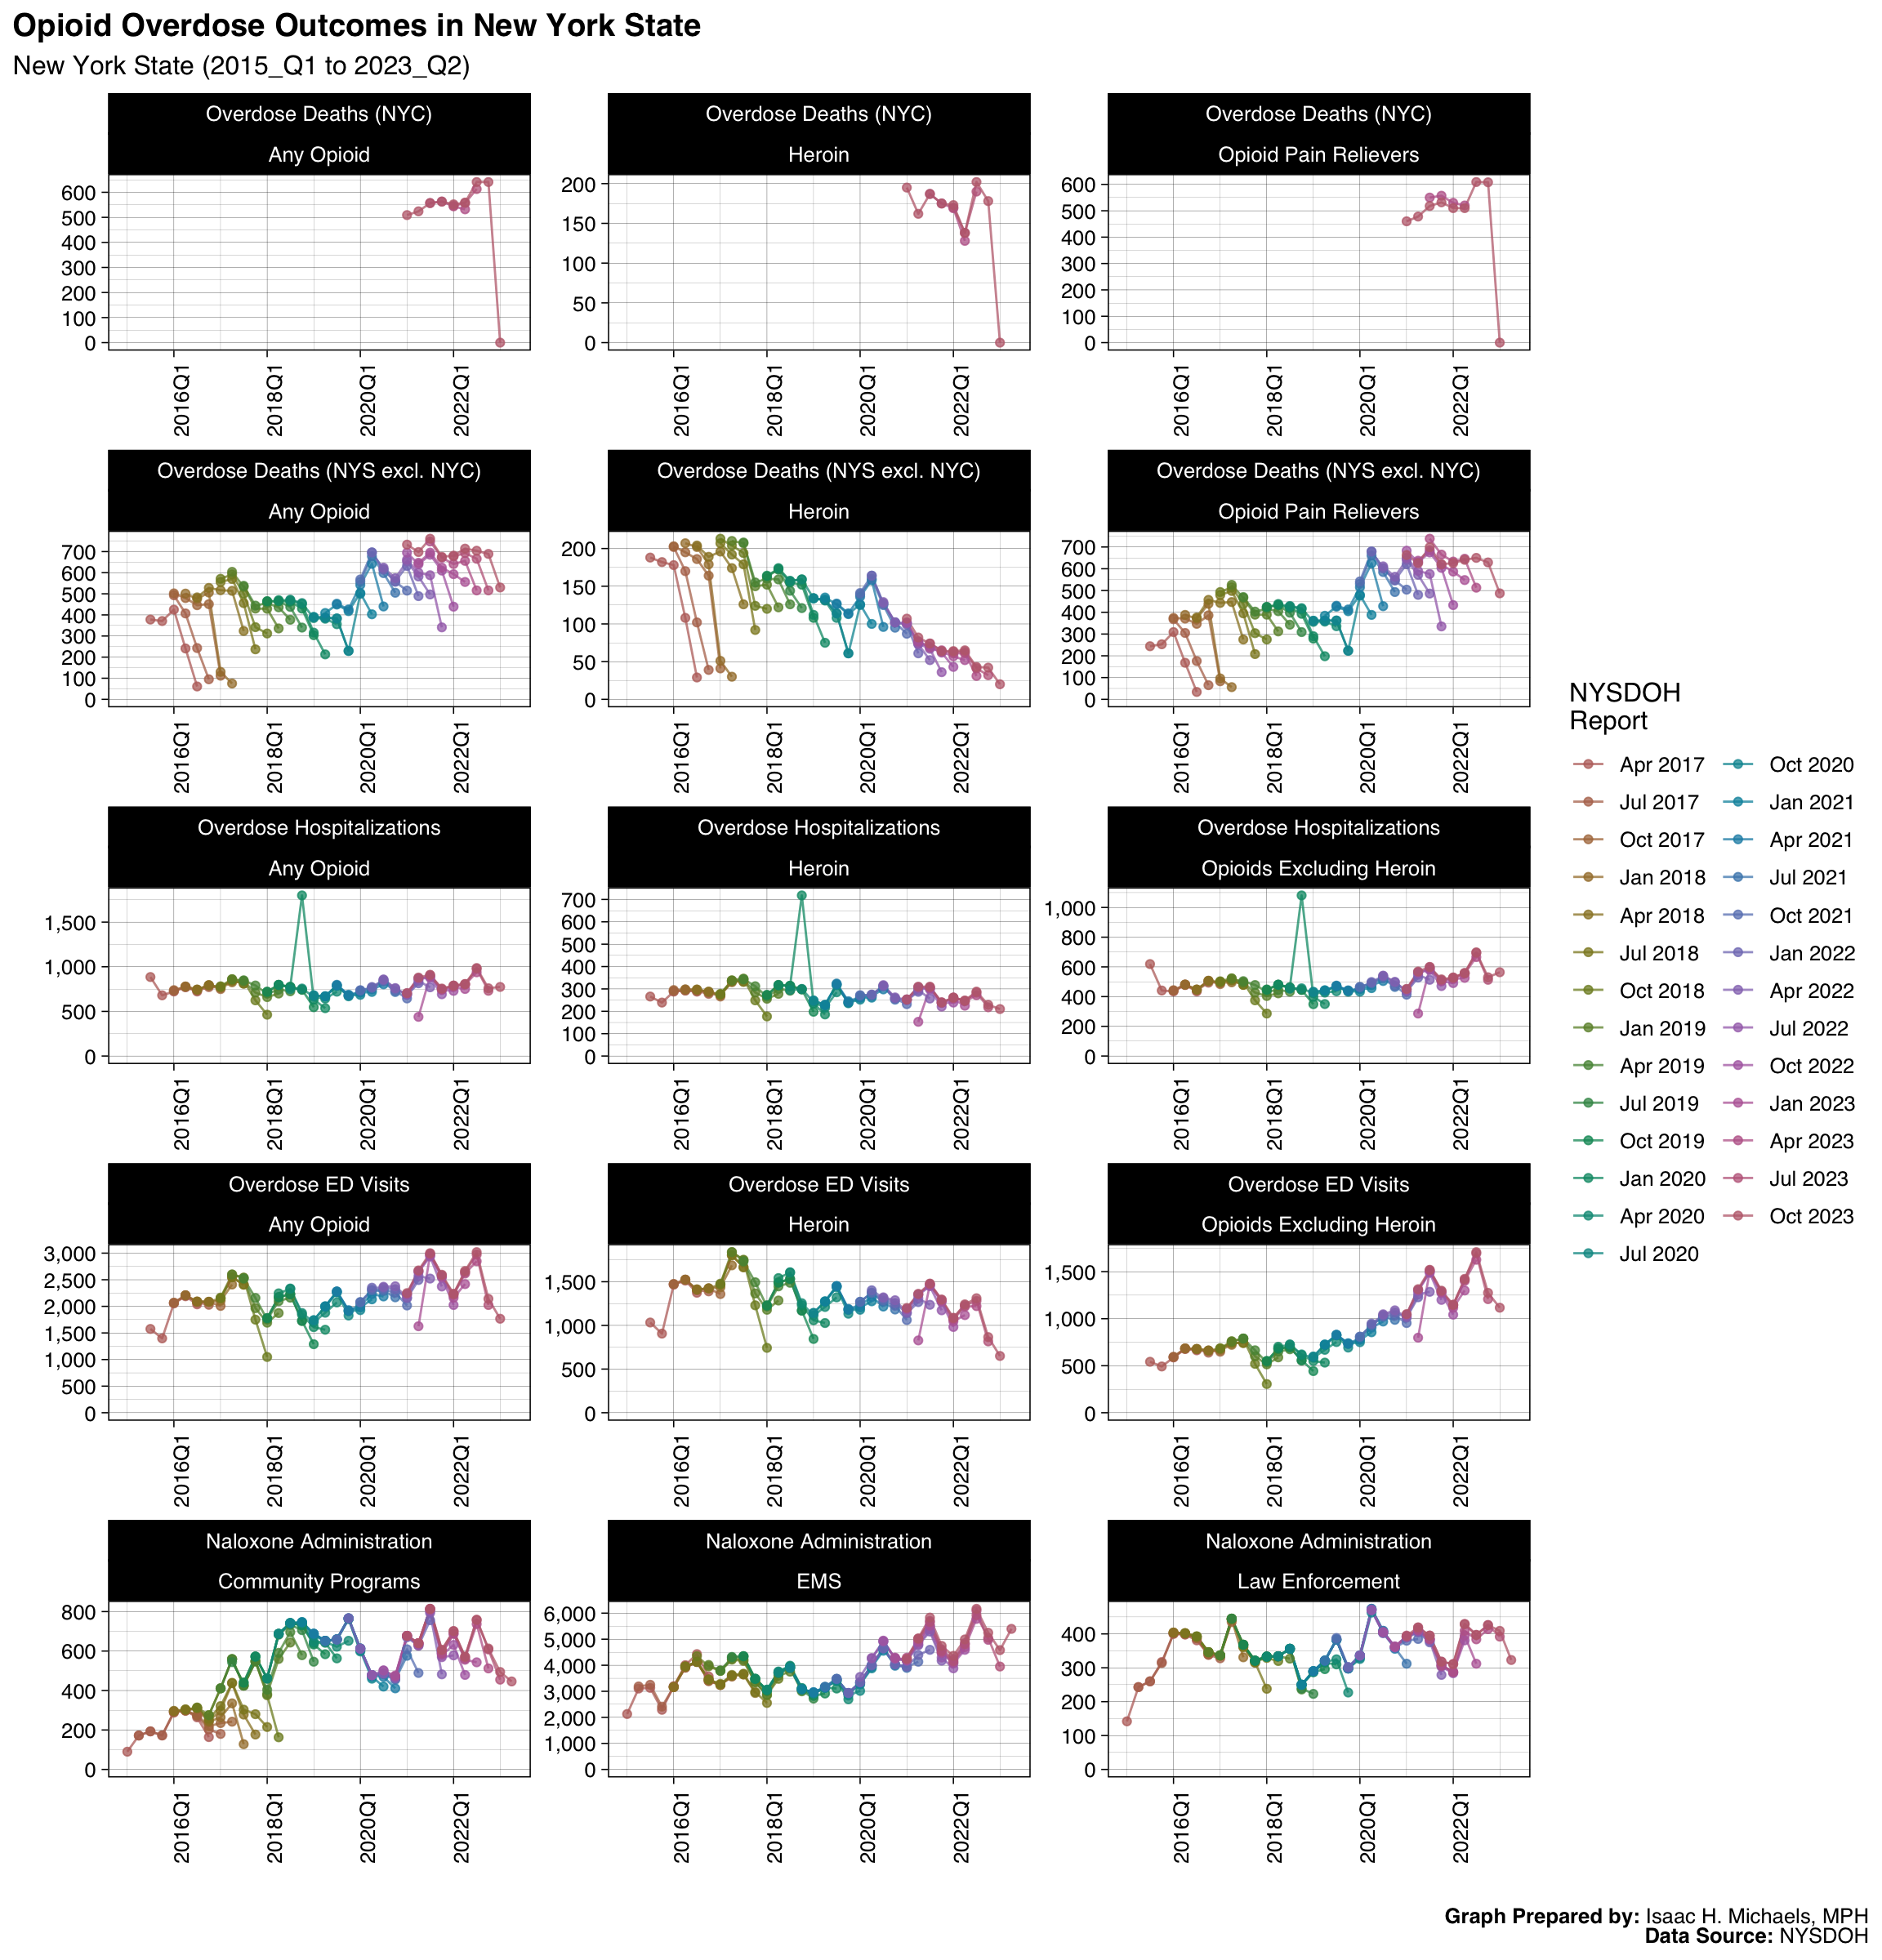
- Statewide
- By County
- Counts
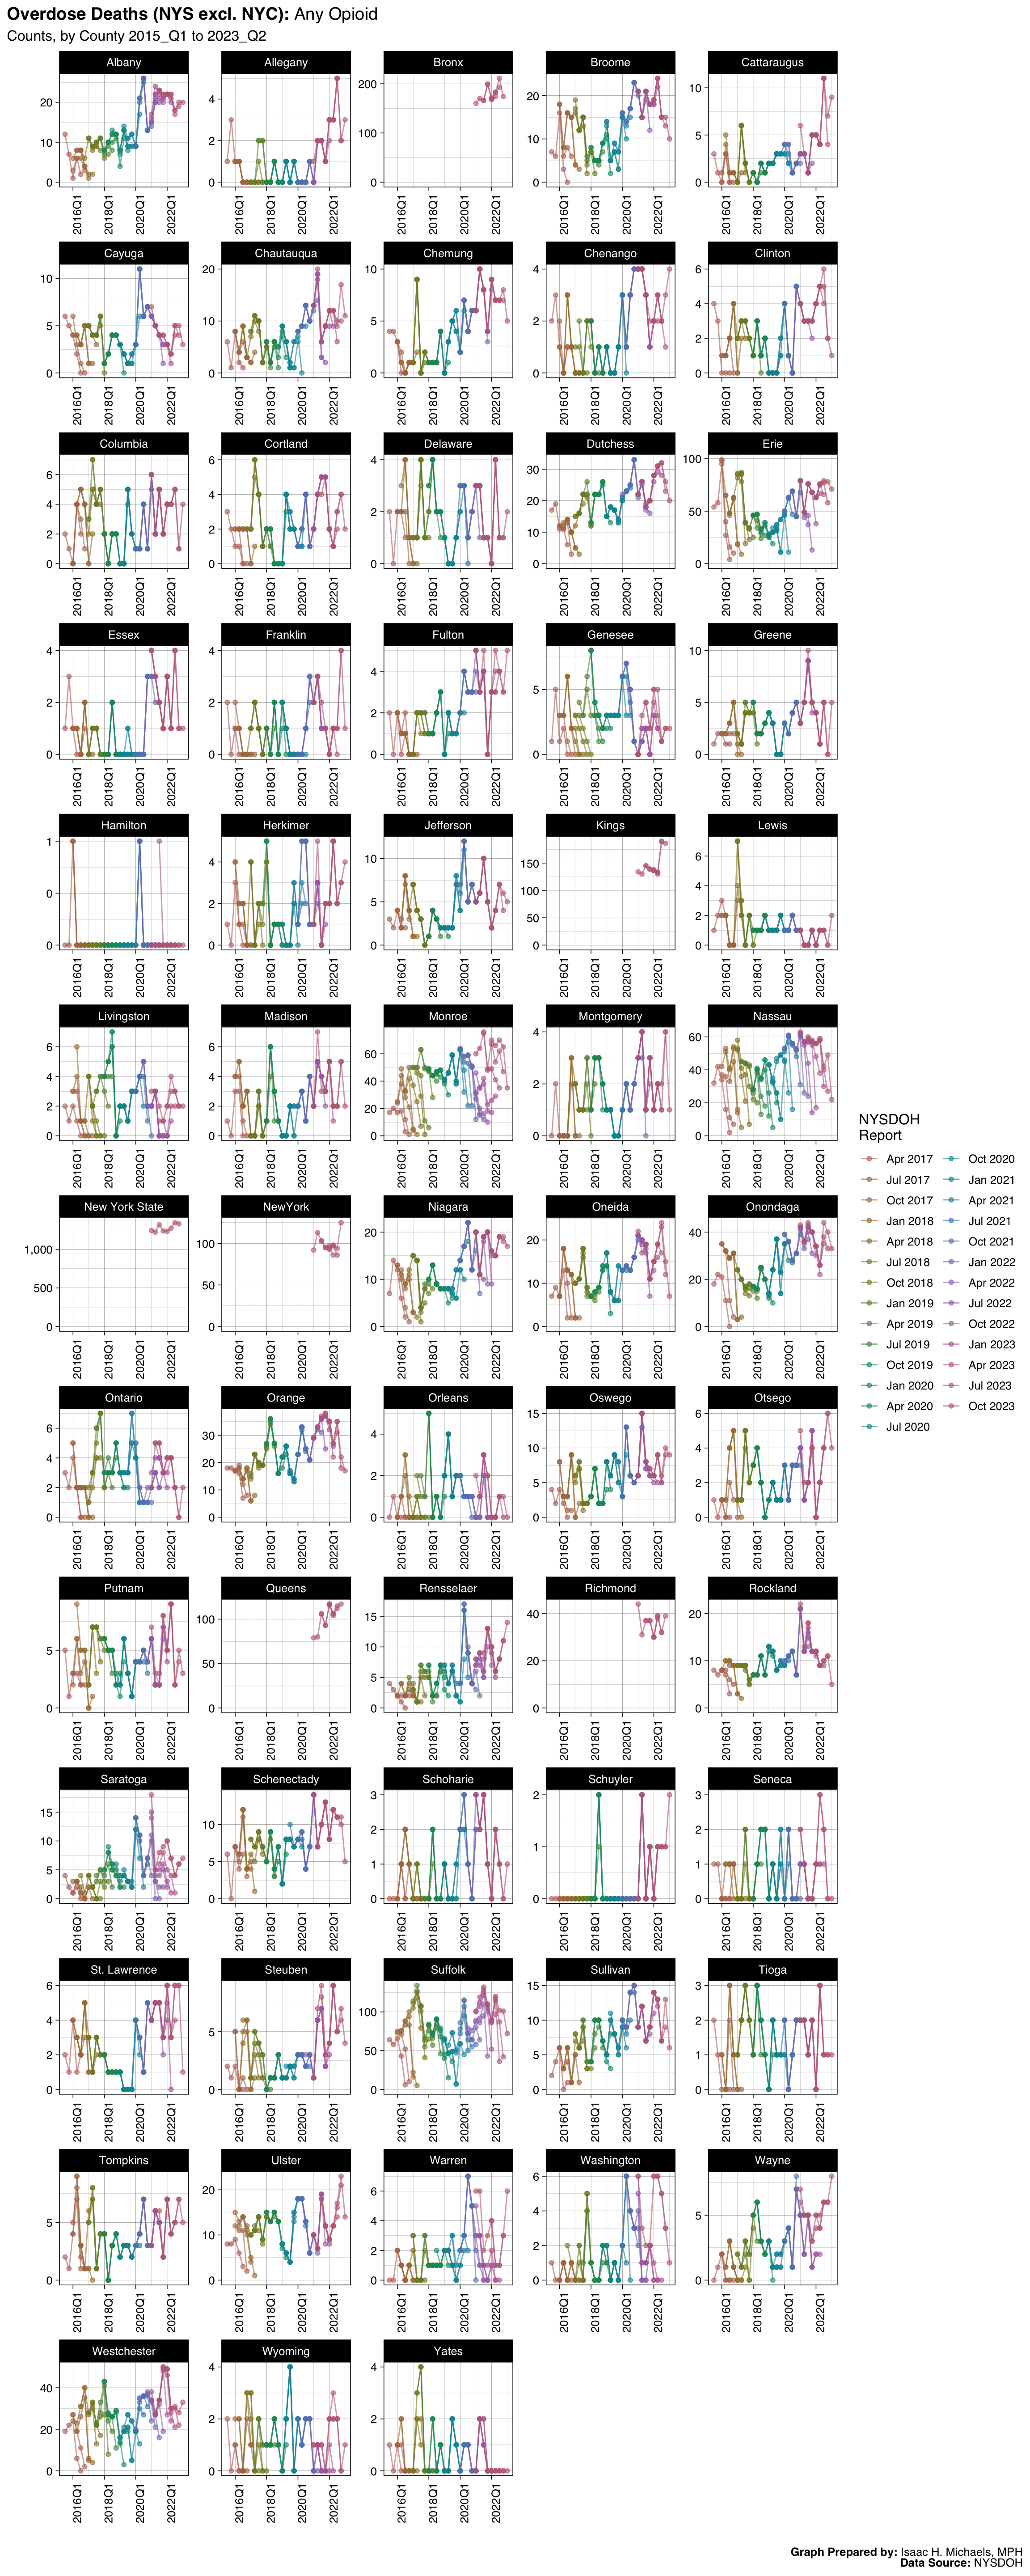
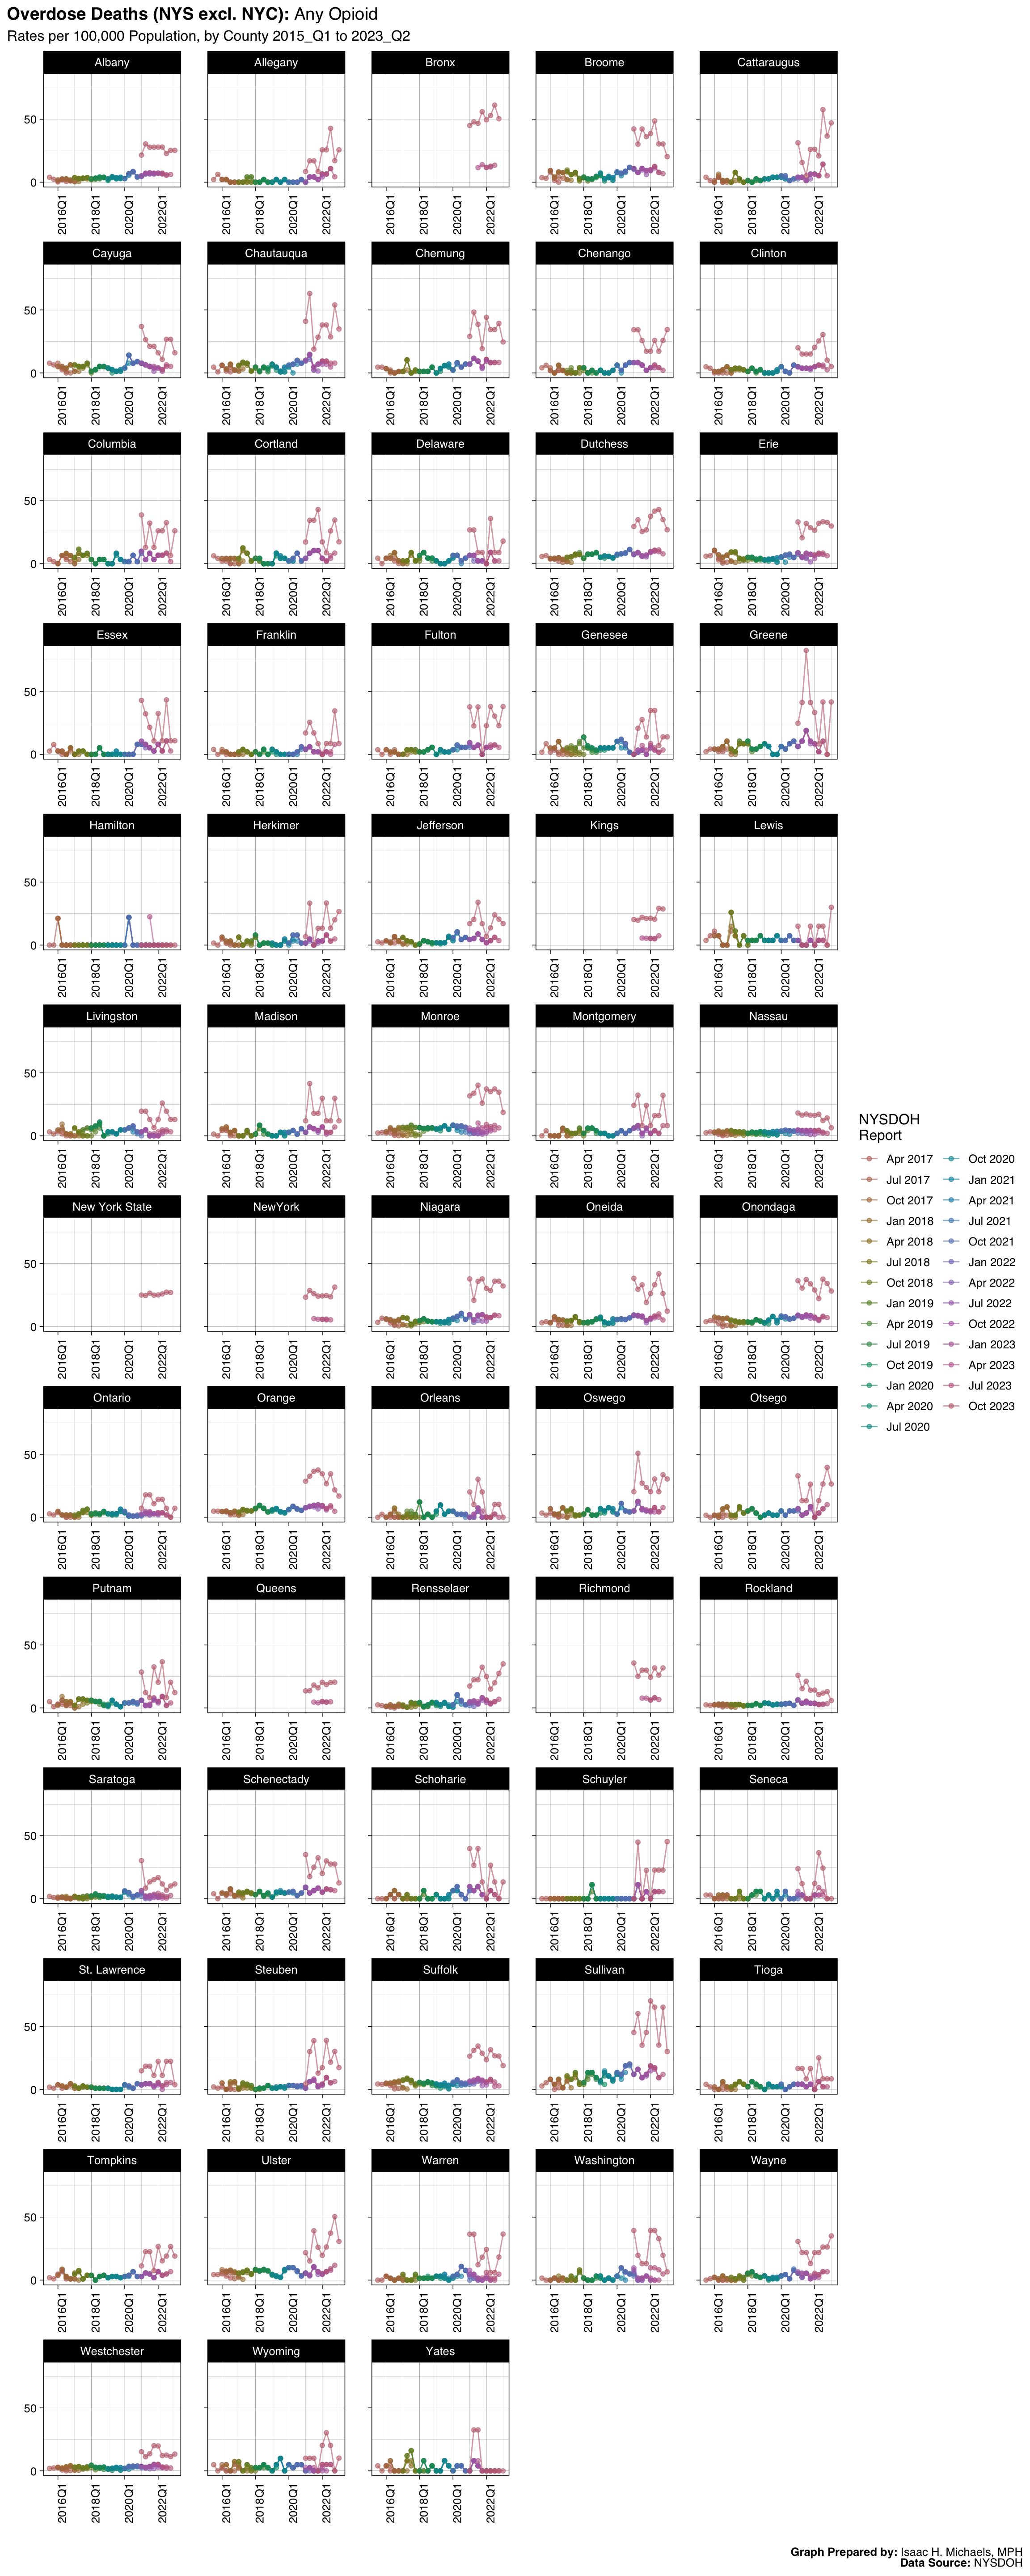
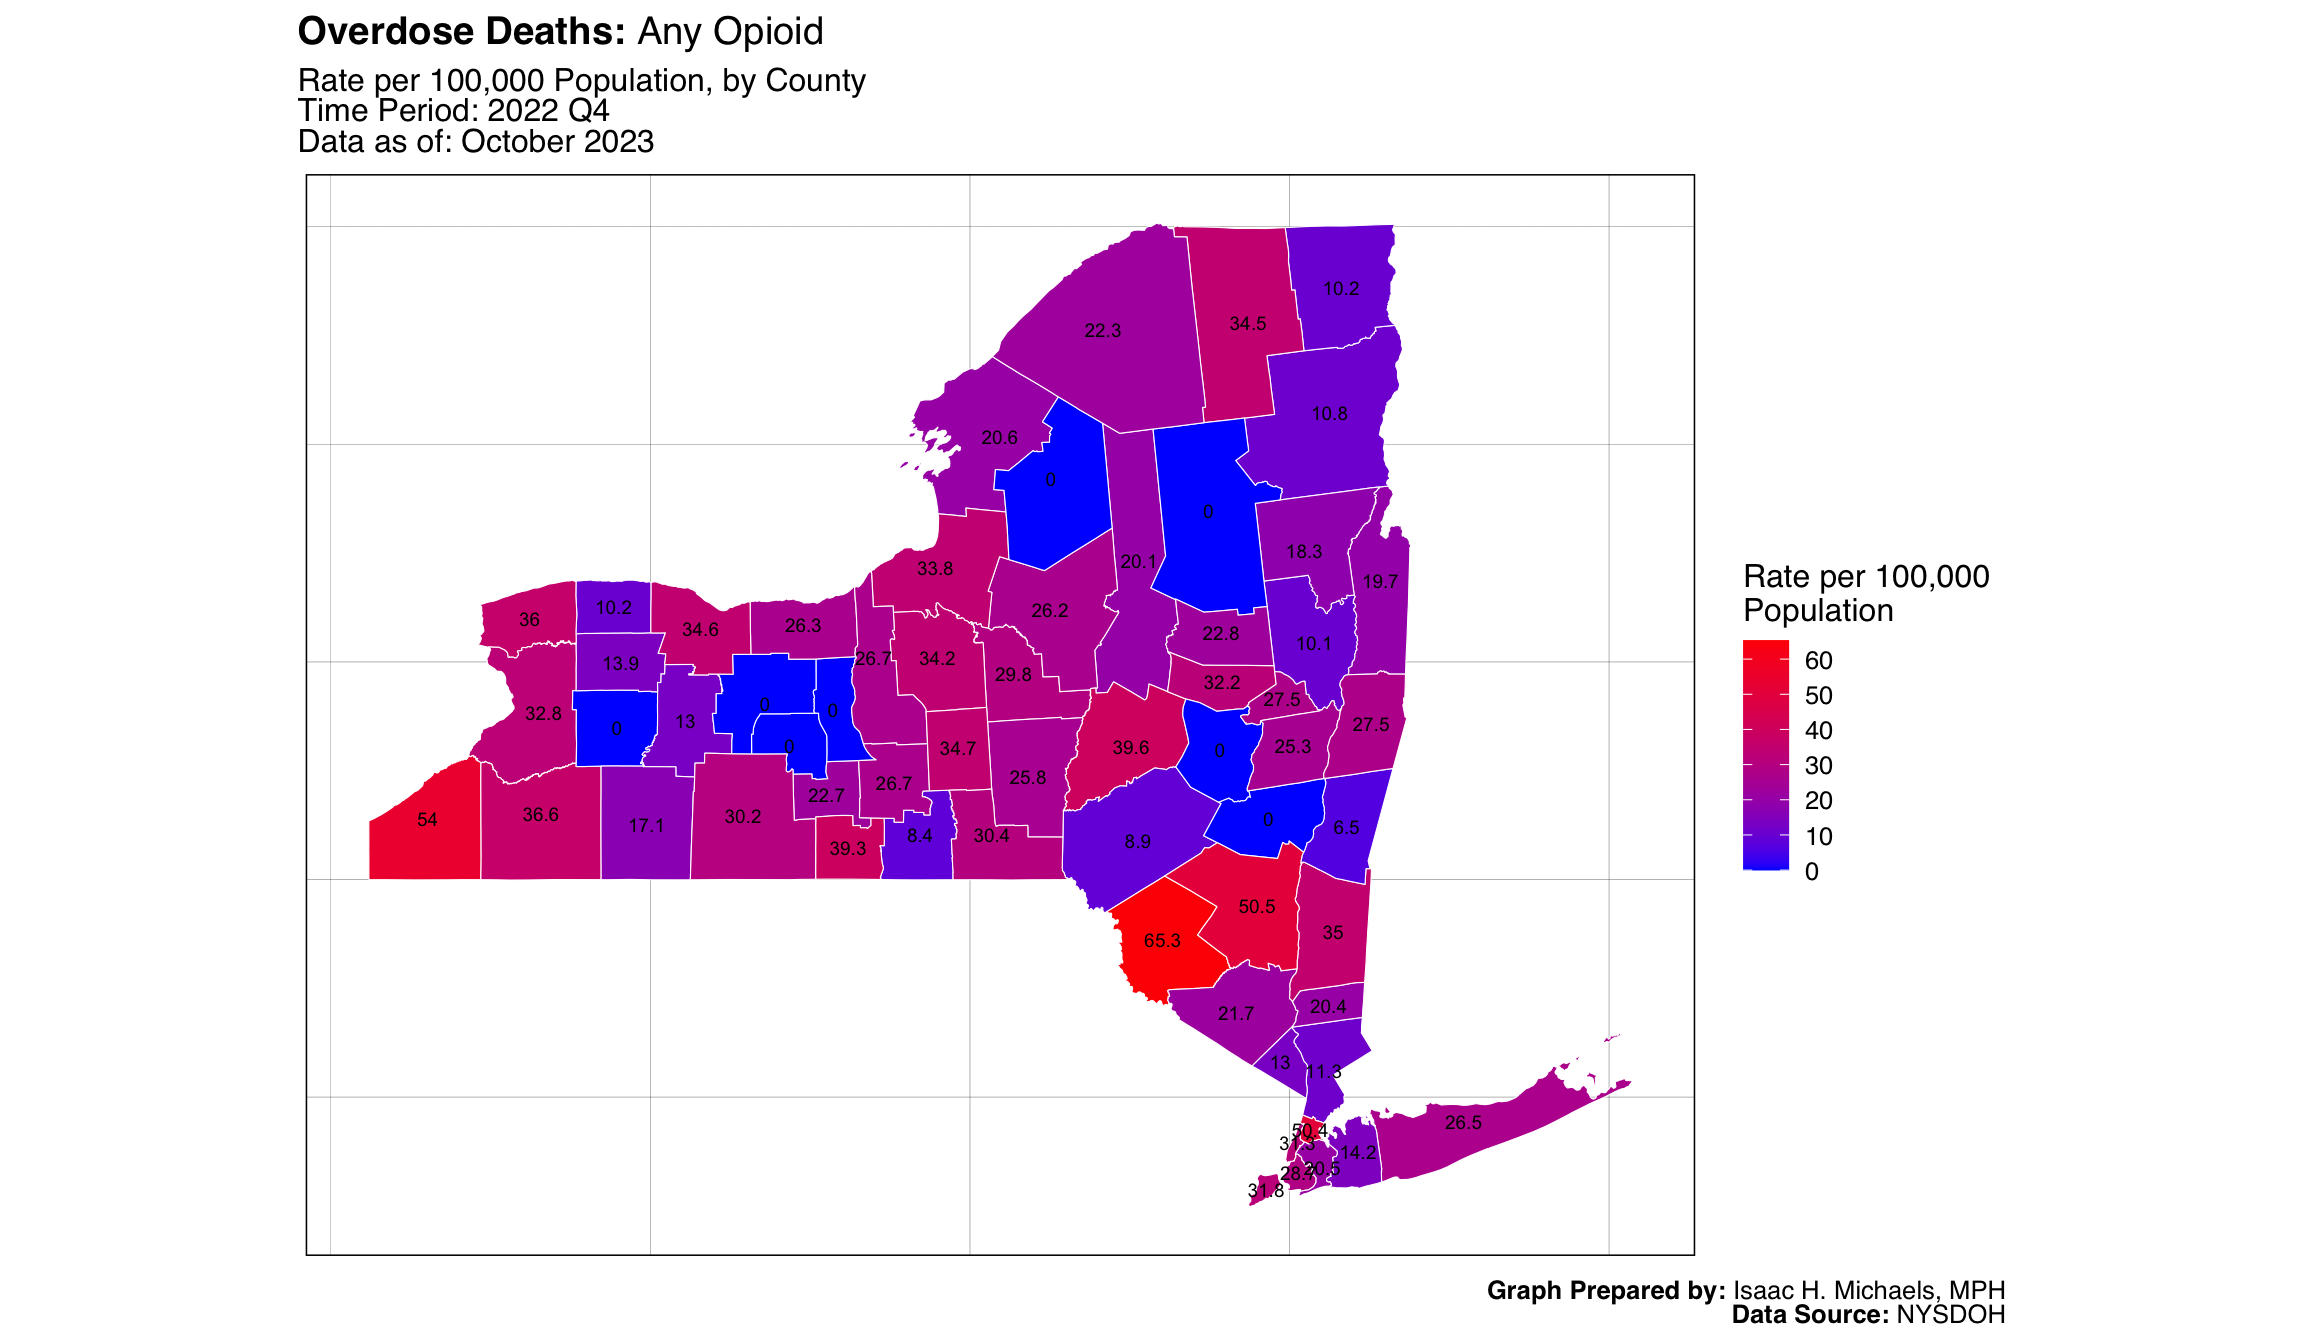
- Deaths: Any Opioid
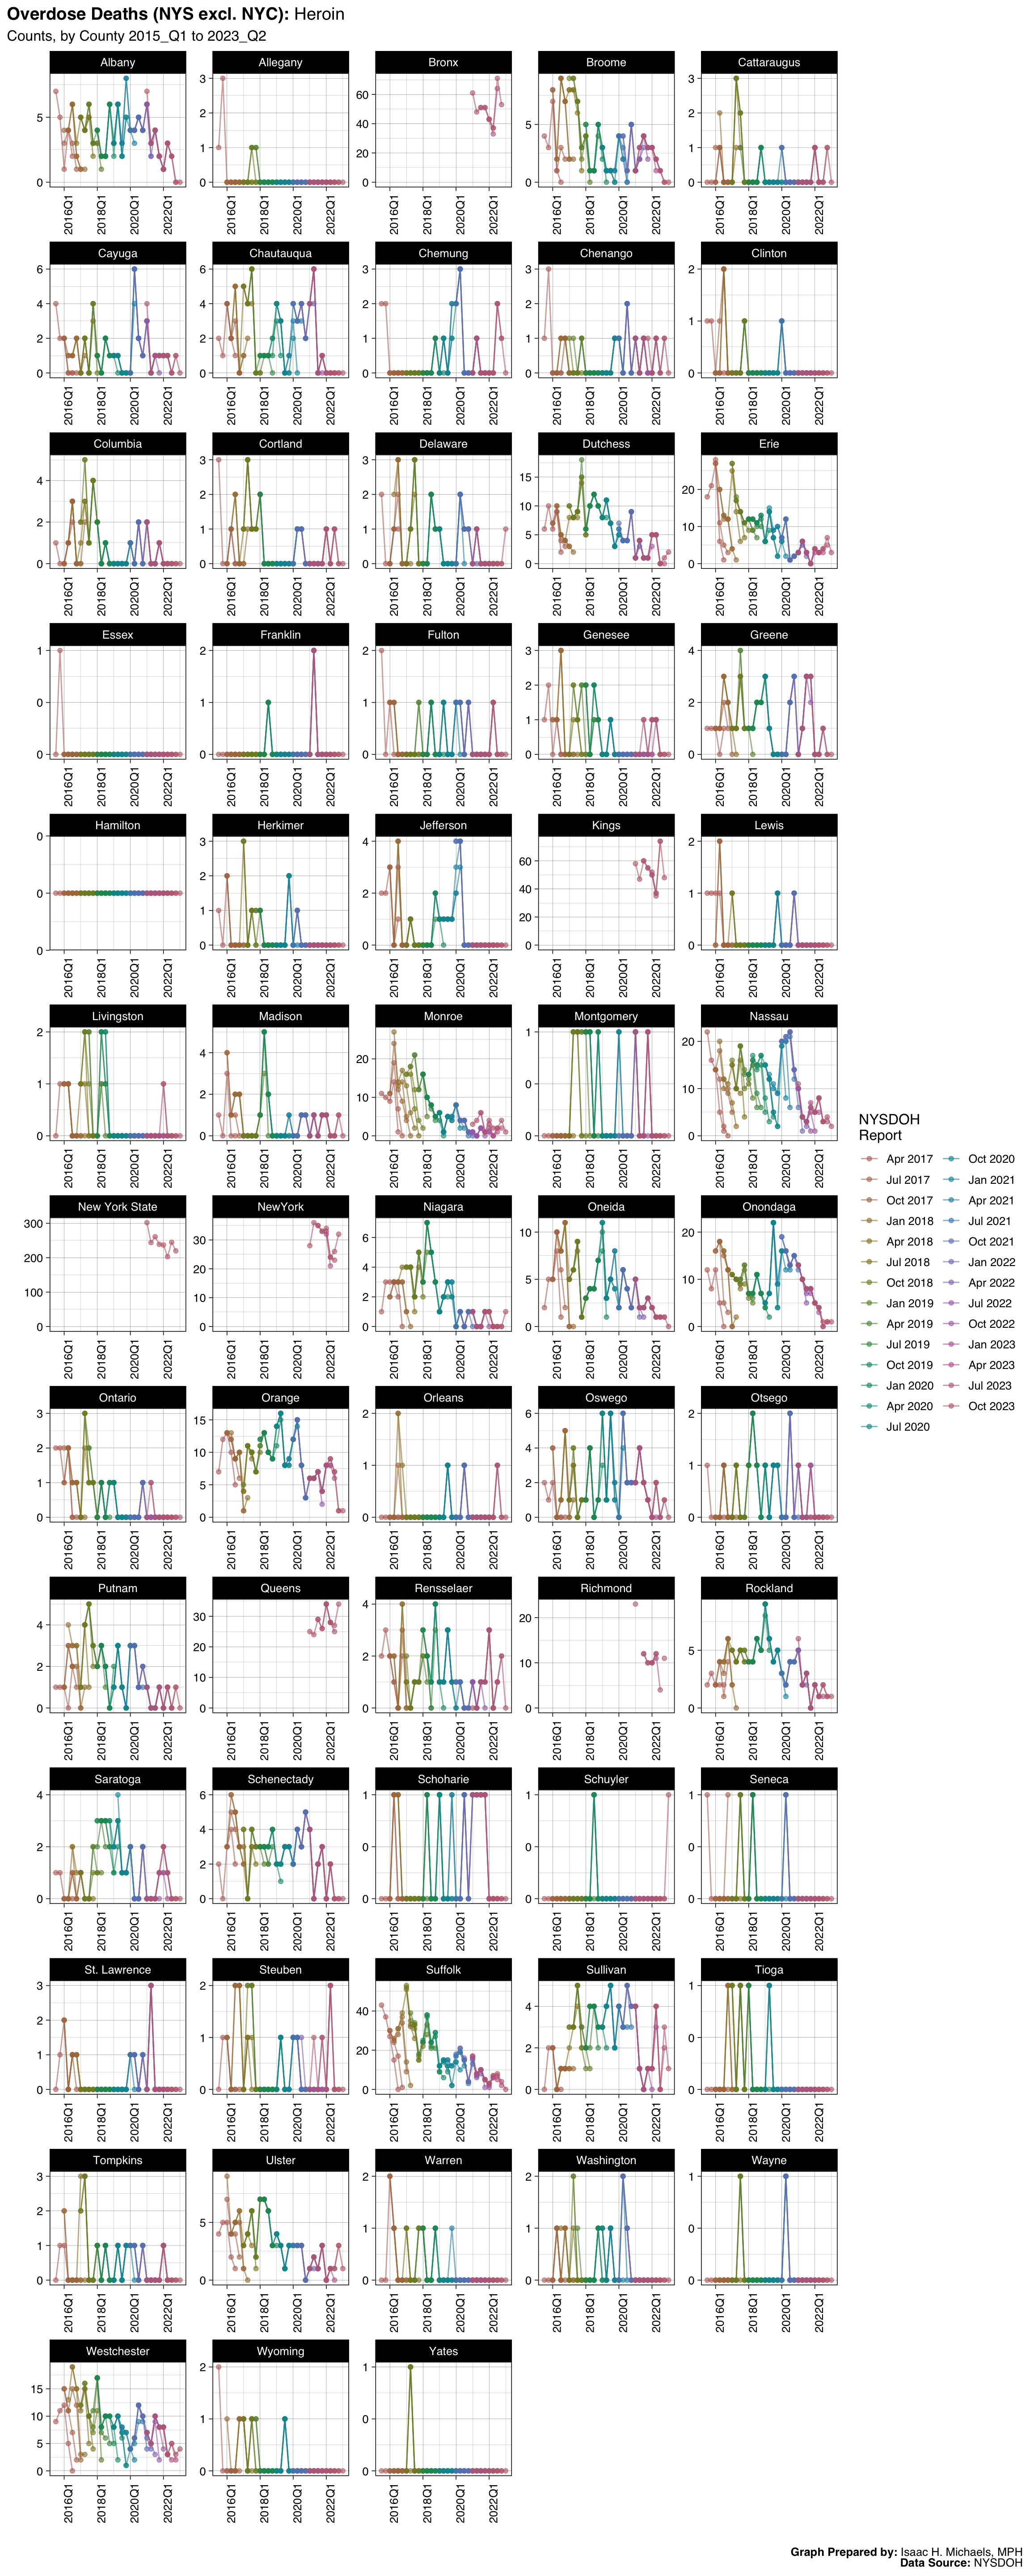
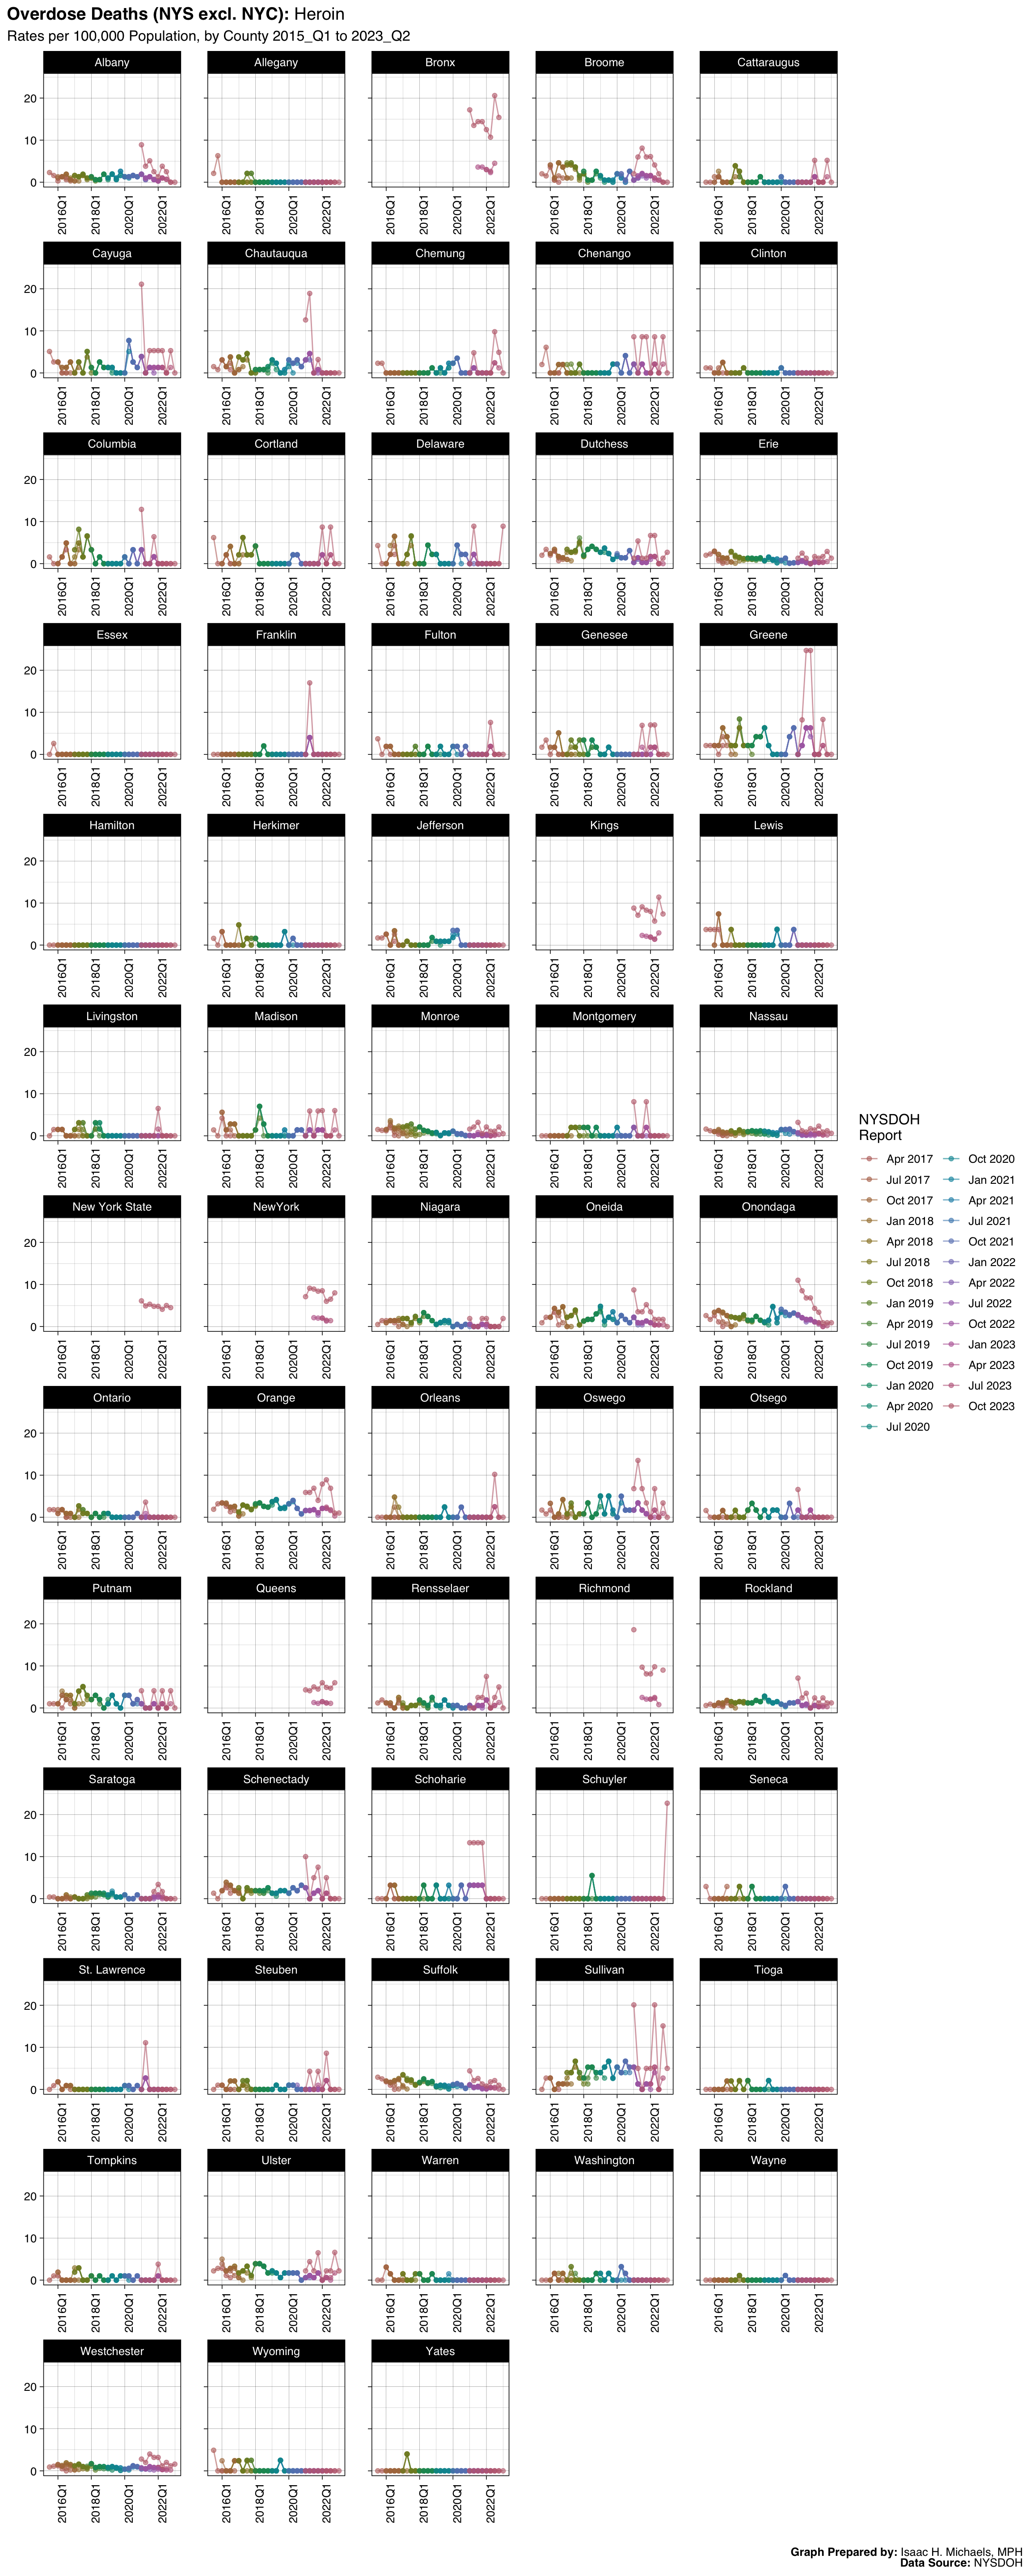
- Deaths: Heroin
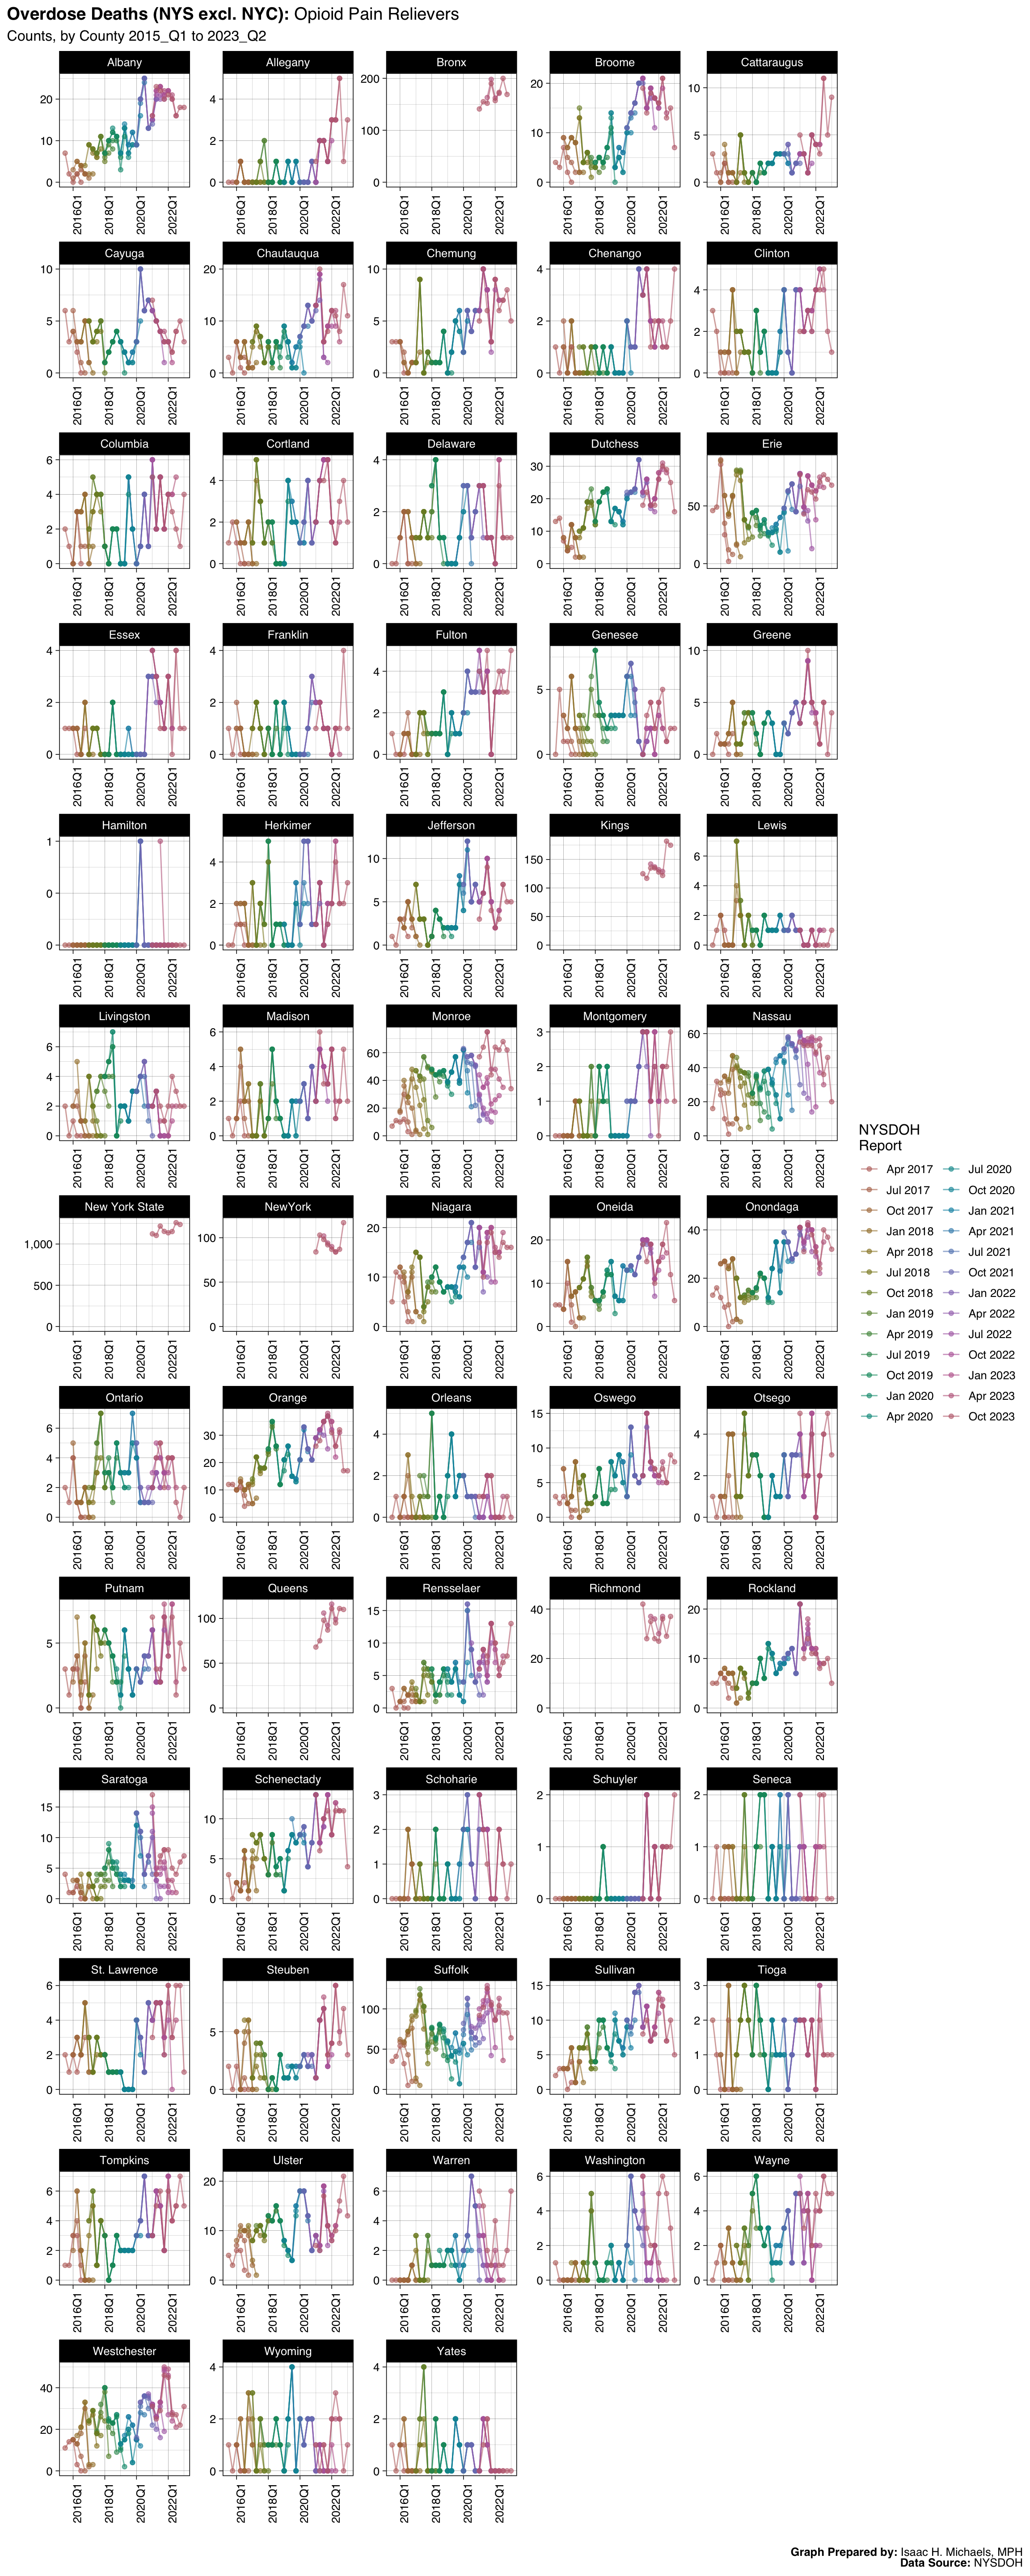
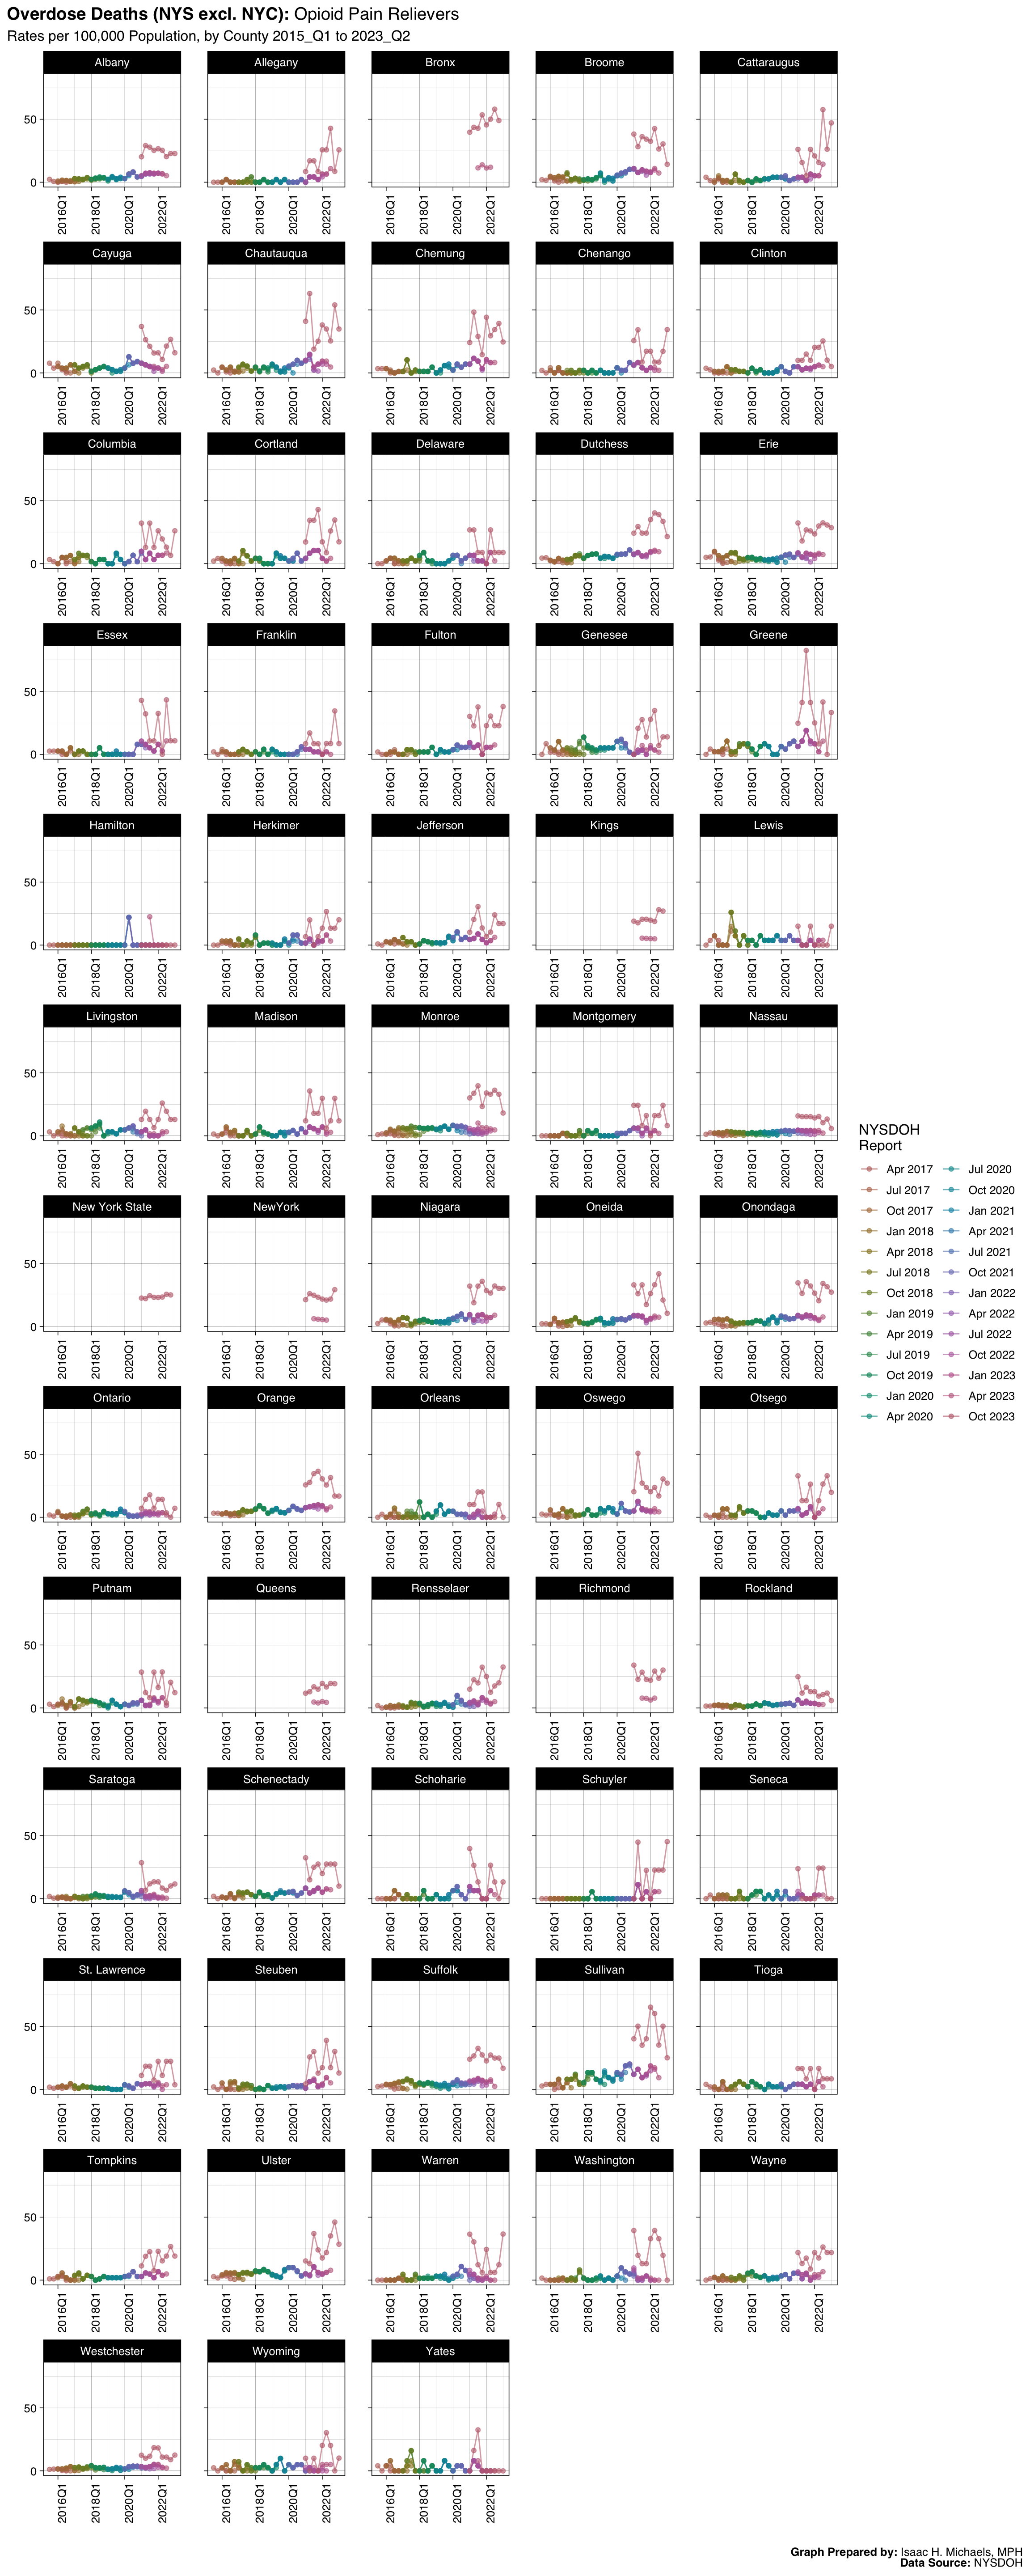
- Deaths: Opioid Pain Relievers
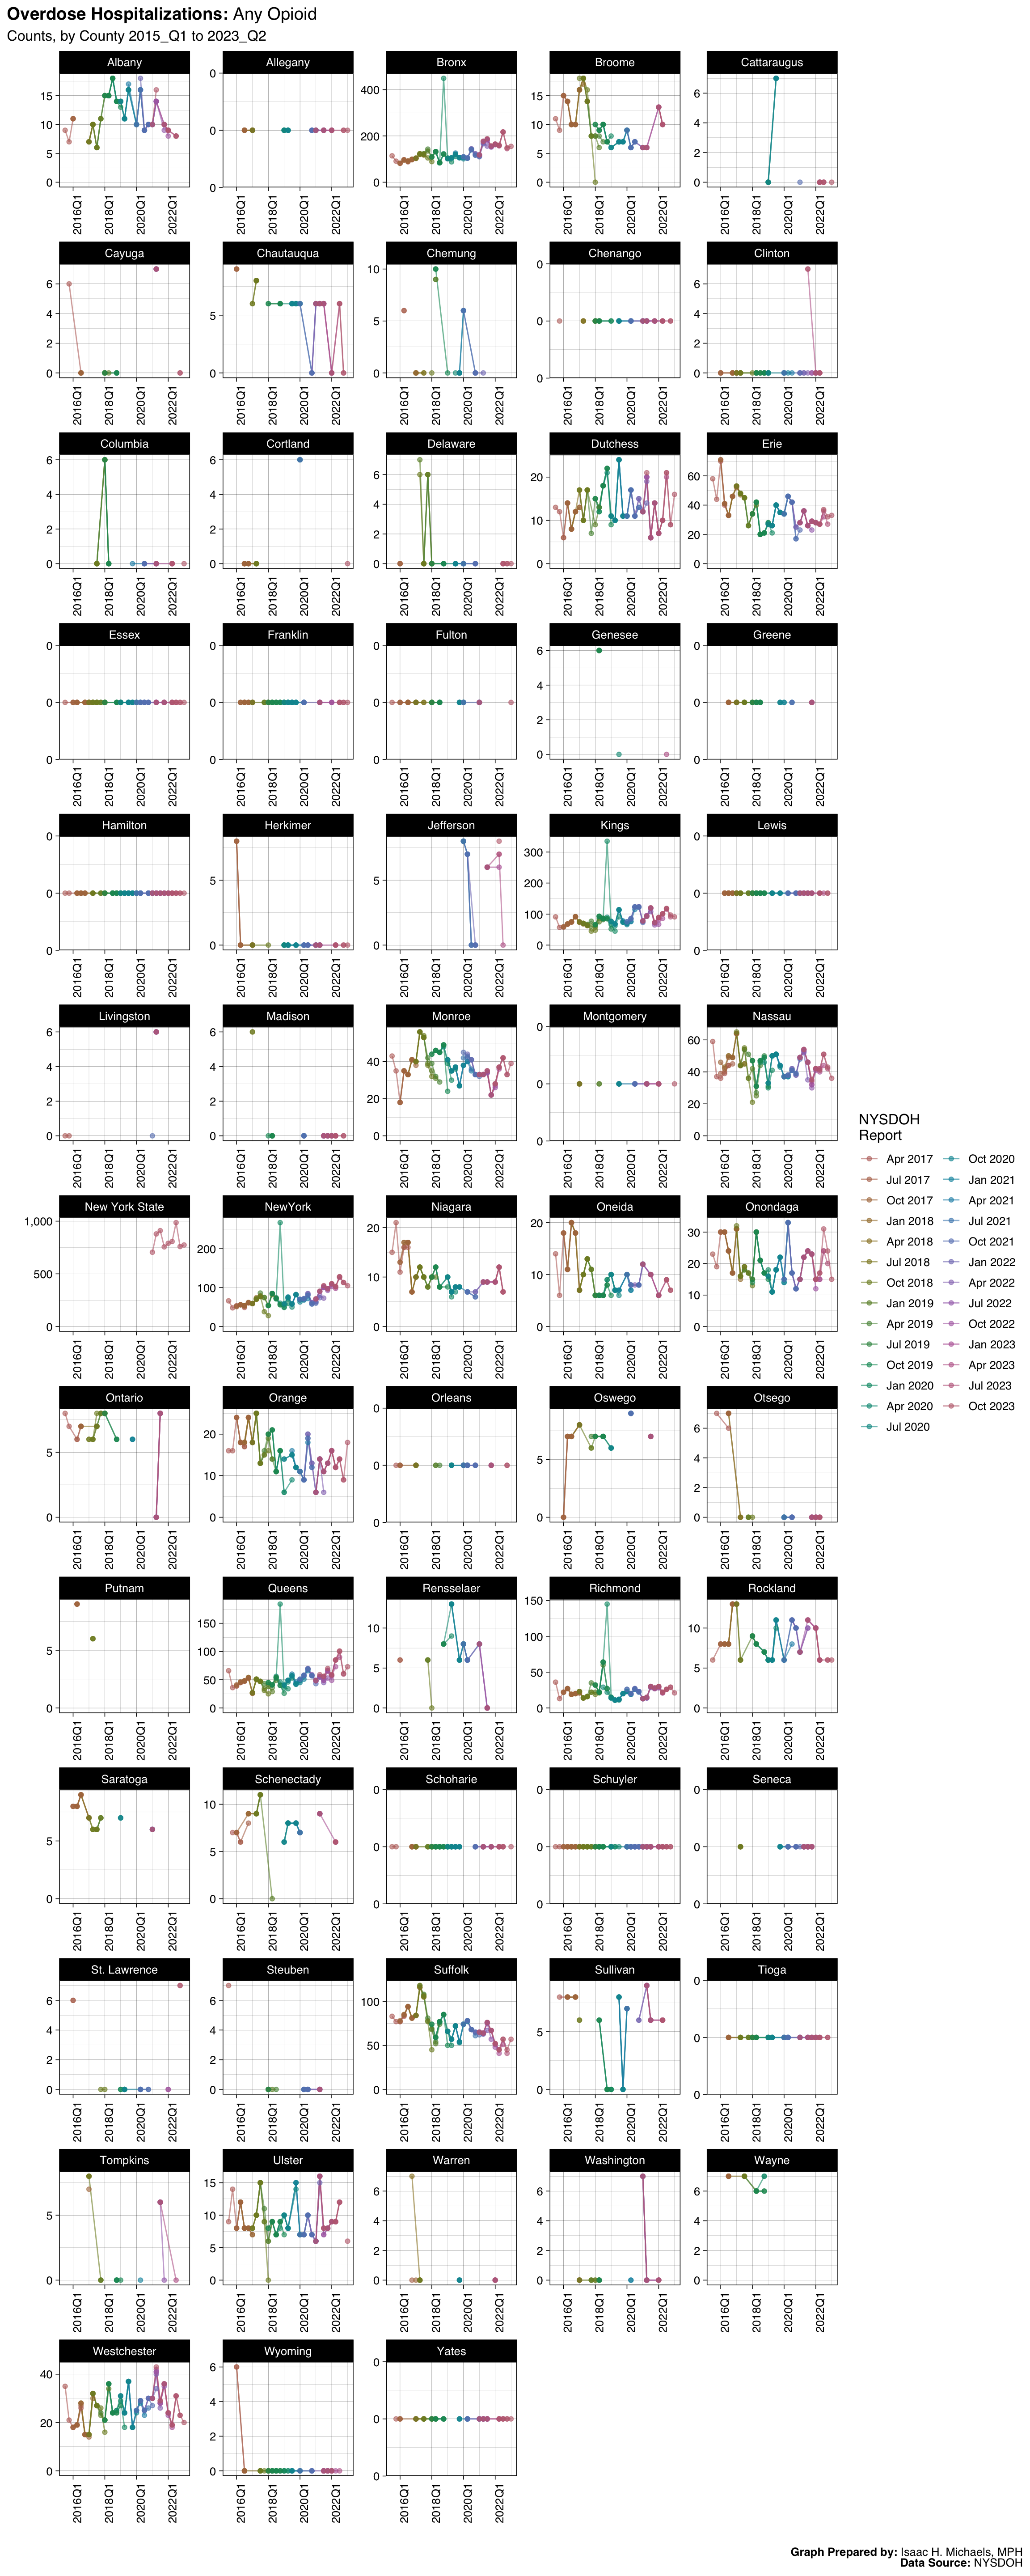
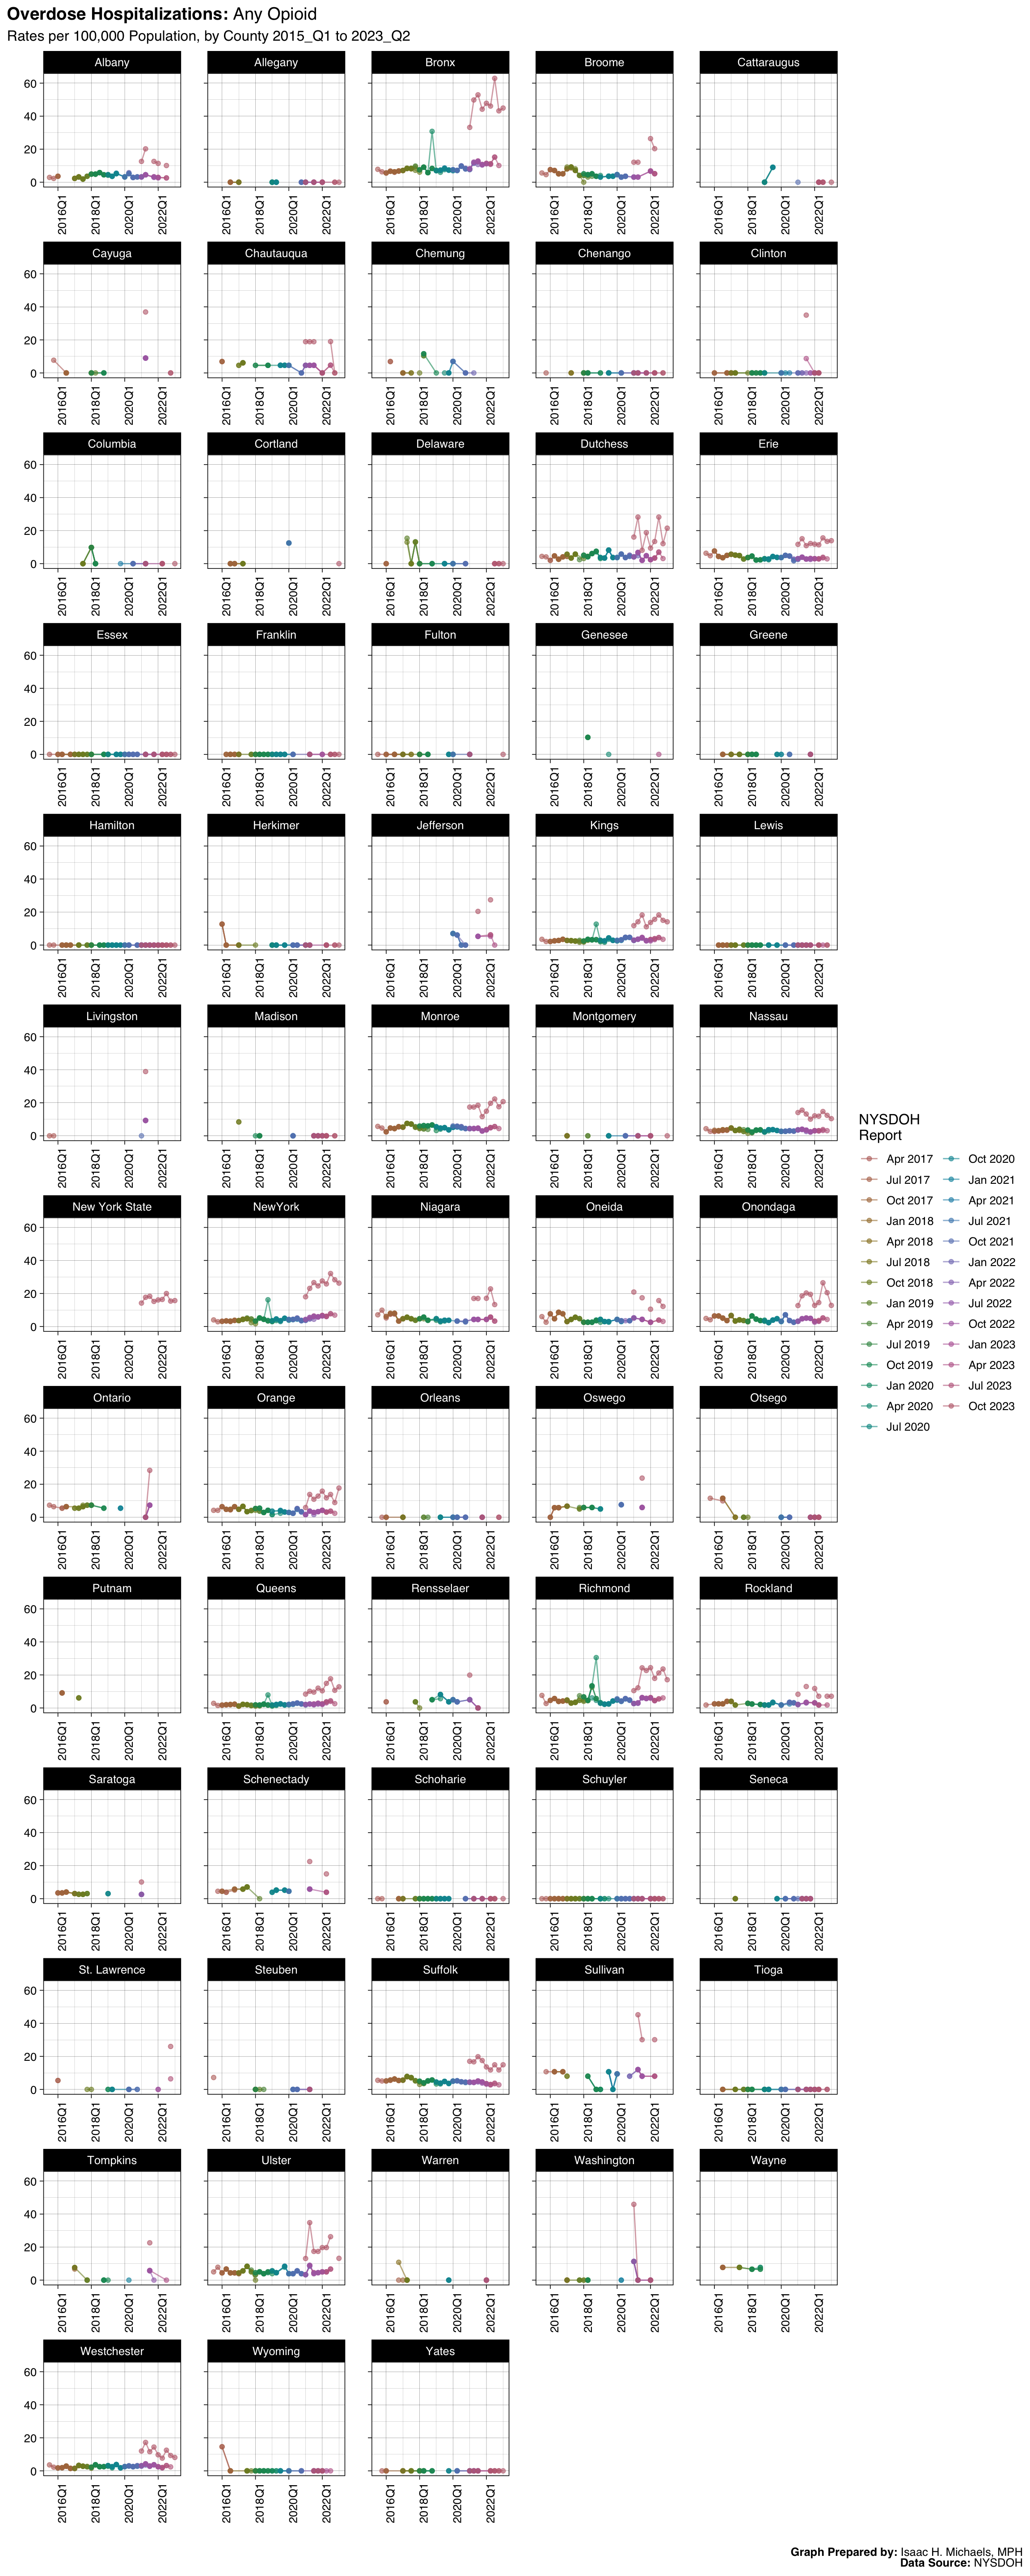
- Hospitalizations: Any Opioid
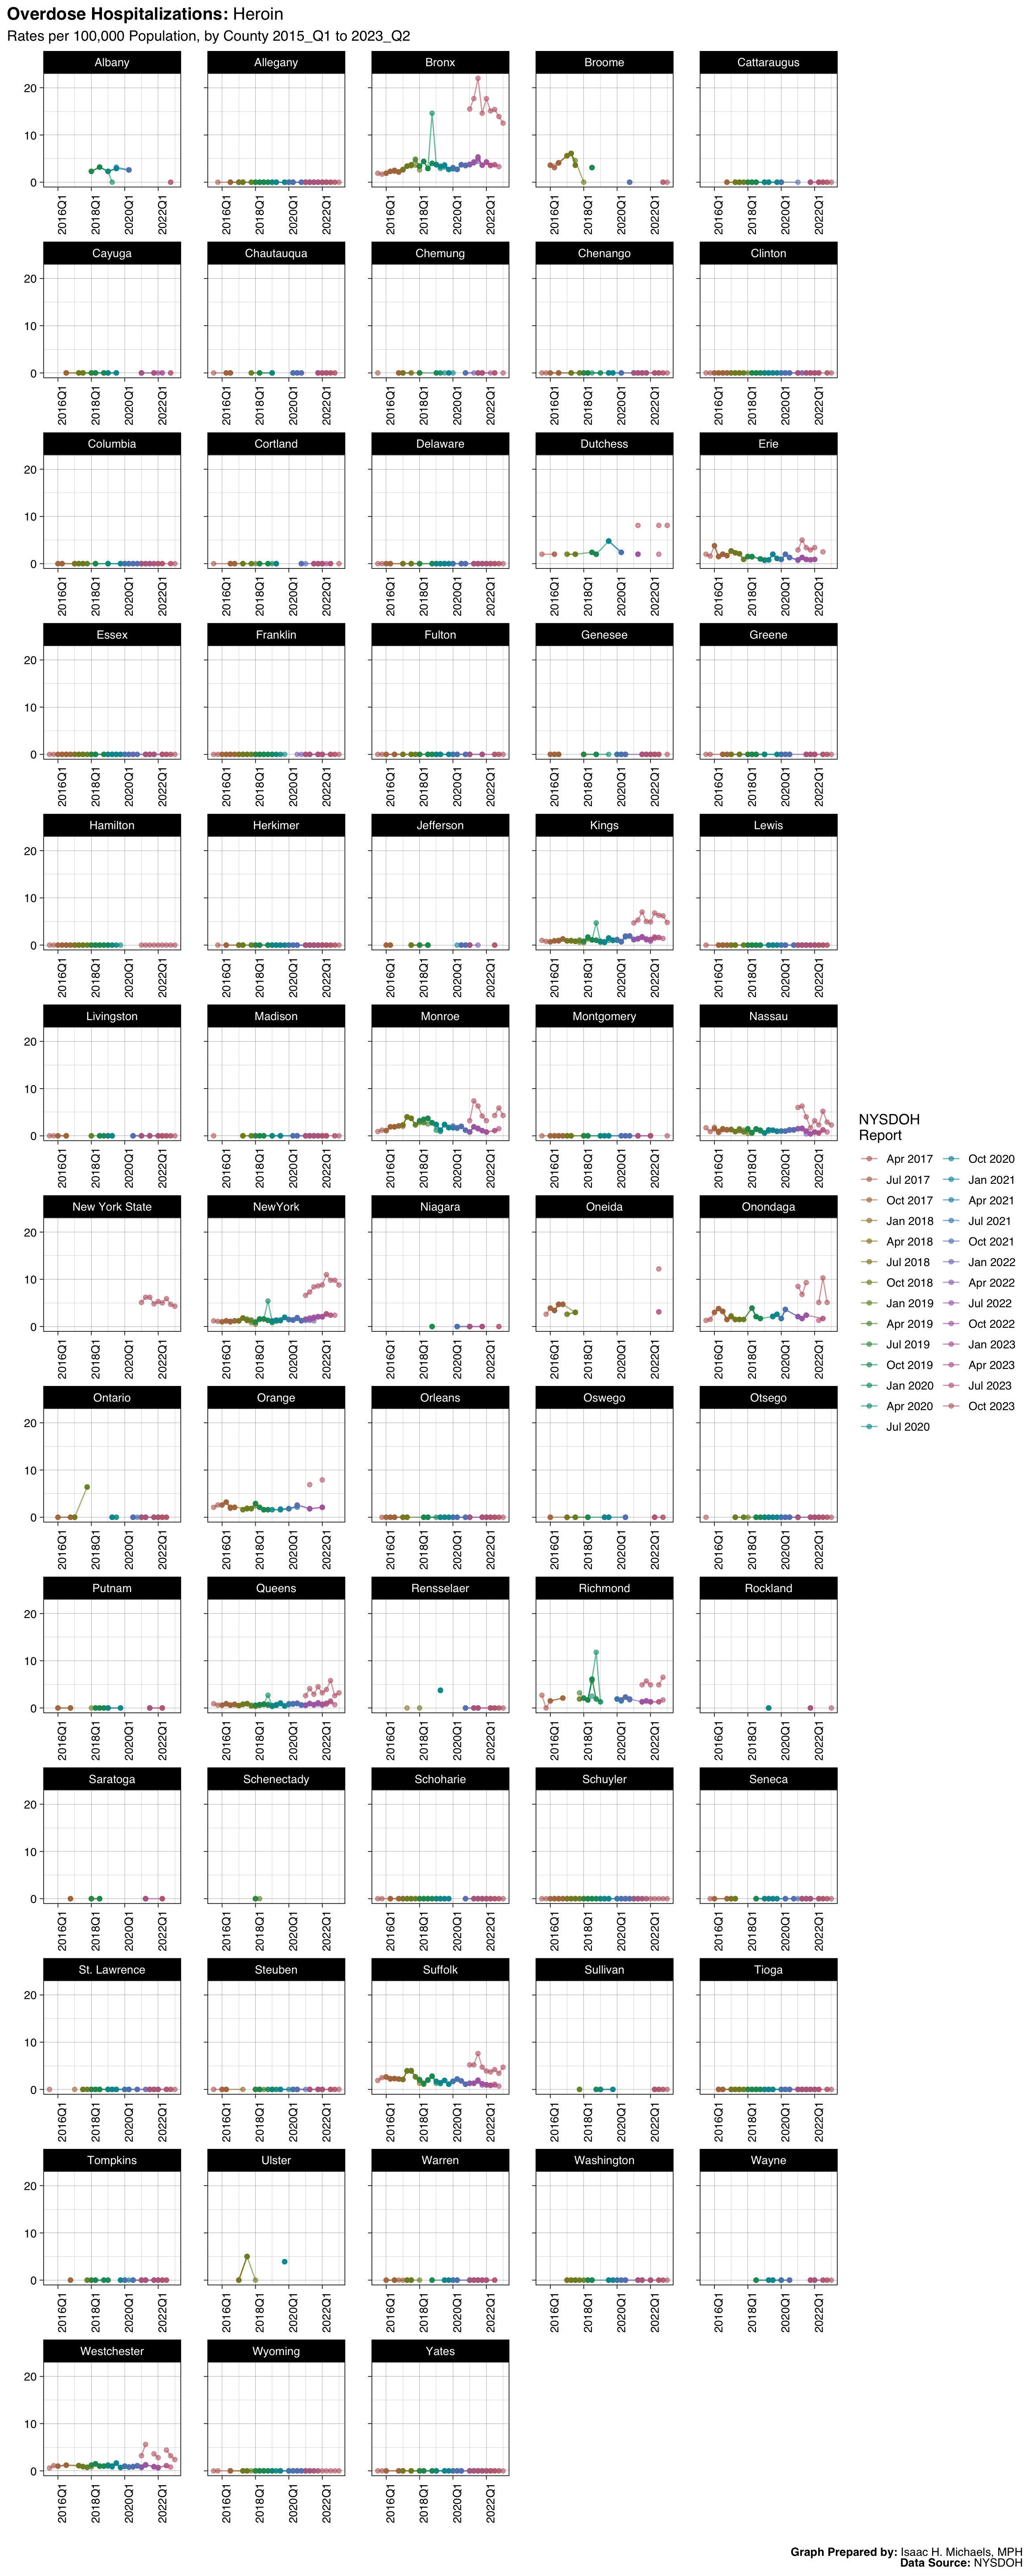
- Hospitalizations: Heroin
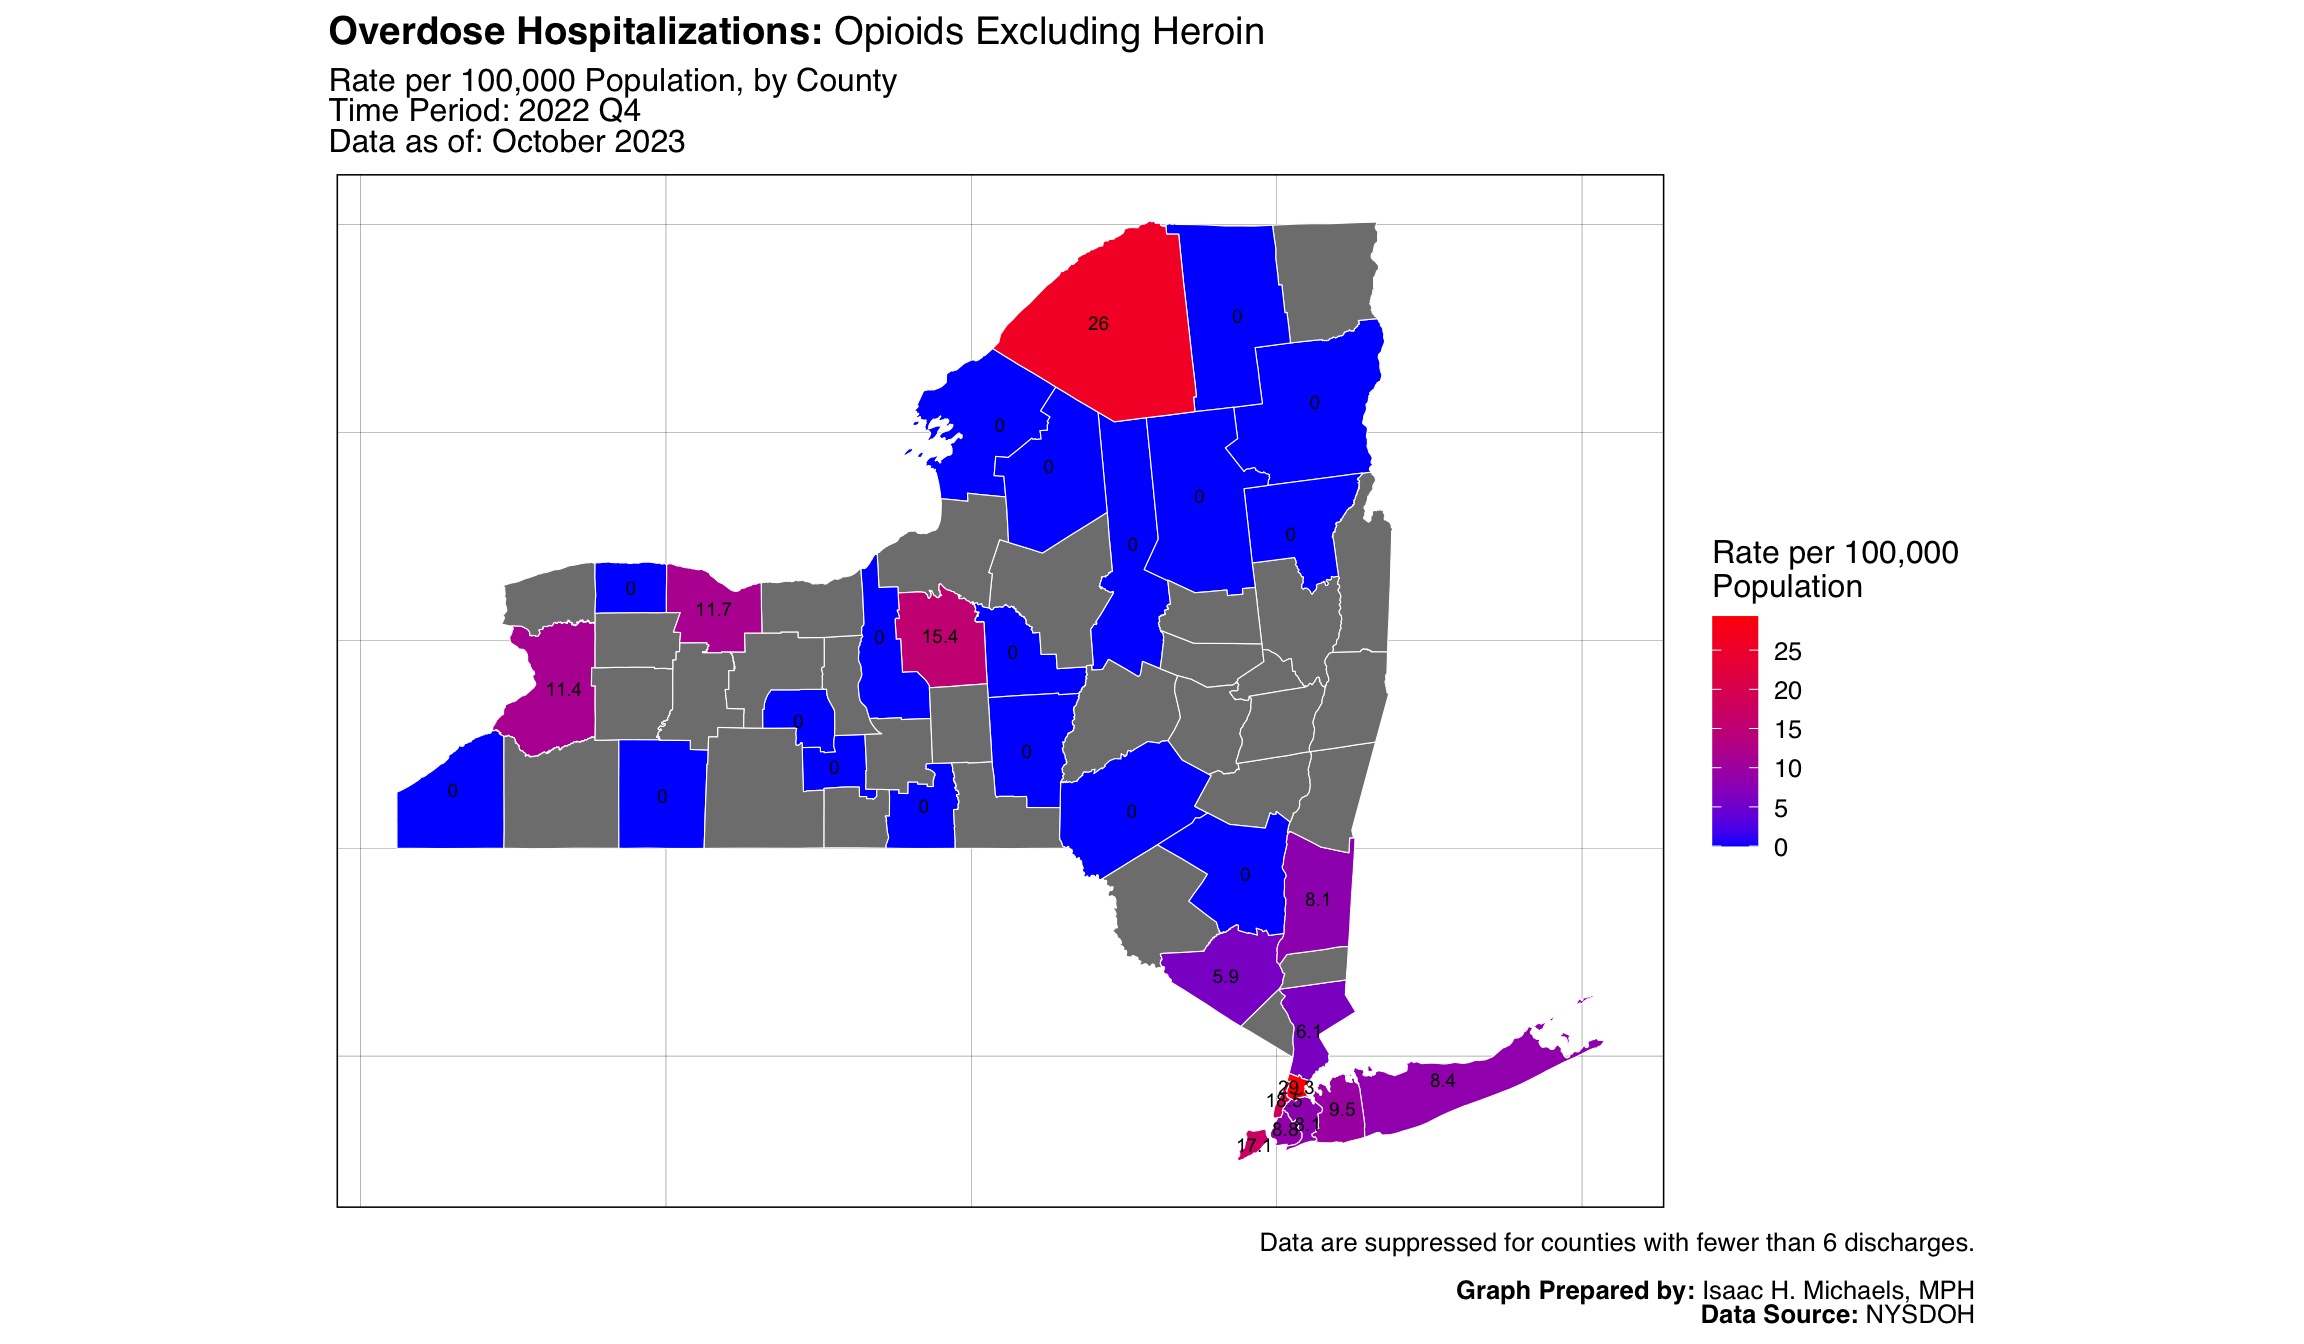
- Hospitalizations: Opioids Excluding Heroin
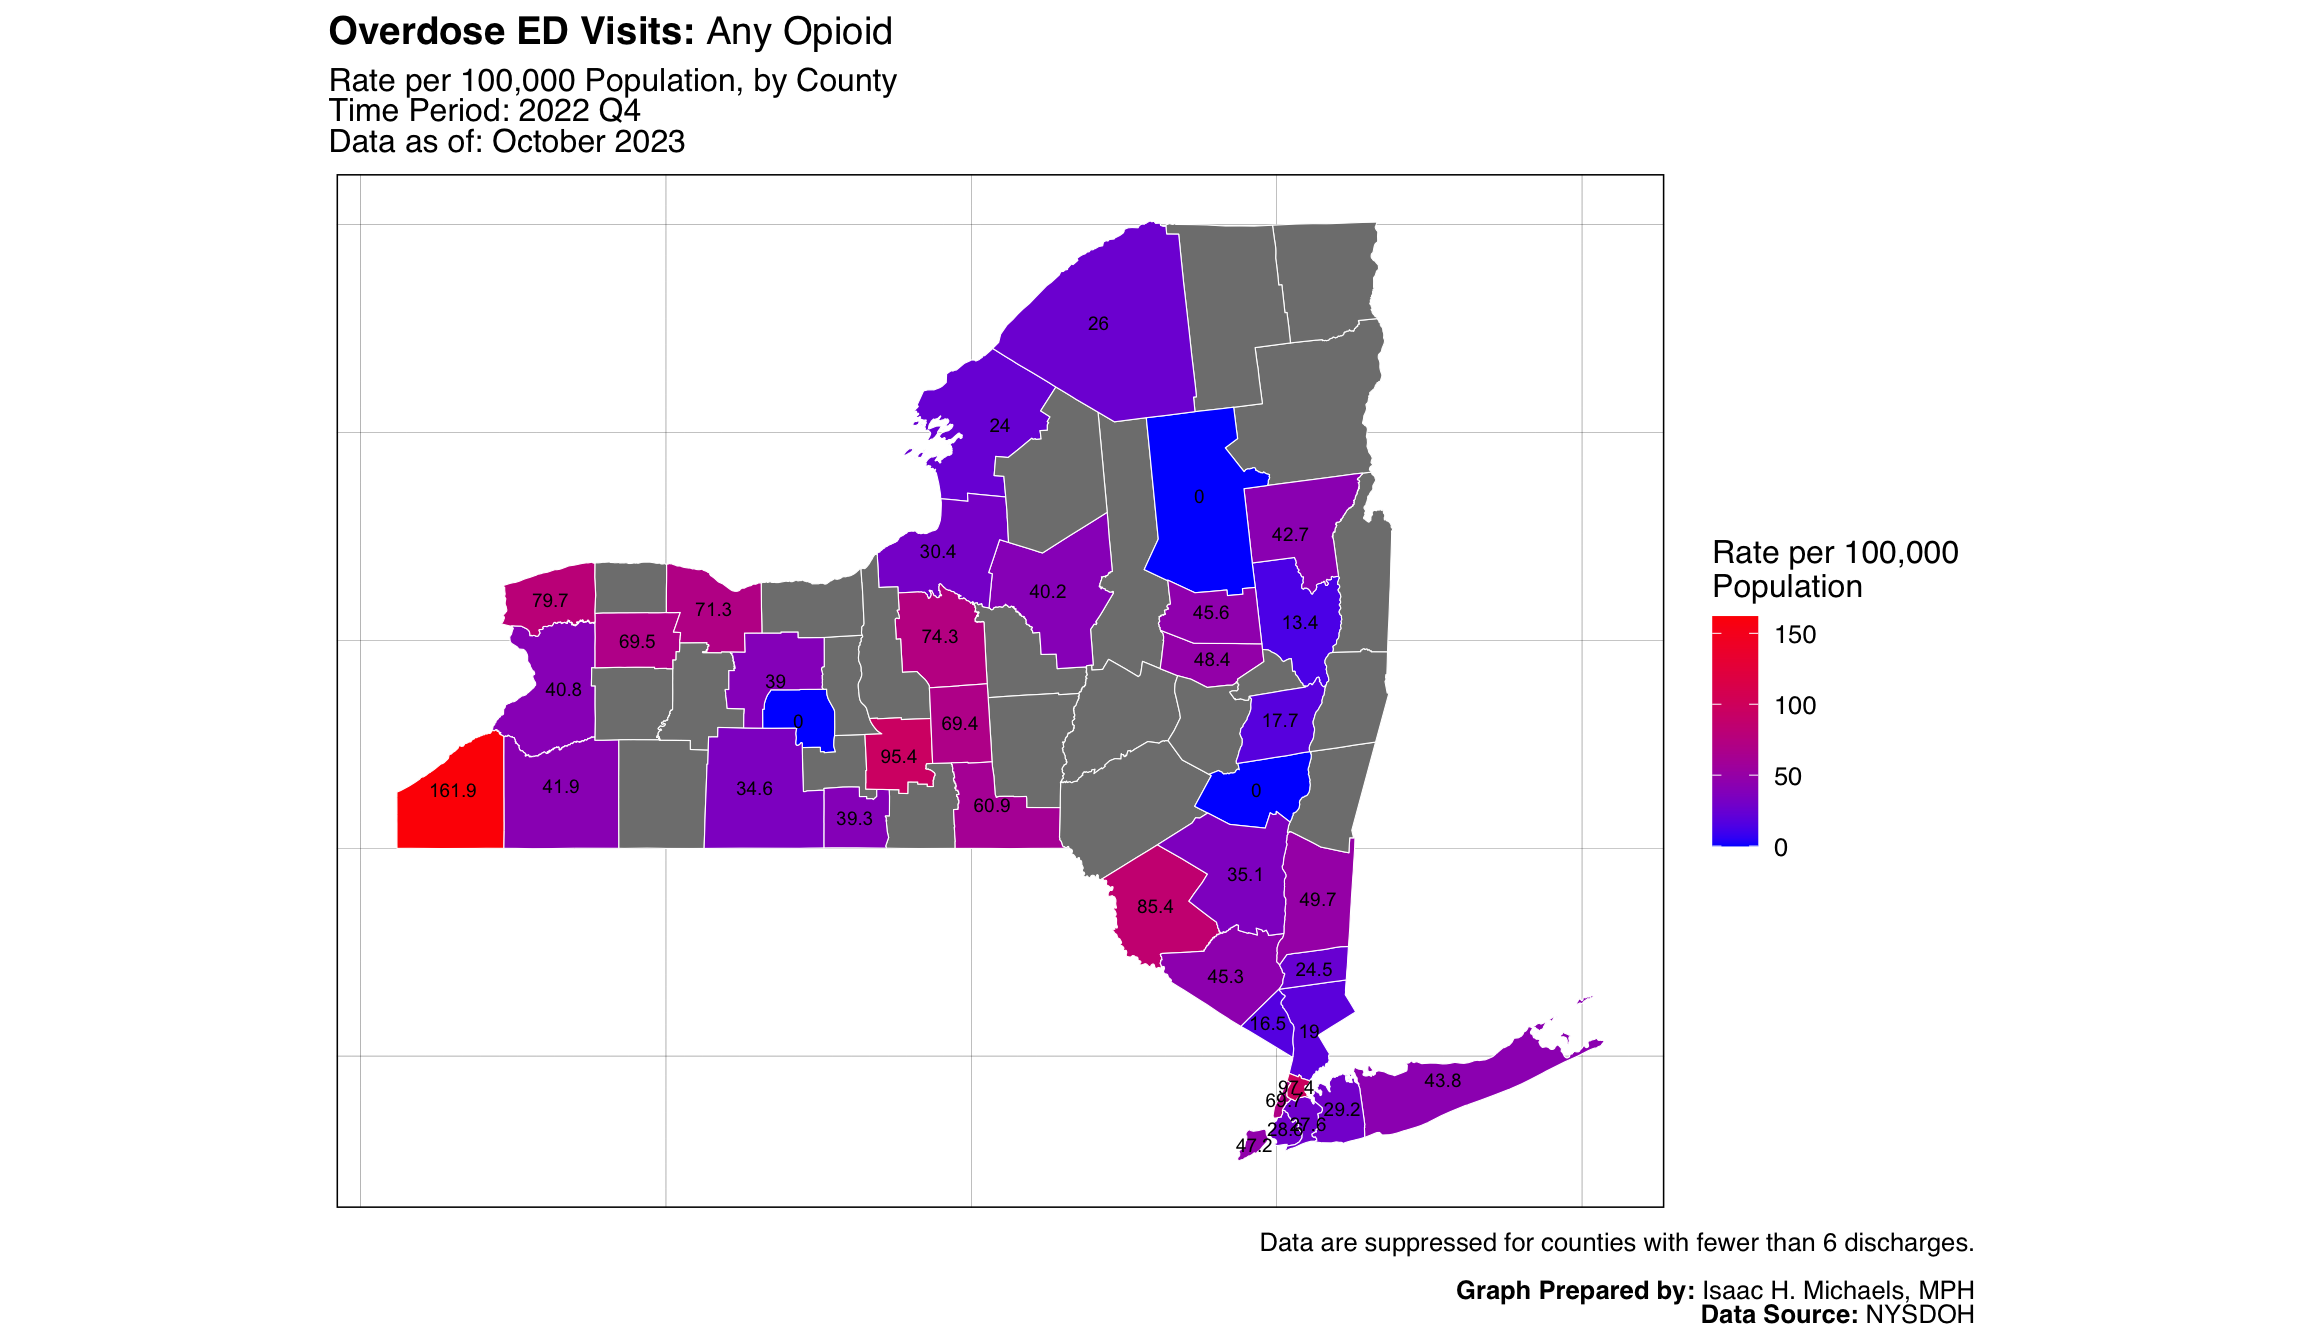
- ED Visits: Any Opioid
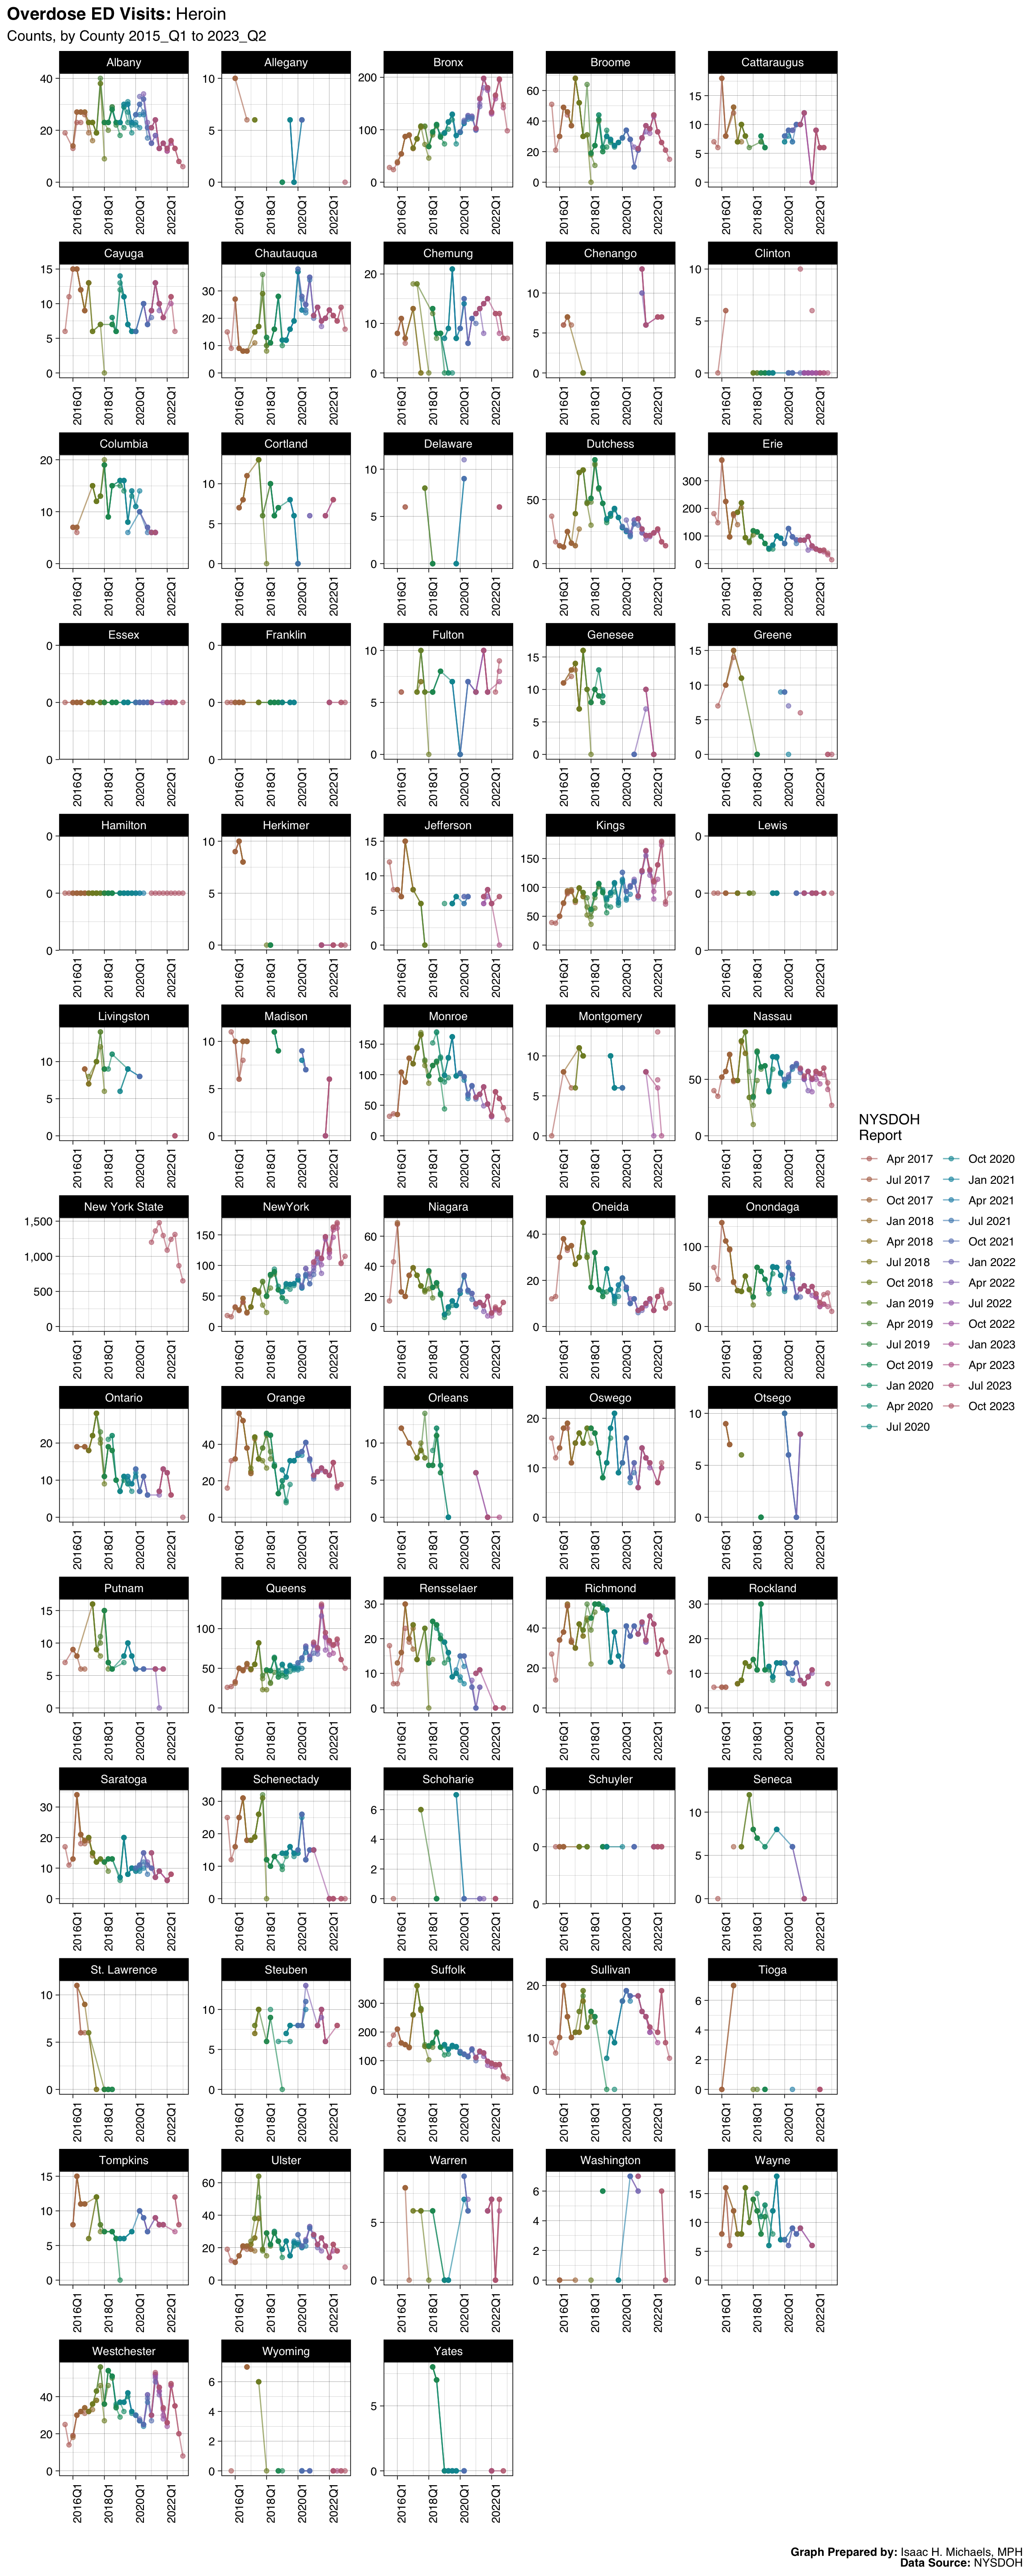
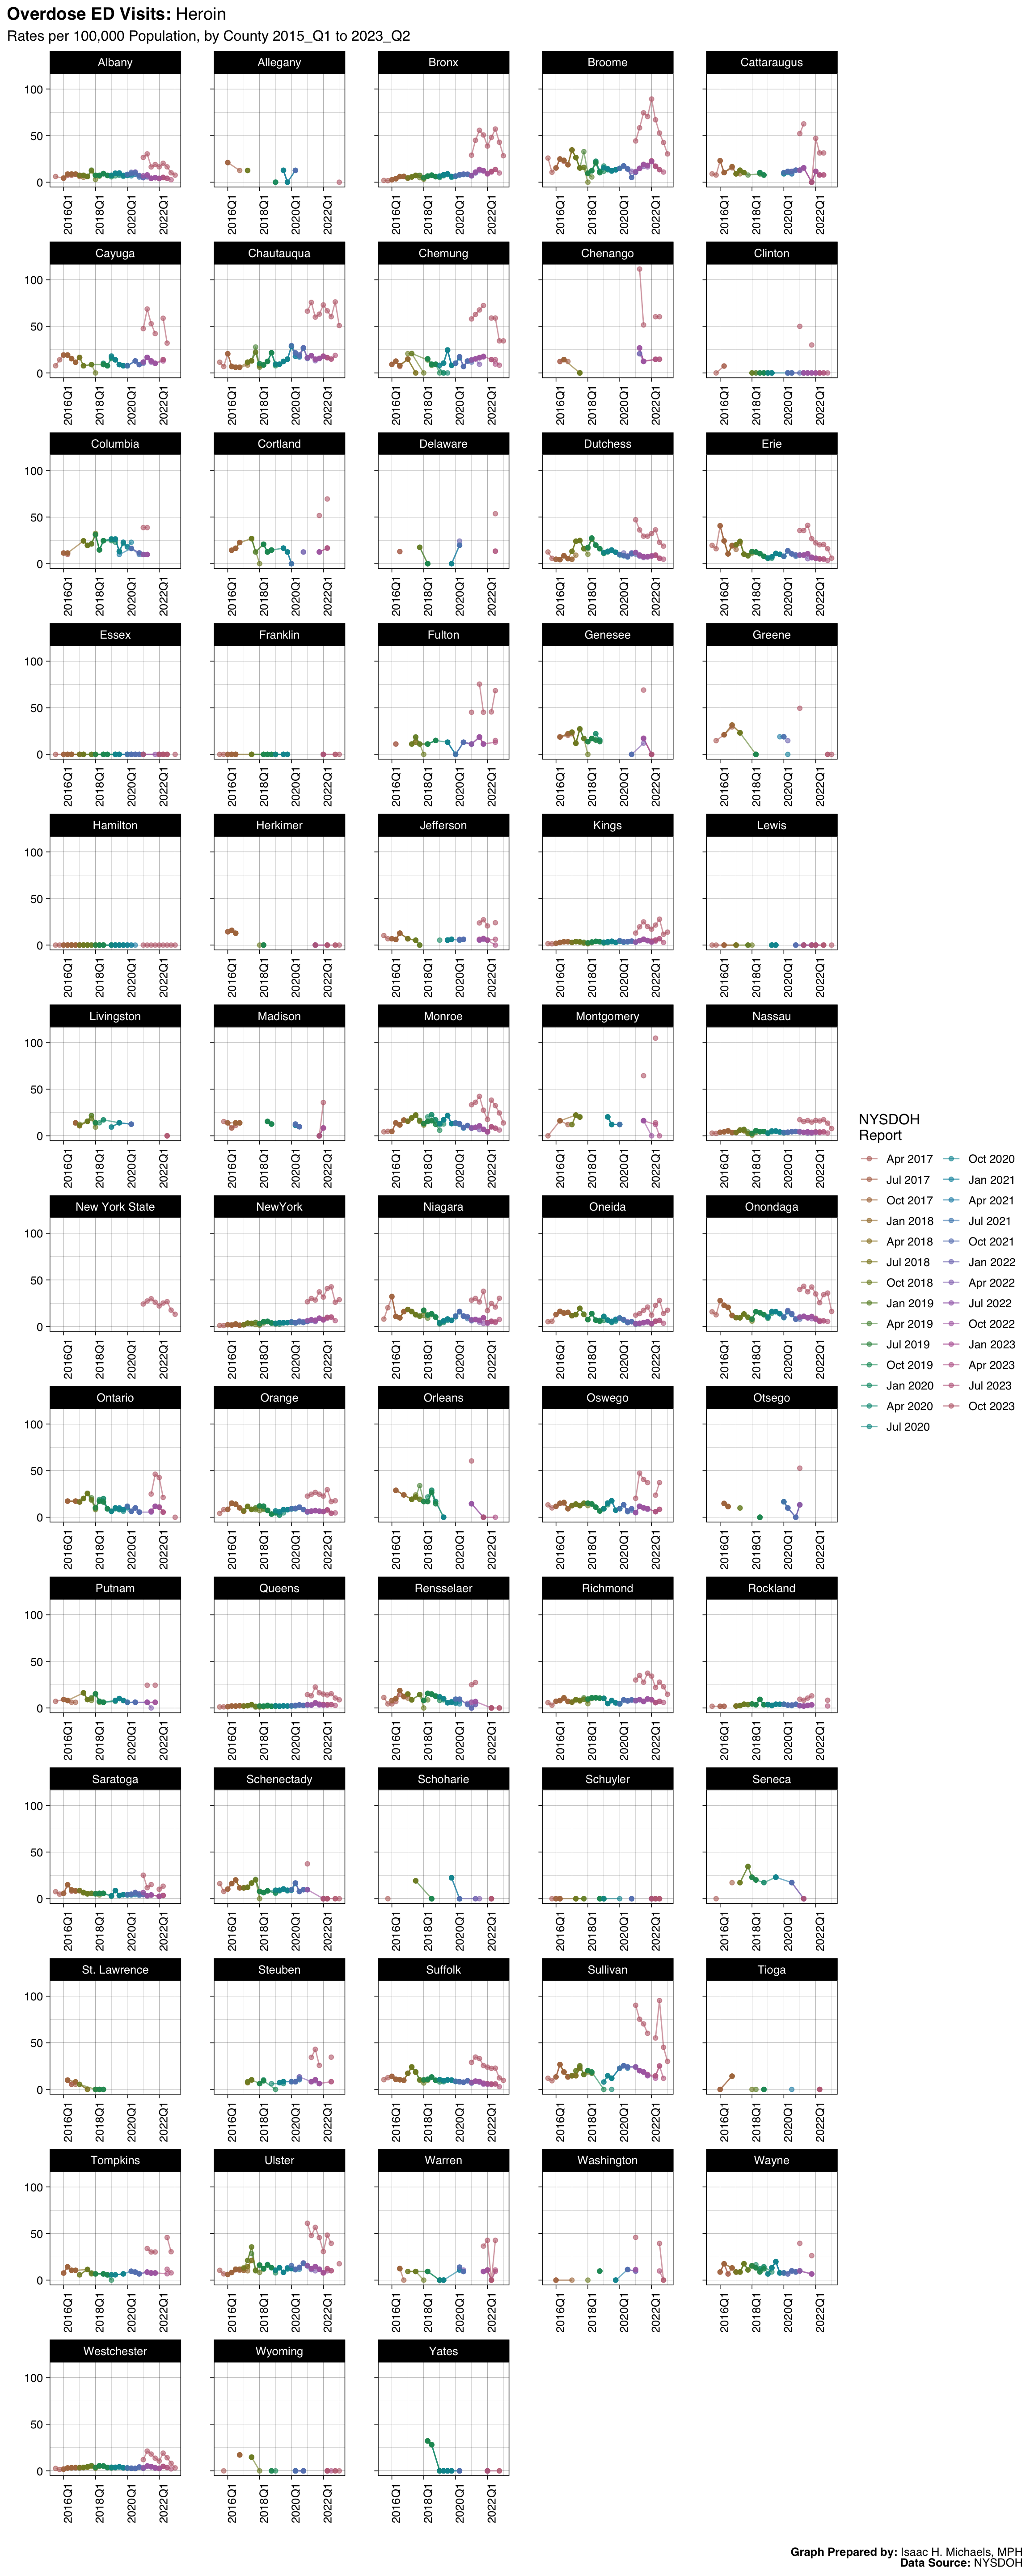
- ED Visits: Heroin
- ED Visits: Opioids Excluding Heroin
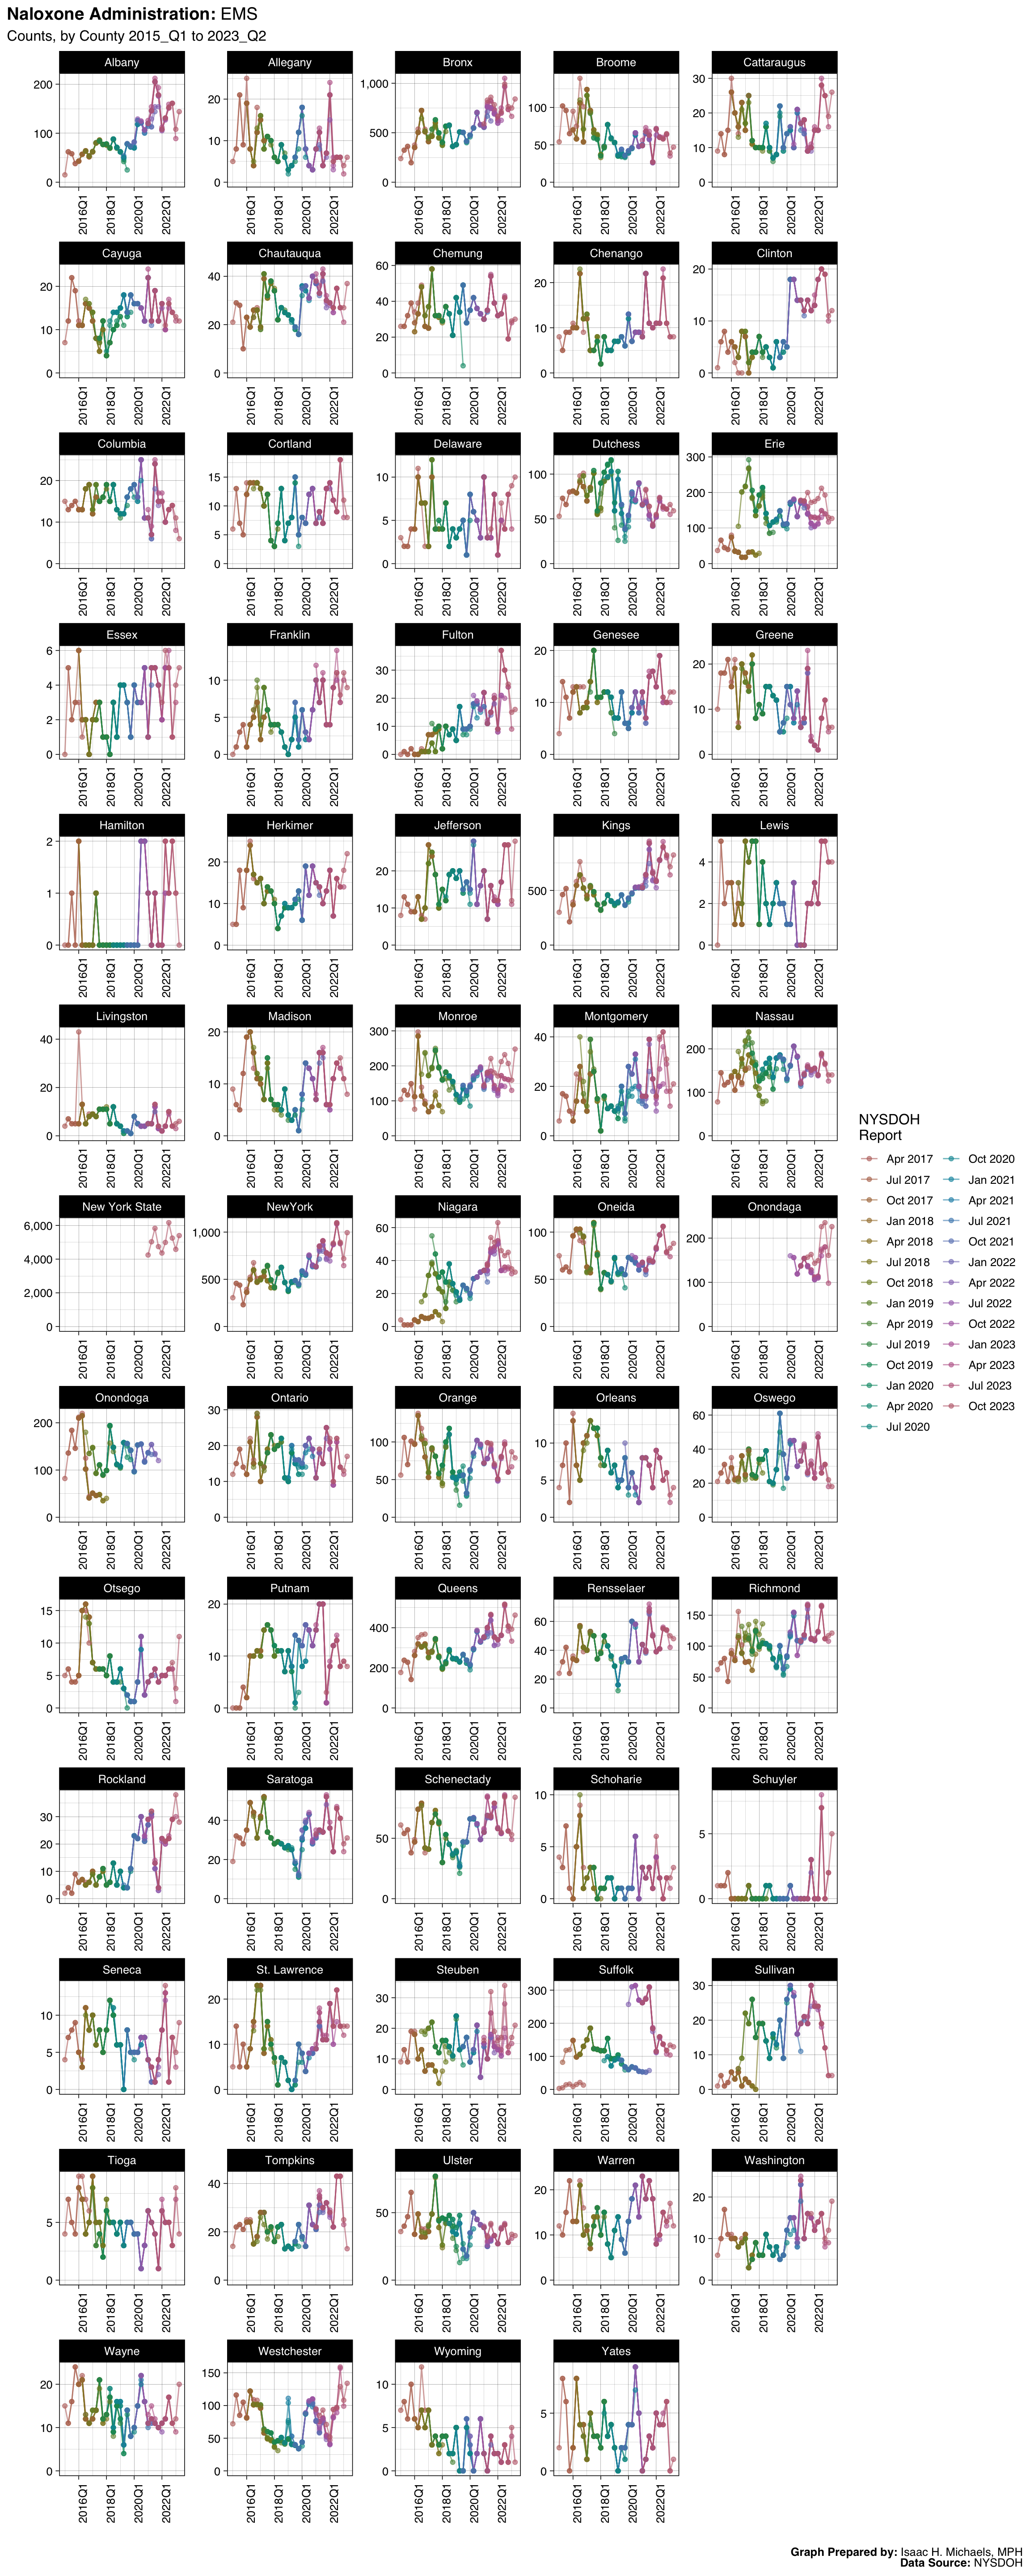
- Naloxone Administration: EMS
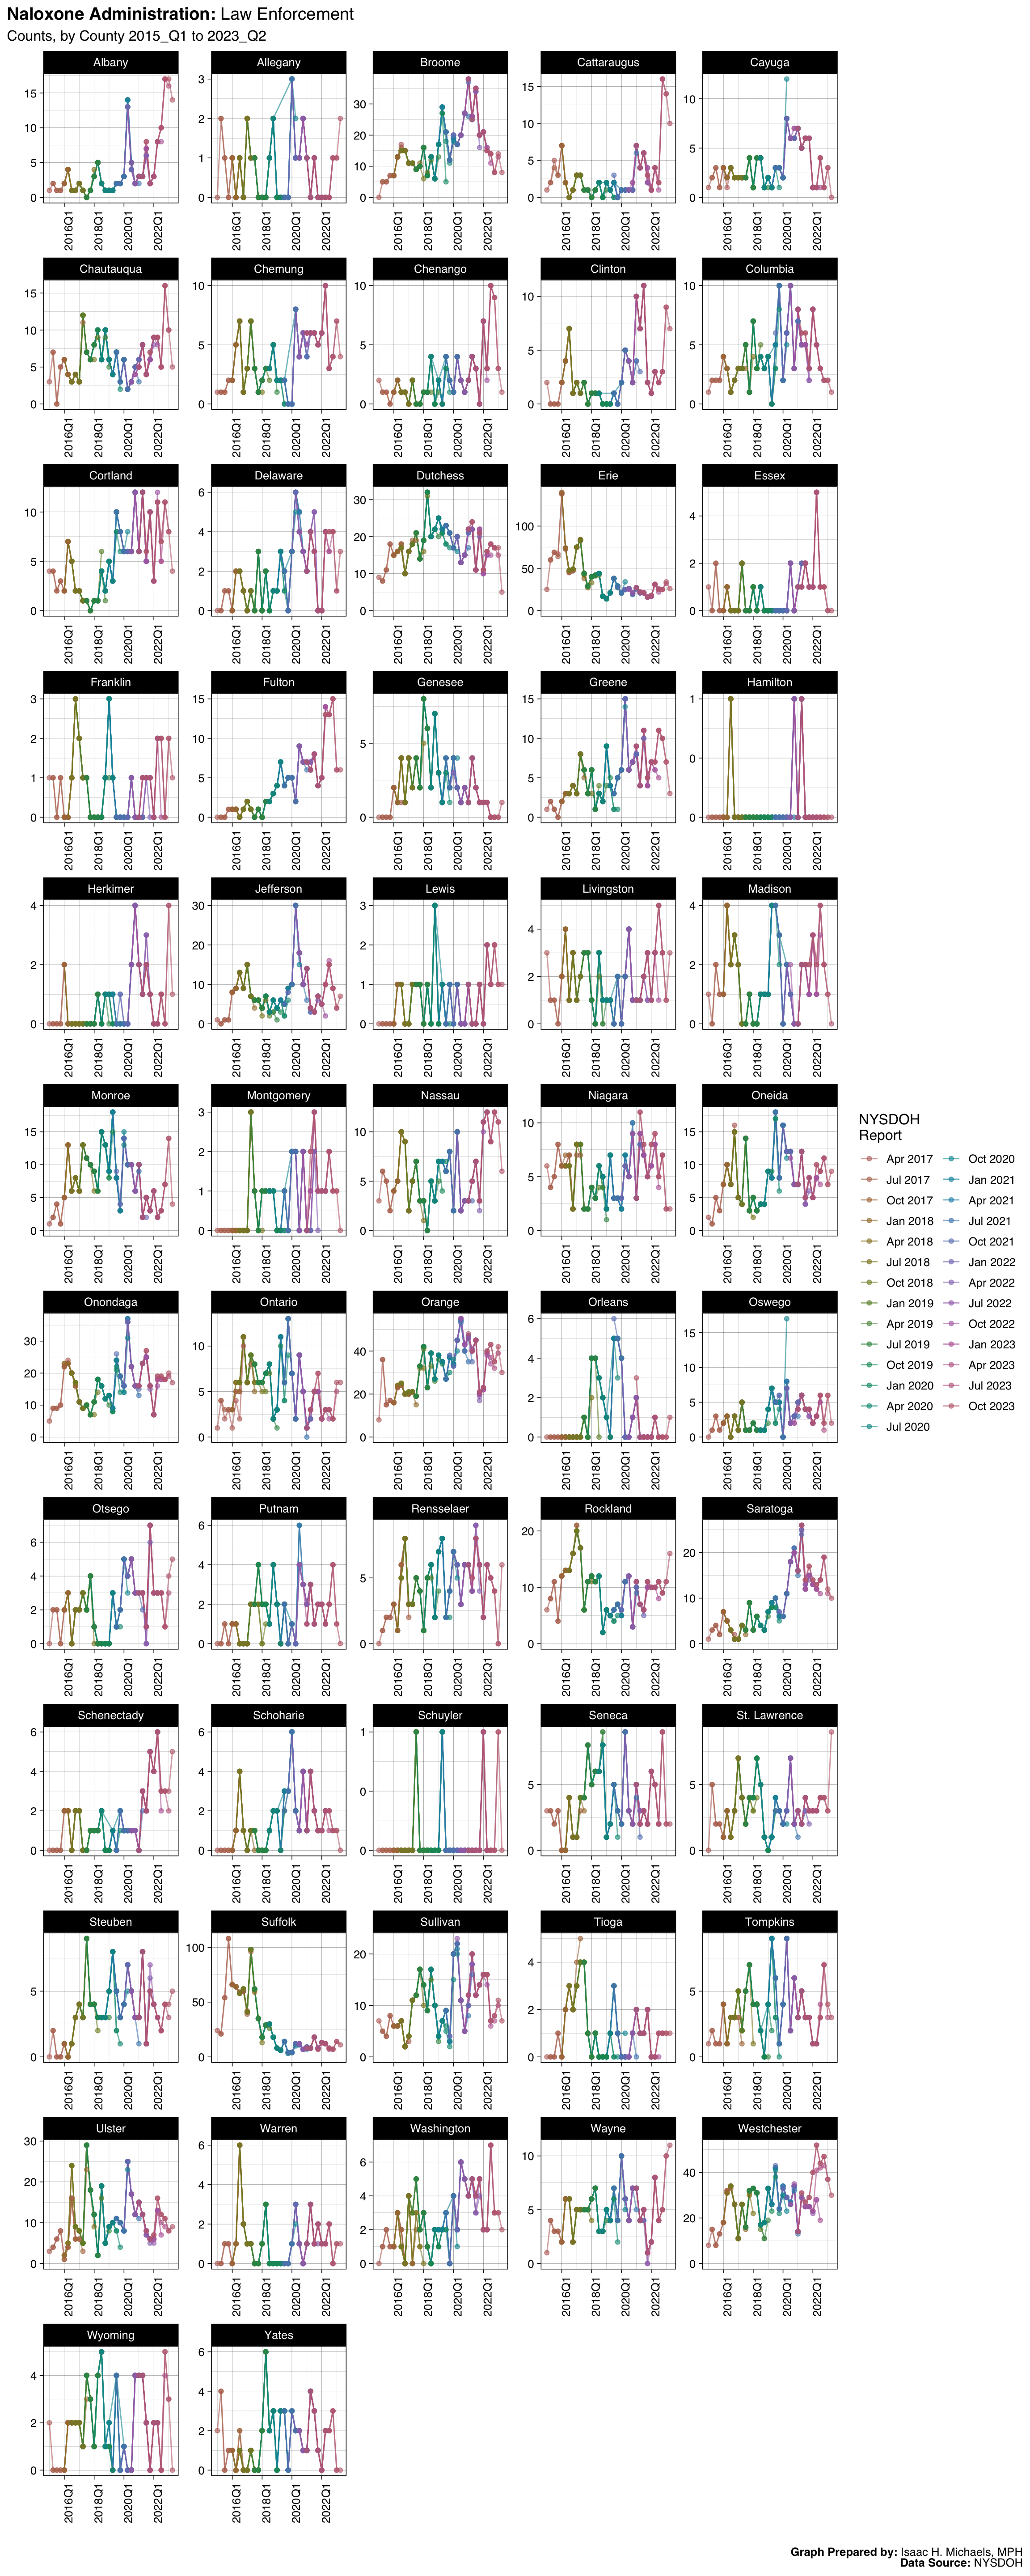
- Naloxone Administration: Law Enforcement
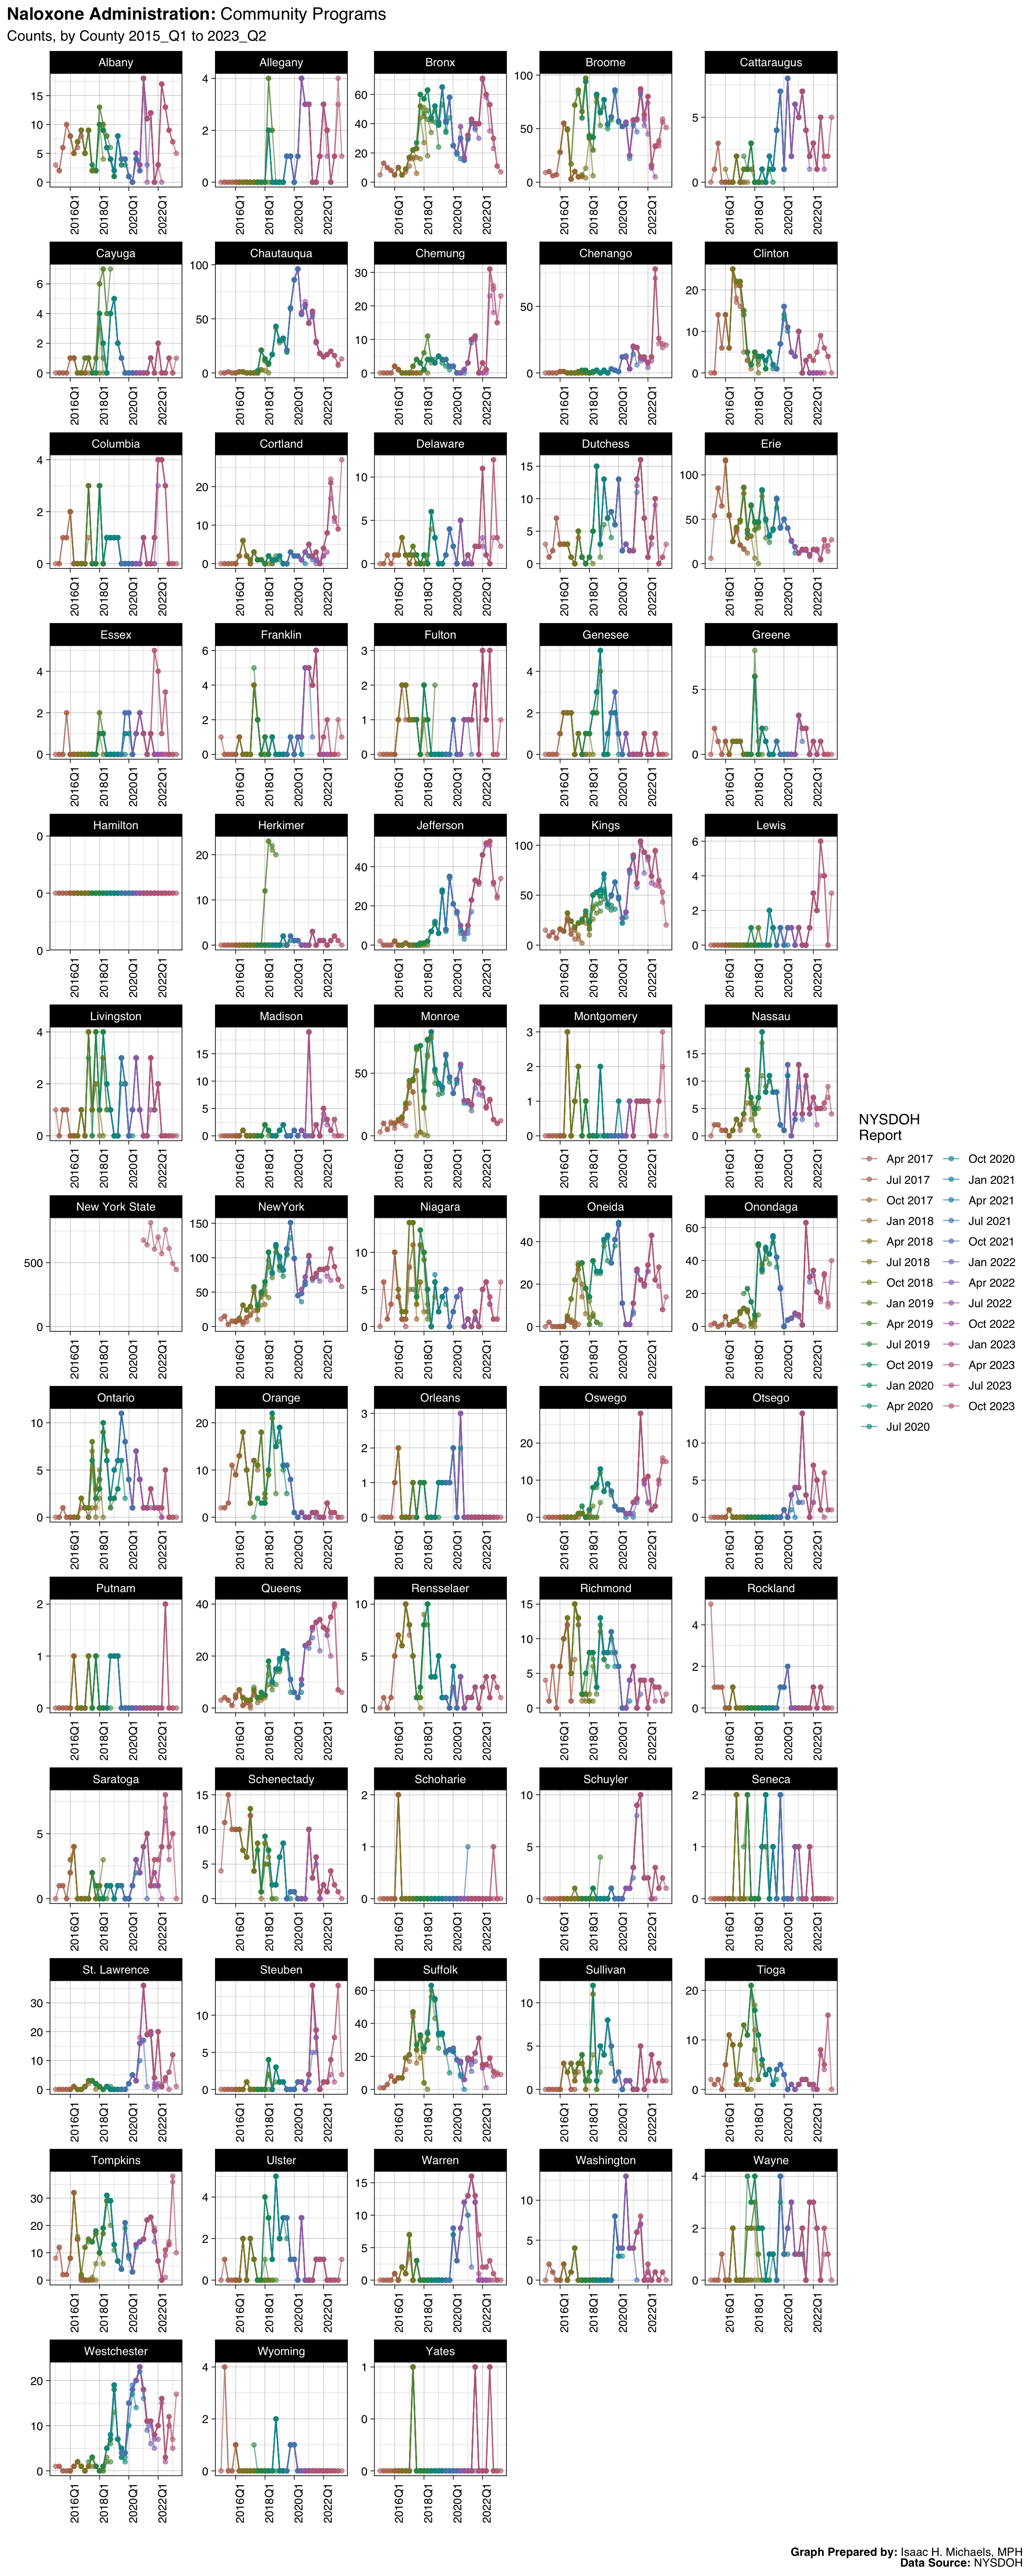
- Naloxone Administration: Community Programs
- Rates
- Counts
- Technical Notes
Published: March 7, 2021
Updated: June 01, 2025 at 11:30PM
Welcome
Welcome to this page, where I present data analyses on opioid overdoses in New York State. The data presented on this webpage include quarterly counts and rates for deaths, hospitalizations, emergency department visits, and naloxone administrations by EMS, law enforcement, and community programs. The data are broken down by indicators such as overdose deaths involving any opioid, overdose deaths involving heroin, and overdose deaths involving opioid pain relievers. The data presented are obtained from the New York State Opioid Data Quarterly Reports by the New York State Department of Health, beginning with the April 2017 report.
Data Overview
The data presented on this webpage are from several underlying data sources:
- New York State Vital Statistics (deaths) which includes data on live births, deaths, fetal deaths, and marriages recorded in New York State Exclusive of New York City, and through a cooperative agreement, data on live births, deaths, fetal deaths, and marriages recorded in New York City from the New York City Department of Health and Mental Hygiene.
- New York Statewide Planning and Research Cooperative System (hospitalizations and ED visits) which includes information about hospitalizations and ED visits collected through the hospital data system.
- EMS Electronic Patient Care Reports (naloxone administration by EMS) which includes data on naloxone administration by Emergency Medical Services.
- New York State AIDS Institute (naloxone administration by law enforcement and community programs) which includes data on naloxone administration by law enforcement and community programs.
How to Use These Data
This webpage is organized into several sections, including Statewide, By County, Counts, Deaths, Hospitalizations, ED Visits, Naloxone Administration, Rates, Trends, Maps, and Technical Notes. Users can explore statewide and county-level data and trends in opioid overdose outcomes by navigating through these sections. The latest data presented are considered preliminary and subject to change.
Why are these data important?
Opioid overdose is a major public health crisis in the United States, and understanding the trends and patterns of opioid overdose is crucial in order to develop effective prevention and intervention strategies. These data can be used to identify areas of high risk, and to target resources and services where they are most needed.
What can you do to protect yourself and your community?
There are several steps that individuals and communities can take to protect themselves from opioid overdose. These include:
- Educating yourself about the risks of opioid overdose and how to recognize the signs of an overdose
- Being aware of the risks associated with taking opioids, and taking steps to reduce the risks, such as using opioids only under the guidance of a healthcare professional, and properly disposing of unused opioids.
- Knowing how to use naloxone, a medication that can reverse an opioid overdose, and keeping it on hand in case of an emergency.
- Connecting with local resources and support groups for individuals and families affected by opioid addiction.
- Advocating for policies and programs that address the opioid epidemic at the local, state, and national level, such as increasing access to addiction treatment and overdose prevention services, and reducing the over-prescription of opioids.
Communities can take action by working with local organizations, government agencies, and healthcare providers to provide education, resources, and support for those affected by opioid addiction. By working together, we can help prevent opioid overdoses and save lives.
Data Visualizations
 Graph Prepared By:
 By County
Counts
Deaths: Any Opioid
 Graph Prepared By: Isaac H. Michaels, MPH
Data Source: NYSDOH (Current, Archived)
 Graph Prepared By:
 Deaths: Opioid Pain Relievers
 Graph Prepared By: Isaac H. Michaels, MPH
Data Source: NYSDOH (Current, Archived)
Hospitalizations: Any Opioid
 Graph Prepared By: Isaac H. Michaels, MPH
Data Source: NYSDOH (Current, Archived)
Hospitalizations: Heroin
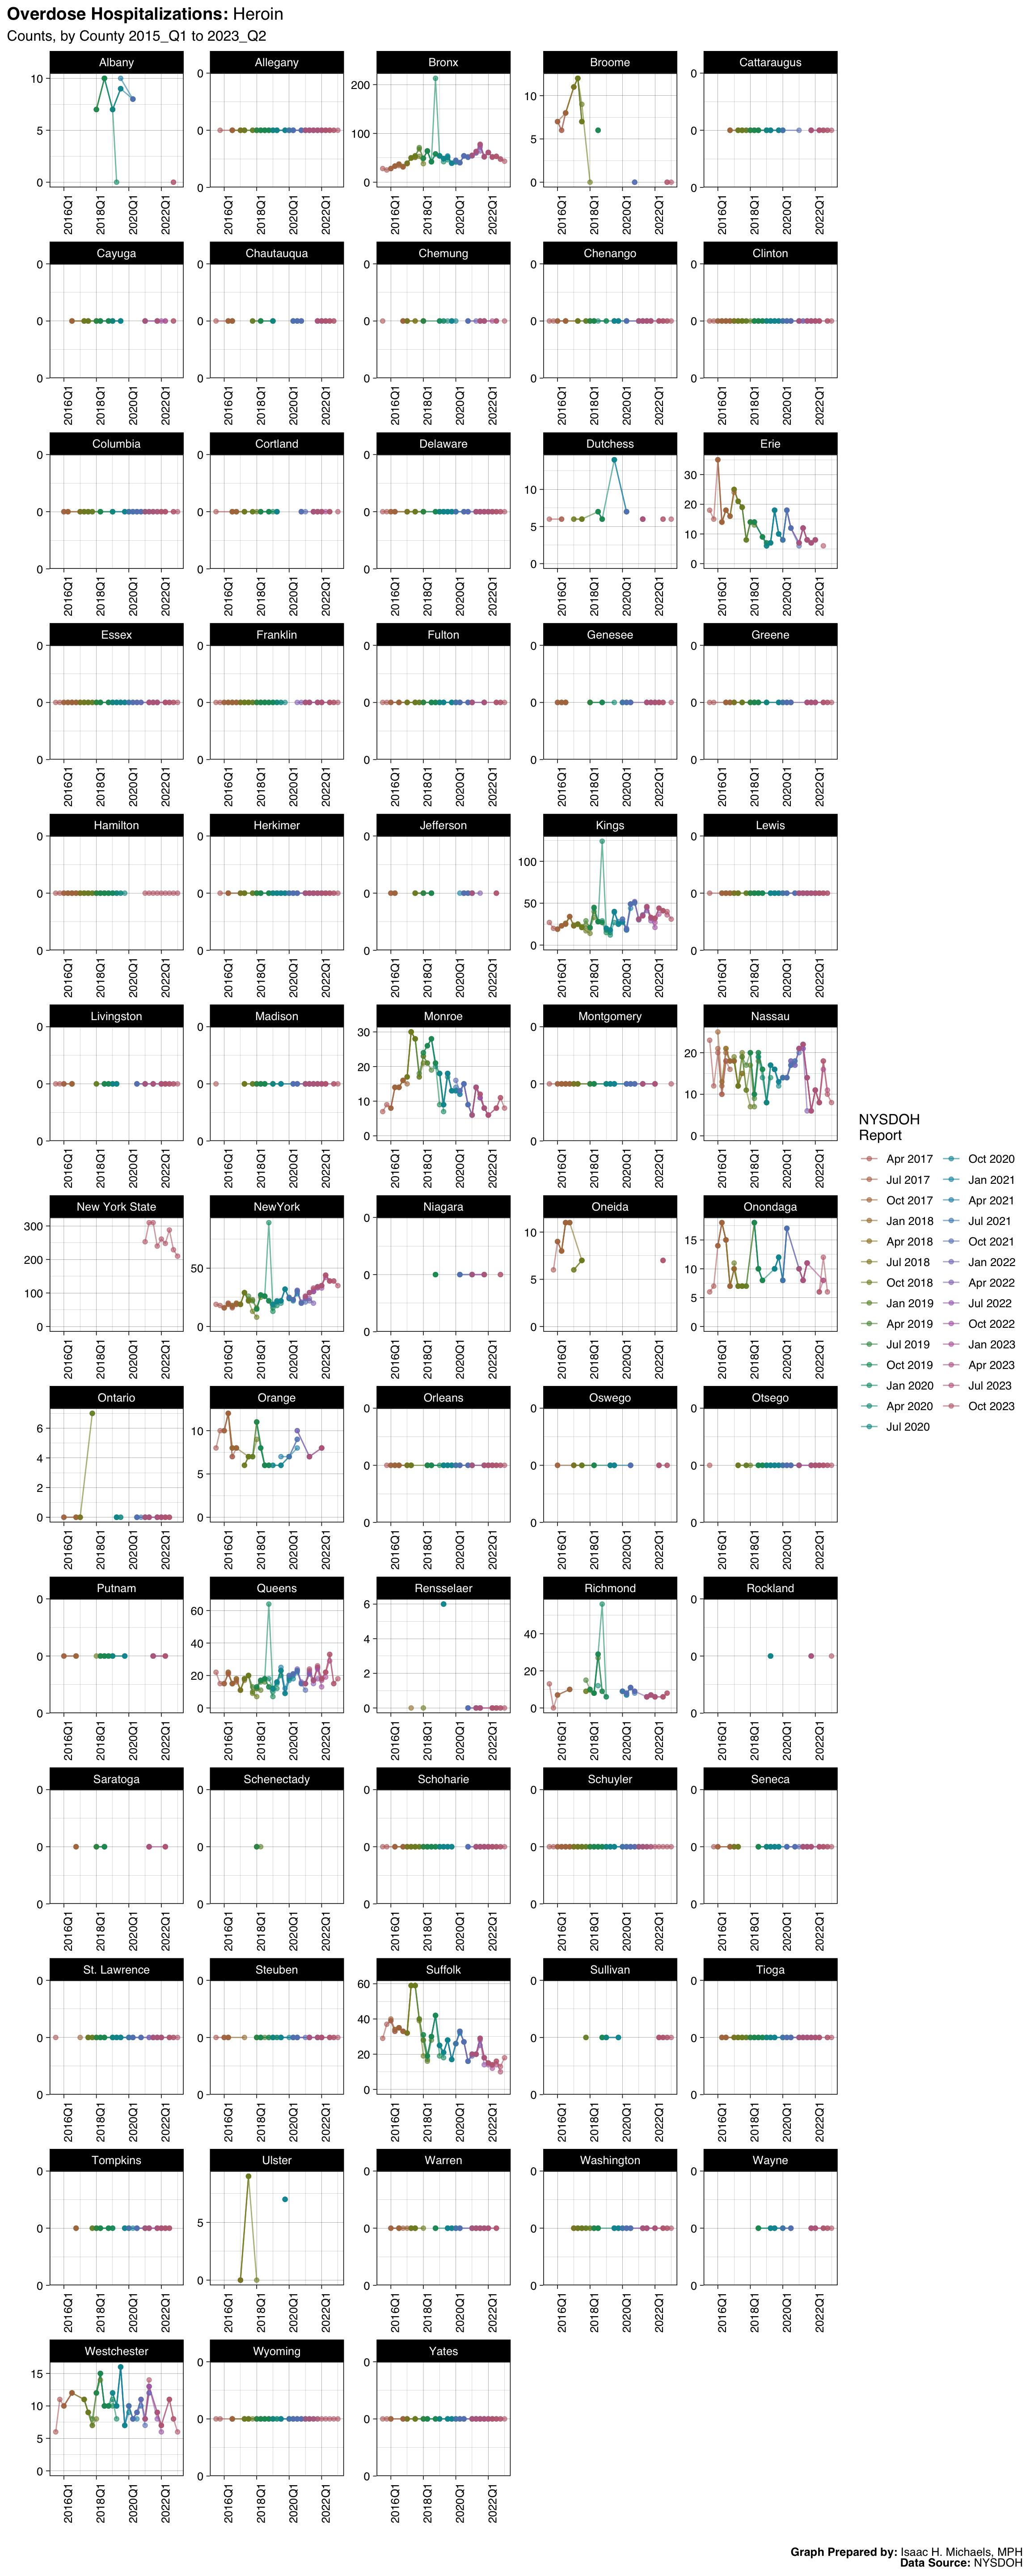 Graph Prepared By: Isaac H. Michaels, MPH
Data Source: NYSDOH (Current, Archived)
Hospitalizations: Opioids Excluding Heroin
 Graph Prepared By: Isaac H. Michaels, MPH
Data Source: NYSDOH (Current, Archived)
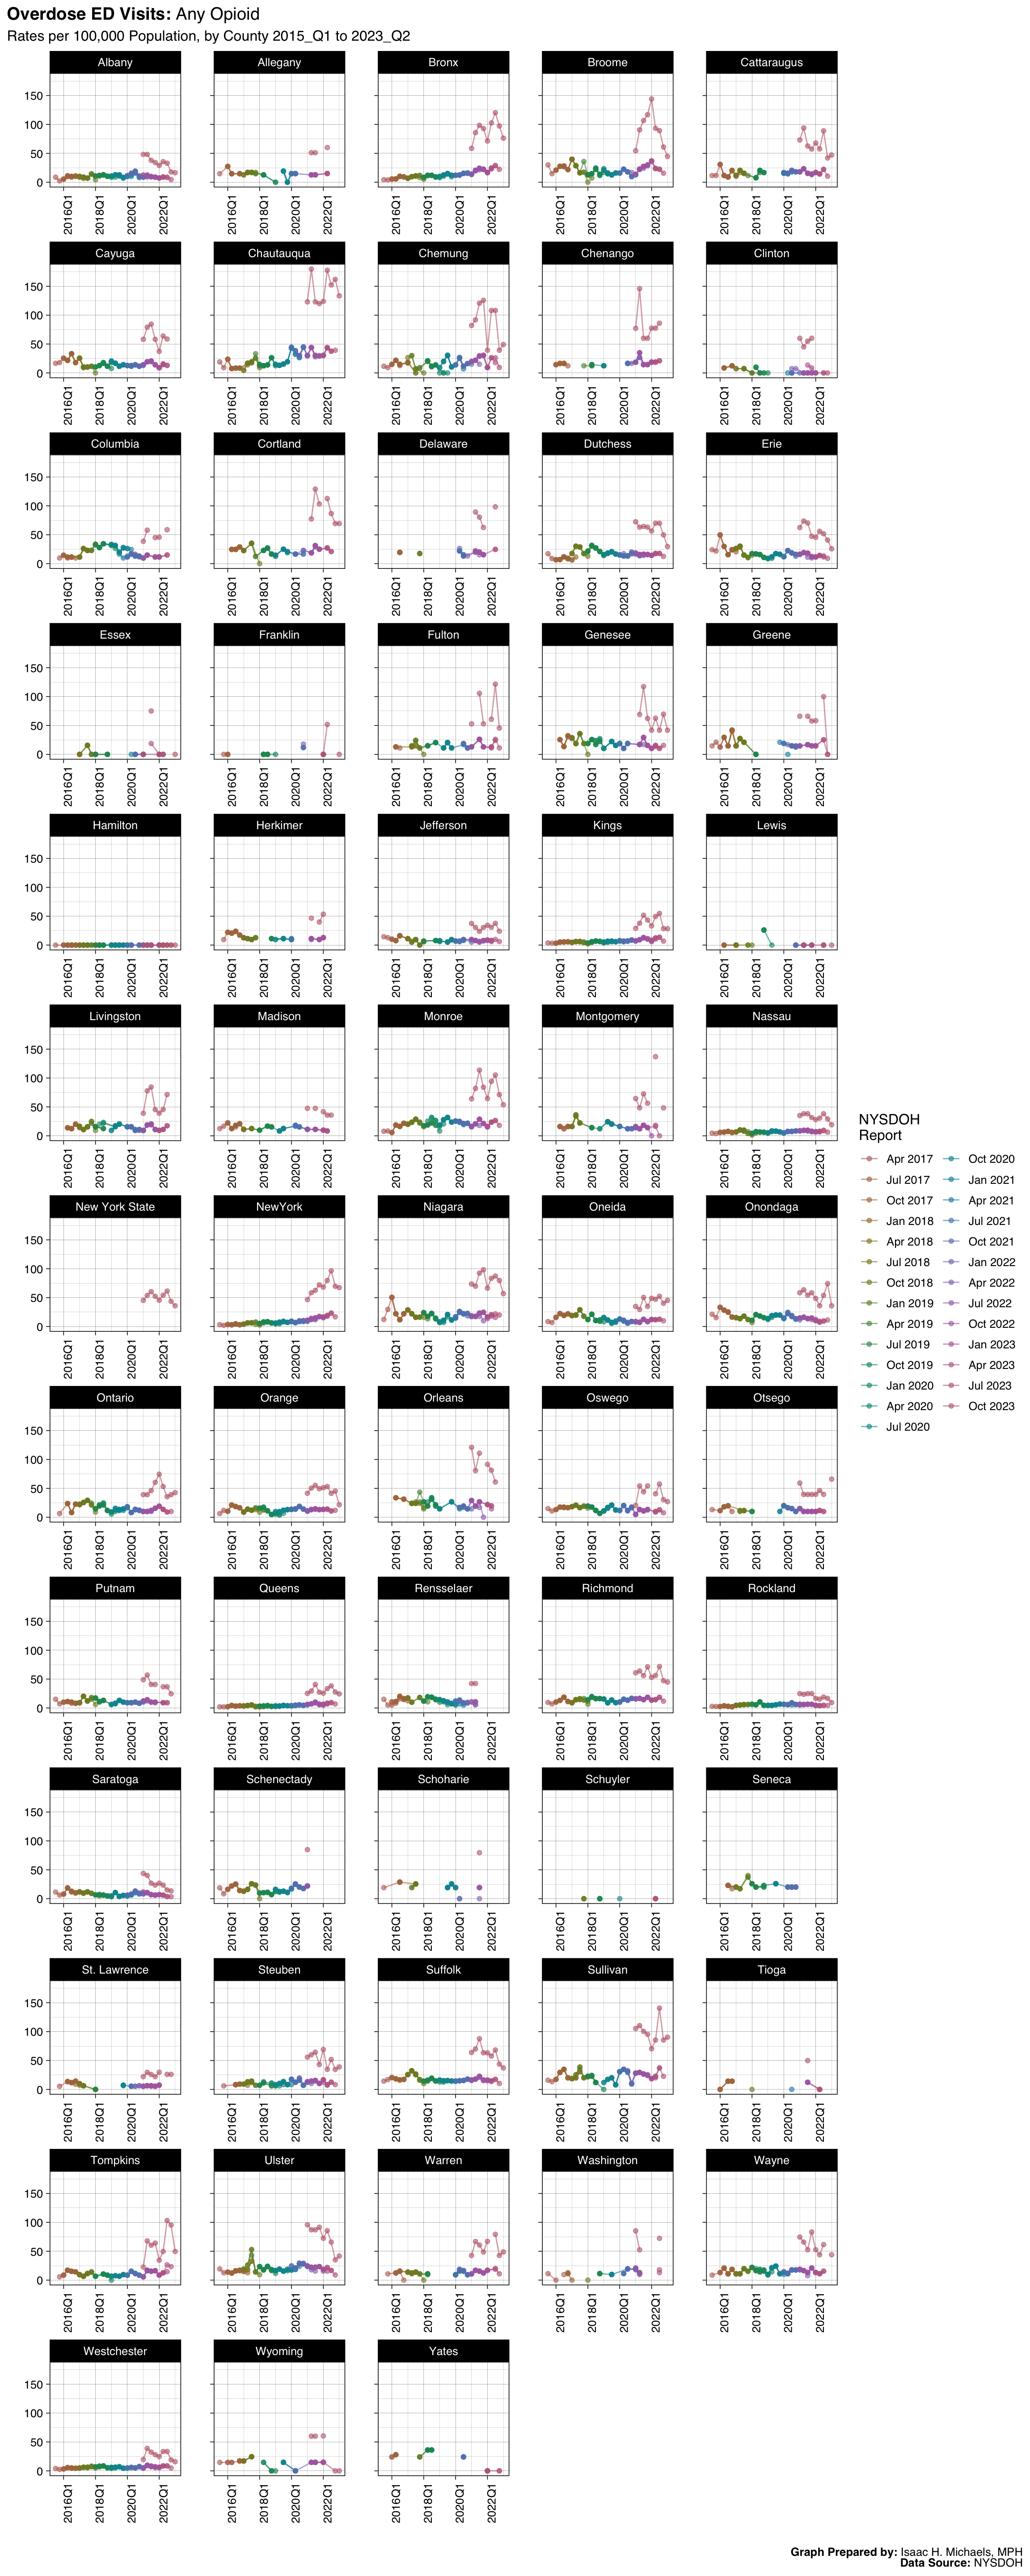
ED Visits: Any Opioid
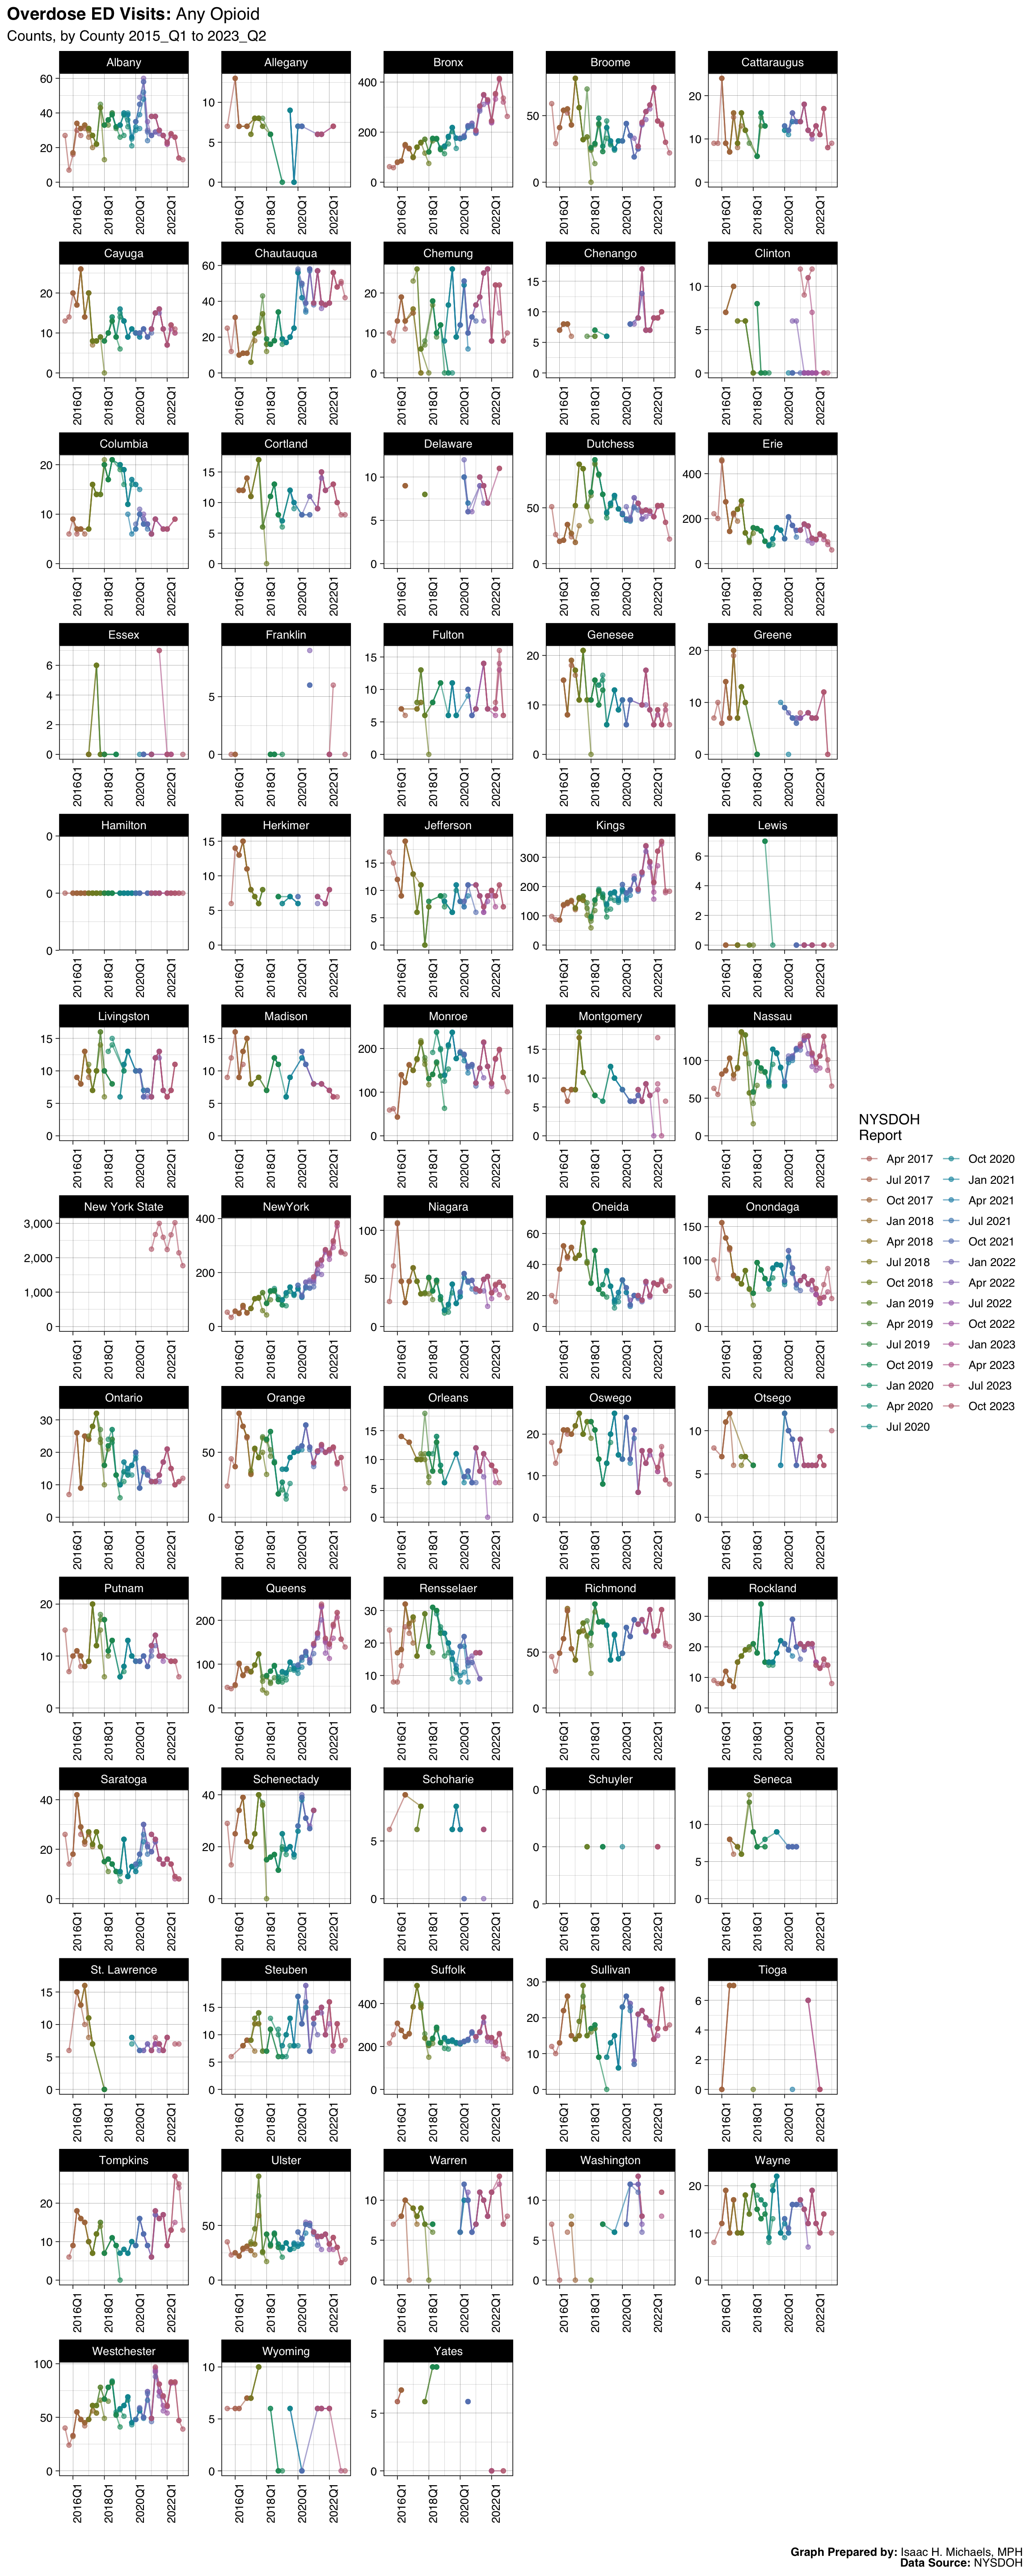 Graph Prepared By: Isaac H. Michaels, MPH
Data Source: NYSDOH (Current, Archived)
 Graph Prepared By:
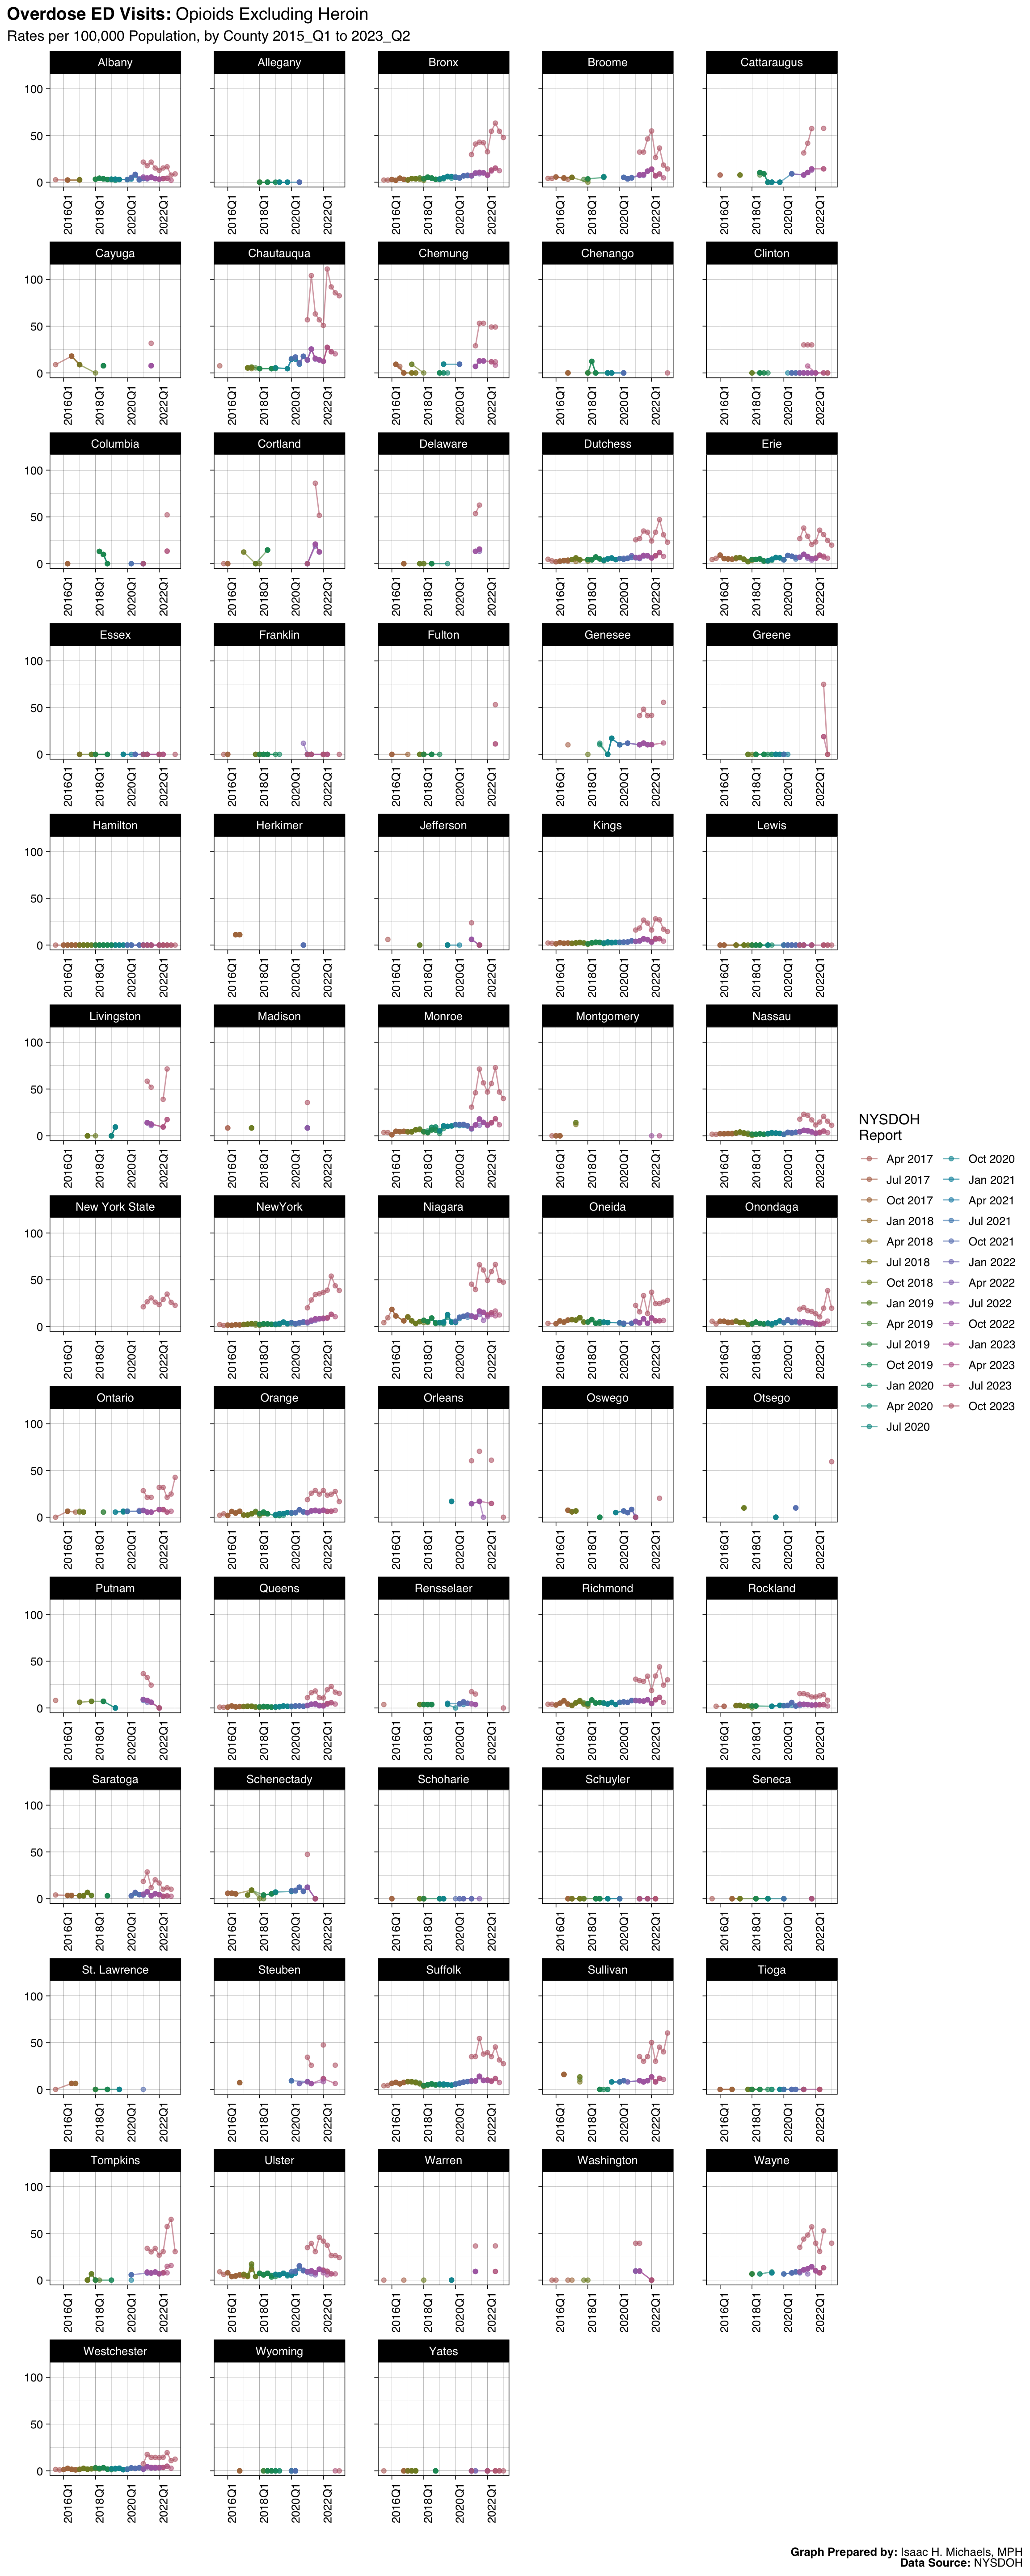
 ED Visits: Opioids Excluding Heroin
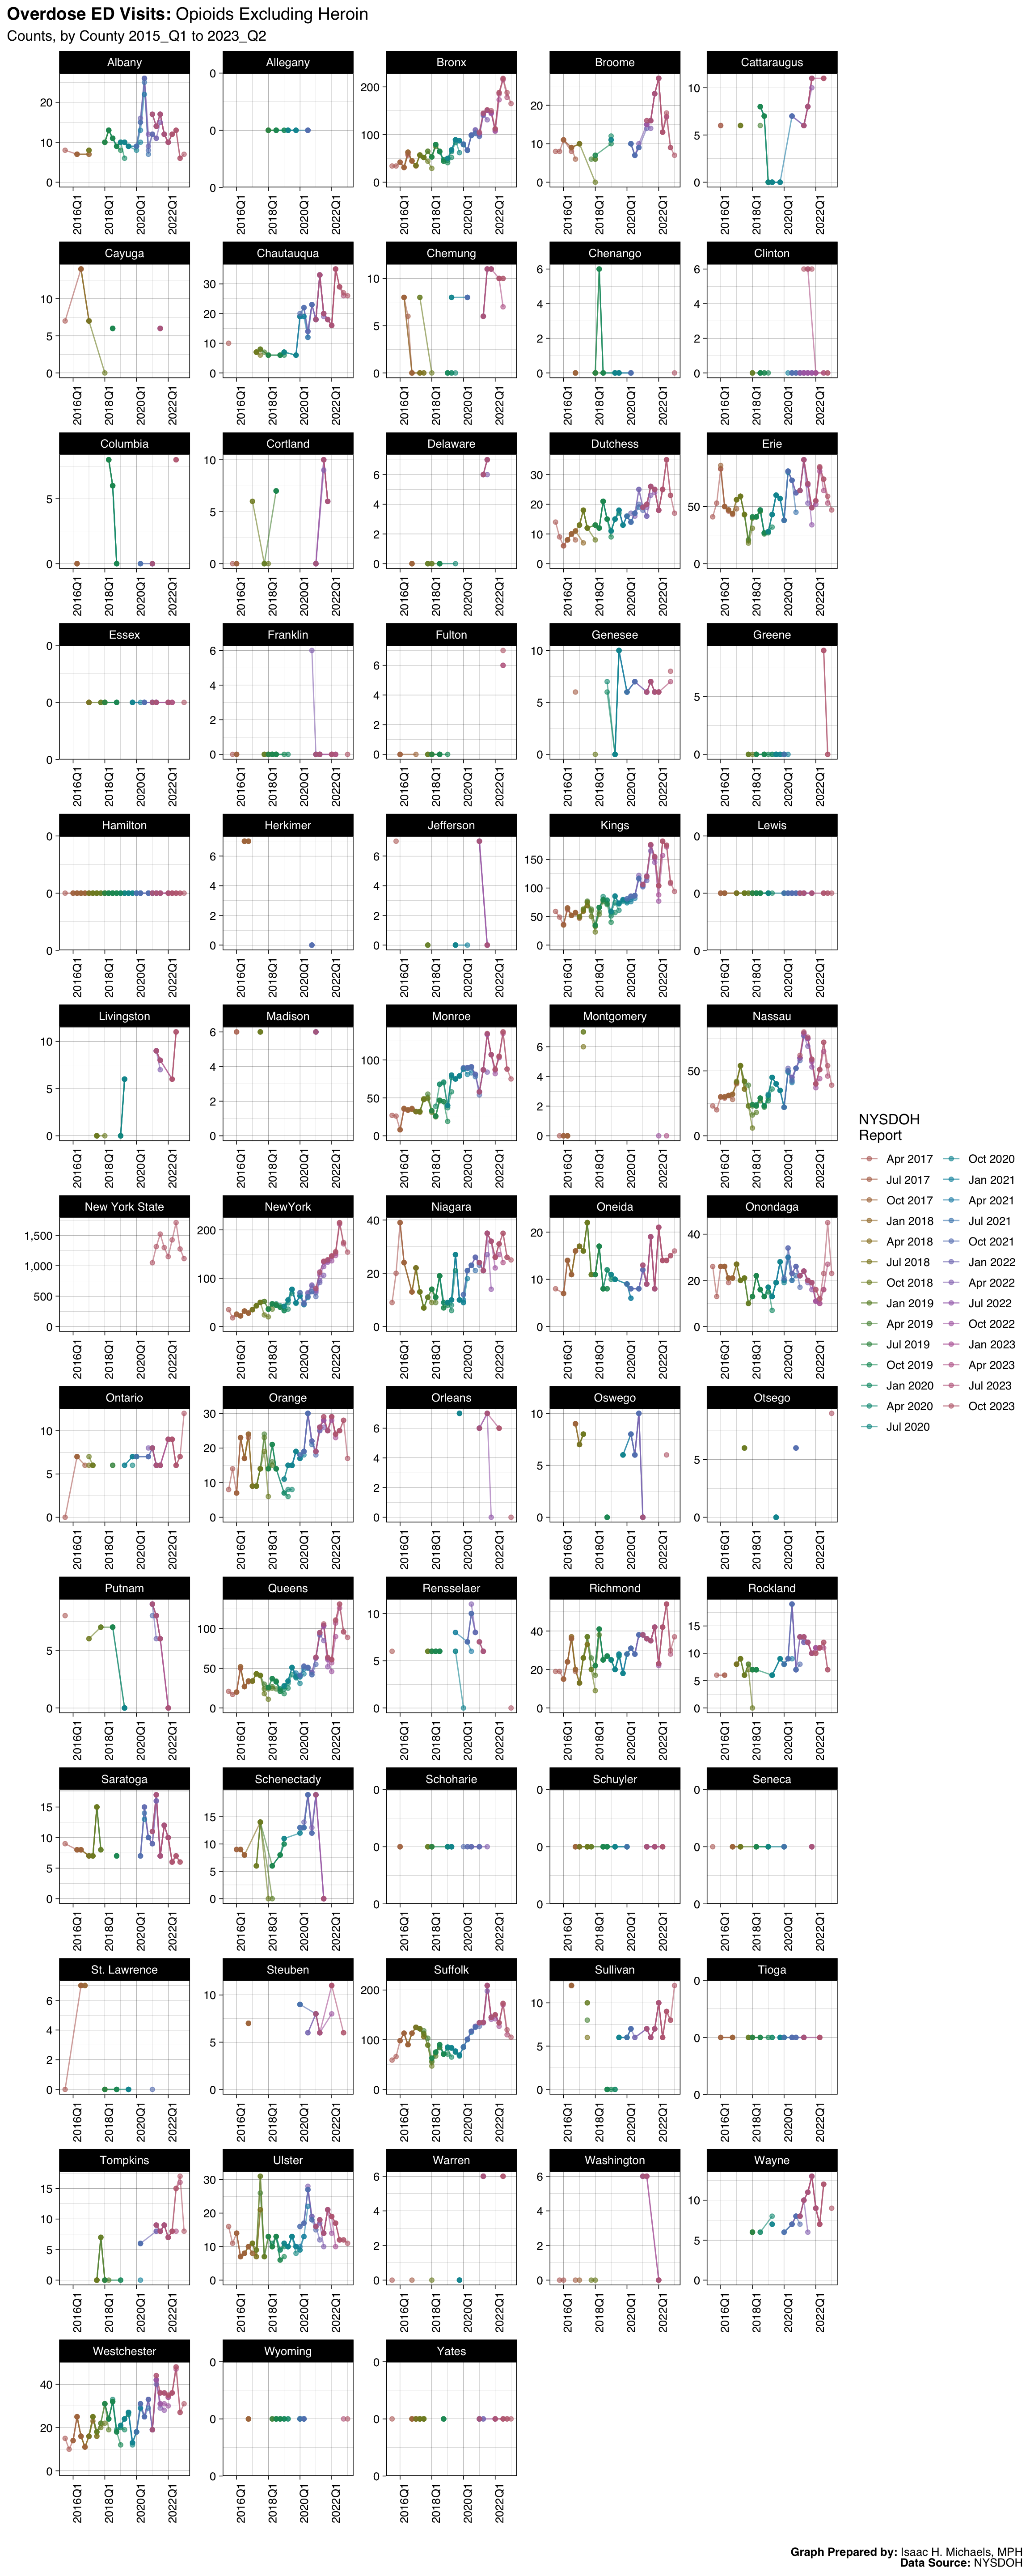 Graph Prepared By: Isaac H. Michaels, MPH
Data Source: NYSDOH (Current, Archived)
Naloxone Administration: EMS
 Graph Prepared By: Isaac H. Michaels, MPH
Data Source: NYSDOH (Current, Archived)
Naloxone Administration: Law Enforcement
 Graph Prepared By: Isaac H. Michaels, MPH
Data Source: NYSDOH (Current, Archived)
Naloxone Administration: Community Programs
 Graph Prepared By: Isaac H. Michaels, MPH
Data Source: NYSDOH (Current, Archived)
Rates
Trends
Deaths: Any Opioid
 Graph Prepared By: Isaac H. Michaels, MPH
Data Source: NYSDOH (Current, Archived)
 Graph Prepared By:
 Deaths: Opioid Pain Relievers
 Graph Prepared By: Isaac H. Michaels, MPH
Data Source: NYSDOH (Current, Archived)
Hospitalizations: Any Opioid
 Graph Prepared By: Isaac H. Michaels, MPH
Data Source: NYSDOH (Current, Archived)
Hospitalizations: Heroin
 Graph Prepared By: Isaac H. Michaels, MPH
Data Source: NYSDOH (Current, Archived)
Hospitalizations: Opioids Excluding Heroin
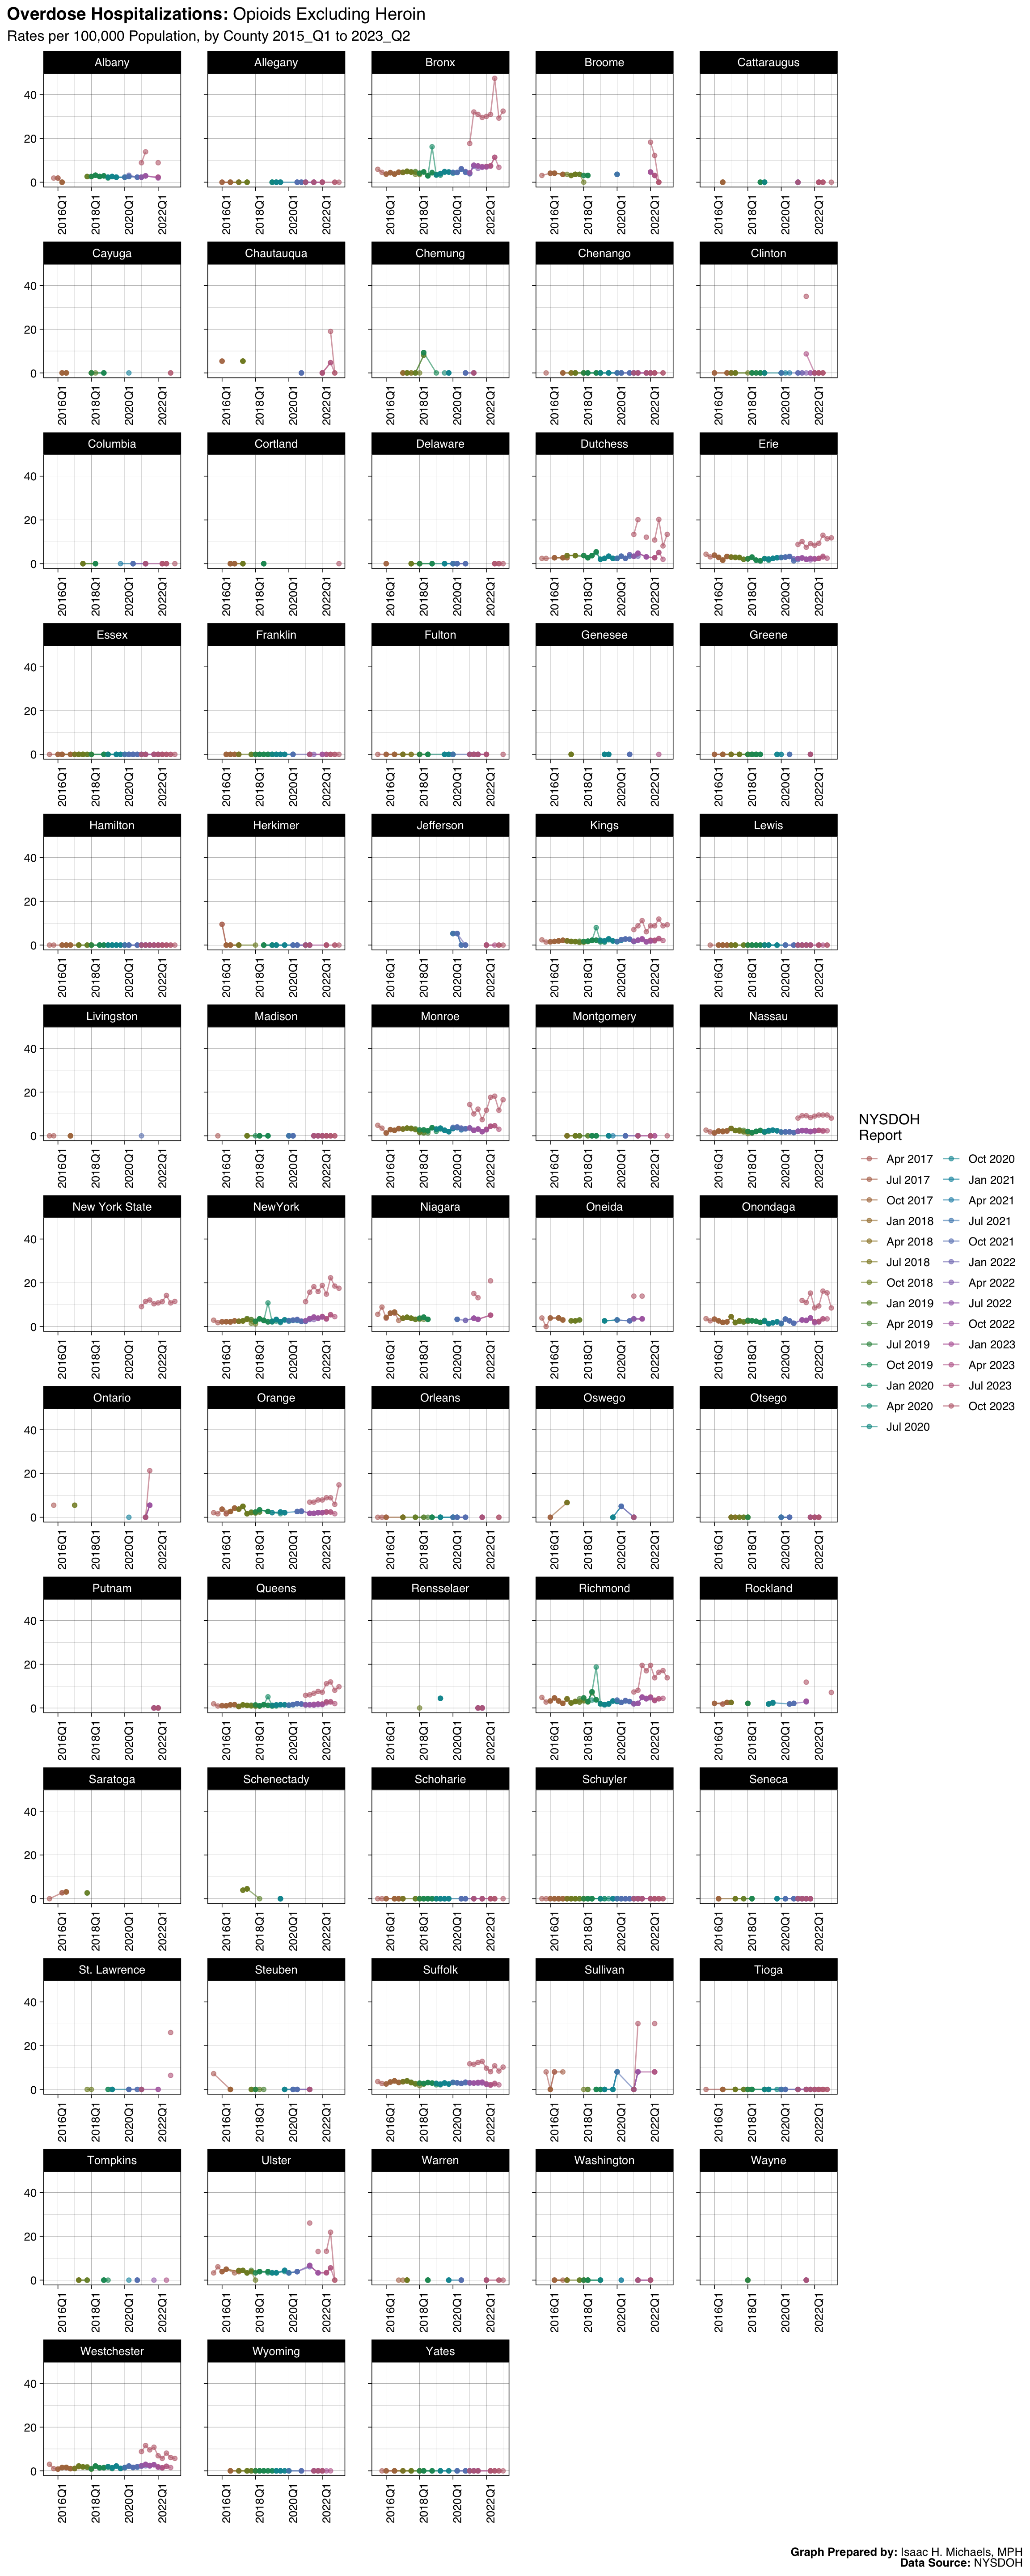 Graph Prepared By: Isaac H. Michaels, MPH
Data Source: NYSDOH (Current, Archived)
ED Visits: Any Opioid
 Graph Prepared By: Isaac H. Michaels, MPH
Data Source: NYSDOH (Current, Archived)
 Graph Prepared By:
 ED Visits: Opioids Excluding Heroin
 Graph Prepared By: Isaac H. Michaels, MPH
Data Source: NYSDOH (Current, Archived)
Maps
 Map Prepared By:
 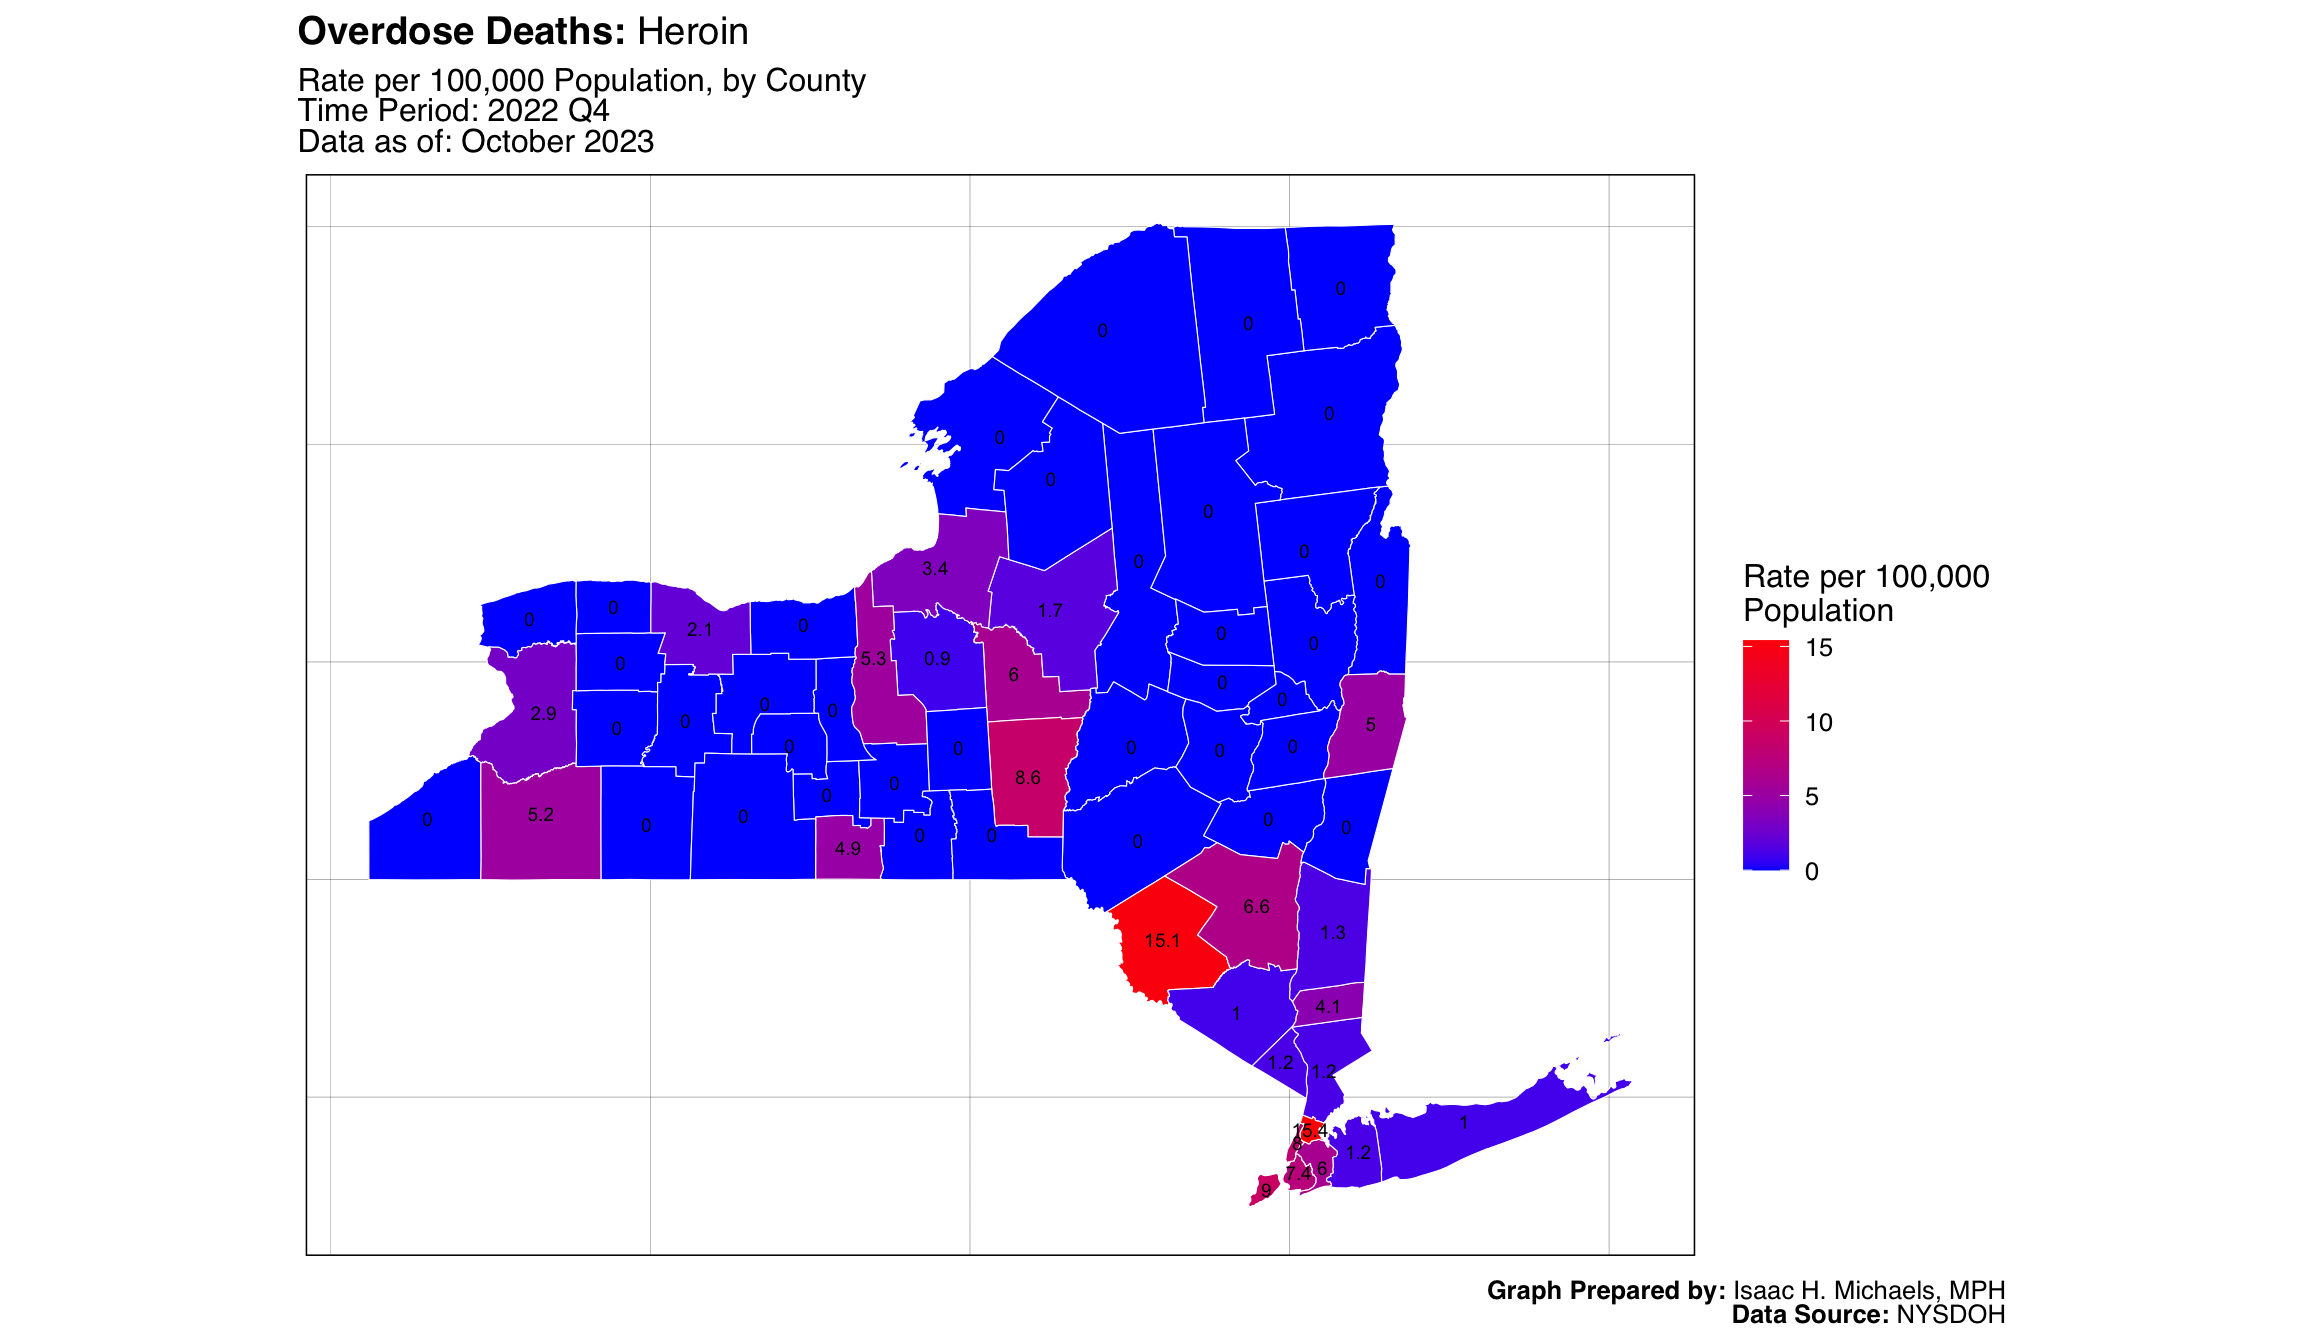 Map Prepared By:
 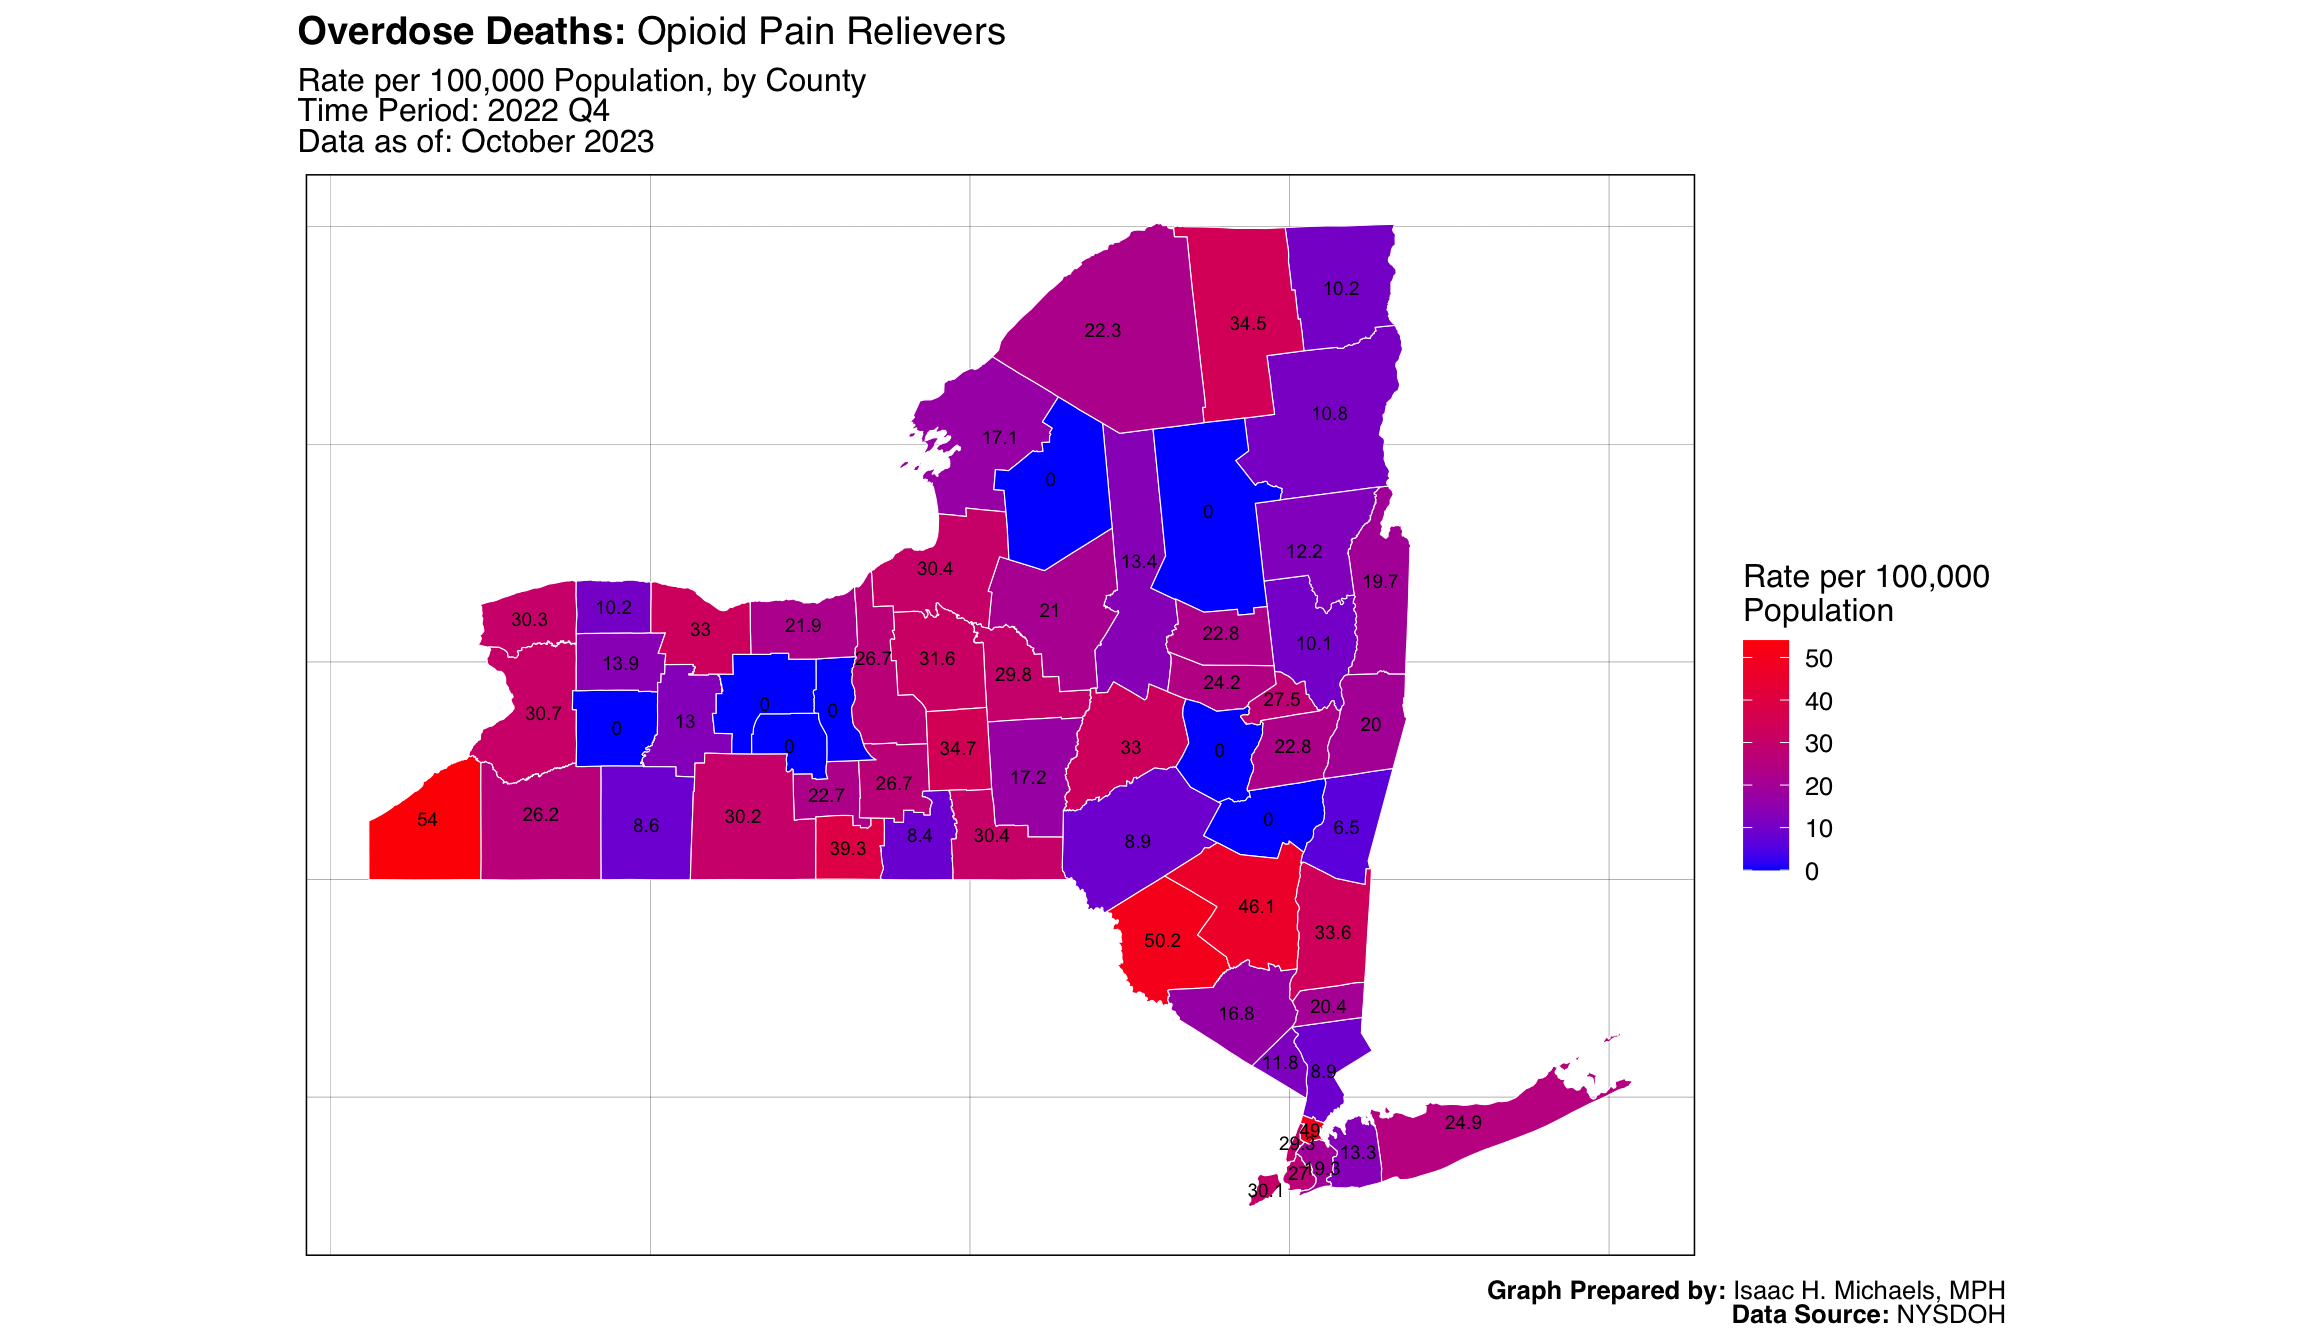 Map Prepared By:
 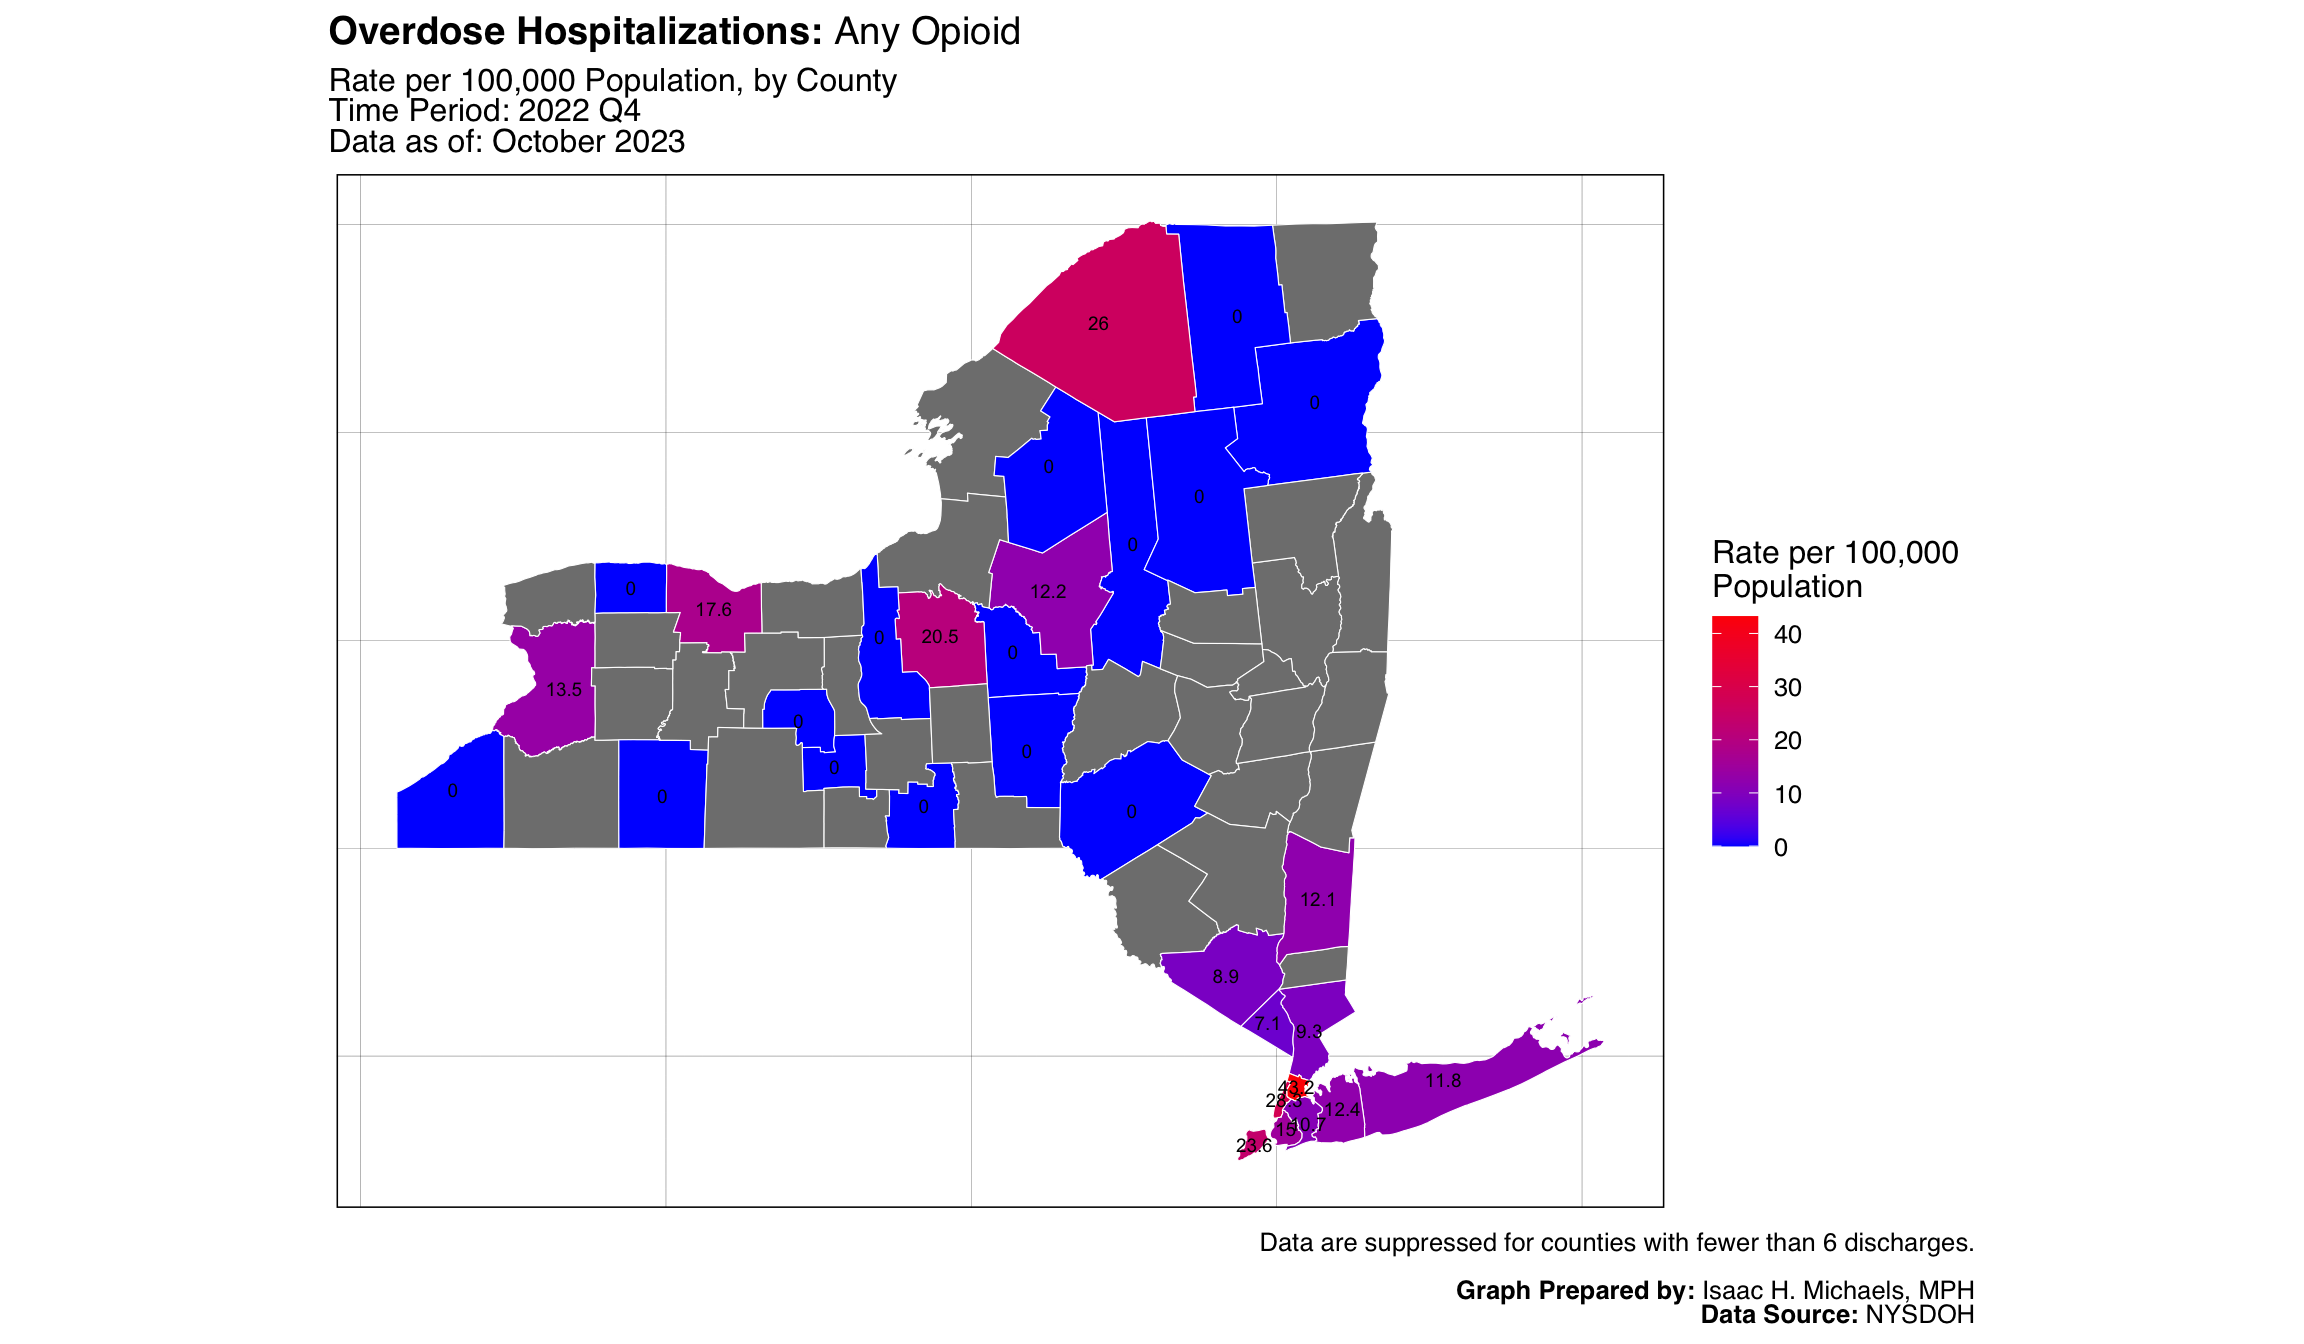 Map Prepared By:
 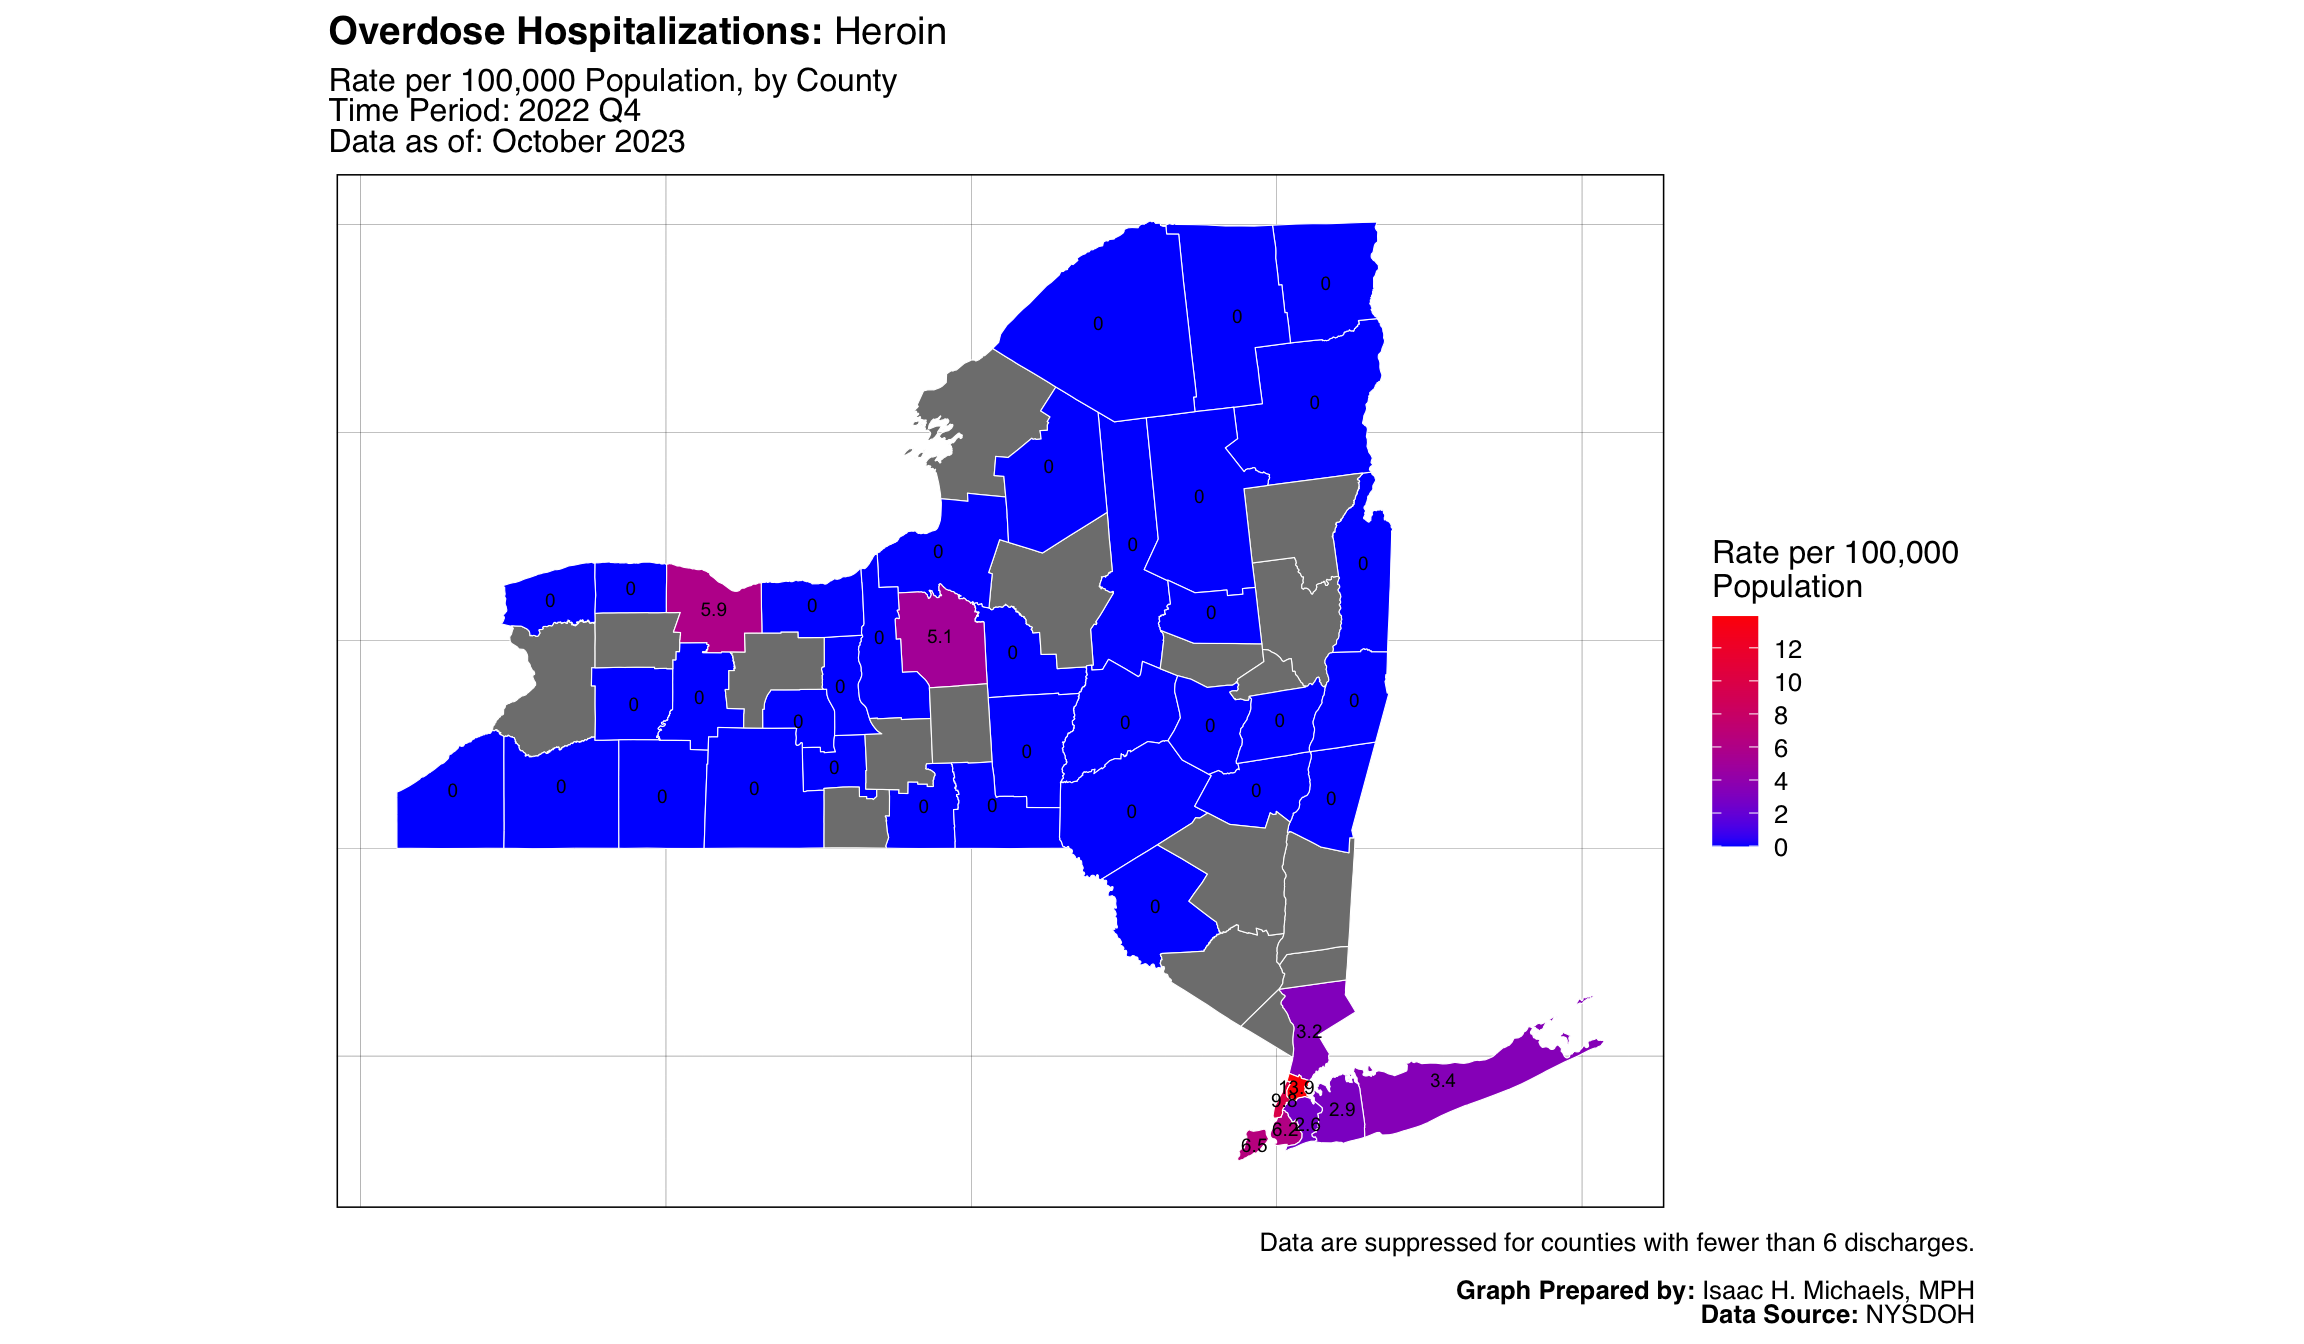 Map Prepared By:
 Hospitalizations: Opioids Excluding Heroin
 Map Prepared By: Isaac H. Michaels, MPH
Data Source: NYSDOH
 Map Prepared By:
 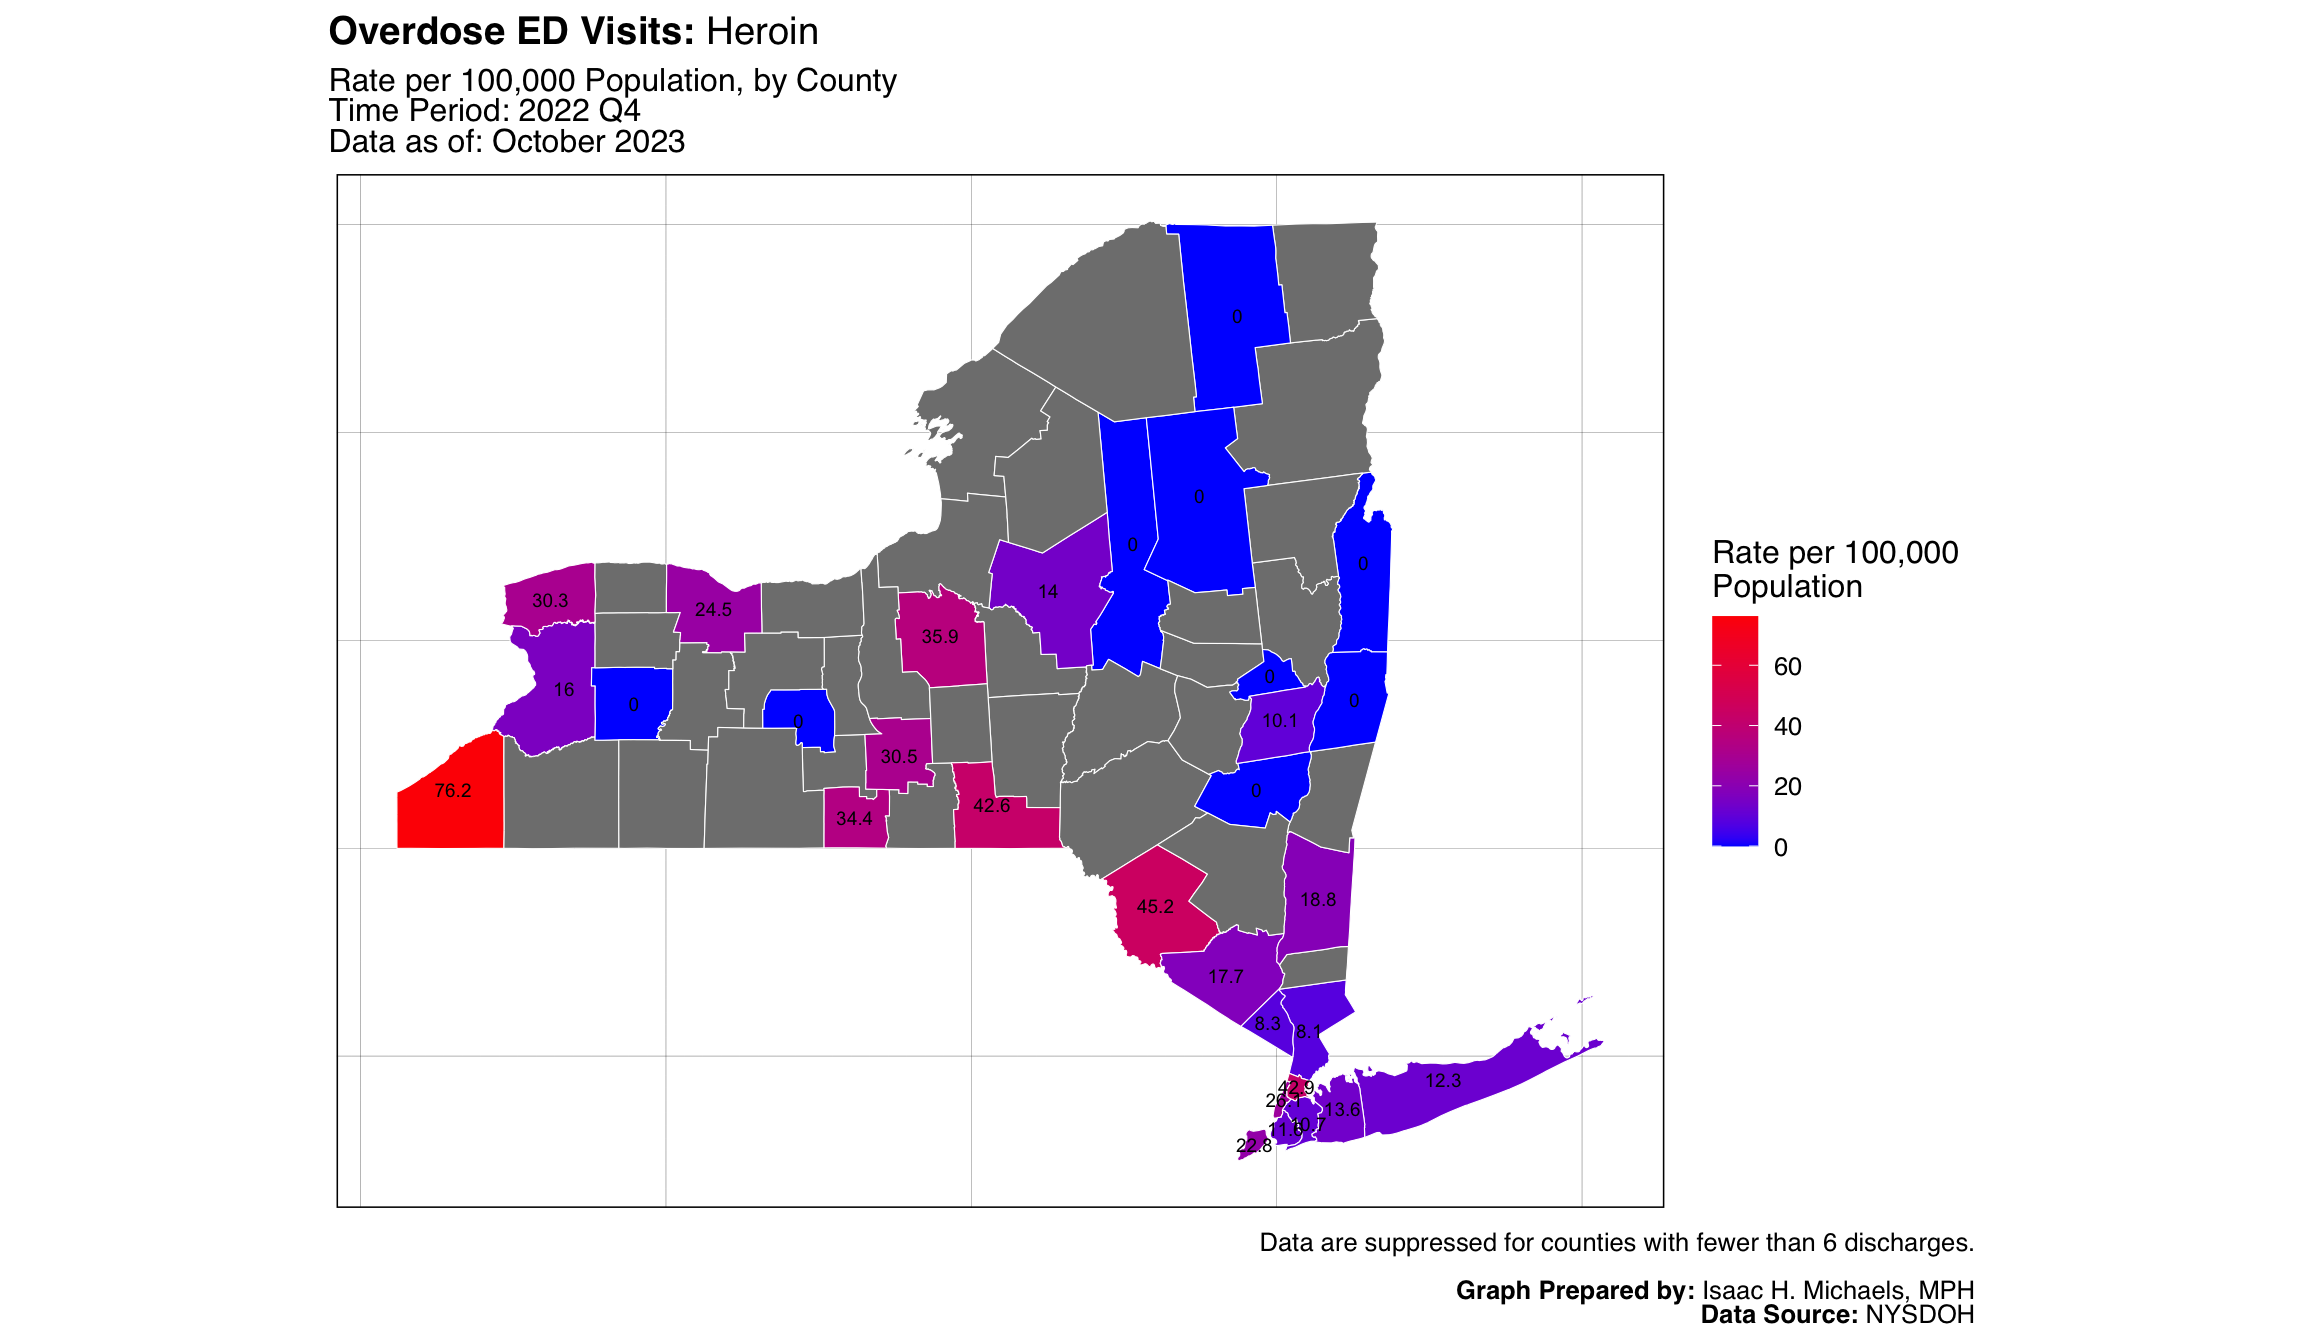 Map Prepared By:
 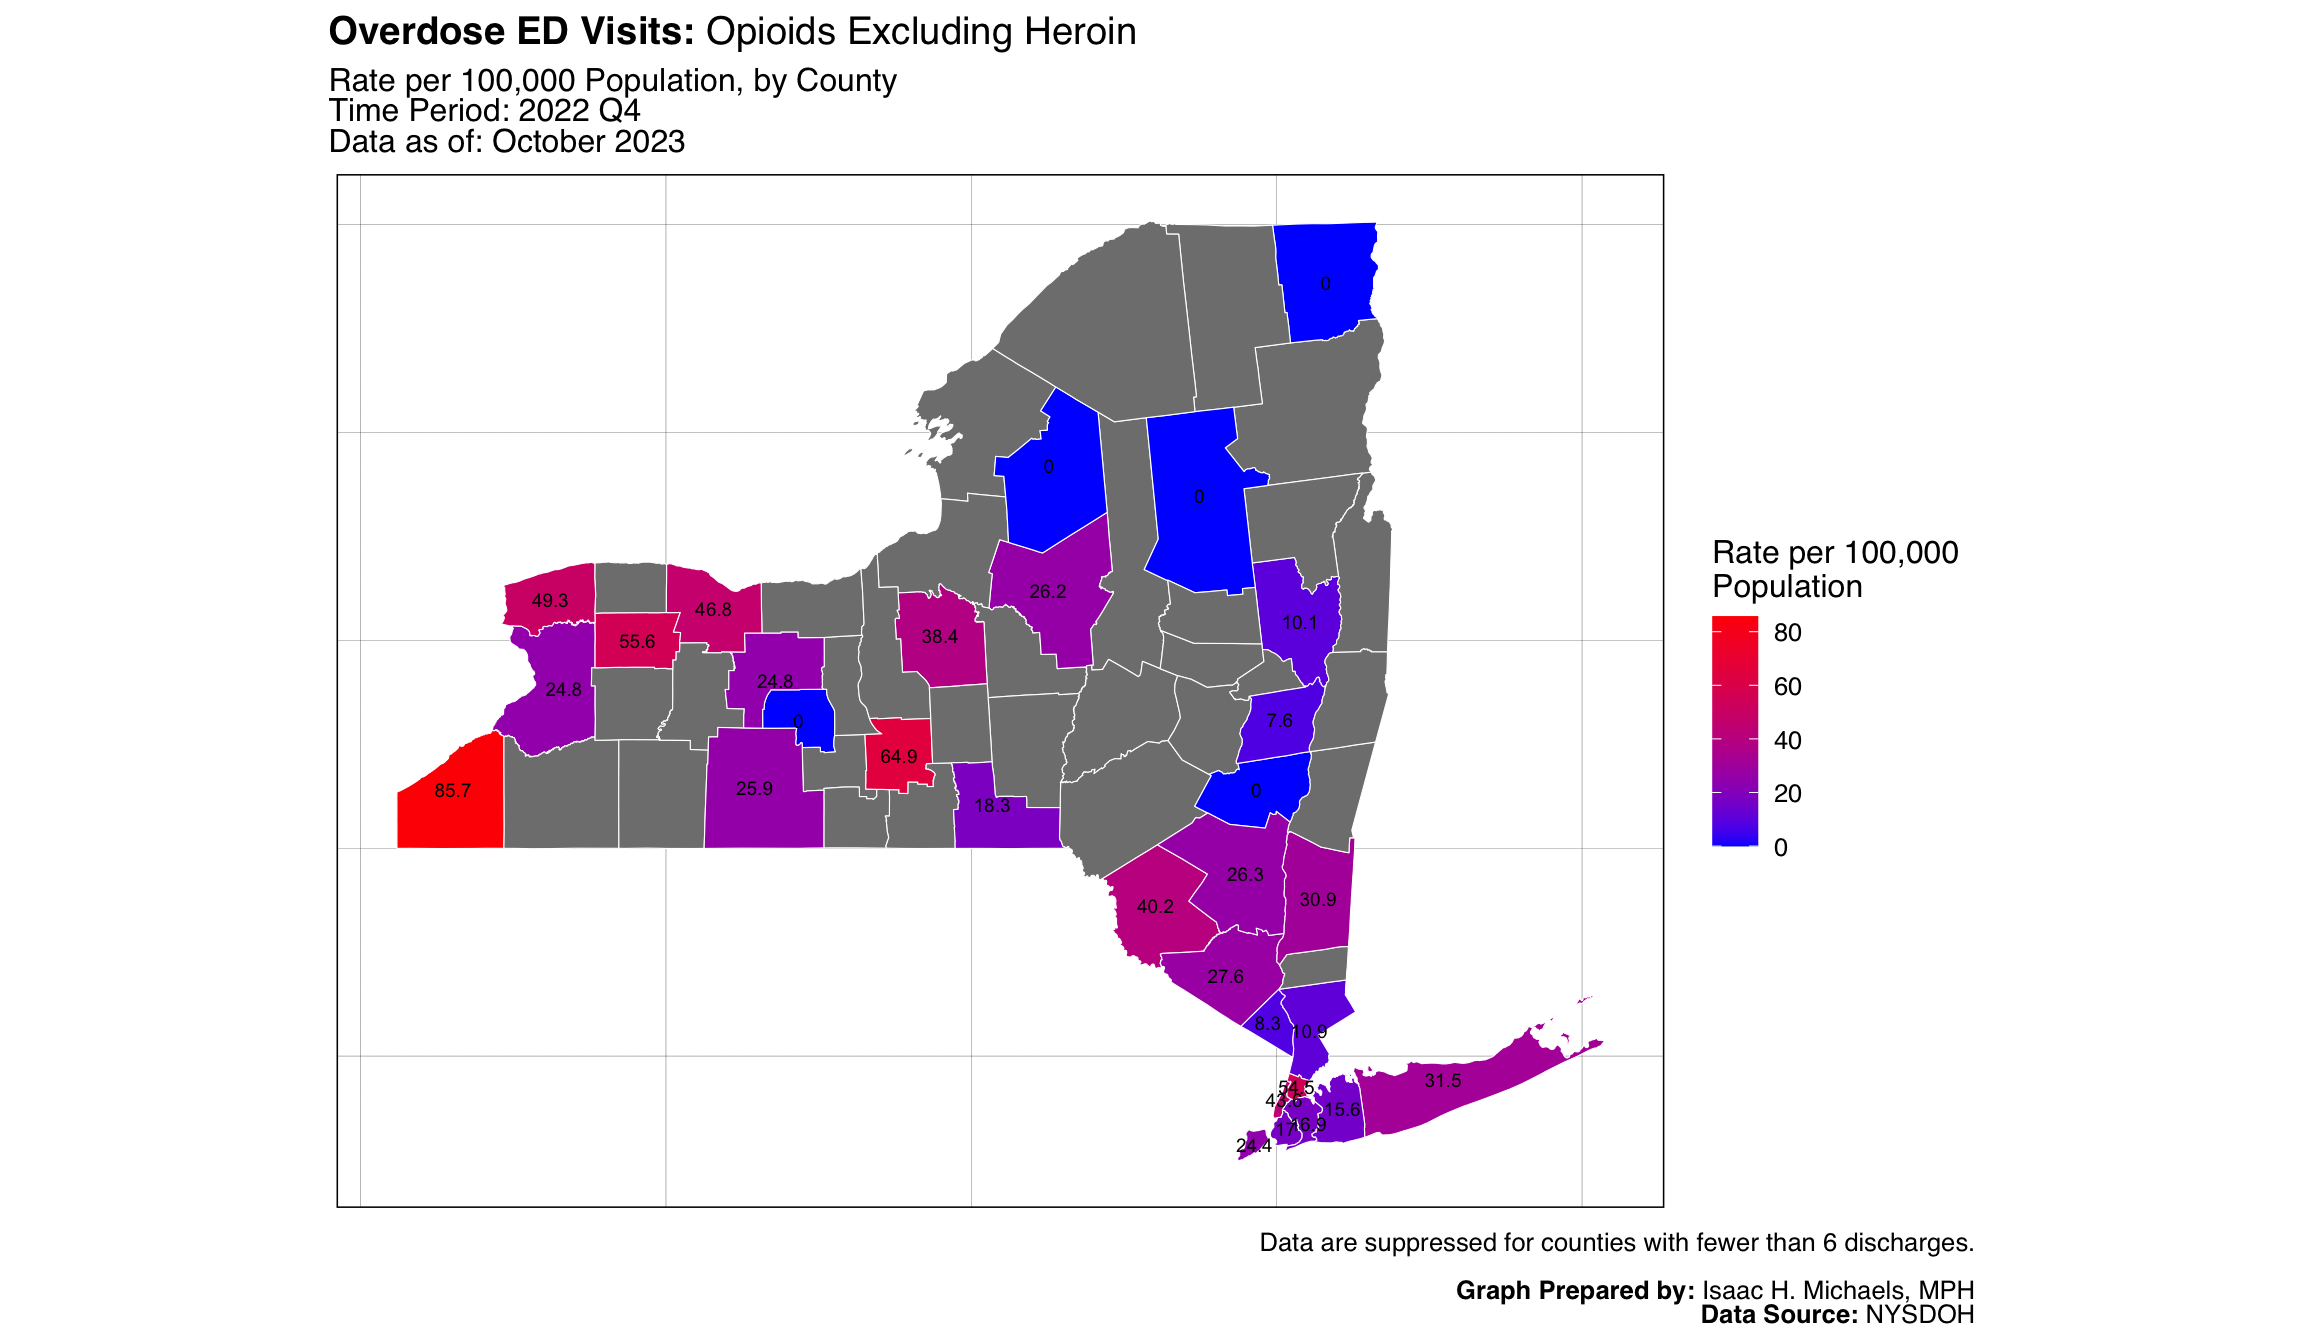 Map Prepared By:
 Technical Notes
Data Sources
- New York State Vital Statistics (deaths)
- New York Statewide Planning and Research Cooperative System (hospitalizations and ED visits)
- EMS Electronic Patient Care Reports (naloxone administration by EMS)
- New York State AIDS Institute (naloxone administration by law enforcement and community programs)
Data Suppression
Hospitalization and ED visits are suppressed when counts are greater than zero AND less than 6.
Indicator Definitions
- Deaths
- Any Opioid: Underlying cause of death X40-X44,X60-X64,X85, Y10-Y14 AND any opioid in all other causes of death (T40.0, T40.1, T40.2, T40.3, T40.4, T40.6).
- Heroin: Underlying cause of death X40-X44,X60-X64,X85, Y10-Y14 AND heroin in all other causes of death (T40.1).
- Opioid Pain Relievers: Underlying cause of death X40-X44,X60-X64,X85, Y10-Y14 AND any opioid pain relievers in all other causes of death (T40.2, T40.3, T40.4).
- Hospitalizations and ED Visits
- Any Opioid: ICD-9-CM Principal Diagnosis 96500, 96501, 96502, 96509 OR First-listed External Cause of Injury E8500, E8501, E8502; ICD-10-CM Principal Diagnosis T40.0, T40.1, T40.2, T40.3, T40.4, T40.6, excluding ‘adverse effect,’ ‘underdosing,’ and ‘sequela’.
- Heroin: ICD-9-CM Principal Diagnosis 96501 OR First-listed External Cause of Injury E8500; ICD-10-CM Principal Diagnosis T40.1, excluding ‘adverse effect,’ ‘underdosing,’ and ‘sequela’.
- Opioids excluding Heroin: ICD-9-CM Principal Diagnosis 96500, 96502, 96509 OR First-listed External Cause of Injury E8501, E8502; ICD-10-CM: Principal Diagnosis T40.0, T40.2, T40.3, T40.4, T40.6, excluding ‘adverse effect,’ ‘underdosing,’ and ‘sequela’.
Location Attribution
In the visualizations above, the overdose death/hospitalization/ED visit indicators reflect the decedent/patient’s county of residence. In contrast, the naloxone indicators reflect the county where the overdose occurred.