Published: January 27, 2023
Updated: September 01, 2024 at 05:10PM
Note: The weekly data on this page are no longer being updated because CDC (as of September 27, 2023) is no longer updating the Weekly Counts of Deaths by Jurisdiction and Age dataset on data.cdc.gov.
Welcome
Welcome to this page presenting data on all-cause mortality among New York State residents. This analysis provides insights into mortality trends over time and across different age groups. The data are ascertained from CDC WONDER, a trusted source for health-related statistics in the United States. The weekly data I use for these analyses are obtained from the National Center for Health Statistics via the data.cdc.gov open data platform, and the annual data are obtained via CDC WONDER.
Data Overview
The annual data in this analysis reflect information on all-cause mortality among New York State residents spanning from 1999 to the present. They includes mortality counts, population figures, and crude mortality rates per 100,000 population. The data is categorized by age groups, making it possible to analyze how mortality rates vary across different life stages.
The weekly data in this analysis cover the period from 2015 to present. These data are presented in various forms, including as line graphs, bar graphs, and heat maps. The line graphs show overall trends, as well as trends by jurisdiction and age group. The bar graphs show trends by year. The heat maps show trends by age group and year, as well as by age group, year, and jurisdiction, by year and month, by year, month, and jurisdiction, and by year, month, and age group.
How to Use These Data
These data are intended for public health professionals, researchers, policymakers, and anyone interested in understanding the patterns and trends in mortality rates among New York State residents. This analysis can be used to identify specific age groups or years with notable changes in mortality, allowing for informed decision-making and targeted interventions.
Why are these data important?
Understanding all-cause mortality rates is crucial for public health planning and intervention strategies. These data serve as a foundation for identifying potential health disparities, evaluating the effectiveness of healthcare programs, and allocating resources to address specific age groups or time periods with elevated mortality rates. By analyzing these trends, policymakers and healthcare professionals can work to reduce mortality and improve overall community health.
What do these data show?
This analysis displays all-cause mortality counts and crude mortality rates per 100,000 population for New York State residents, organized by year and age group. It reveals how mortality rates have changed over time and highlights variations across different age groups. The data allow for an in-depth examination of mortality trends, enabling stakeholders to identify periods or demographics that may require targeted public health interventions.
What do these data not show?
While these data provide valuable insights into all-cause mortality trends, they do not provide specific information about the underlying causes of death or the impact of individual risk factors. To gain a comprehensive understanding of mortality patterns, additional data sources and analyses are necessary to explore the underlying causes and contributors to mortality among New York State residents.
Implications for Public Health Practice
The data presented here underscore the importance of ongoing monitoring and analysis of all-cause mortality rates. Public health practitioners should consider the following implications:
Targeted Interventions: Identifying age groups and years with increased mortality rates is essential for designing and implementing targeted public health interventions. Resources can be allocated to address specific health challenges within these groups.
Health Disparities: Disparities in mortality rates among different age groups may highlight the need for addressing social determinants of health and improving healthcare access for vulnerable populations.
Data-Informed Decision-Making: Policymakers and healthcare professionals can use these data to make evidence-based decisions about resource allocation, health policy development, and healthcare system improvements.
Continuous Monitoring: Regular updates and analysis of mortality data are crucial for staying informed about evolving health trends and ensuring that public health strategies remain effective.
Collaboration: Collaboration between public health agencies, healthcare providers, and community organizations is essential for implementing effective interventions and addressing the root causes of mortality disparities.
Weekly Counts
Trends
Overall
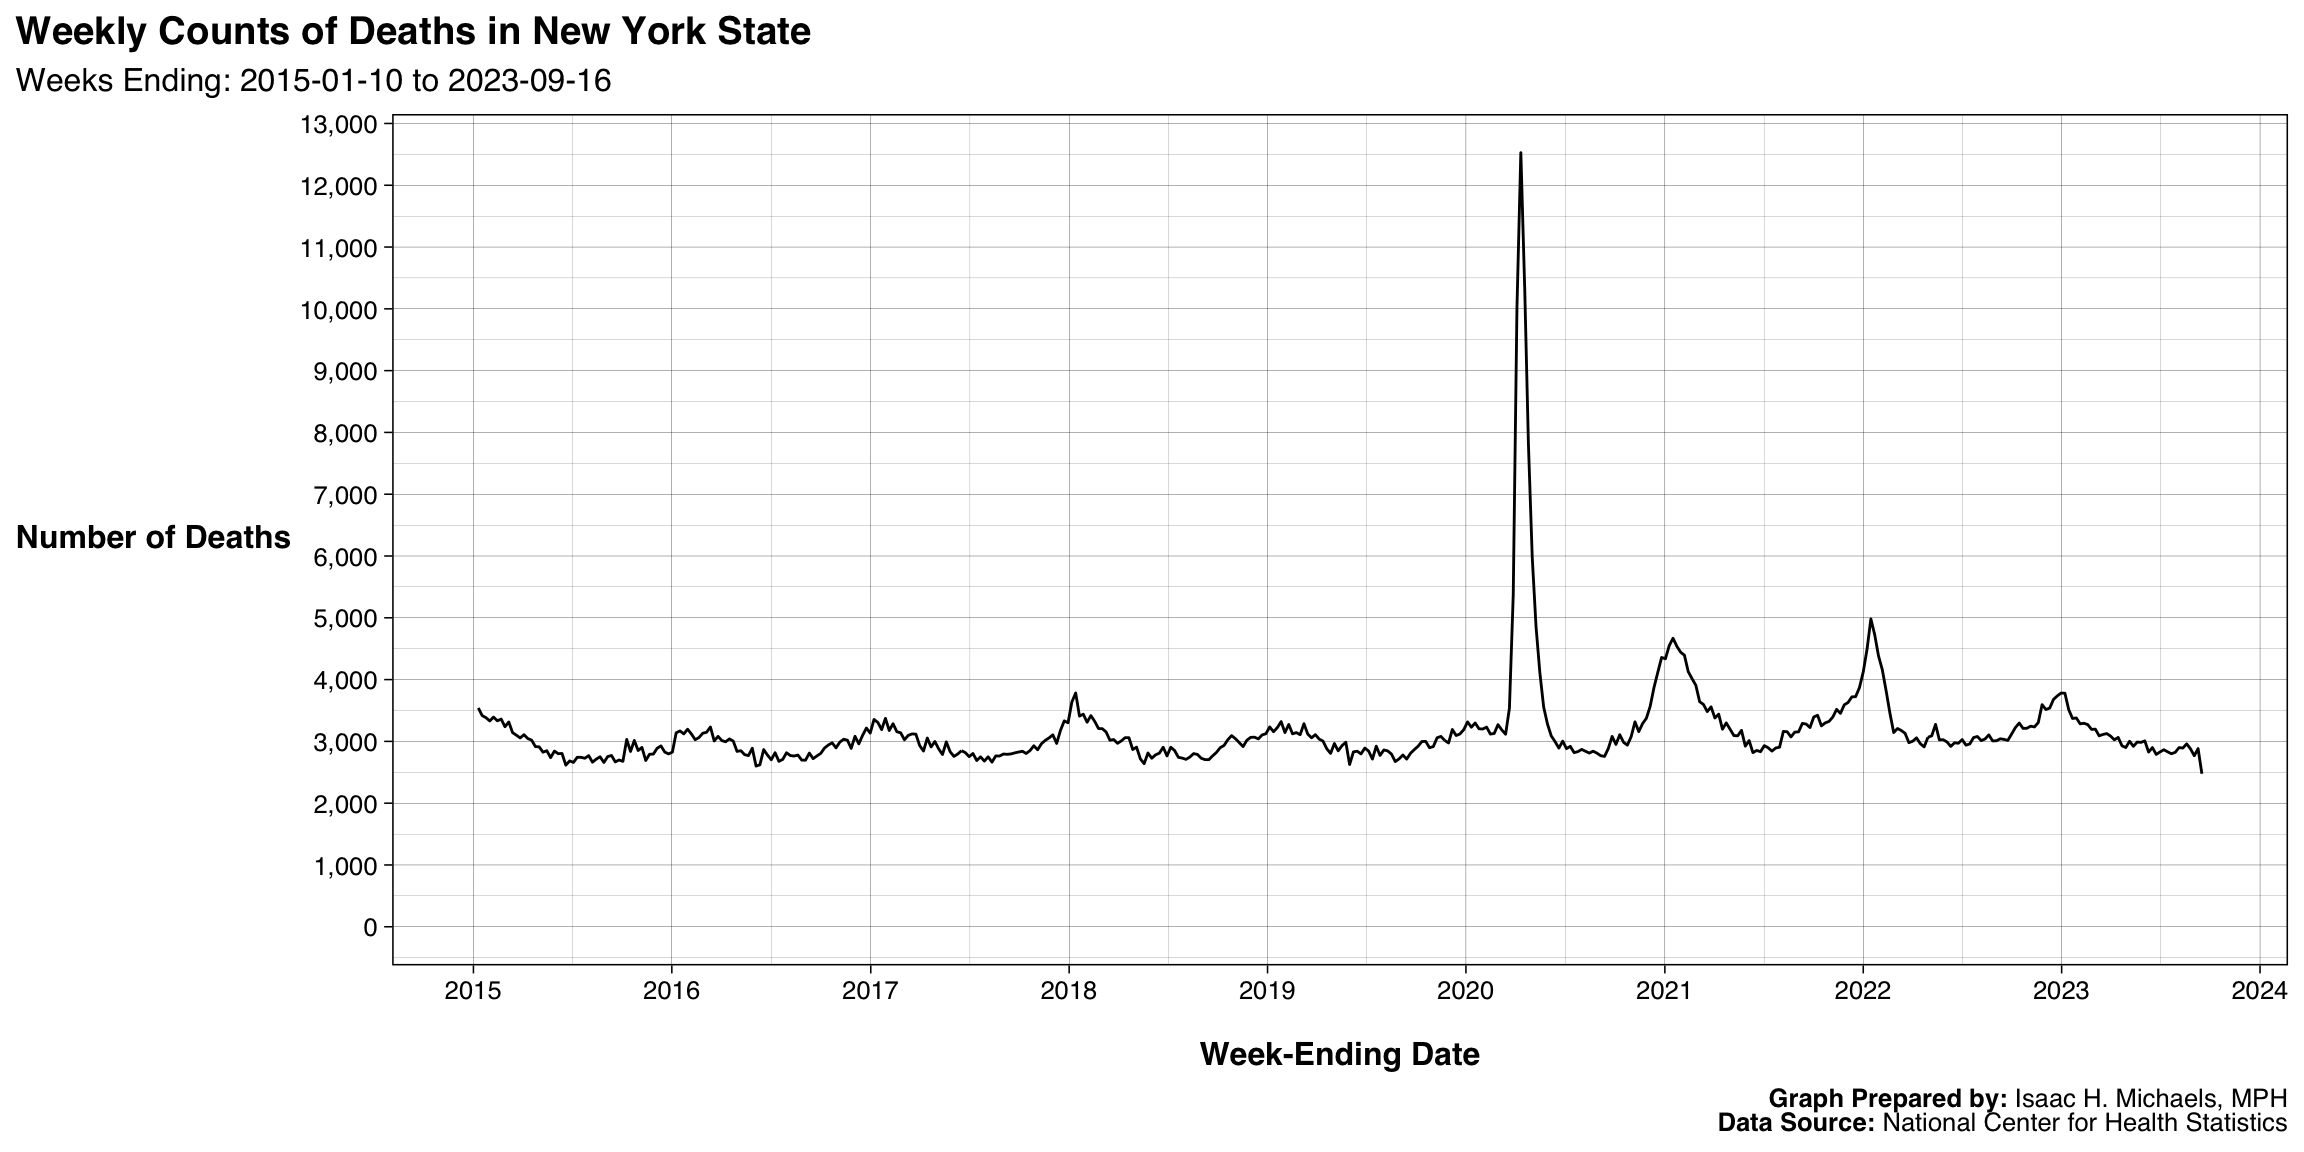 Graphs Prepared By: Isaac H. Michaels, MPH
Data Source: National Center for Health Statistics
By Jurisdiction
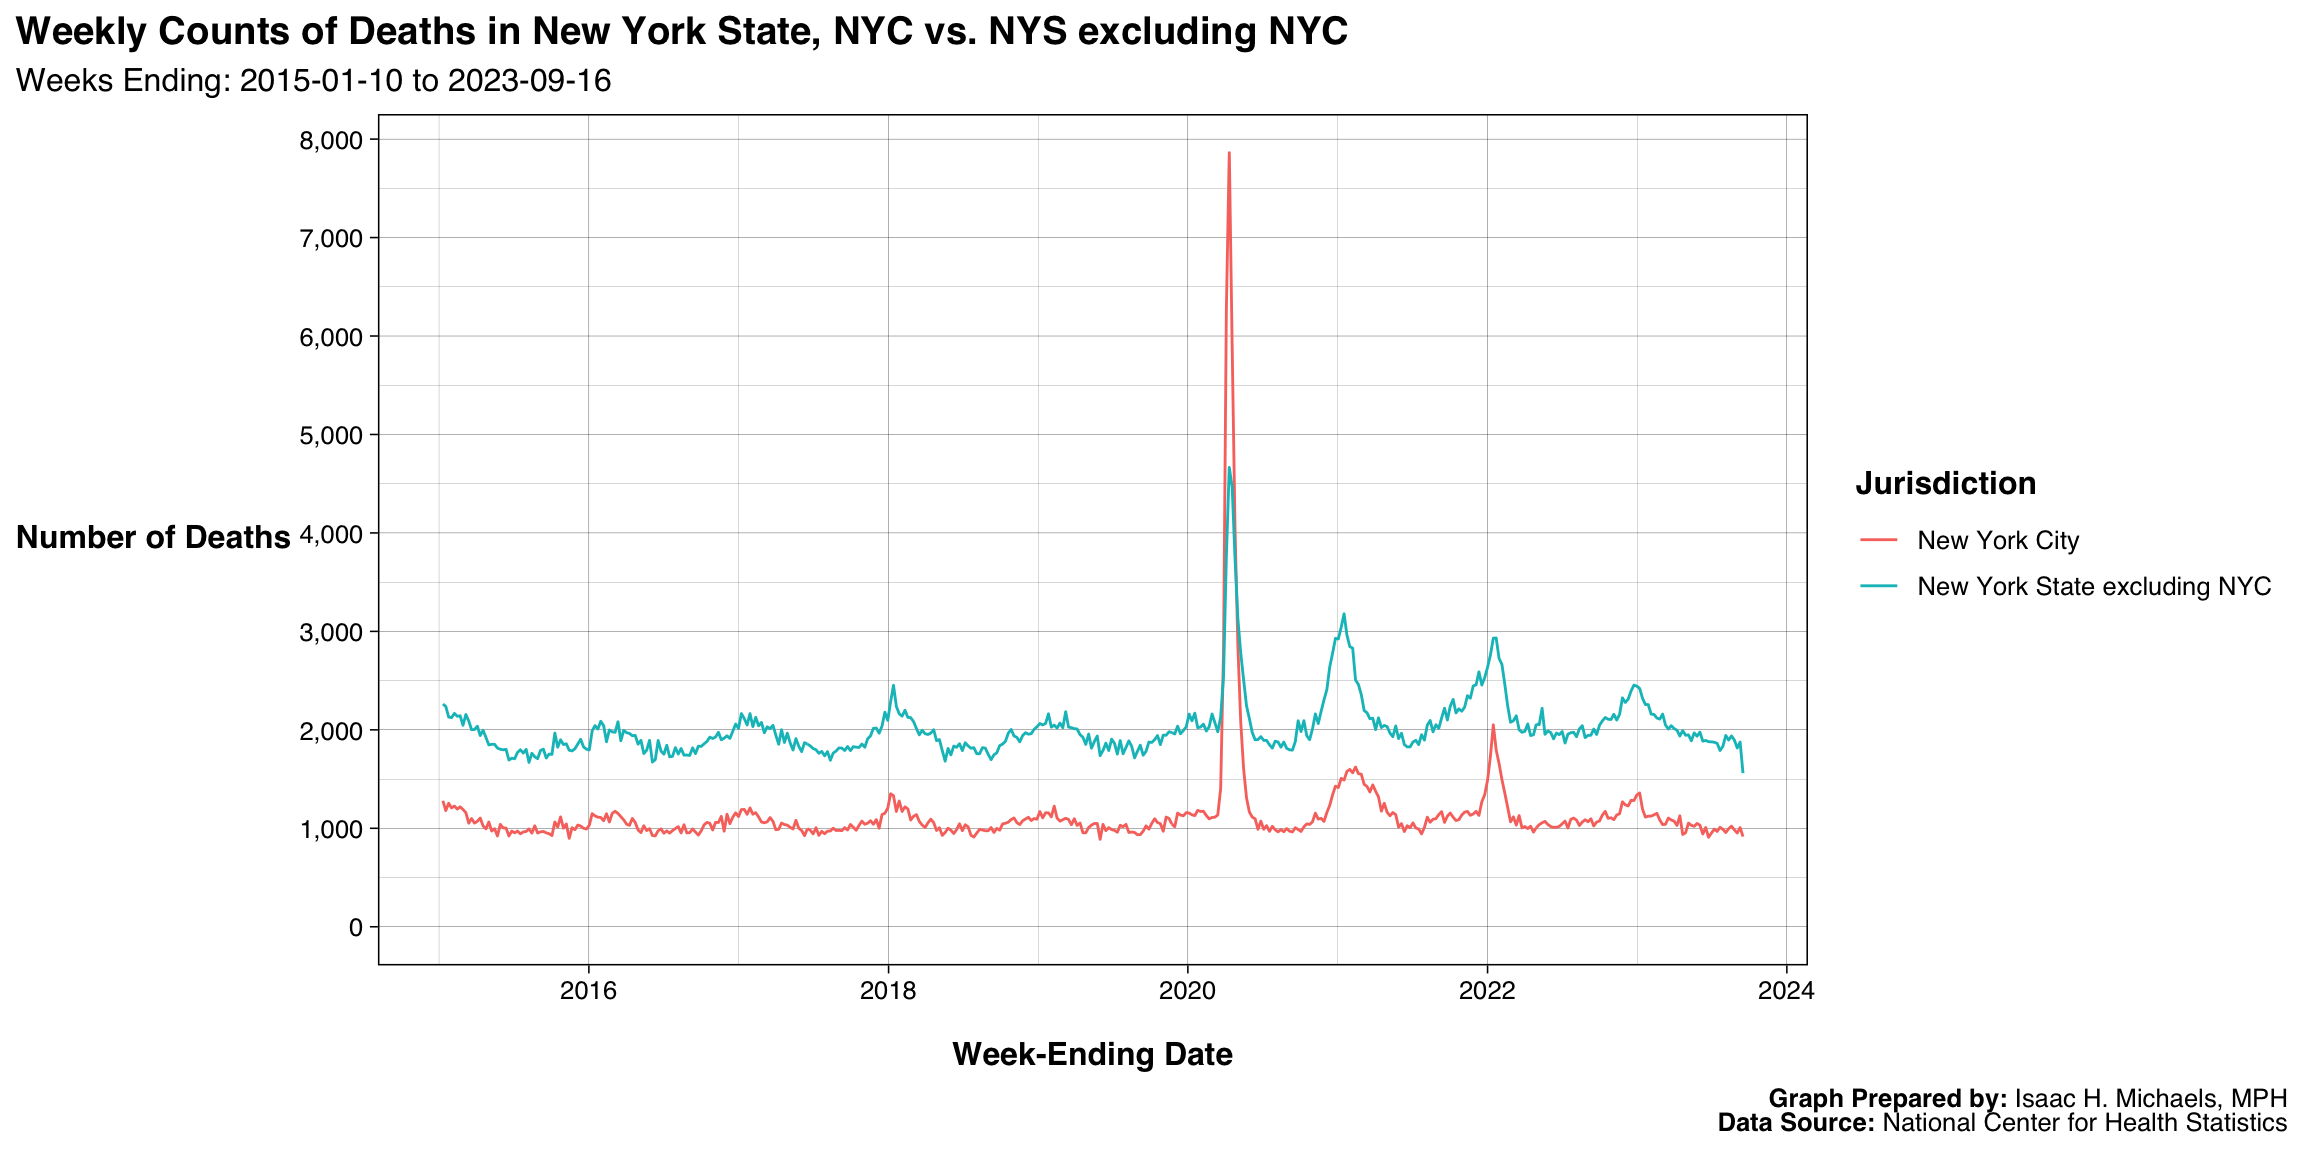 Graphs Prepared By: Isaac H. Michaels, MPH
Data Source: National Center for Health Statistics
By Age Group
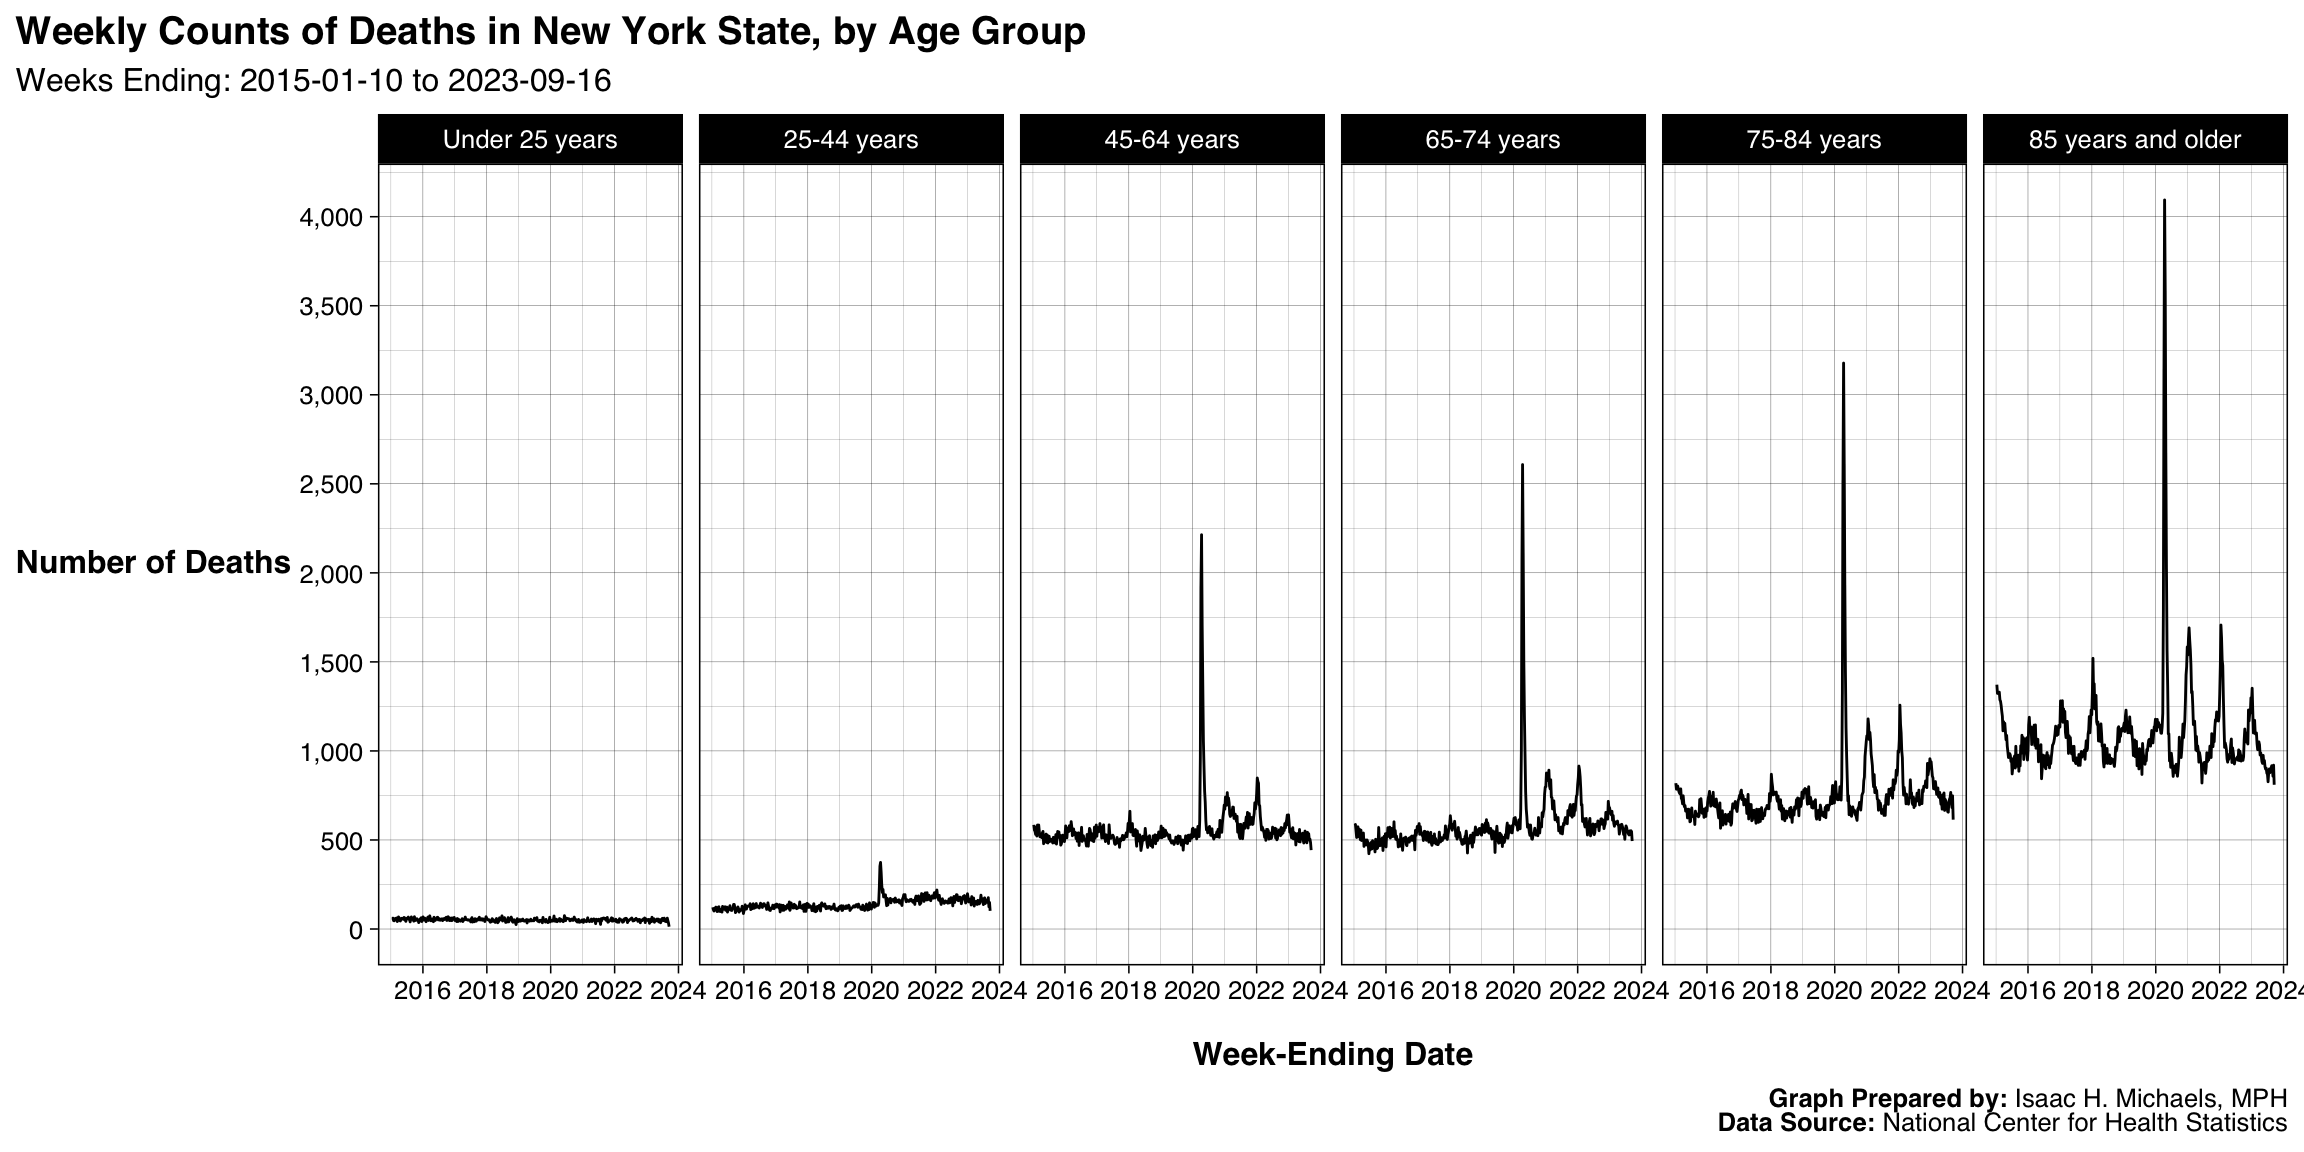 Graphs Prepared By: Isaac H. Michaels, MPH
Data Source: National Center for Health Statistics
By Jurisdiction and Age Group
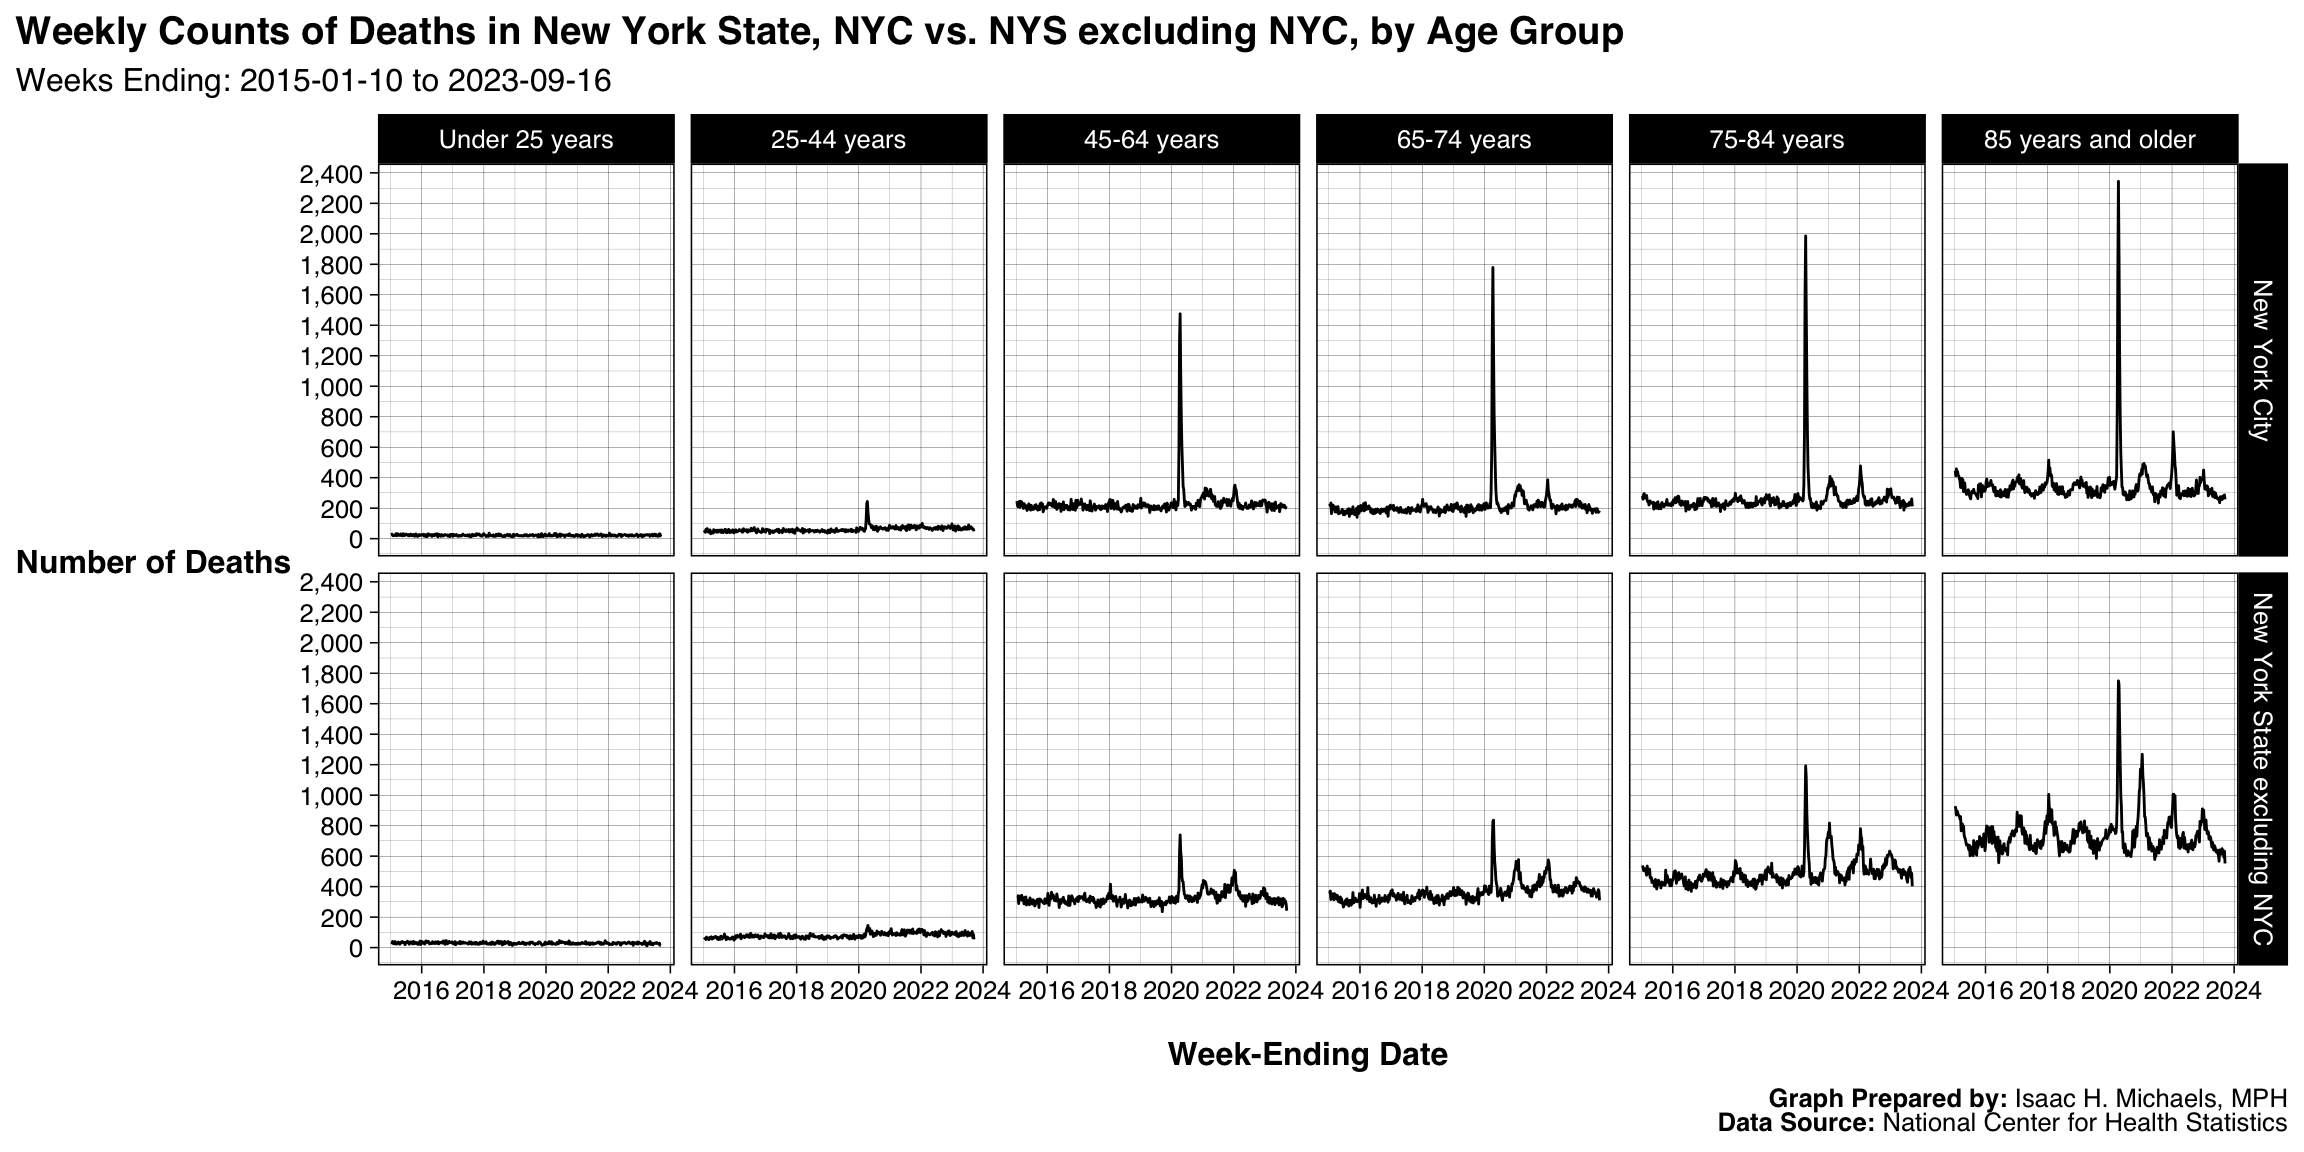 Graphs Prepared By: Isaac H. Michaels, MPH
Data Source: National Center for Health Statistics
Bar Graphs
By Year
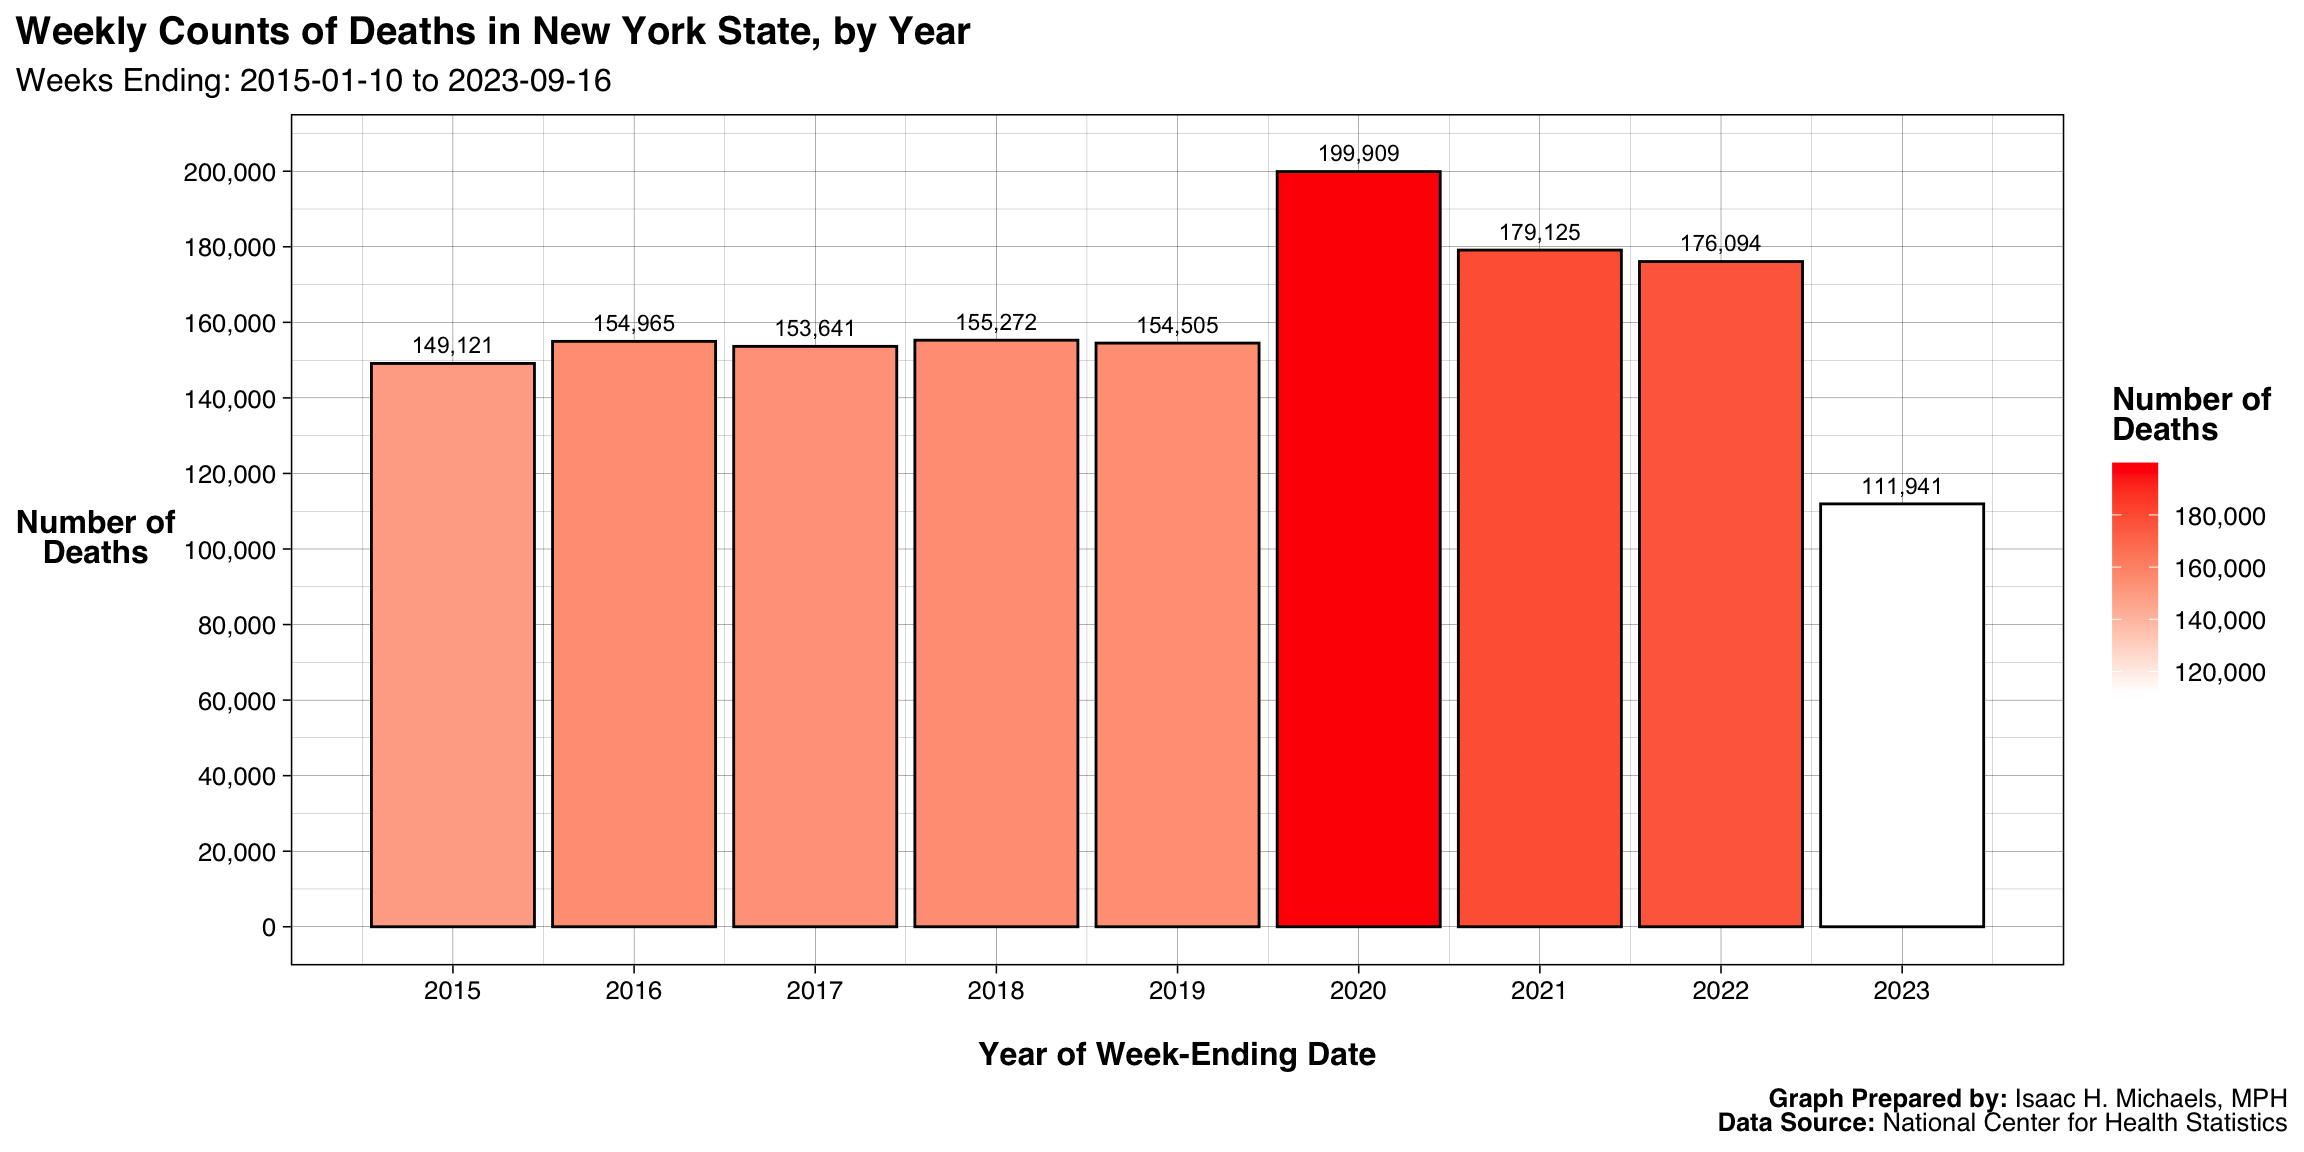 Graphs Prepared By: Isaac H. Michaels, MPH
Data Source: National Center for Health Statistics
Crosstabs
By Age Group and Year
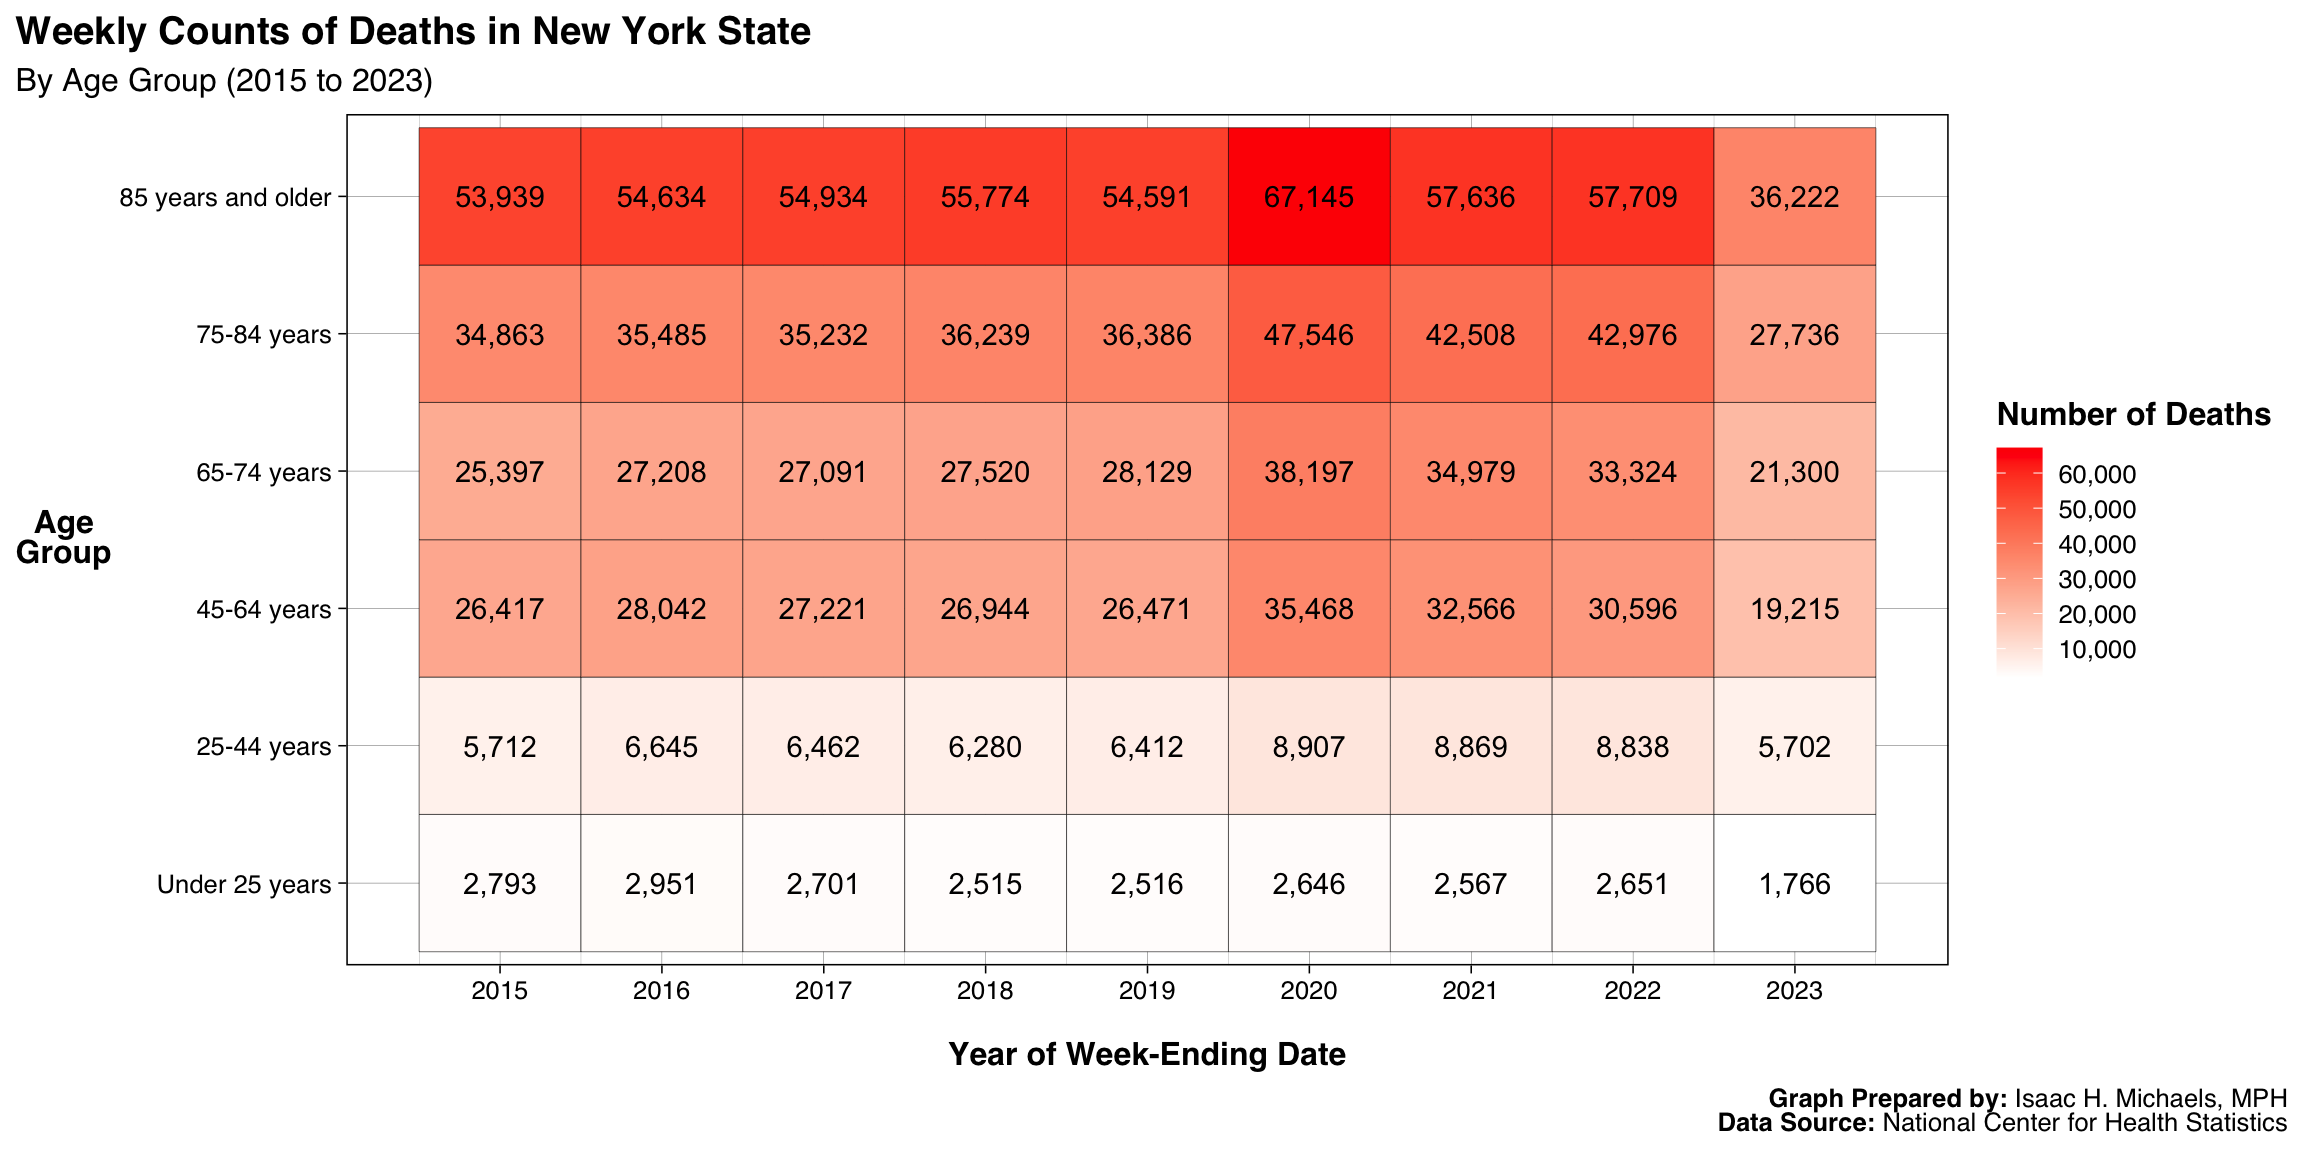 Graphs Prepared By: Isaac H. Michaels, MPH
Data Source: National Center for Health Statistics
By Age Group, Year, and Jurisdiction
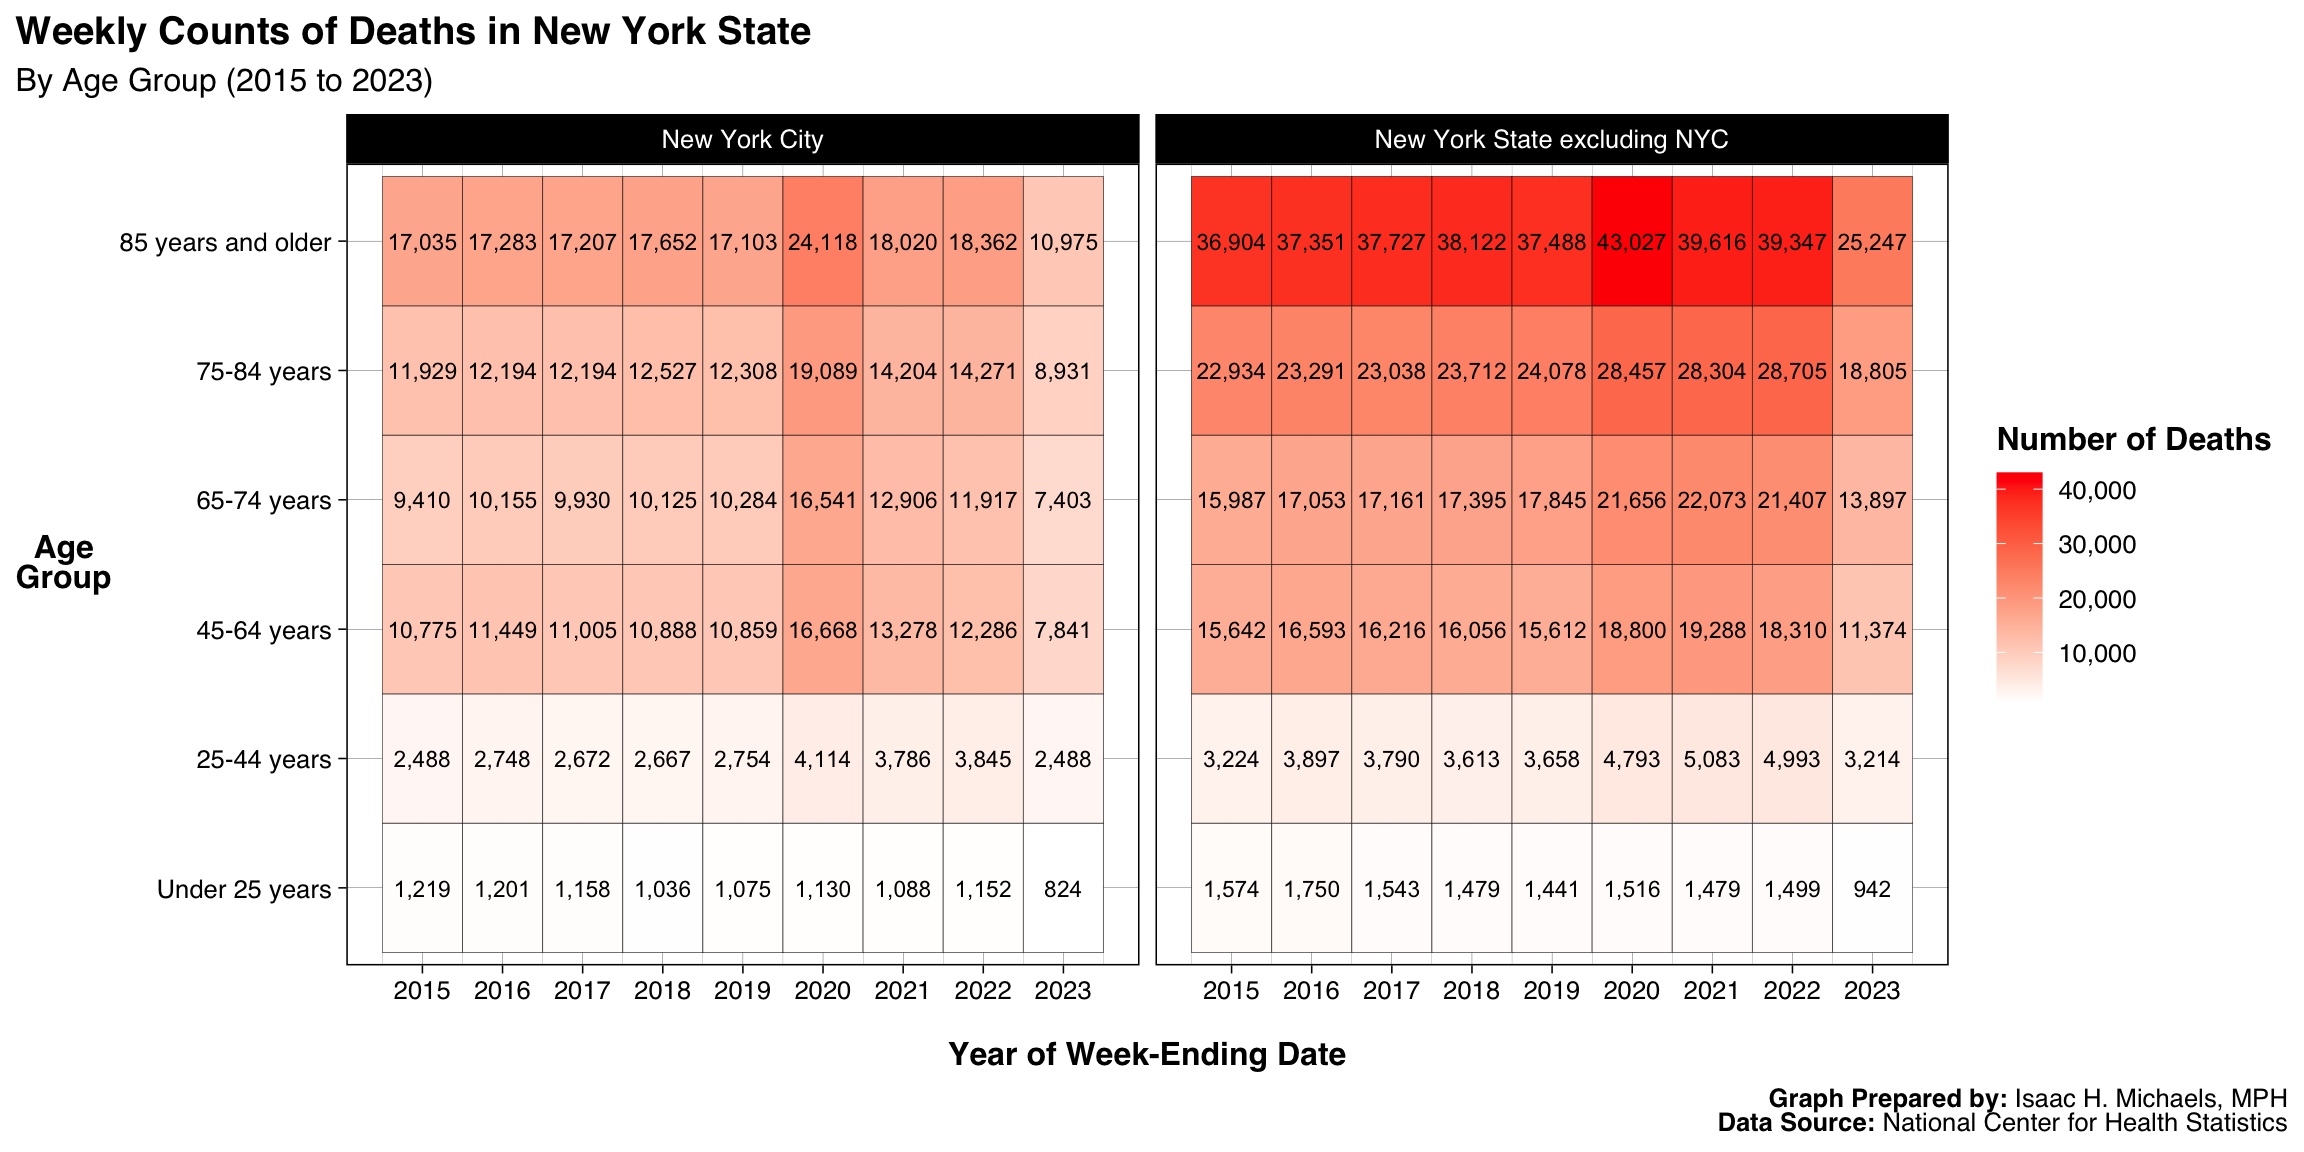 Graphs Prepared By: Isaac H. Michaels, MPH
Data Source: National Center for Health Statistics
By Year and Month
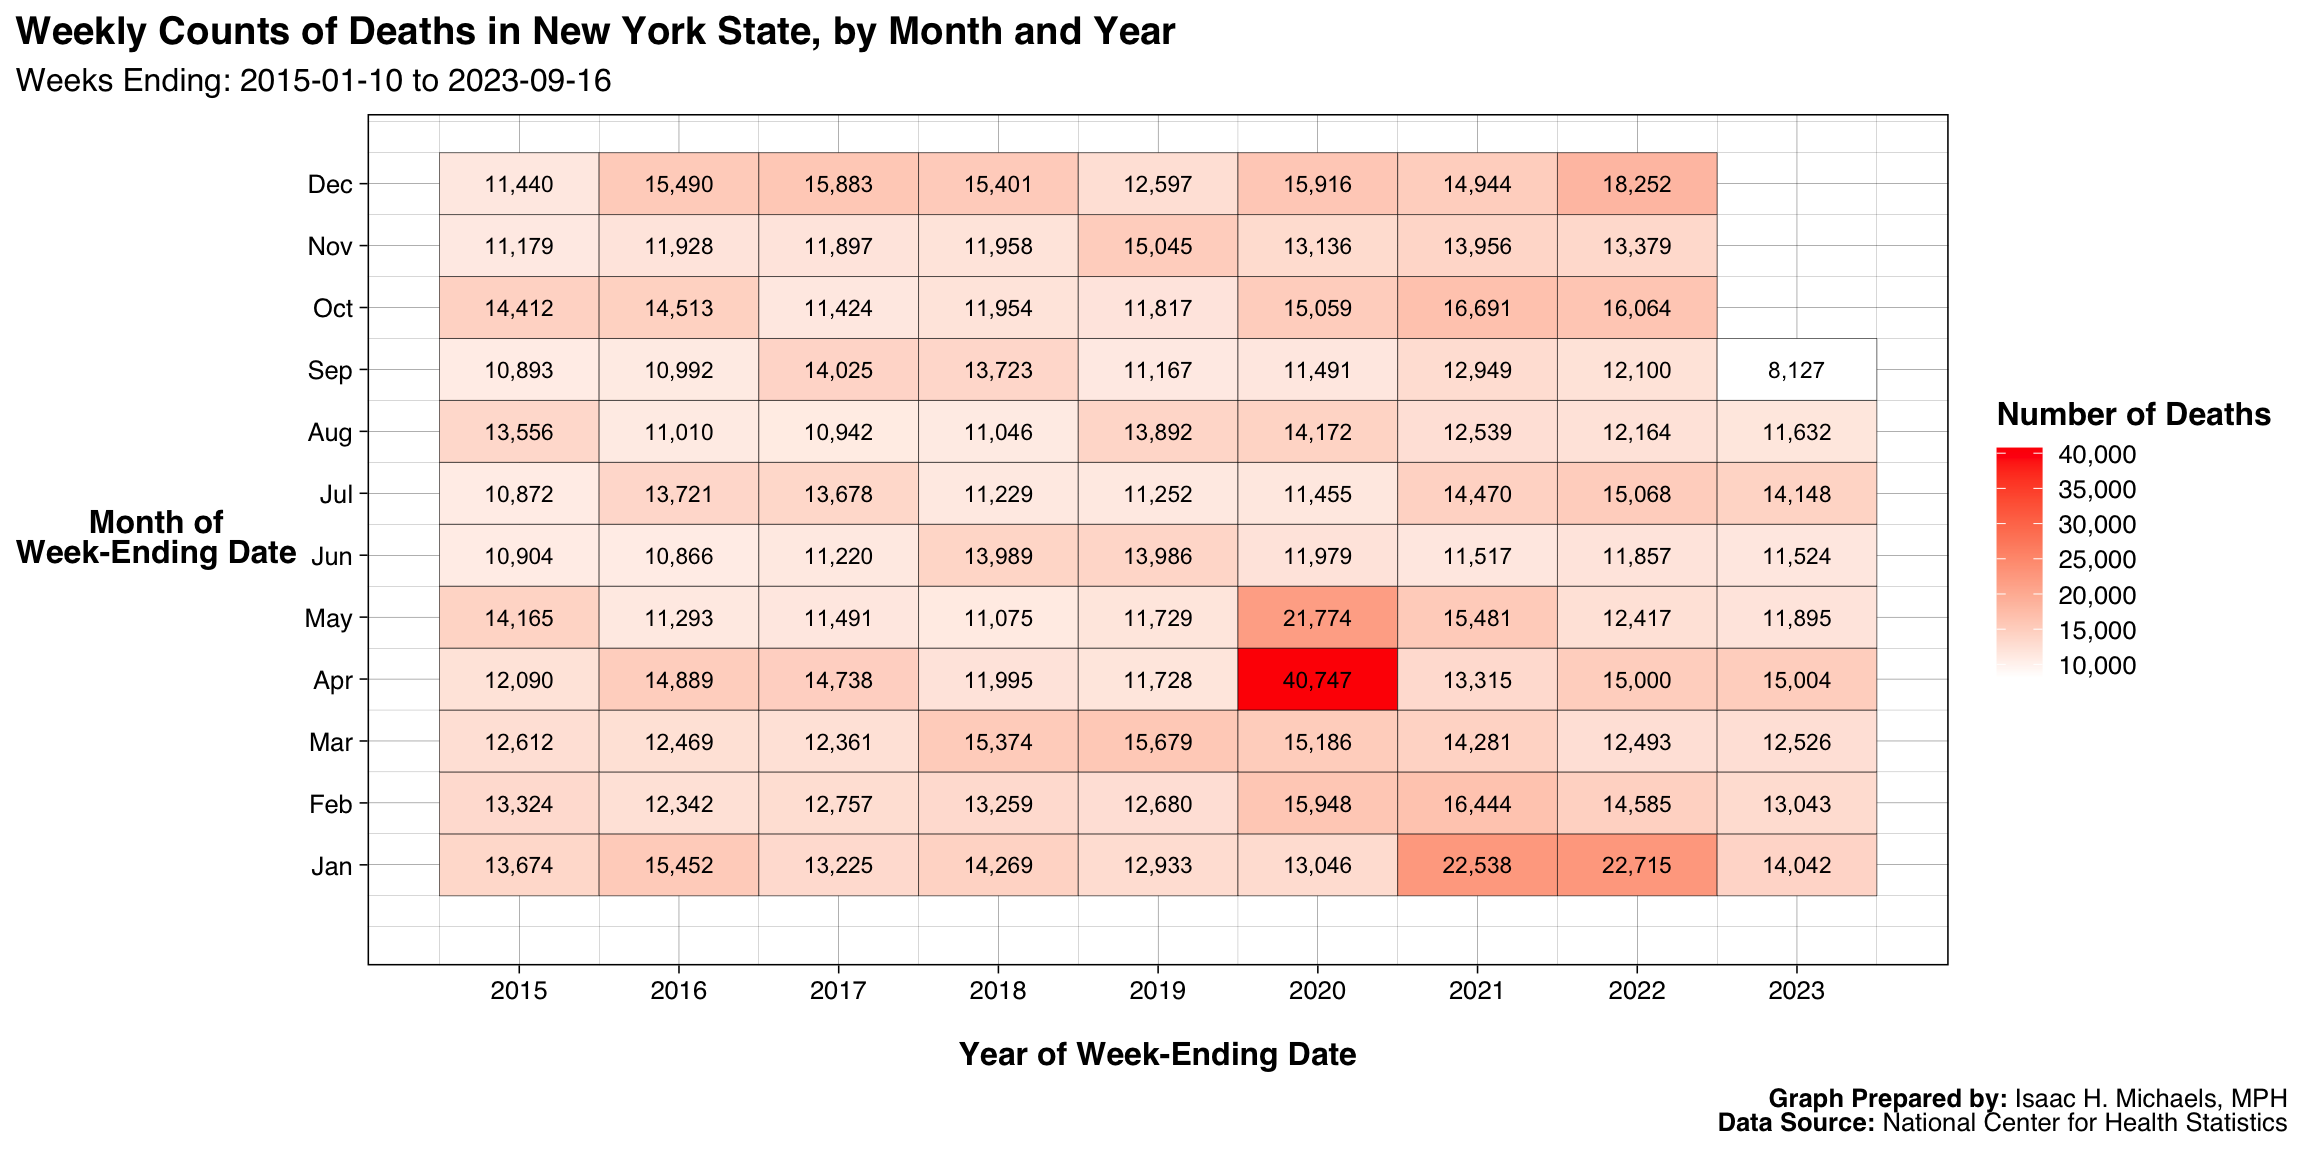 Graphs Prepared By: Isaac H. Michaels, MPH
Data Source: National Center for Health Statistics
By Year, Month, and Jurisdiction
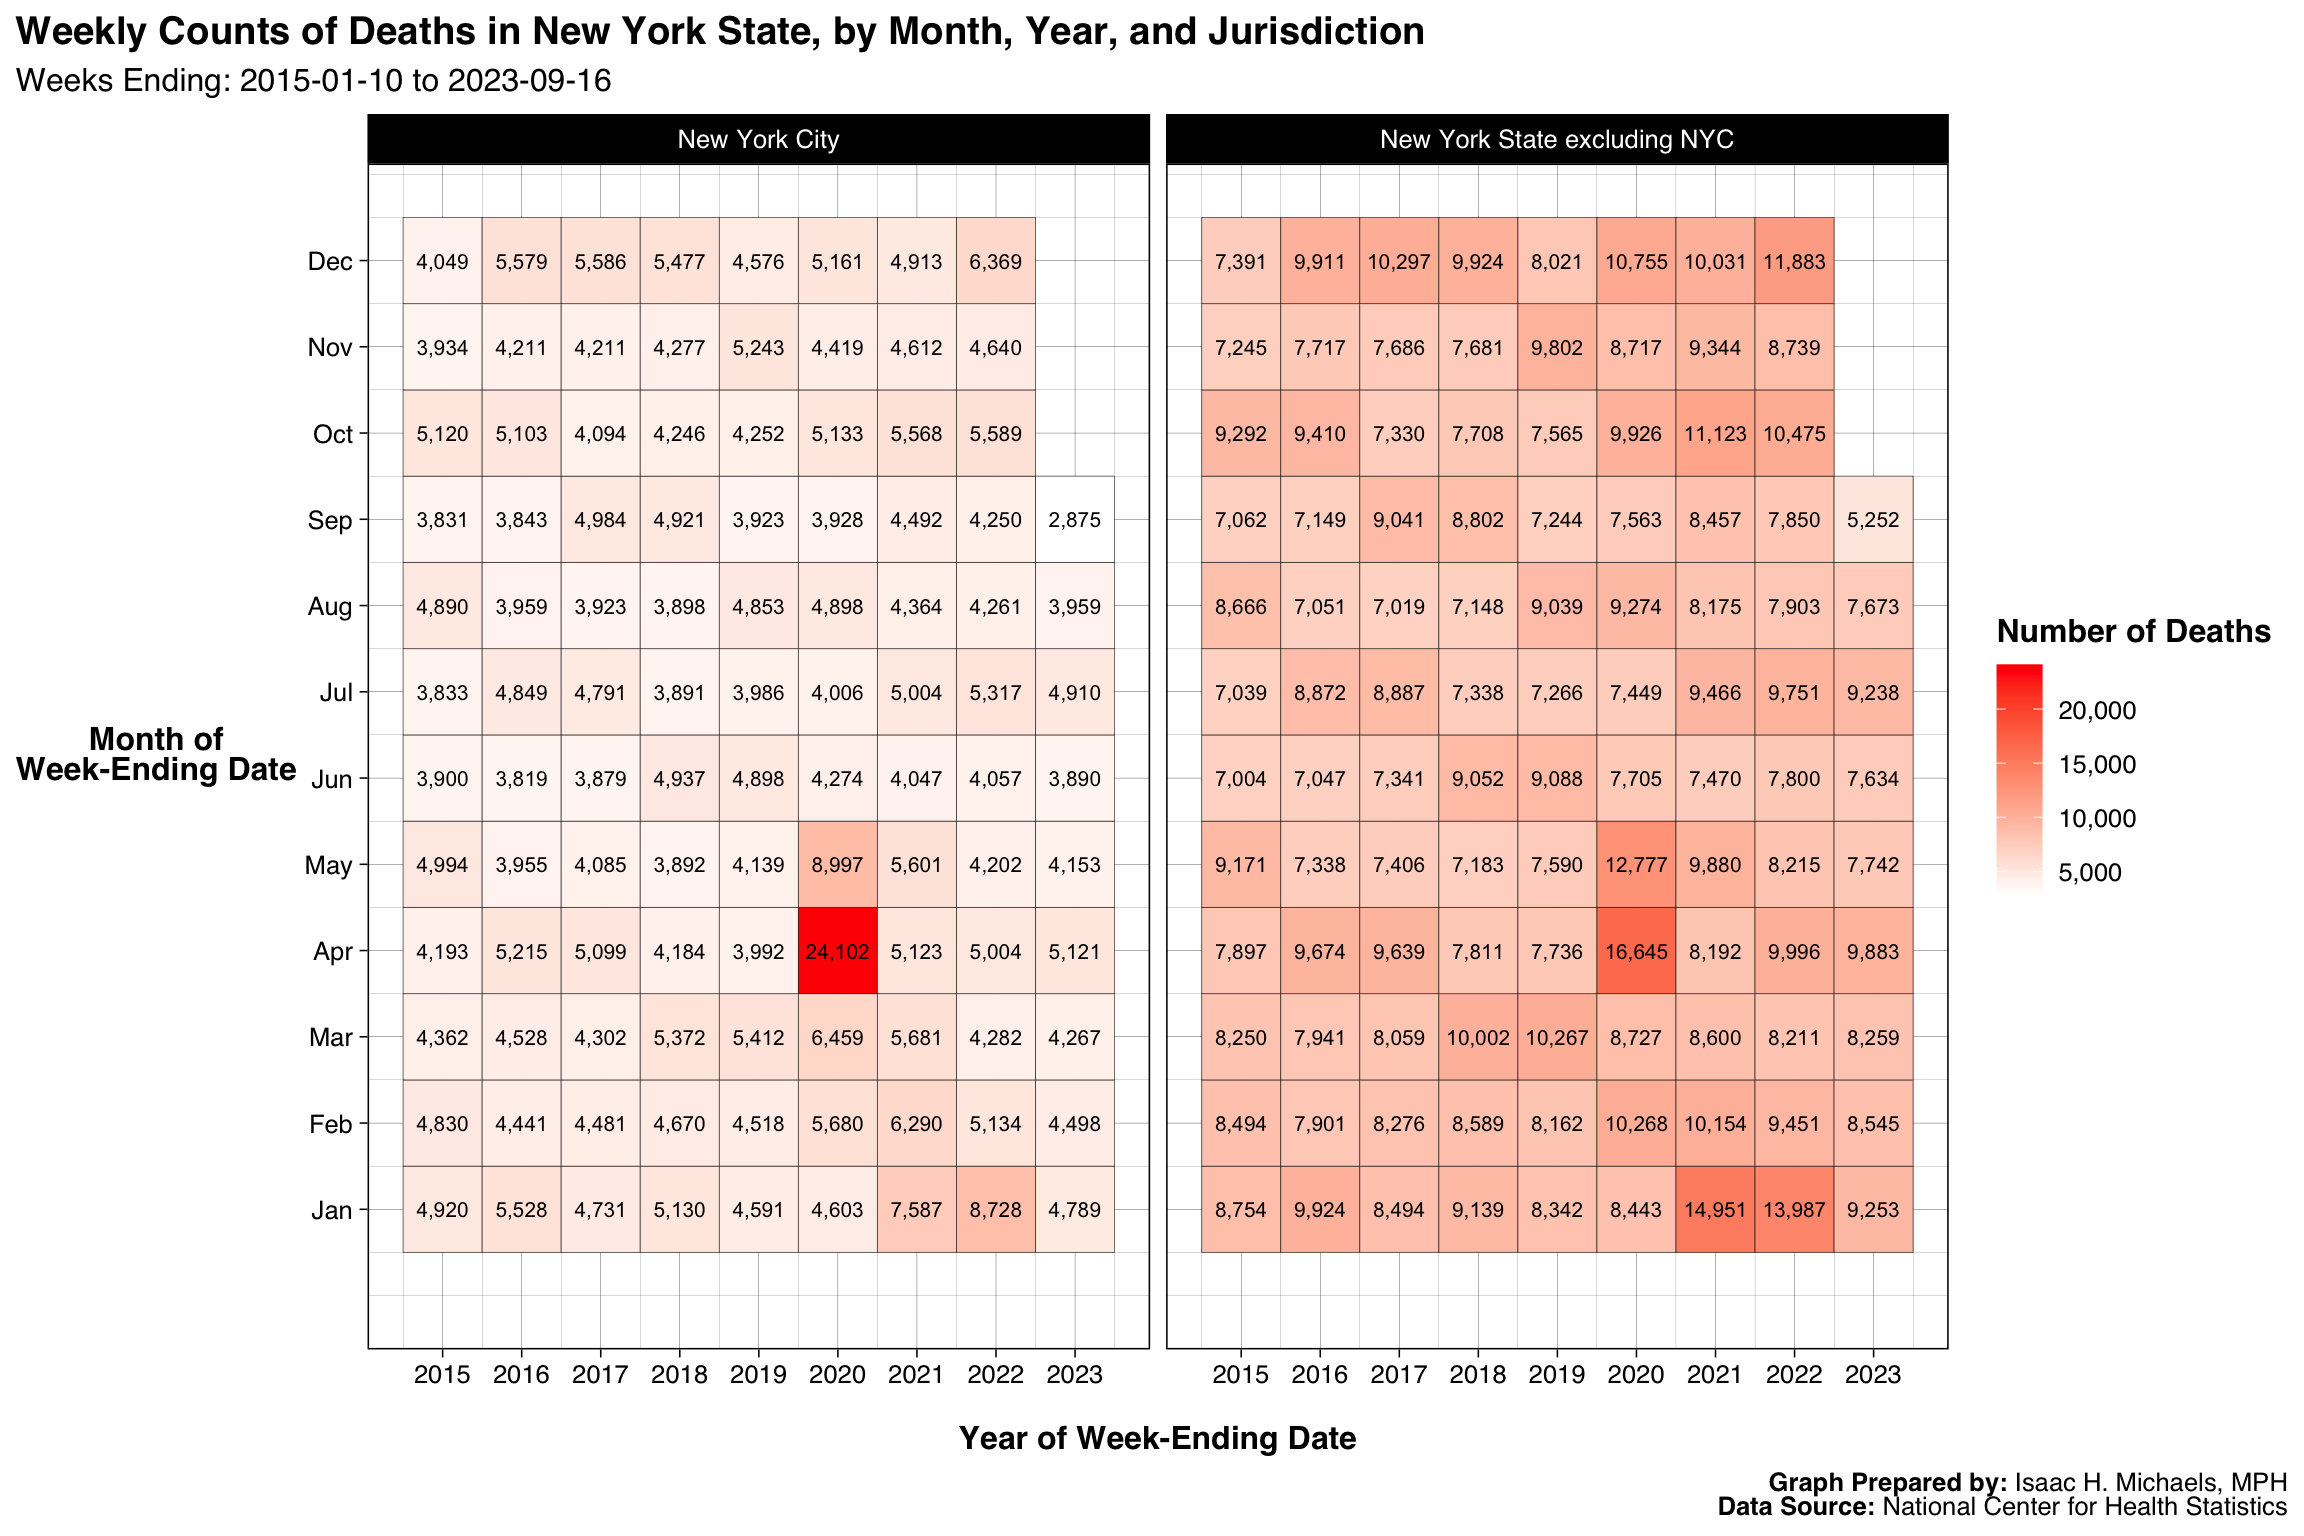 Graphs Prepared By: Isaac H. Michaels, MPH
Data Source: National Center for Health Statistics
By Year, Month, and Age Group
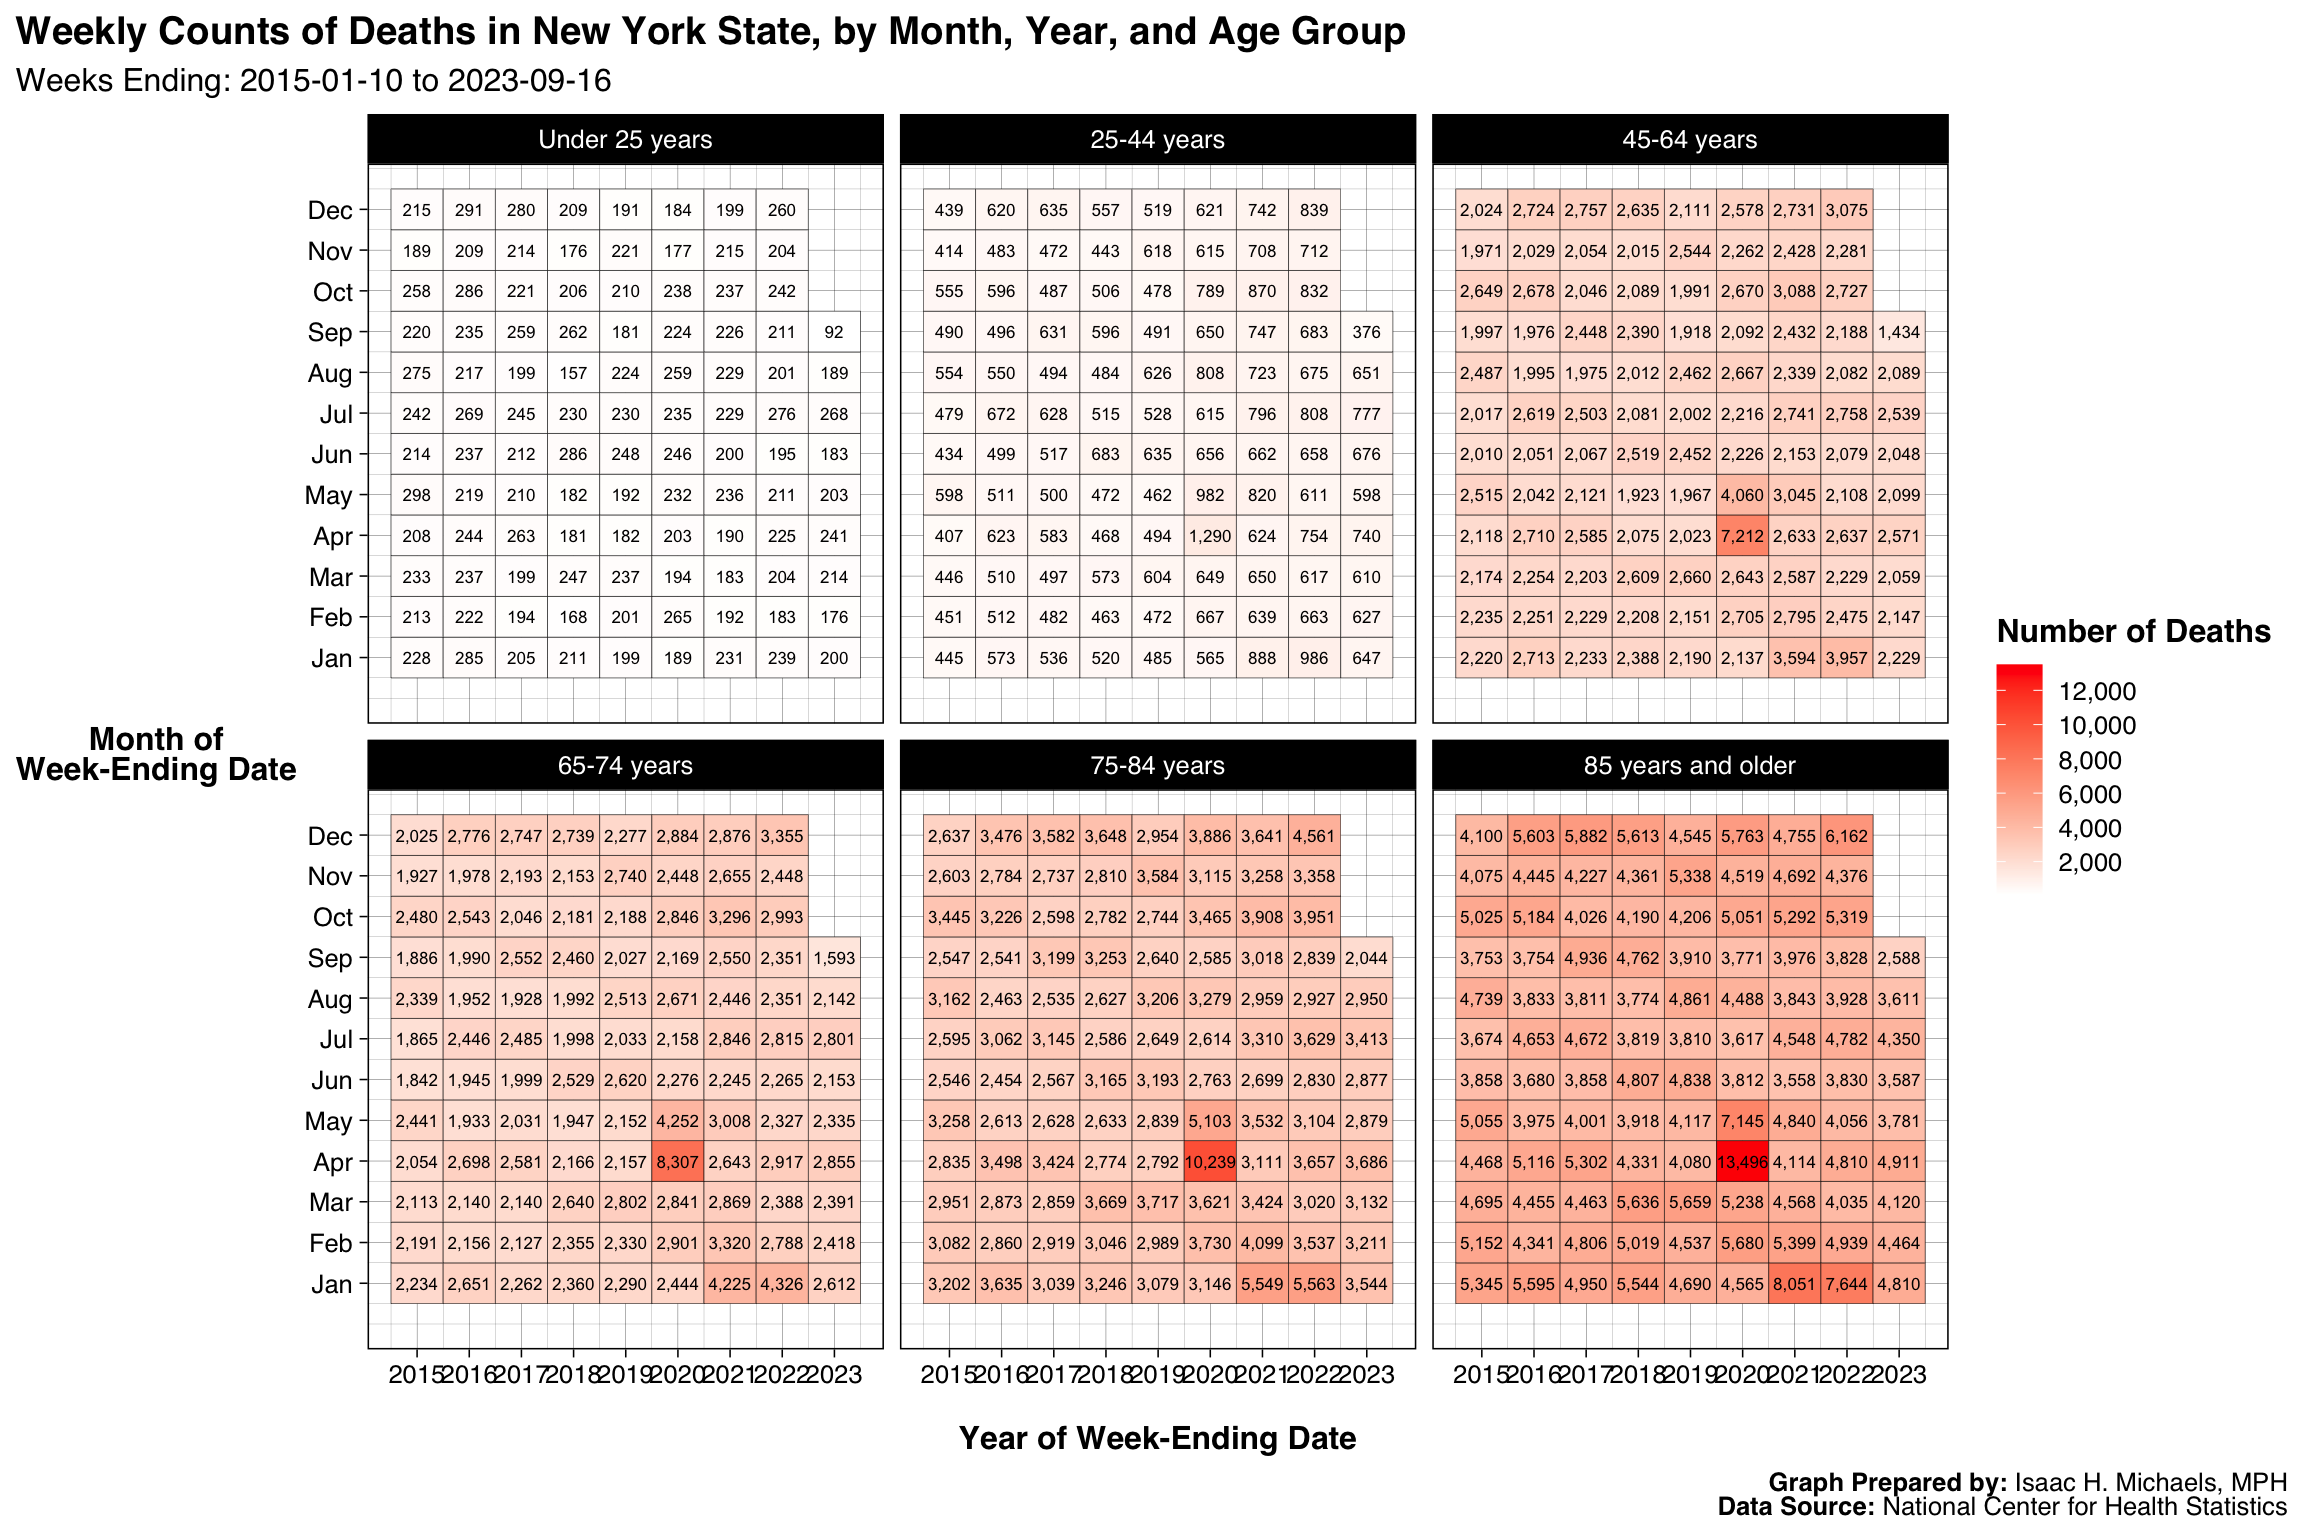 Graphs Prepared By: Isaac H. Michaels, MPH
Data Source: National Center for Health Statistics
Annual Trends
Death Counts
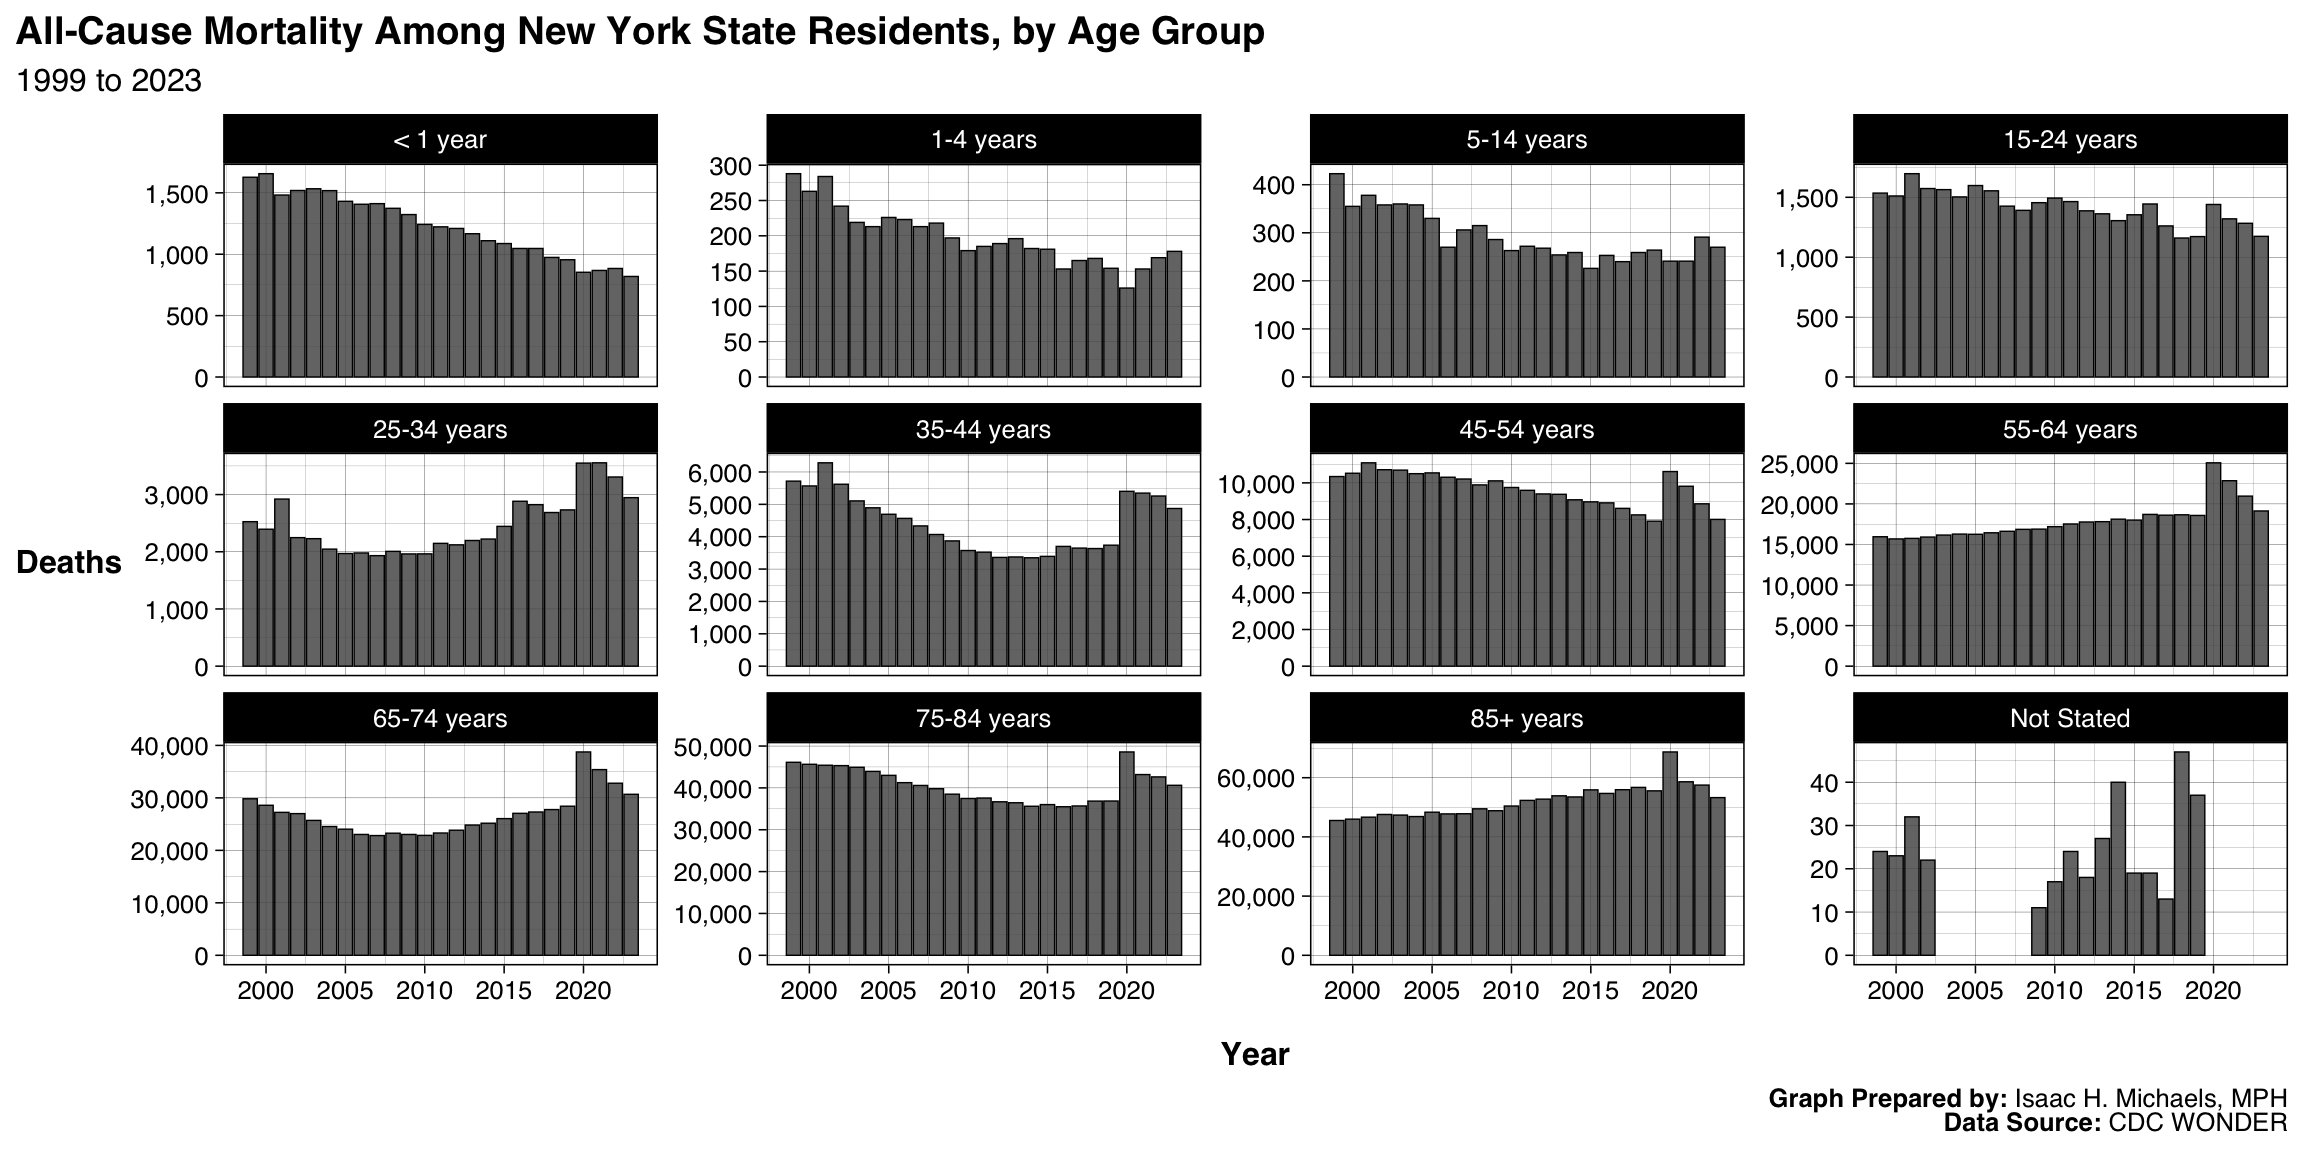
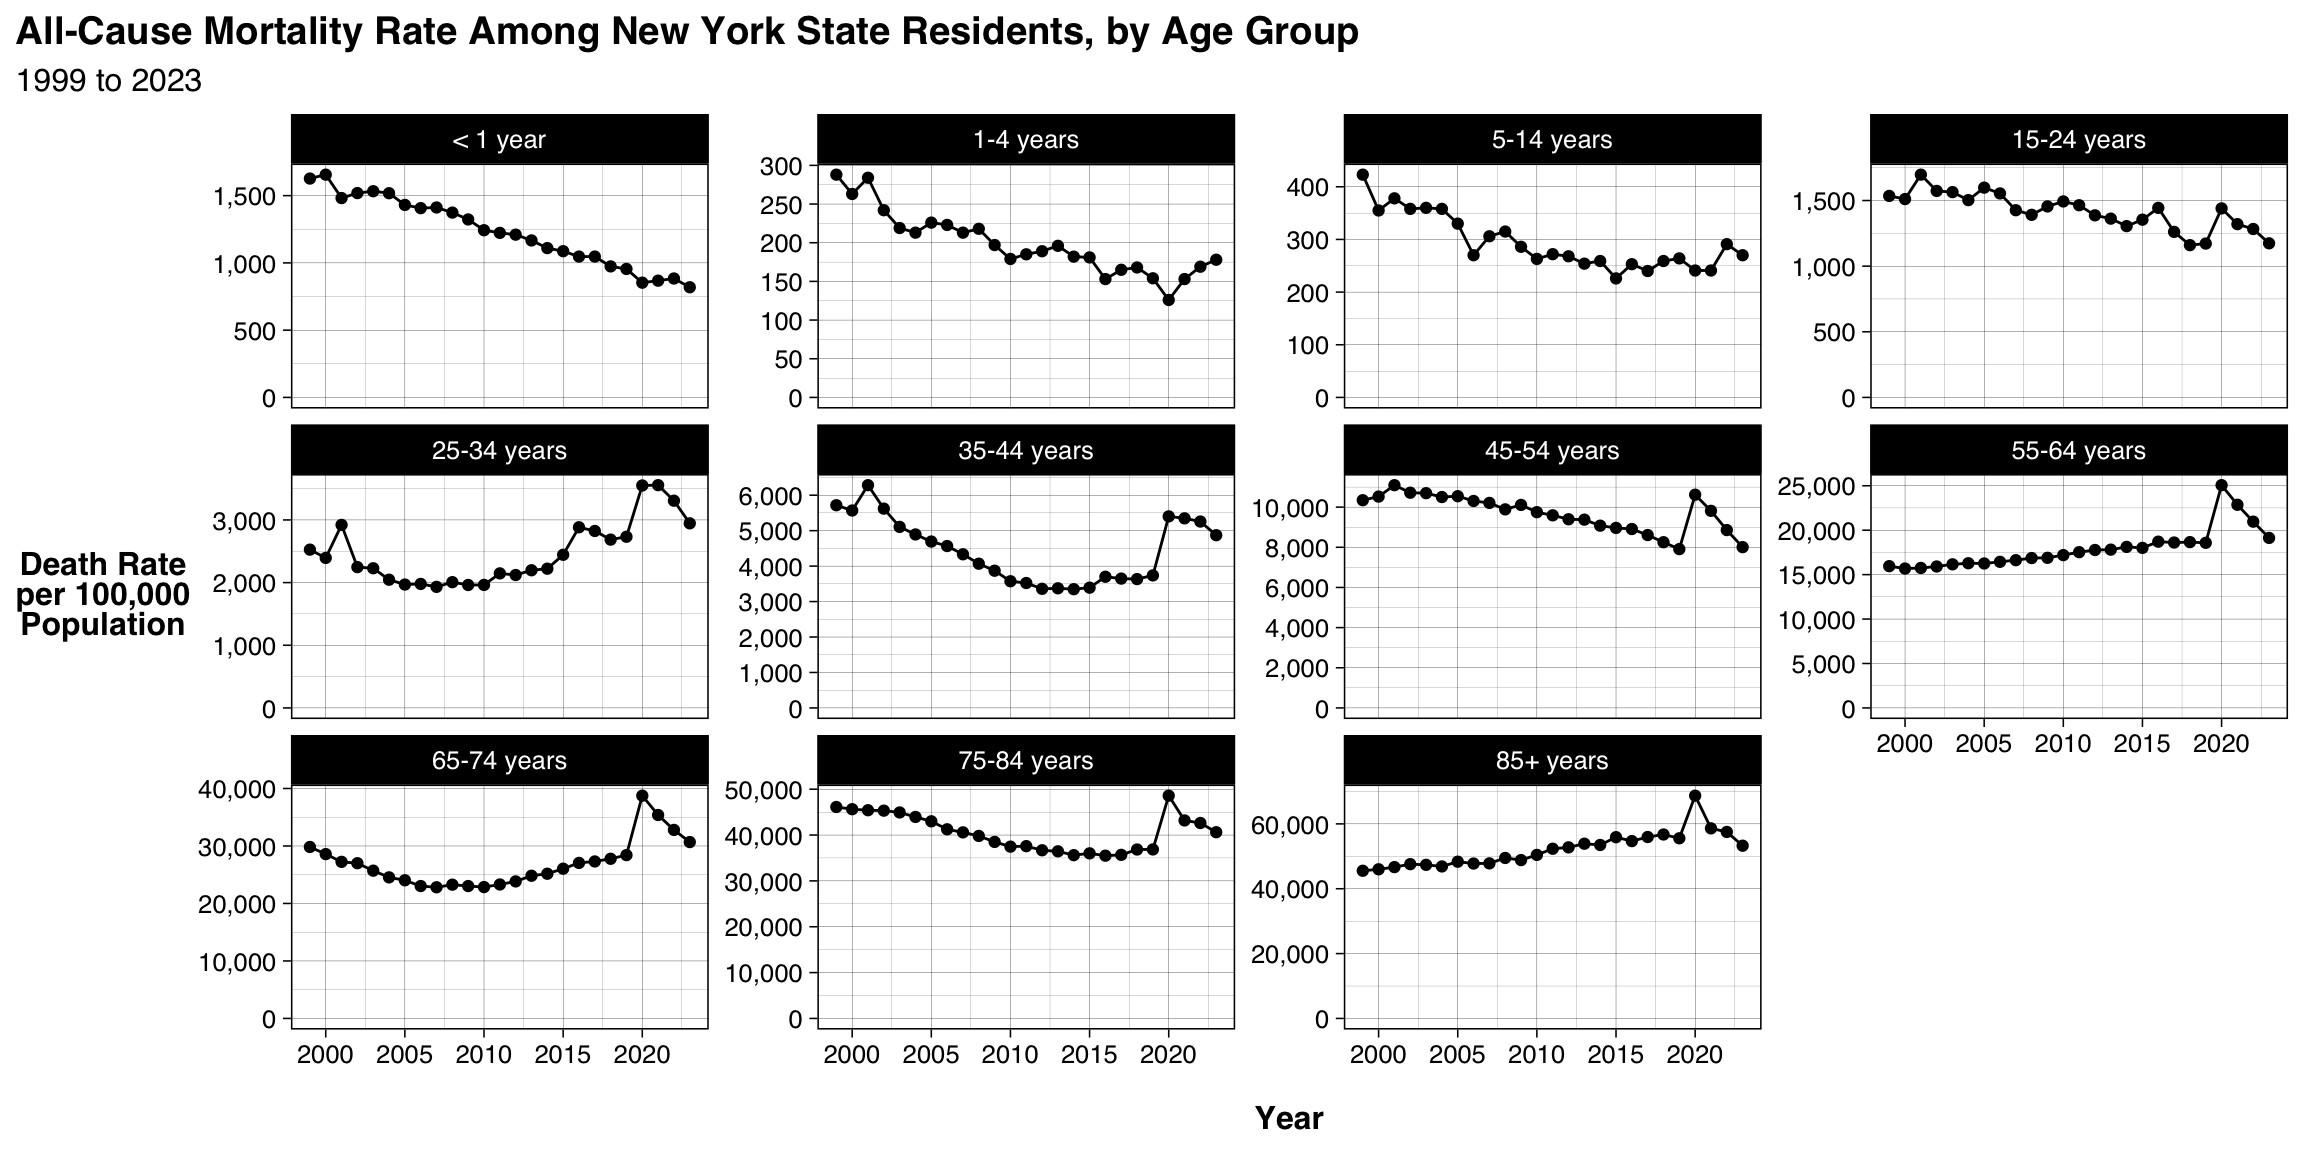
By Year and Age Group
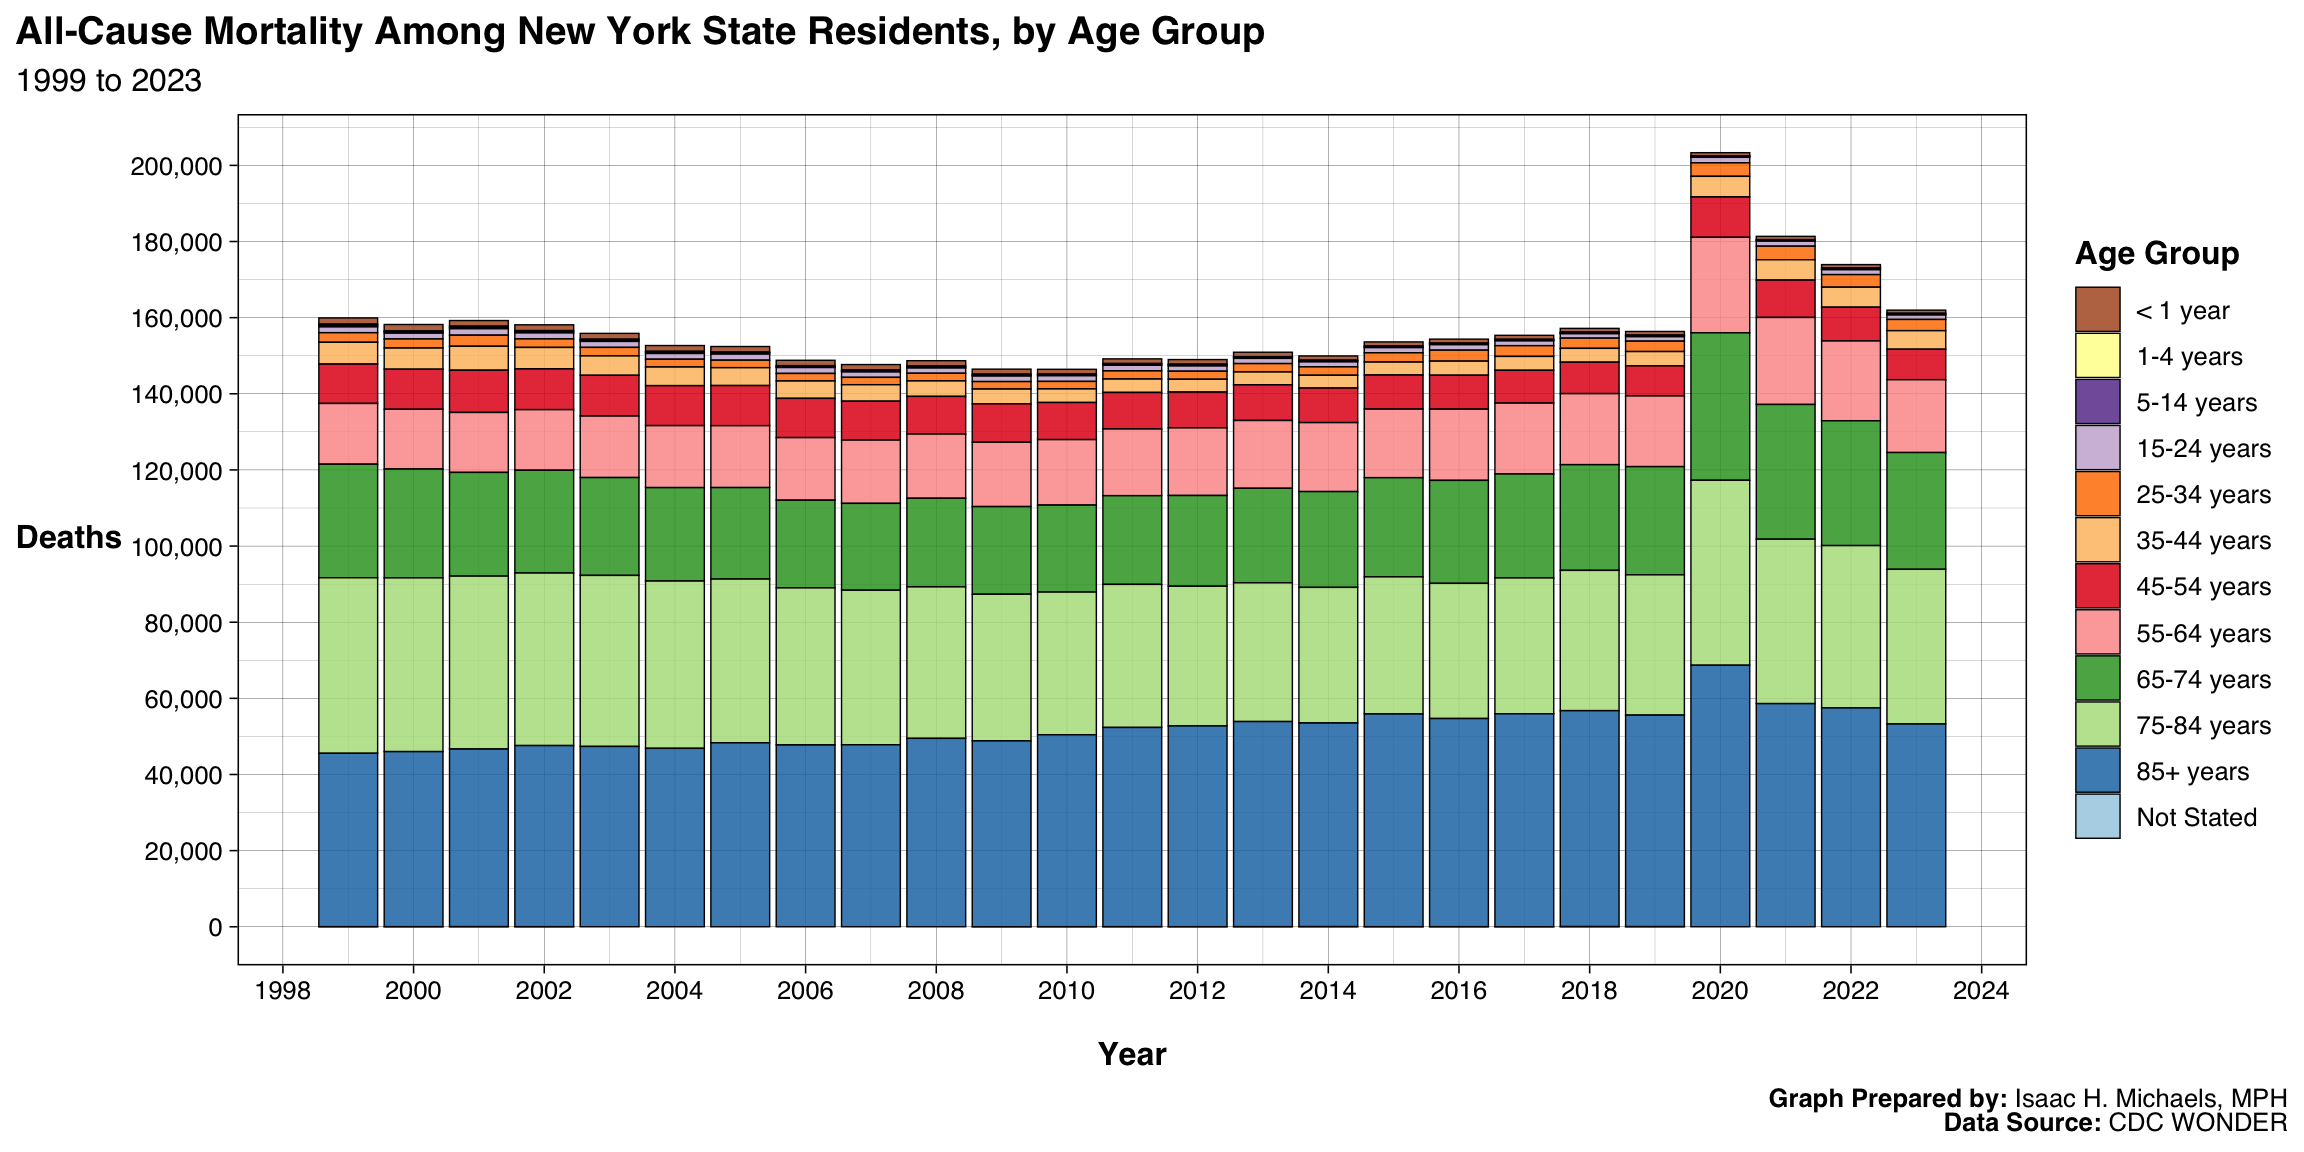 Graphs Prepared By: Isaac H. Michaels, MPH
Data Source: CDC WONDER
 Graphs Prepared By: Isaac H. Michaels, MPH
Data Source: CDC WONDER
 Graphs Prepared By: