Published: August 8, 2019
Updated: September 02, 2024 at 03:43PM
Graph Prepared By: Isaac H. Michaels, MPH
Death Data Source: CDC WONDER
State Policy Data Source: www.statefirearmlaws.org
Published: August 8, 2019
Updated: September 02, 2024 at 03:43PM
Graph Prepared By: Isaac H. Michaels, MPH
Death Data Source: CDC WONDER
State Policy Data Source: www.statefirearmlaws.org
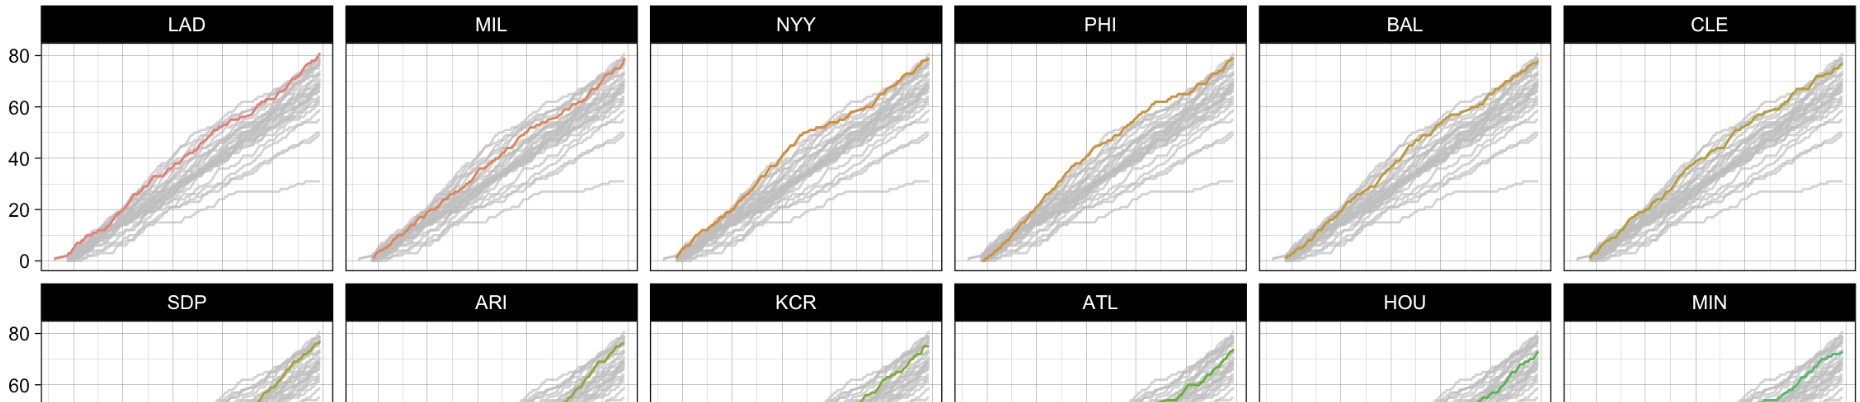
Explore my detailed MLB season insights through interactive visualizations and data tables. I’ve included animations of cumulative wins, trend graphs, scatter plots of runs scored vs. runs allowed, and bar graphs of run differentials. Updated daily during baseball season, this page provides a compre…
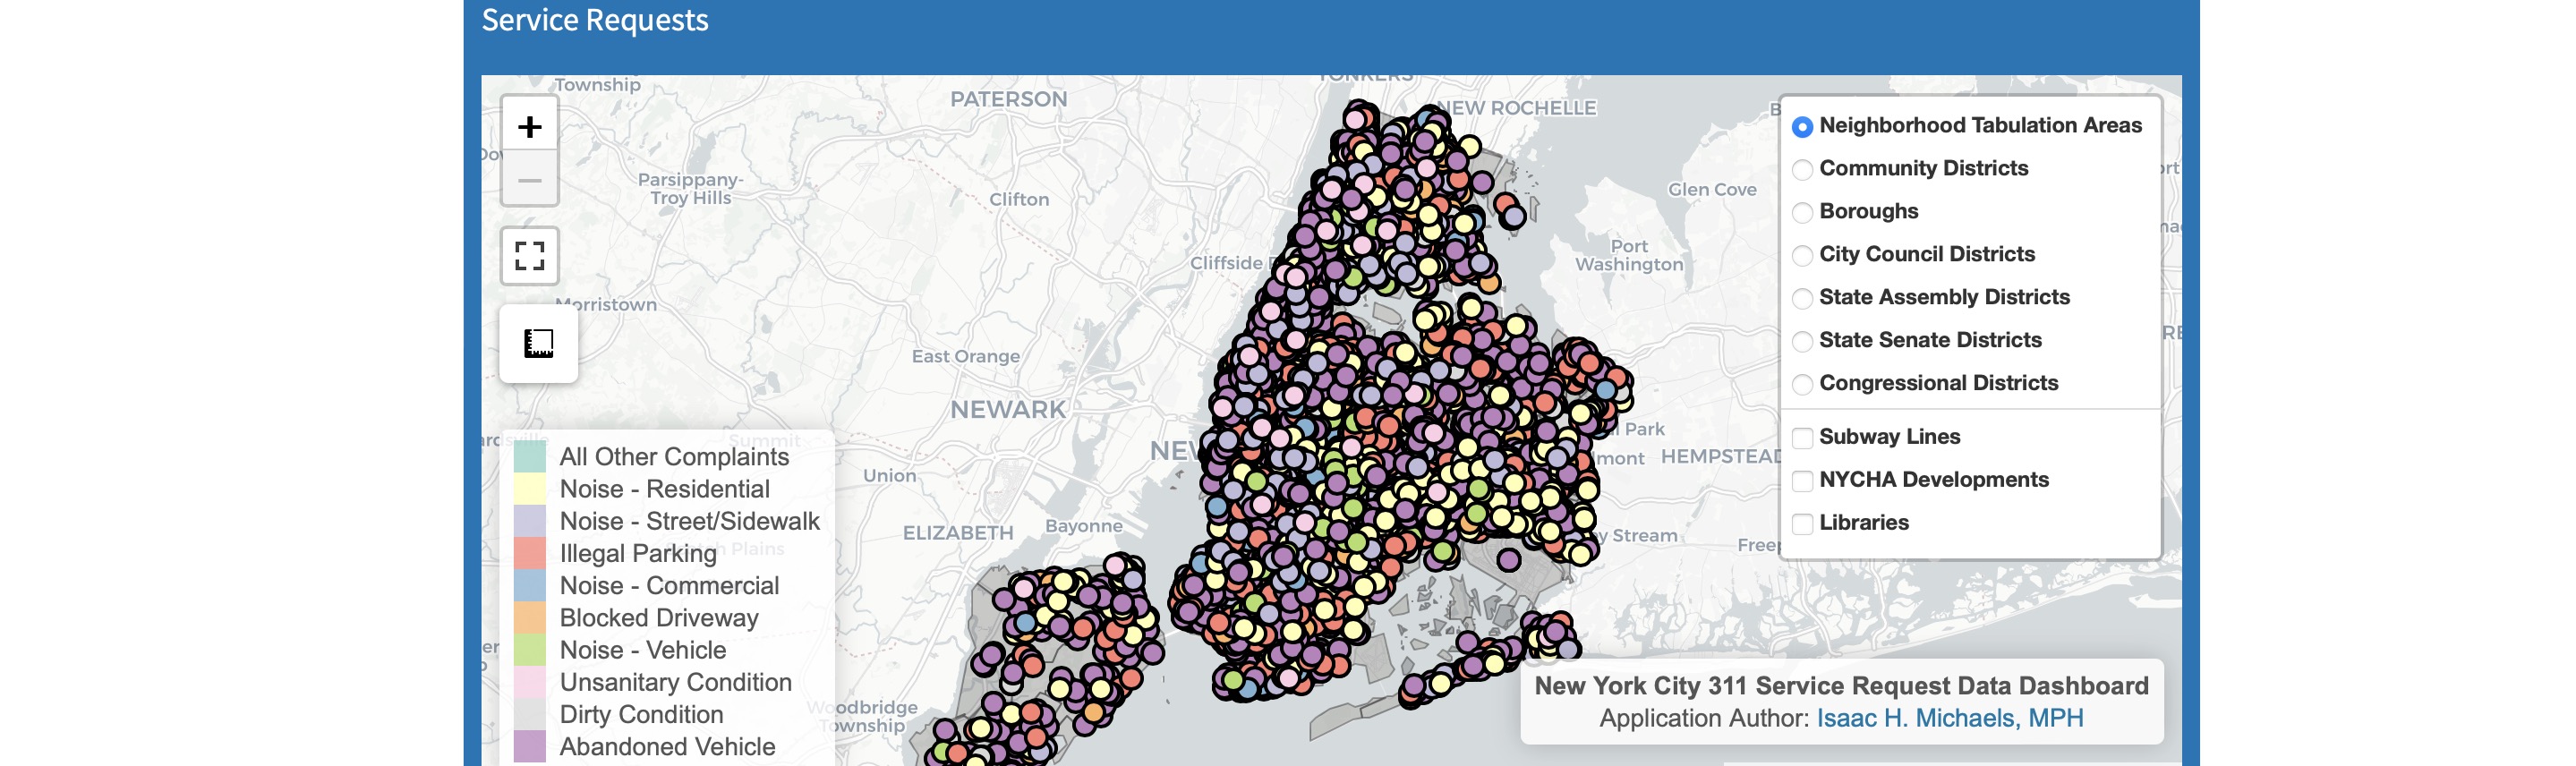
Explore the New York City 311 Service Request Data Dashboard, an interactive GIS tool that visualizes social determinants of health using 311 service requests across NYC. Developed by Isaac H. Michaels, DrPH, the dashboard provides spatial analysis of complaint types, dynamic frequency updates, and …
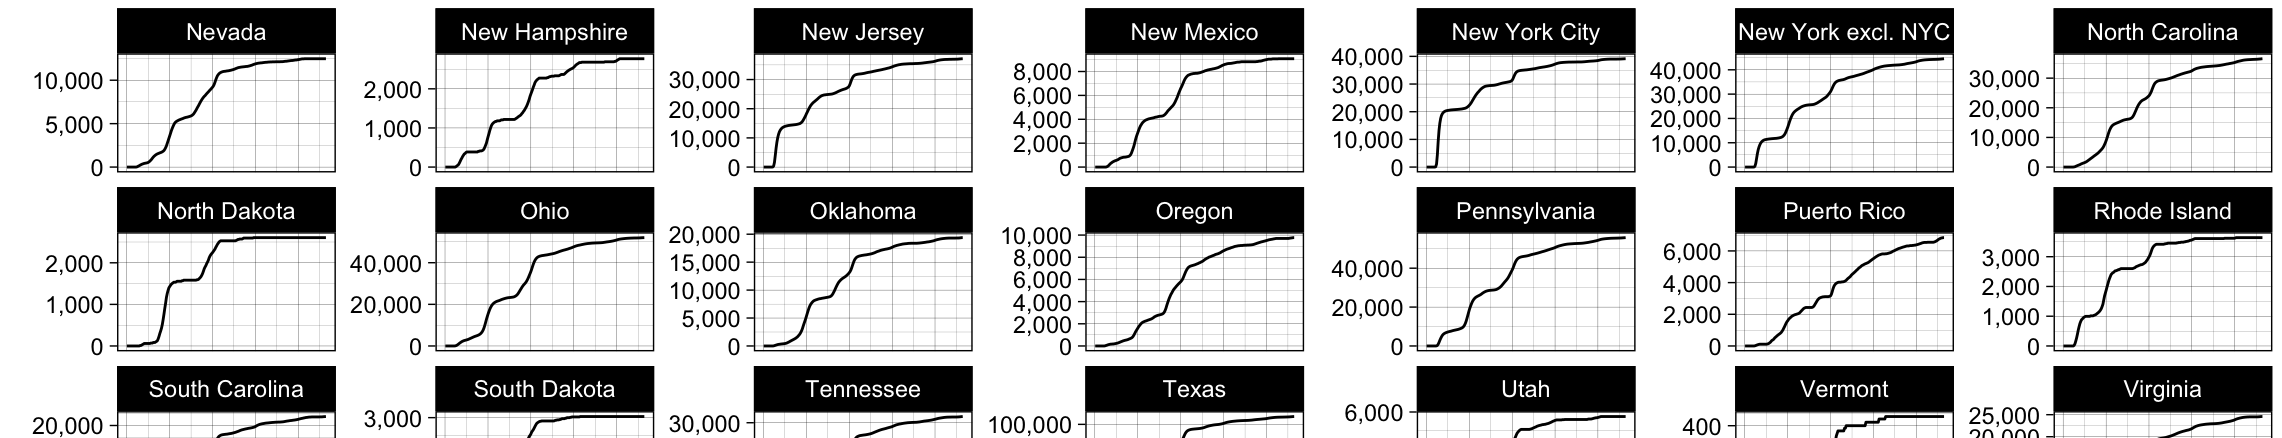
Published: March 25, 2020 Updated: September 16, 2025 at 08:56PM Welcome Welcome to this web page, which presents analyses of data on COVID-19 in the United States. I believe that data are an essential component of any public health response. The data on this page are obtained from the data.cdc.gov …