Published: January 5, 2020
Updated: April 15, 2025 at 05:36PM
Background
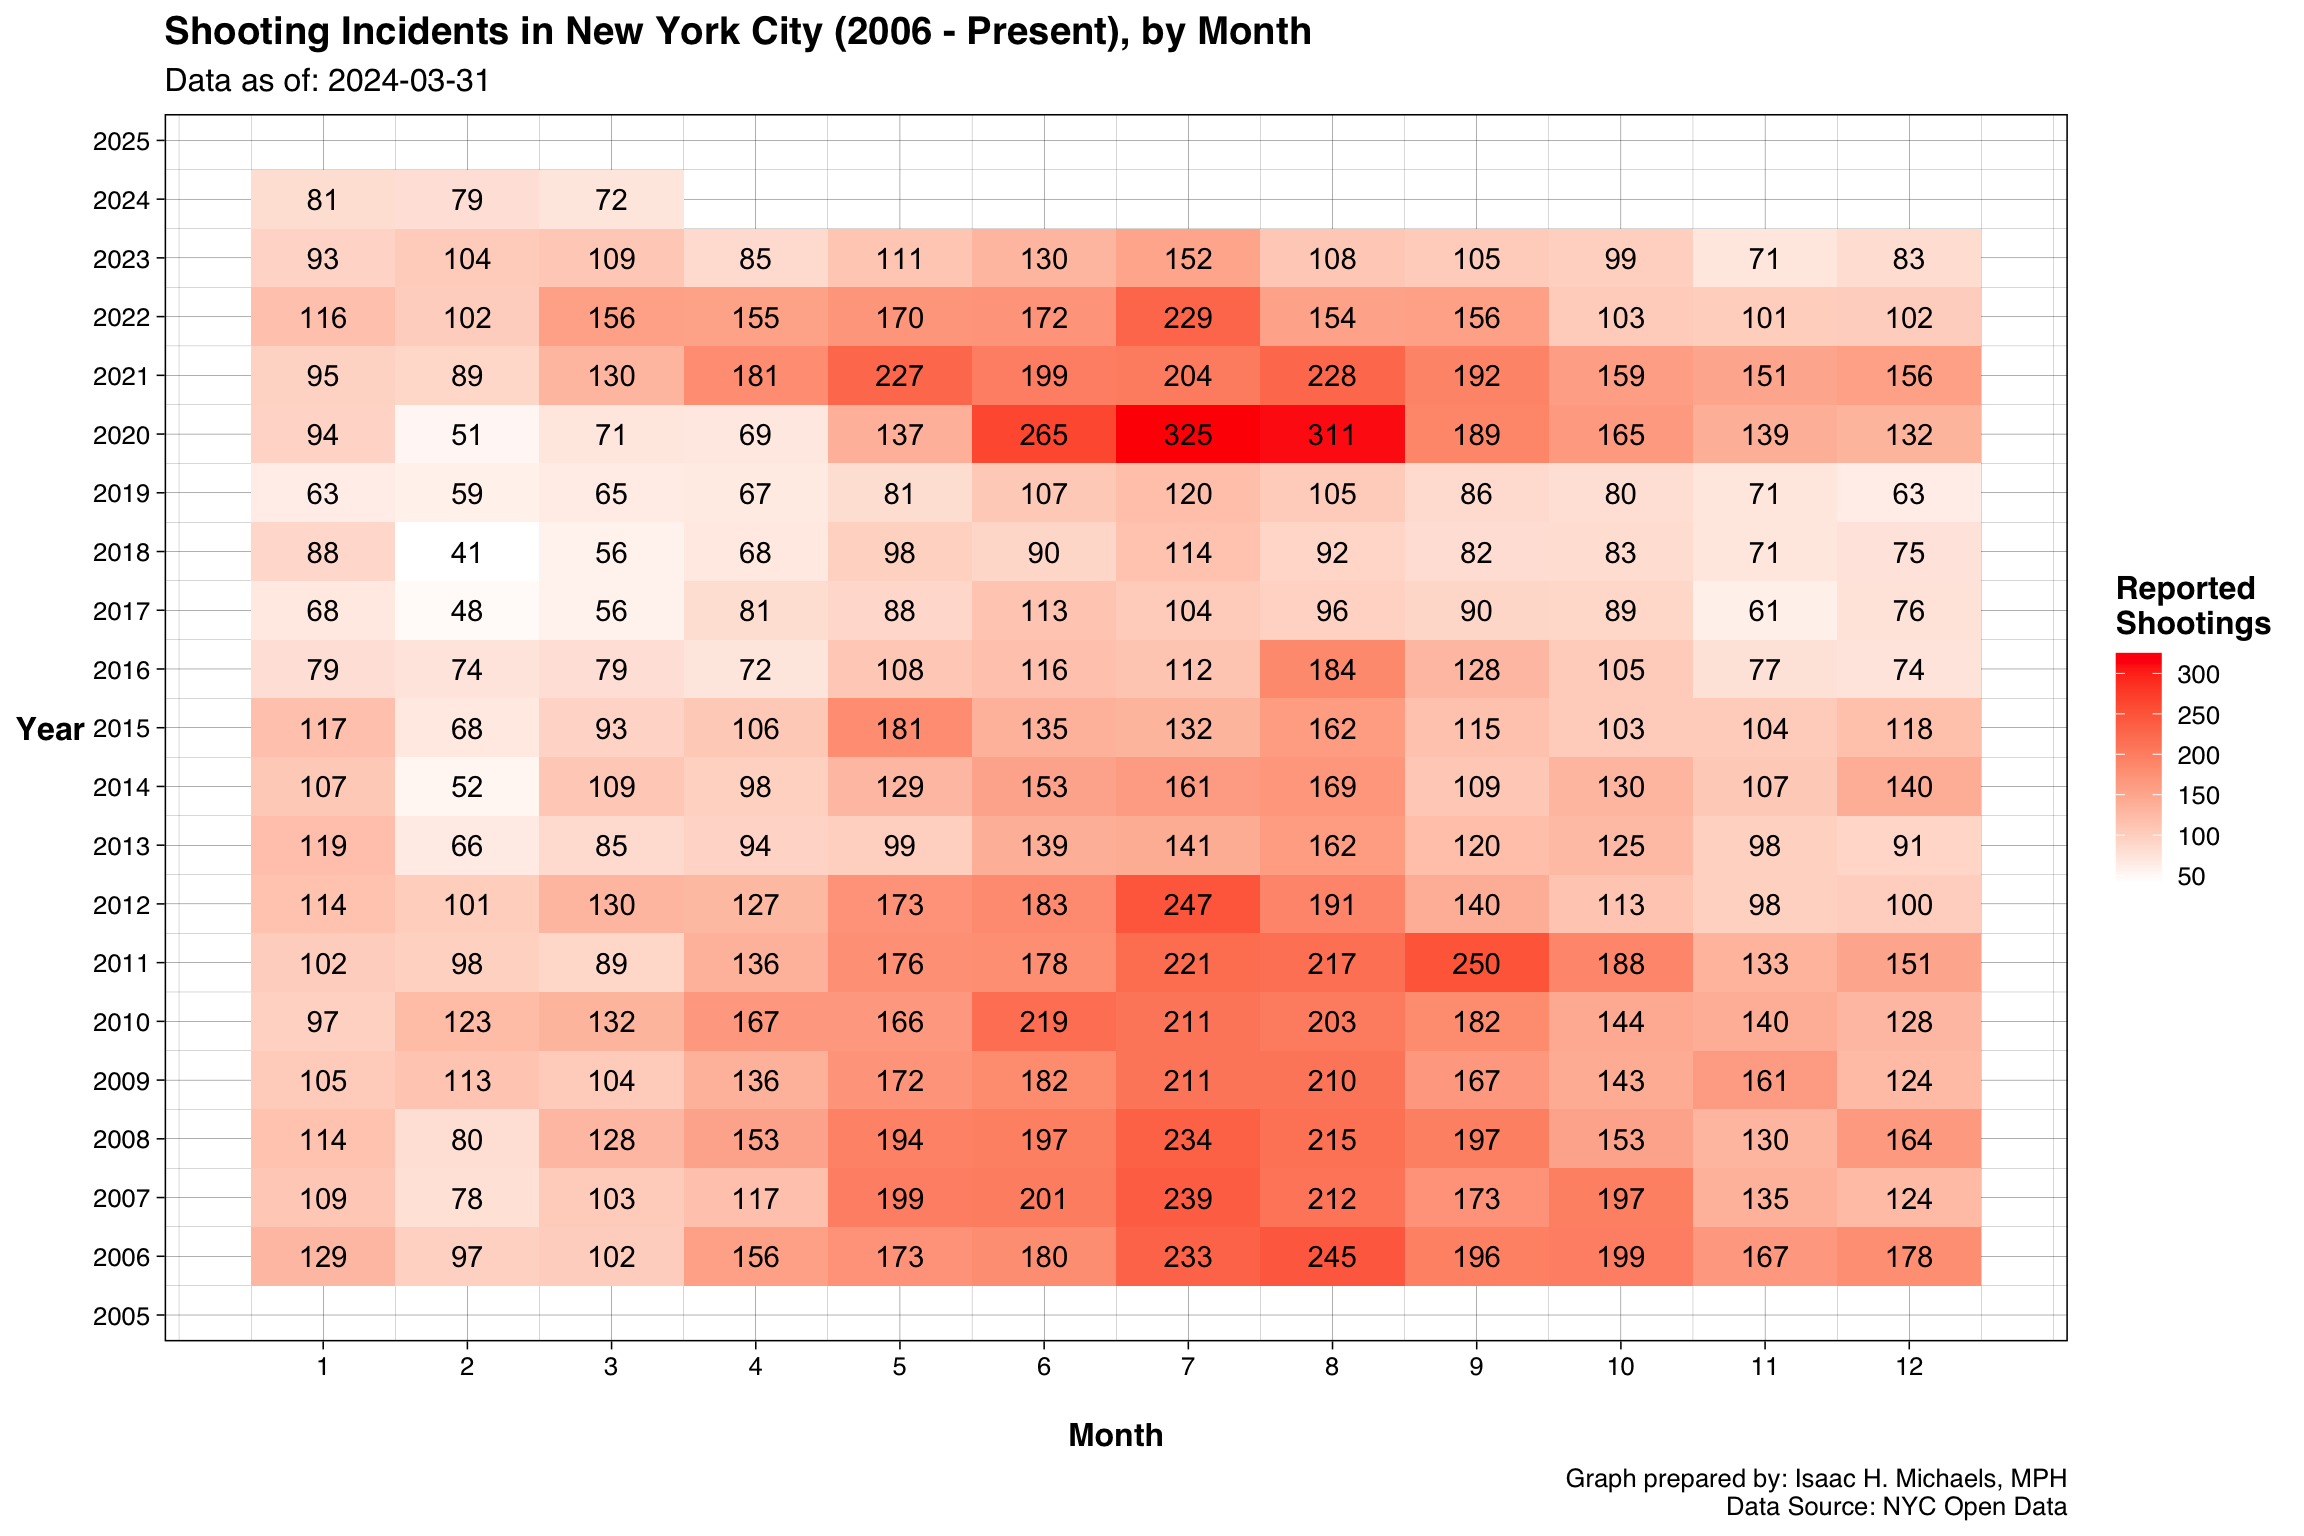
Shooting incidents have long been a significant public safety concern in New York City. According to data from the New York City Police Department (NYPD), the number of shooting incidents in the city has fluctuated over time, with some years seeing higher levels of gun violence than others. In recent years, there has been a general trend of declining shooting incidents in the city, though there have been some spikes in certain years, such as in 2020 and 2021.
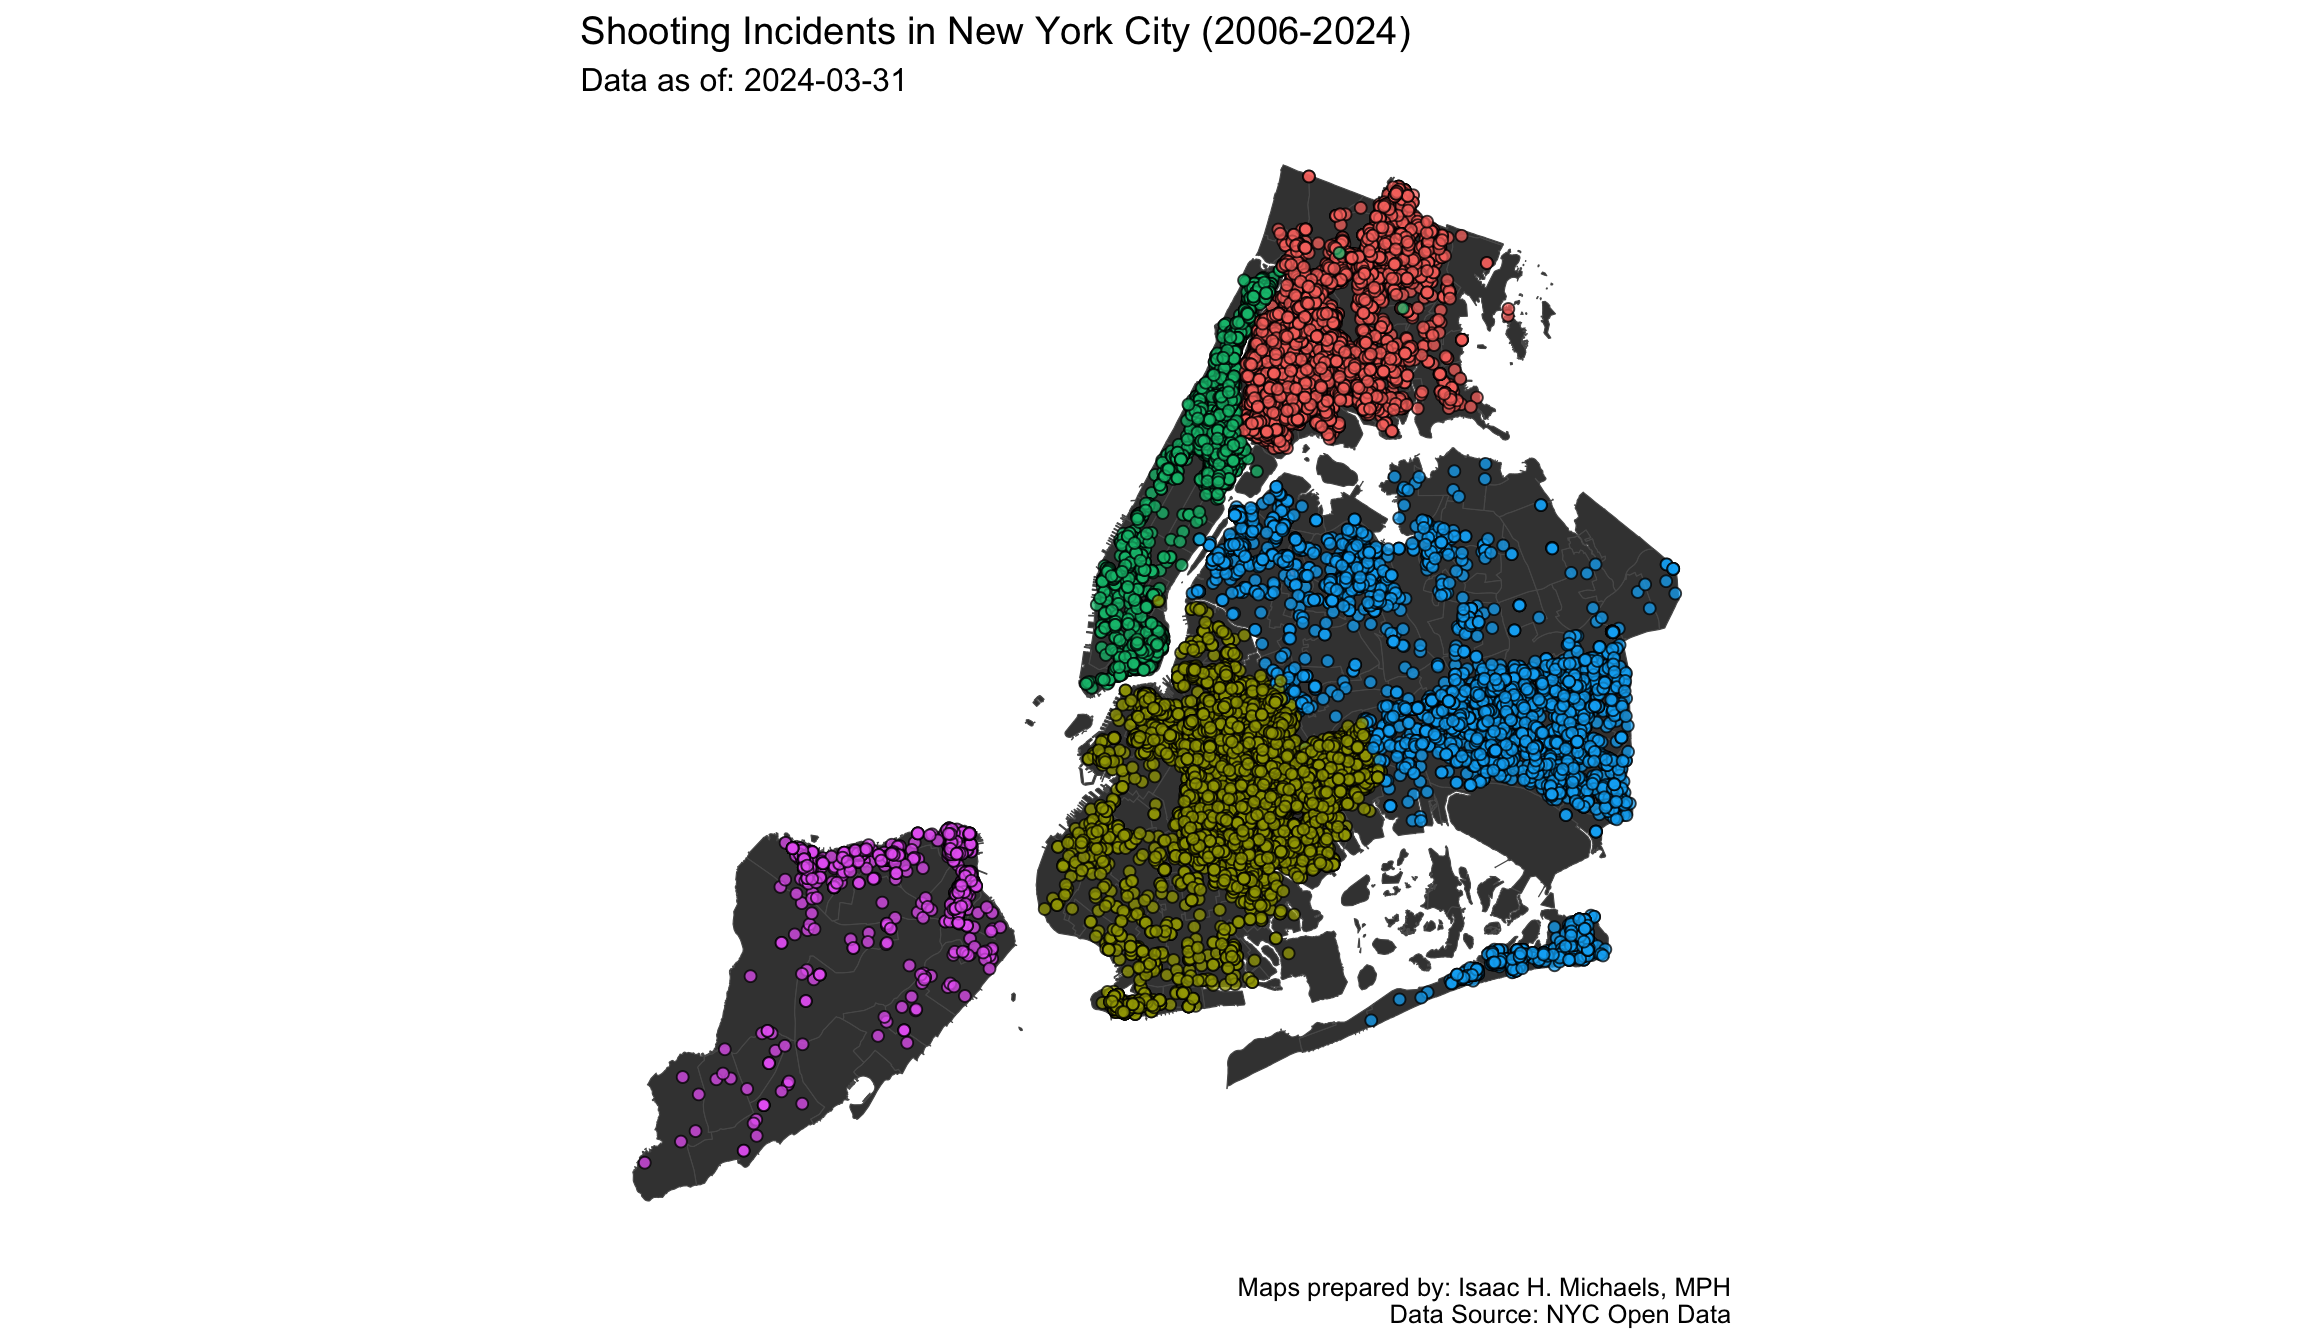
In addition to the overall number of shooting incidents, there are also significant disparities in the distribution of gun violence across different neighborhoods and boroughs in the city. Some neighborhoods and boroughs have consistently higher rates of shooting incidents than others, and these patterns of violence often disproportionately affect marginalized and low-income communities.
Understanding the patterns and trends of shooting incidents in New York City is crucial for developing effective strategies to address and prevent such incidents. By analyzing data on shooting incidents in the city, we can gain insights into the factors that contribute to gun violence and identify opportunities for intervention.
Data Overview
The data on this website is sourced from the NYPD Shooting Incident Data (Year To Date) and covers shooting incidents in New York City from 2006 to the present. The data includes information on the location, date, and time of the incident, as well as age, gender, and race/ethnicity for both perpetrators and victims. This data is manually extracted every quarter and reviewed by the Office of Management Analysis and Planning before being posted on the NYPD website.
How to Use These Data
On this website, you can explore the data through various visualizations, including a citywide point map, trend graphs, heat maps, bar graphs, and borough-specific maps. These visualizations allow you to easily identify patterns and trends in the data, such as the number of incidents by year, month, weekday, and hour, as well as the characteristics of both the perpetrators and victims.
Why These Data are Important
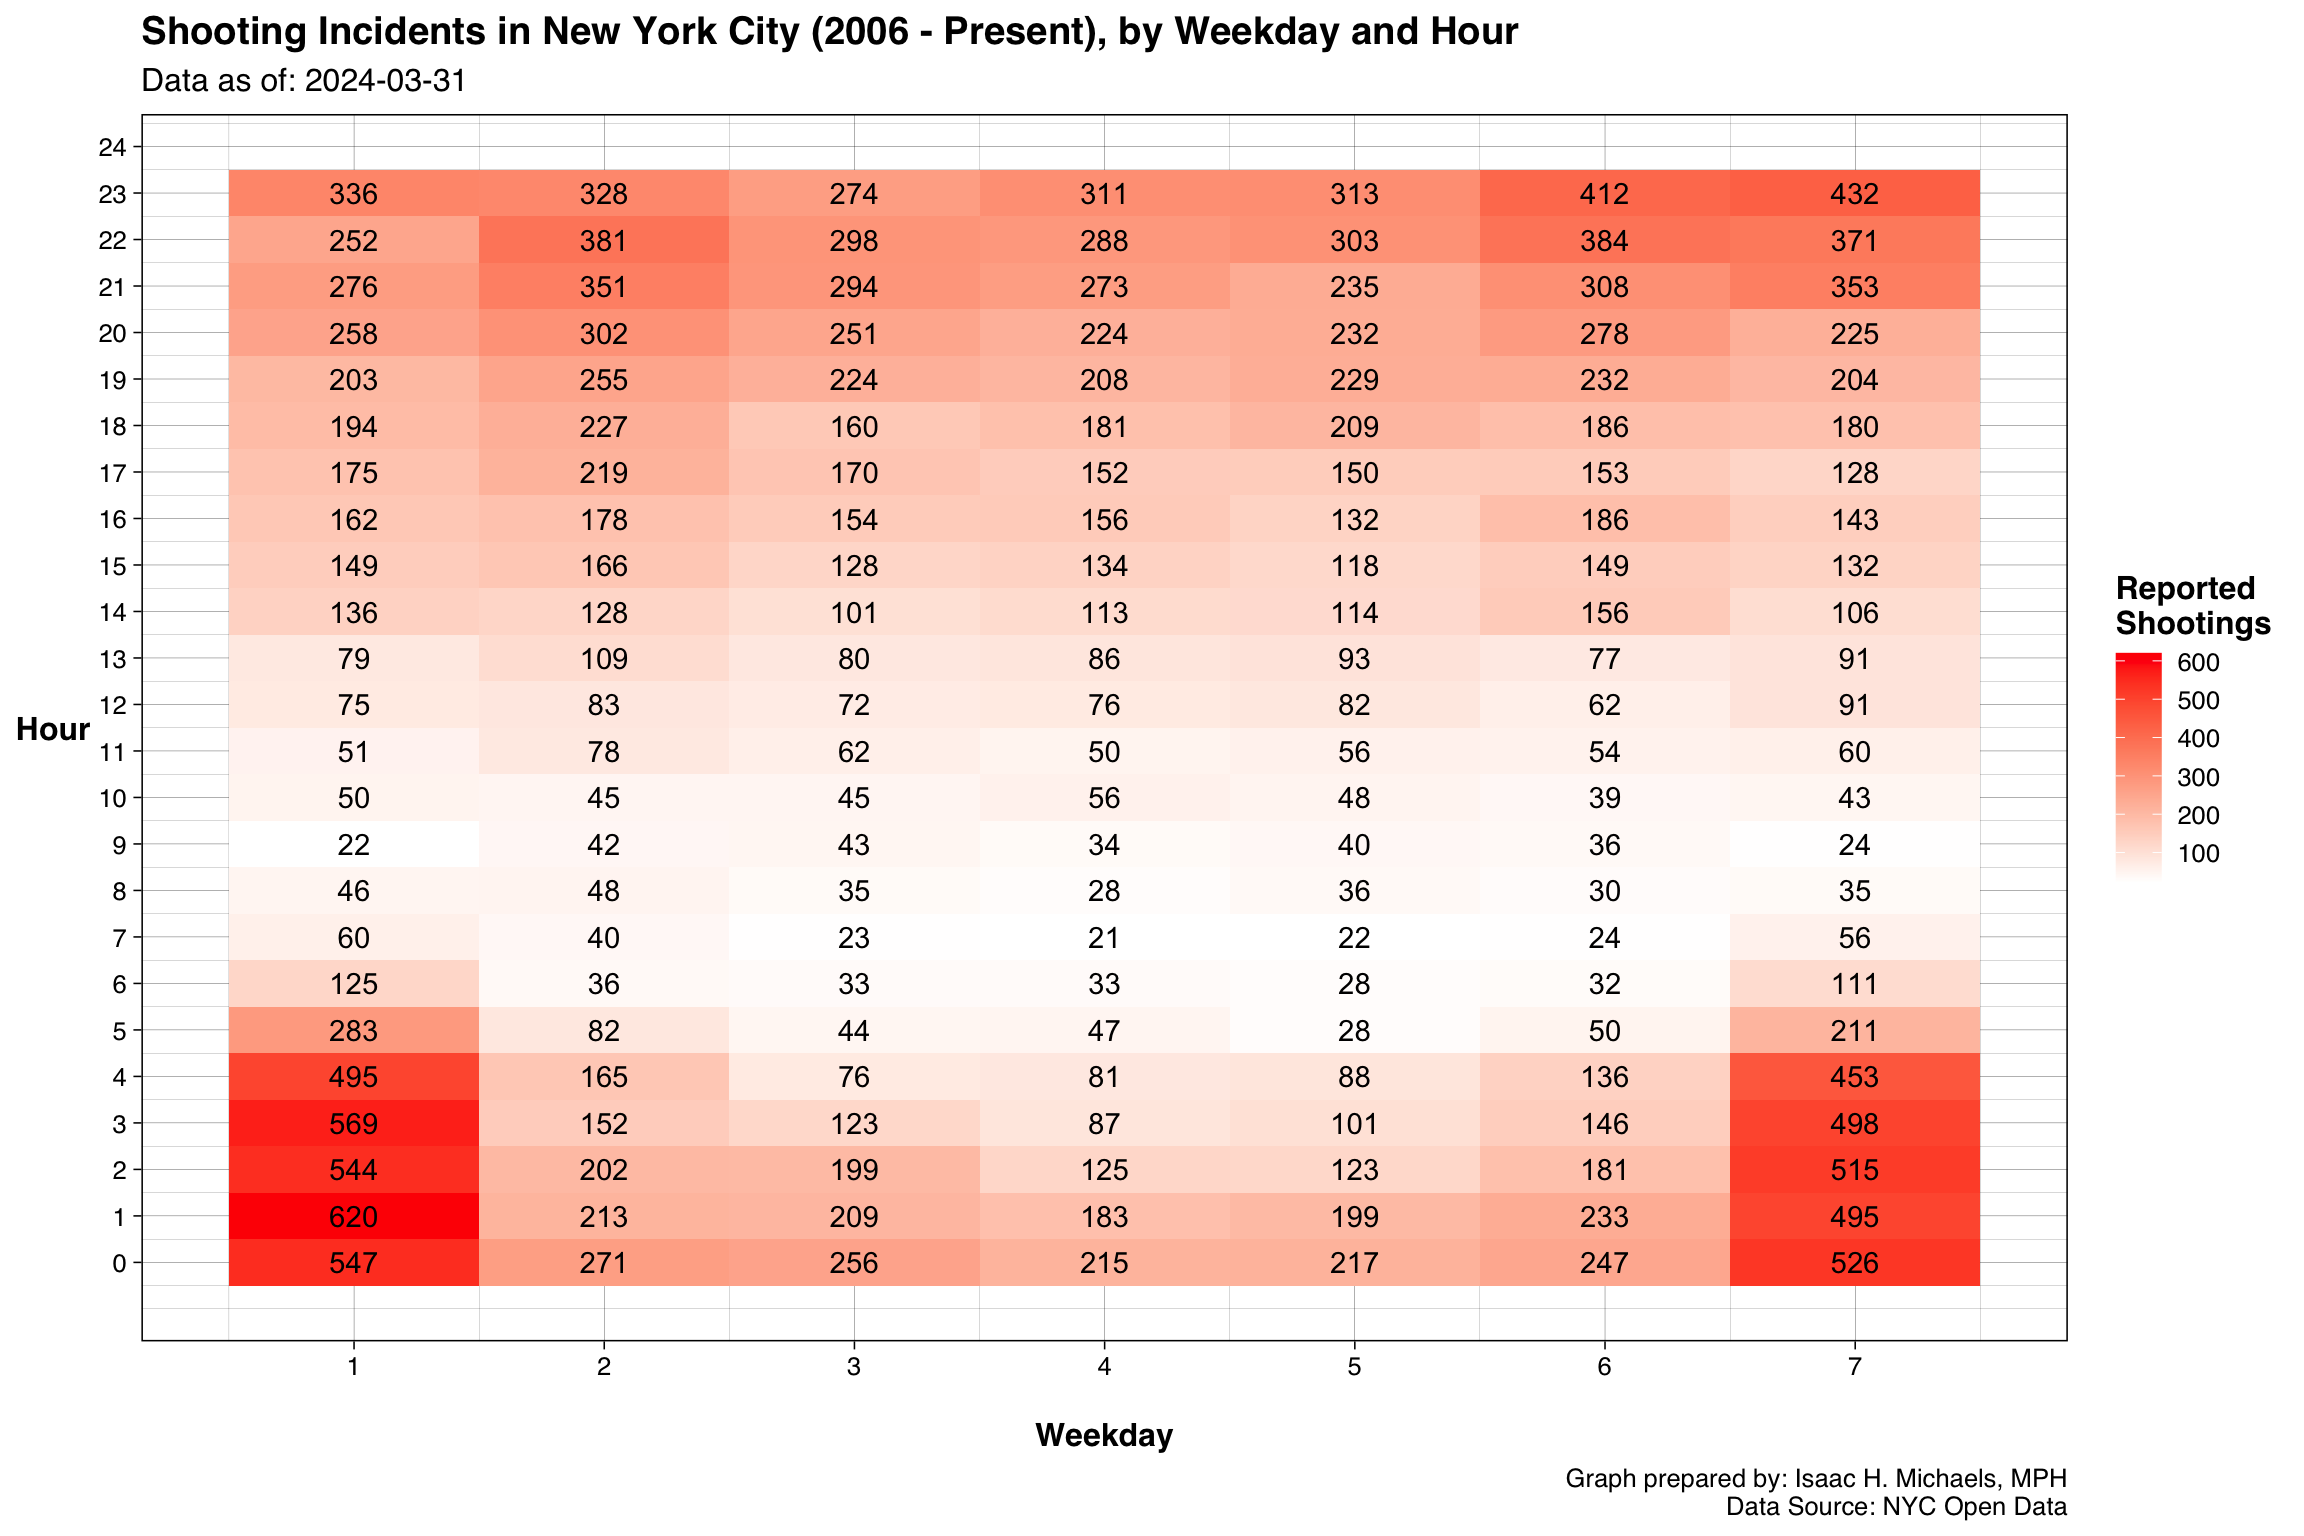
Understanding the patterns and trends of shooting incidents in New York City is crucial for informing public health practice and crime prevention efforts. By analyzing the data, we can identify high-risk areas, times, and populations and target interventions accordingly. Additionally, understanding the characteristics of both the perpetrators and victims can help us address underlying social determinants of health that contribute to violence.
Implications for Public Health Practice
The data on this website can be used by public health practitioners, policymakers, and community leaders to develop and implement evidence-based interventions to reduce the incidence of shootings in New York City. By identifying high-risk areas, times, and populations, interventions can be targeted to specific locations and populations, and be tailored to address the underlying social determinants of health that contribute to violence. Additionally, by understanding the characteristics of both the perpetrators and victims, interventions can also be tailored to address the specific needs of these groups.
Key Takeaways
The findings of this analysis of shooting incidents in New York City have several important implications for understanding and addressing gun violence in the city. Some key points to consider include:
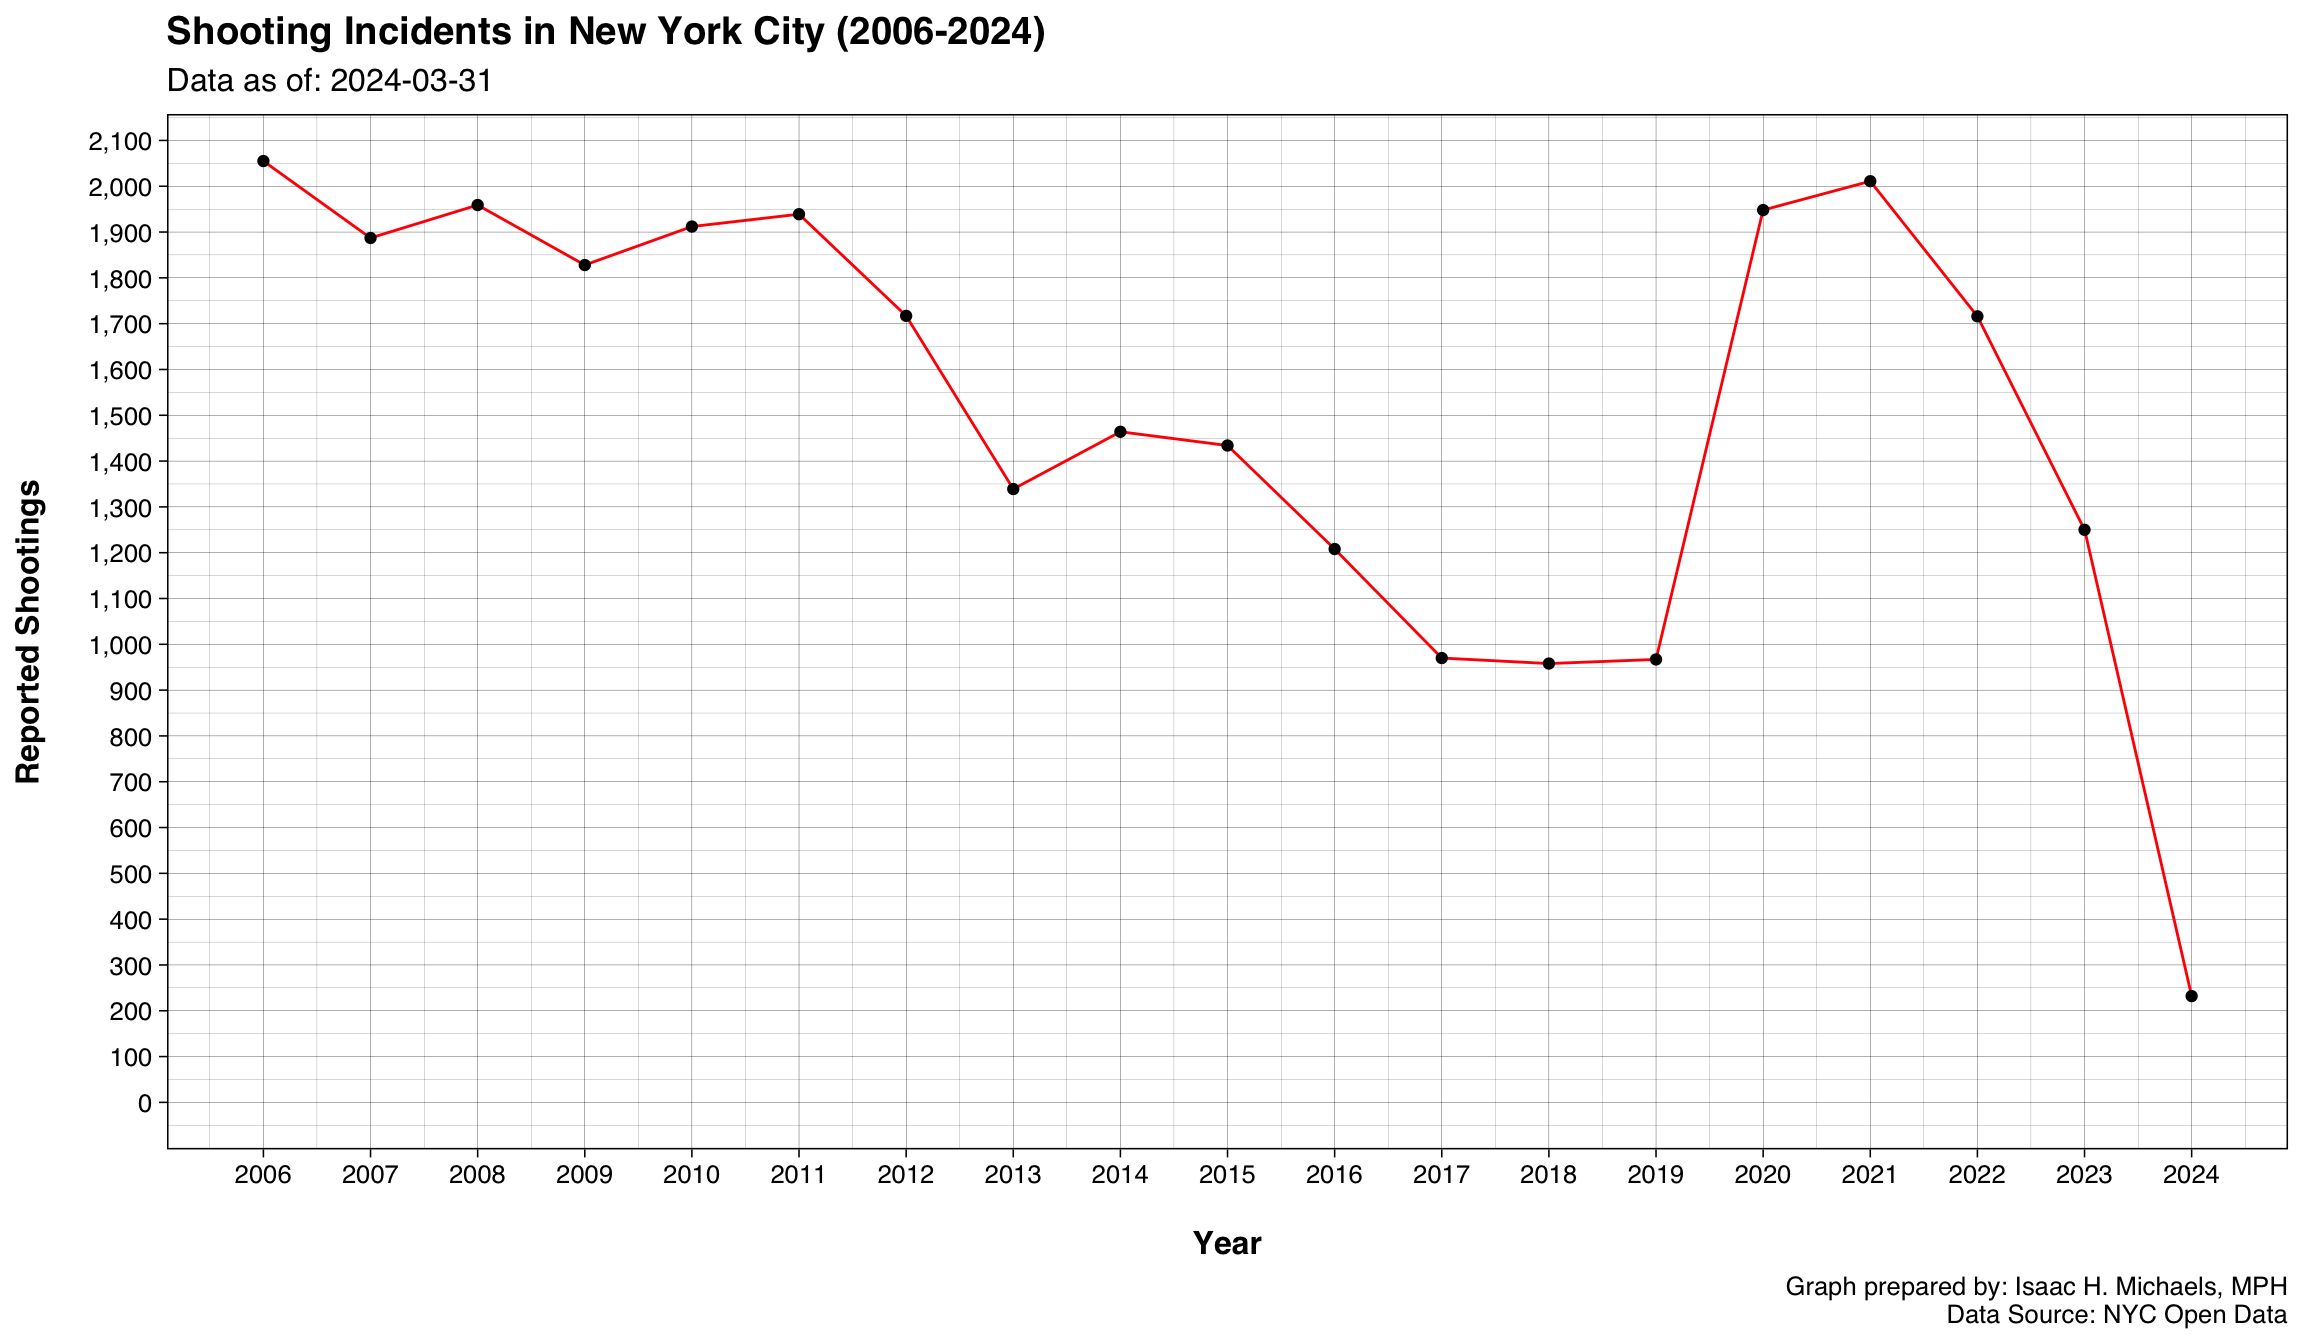
- The overall trend of declining shooting incidents in the city in recent years is encouraging, but there have been some spikes in certain years that warrant further examination. Understanding the factors that contribute to these spikes in gun violence could help inform interventions and prevention efforts.
- Disparities in the distribution of shooting incidents across different neighborhoods and boroughs suggest that gun violence is not evenly distributed throughout the city. Targeting interventions and prevention efforts in areas with higher rates of gun violence may be particularly effective in reducing the overall incidence of shooting incidents.
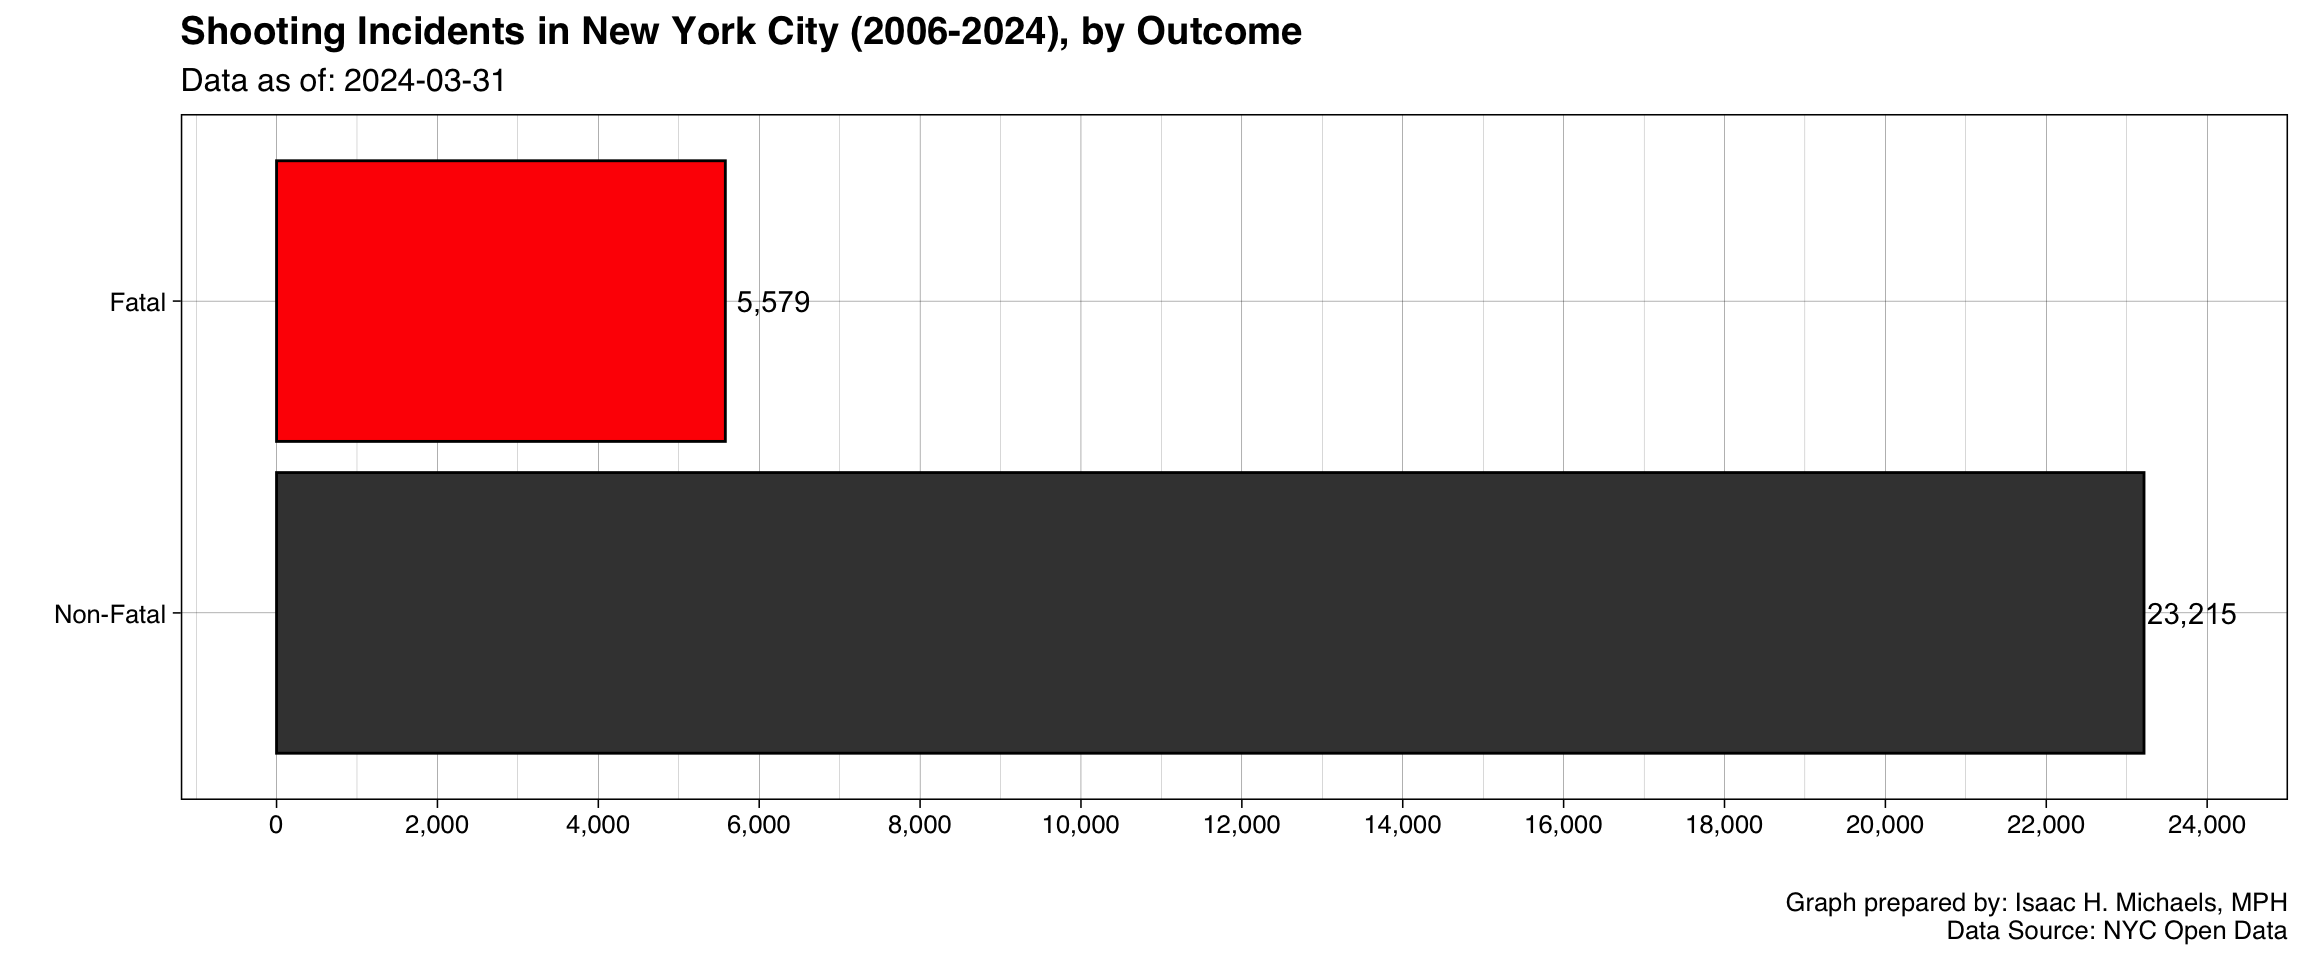
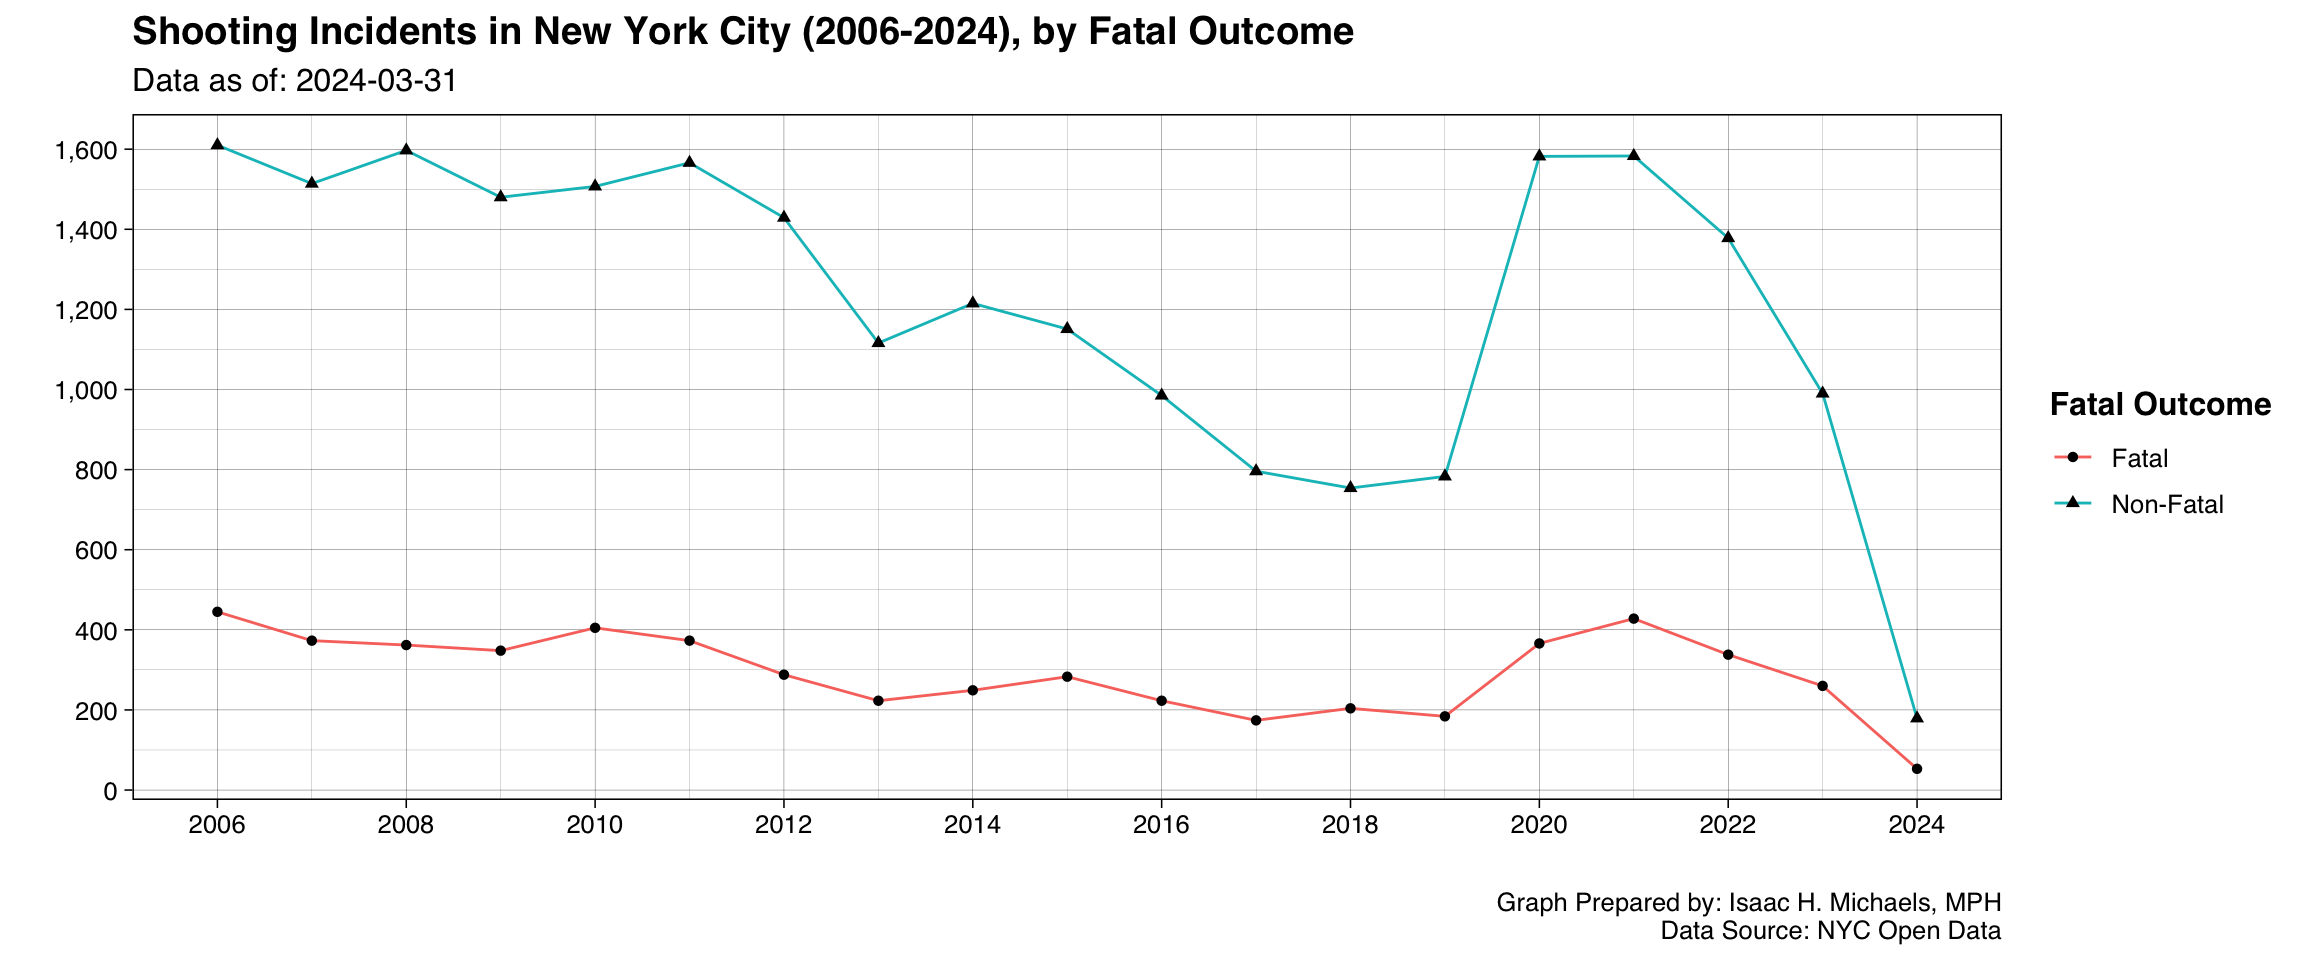
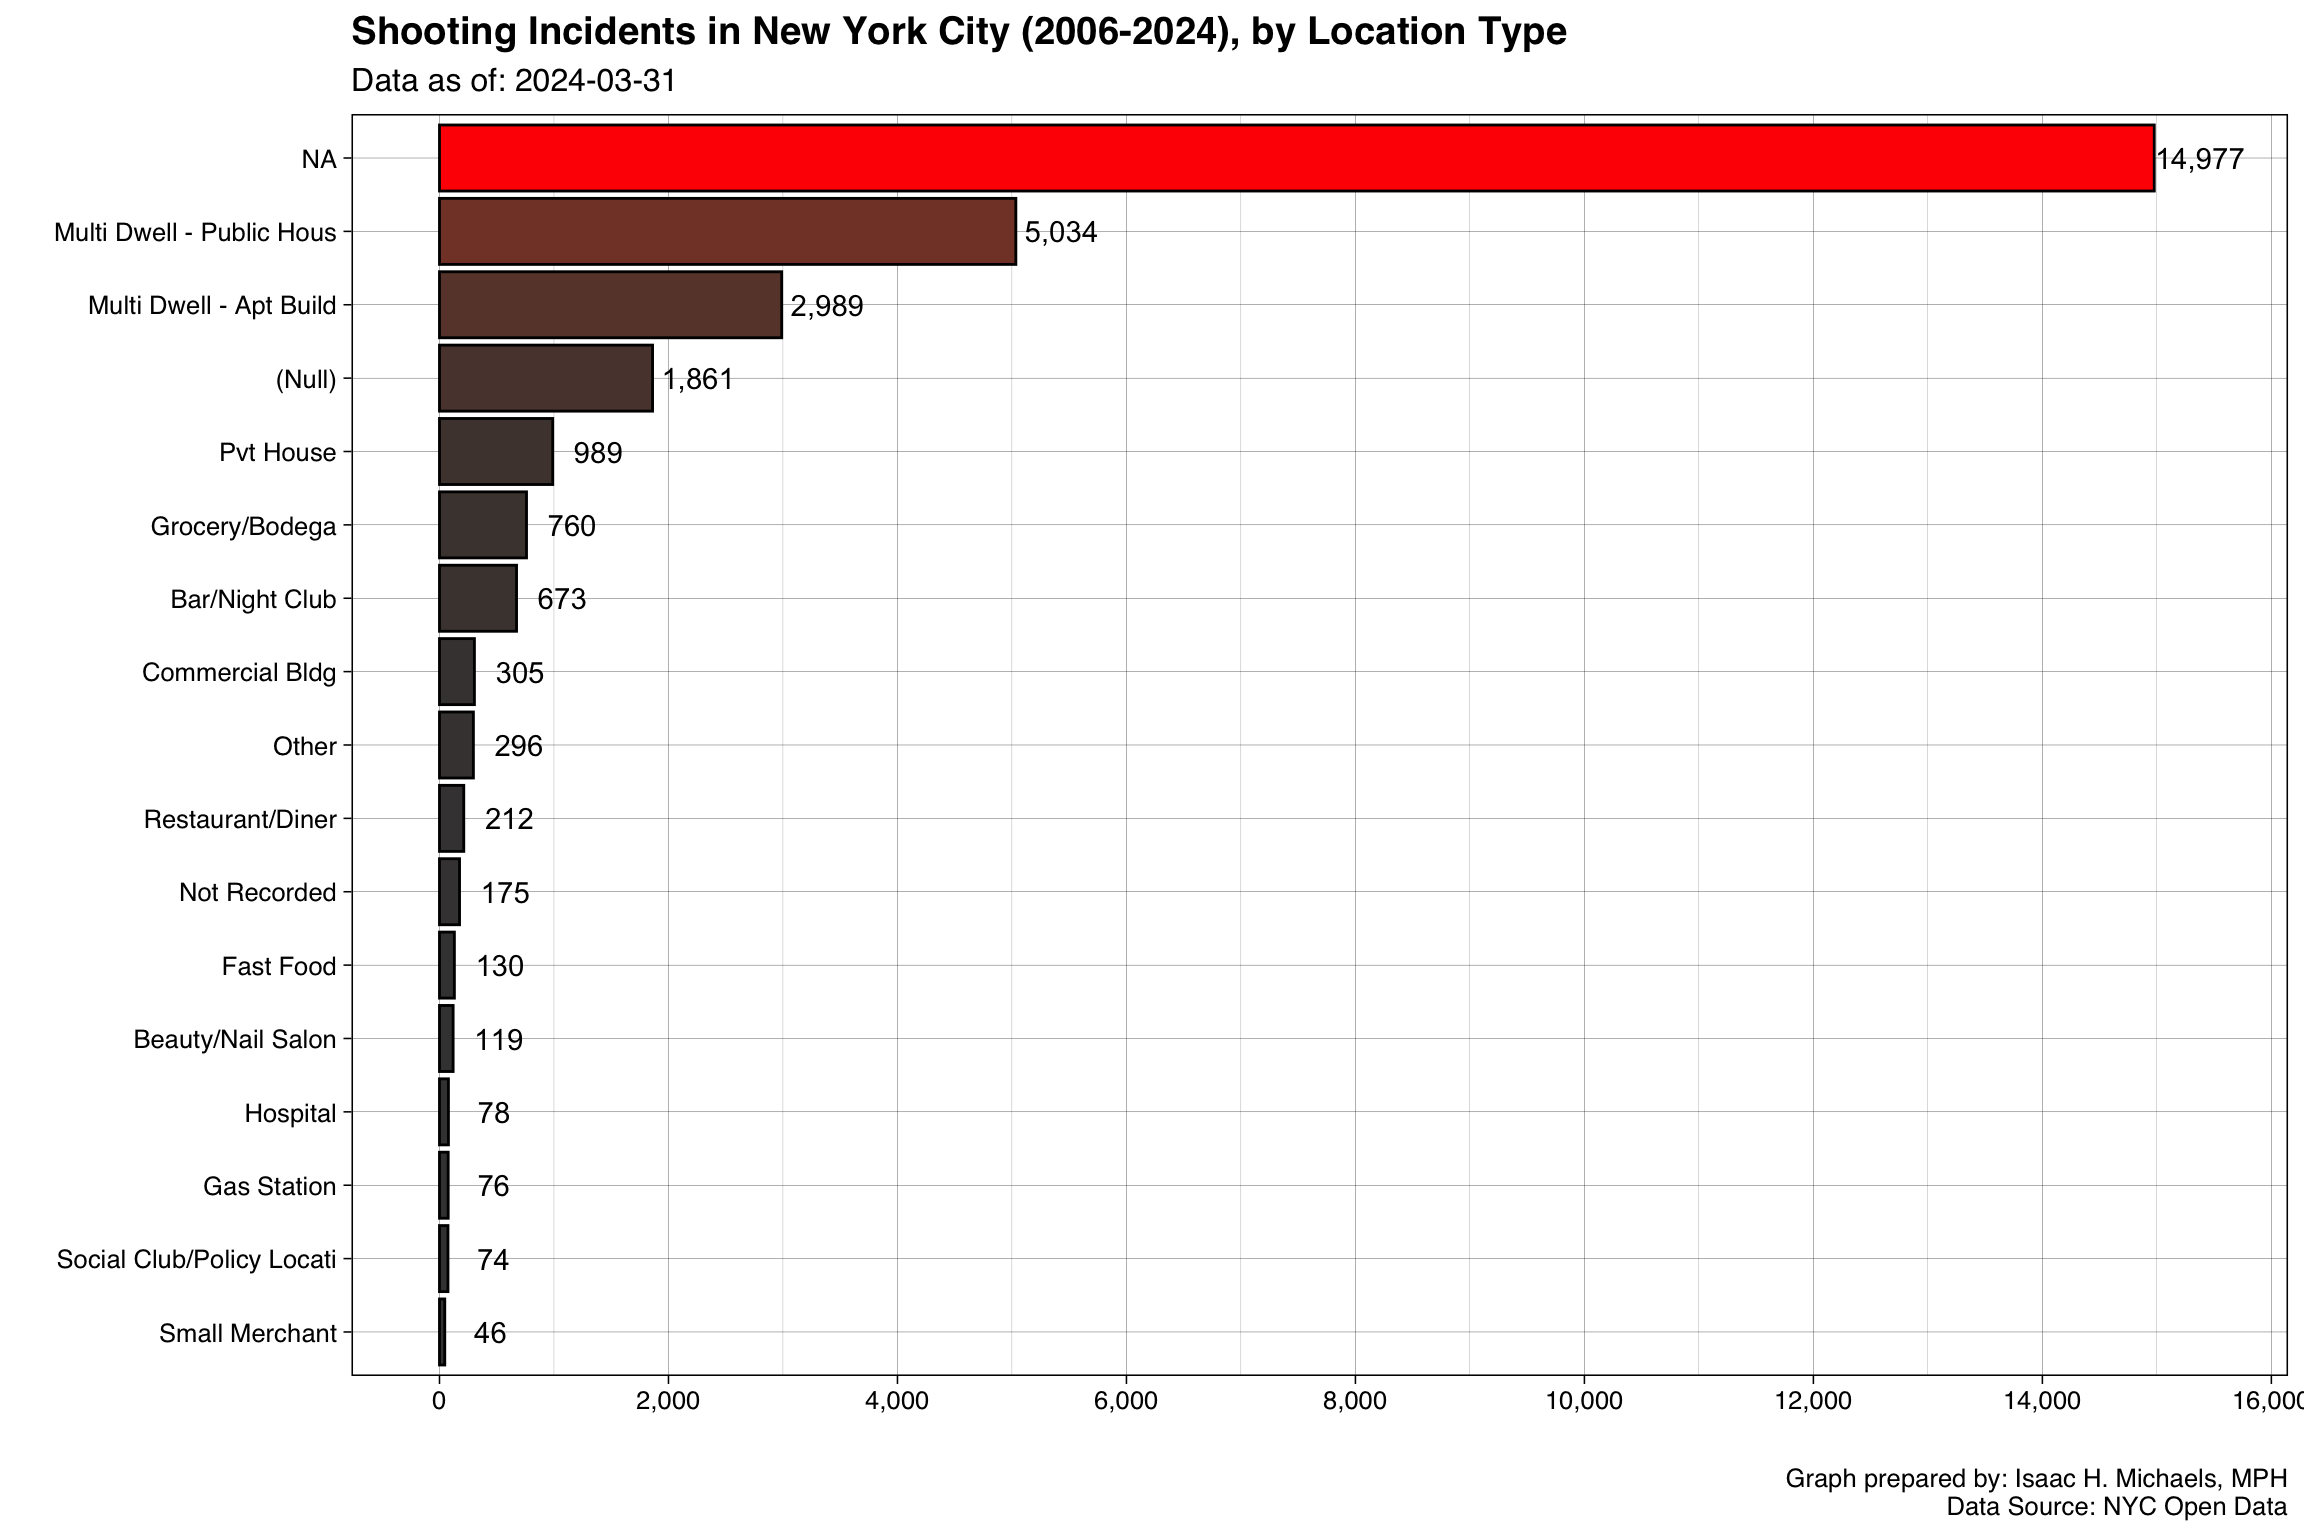
- Examining the characteristics of shooting incidents, such as the location type and whether the shooting resulted in a victim’s death, can provide insights into the nature of gun violence in the city. For example, understanding the types of locations where shootings are more likely to occur could inform strategies for preventing such incidents.
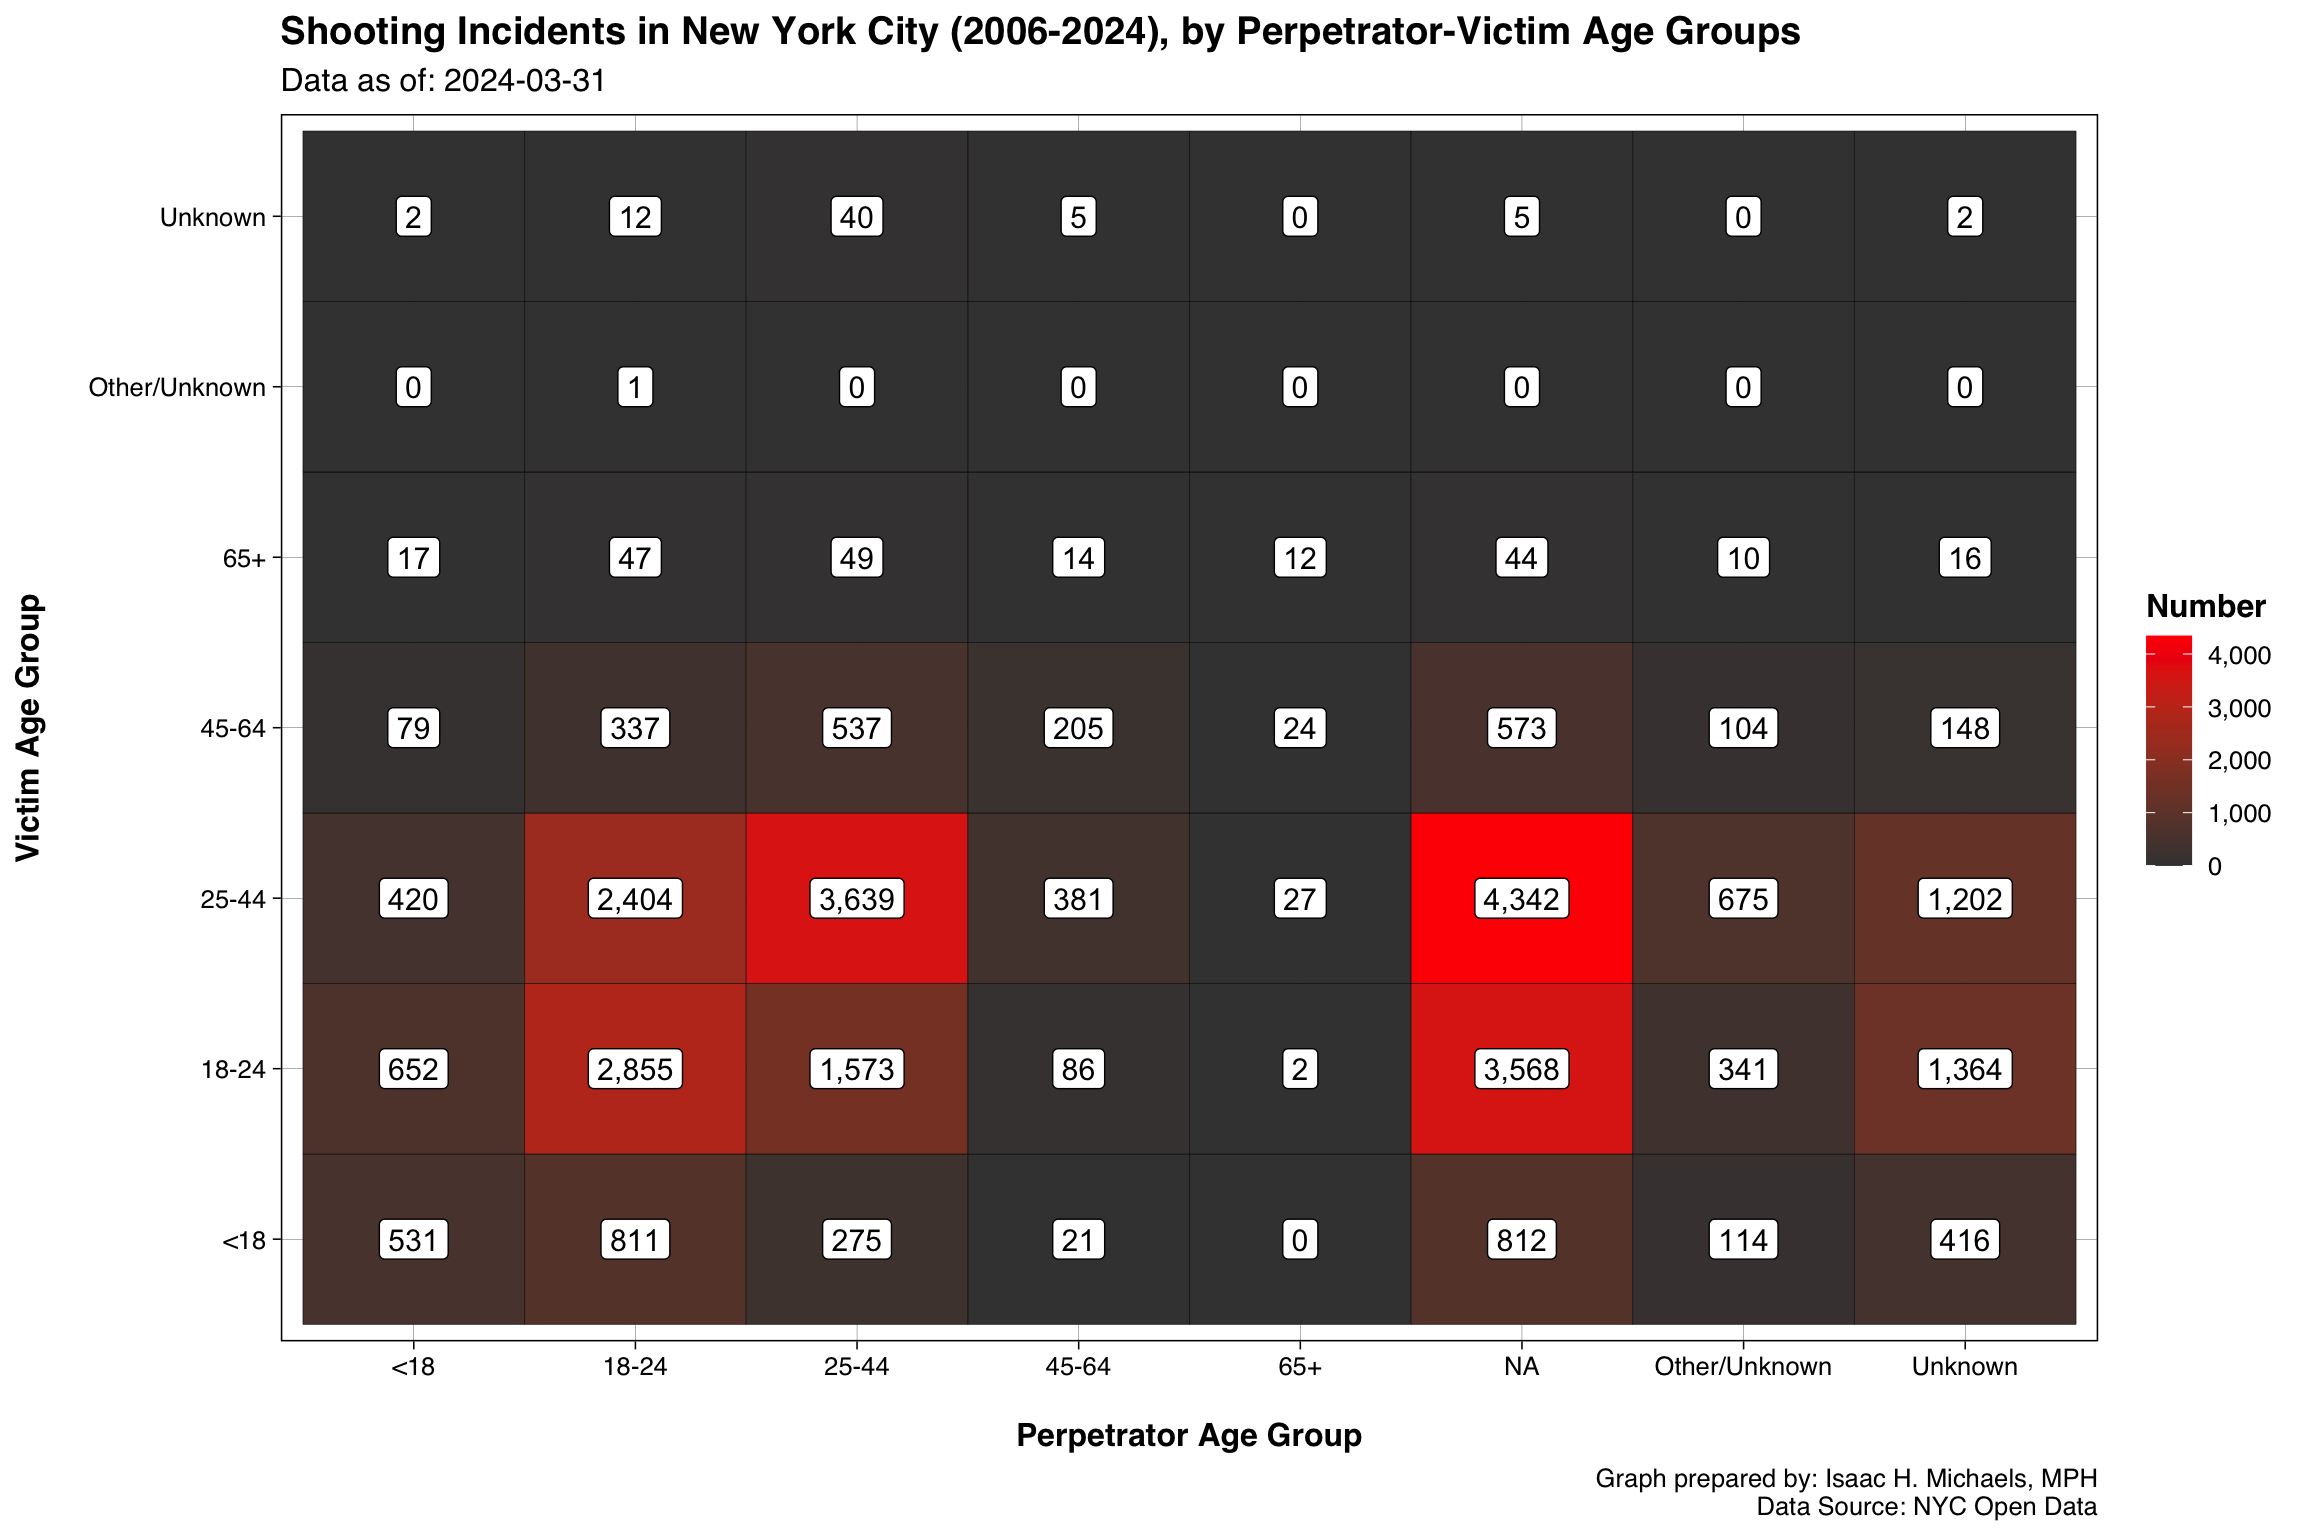
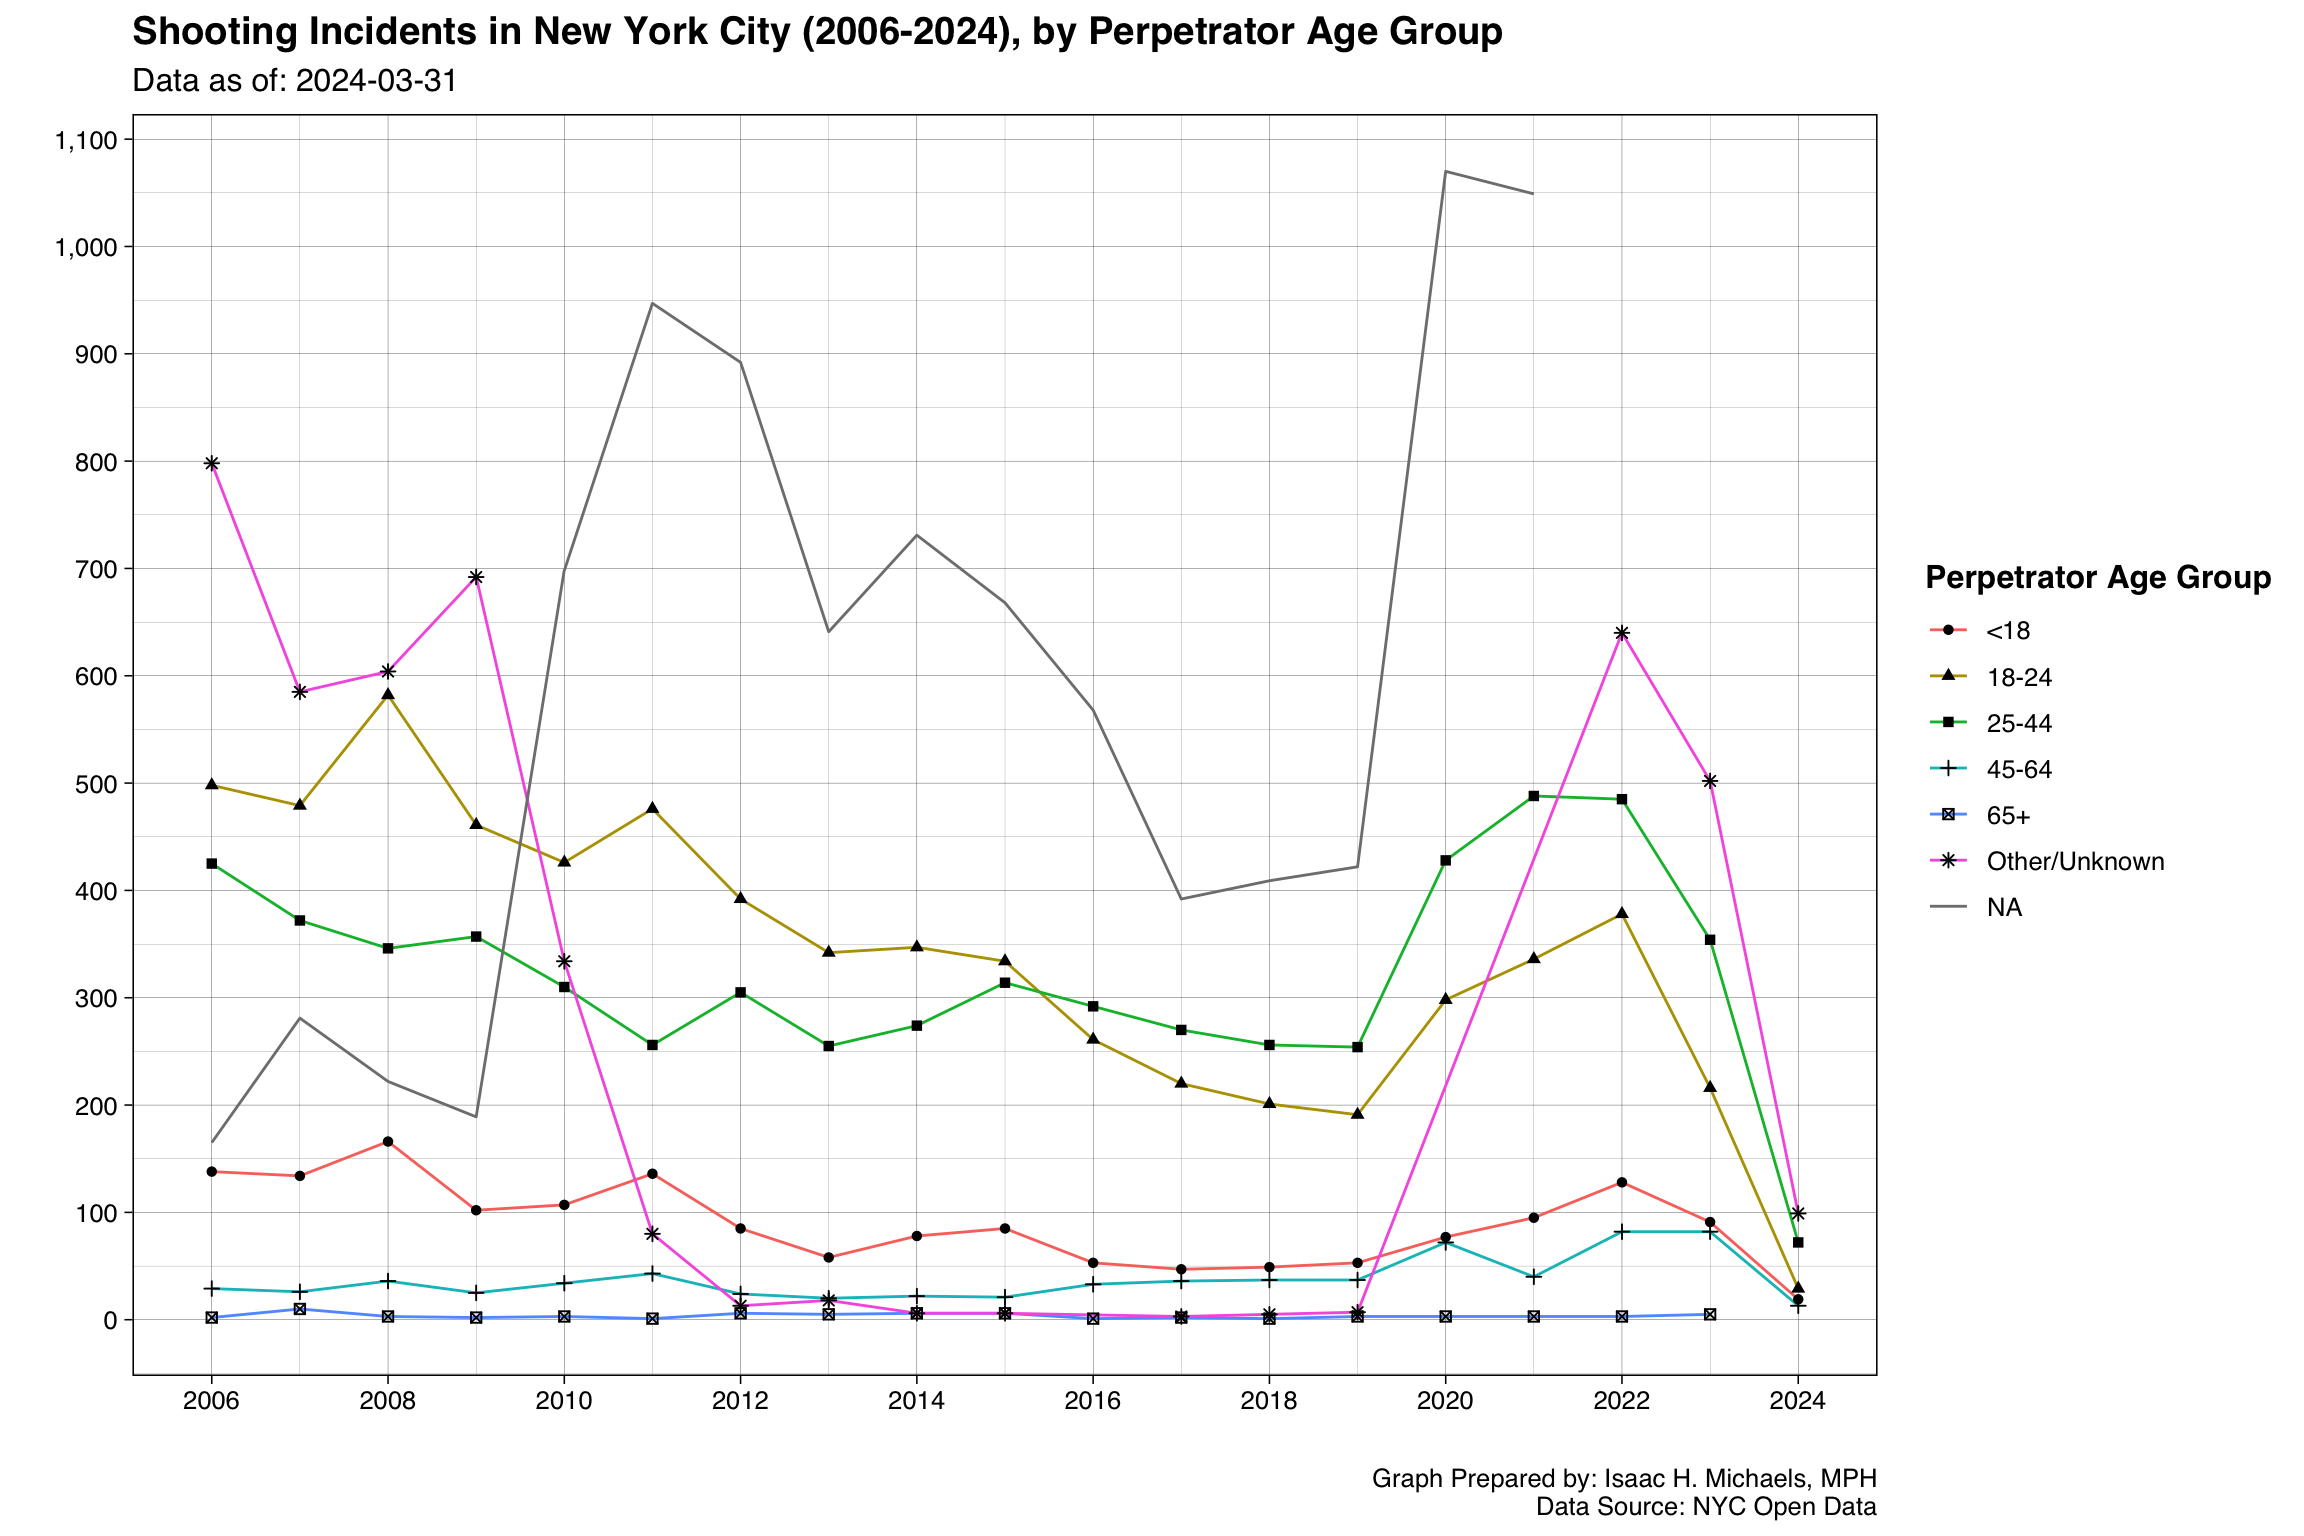
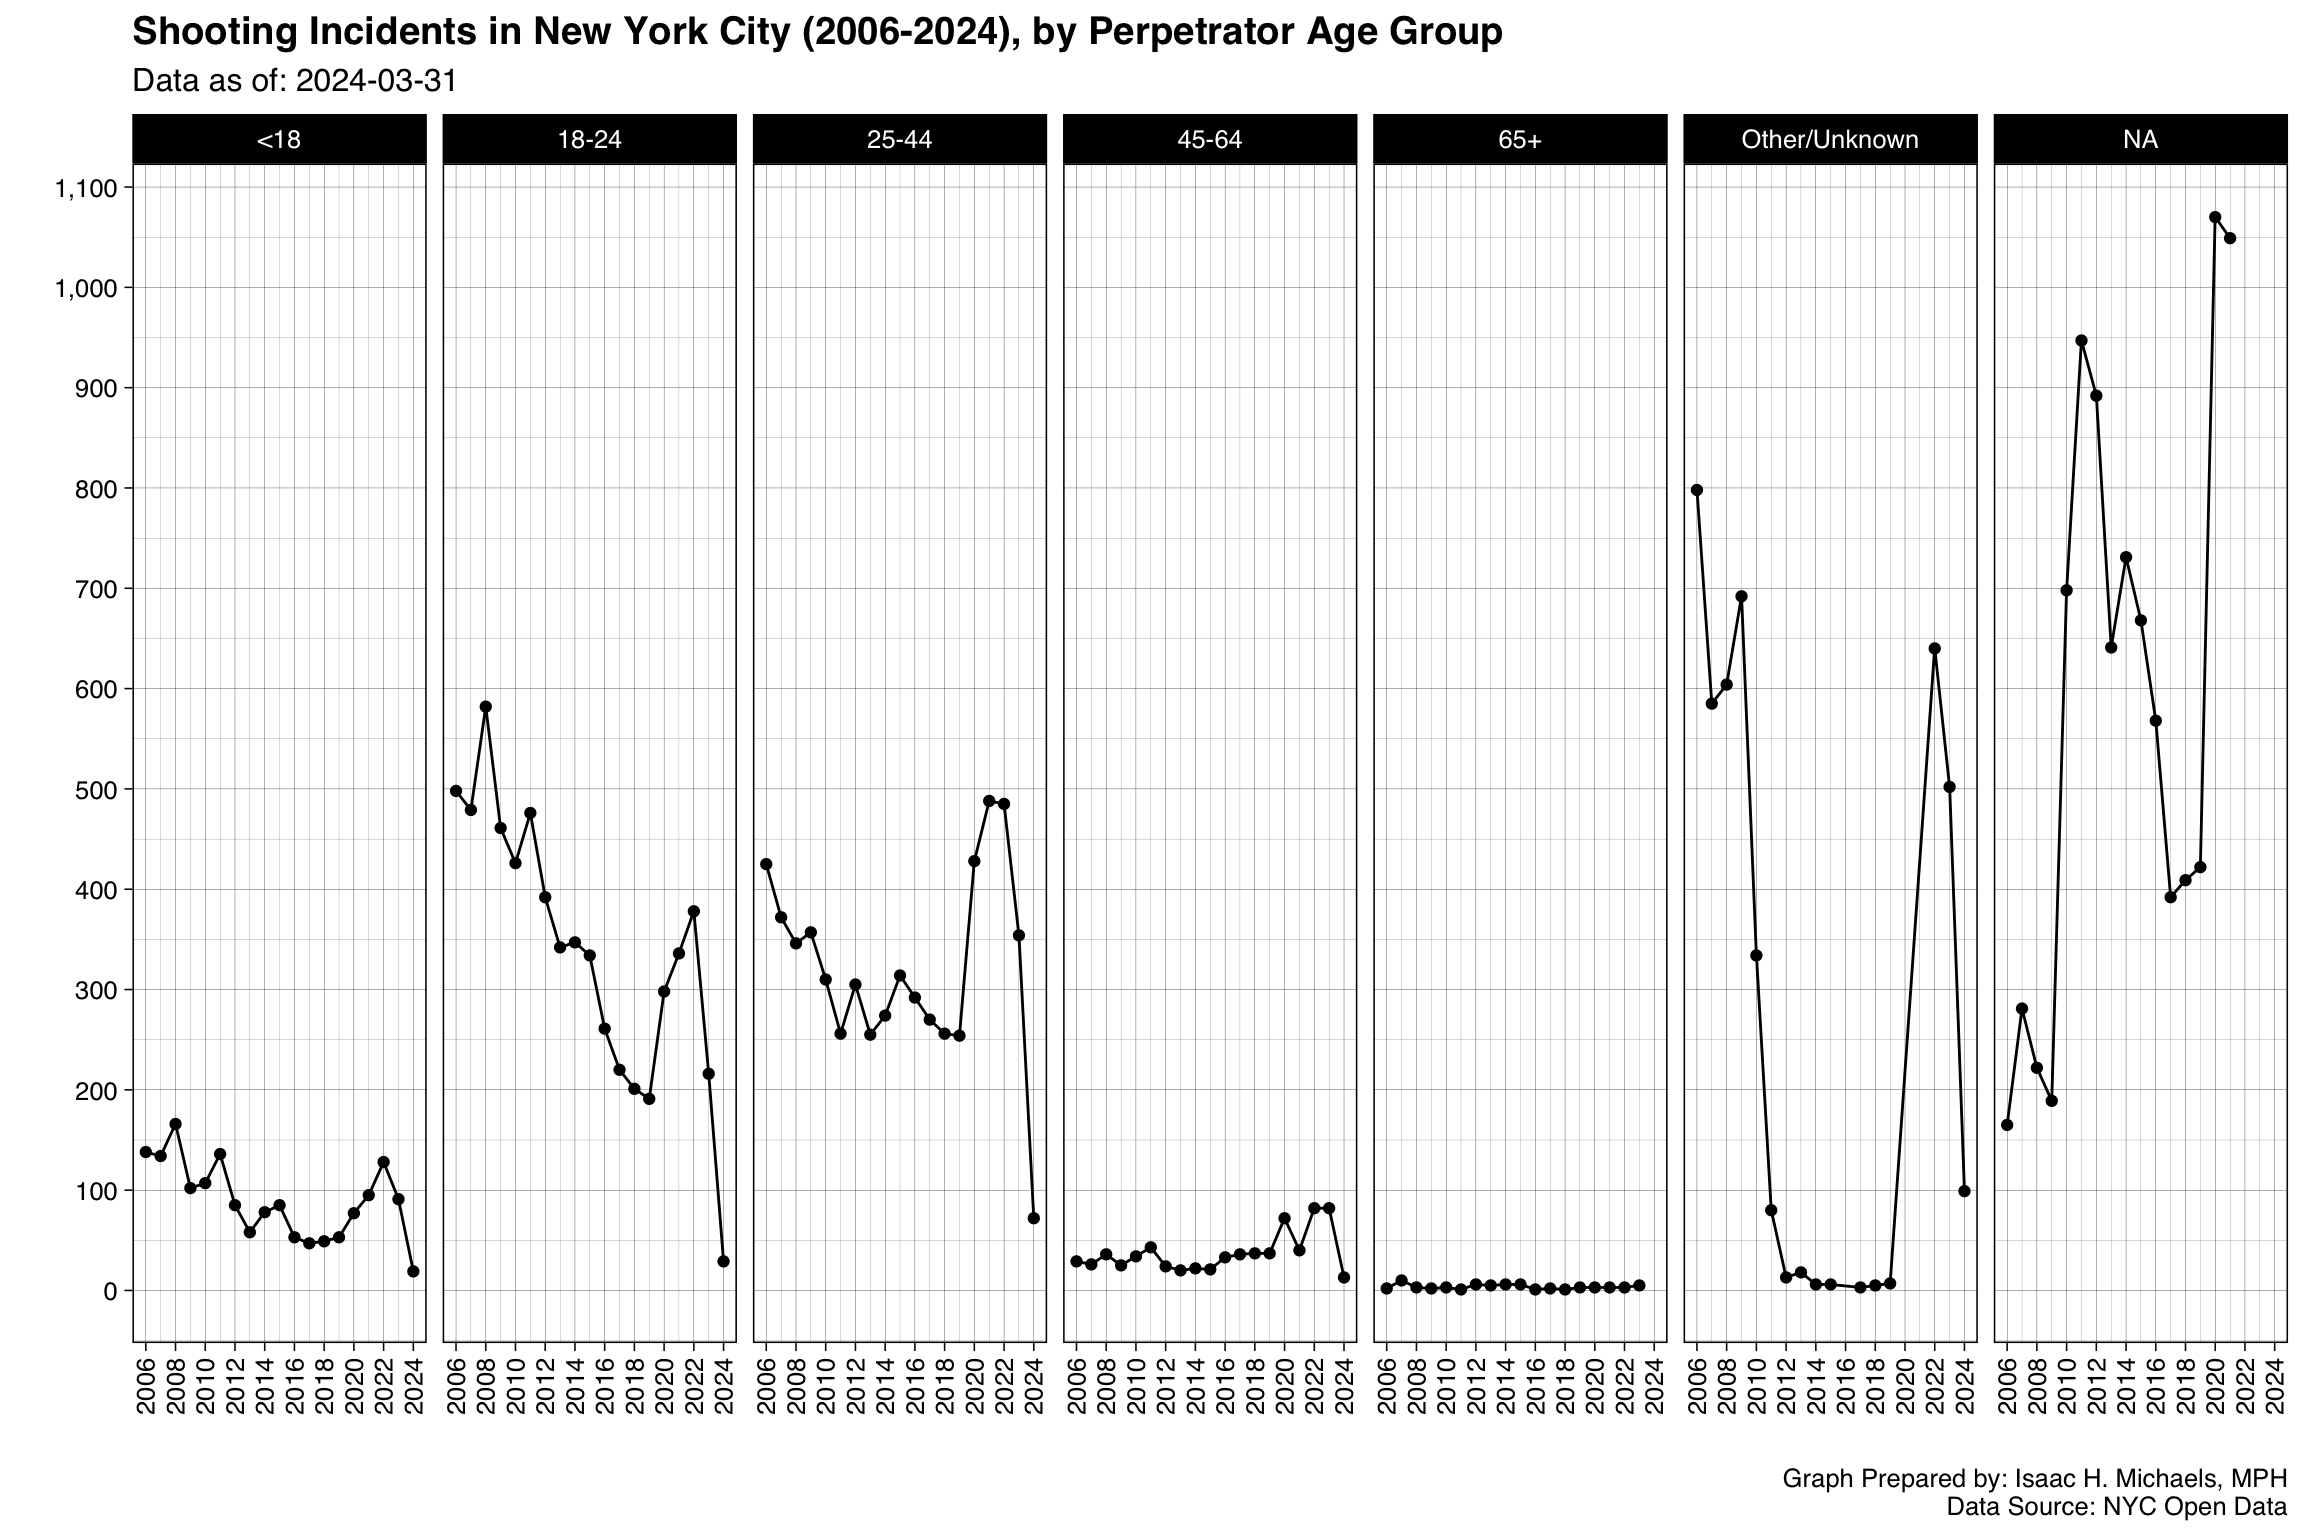
- Analyzing the demographics of suspects and victims can also shed light on the factors that may contribute to gun violence in the city. For example, examining the relationship between perpetrator and victim characteristics (e.g. gender, race/ethnicity) can help identify patterns and trends that could inform targeted interventions.
Overall, this analysis provides a detailed and nuanced understanding of shooting incidents in New York City, and can inform efforts to address and prevent such incidents from occurring in the future.
Citywide Data
Maps
Interactive
January 01, 2006 through March 30, 2025
Map Author: Isaac H. Michaels, MPH
Data Source: NYC Open Data
Map Prepared By: Isaac H. Michaels, MPH
Data Source: NYC Open Data (Current, Historical)
 Map Prepared By:
 Trend
 Graph Prepared By: Isaac H. Michaels, MPH
Data Source: NYC Open Data (Current, Historical)
Shooting Incidents in New York City (2006-2025)
Data as of: 2025-03-30
| Year | Number |
|---|---|
| 2006 | 2,055 |
| 2007 | 1,887 |
| 2008 | 1,959 |
| 2009 | 1,828 |
| 2010 | 1,912 |
| 2011 | 1,939 |
| 2012 | 1,717 |
| 2013 | 1,339 |
| 2014 | 1,464 |
| 2015 | 1,434 |
| 2016 | 1,208 |
| 2017 | 970 |
| 2018 | 958 |
| 2019 | 967 |
| 2020 | 1,948 |
| 2021 | 2,011 |
| 2022 | 1,716 |
| 2023 | 1,250 |
| 2024 | 1,182 |
| 2025 | 170 |
Table Prepared By: Isaac H. Michaels, MPH
Data Source: NYC Open Data (Current, Historical)
 Graph Prepared By:
 Weekdays and Times
 Graph Prepared By: Isaac H. Michaels, MPH
Data Source: NYC Open Data (Current, Historical)
Fatal vs. Non-Fatal
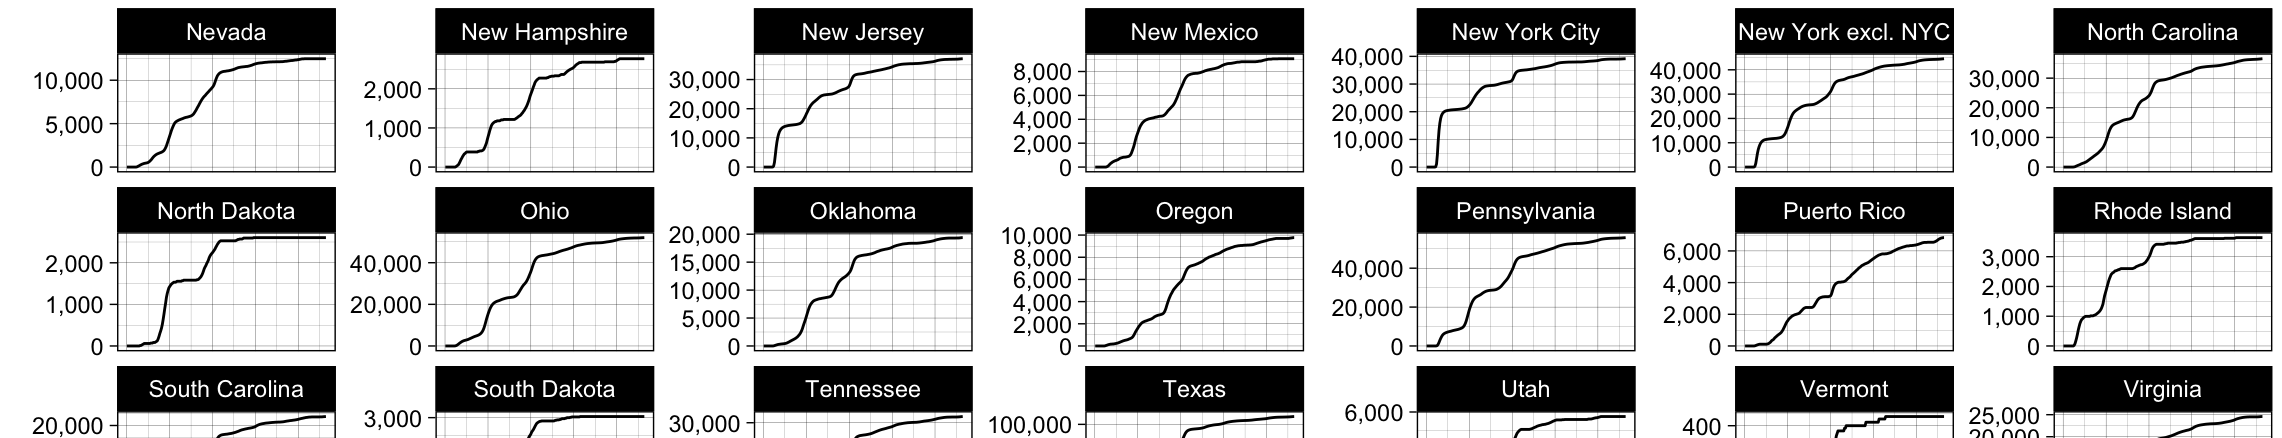
Cumulative Counts
 Graph Prepared By: Isaac H. Michaels, MPH
Data Source: NYC Open Data (Current, Historical)
 Graph Prepared By:
 Location Types
Cumulative Counts
 Graph Prepared By: Isaac H. Michaels, MPH
Data Source: NYC Open Data (Current, Historical)
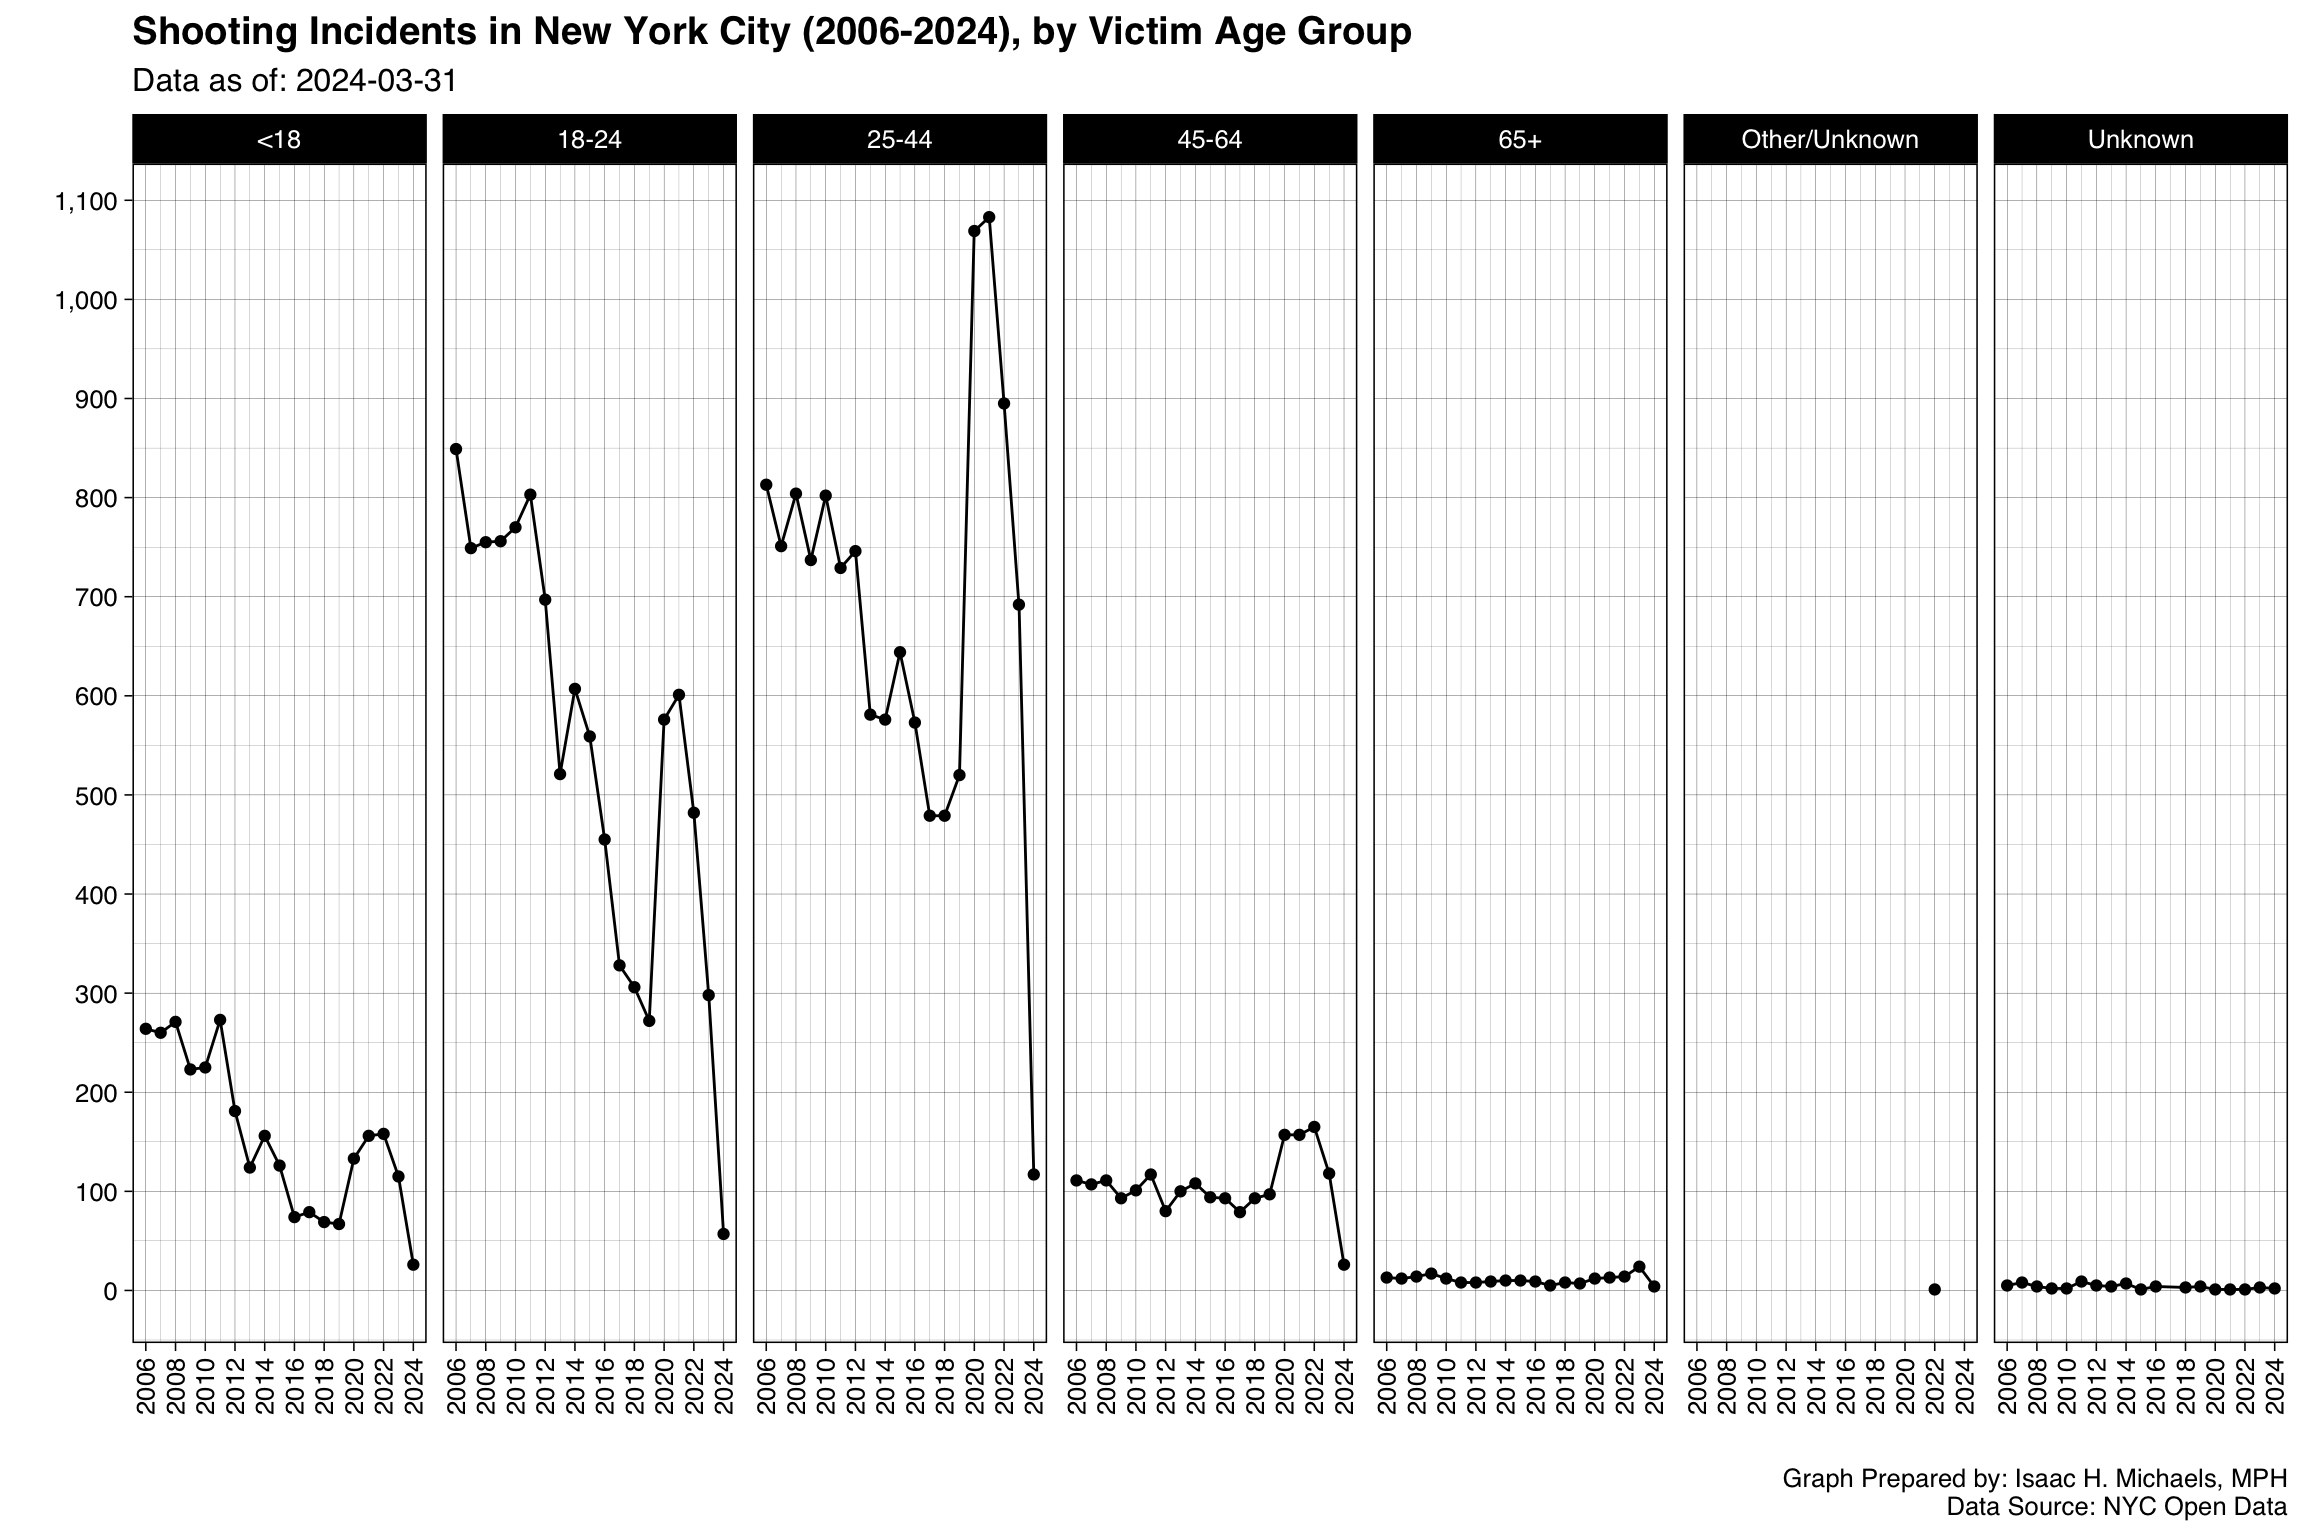
Age Groups
Cumulative Counts
 Graph Prepared By: Isaac H. Michaels, MPH
Data Source: NYC Open Data (Current, Historical)
Trends
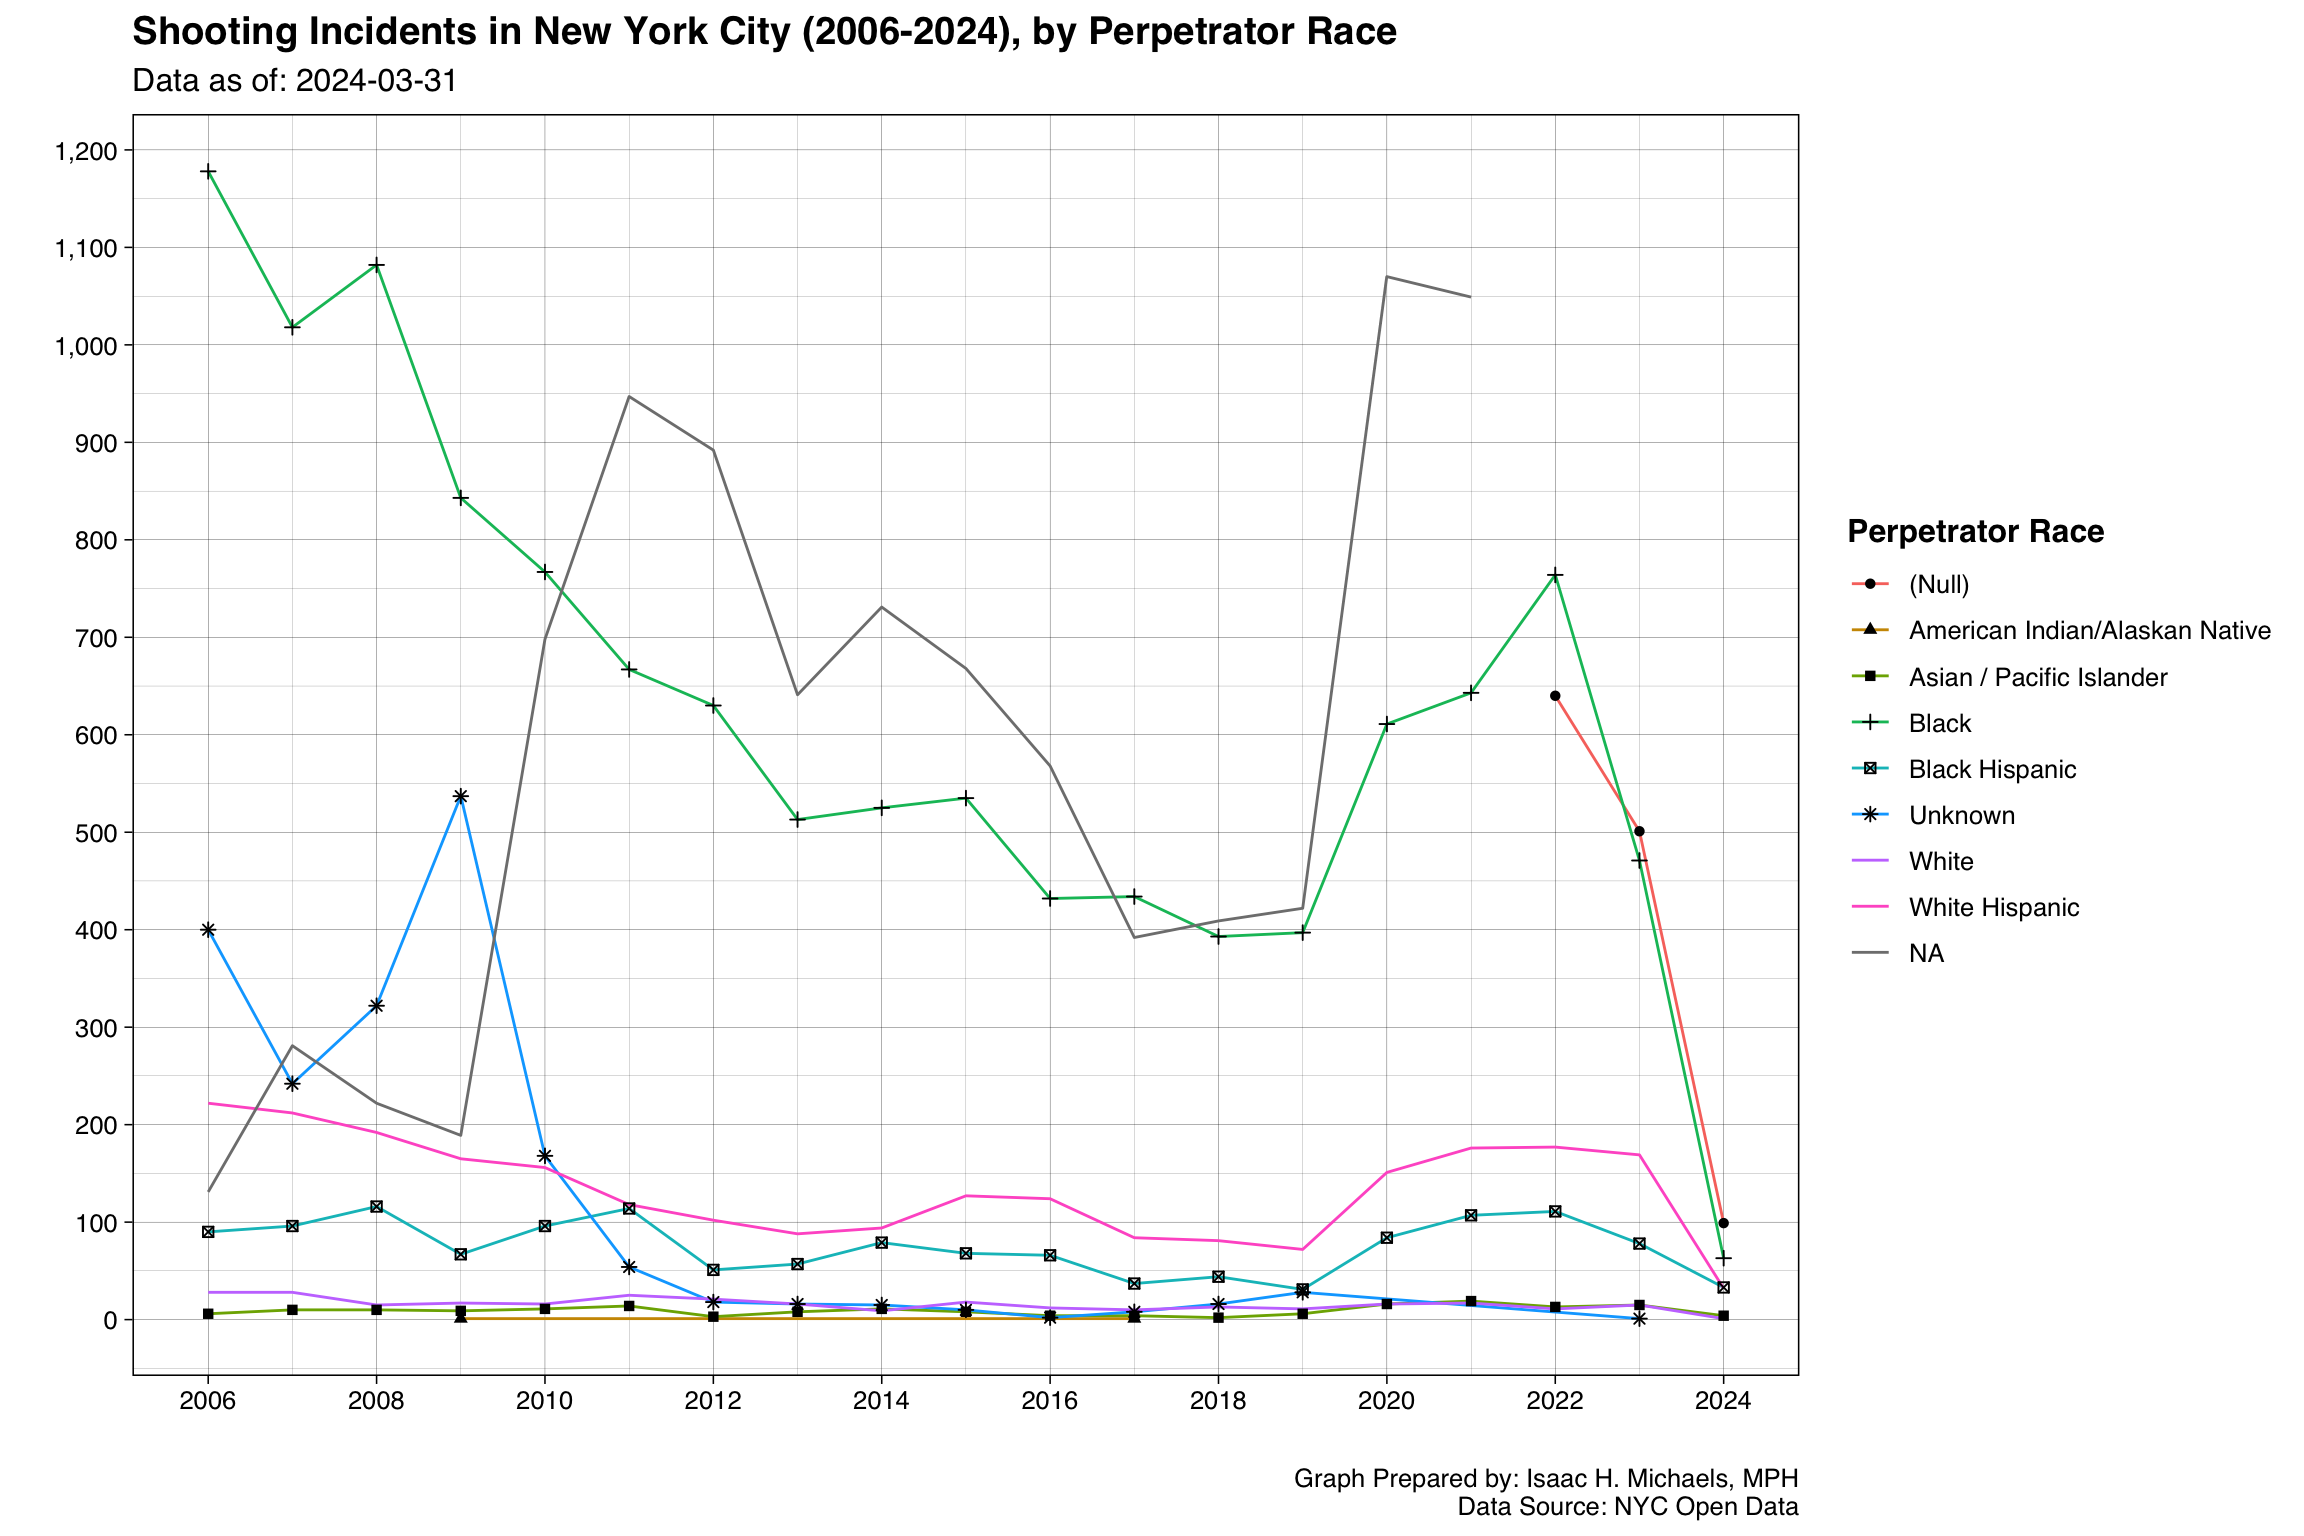
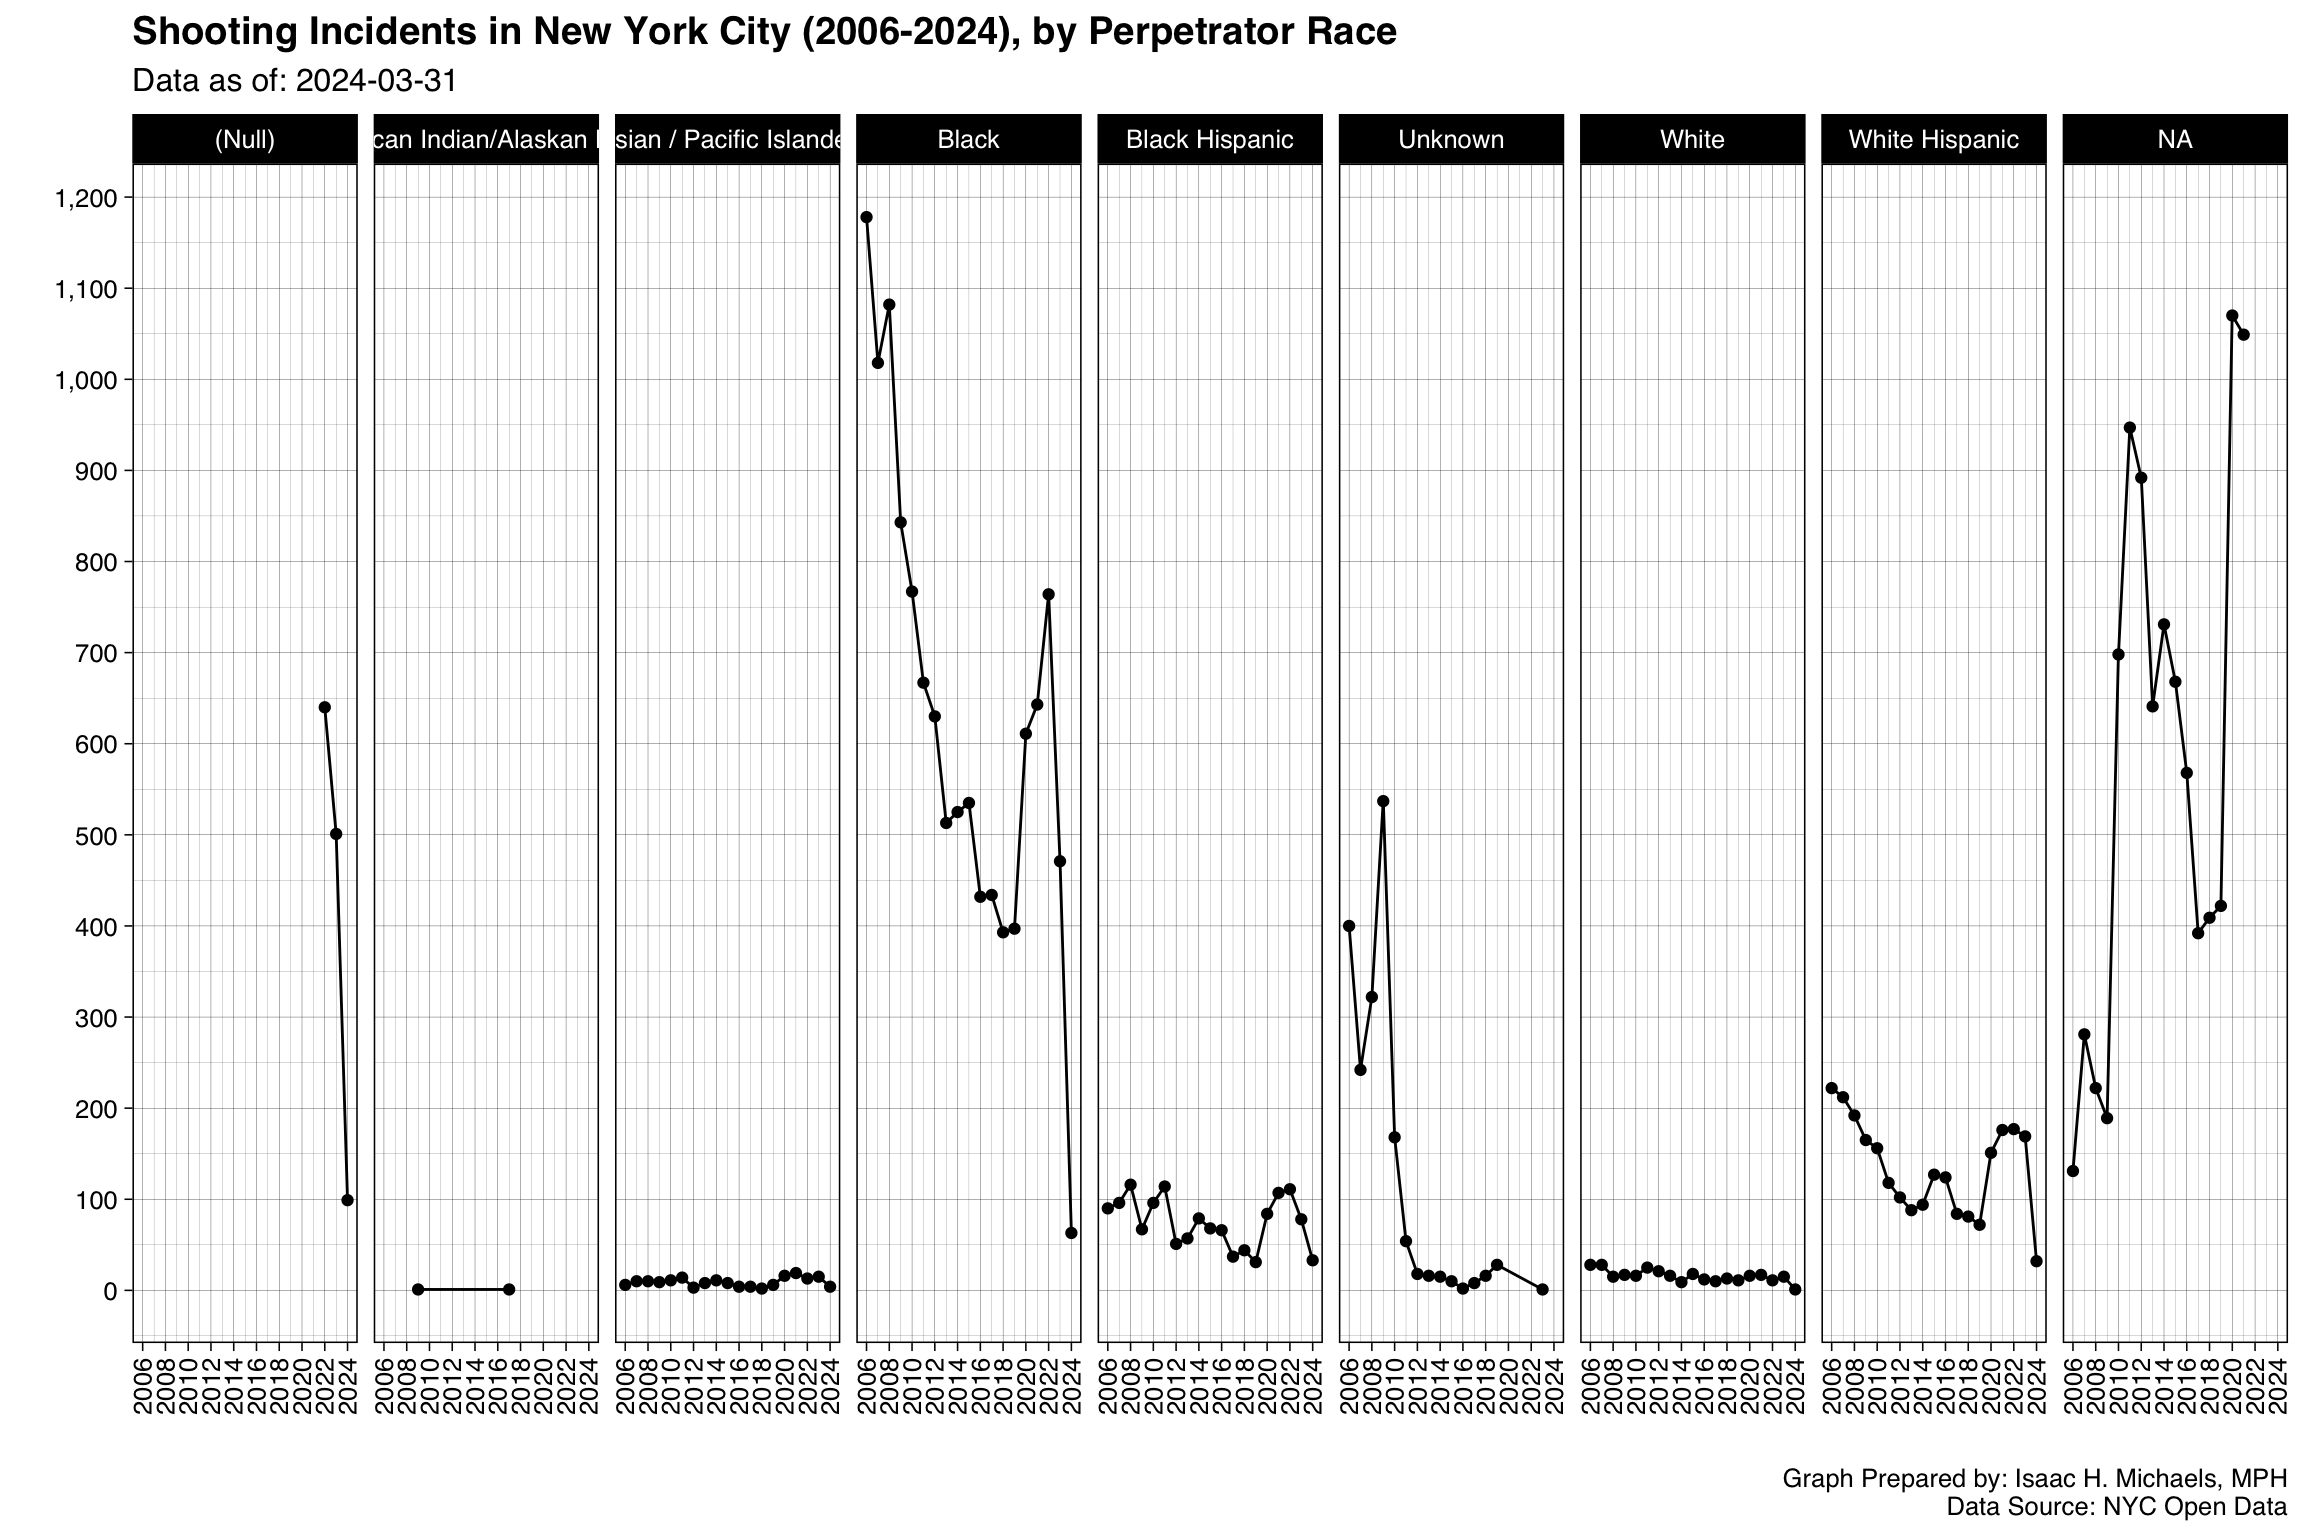
Perpetrators
 Graph Prepared By: Isaac H. Michaels, MPH
Data Source: NYC Open Data (Current, Historical)
 Graph Prepared By: Isaac H. Michaels, MPH
Data Source: NYC Open Data (Current, Historical)
Victims
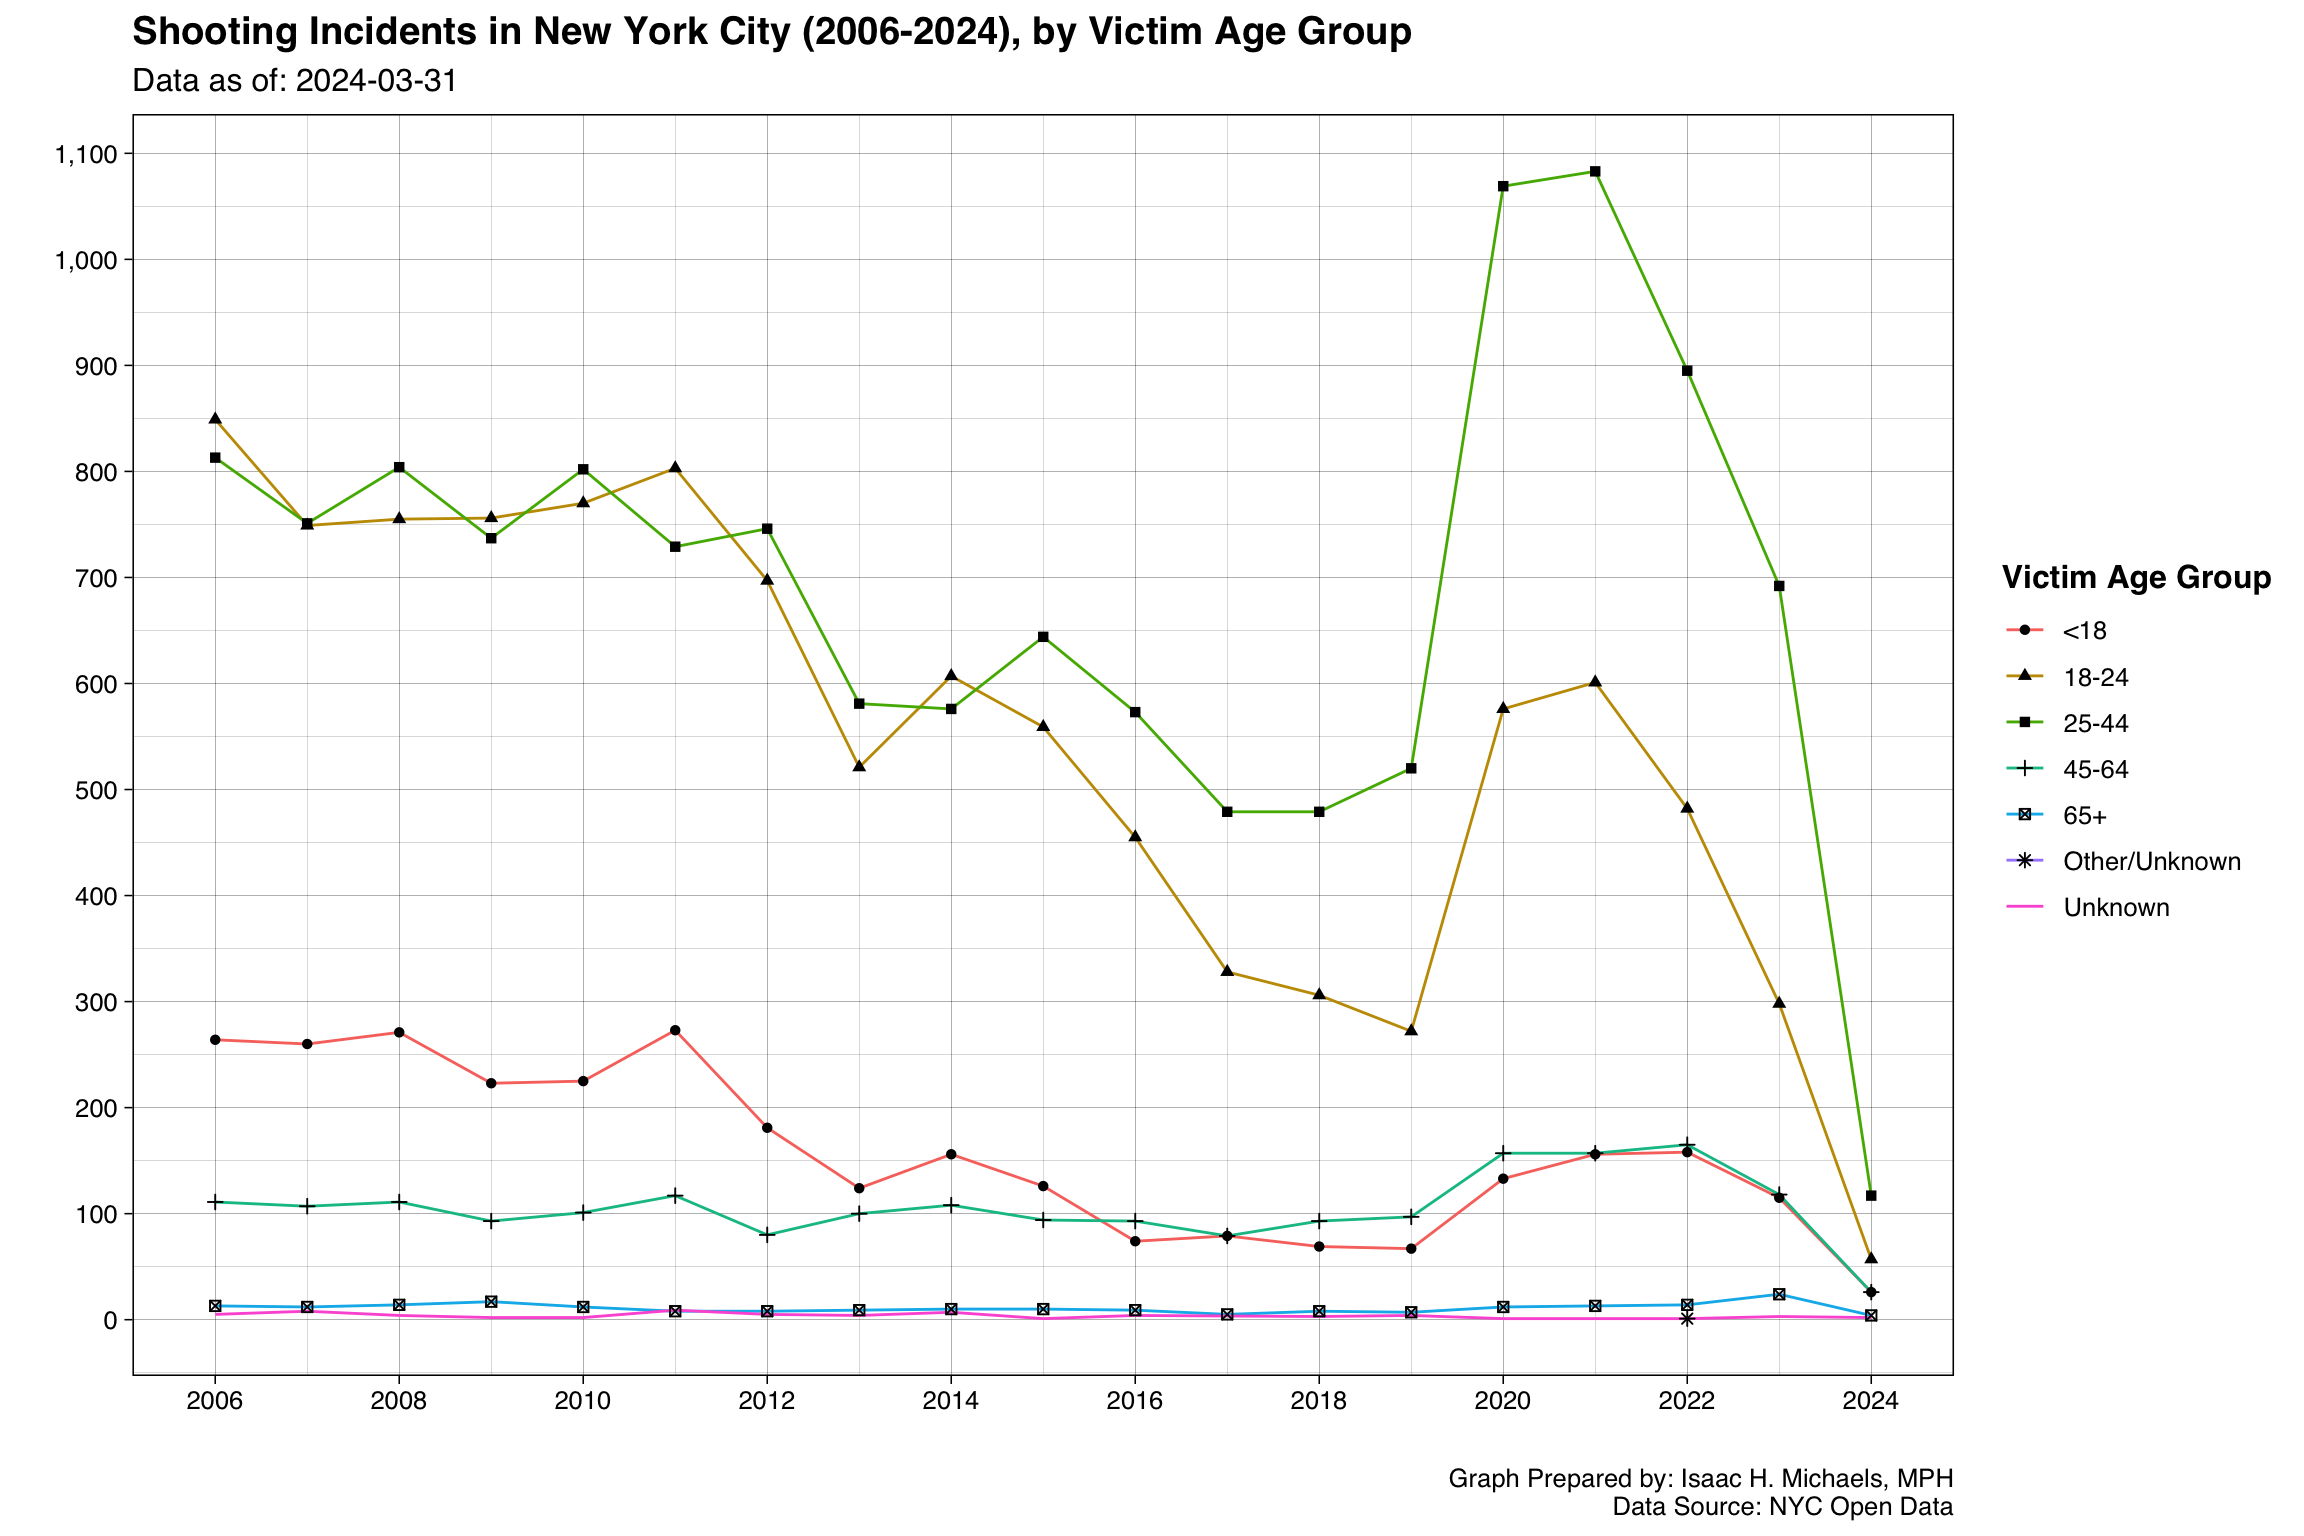 Graph Prepared By: Isaac H. Michaels, MPH
Data Source: NYC Open Data (Current, Historical)
 Graph Prepared By: Isaac H. Michaels, MPH
Data Source: NYC Open Data (Current, Historical)
Genders
Cumulative Counts
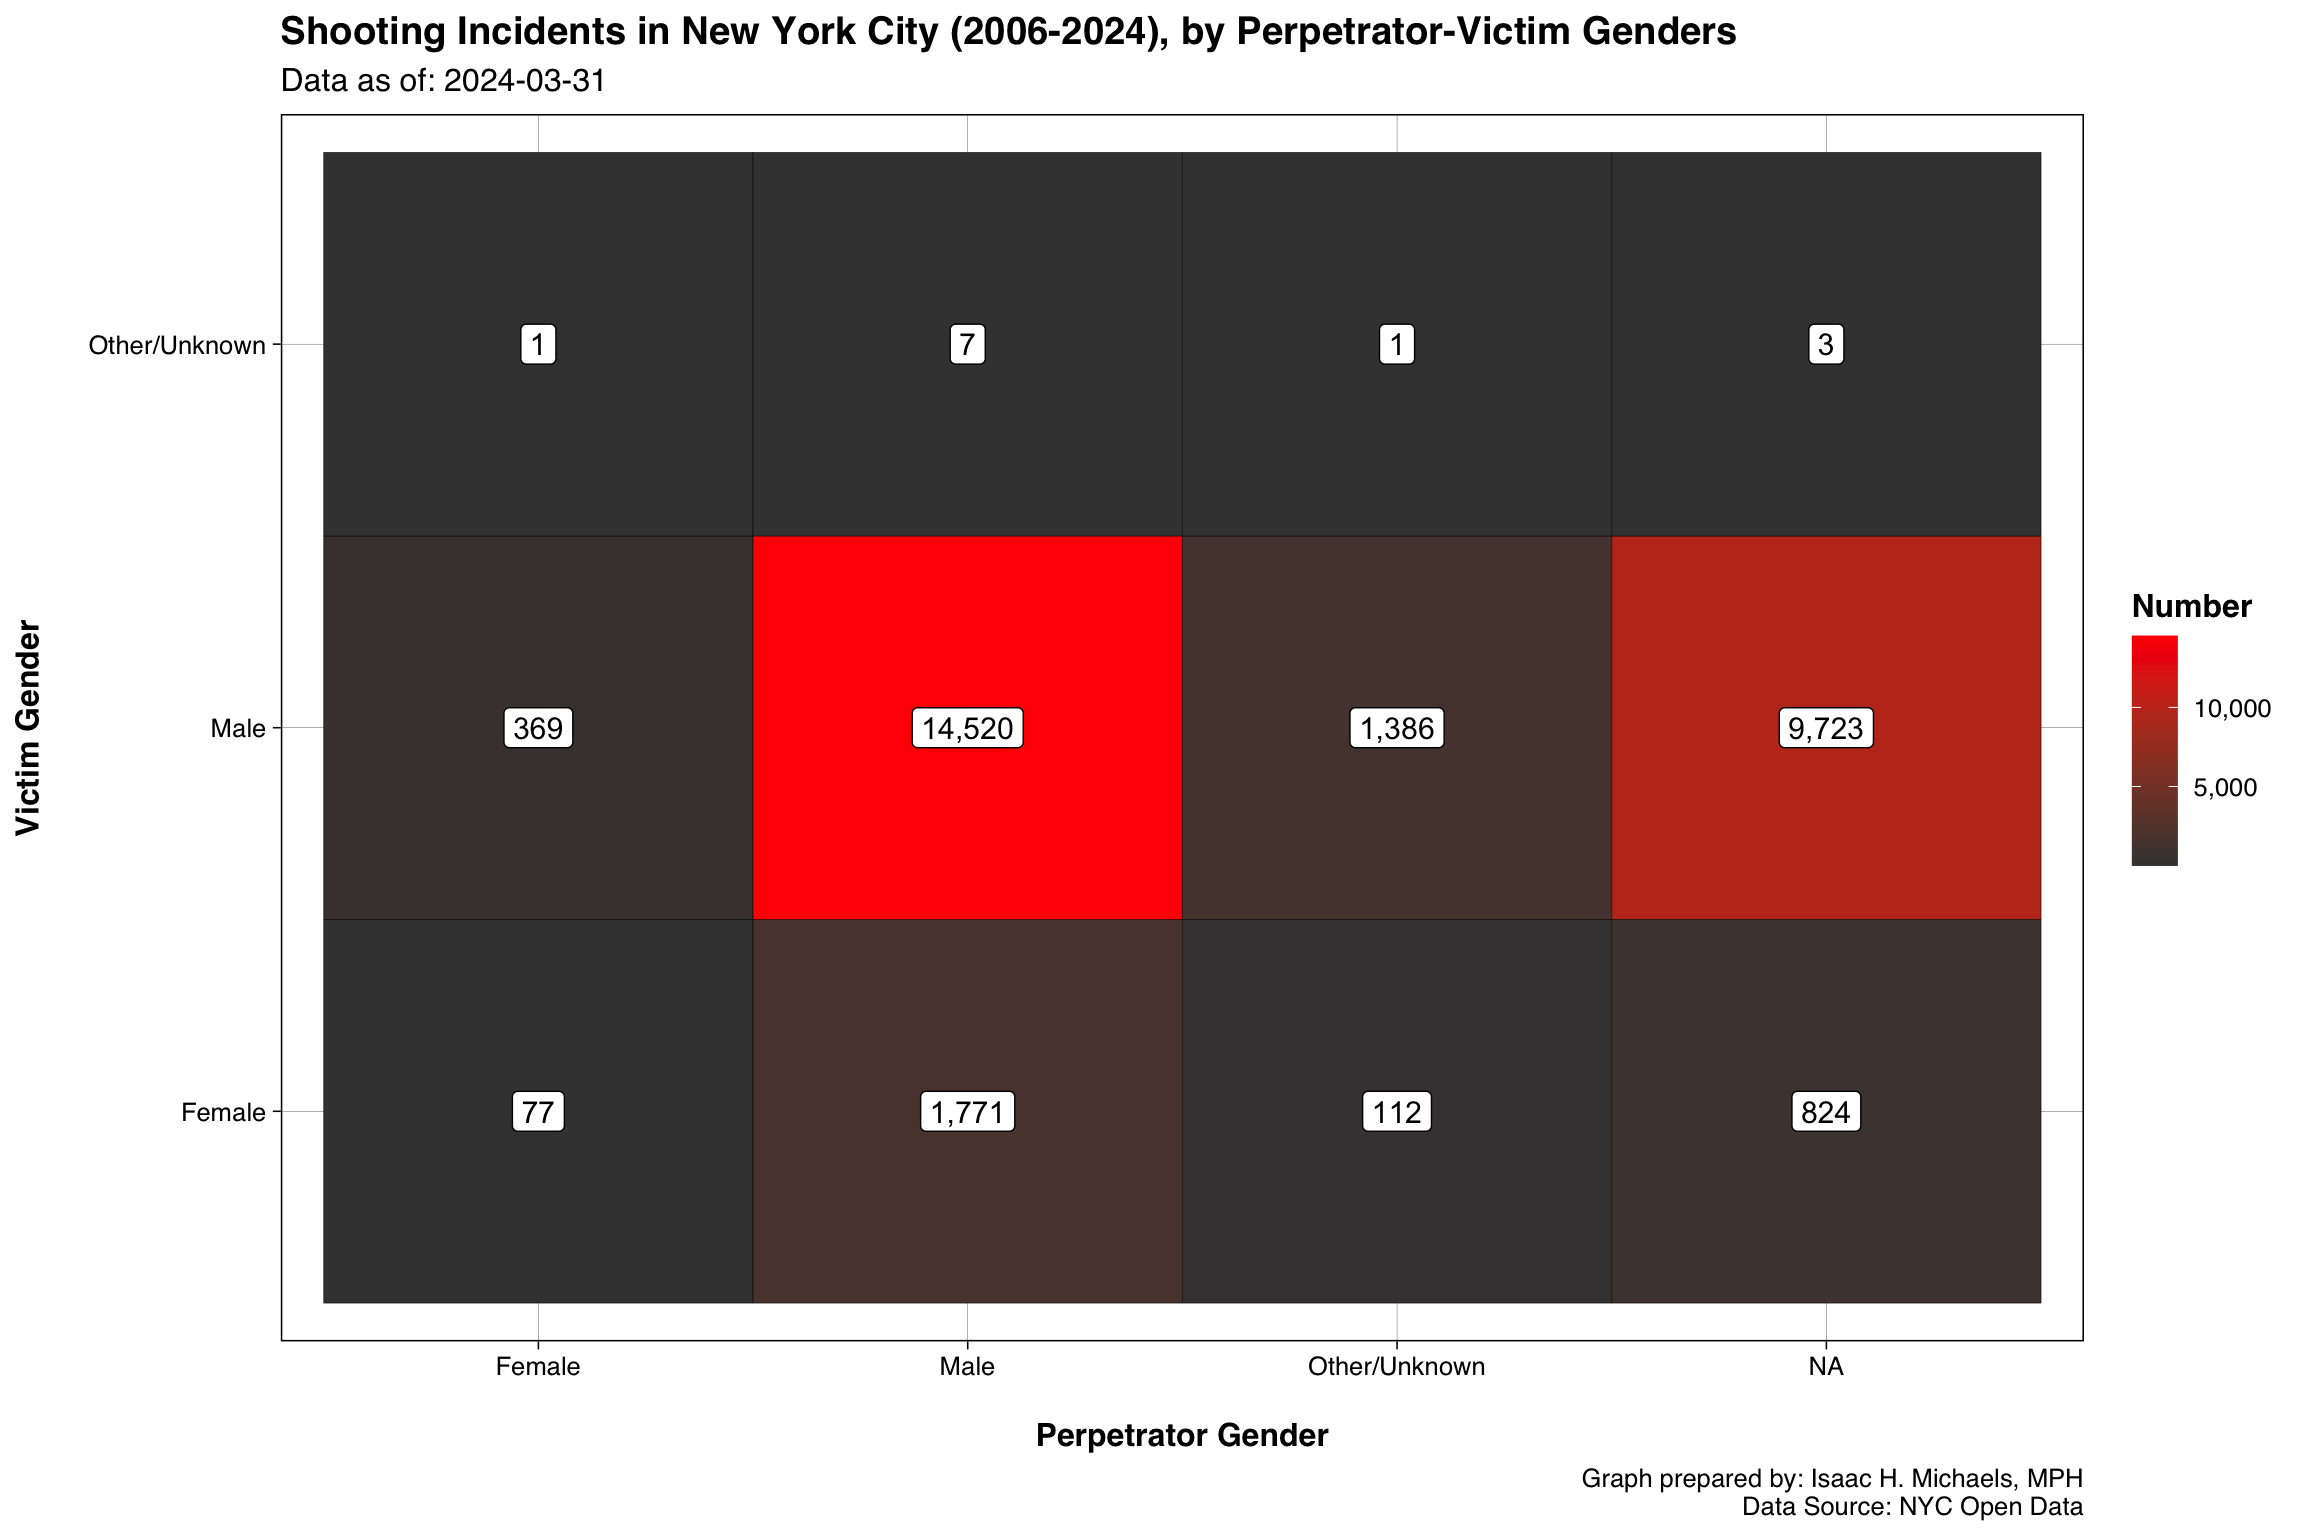 Graph Prepared By: Isaac H. Michaels, MPH
Data Source: NYC Open Data (Current, Historical)
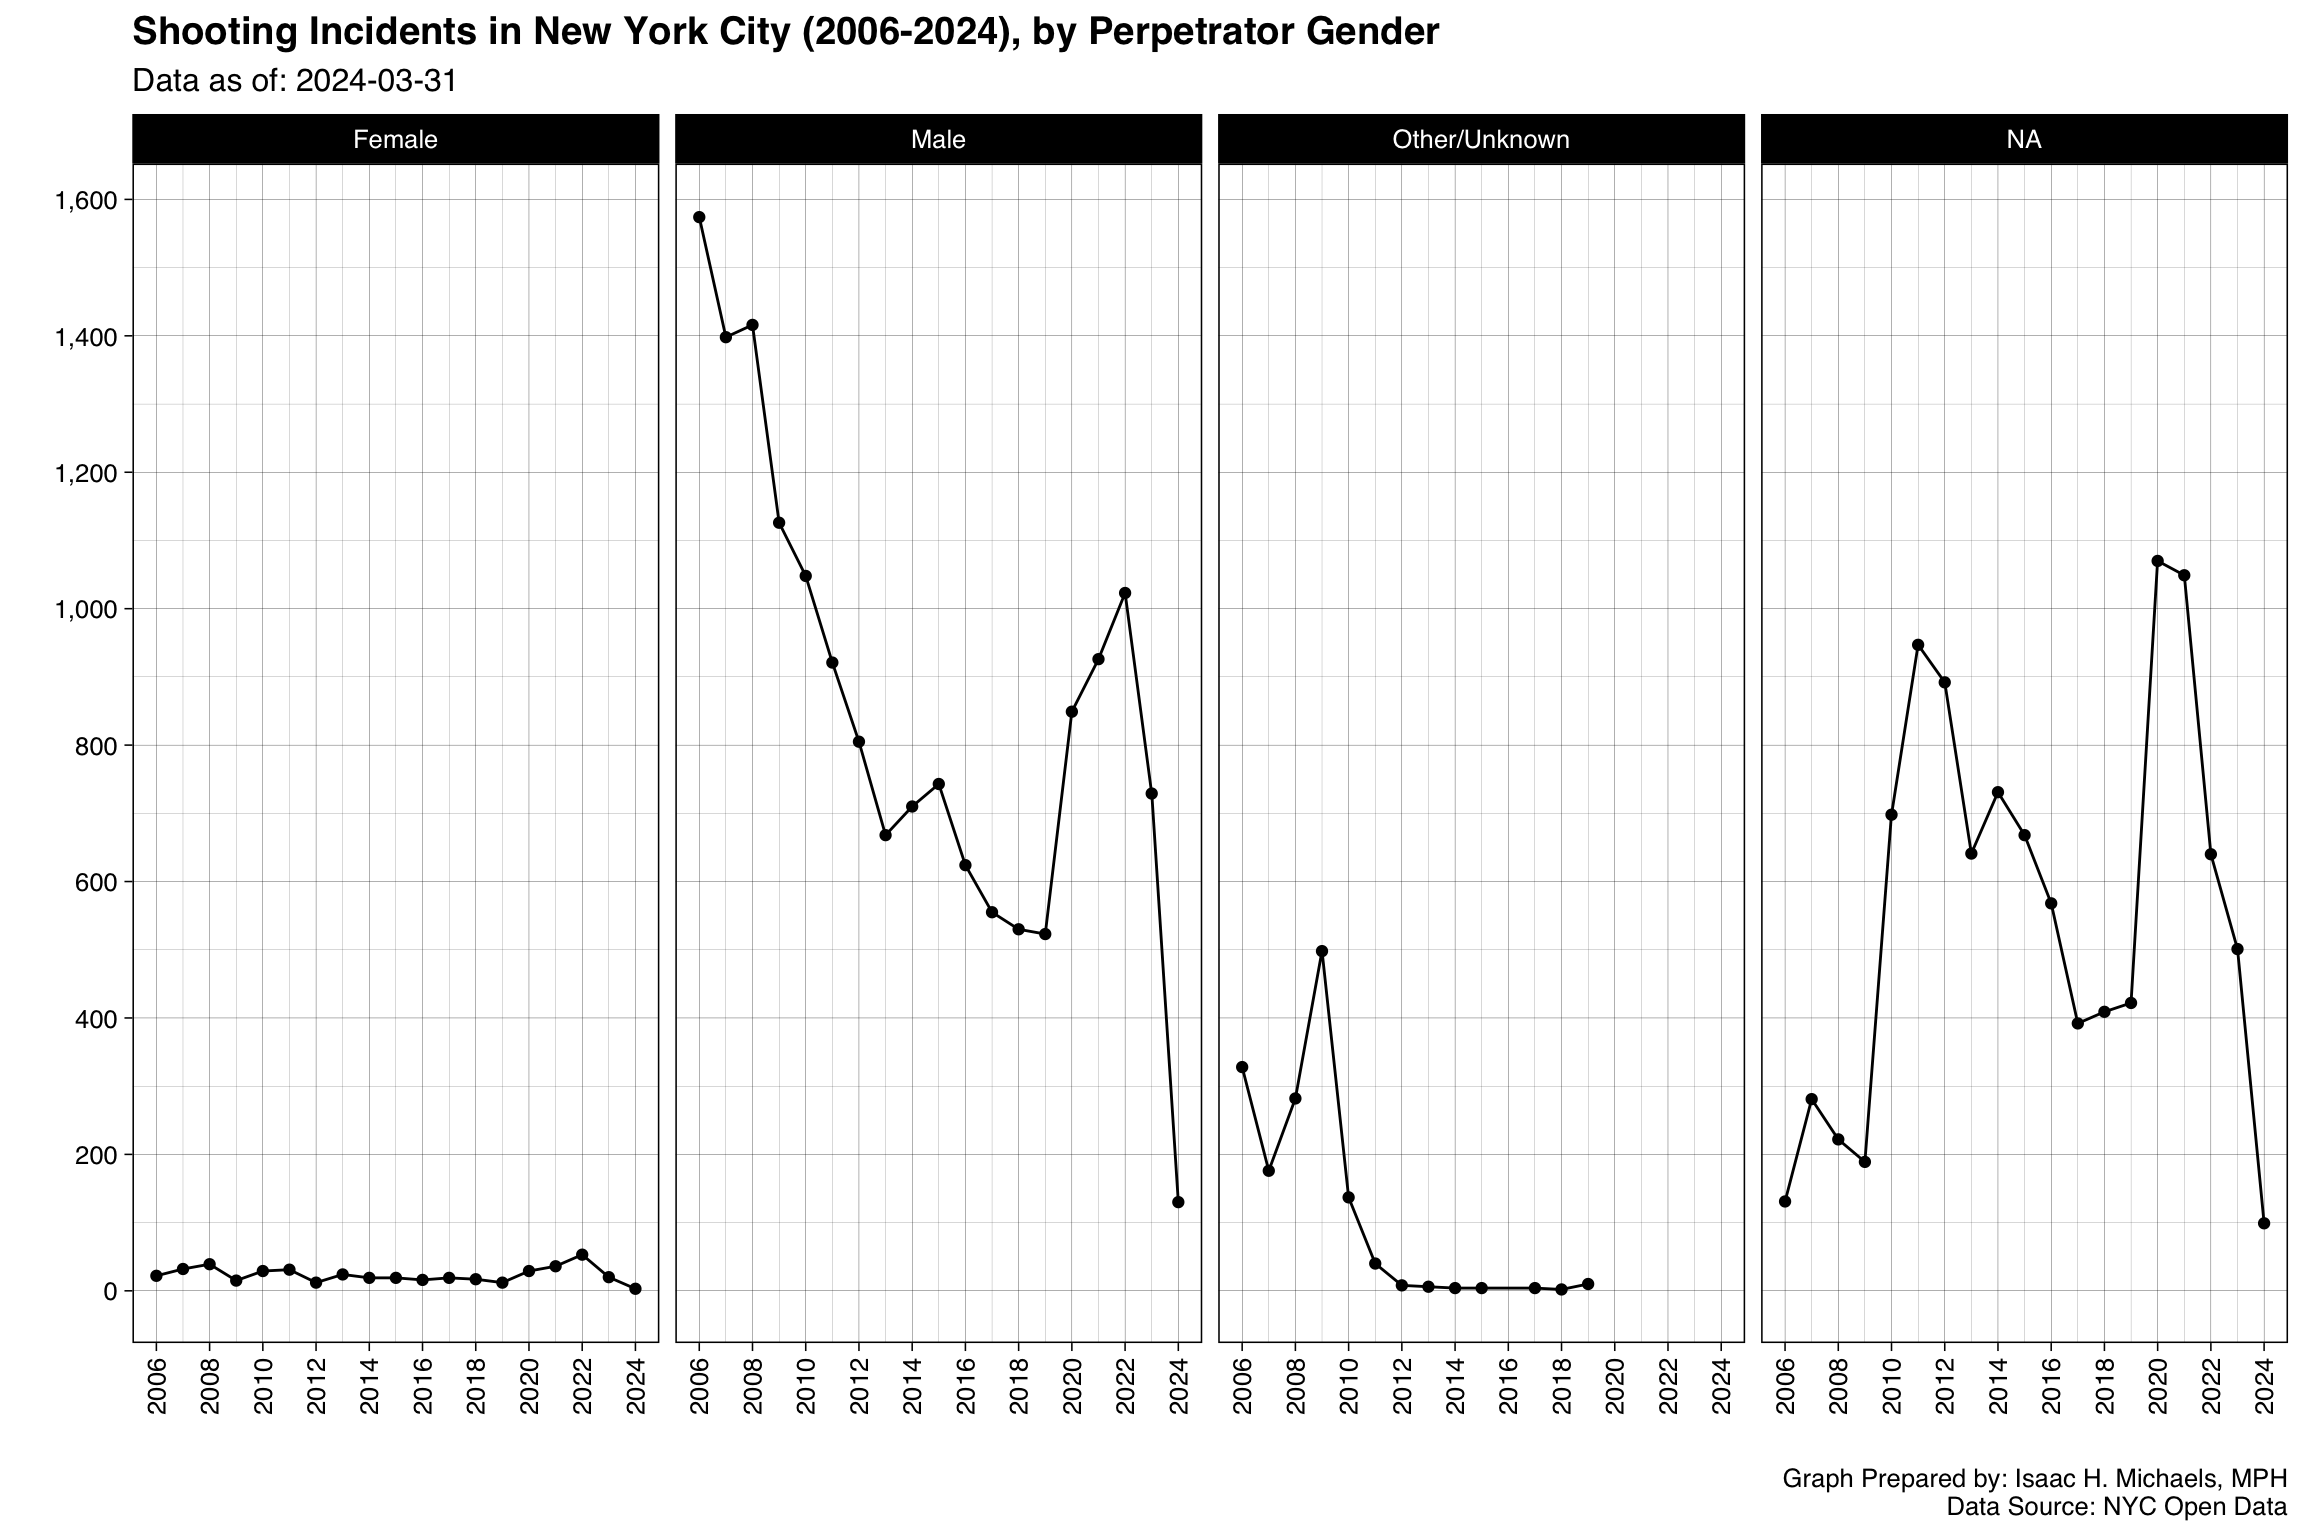
Trends
Perpetrators
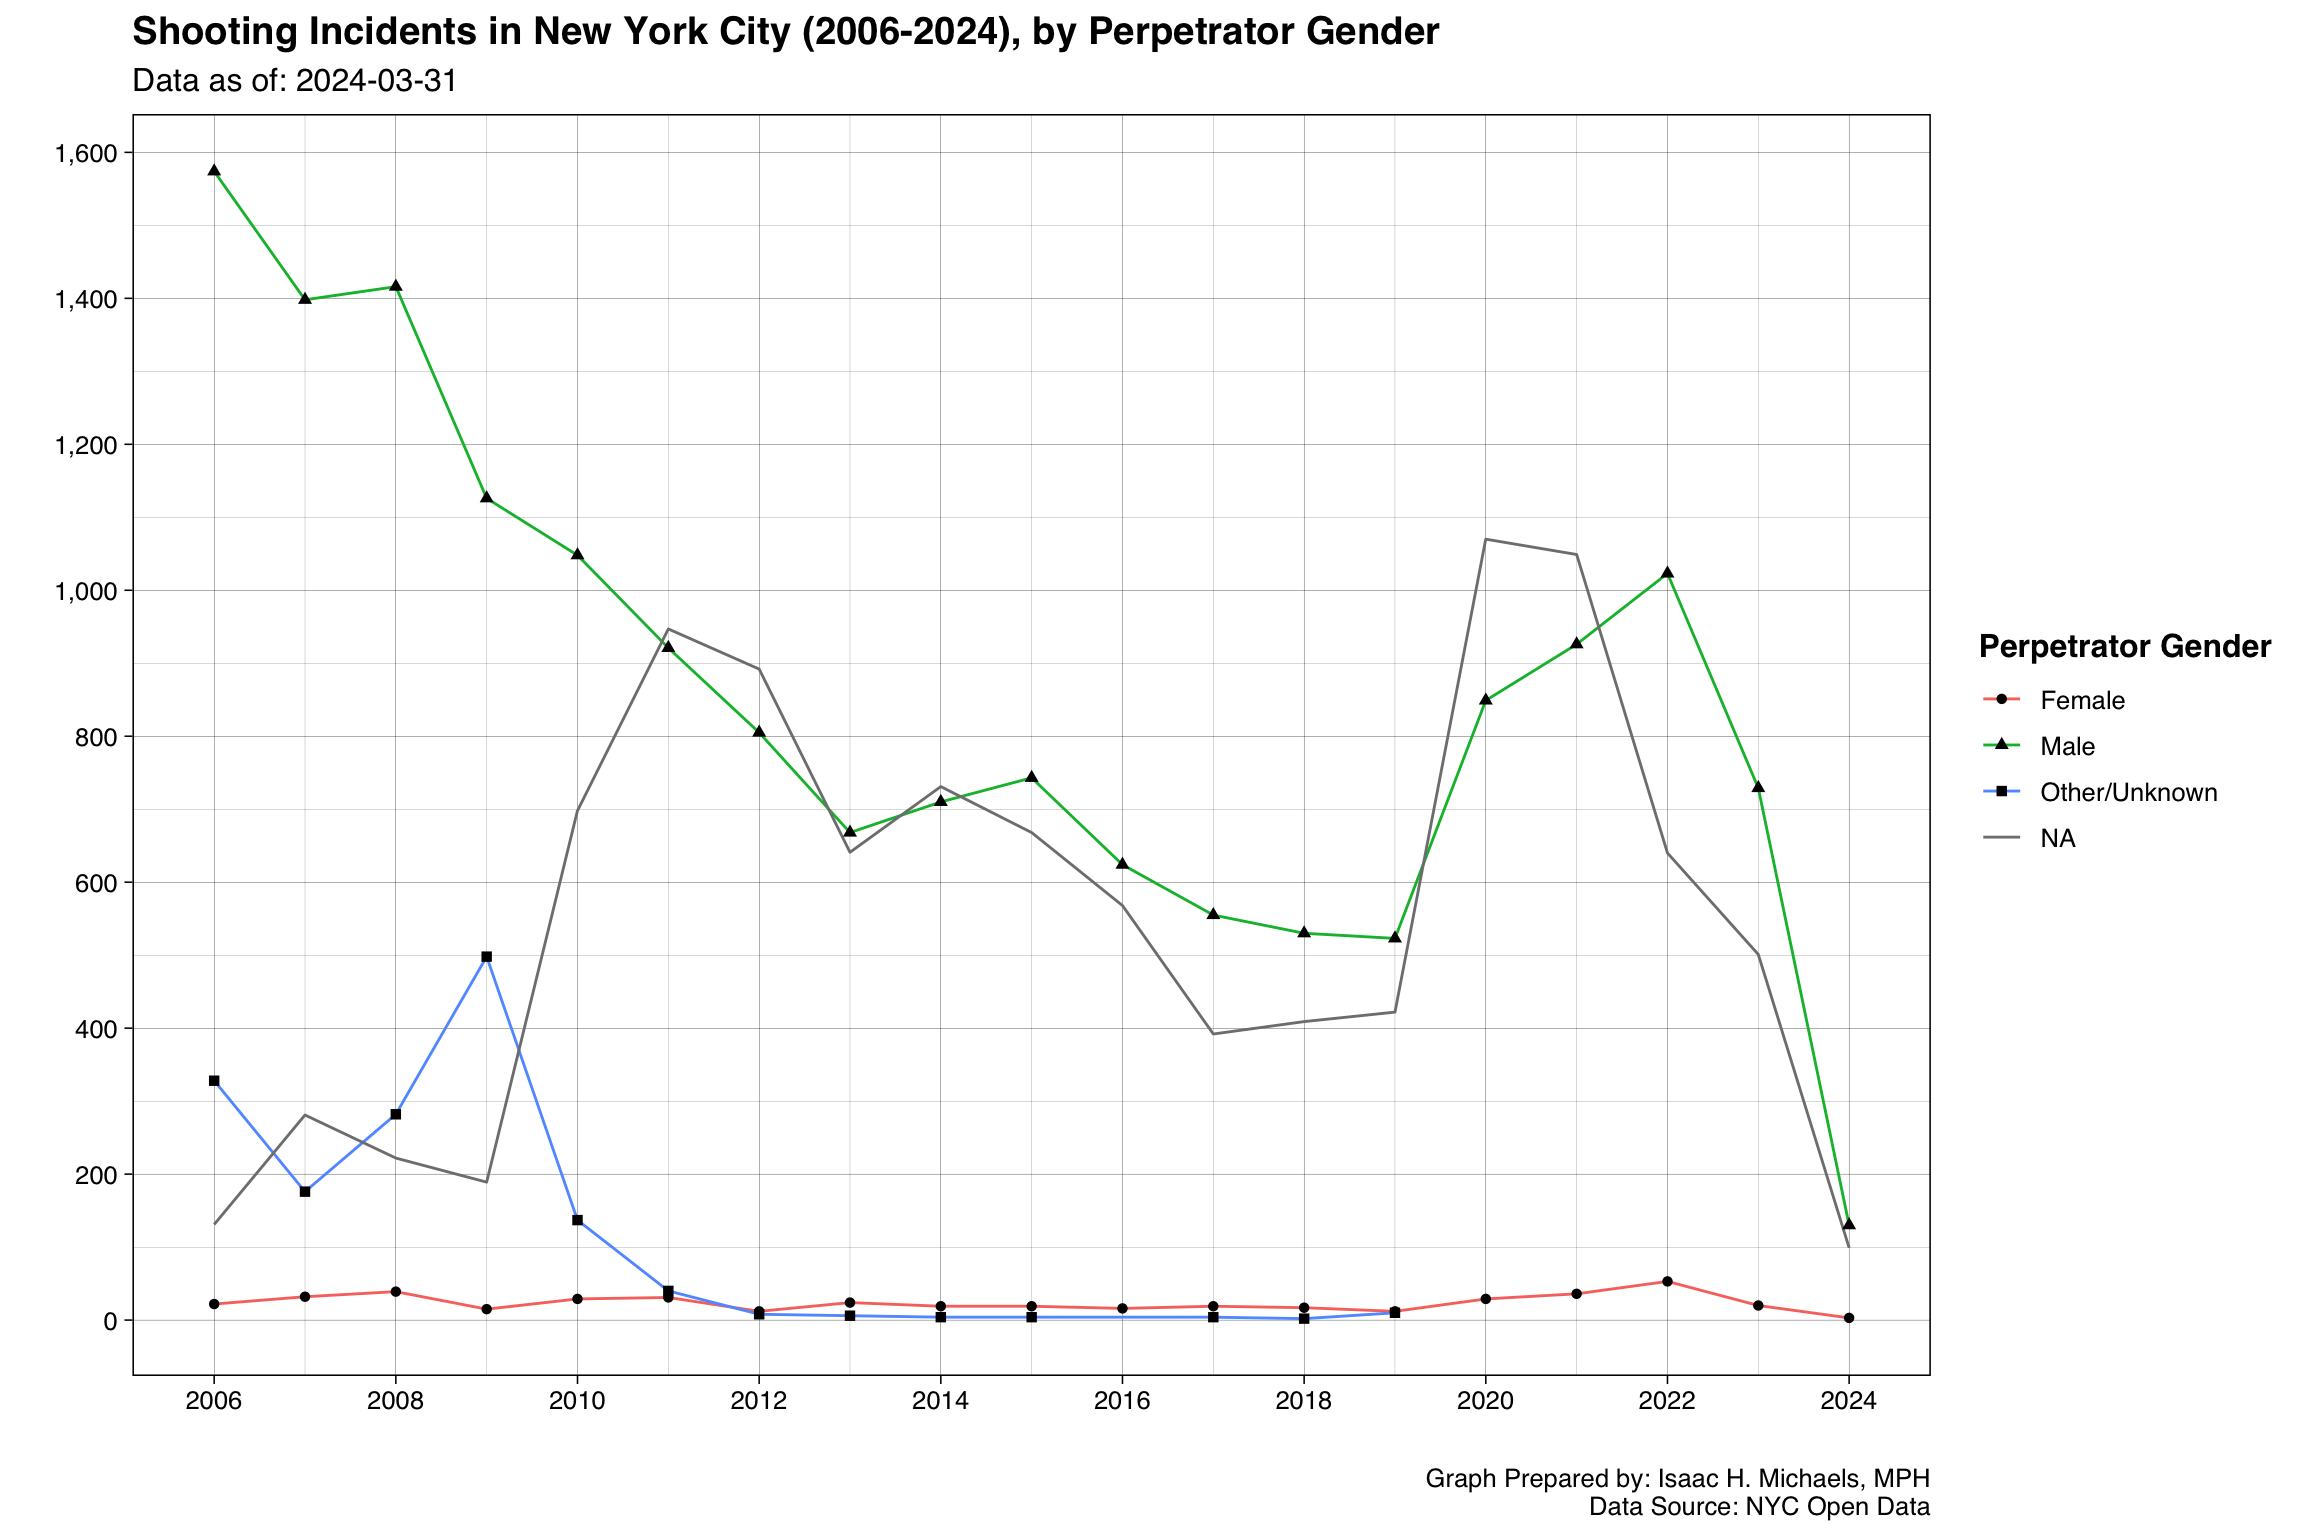 Graph Prepared By: Isaac H. Michaels, MPH
Data Source: NYC Open Data (Current, Historical)
 Graph Prepared By: Isaac H. Michaels, MPH
Data Source: NYC Open Data (Current, Historical)
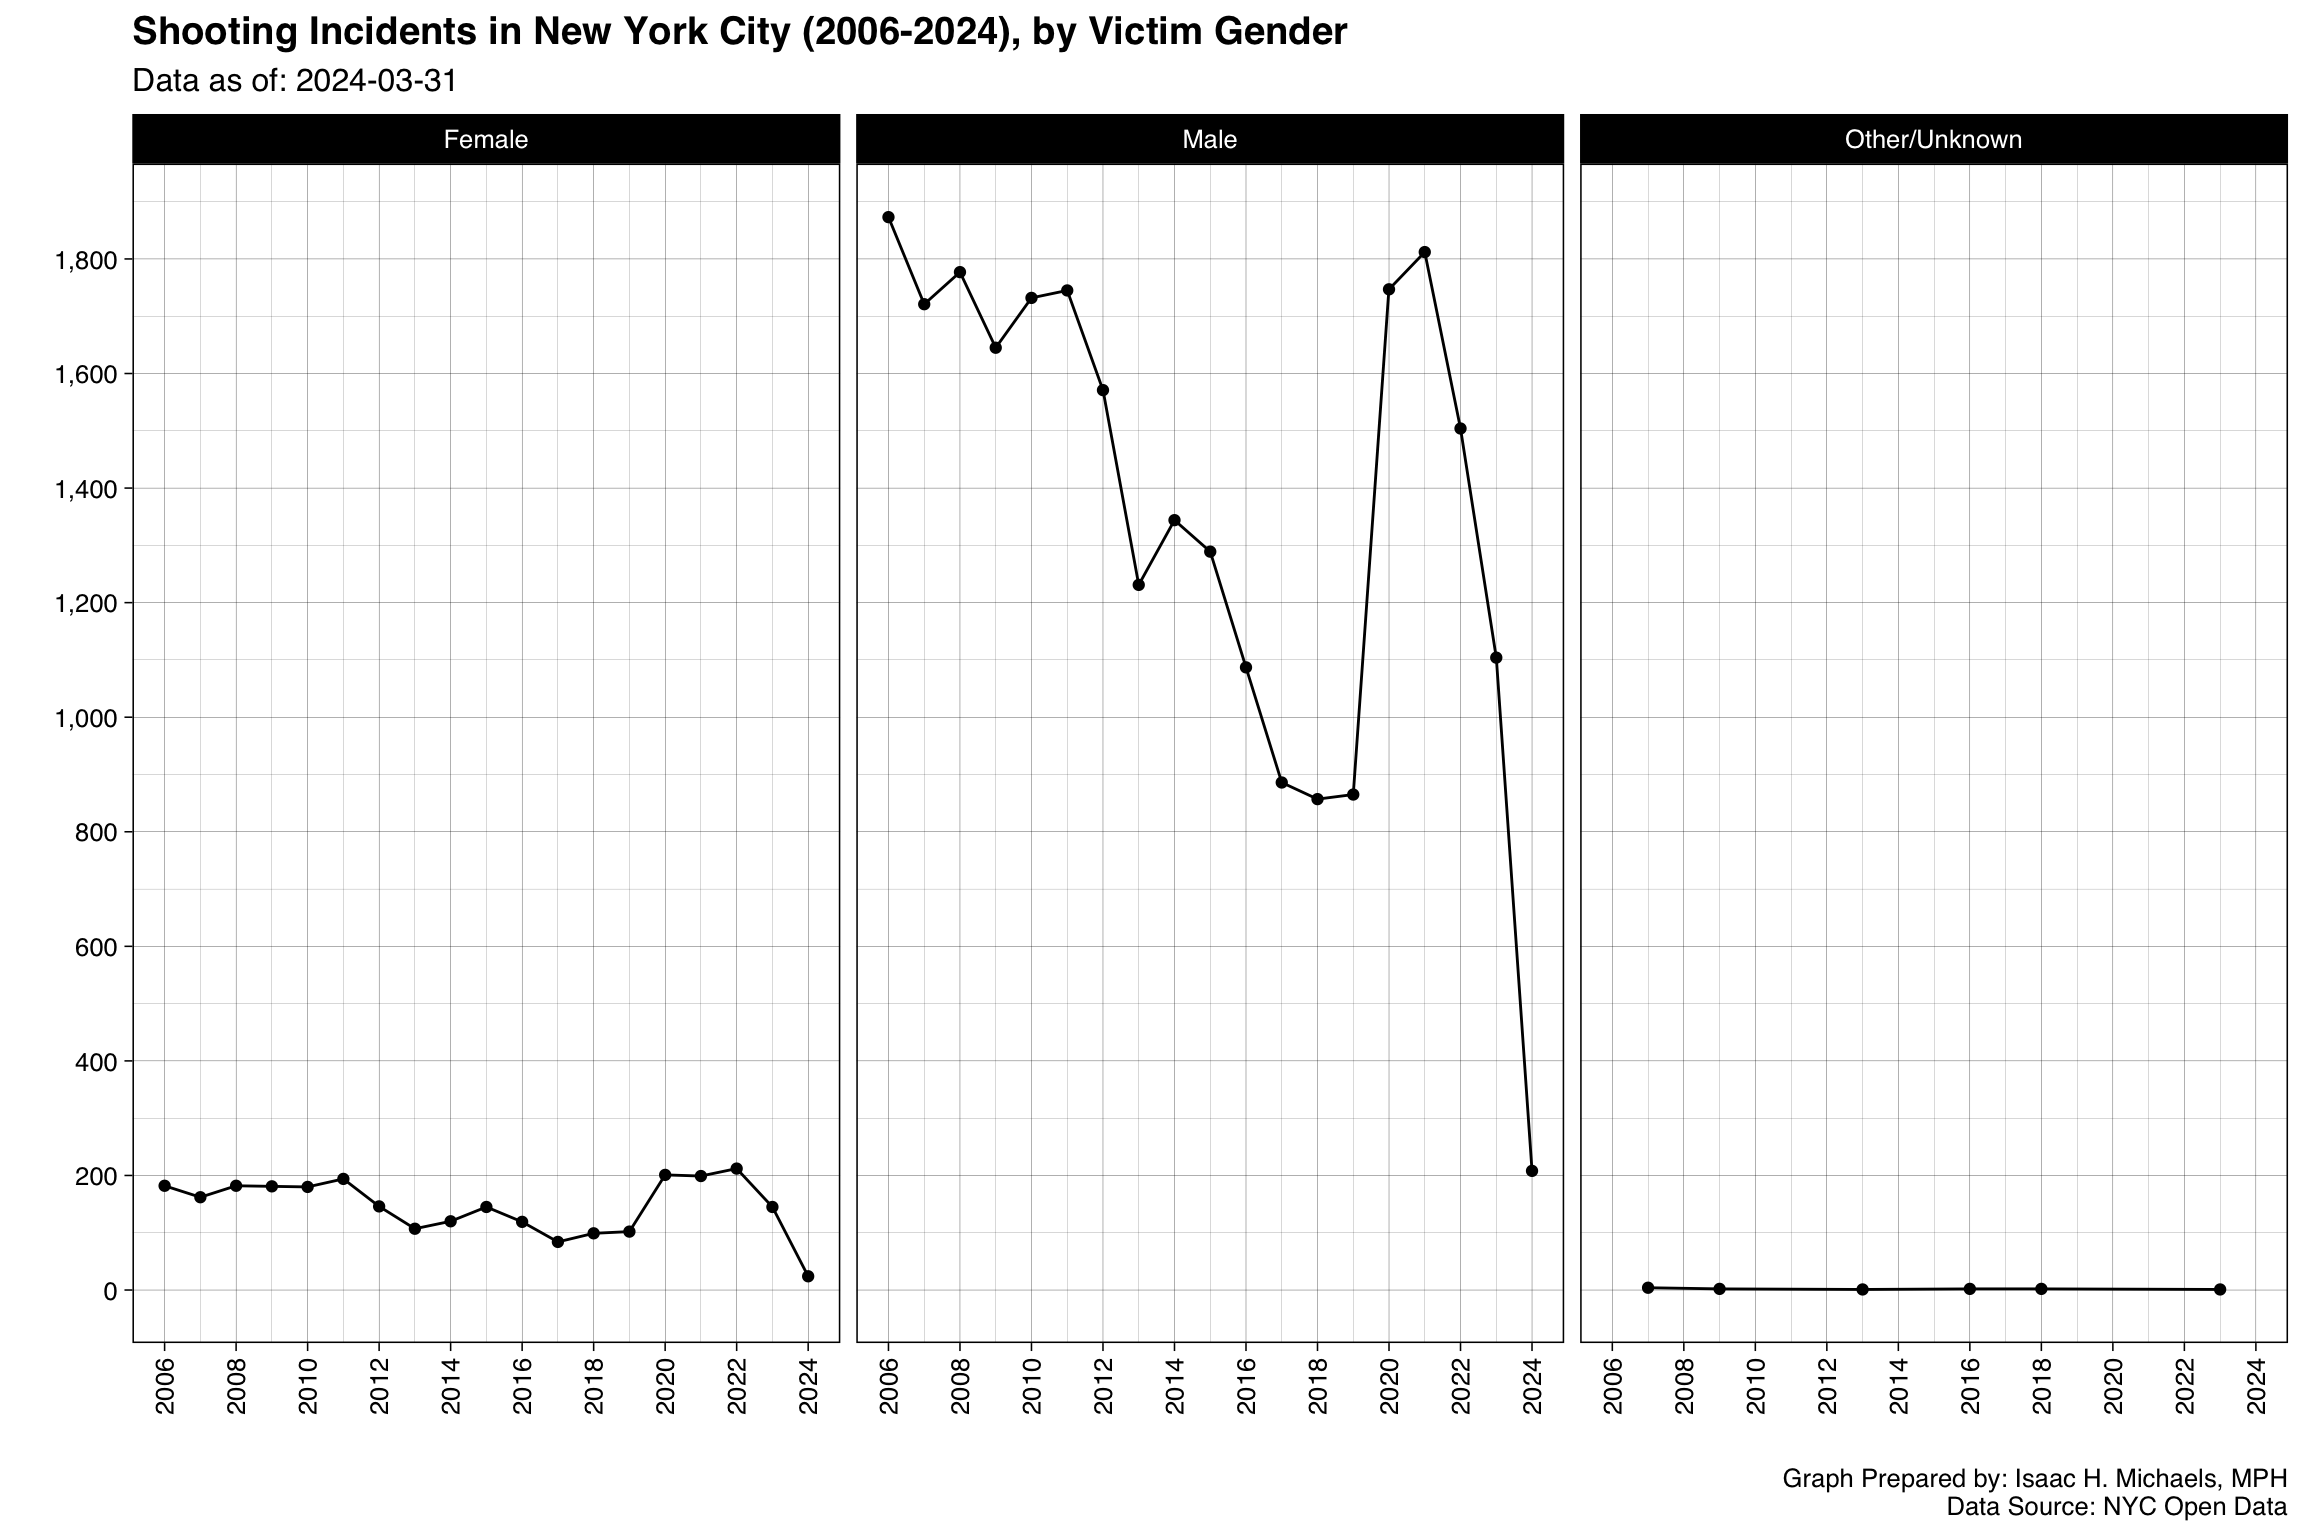
Victims
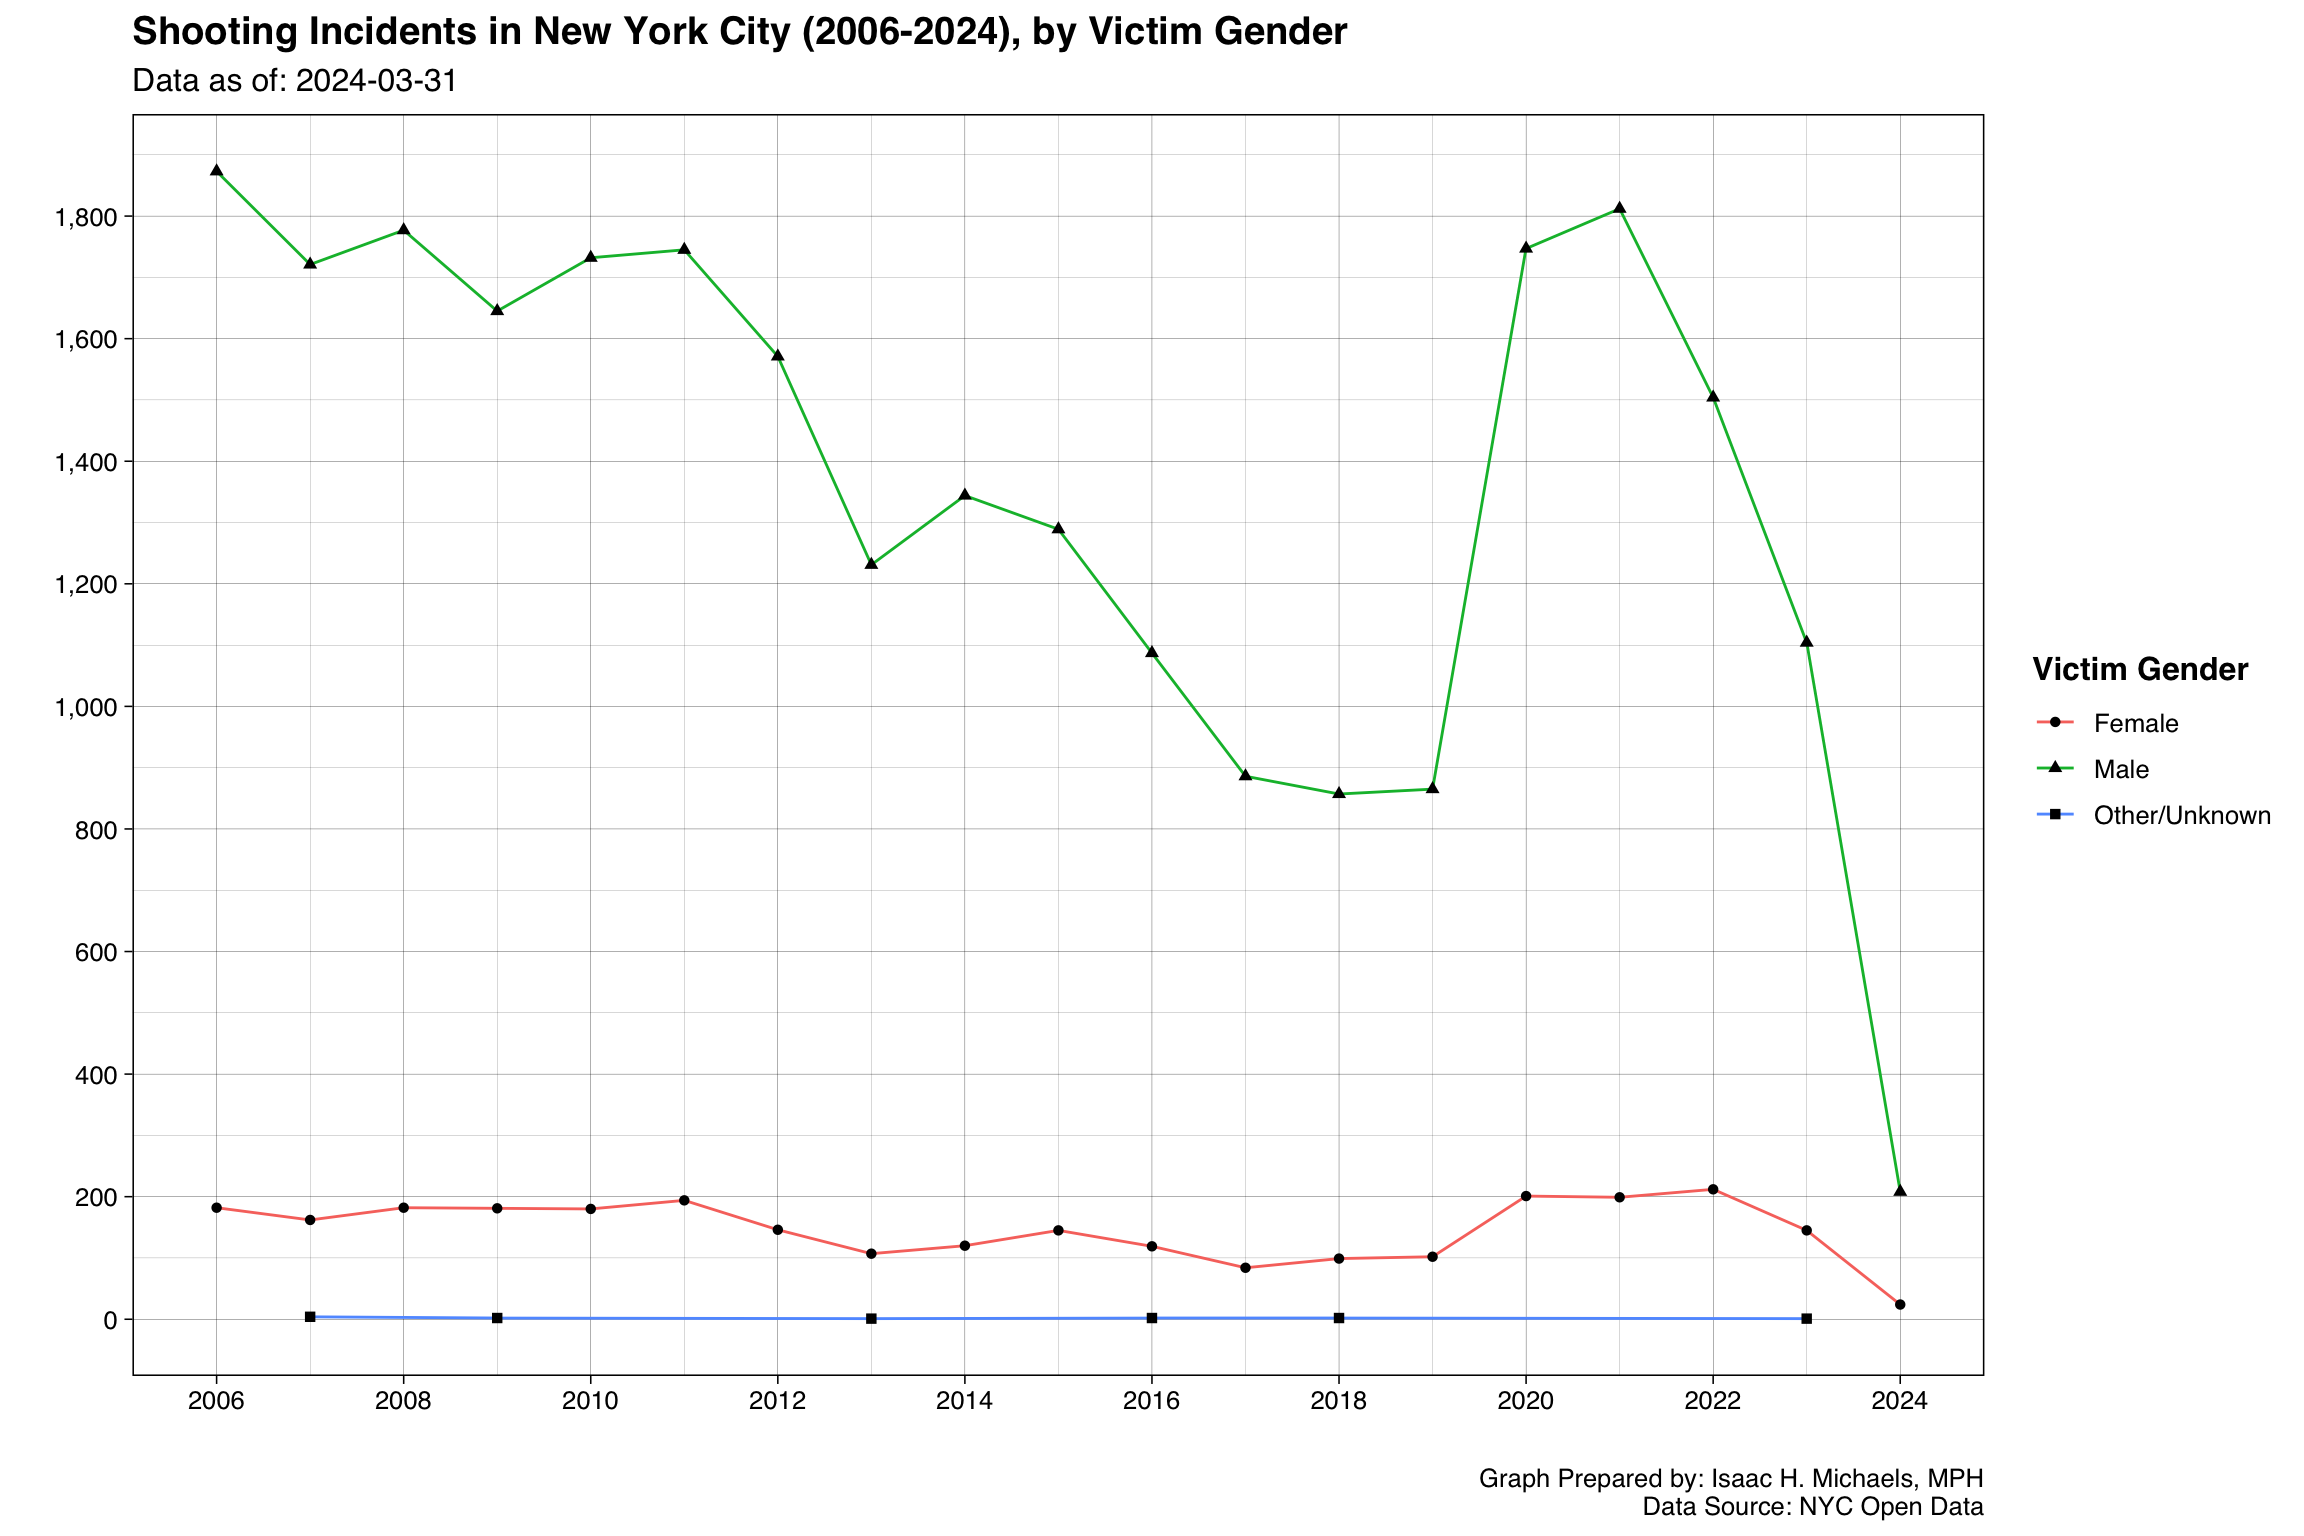 Graph Prepared By: Isaac H. Michaels, MPH
Data Source: NYC Open Data (Current, Historical)
 Graph Prepared By: Isaac H. Michaels, MPH
Data Source: NYC Open Data (Current, Historical)
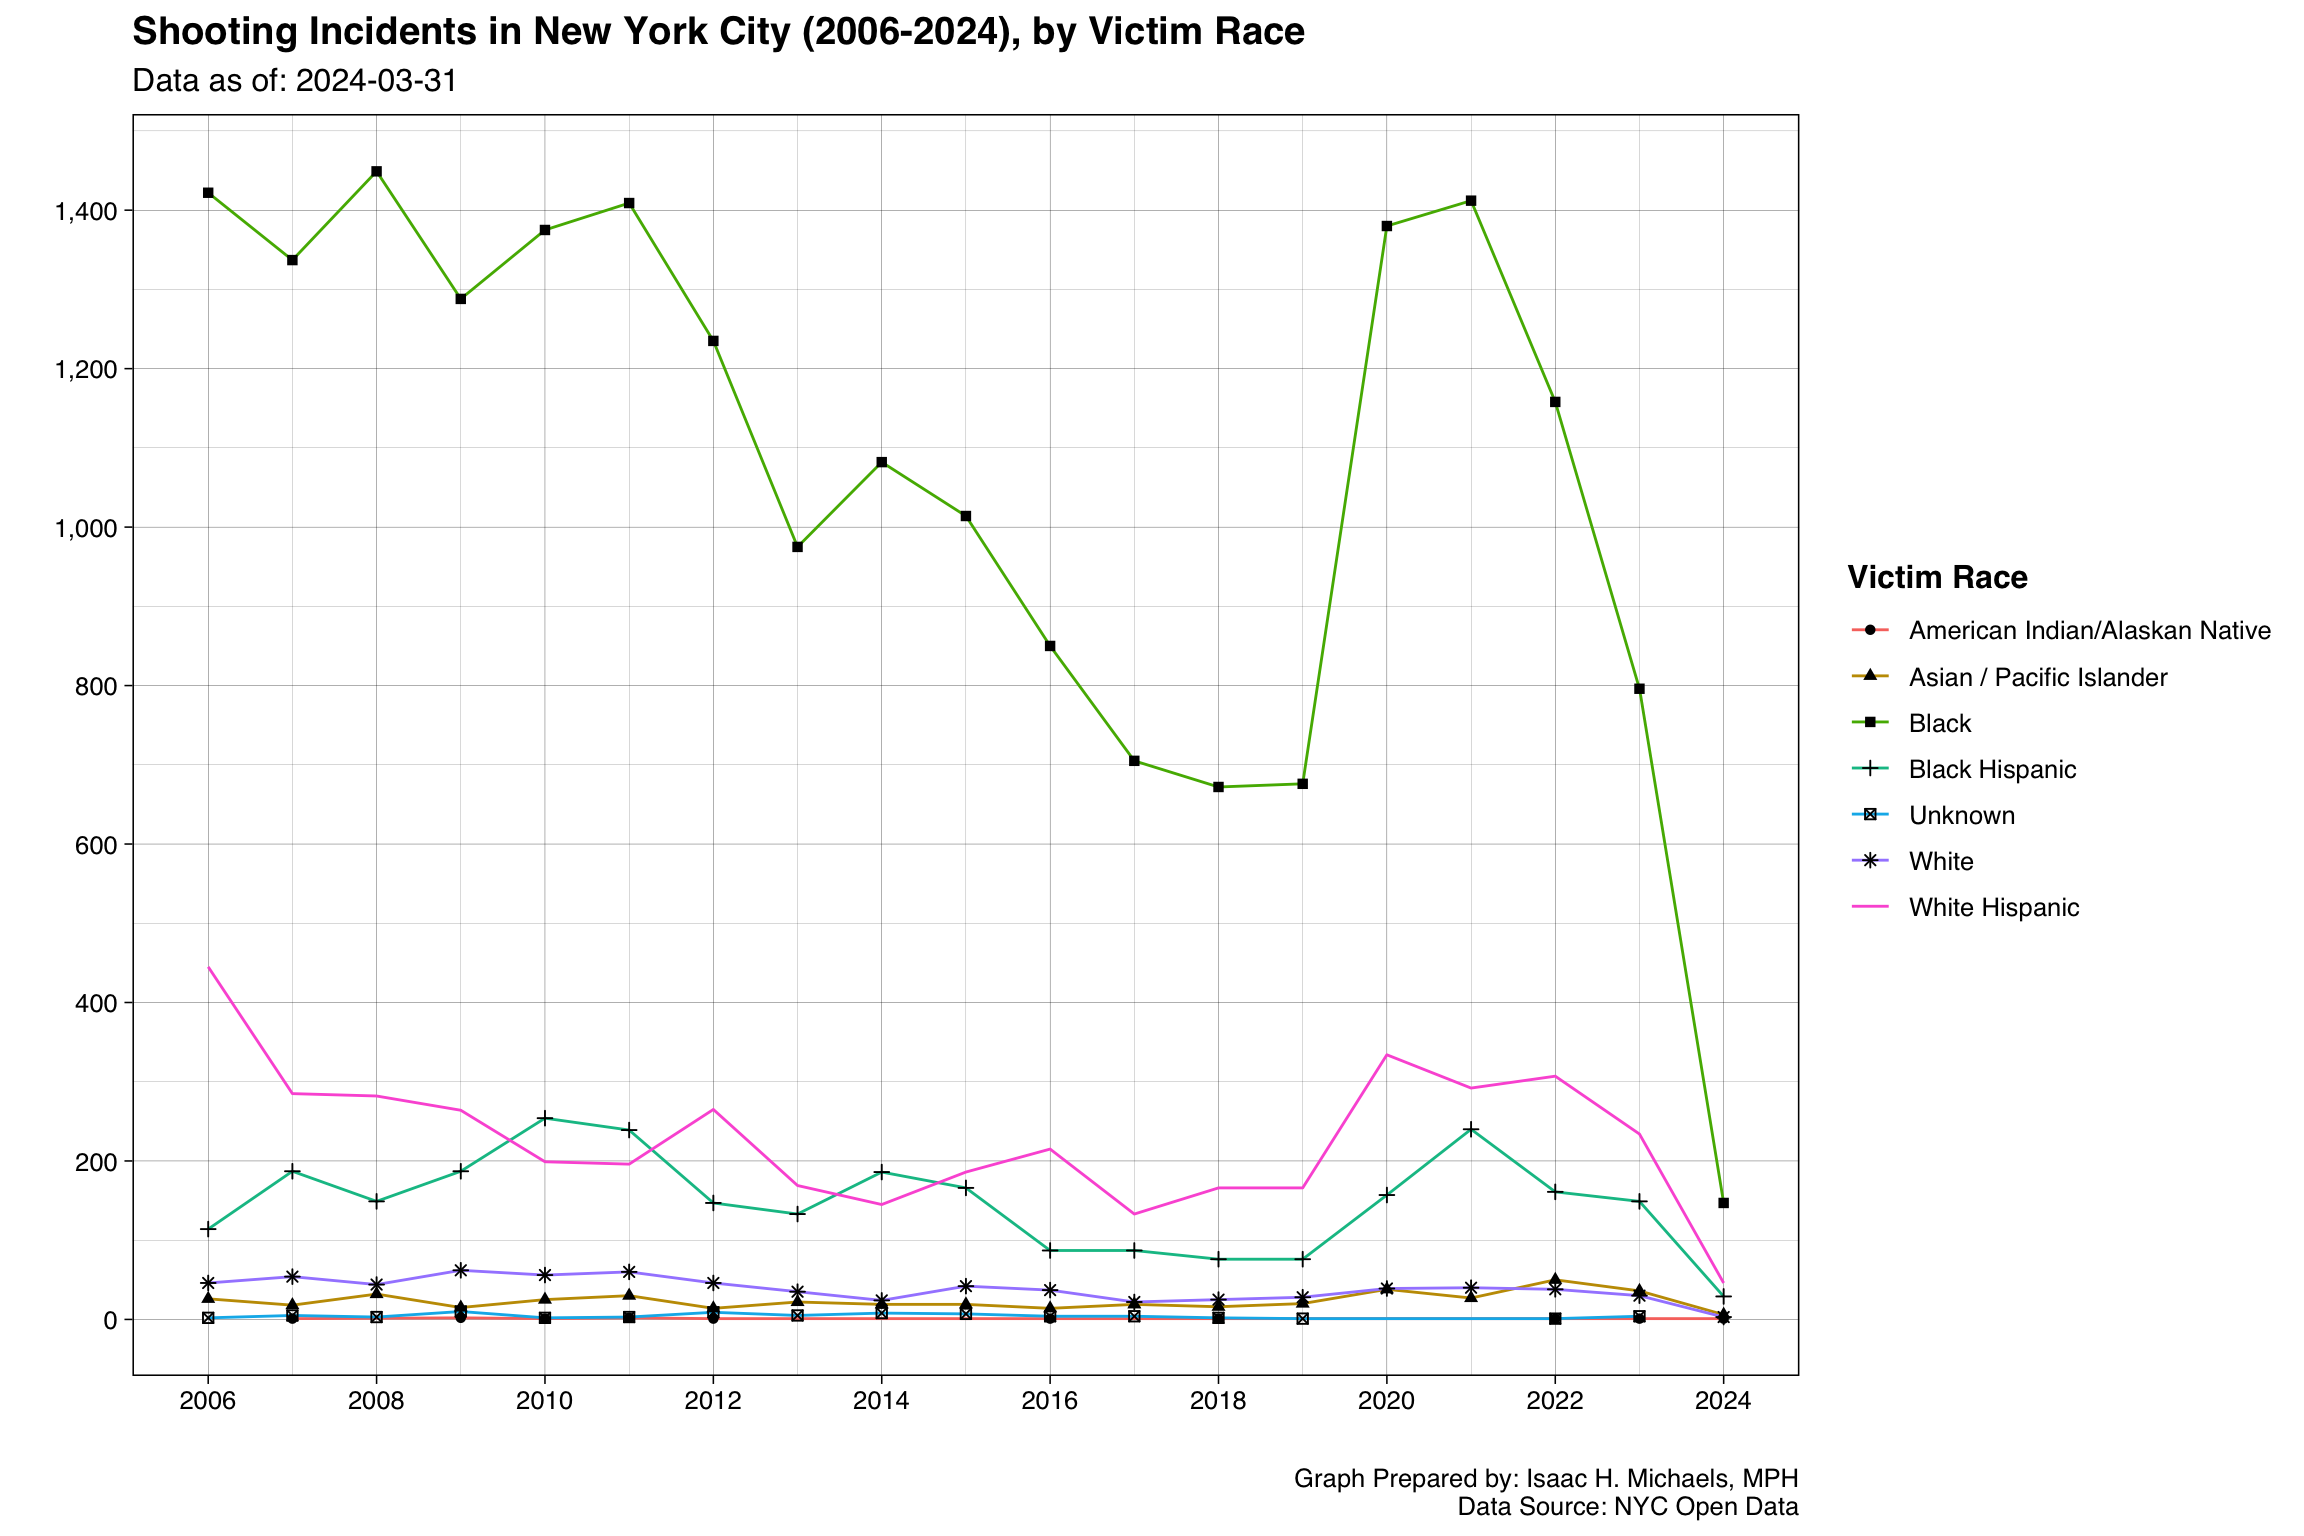
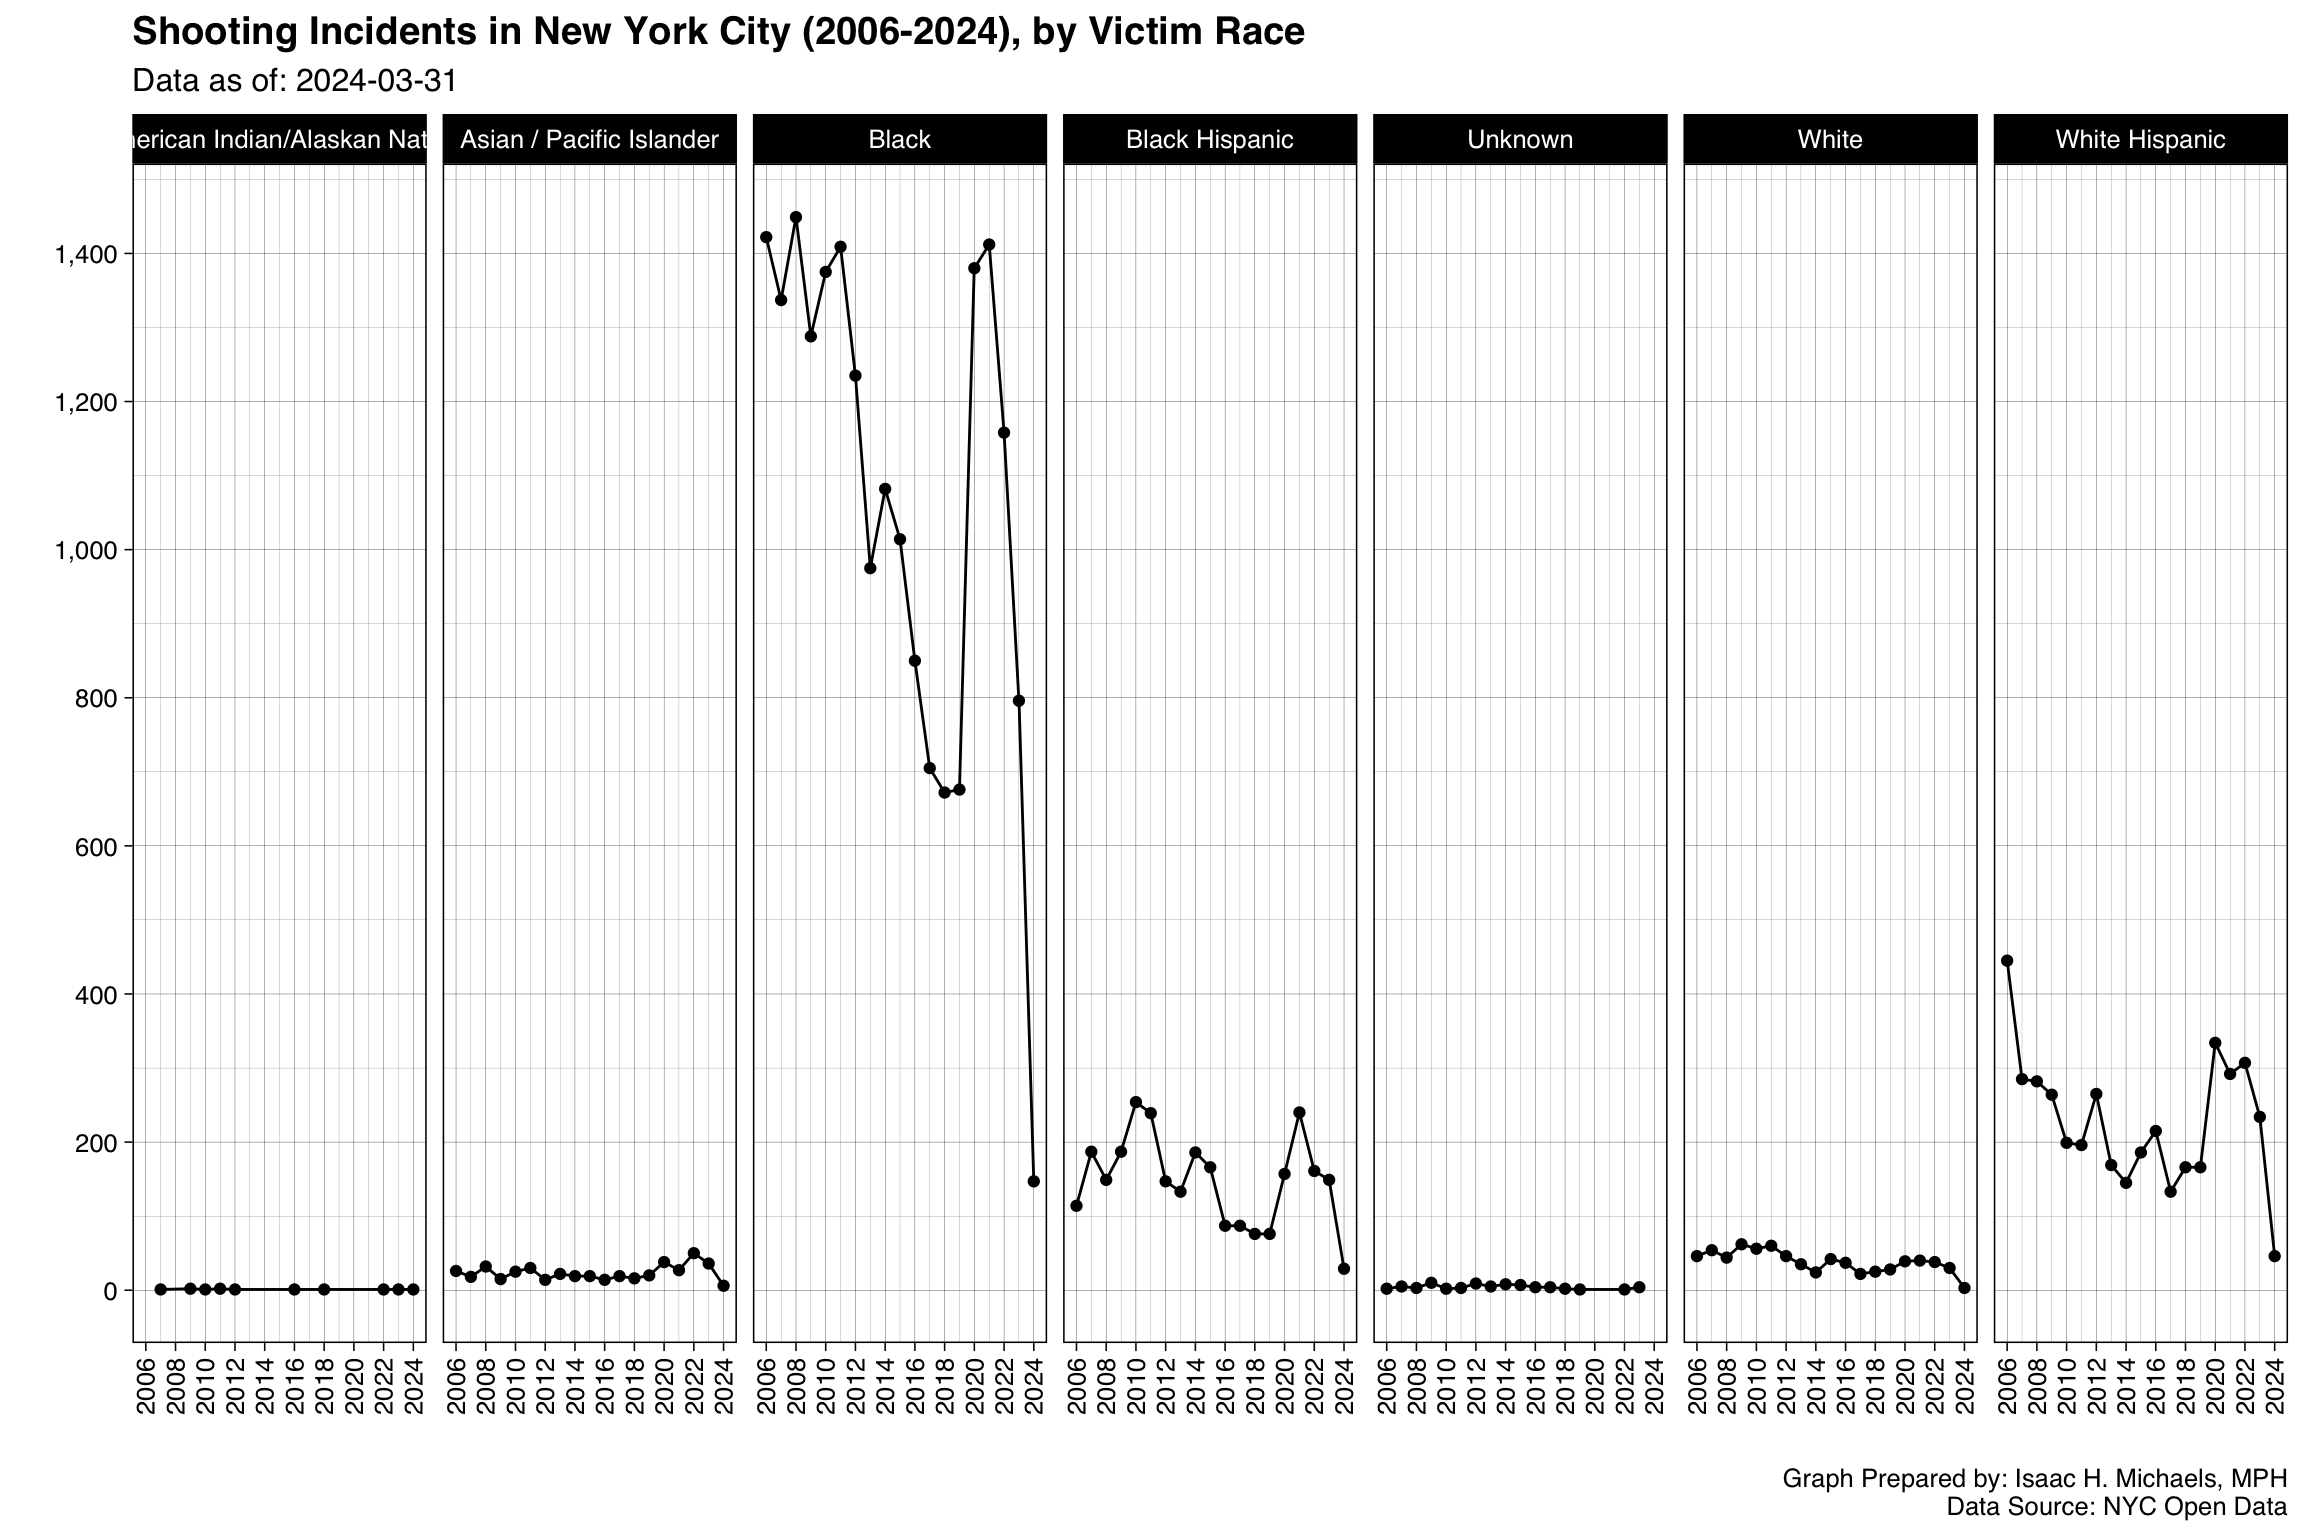
Races/Ethnicities
Cumulative Counts
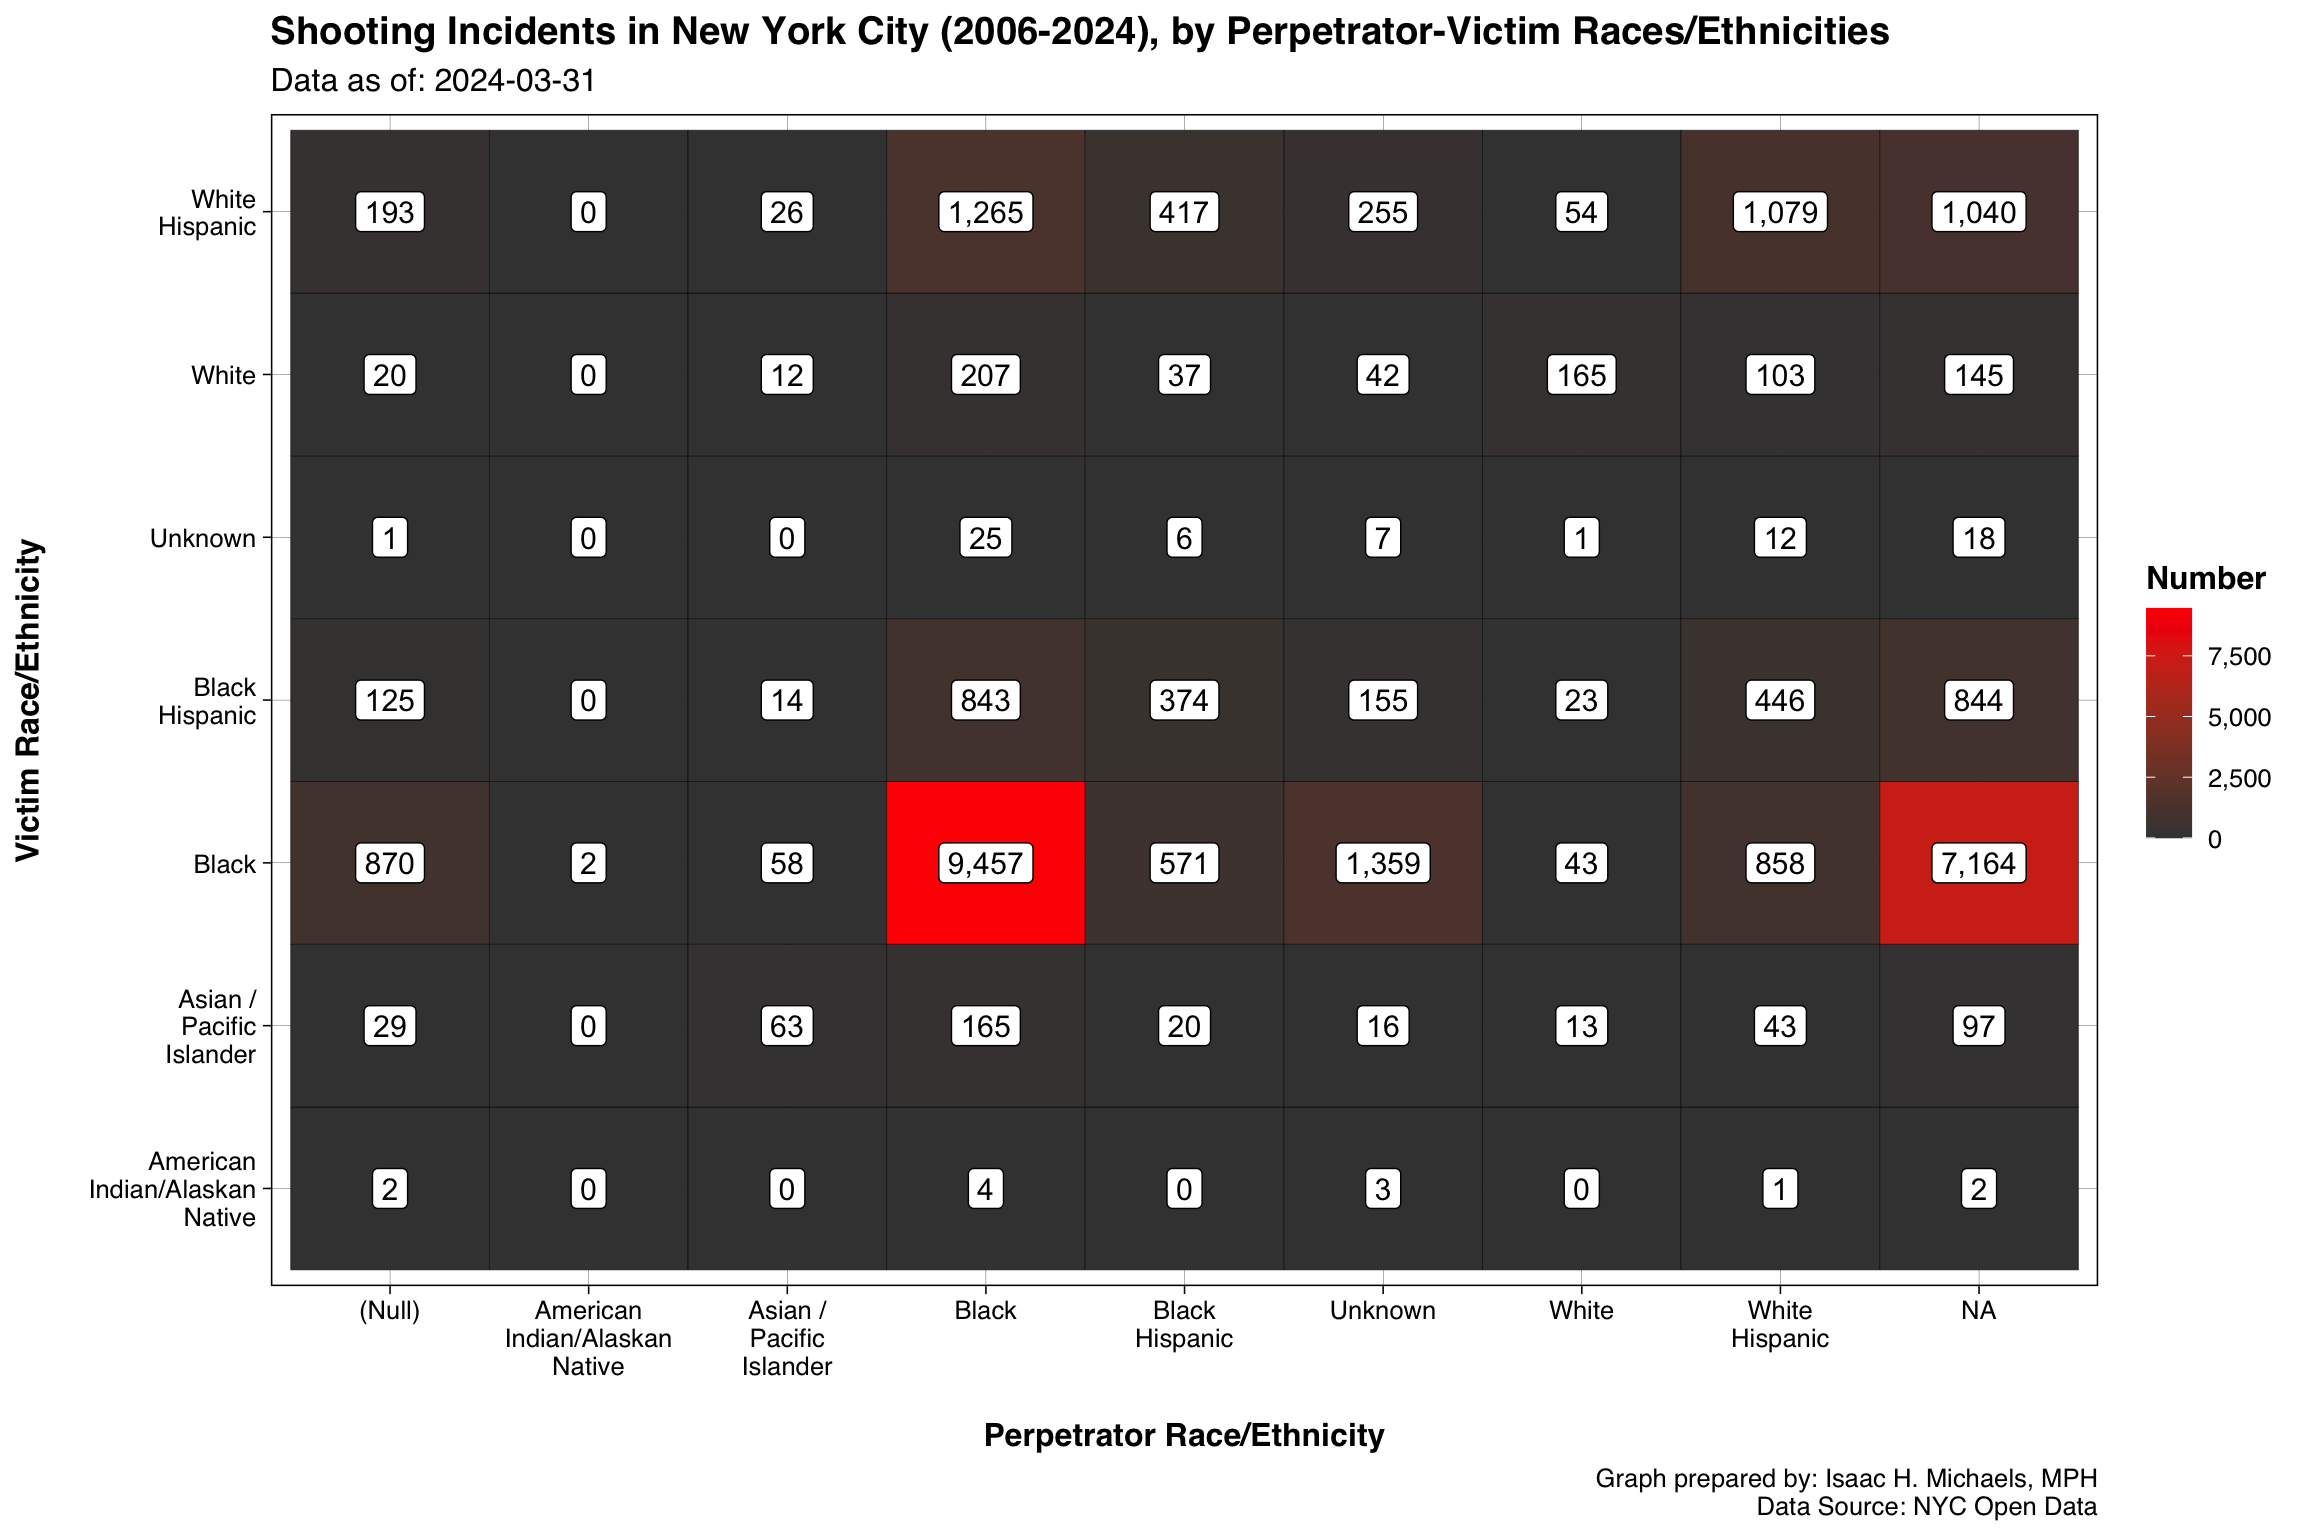 Graph Prepared By: Isaac H. Michaels, MPH
Data Source: NYC Open Data (Current, Historical)
Trends
Perpetrators
 Graph Prepared By: Isaac H. Michaels, MPH
Data Source: NYC Open Data (Current, Historical)
 Graph Prepared By: Isaac H. Michaels, MPH
Data Source: NYC Open Data (Current, Historical)
Victims
 Graph Prepared By: Isaac H. Michaels, MPH
Data Source: NYC Open Data (Current, Historical)
 Graph Prepared By: Isaac H. Michaels, MPH
Data Source: NYC Open Data (Current, Historical)
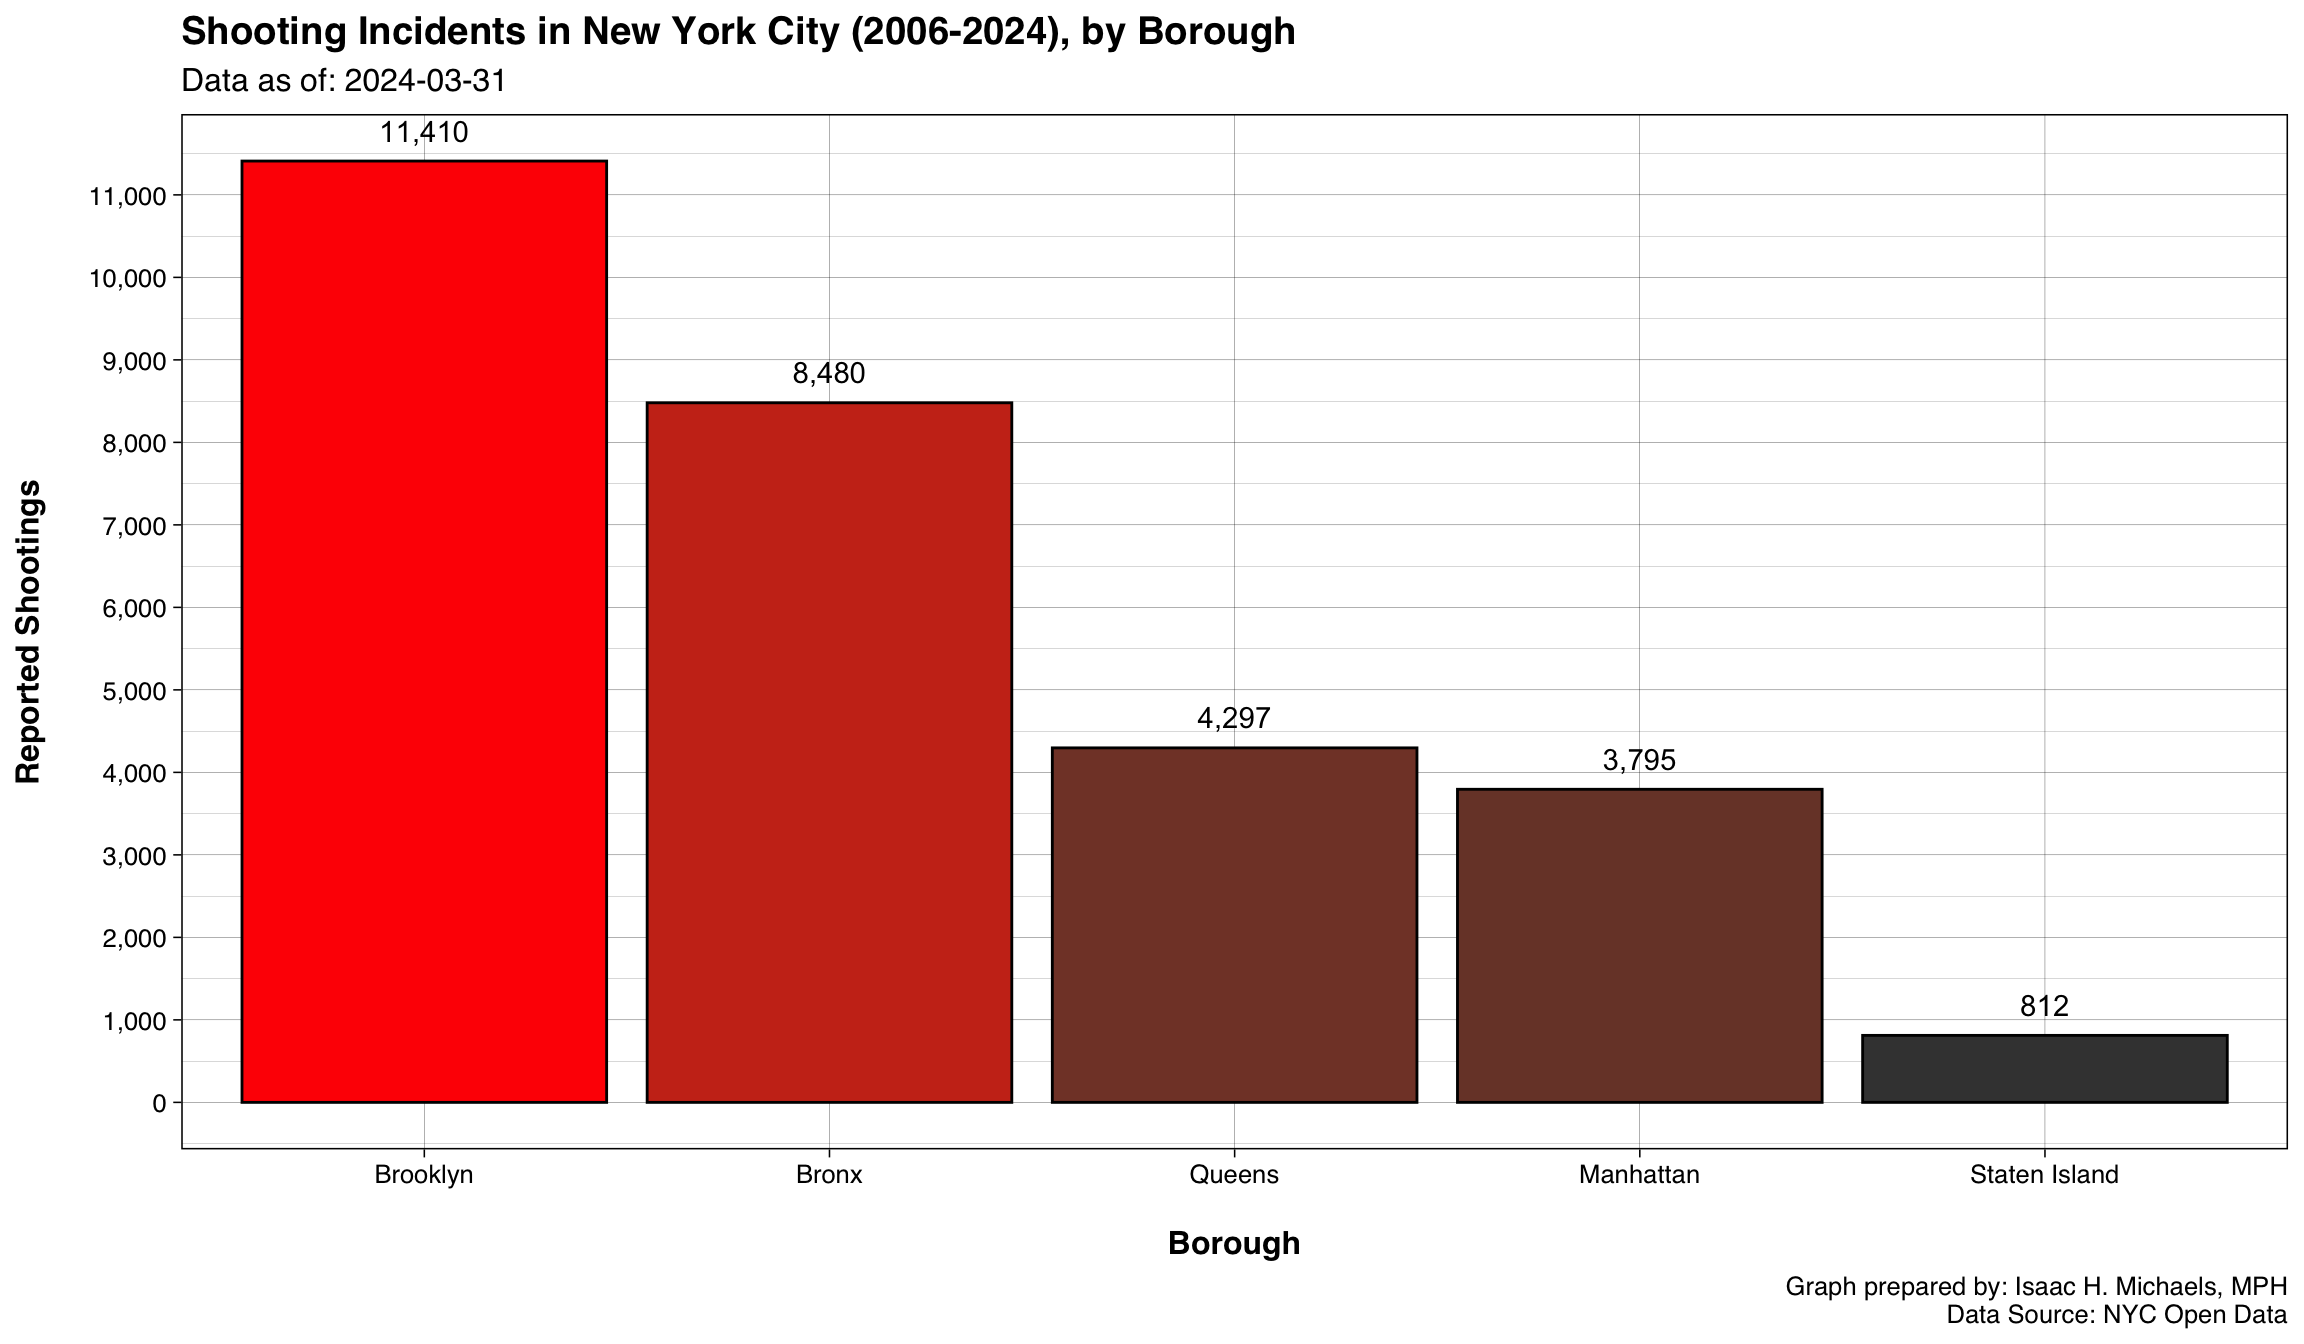
Boroughs – All Years
All Boroughs
 Graph Prepared By: Isaac H. Michaels, MPH
Data Source: NYC Open Data (Current, Historical)
 Map Prepared By:
 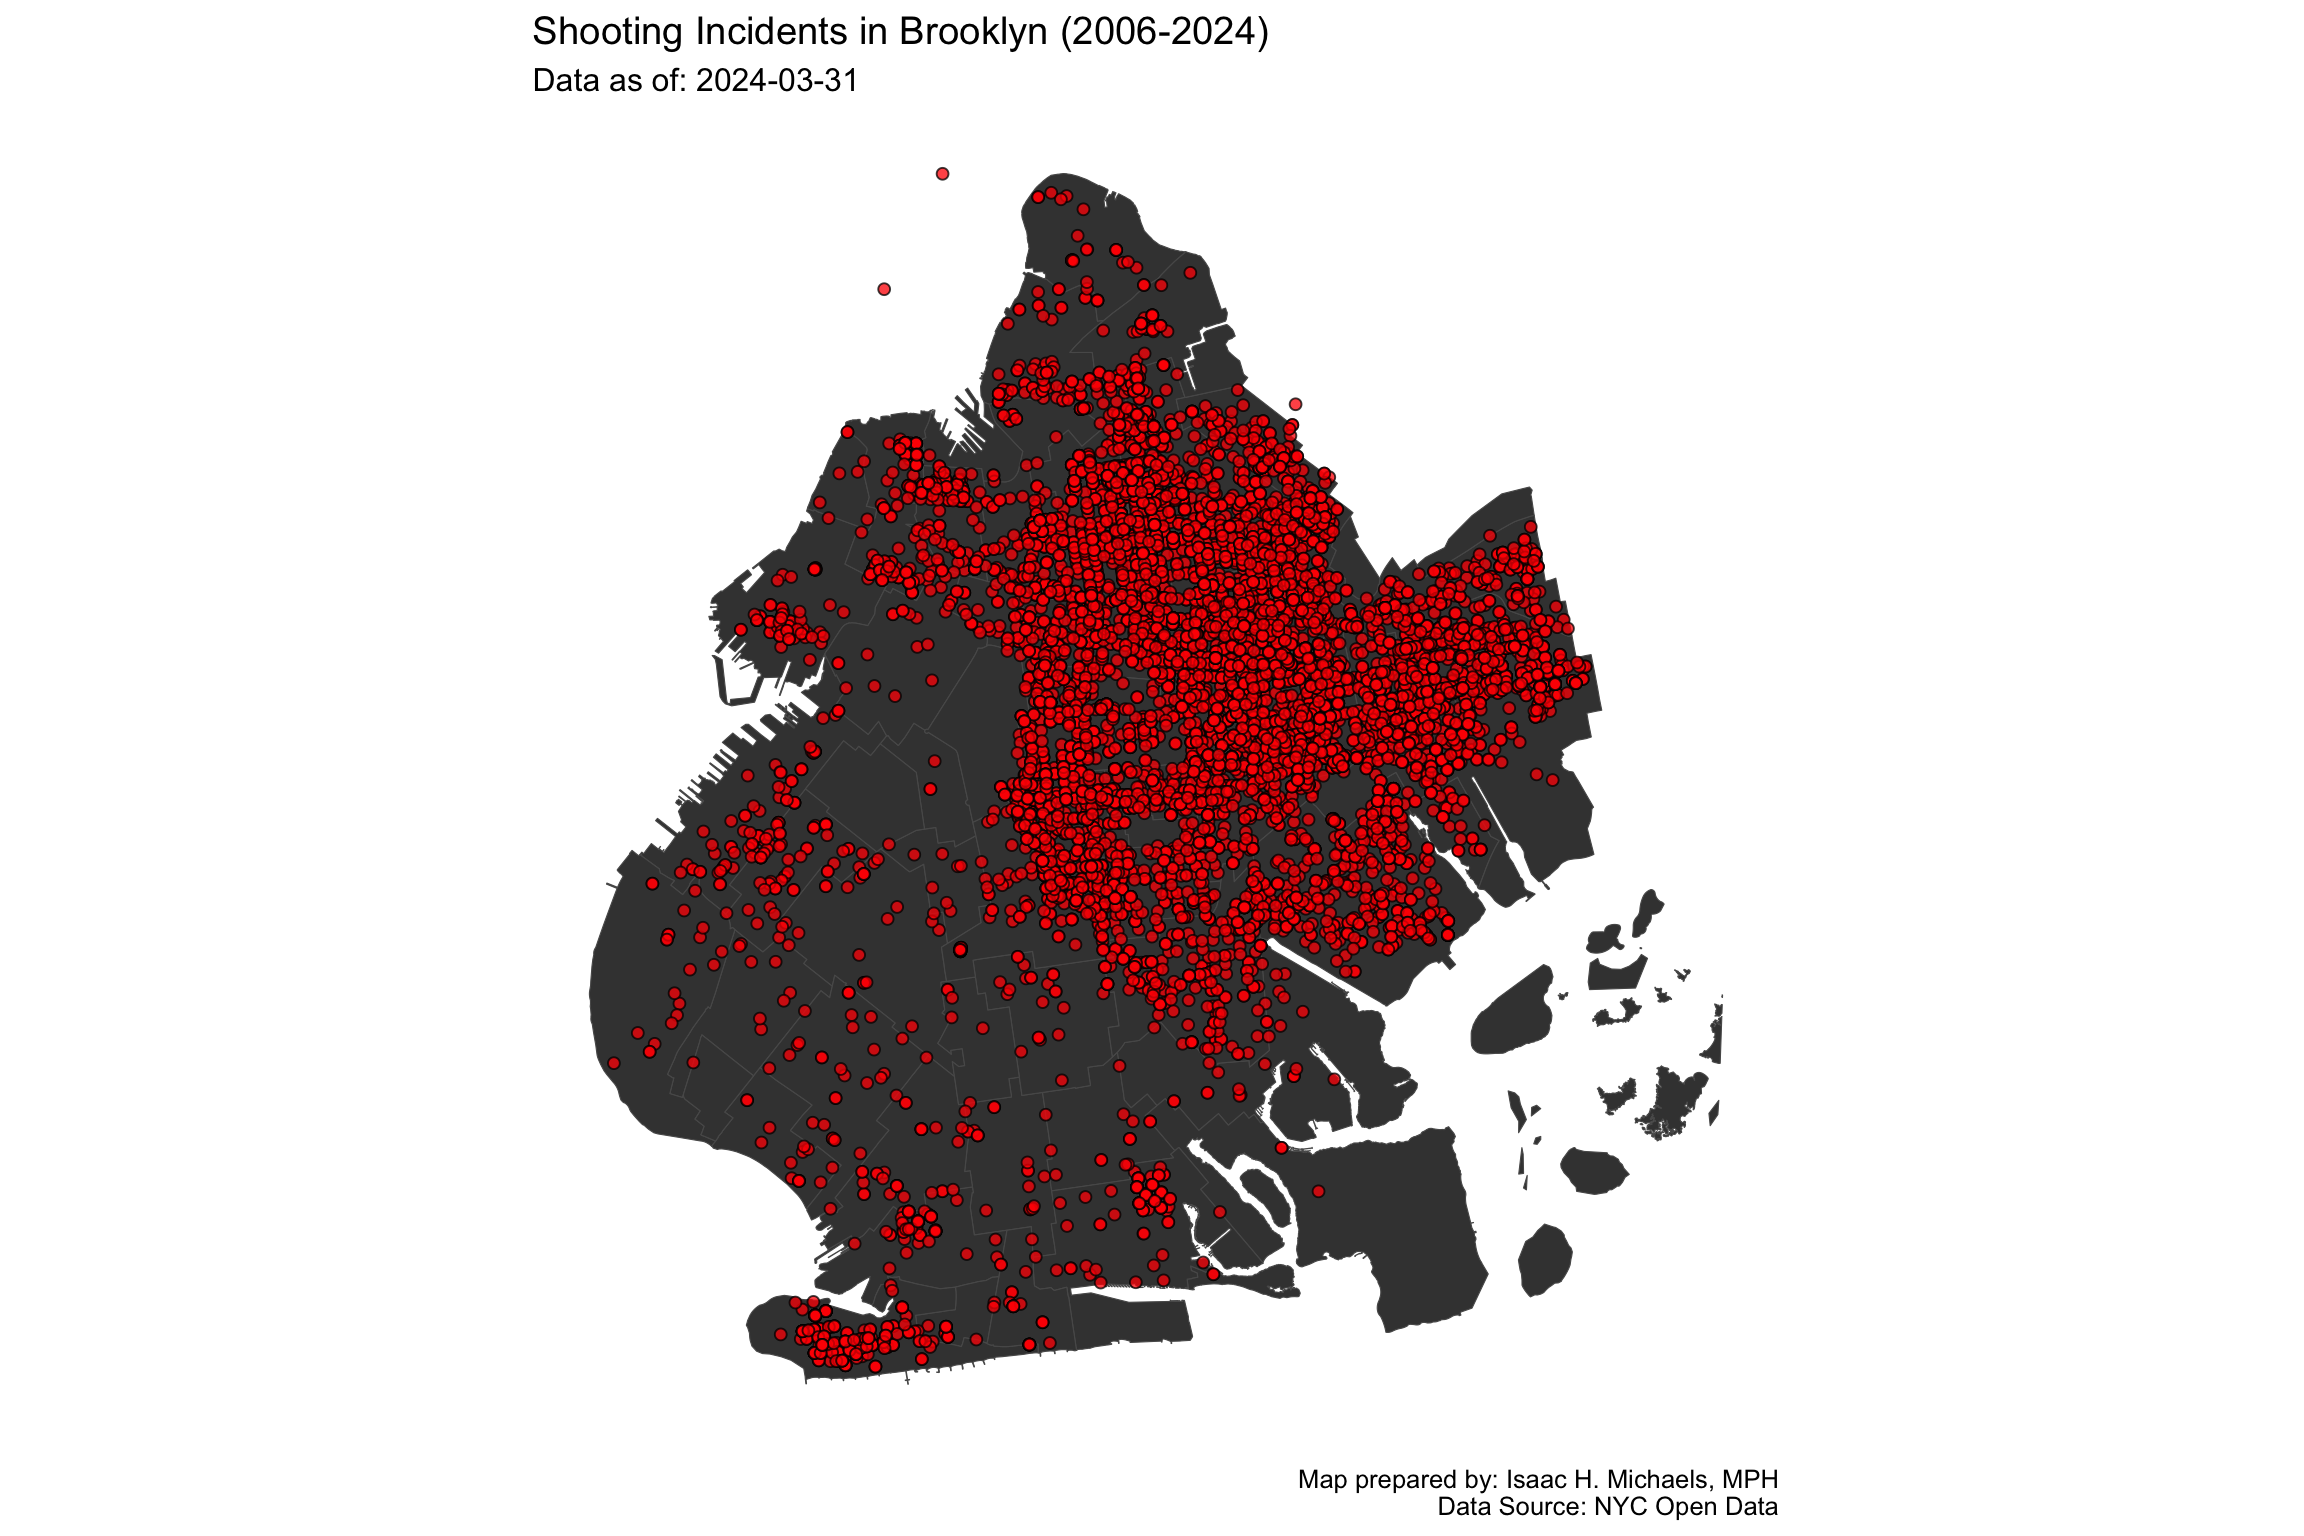 Map Prepared By:
 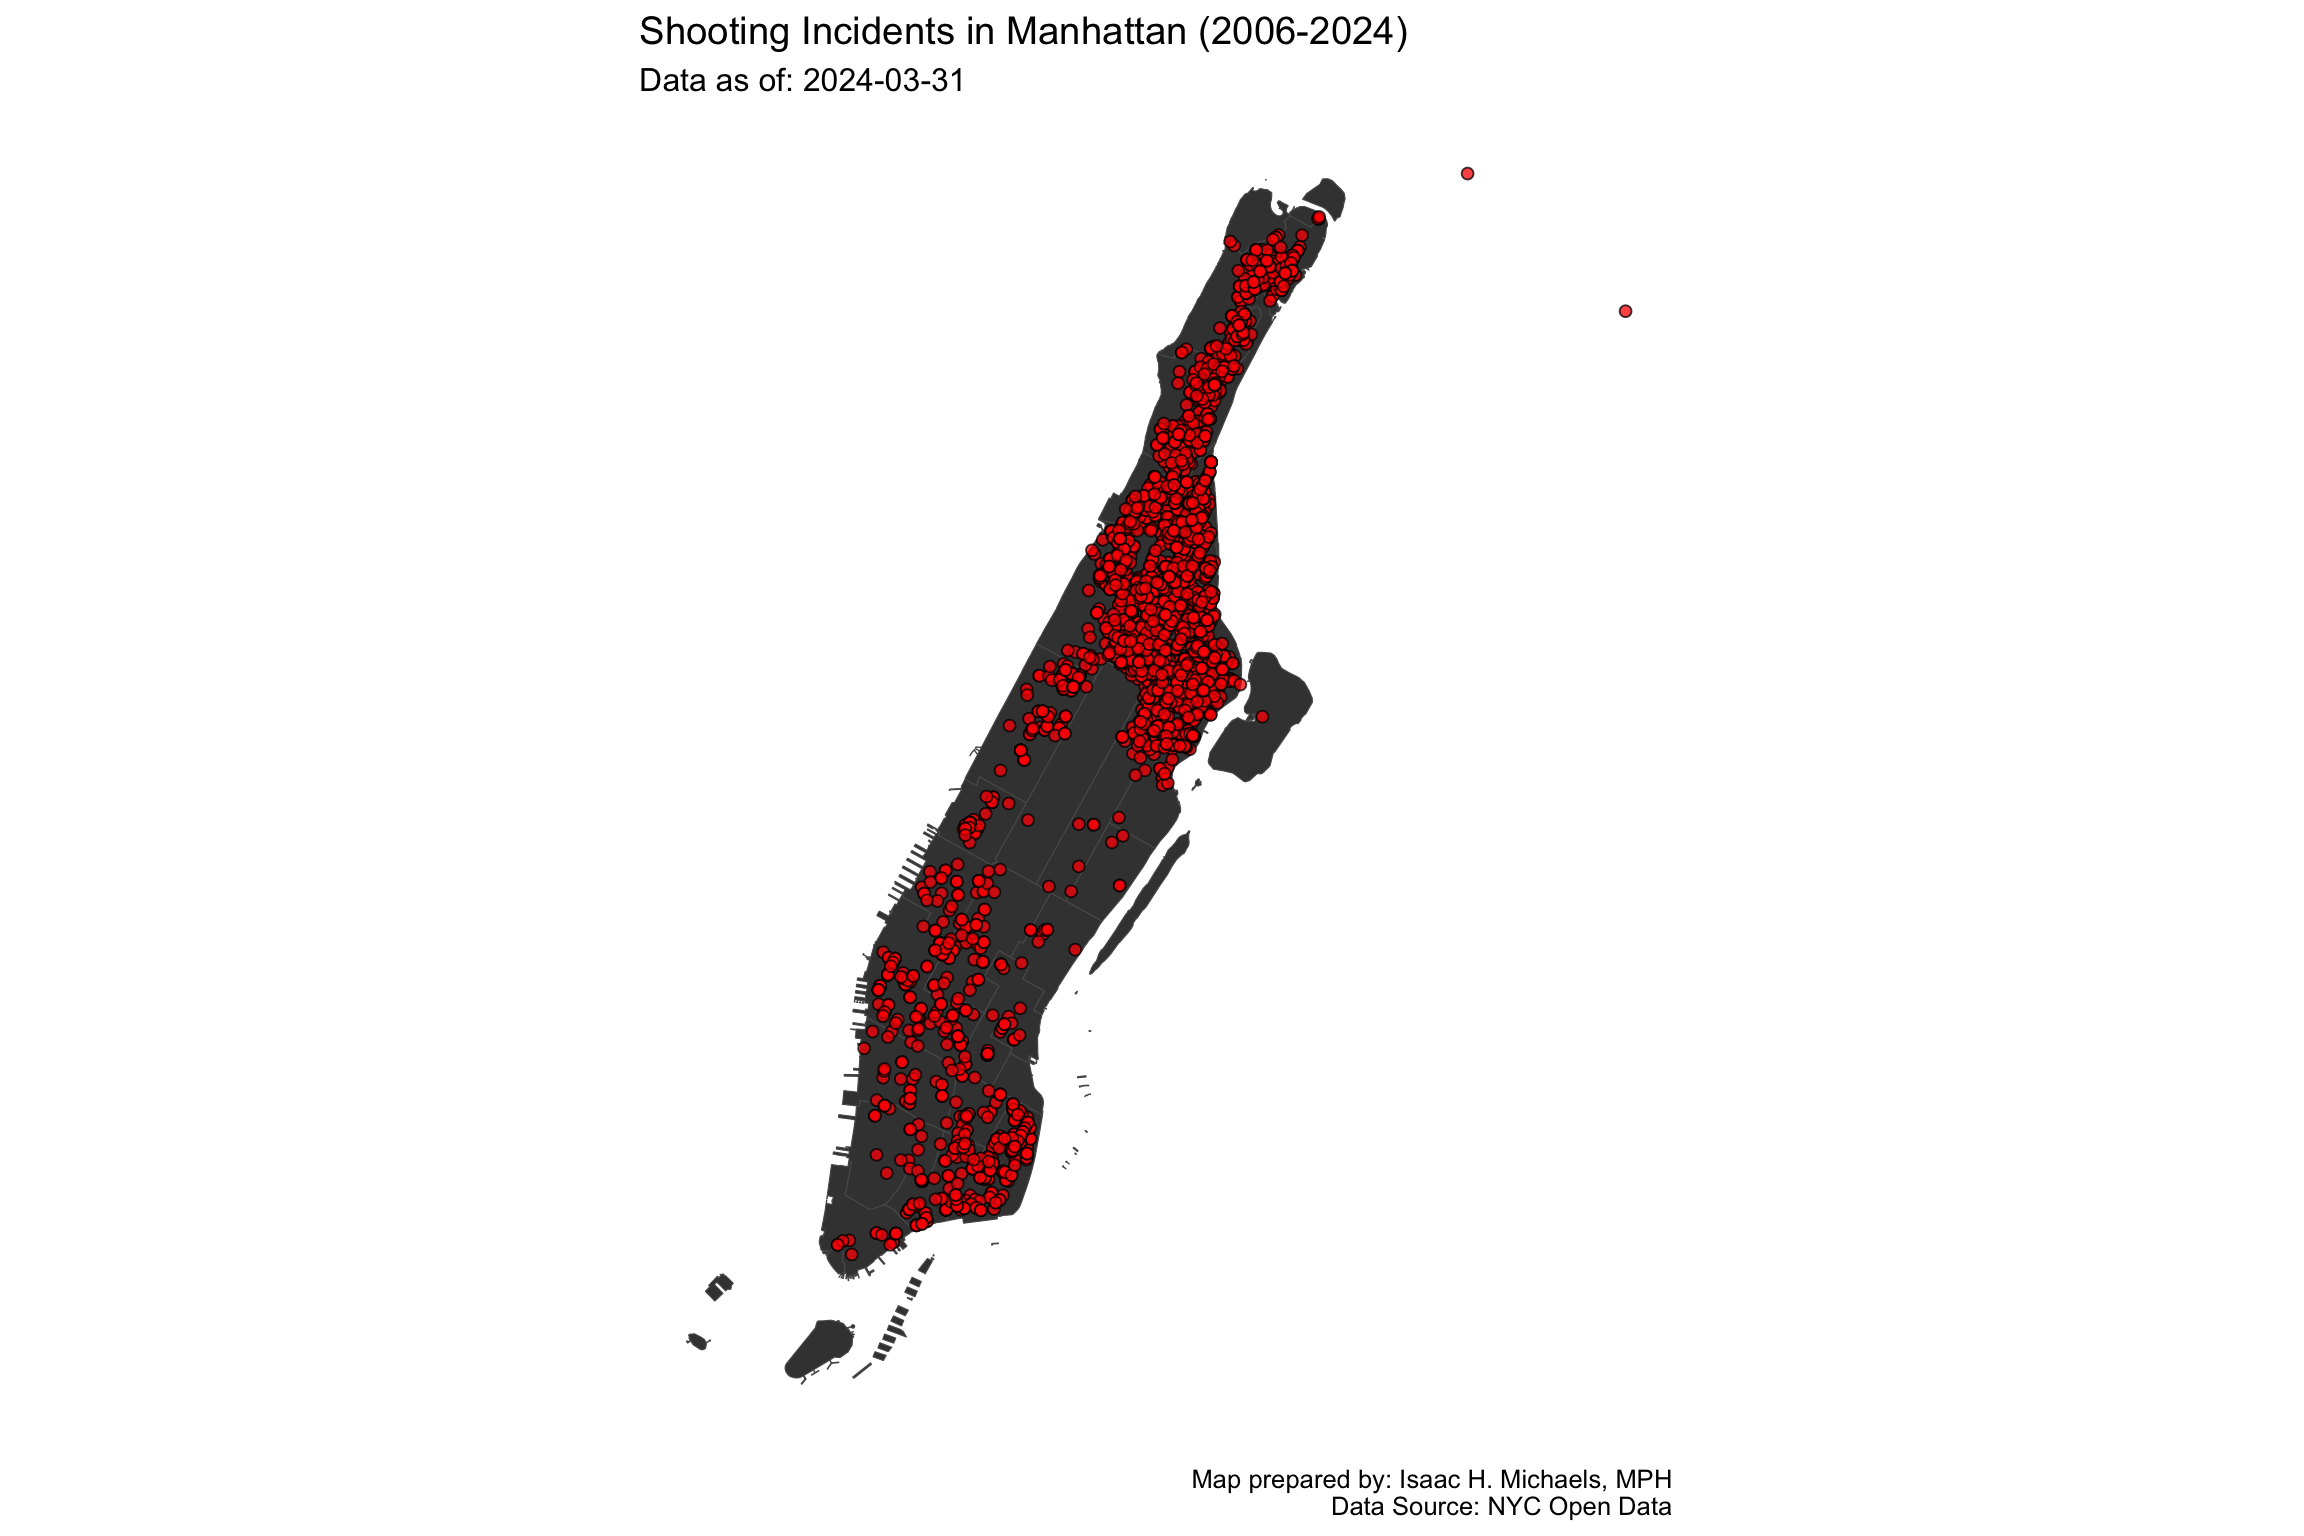 Map Prepared By:
 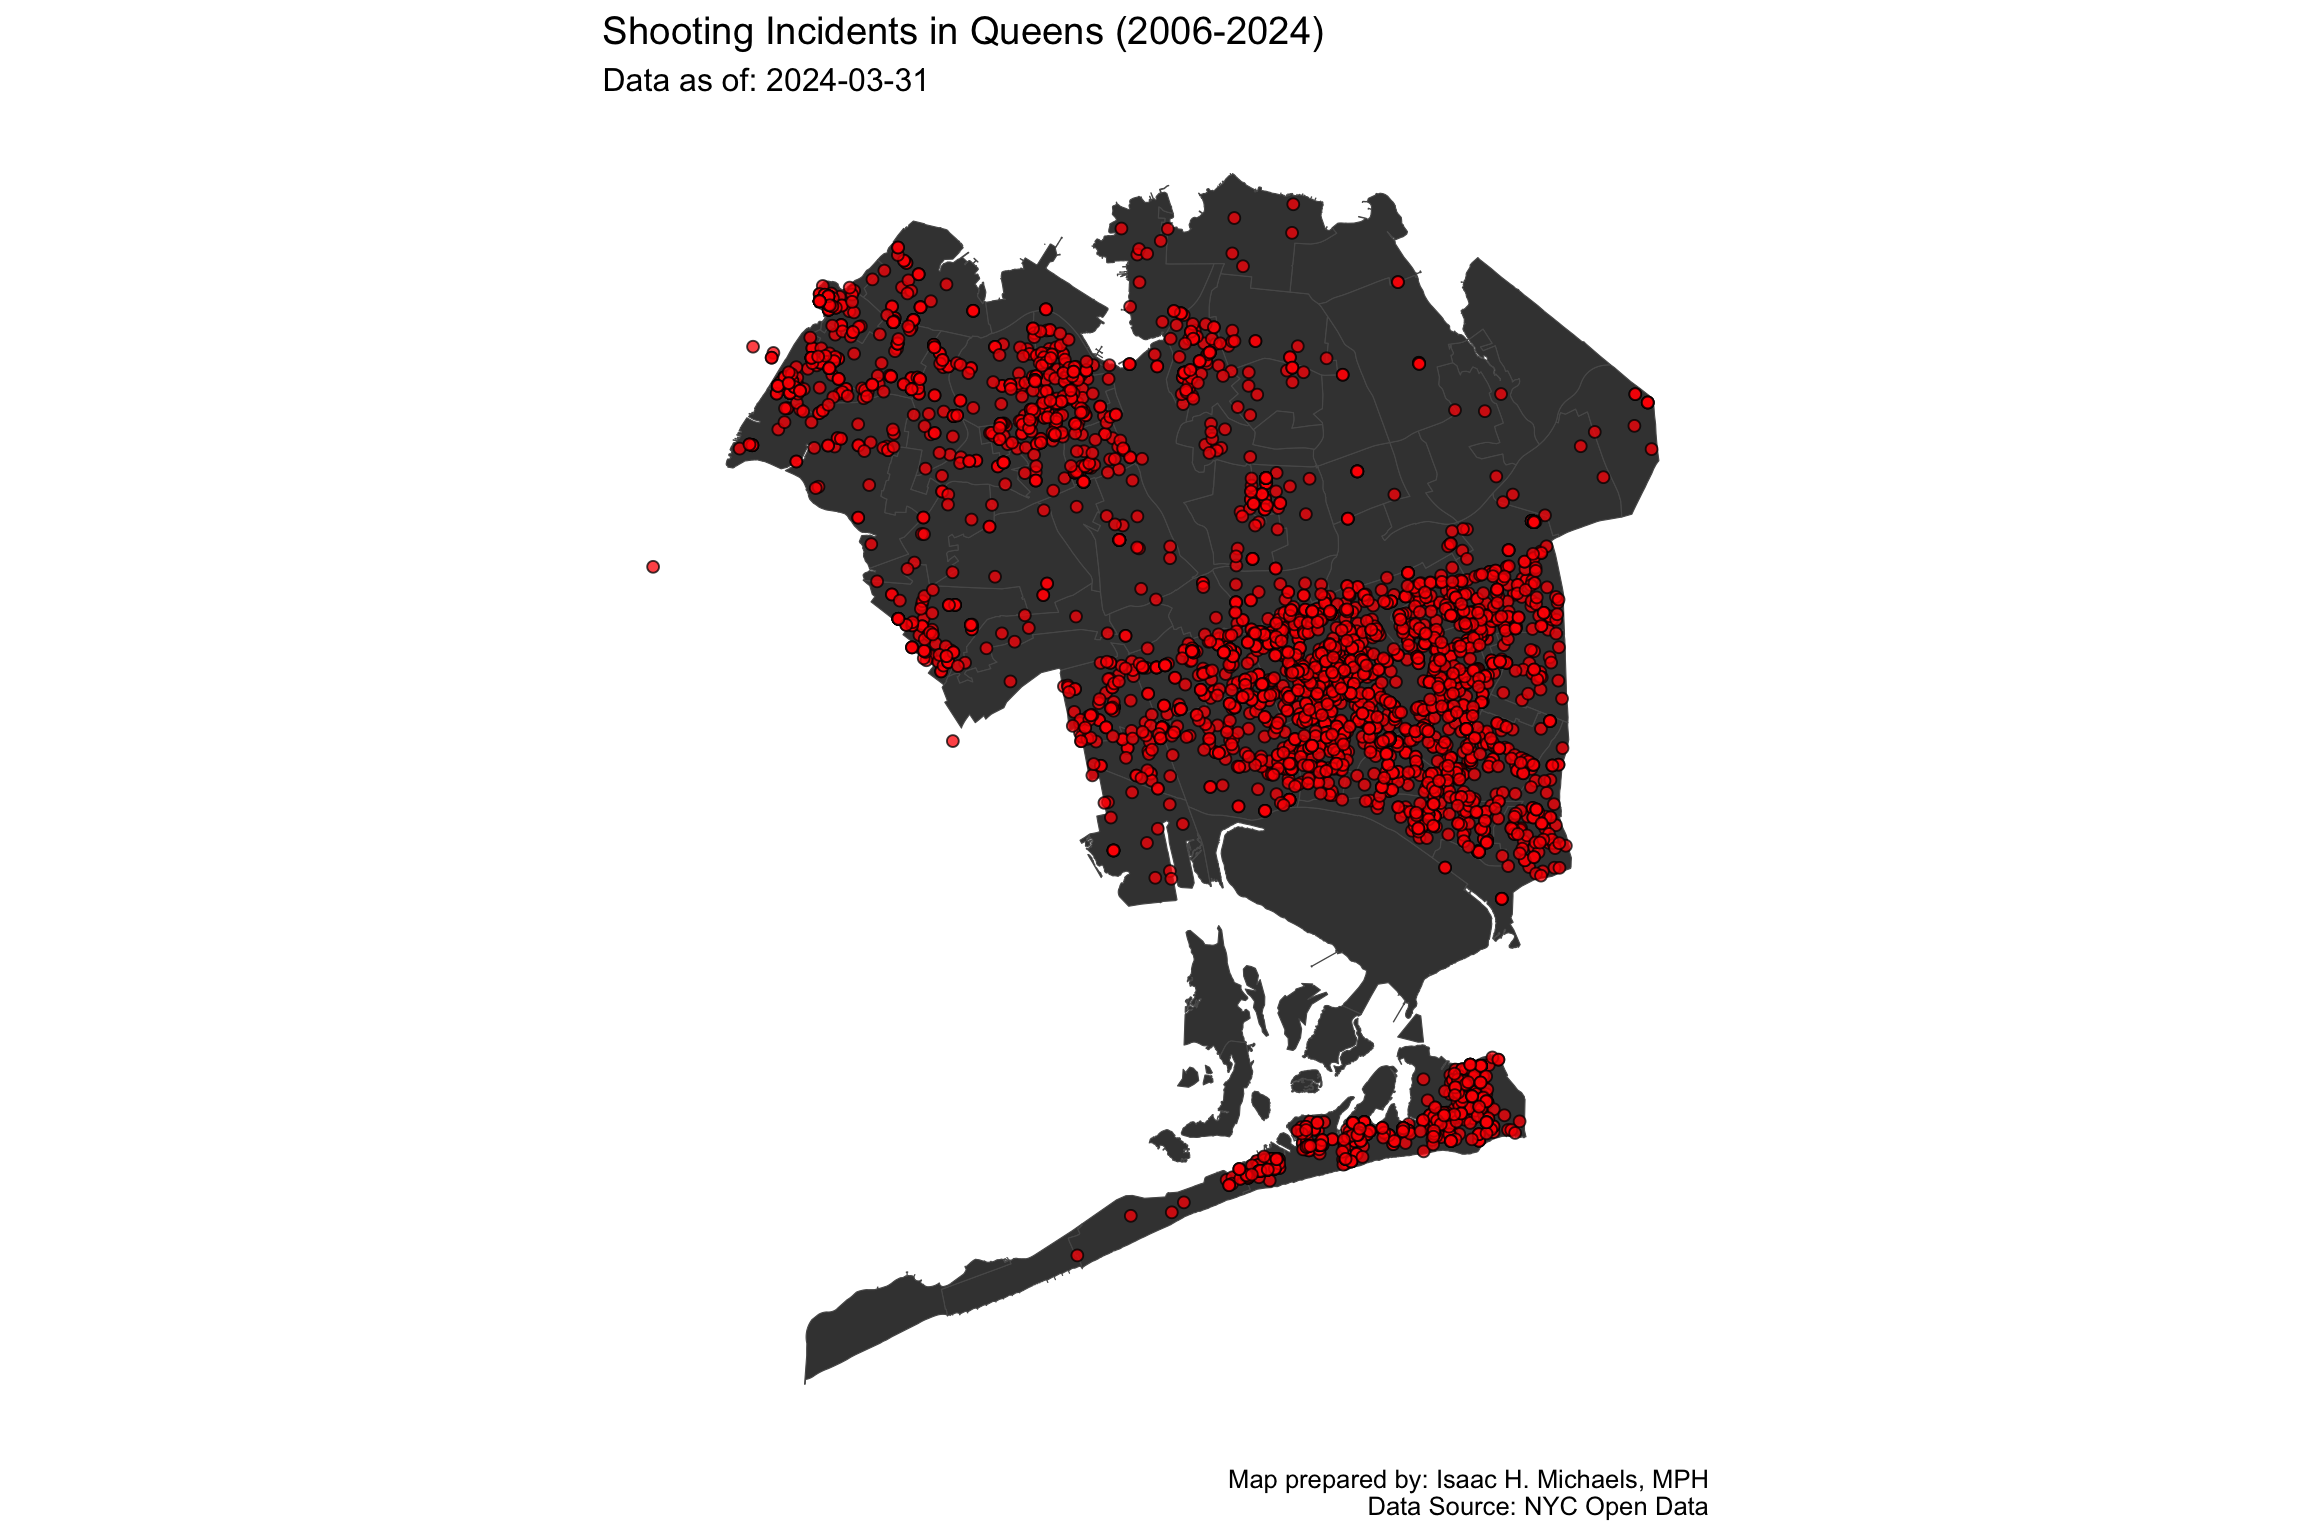 Map Prepared By:
 Staten Island
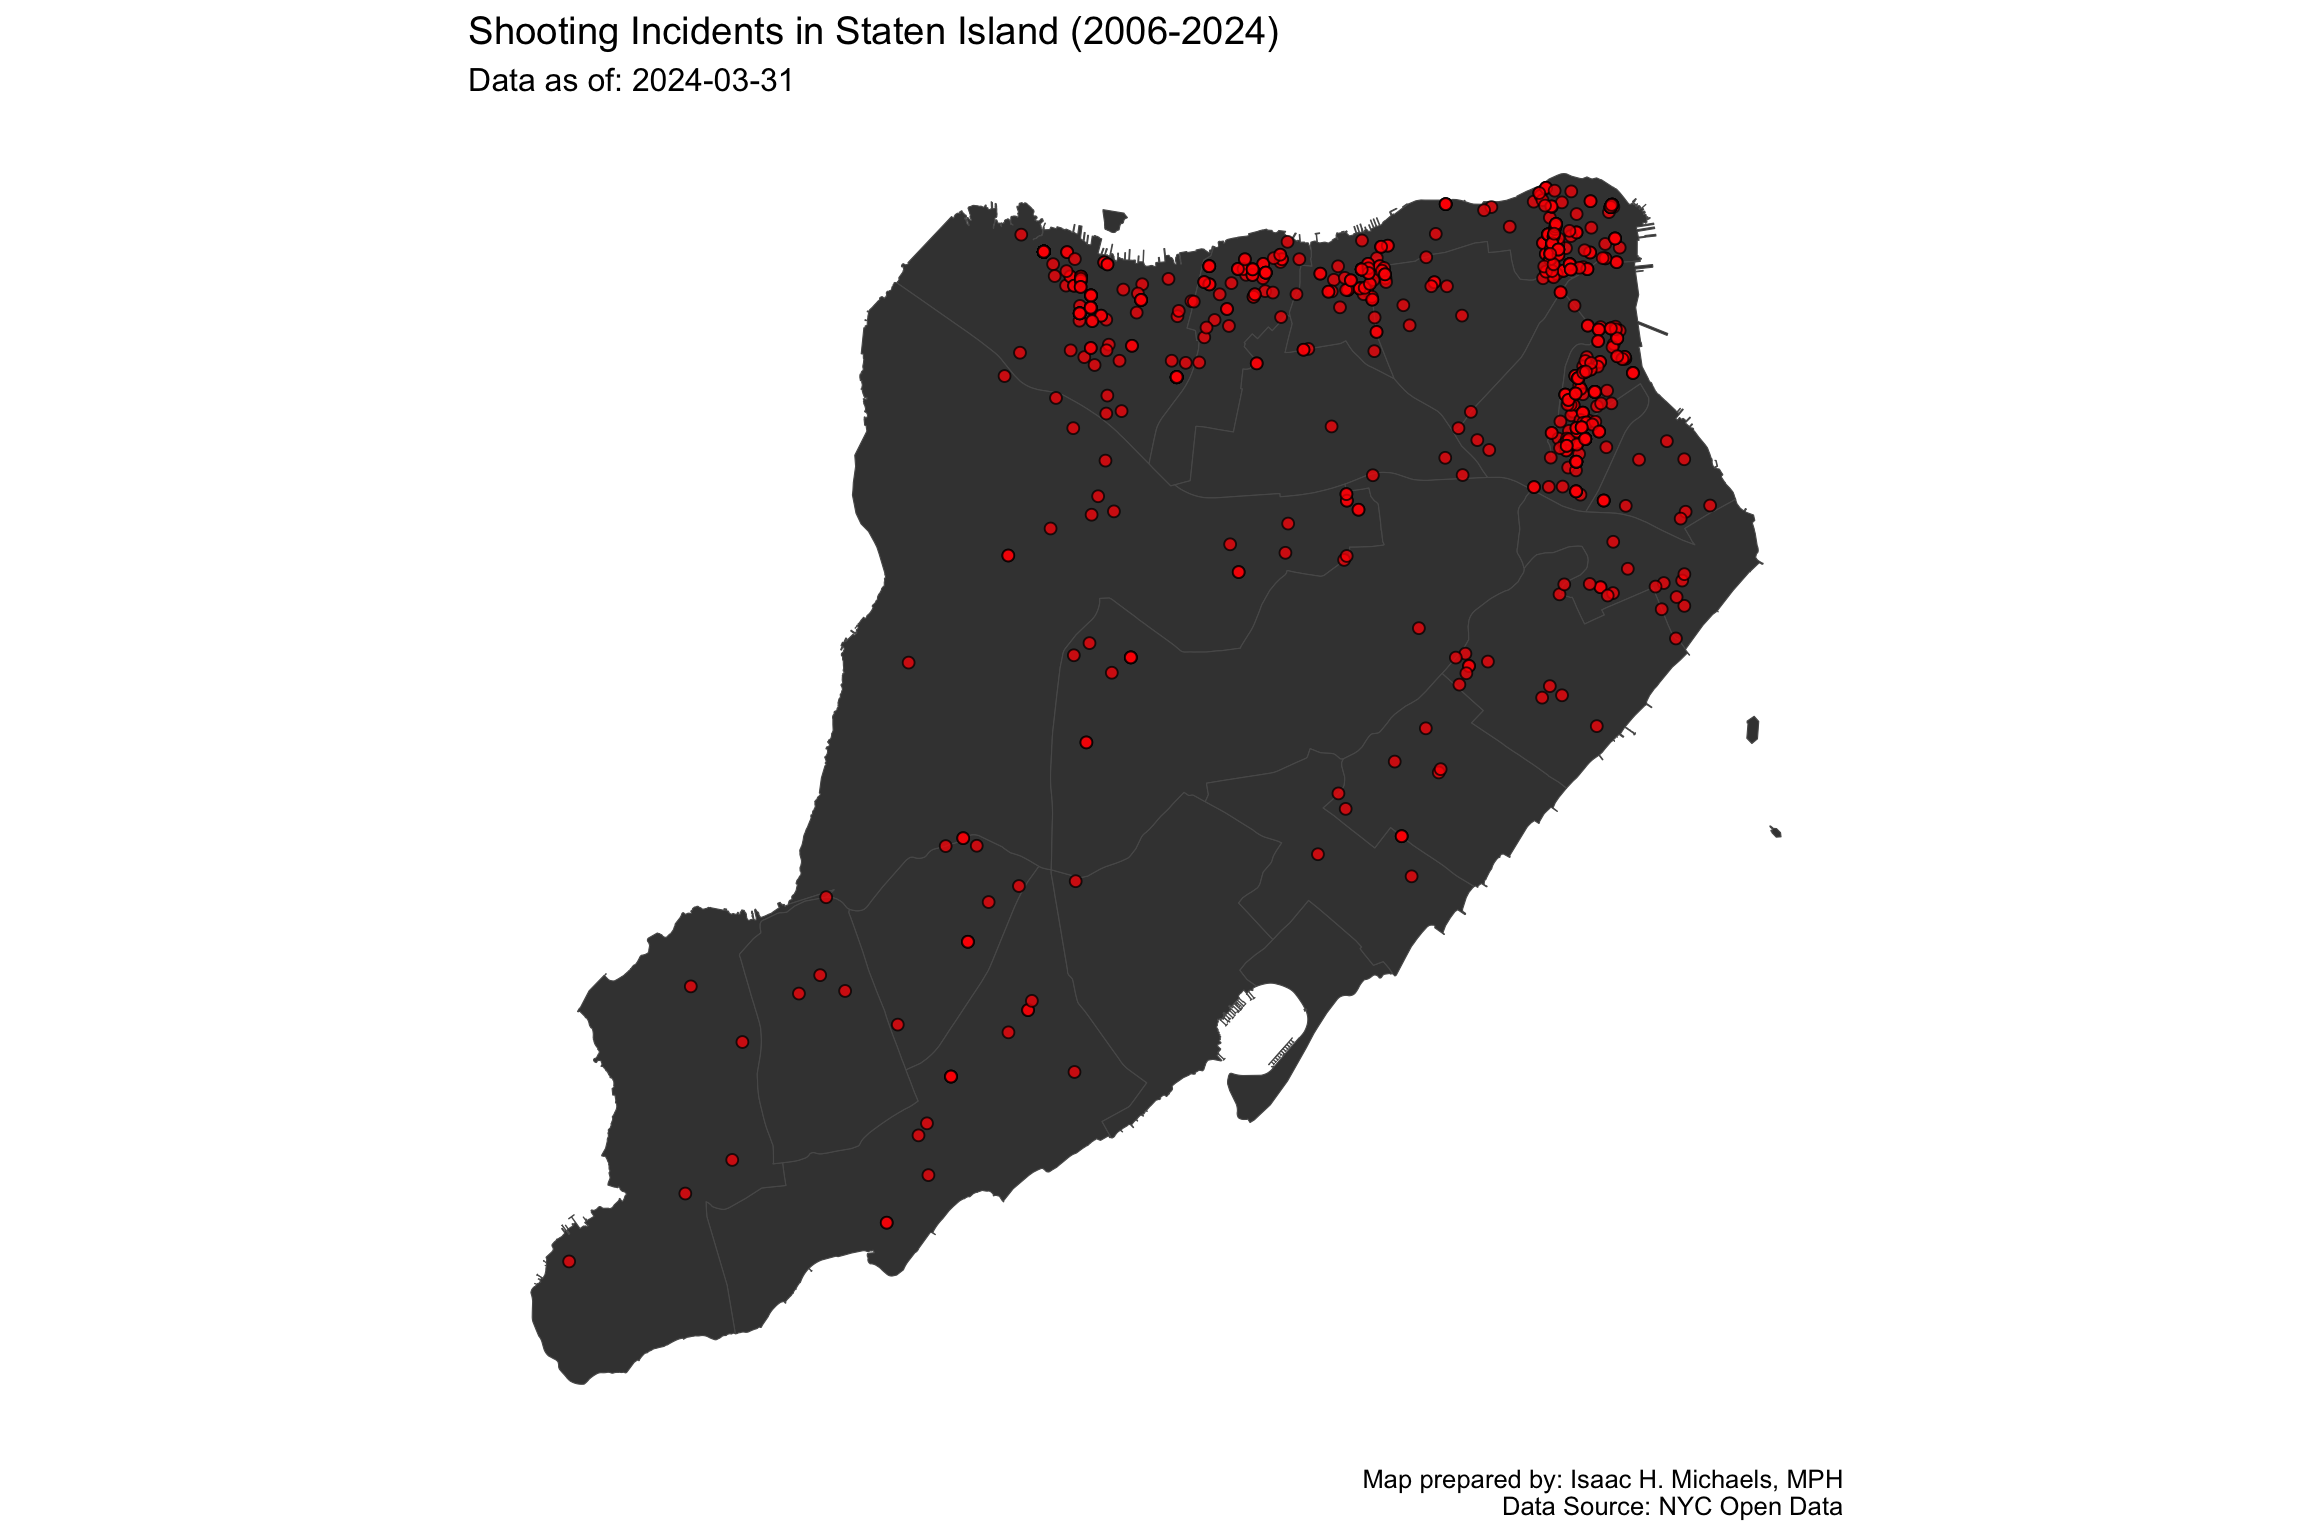 Map Prepared By: Isaac H. Michaels, MPH
Data Source: NYC Open Data (Current, Historical)
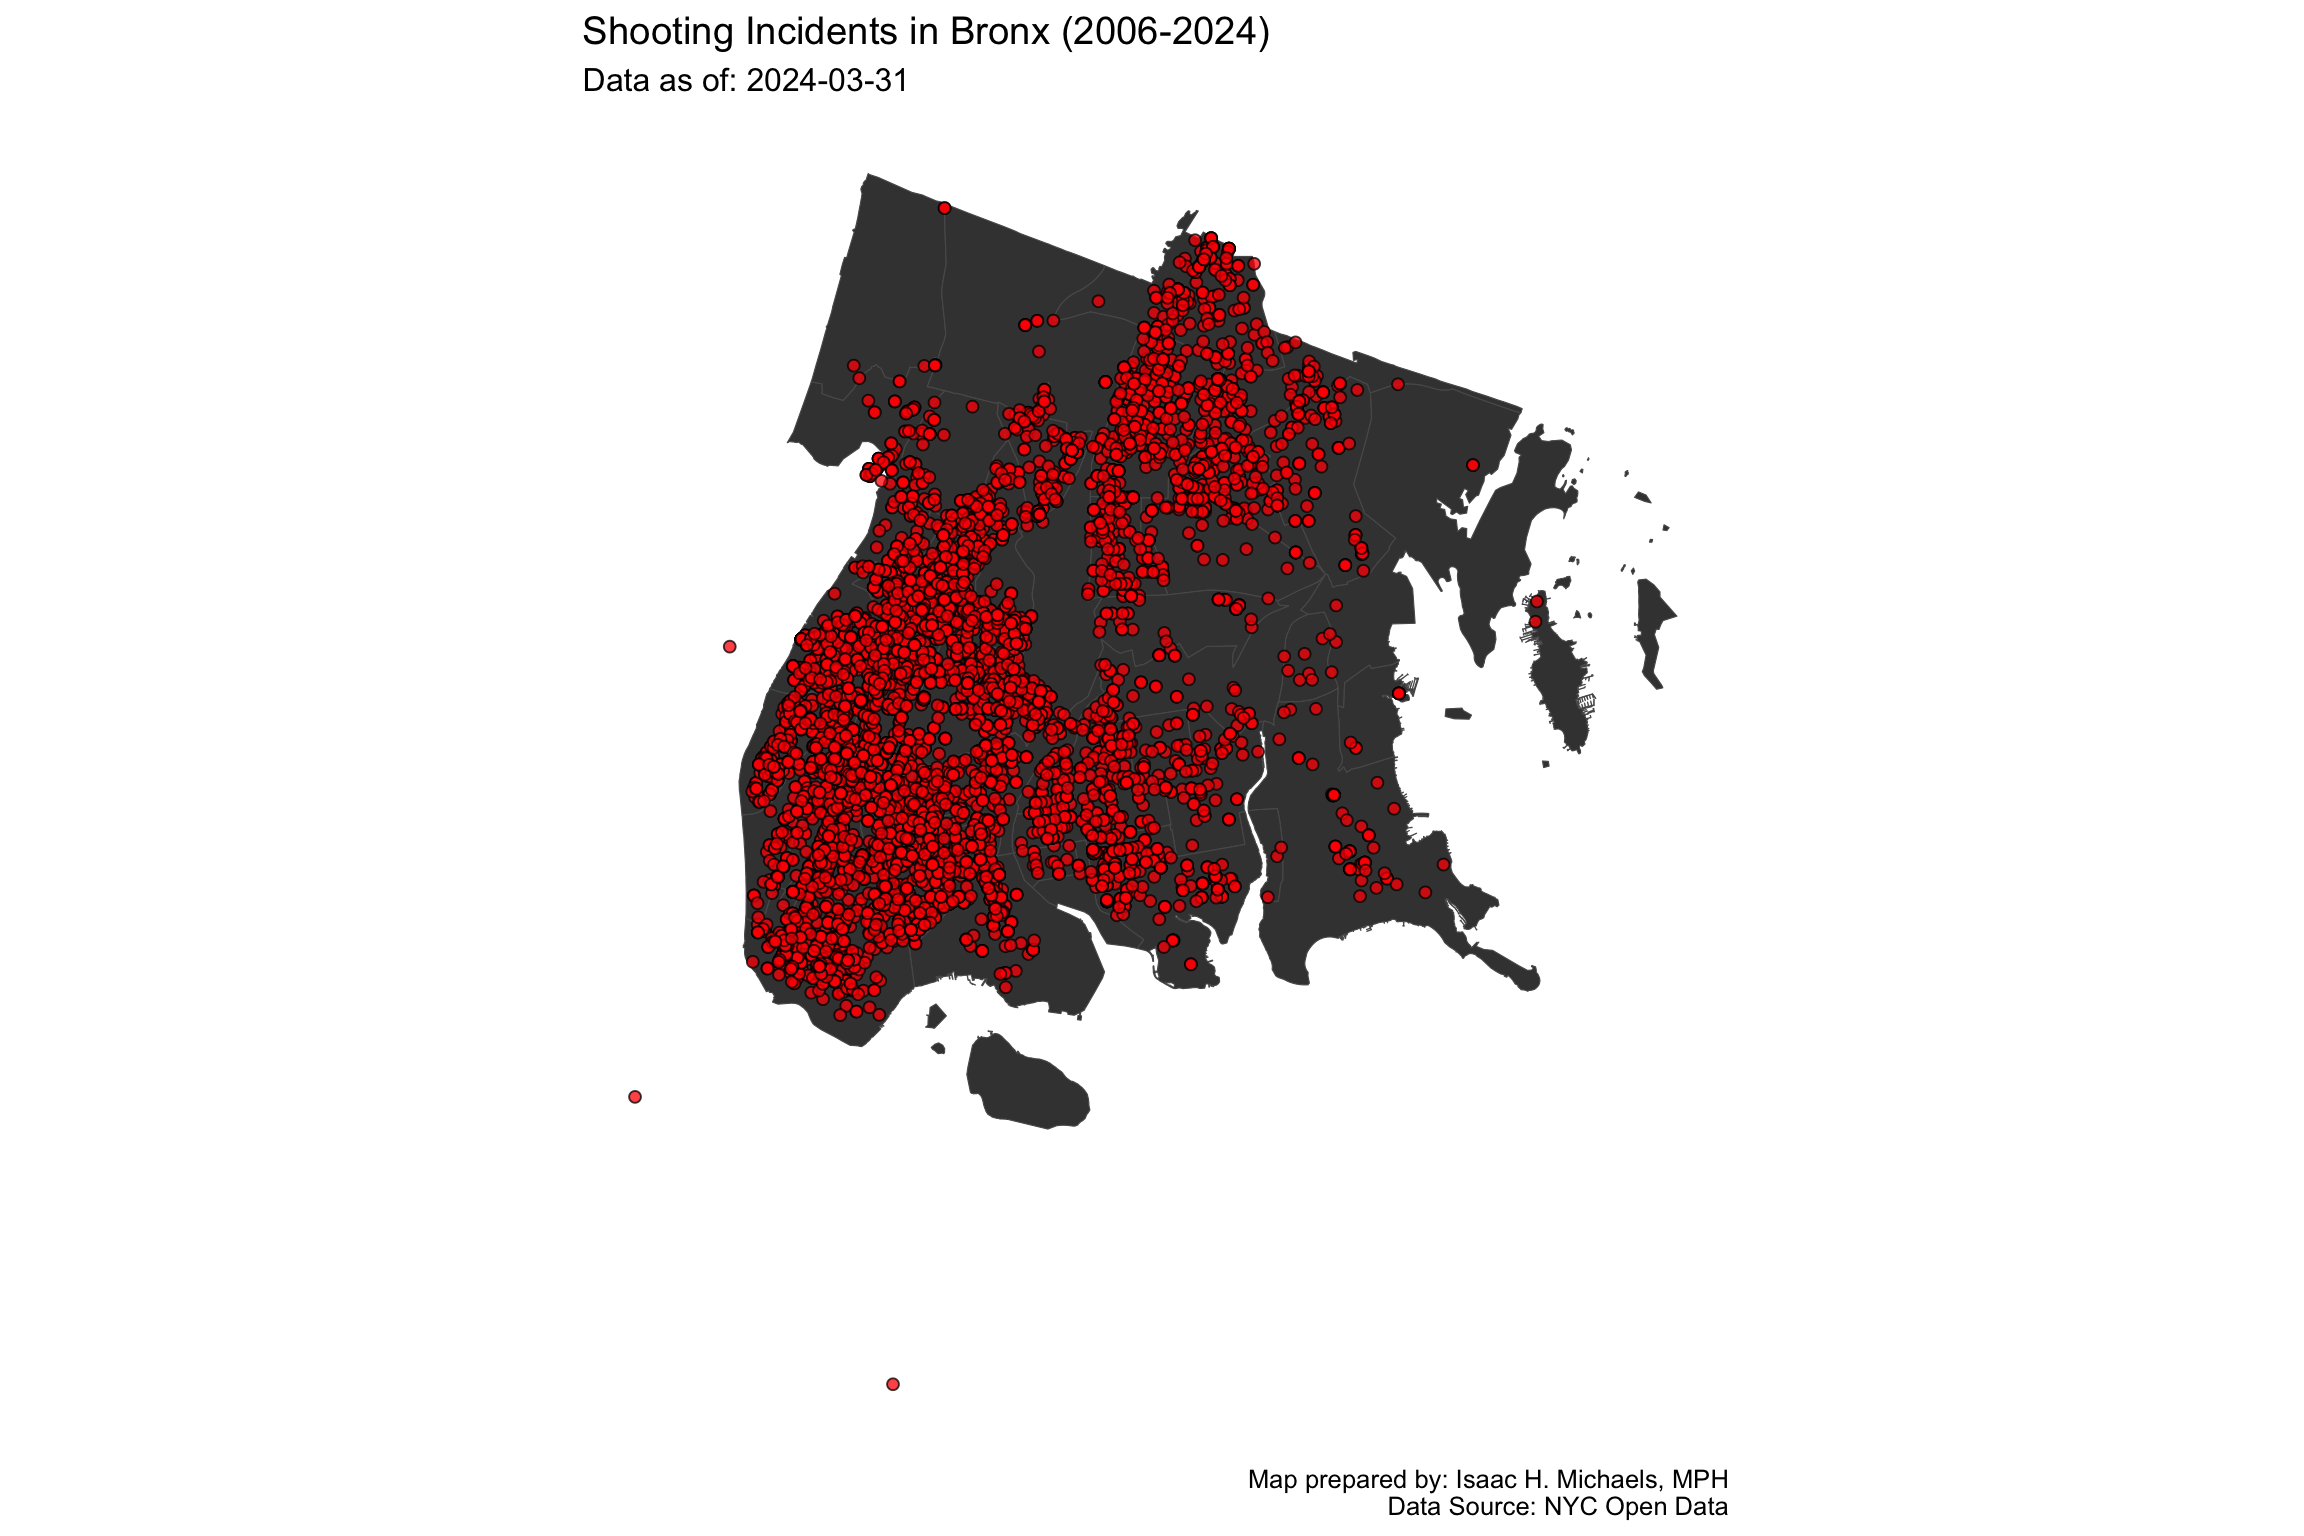
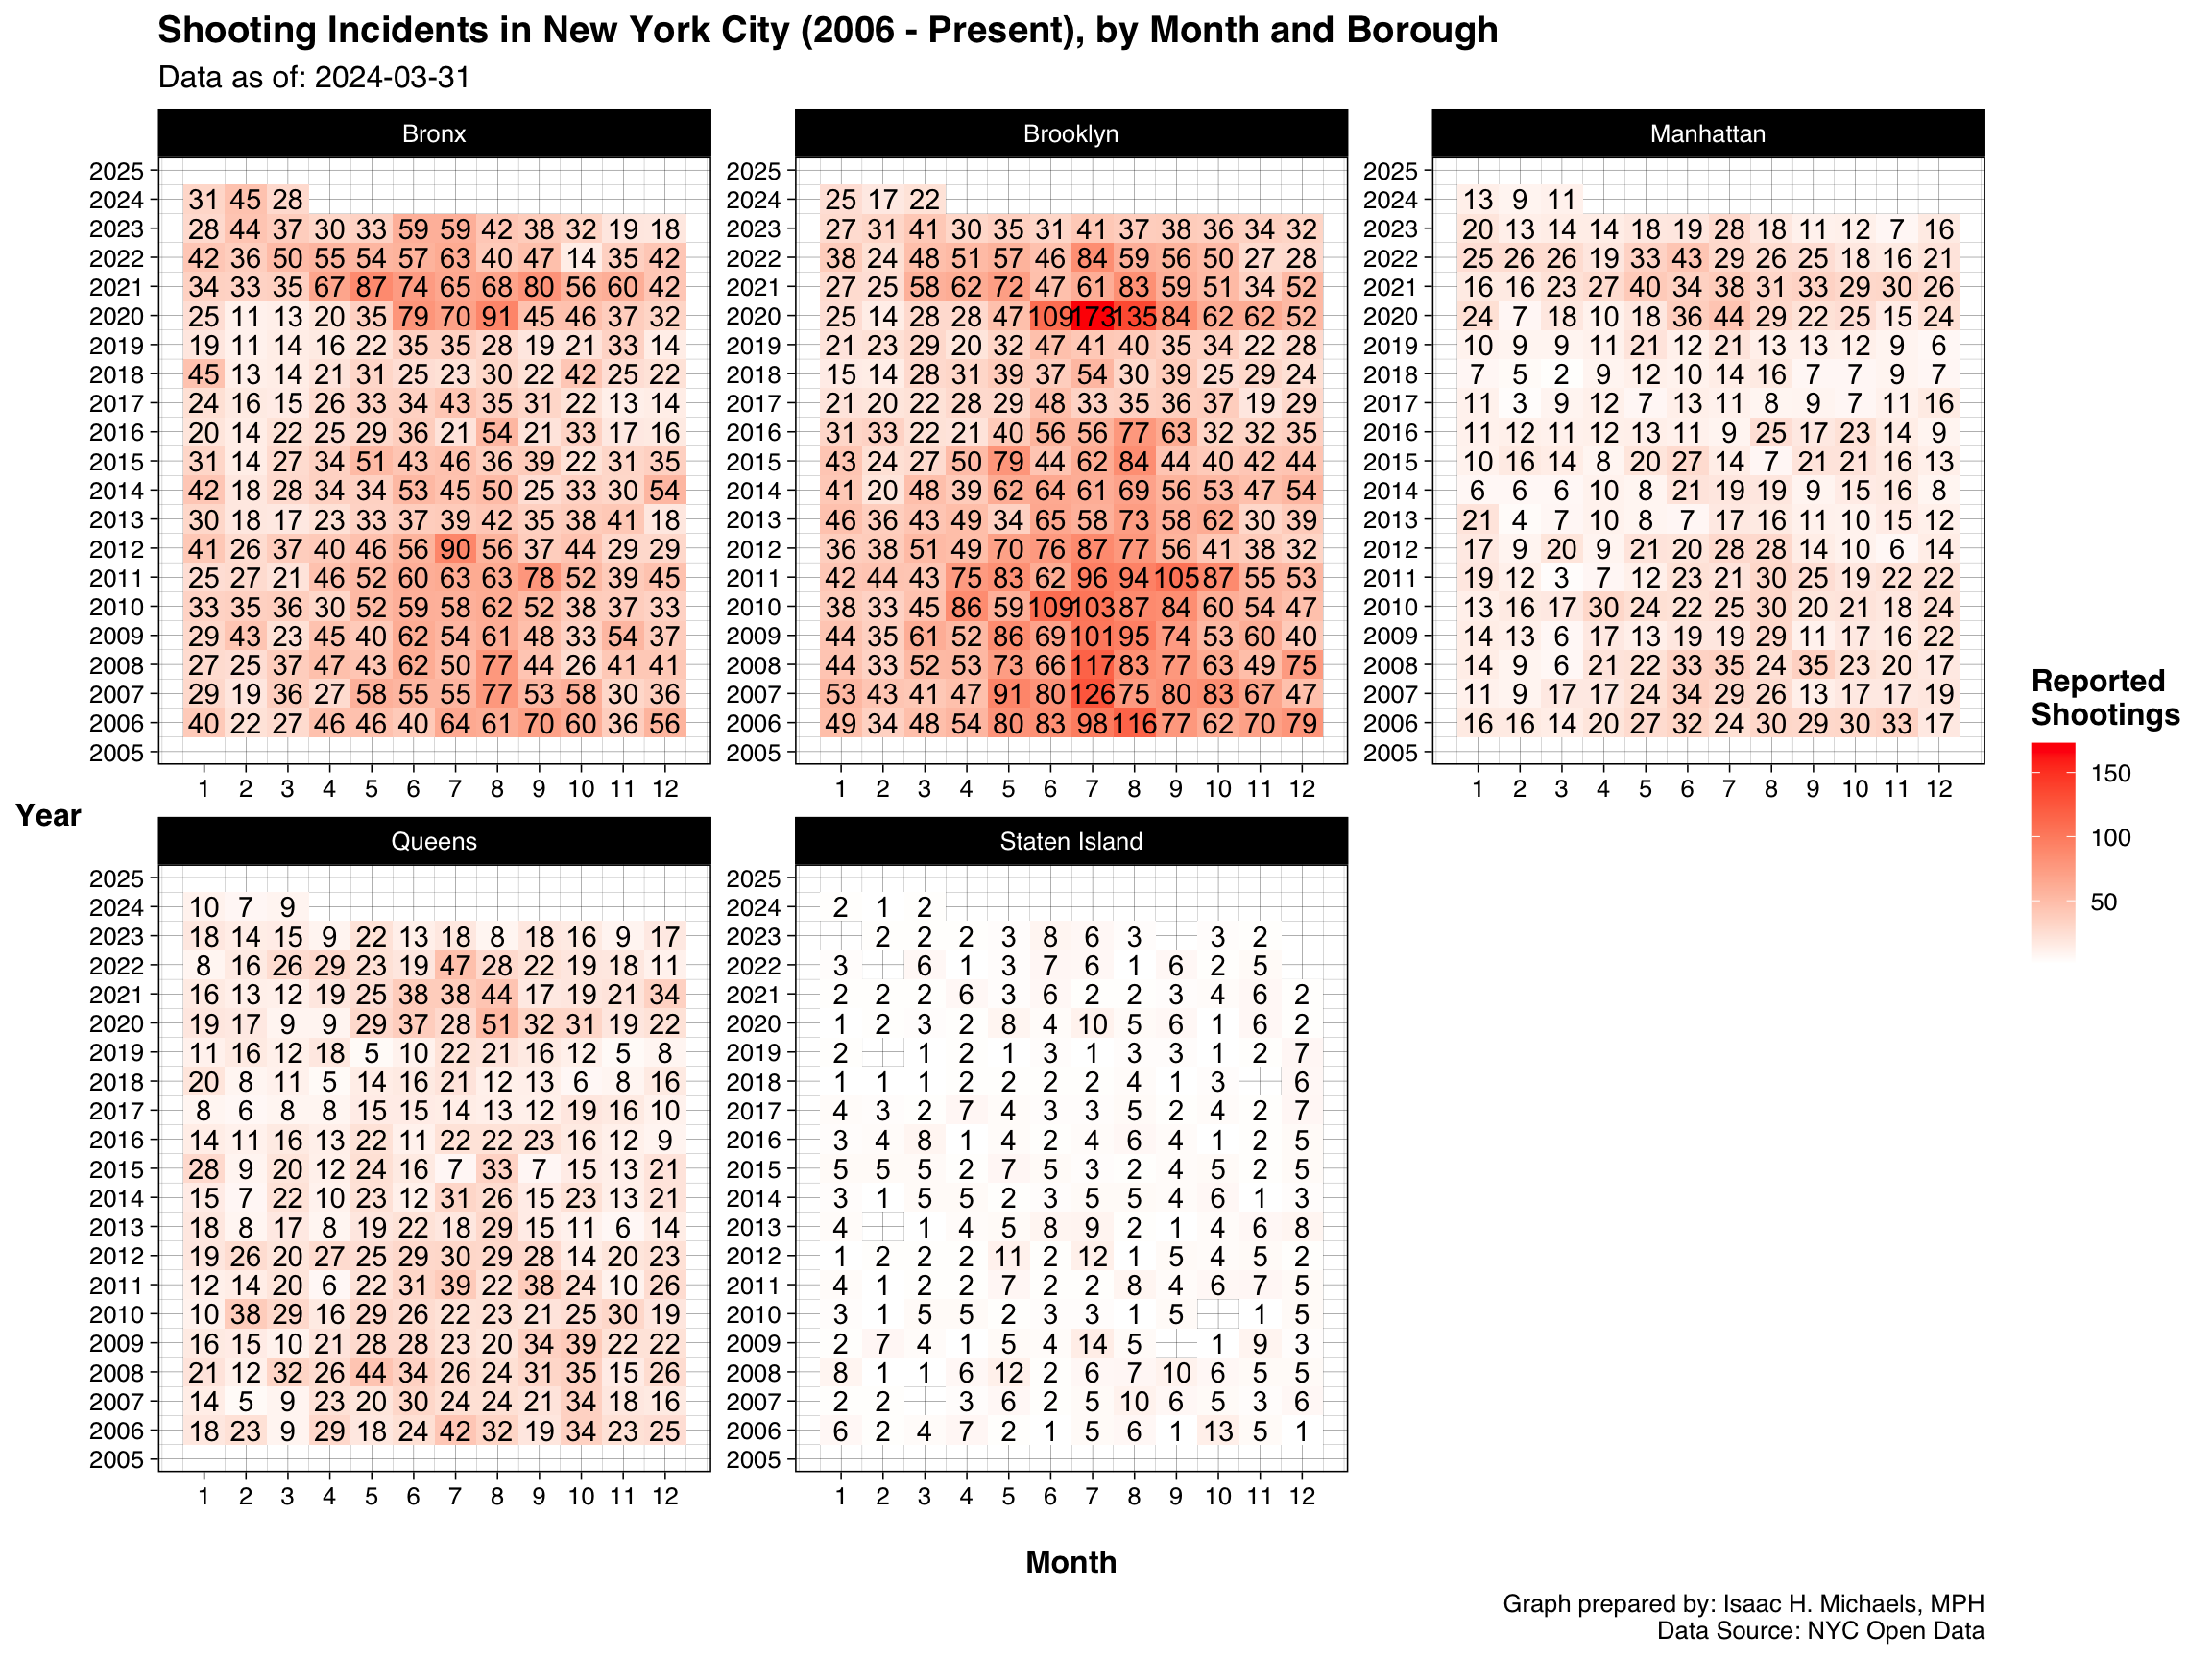
Boroughs – Annual Trends
Trends
 Graph Prepared By: Isaac H. Michaels, MPH
Data Source: NYC Open Data (Current, Historical)
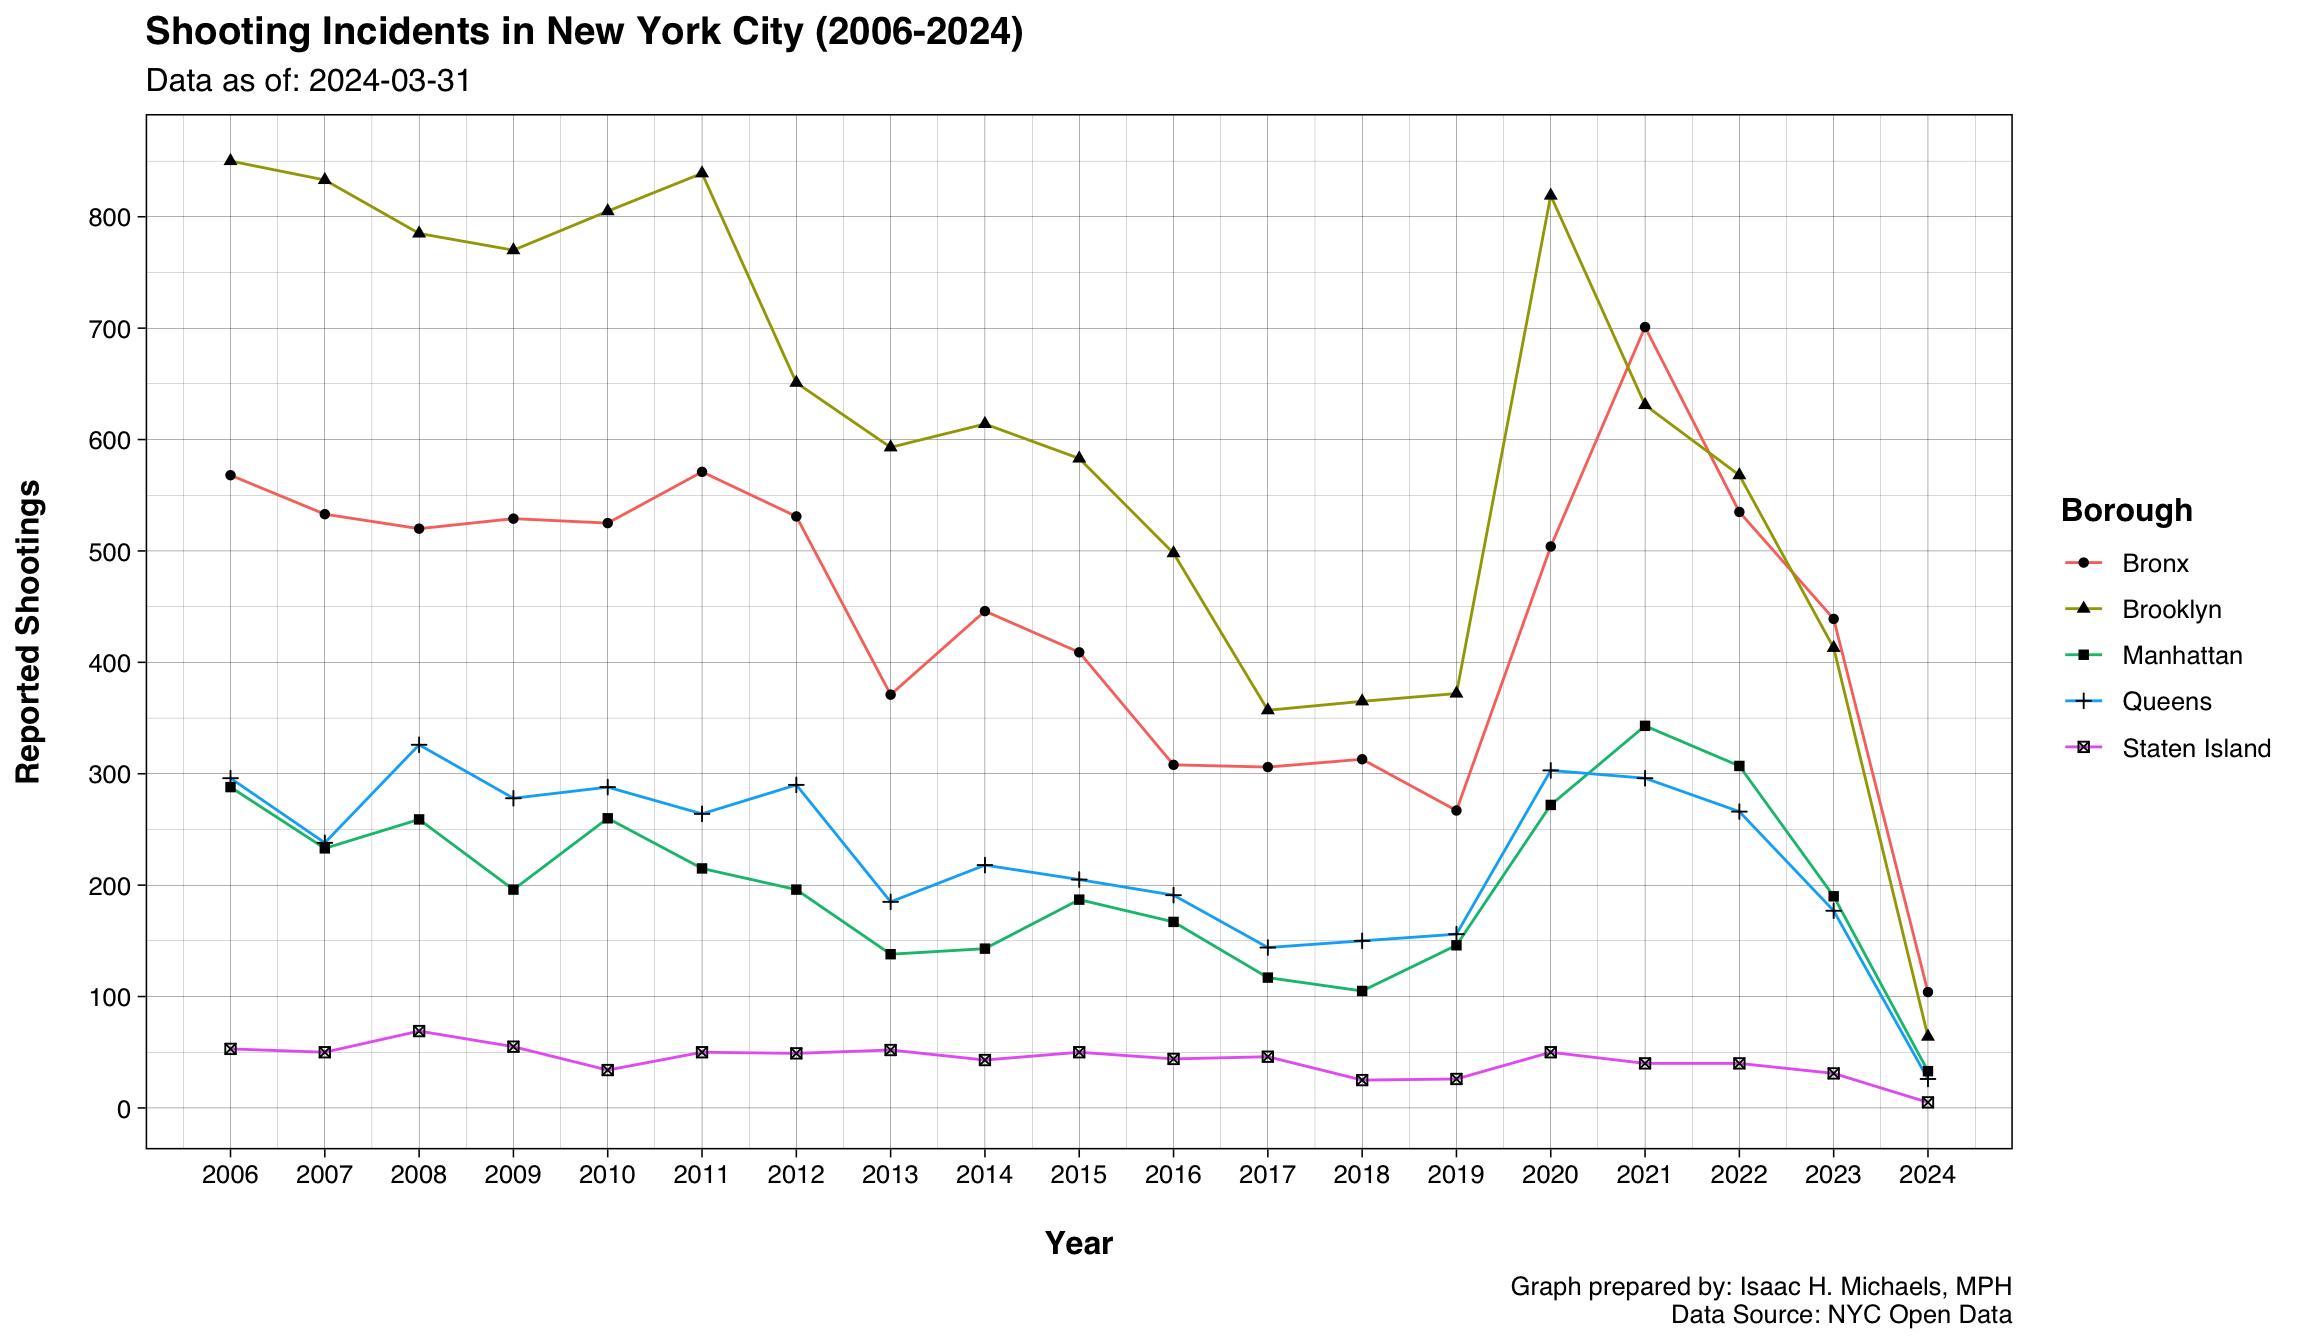
Shooting Incidents in New York City, by Borough (2006-2025)
Data as of: 2025-03-30
| Year | Bronx | Brooklyn | Manhattan | Queens | Staten Island |
|---|---|---|---|---|---|
| 2006 | 568 | 850 | 288 | 296 | 53 |
| 2007 | 533 | 833 | 233 | 238 | 50 |
| 2008 | 520 | 785 | 259 | 326 | 69 |
| 2009 | 529 | 770 | 196 | 278 | 55 |
| 2010 | 525 | 805 | 260 | 288 | 34 |
| 2011 | 571 | 839 | 215 | 264 | 50 |
| 2012 | 531 | 651 | 196 | 290 | 49 |
| 2013 | 371 | 593 | 138 | 185 | 52 |
| 2014 | 446 | 614 | 143 | 218 | 43 |
| 2015 | 409 | 583 | 187 | 205 | 50 |
| 2016 | 308 | 498 | 167 | 191 | 44 |
| 2017 | 306 | 357 | 117 | 144 | 46 |
| 2018 | 313 | 365 | 105 | 150 | 25 |
| 2019 | 267 | 372 | 146 | 156 | 26 |
| 2020 | 504 | 819 | 272 | 303 | 50 |
| 2021 | 701 | 631 | 343 | 296 | 40 |
| 2022 | 535 | 568 | 307 | 266 | 40 |
| 2023 | 439 | 413 | 190 | 177 | 31 |
| 2024 | 458 | 339 | 215 | 155 | 15 |
| 2025 | 59 | 62 | 25 | 21 | 3 |
Table Prepared By: Isaac H. Michaels, MPH
Data Source: NYC Open Data (Current, Historical)
 Graph Prepared By:
 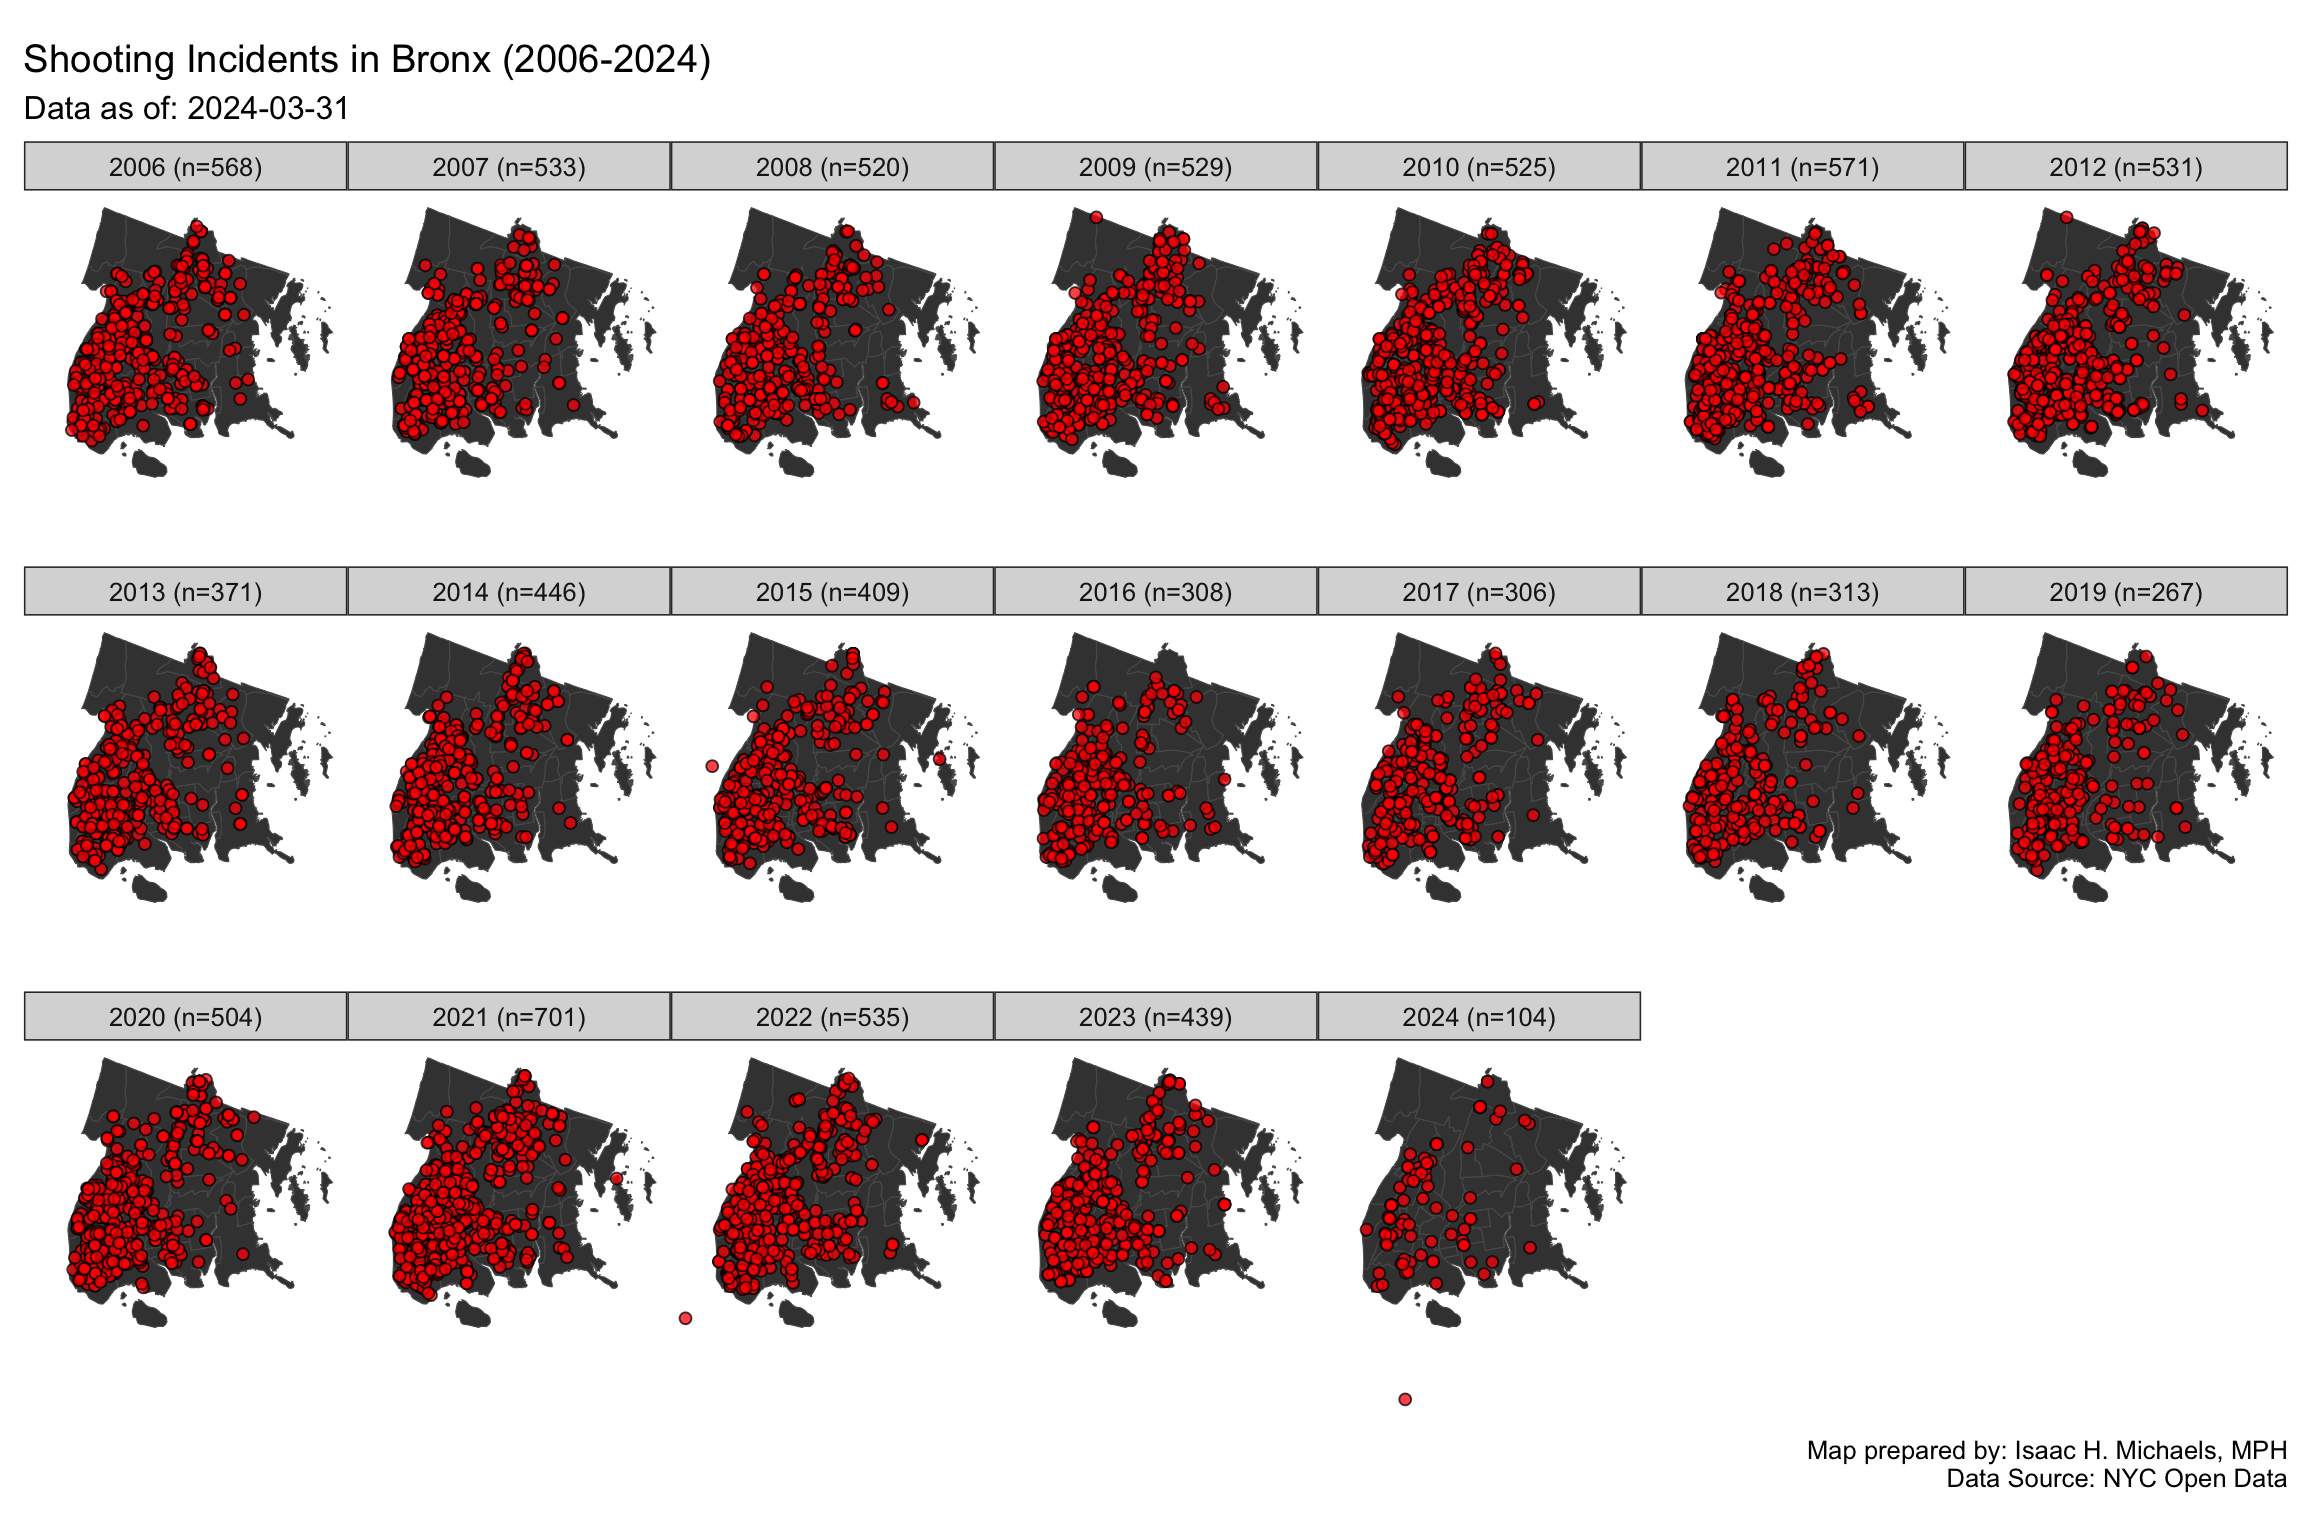 Maps Prepared By:
 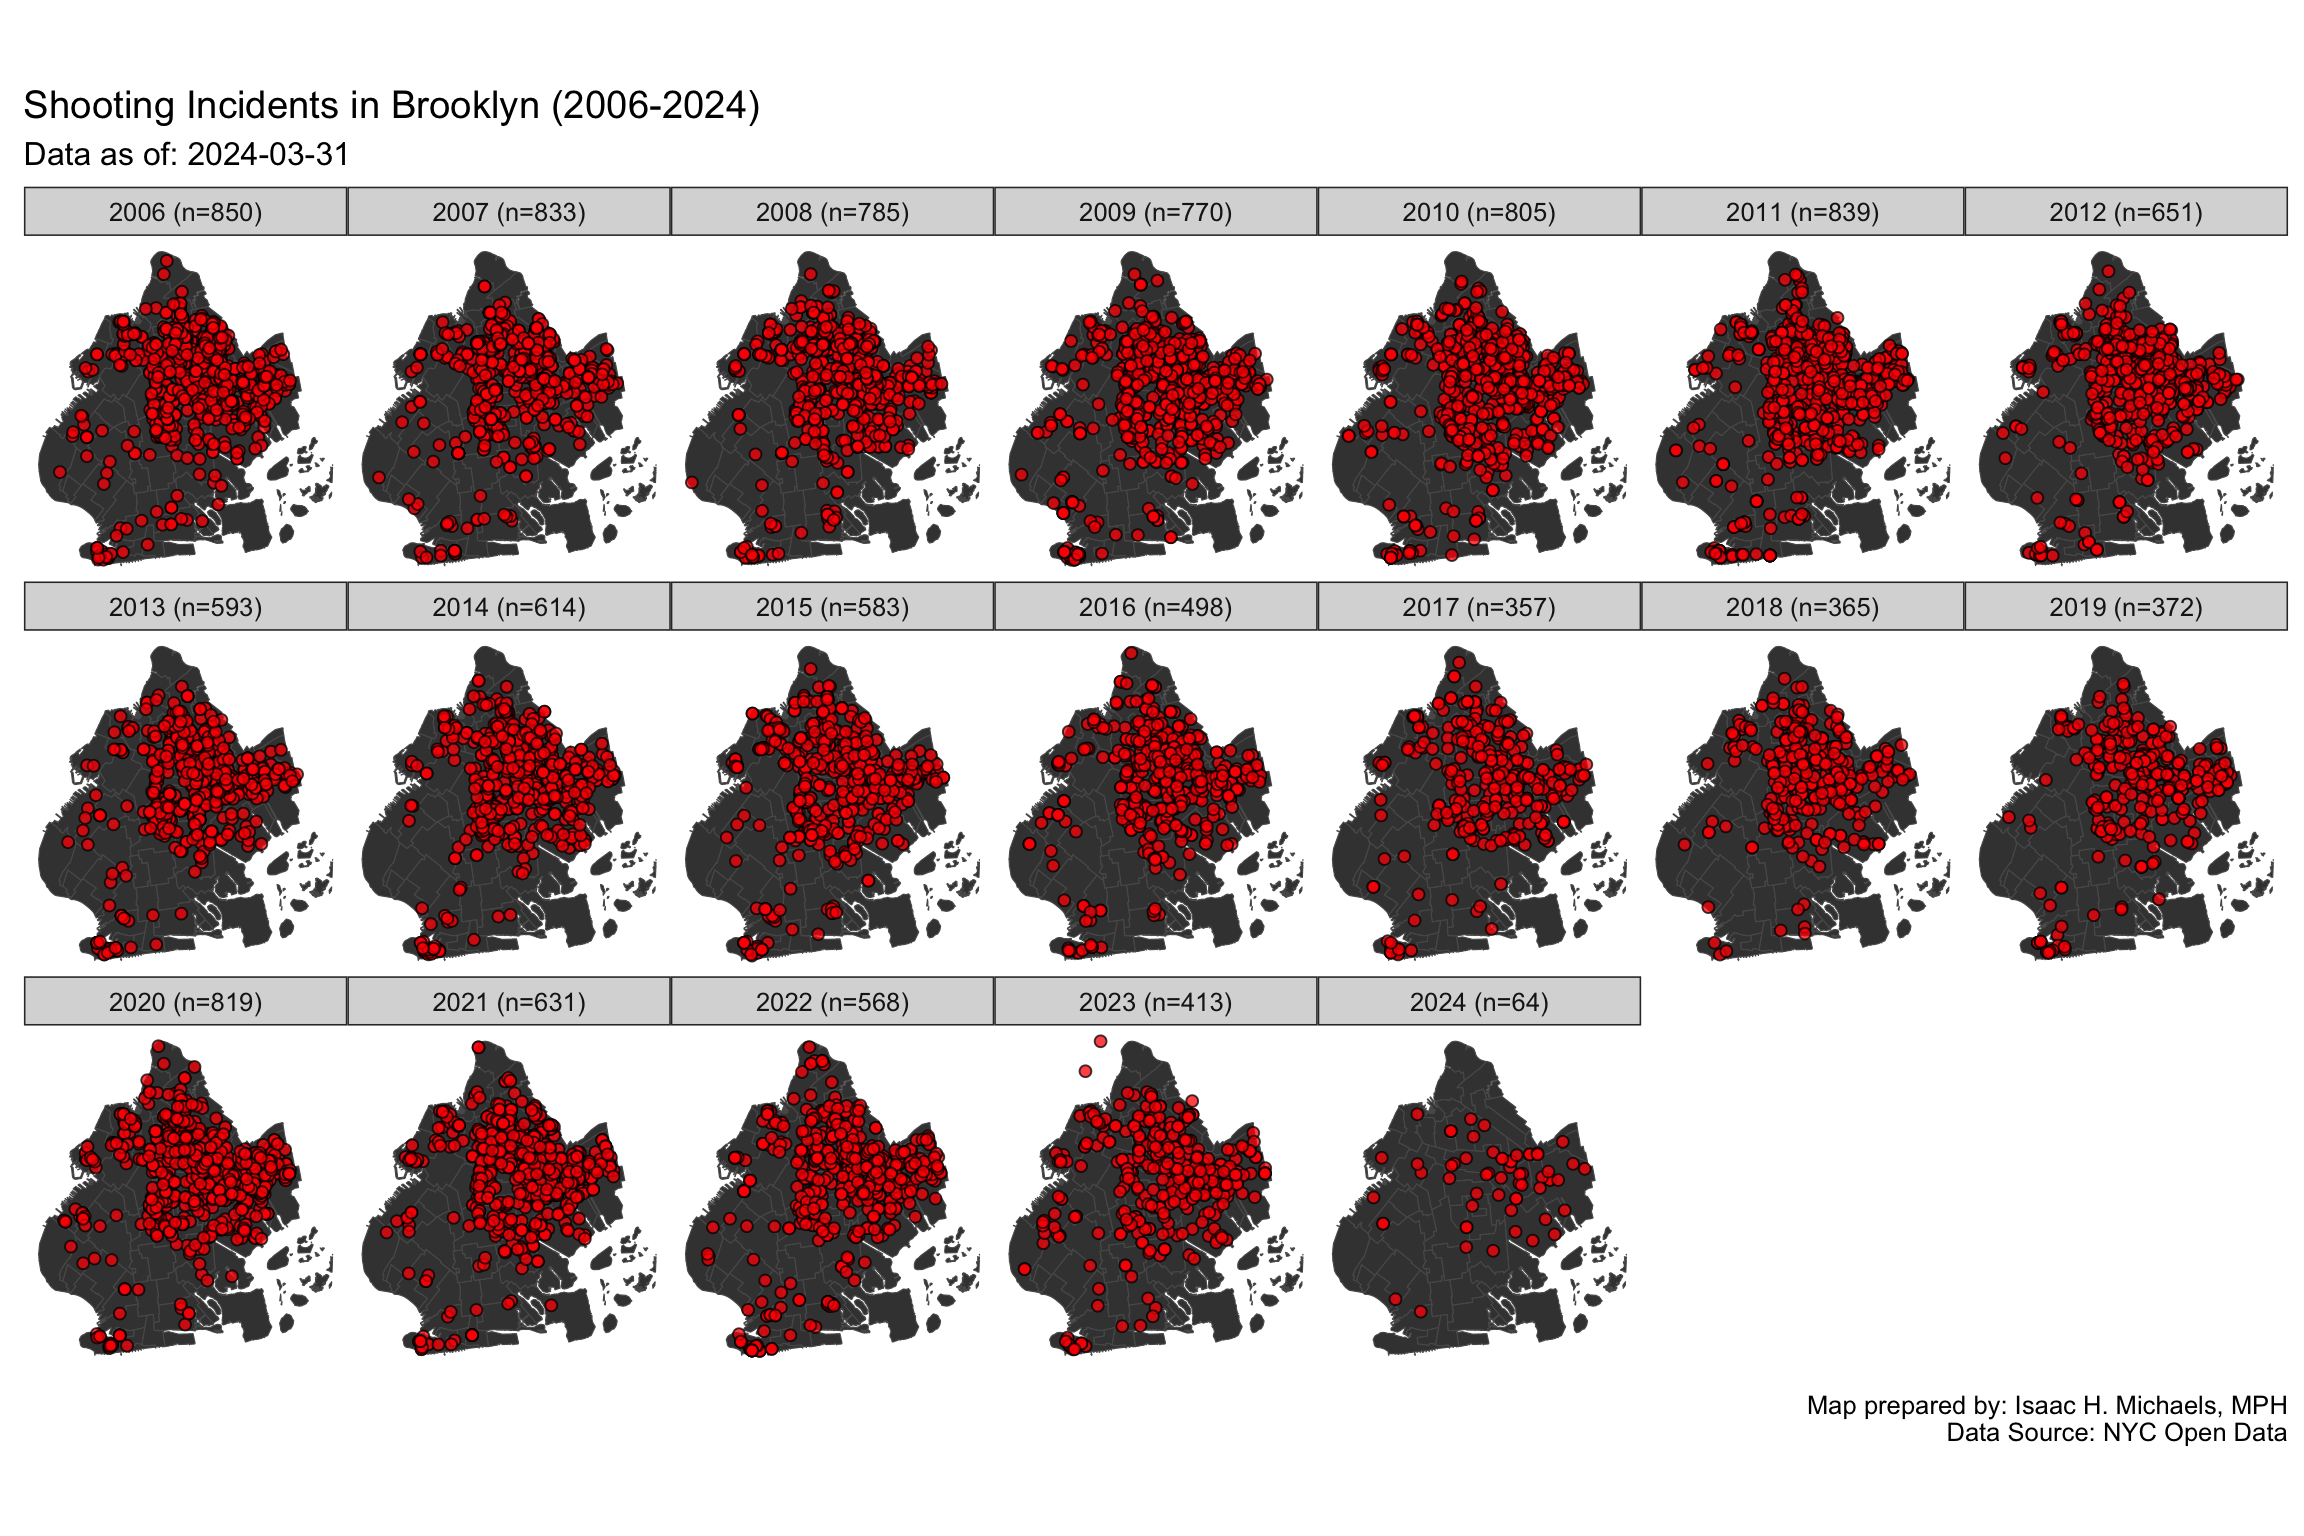 Maps Prepared By:
 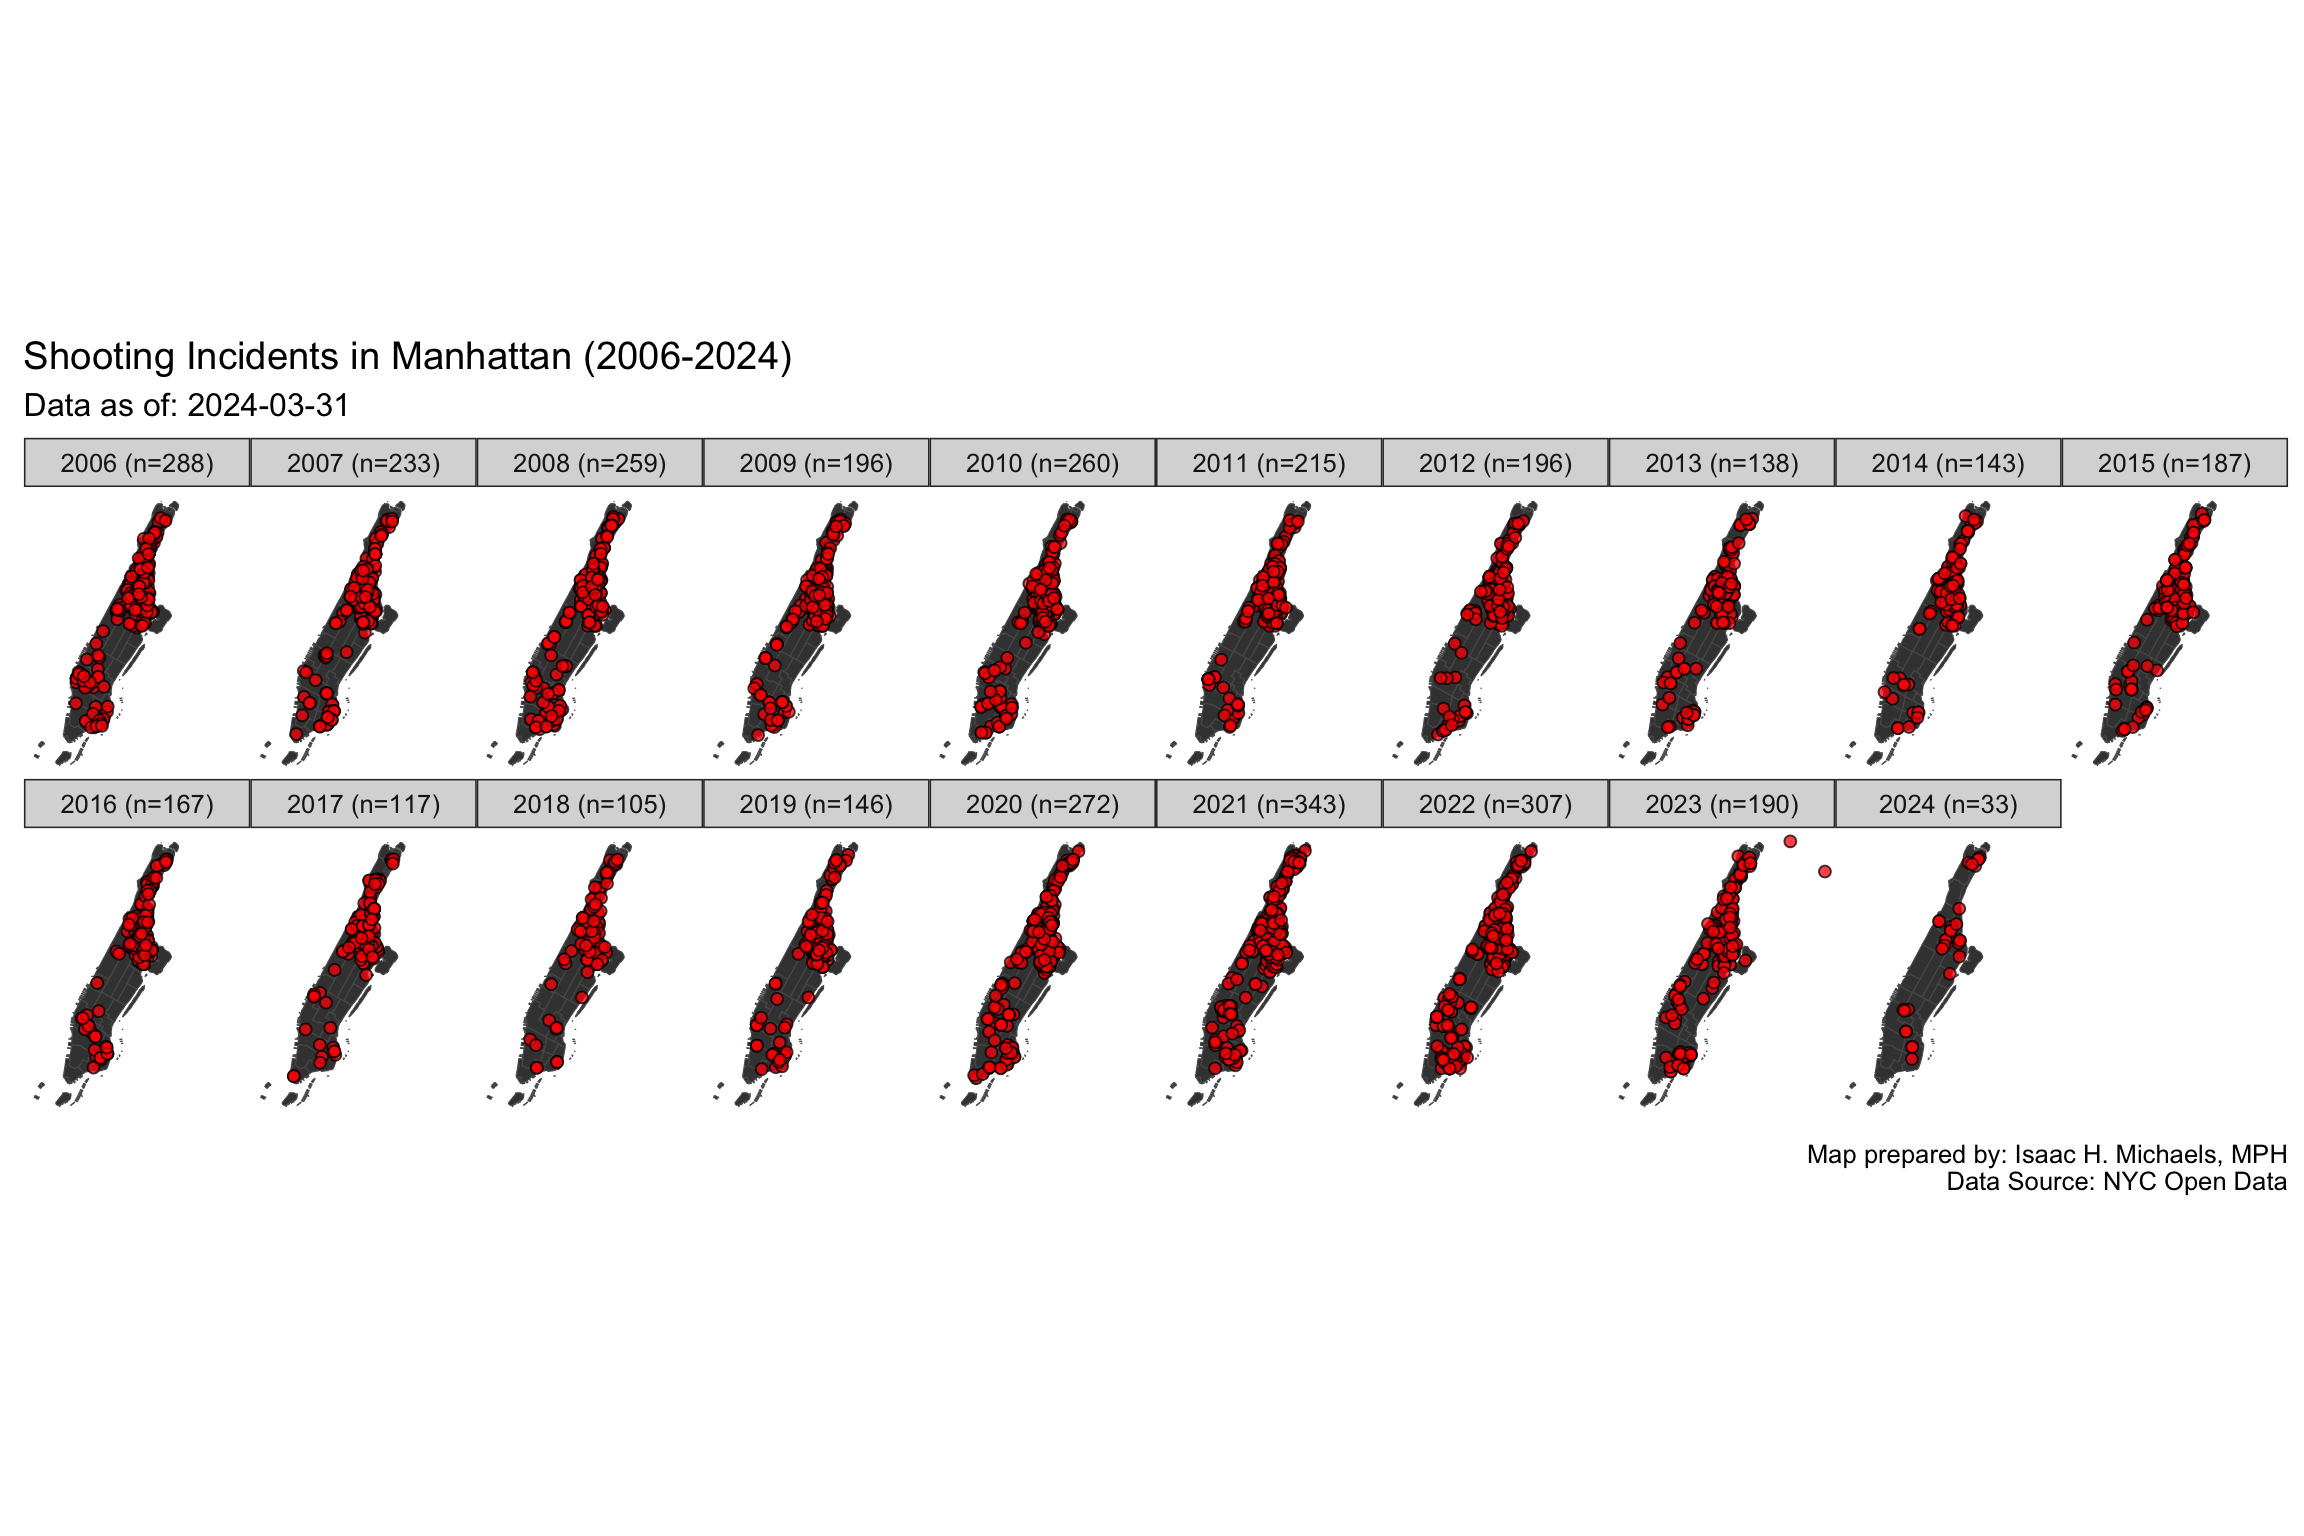 Maps Prepared By:
 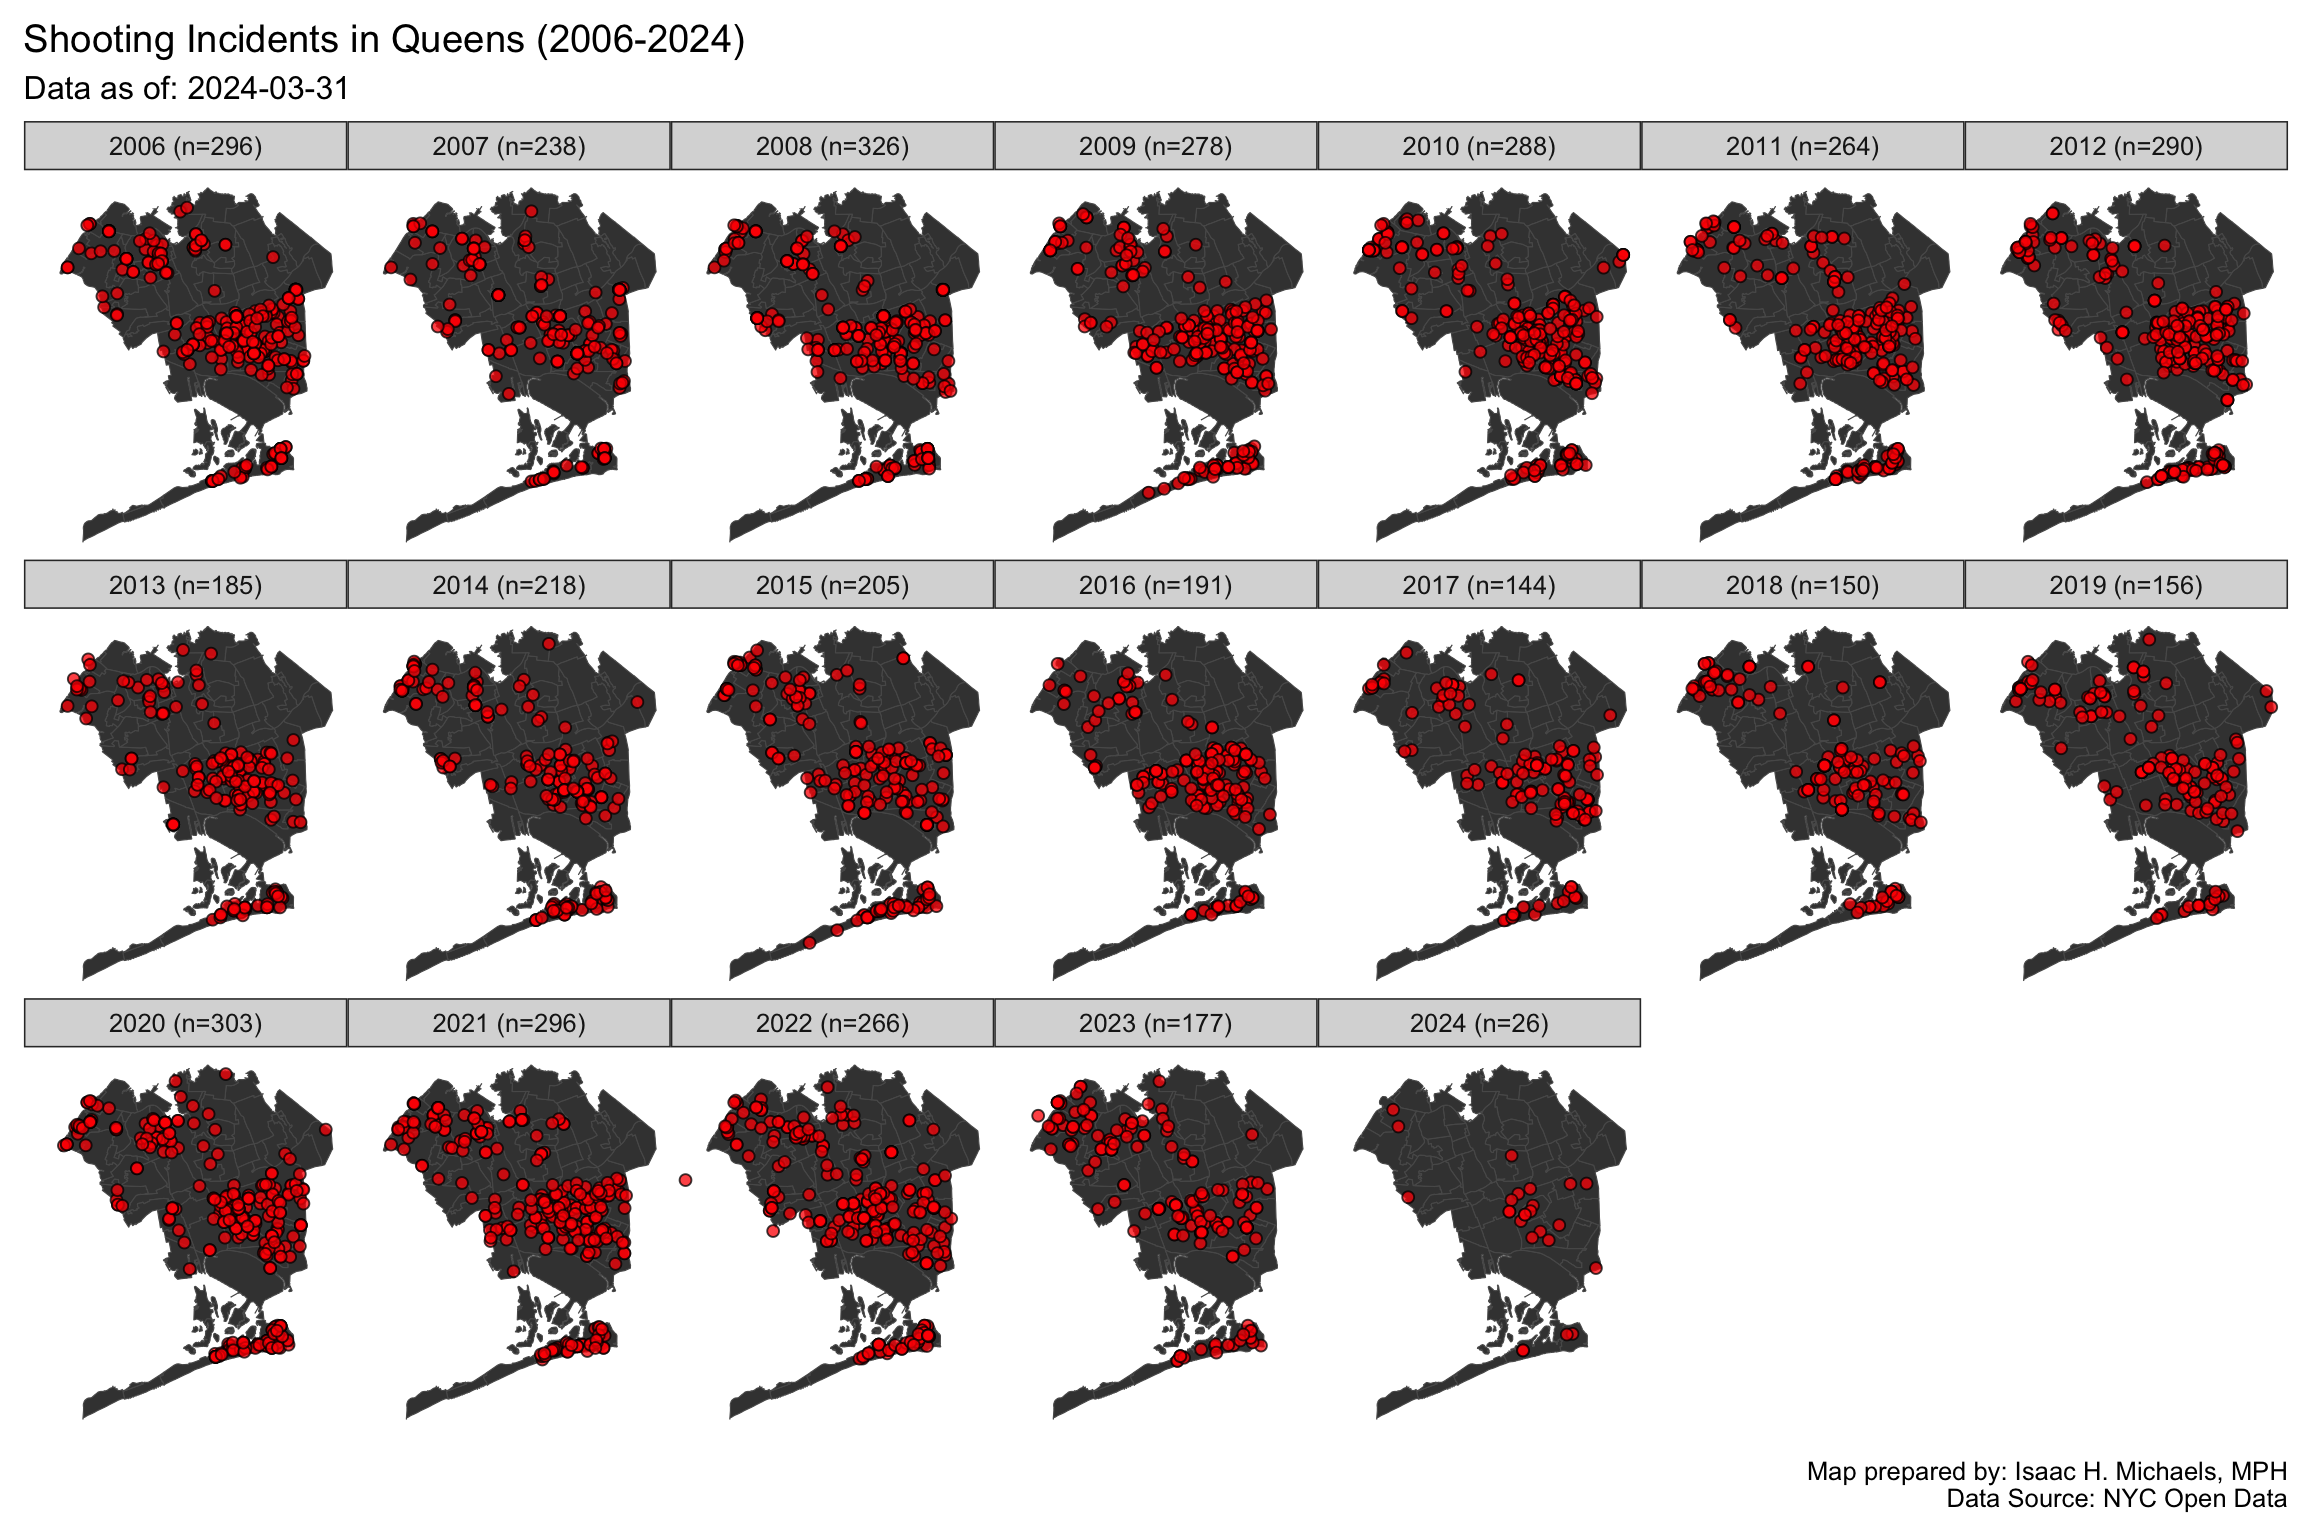 Maps Prepared By:
 Staten Island
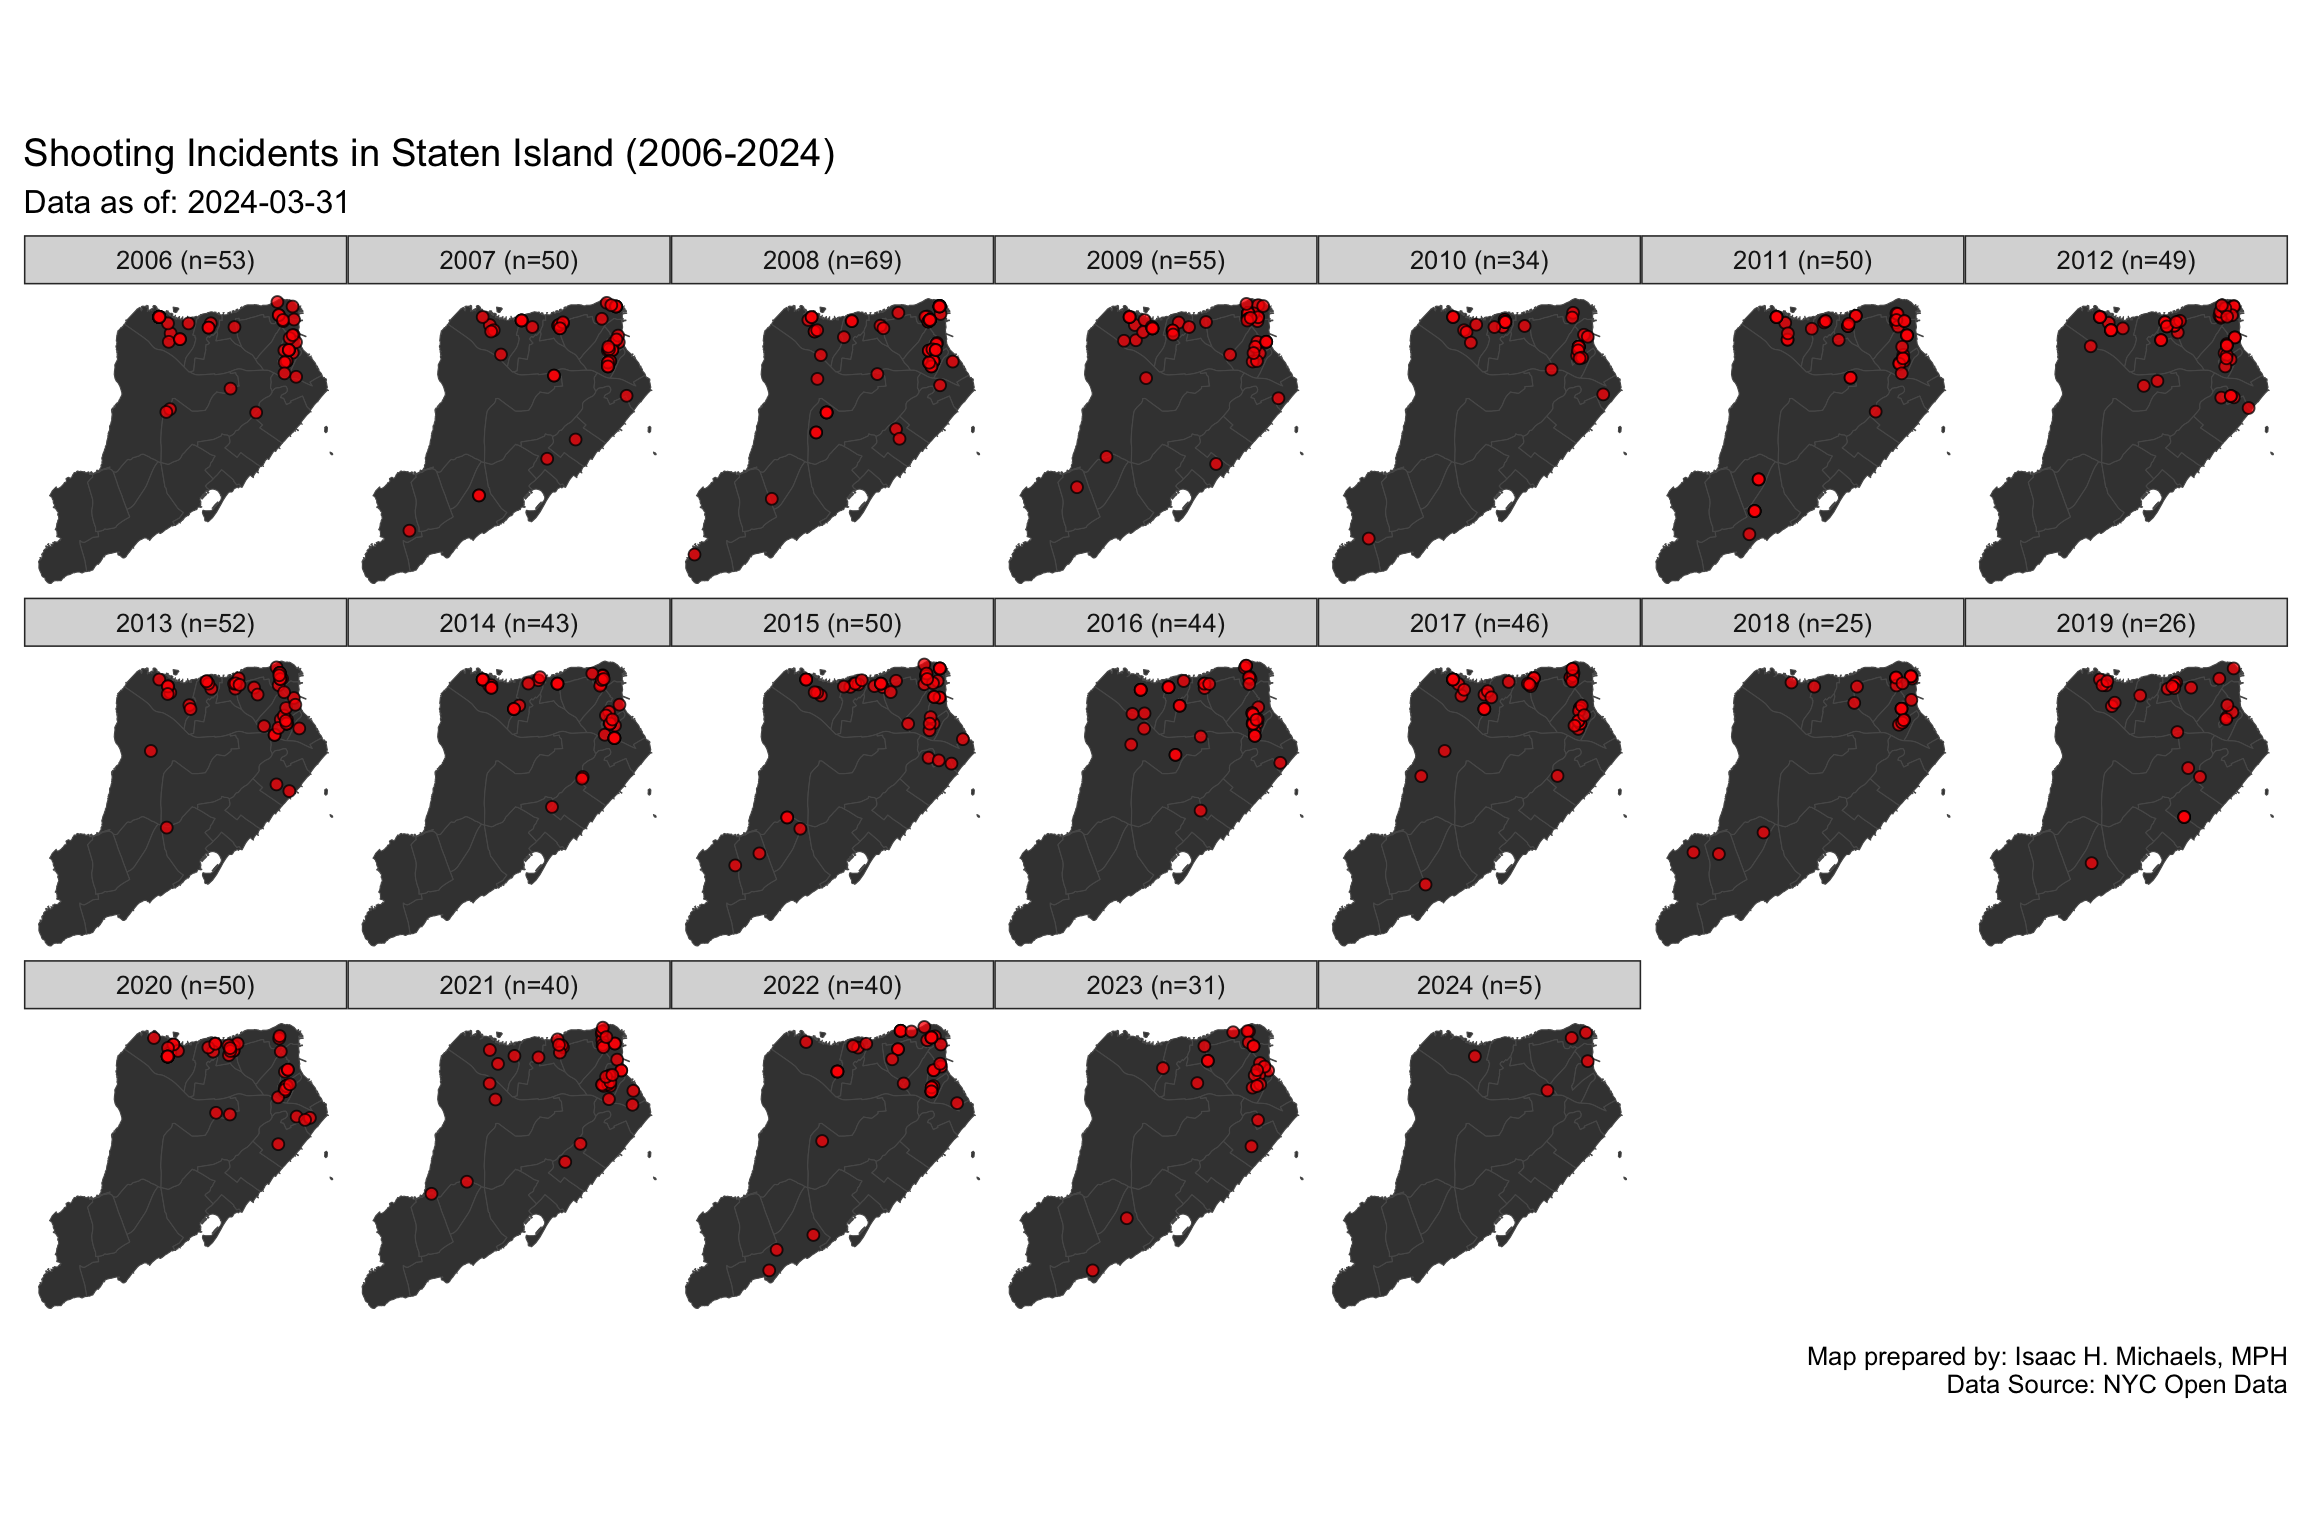 Maps Prepared By: Isaac H. Michaels, MPH
Data Source: NYC Open Data (Current, Historical)
Technical Notes
Dataset Description
Description excerpted from https://data.cityofnewyork.us/Public-Safety/NYPD-Shooting-Incident-Data-Historic-/833y-fsy8:
List of every shooting incident that occurred in NYC going back to 2006 through the end of the previous calendar year. This is a breakdown of every shooting incident that occurred in NYC going back to 2006 through the end of the previous calendar year. This data is manually extracted every quarter and reviewed by the Office of Management Analysis and Planning before being posted on the NYPD website. Each record represents a shooting incident in NYC and includes information about the event, the location and time of occurrence. In addition, information related to suspect and victim demographics is also included. This data can be used by the public to explore the nature of shooting/criminal activity. Please refer to the attached data footnotes for additional information about this dataset.
NYPD Shooting Incident Level Data Footnotes
Select footnotes excerpted from https://data.cityofnewyork.us/api/views/833y-fsy8/files/e4e3d86c-348f-4a16-a17f-19480c089429?download=true&filename=NYPD_Shootings_Incident_Level_Data_Footnotes.pdf:
Information is accurate as of the date it was queried from the system of record, but should be considered a close approximation of current records, due to revisions and updates.
Data is available as of the date that technological enhancements to information systems allowed for data capture. Null values appearing frequently in certain fields may be attributed to changes on official department forms where data was previously not collected. Null values may also appear in instances where information was not available or unknown at the time of the report and should be considered as either “Unknown/Not Available/Not Reported.”
A shooting incident can have multiple victims involved and as a result duplicate INCIDENT_KEY’s are produced. Each INCIDENT_KEY represents a victim but similar duplicate keys are counted as one incident.
Shooting incidents occurring near an intersection are represented by the X coordinate and Y coordinates of the intersection Shooting incidents occurring anywhere other than at an intersection are geo-located to the middle of the nearest street segment where appropriate.
Any attempt to match the approximate location of the incident to an exact address or link to other datasets is not recommended.
Many other shooting incidents that were not able to be geo-coded (for example, due to an invalid address) have been located as occurring at the police station house within the precinct of occurrence.
Shooting incidents occurring in open areas such as parks or beaches may be geo-coded as occurring on streets or intersections bordering the area.
Shooting incidents occurring on a moving train on transit systems are geo-coded as occurring at the train’s next stop.
All shooting incidents occurring within the jurisdiction of the Department of Correction have been geo-coded as occurring on Riker’s Island.
X and Y Coordinates are in NAD 1983 State Plane New York Long Island Zone Feet (EPSG 2263).
latitude and longitude Coordinates are provided in Global Coordinate System WGS 1984 decimal degrees (EPSG 4326).
Errors in data transcription may result in nominal data inconsistencies.
The CSV file should be opened using an appropriate tool for data exploration, e.g. SPSS, SAS, Tableau, etc. If using MS Excel, be sure to use the tools for importing external data, otherwise inconsistencies may occur when viewing the data.
Only valid shooting incidents resulting in an injured victim are included in this release. Shooting incidents not resulting in an injured victim are classified according to the appropriate offense according to NYS Penal Law.