Published: February 18, 2023
Updated: September 07, 2023 at 03:34PM
Welcome
Welcome to my COVID-19 data predictions web page. On this page, I will present a predictive model to estimate the daily total number of COVID-19 deaths reported by New York State 7 days in the future from the latest available death data. This page will be updated daily to reflect the latest data.
Data Overview
The data used in this model were obtained from the Health Data NY and data.cdc.gov open-data platforms. The model uses a wide range of variables related to COVID-19 deaths, diagnostic testing, hospital admissions, and vaccination uptake. The full list of variables used in the model is provided in the model specifications section below.
How to Use These Data
The model presented on this page can be used to provide daily predictions of the total number of COVID-19 deaths reported by New York State 7 days in the future from the latest available death data. The model is built using machine learning techniques and incorporates a range of relevant variables to make the best possible prediction. The model should not be used as a substitute for public health recommendations or medical advice.
Why are These Data Important?
Tracking the number of COVID-19 deaths reported by New York State is crucial to monitor the impact of the pandemic and evaluate the effectiveness of public health interventions. By predicting the number of deaths 7 days in the future from the latest available death data, this model can provide valuable information to public health officials and policymakers to make informed decisions.
What do These Data Show?
The data show daily predictions of the total number of COVID-19 deaths reported by New York State 7 days in the future from the latest available death data. The model is built using machine learning techniques and uses a range of relevant variables related to COVID-19 deaths, diagnostic testing, hospital admissions, and vaccination uptake to make the best possible prediction.
What do These Data Not Show?
While the model provides an estimate of the total number of COVID-19 deaths reported by New York State 7 days in the future from the latest available death data, it cannot predict individual outcomes or provide medical advice. The model is also based on the assumption that current trends will continue, and it cannot account for unexpected events or changes in public health interventions.
Implications for Public Health Practice
This model provides a valuable tool for public health officials and policymakers to monitor the impact of the COVID-19 pandemic and evaluate the effectiveness of public health interventions. By predicting the number of deaths 7 days in the future from the latest available death data, the model can provide advanced warning of potential surges in COVID-19 cases and deaths, allowing public health officials to take proactive measures to protect the health of their communities.
Death Predictions
Predictions
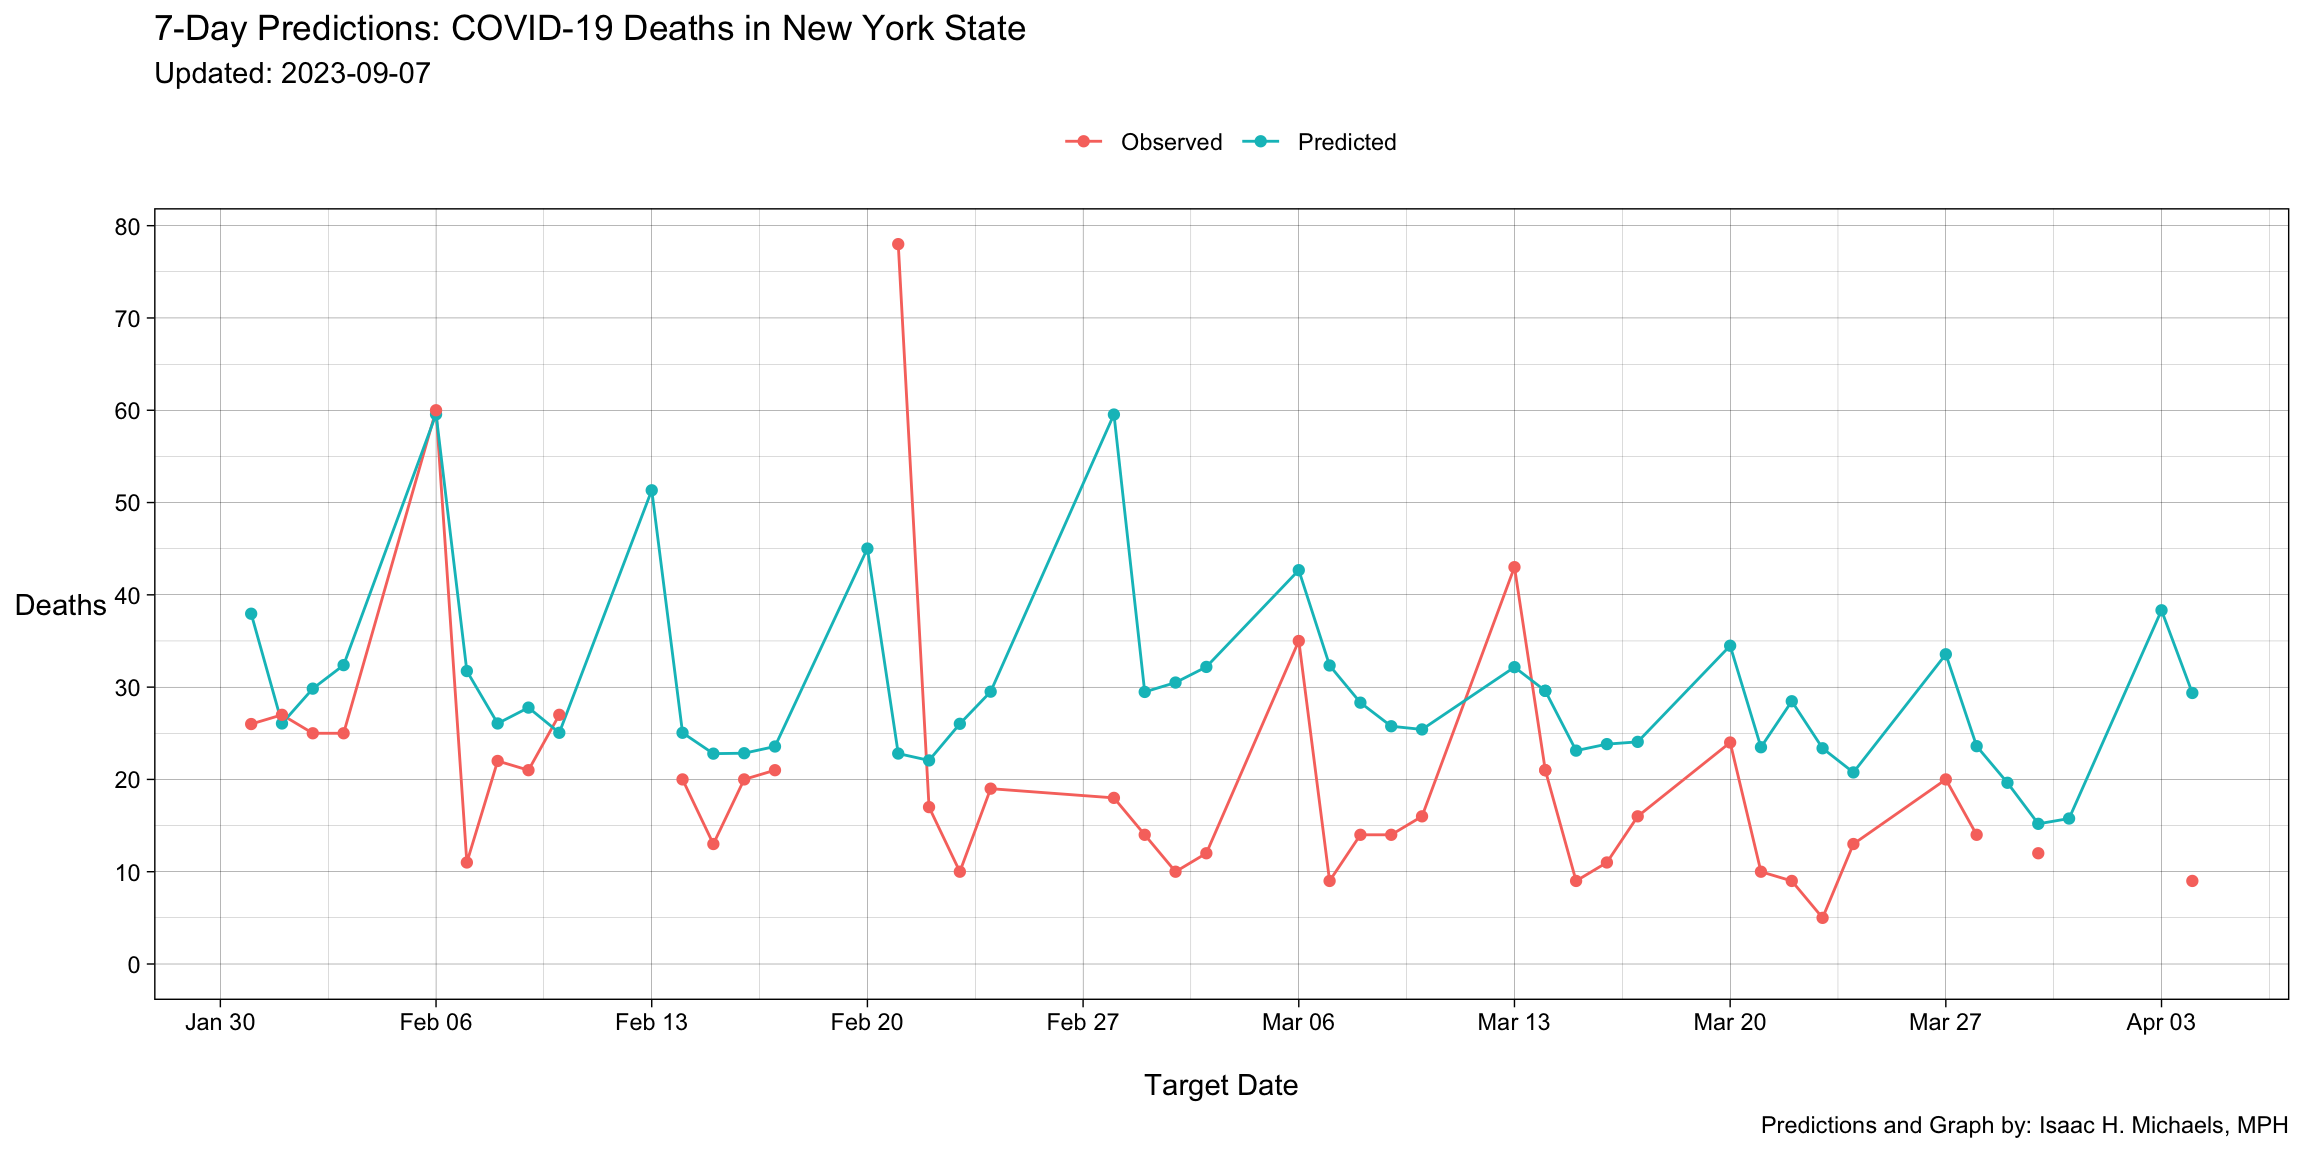
Predictions and Graph Developed by: Isaac H. Michaels, MPH
COVID-19 Deaths Data Source: Health Data NY
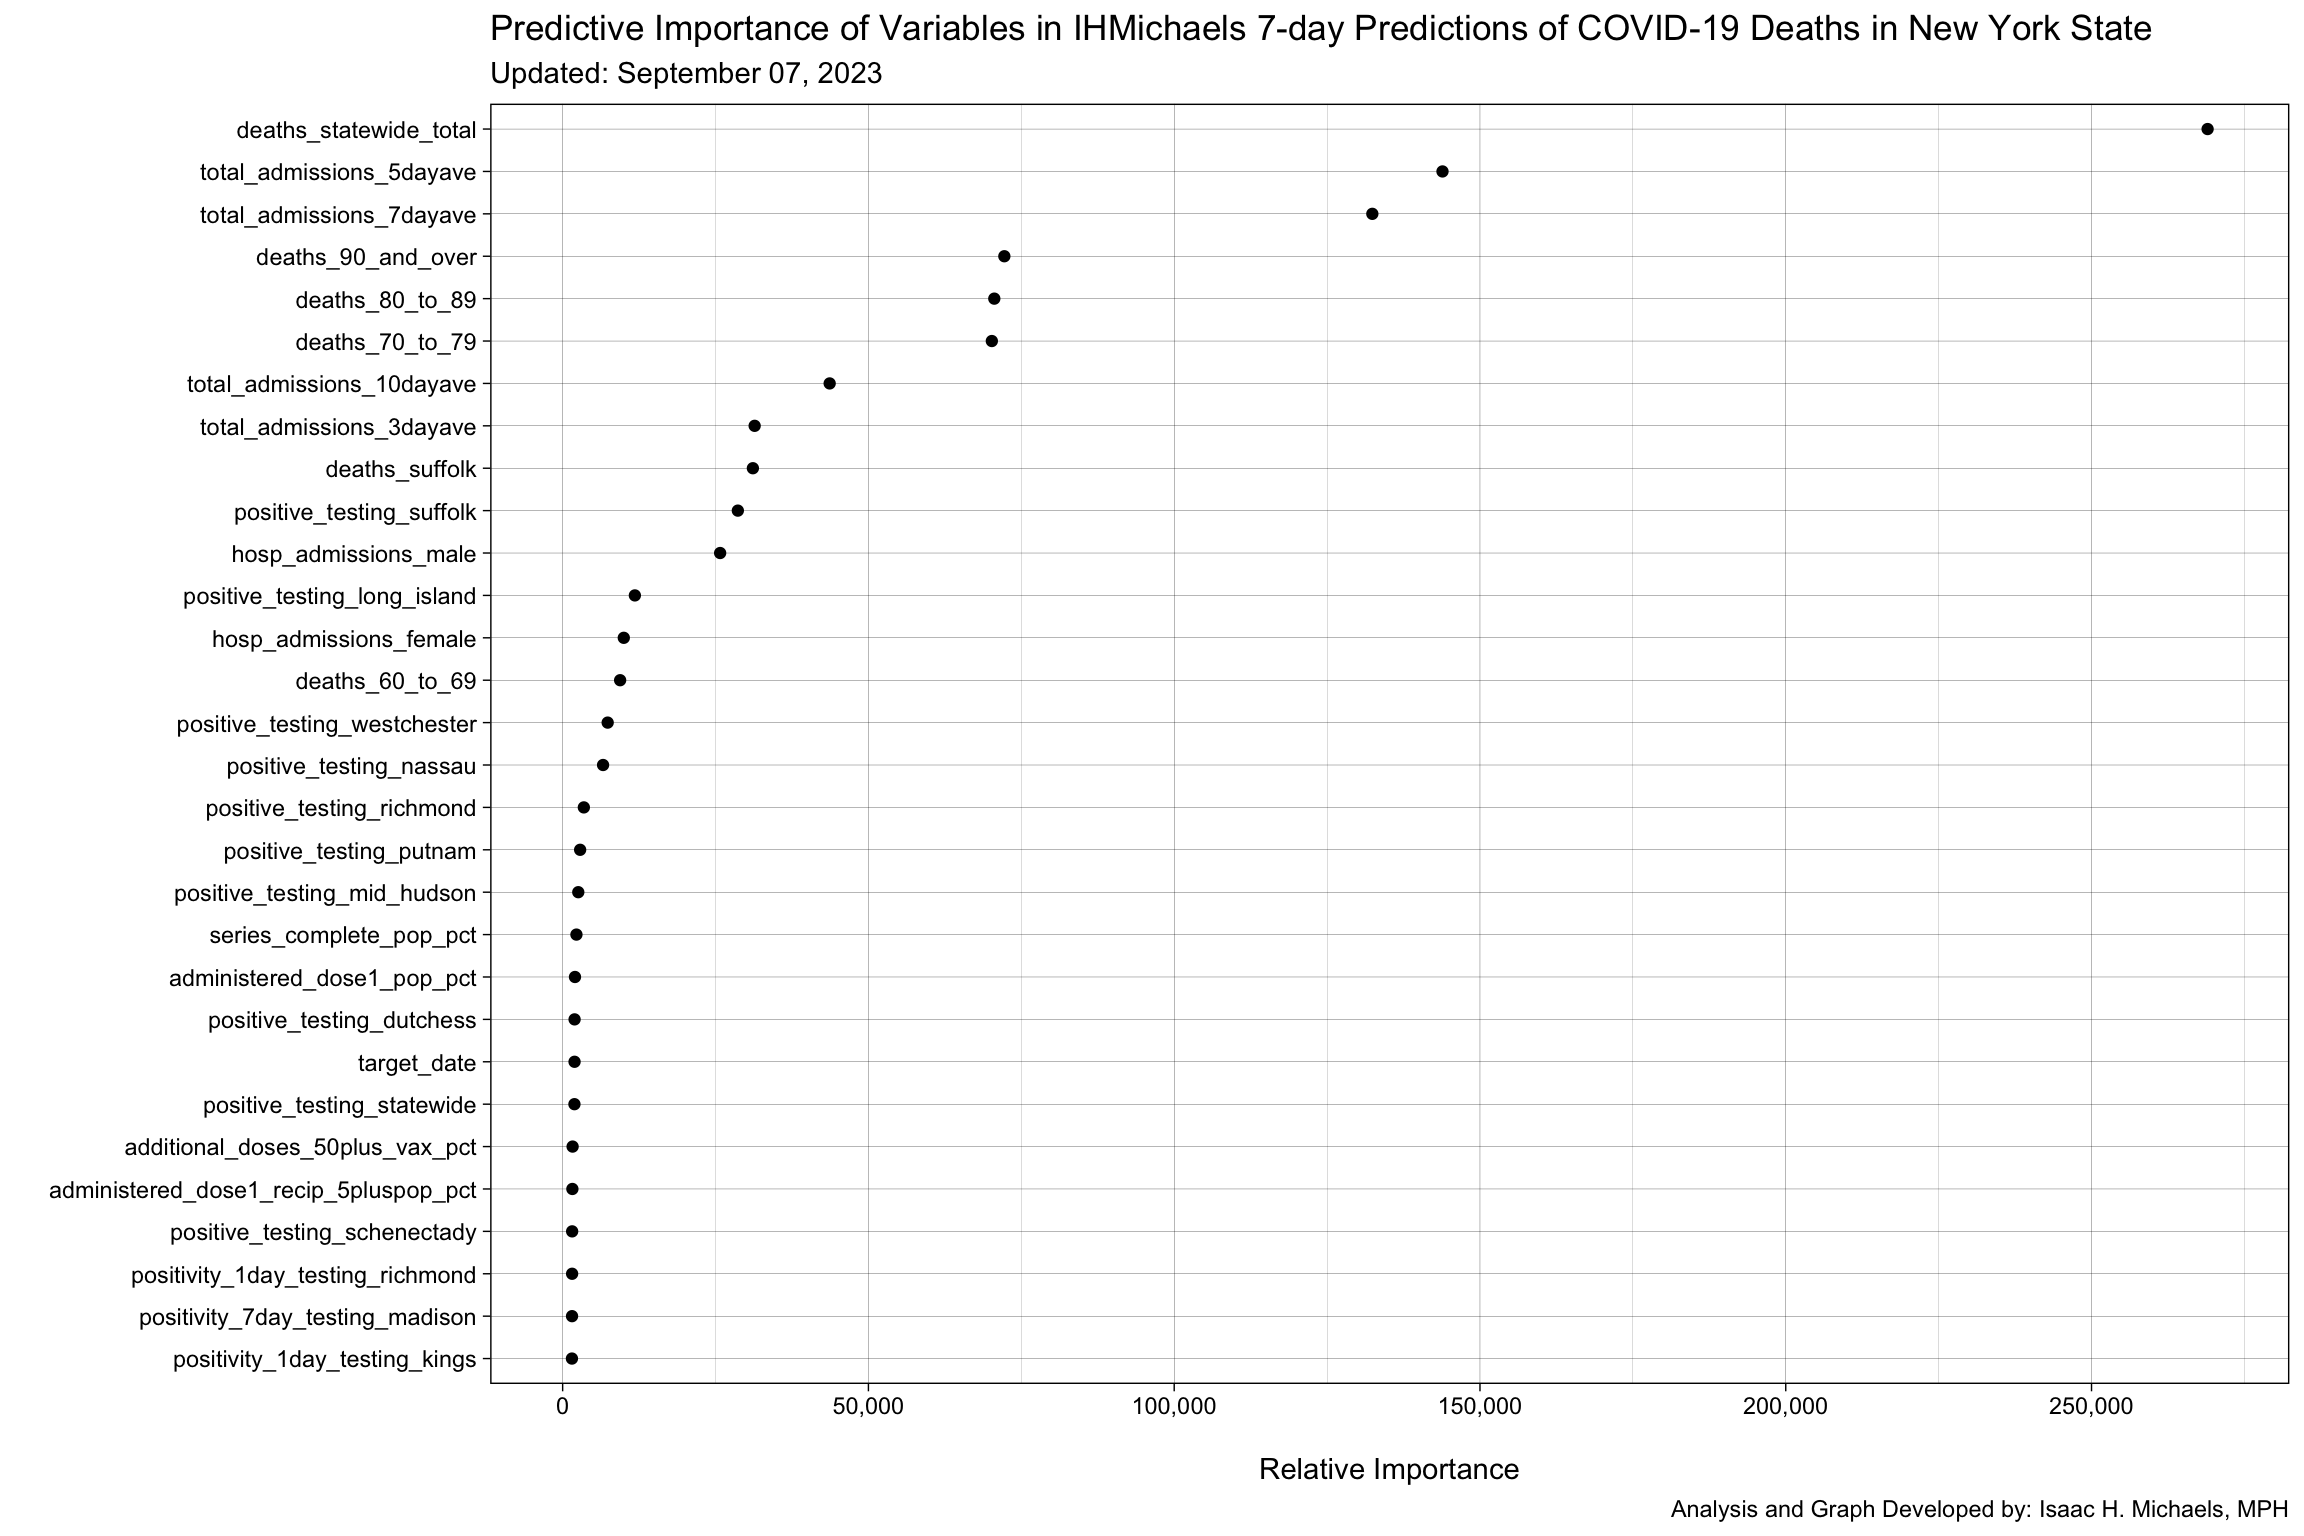
Model Specifications
- Target Variable: New York State statewide daily total reported COVID-19 death count
- Target Date: 7 days in the future from the latest available death data
- Model Type: Random forest (500 trees; na.action = na.omit)
- Model Features:
- Target date (n=1)
- Target-date month (n=1)
- Target-date day (n=1)
- Target-date weekday (n=1)
- Target-date year (n=1)
- COVID-19 deaths - statewide total (n=1)
- COVID-19 deaths - by age group (n=10)
- COVID-19 deaths - by county (n=62)
- Positive COVID-19 diagnostic test results - by county (n=62)
- Positive COVID-19 diagnostic test results - by region (n=11)
- COVID-19 diagnostic test results reported - by county (n=62)
- COVID-19 diagnostic test results reported - by region (n=11)
- 1-day COVID-19 diagnostic test positivity - by county (n=62)
- 1-day COVID-19 diagnostic test positivity - by region (n=11)
- 3-day COVID-19 diagnostic test positivity - by county (n=62)
- 3-day COVID-19 diagnostic test positivity - by region (n=11)
- 5-day COVID-19 diagnostic test positivity - by county (n=62)
- 5-day COVID-19 diagnostic test positivity - by region (n=11)
- 7-day COVID-19 diagnostic test positivity - by county (n=62)
- 7-day COVID-19 diagnostic test positivity - by region (n=11)
- 10-day COVID-19 diagnostic test positivity - by county (n=62)
- 10-day COVID-19 diagnostic test positivity - by region (n=11)
- COVID-19 hospital admissions - by gender (n = 2)
- COVID-19 hospital admissions - 3-day average (n = 1)
- COVID-19 hospital admissions - 5-day average (n = 1)
- COVID-19 hospital admissions - 7-day average (n = 1)
- COVID-19 hospital admissions - 10-day average (n = 1)
- COVID-19 vaccine dose-1 uptake percentage - total population (n=1)
- COVID-19 vaccine dose-1 uptake percentage - population ages 5+ (n=1)
- COVID-19 vaccine primary-series uptake percentage - total population (n=1)
- COVID-19 vaccine primary-series uptake percentage - population ages 5+ (n=1)
- COVID-19 vaccine additional-dose uptake percentage - total population (n=1)
- COVID-19 vaccine additional-dose uptake percentage - population ages 18+ (n=1)
- COVID-19 vaccine additional-dose uptake percentage - population ages 50+ (n=1)
- COVID-19 vaccine additional-dose uptake percentage - population ages 65+ (n=1)
- COVID-19 vaccine bivalent-booster uptake percentage - population ages 5+ (n=1)
- COVID-19 vaccine bivalent-booster uptake percentage - population ages 12+ (n=1)
- COVID-19 vaccine bivalent-booster uptake percentage - population ages 18+ (n=1)
- COVID-19 vaccine bivalent-booster uptake percentage - population ages 65+ (n=1)
- Data Sources:
- Training/Testing Data Split: 80:20
- Frequency of Model Retraining: Daily
Evaluation
Predicted vs. Observed
Graph
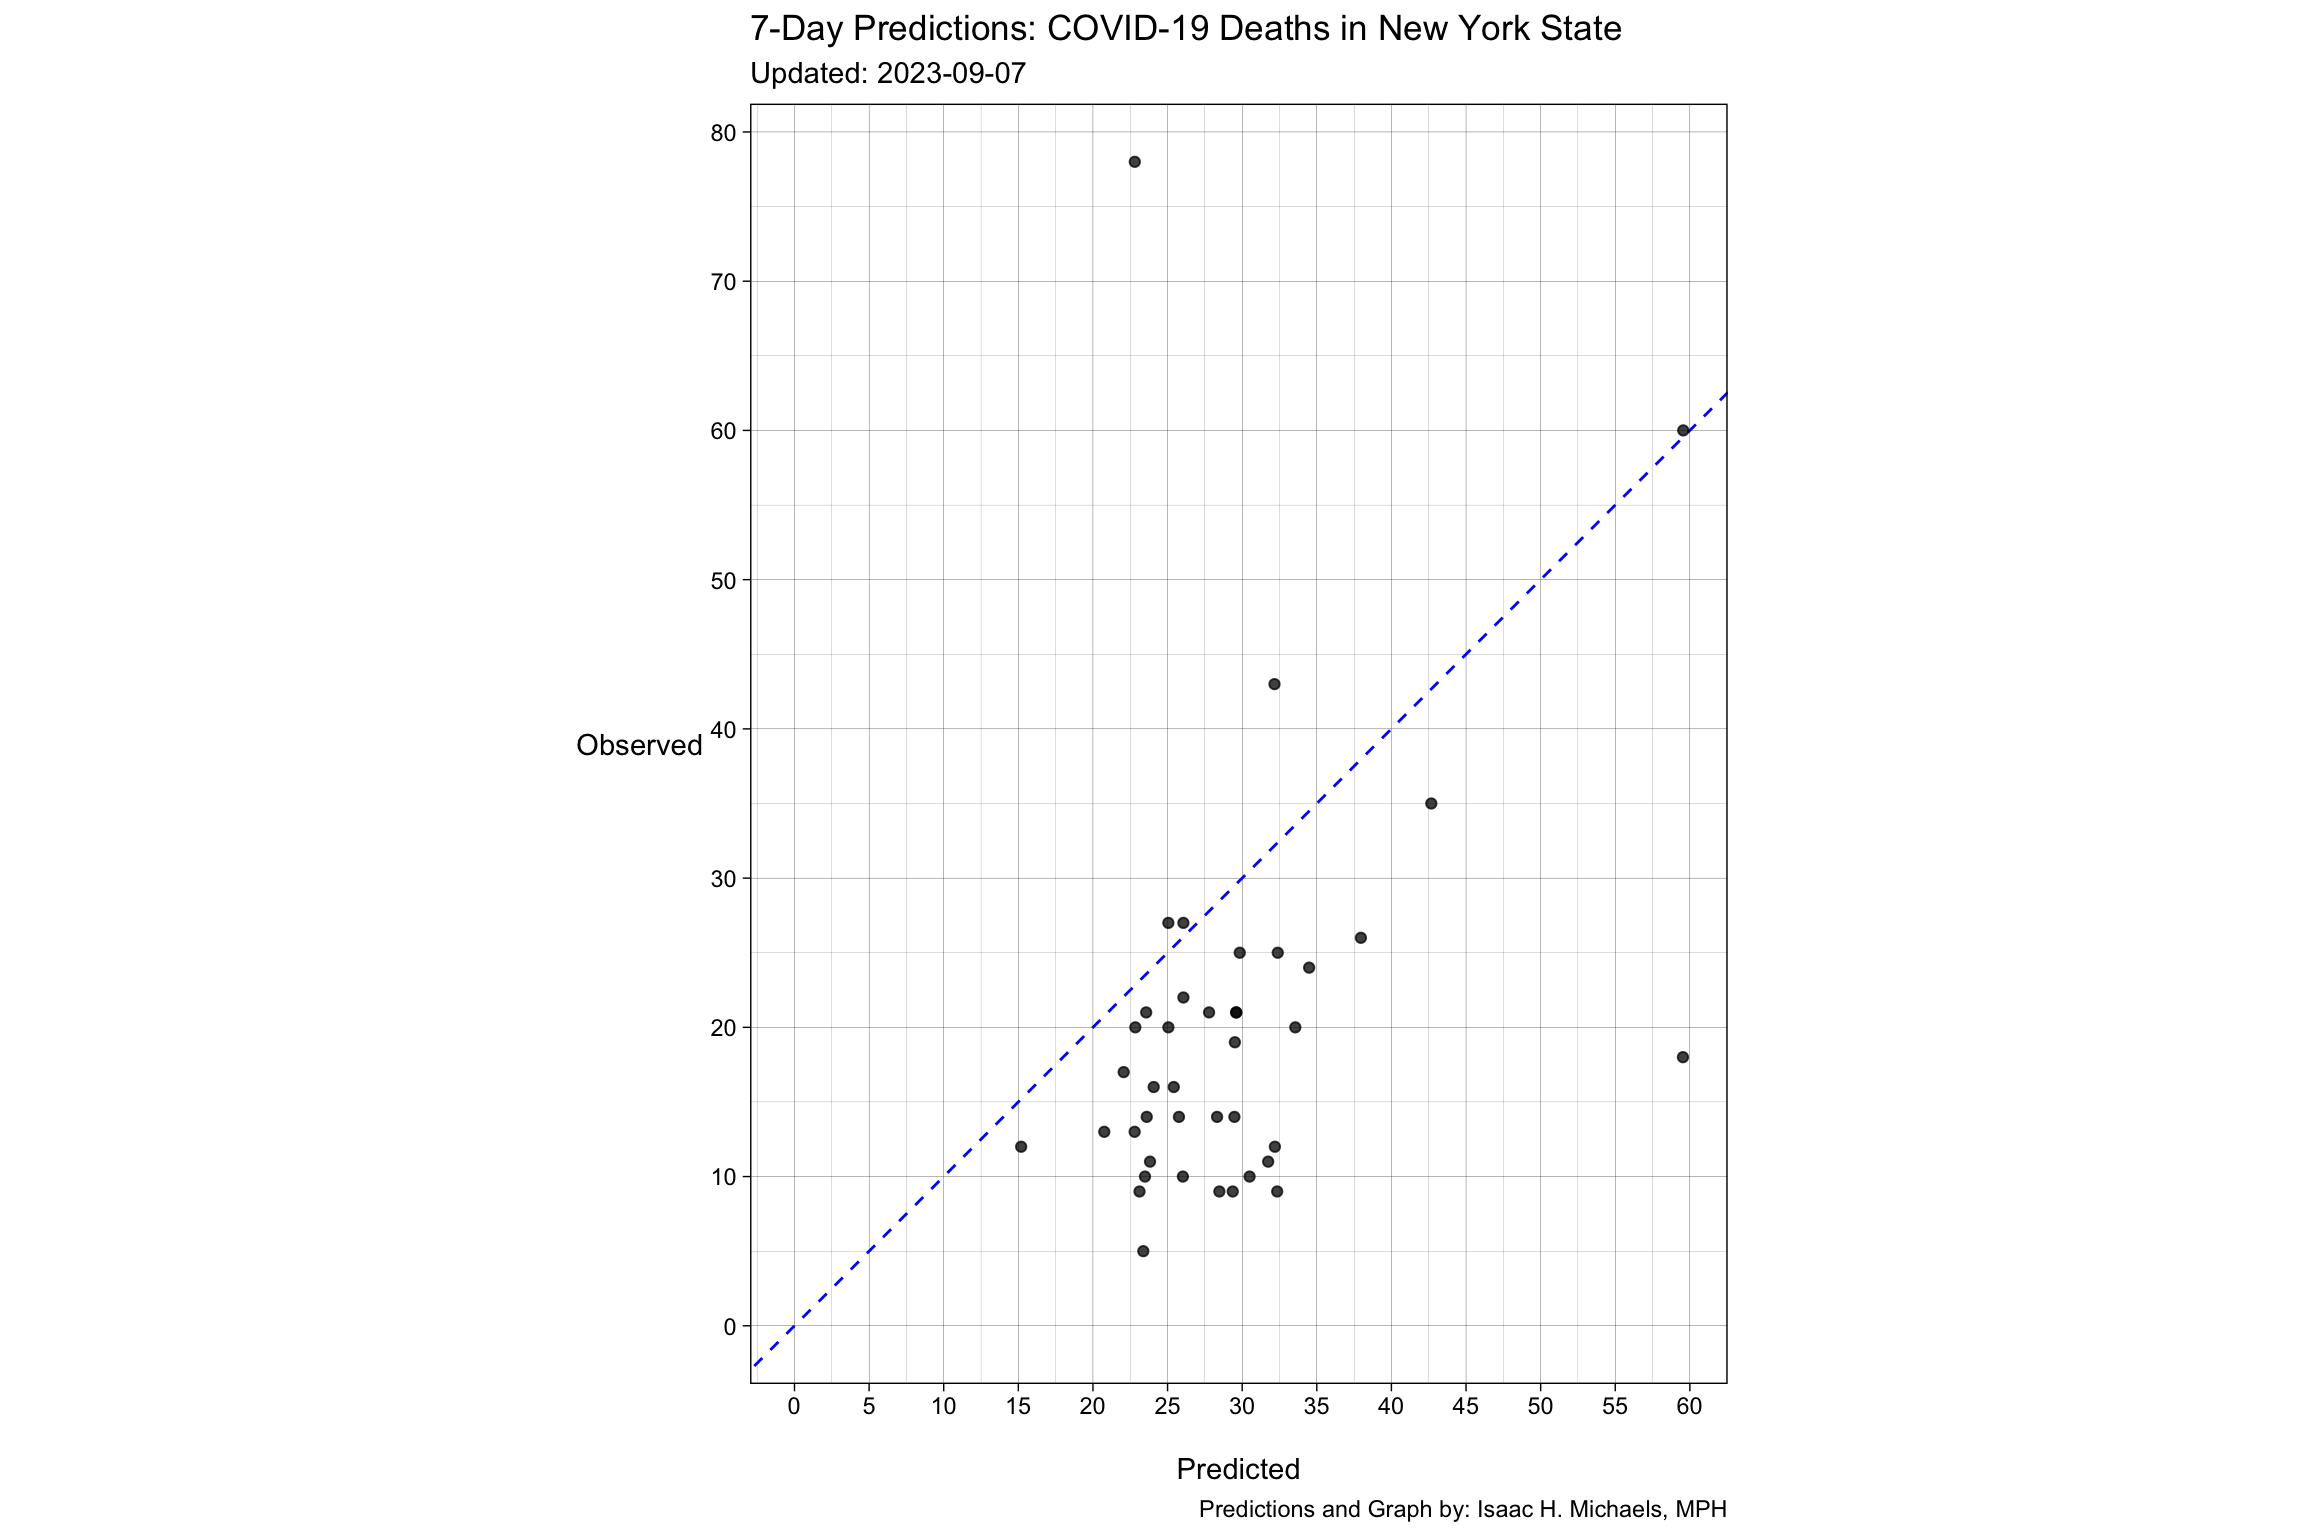
Predictions and Graph Developed by: Isaac H. Michaels, MPH
COVID-19 Deaths Data Source: Health Data NY
Table
| Target Date | Prediction Date | Predicted | Observed | Error |
|---|---|---|---|---|
| 2023-04-04 | 2023-03-28 | 29 | 9 | -20 |
| 2023-04-03 | 2023-03-27 | 38 | NA | NA |
| 2023-03-31 | 2023-03-24 | 16 | NA | NA |
| 2023-03-30 | 2023-03-23 | 15 | 12 | -3 |
| 2023-03-29 | 2023-03-22 | 20 | NA | NA |
| 2023-03-28 | 2023-03-21 | 24 | 14 | -10 |
| 2023-03-27 | 2023-03-20 | 34 | 20 | -14 |
| 2023-03-24 | 2023-03-17 | 21 | 13 | -8 |
| 2023-03-23 | 2023-03-16 | 23 | 5 | -18 |
| 2023-03-22 | 2023-03-15 | 28 | 9 | -19 |
| 2023-03-21 | 2023-03-14 | 23 | 10 | -13 |
| 2023-03-20 | 2023-03-13 | 34 | 24 | -10 |
| 2023-03-17 | 2023-03-10 | 24 | 16 | -8 |
| 2023-03-16 | 2023-03-09 | 24 | 11 | -13 |
| 2023-03-15 | 2023-03-08 | 23 | 9 | -14 |
| 2023-03-14 | 2023-03-07 | 30 | 21 | -9 |
| 2023-03-14 | 2023-03-07 | 30 | 21 | -9 |
| 2023-03-13 | 2023-03-06 | 32 | 43 | 11 |
| 2023-03-10 | 2023-03-03 | 25 | 16 | -9 |
| 2023-03-09 | 2023-03-02 | 26 | 14 | -12 |
| 2023-03-08 | 2023-03-01 | 28 | 14 | -14 |
| 2023-03-07 | 2023-02-28 | 32 | 9 | -23 |
| 2023-03-06 | 2023-02-27 | 43 | 35 | -8 |
| 2023-03-03 | 2023-02-24 | 32 | 12 | -20 |
| 2023-03-02 | 2023-02-23 | 30 | 10 | -20 |
| 2023-03-01 | 2023-02-22 | 29 | 14 | -15 |
| 2023-02-28 | 2023-02-21 | 60 | 18 | -42 |
| 2023-02-24 | 2023-02-17 | 30 | 19 | -11 |
| 2023-02-23 | 2023-02-16 | 26 | 10 | -16 |
| 2023-02-22 | 2023-02-15 | 22 | 17 | -5 |
| 2023-02-21 | 2023-02-14 | 23 | 78 | 55 |
| 2023-02-20 | 2023-02-13 | 45 | NA | NA |
| 2023-02-17 | 2023-02-10 | 24 | 21 | -3 |
| 2023-02-16 | 2023-02-09 | 23 | 20 | -3 |
| 2023-02-15 | 2023-02-08 | 23 | 13 | -10 |
| 2023-02-14 | 2023-02-07 | 25 | 20 | -5 |
| 2023-02-13 | 2023-02-06 | 51 | NA | NA |
| 2023-02-10 | 2023-02-03 | 25 | 27 | 2 |
| 2023-02-09 | 2023-02-02 | 28 | 21 | -7 |
| 2023-02-08 | 2023-02-01 | 26 | 22 | -4 |
| 2023-02-07 | 2023-01-31 | 32 | 11 | -21 |
| 2023-02-06 | 2023-01-30 | 60 | 60 | 0 |
| 2023-02-03 | 2023-01-27 | 32 | 25 | -7 |
| 2023-02-02 | 2023-01-26 | 30 | 25 | -5 |
| 2023-02-01 | 2023-01-25 | 26 | 27 | 1 |
| 2023-01-31 | 2023-01-24 | 38 | 26 | -12 |
Predictions and Graph Developed by: Isaac H. Michaels, MPH
COVID-19 Deaths Data Source: Health Data NY