- Introduction
- Key Features
- Cumulative Incidence and Volume
- Trend Analysis
- Conclusion
- Daily EMS Call Volume
- Daily EMS Call Travel Times
- Call Times
- Final Call Types
- Sick
- Non-Critical Injury
- Hx Drug Or Alcohol Abuse
- Unconscious Patient
- Cardiac Condition
- Psychiatric Patient
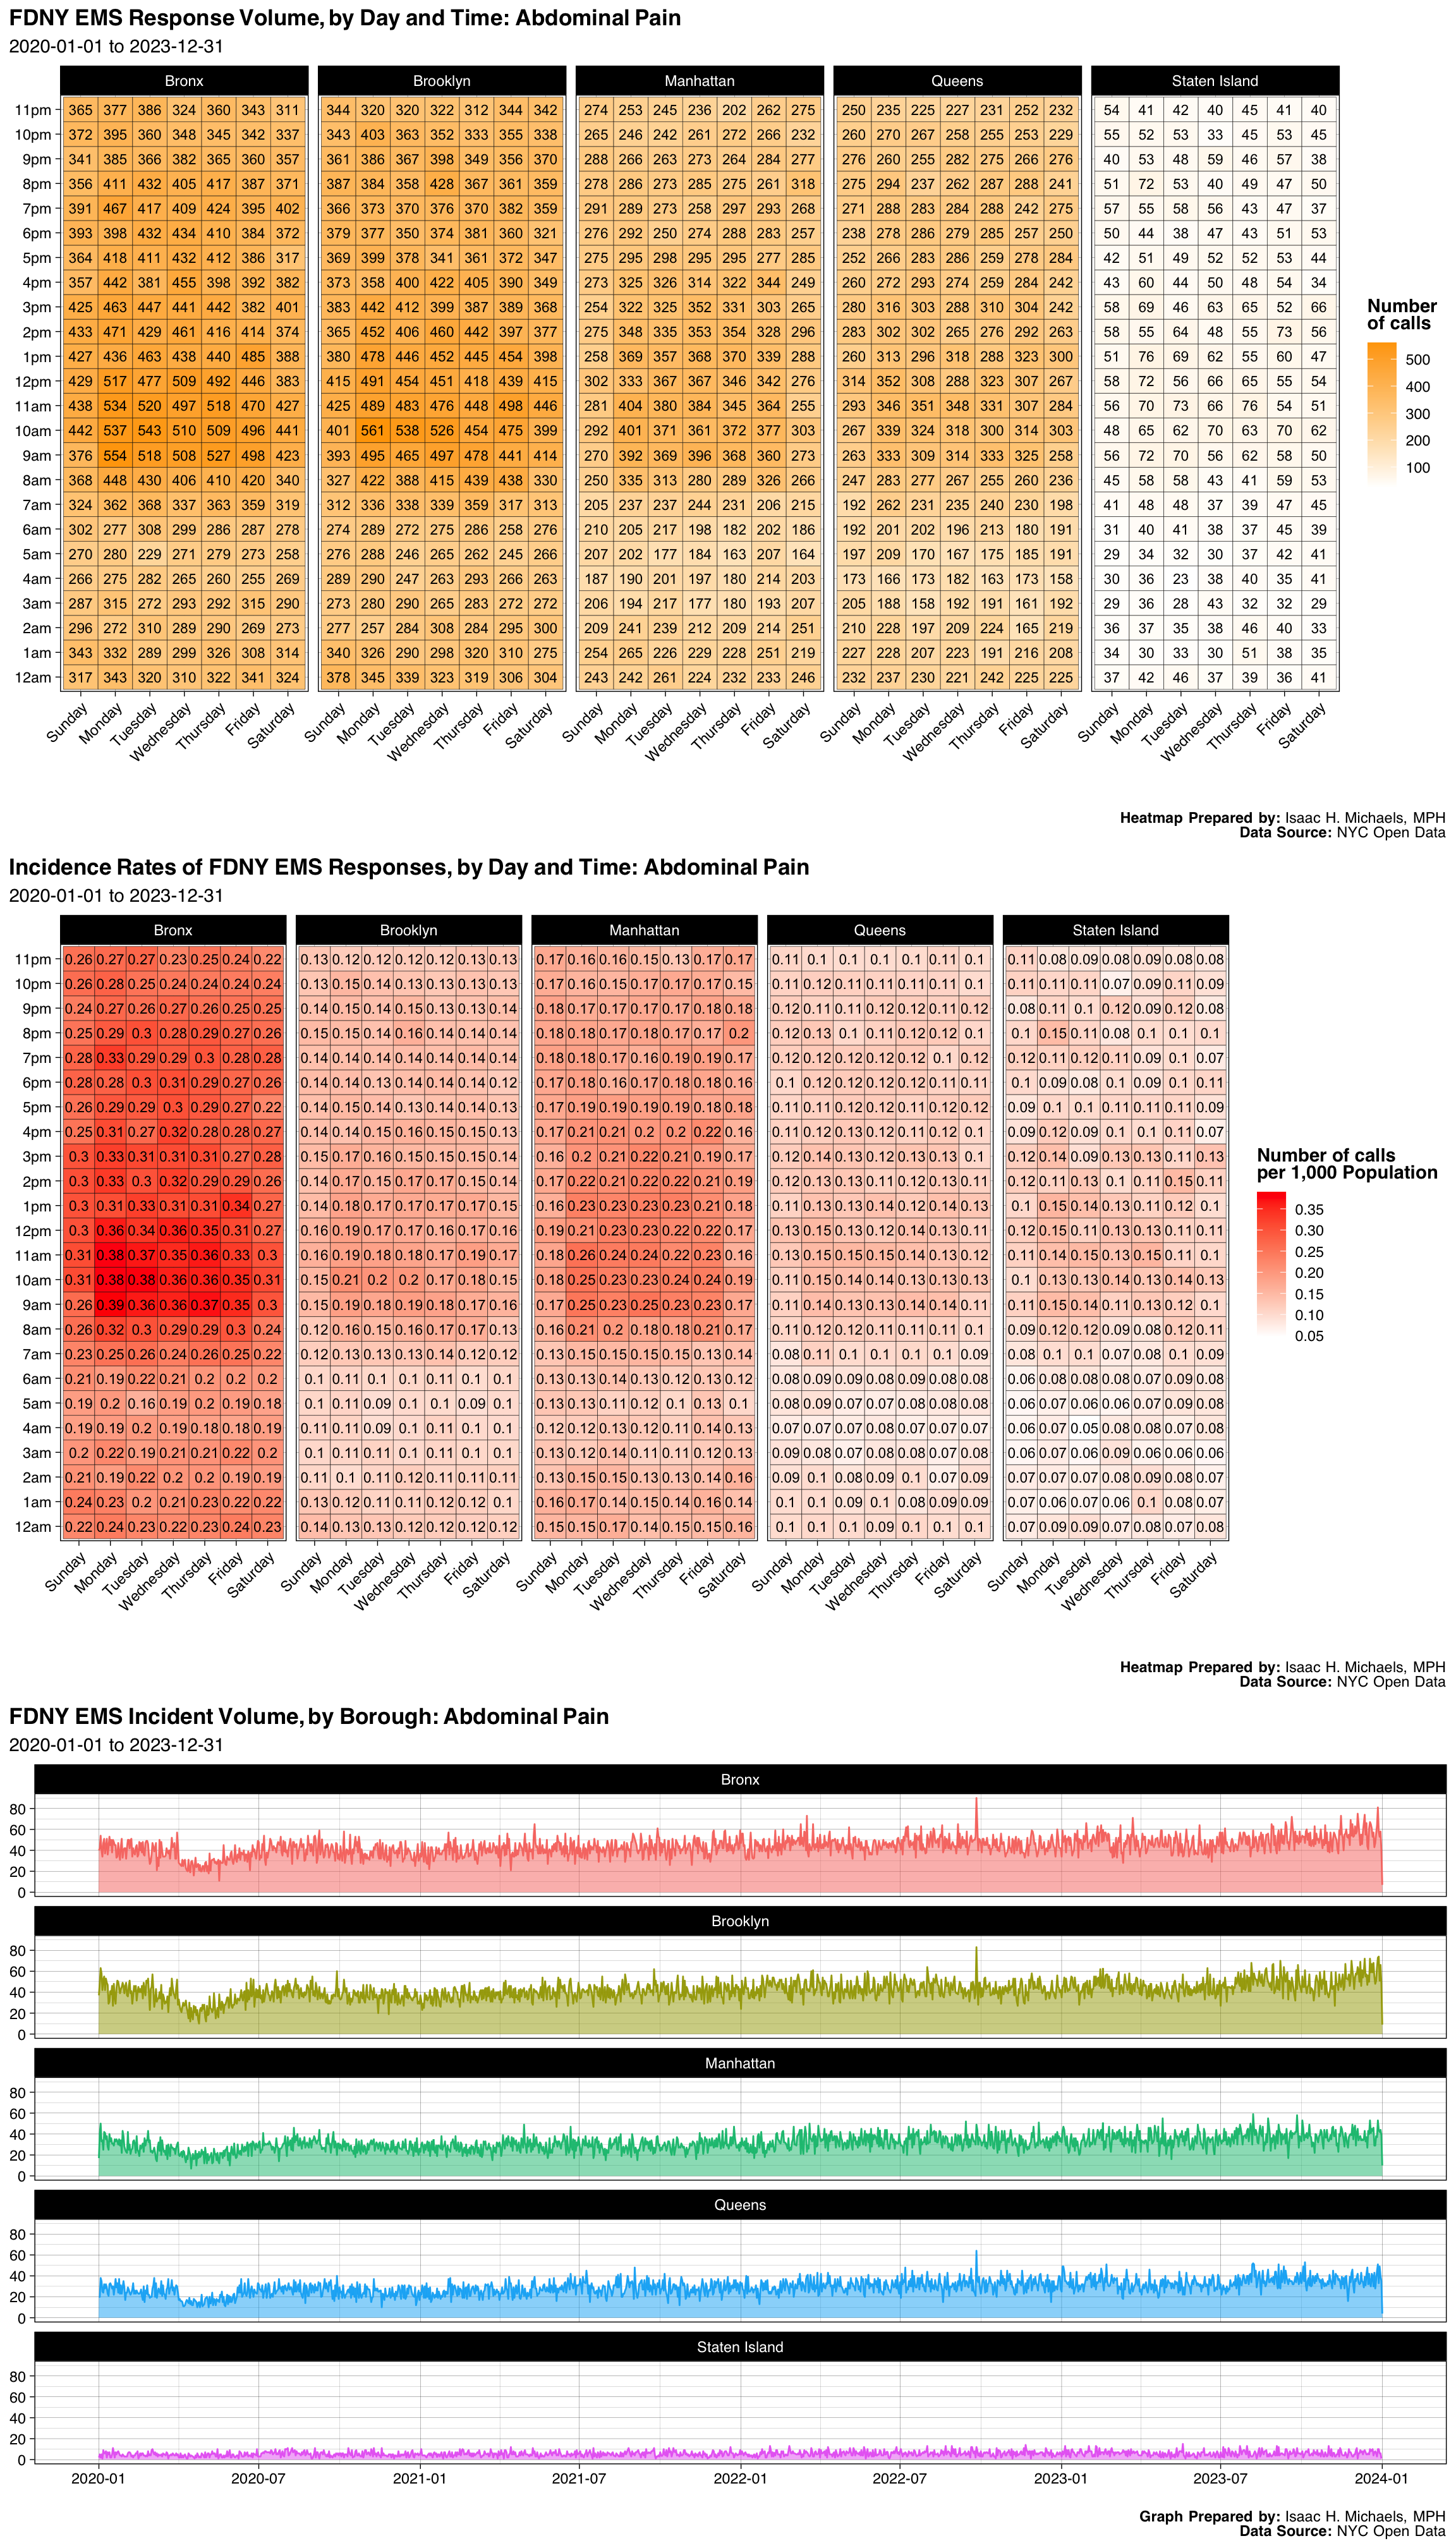
- Abdominal Pain
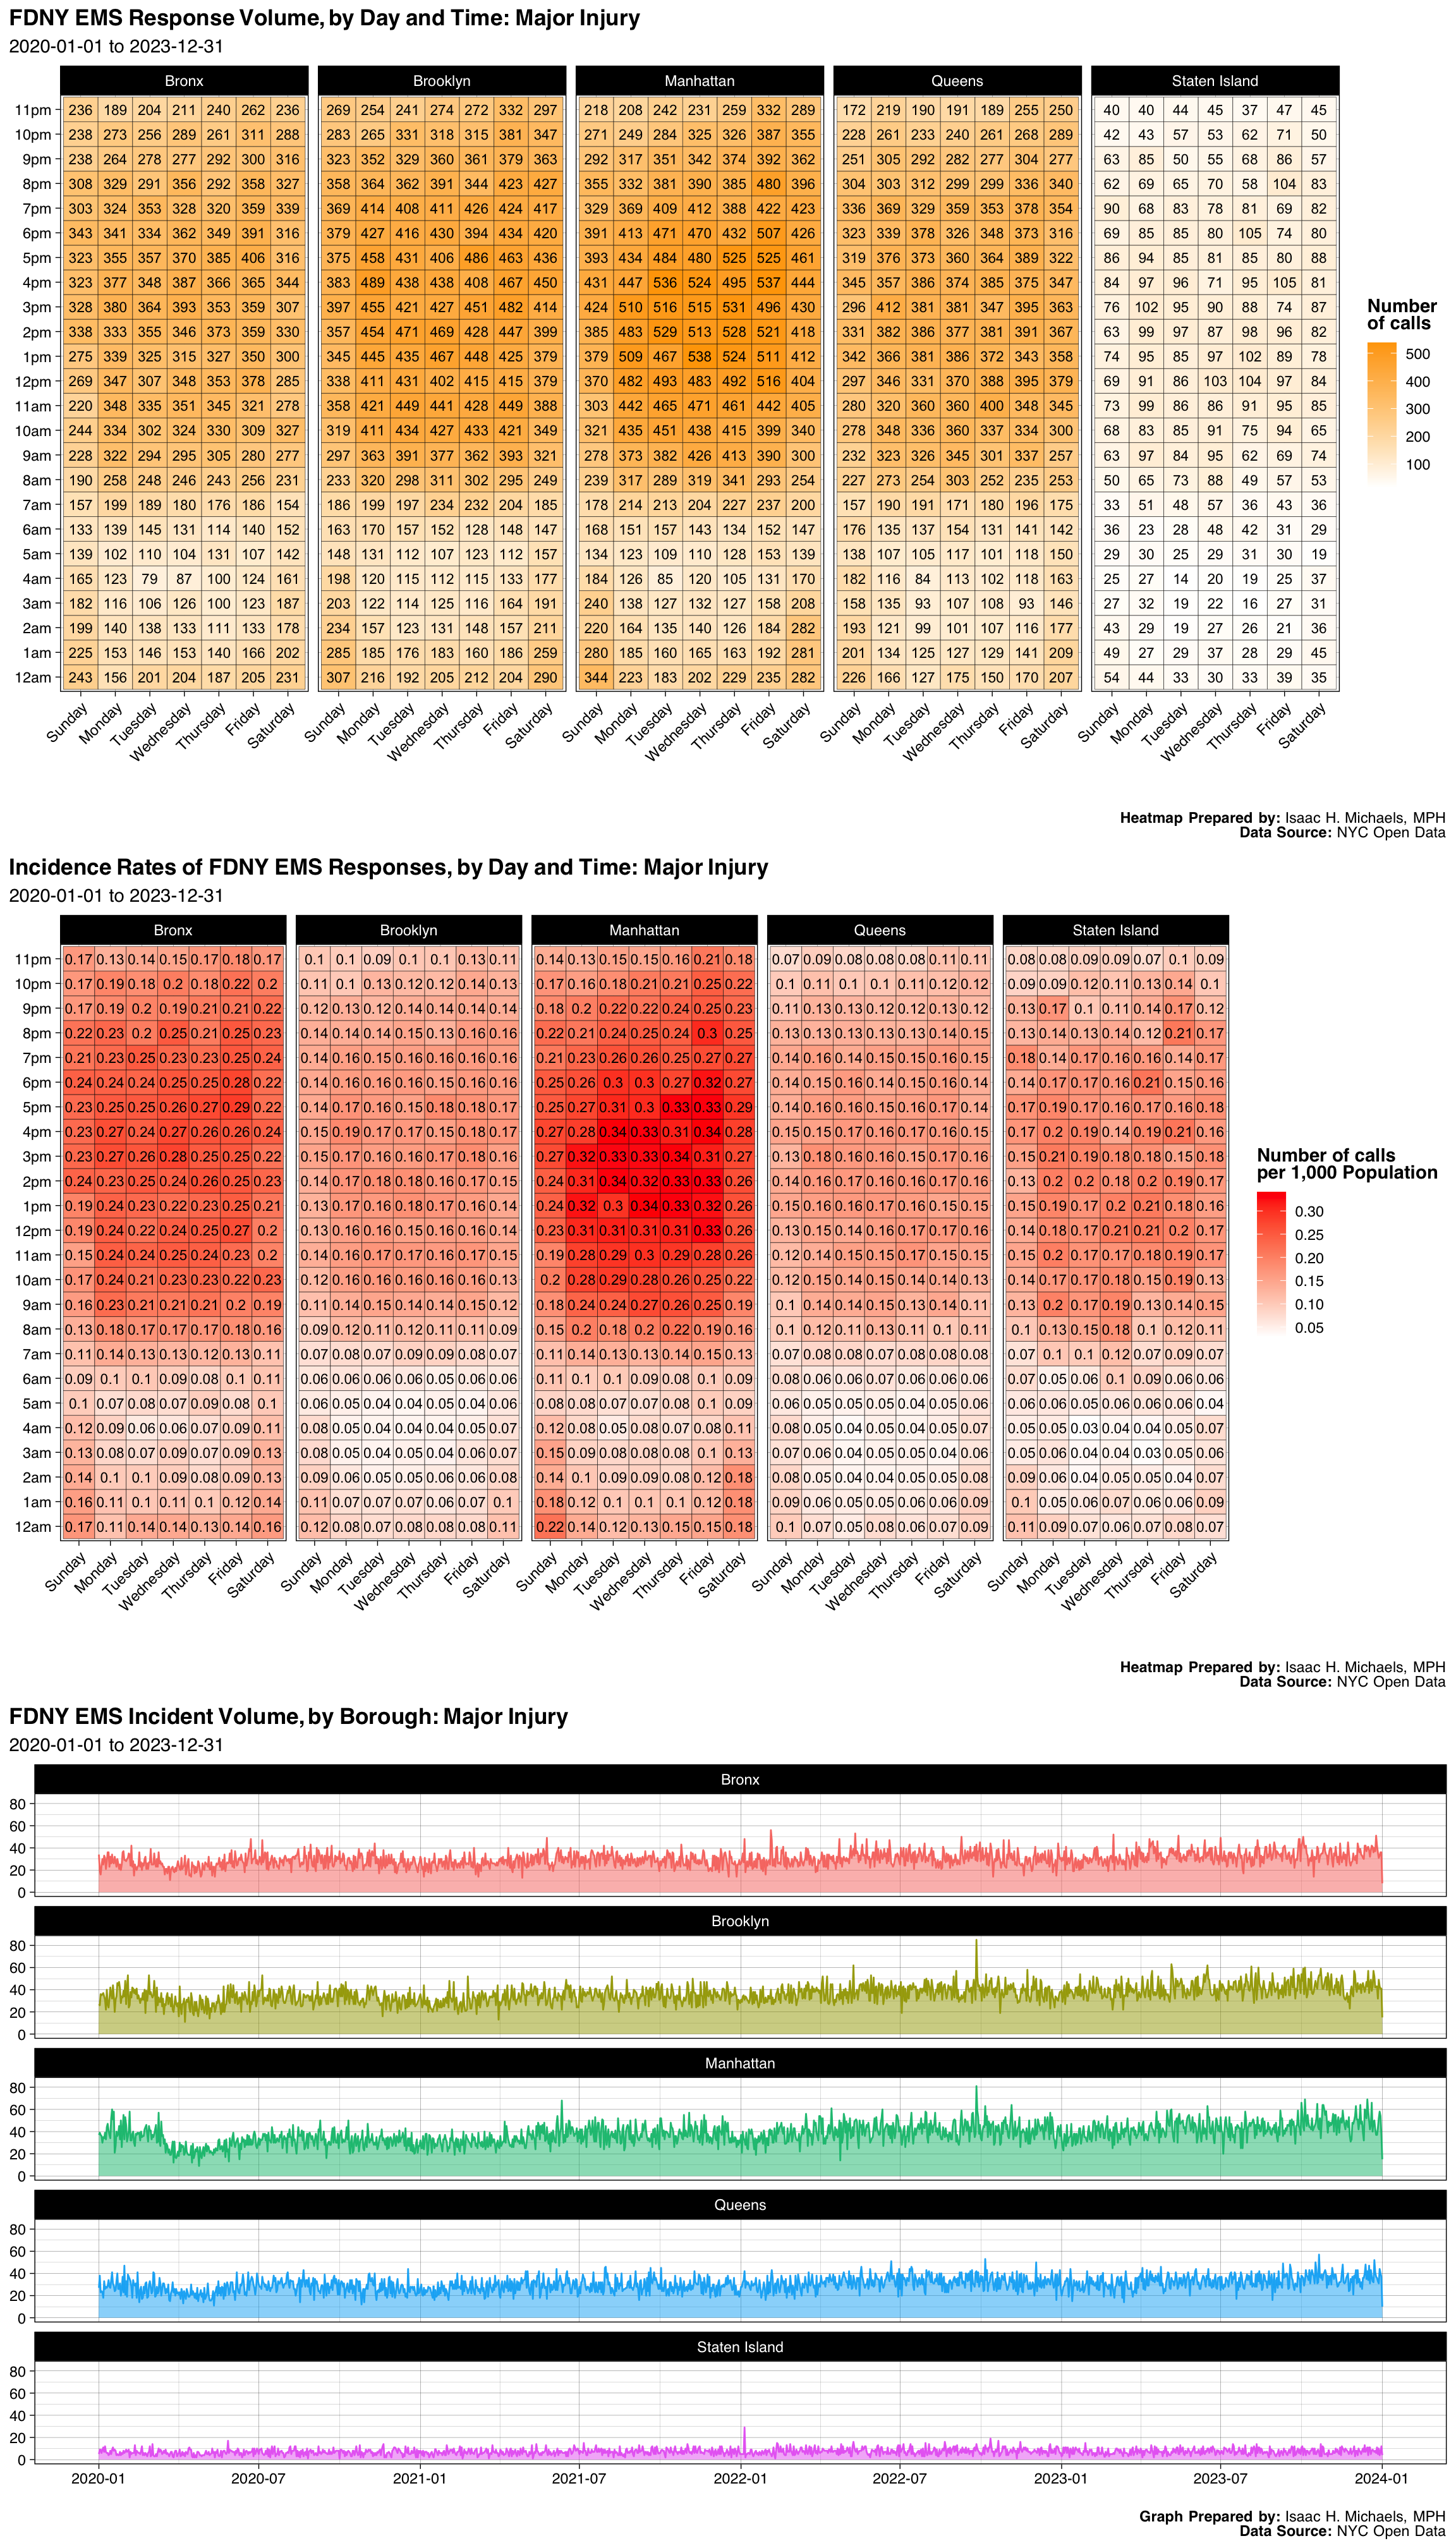
- Major Injury
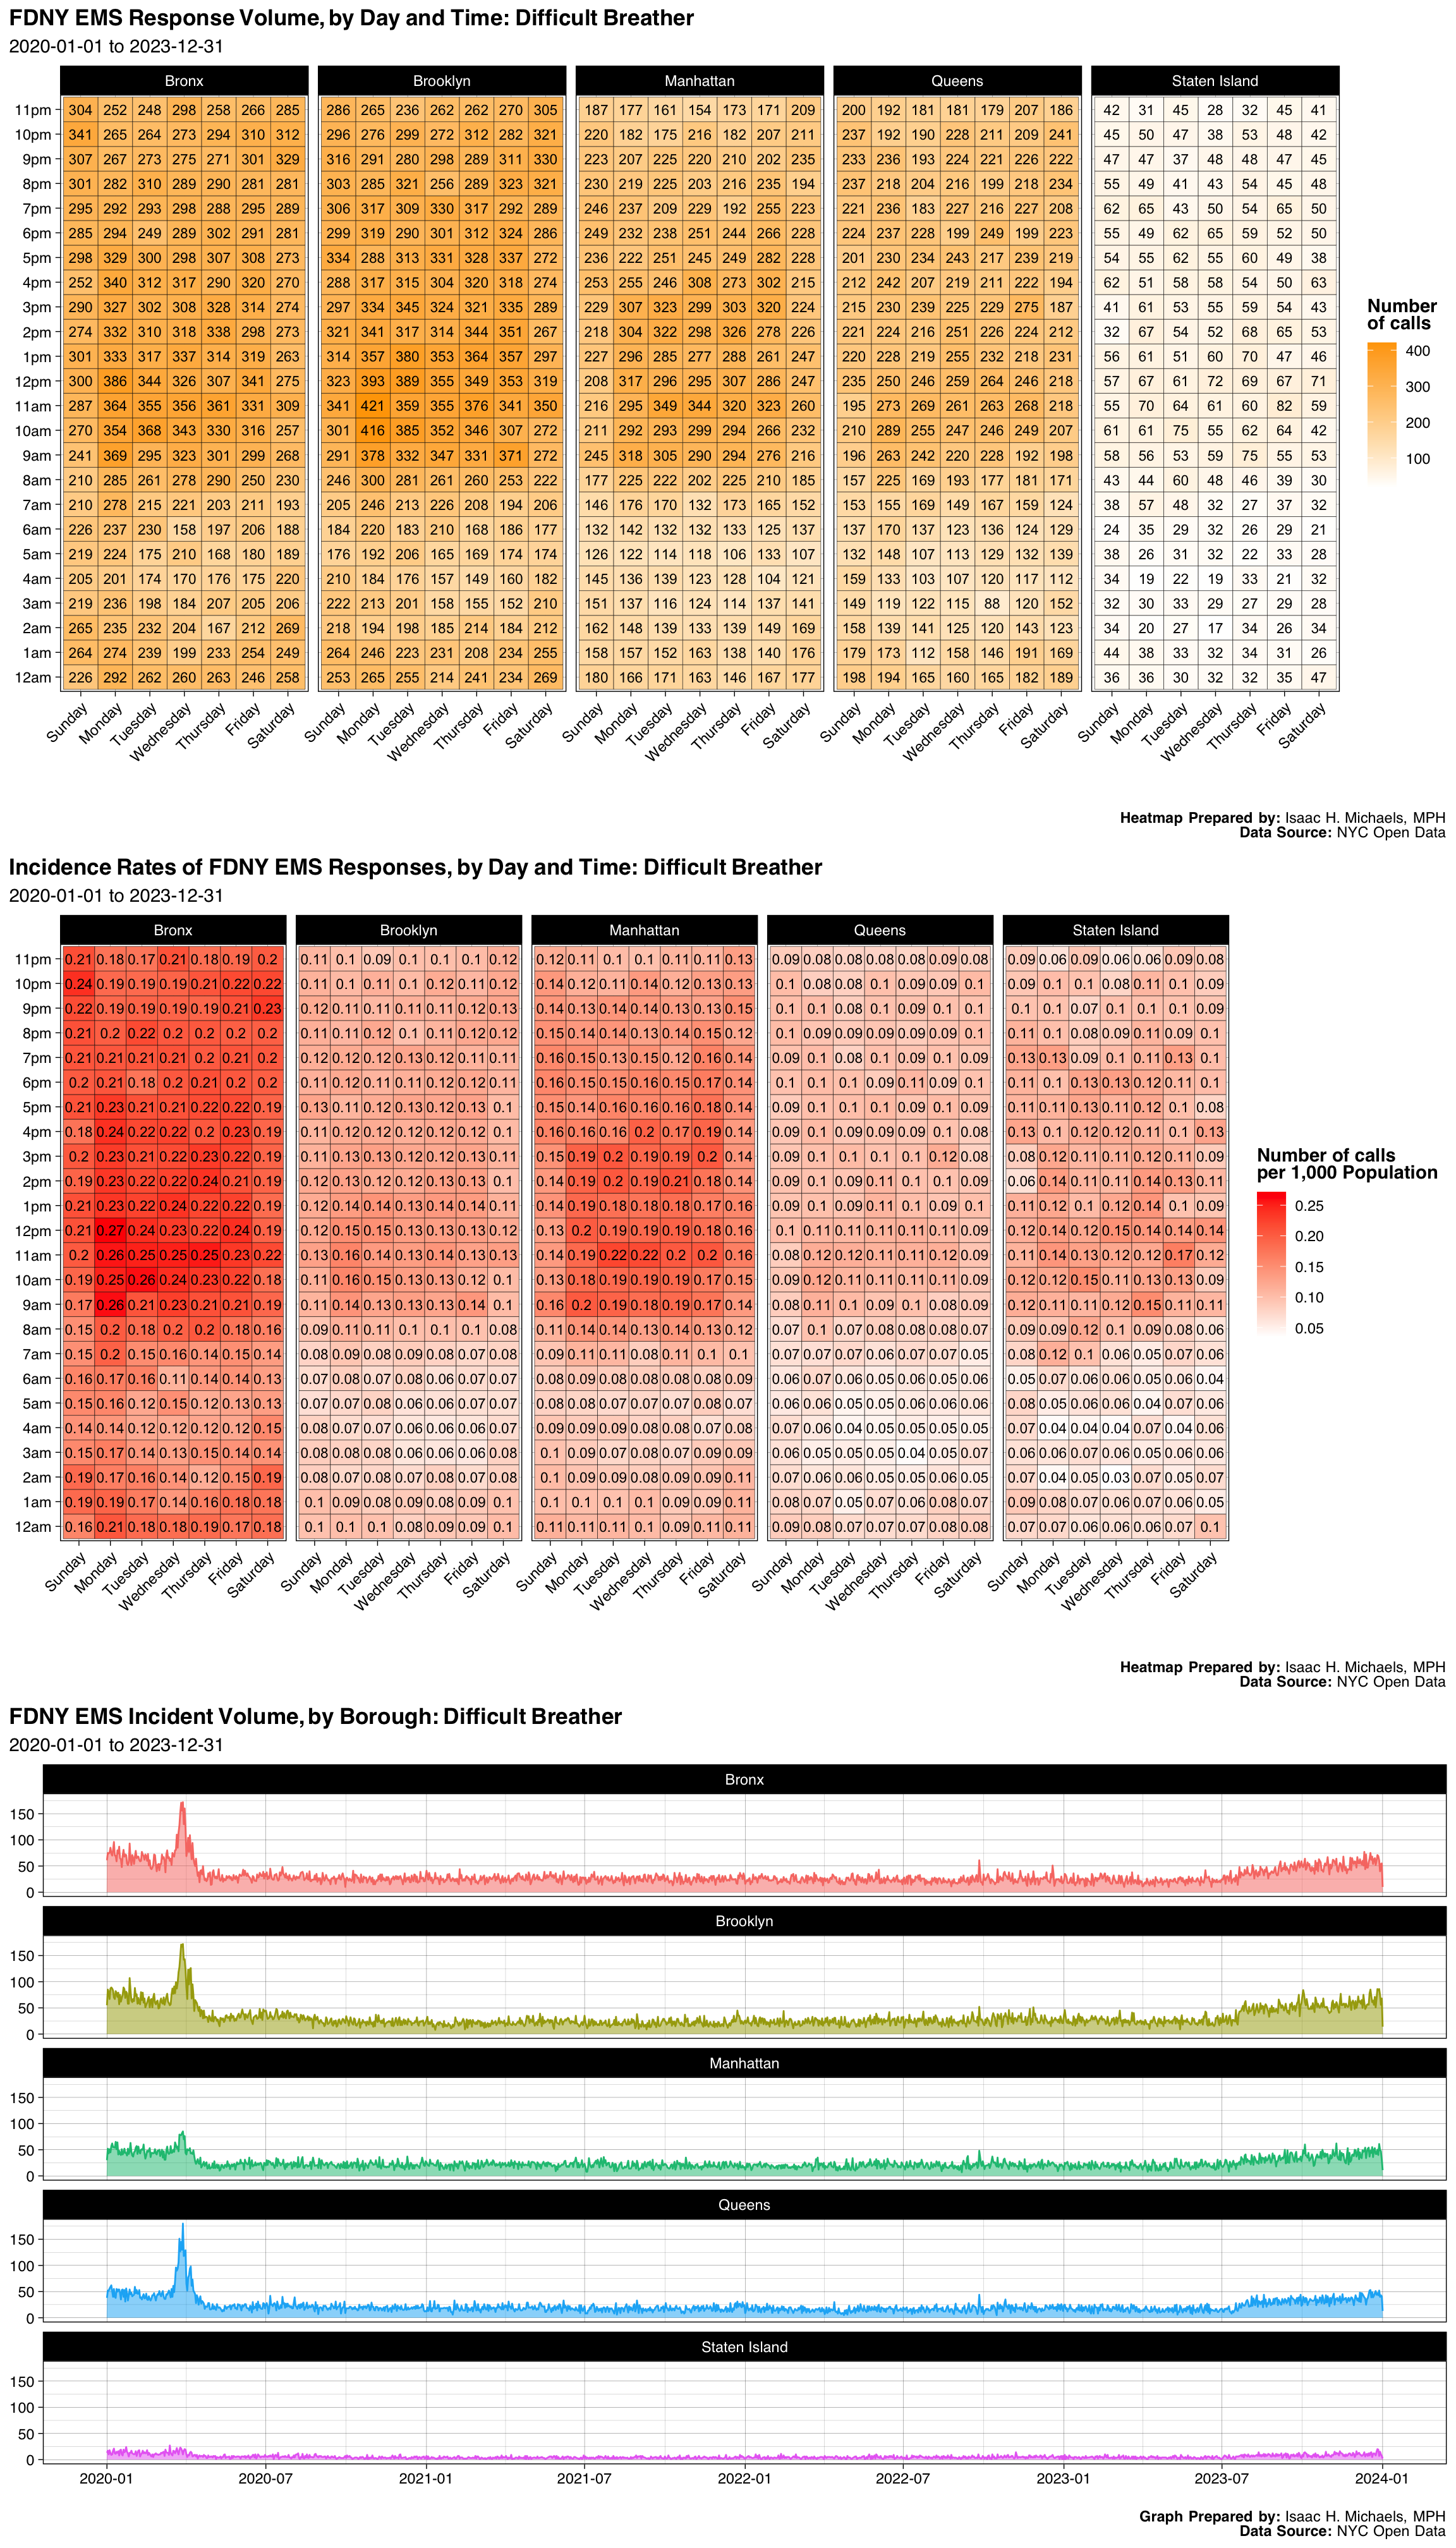
- Difficult Breather
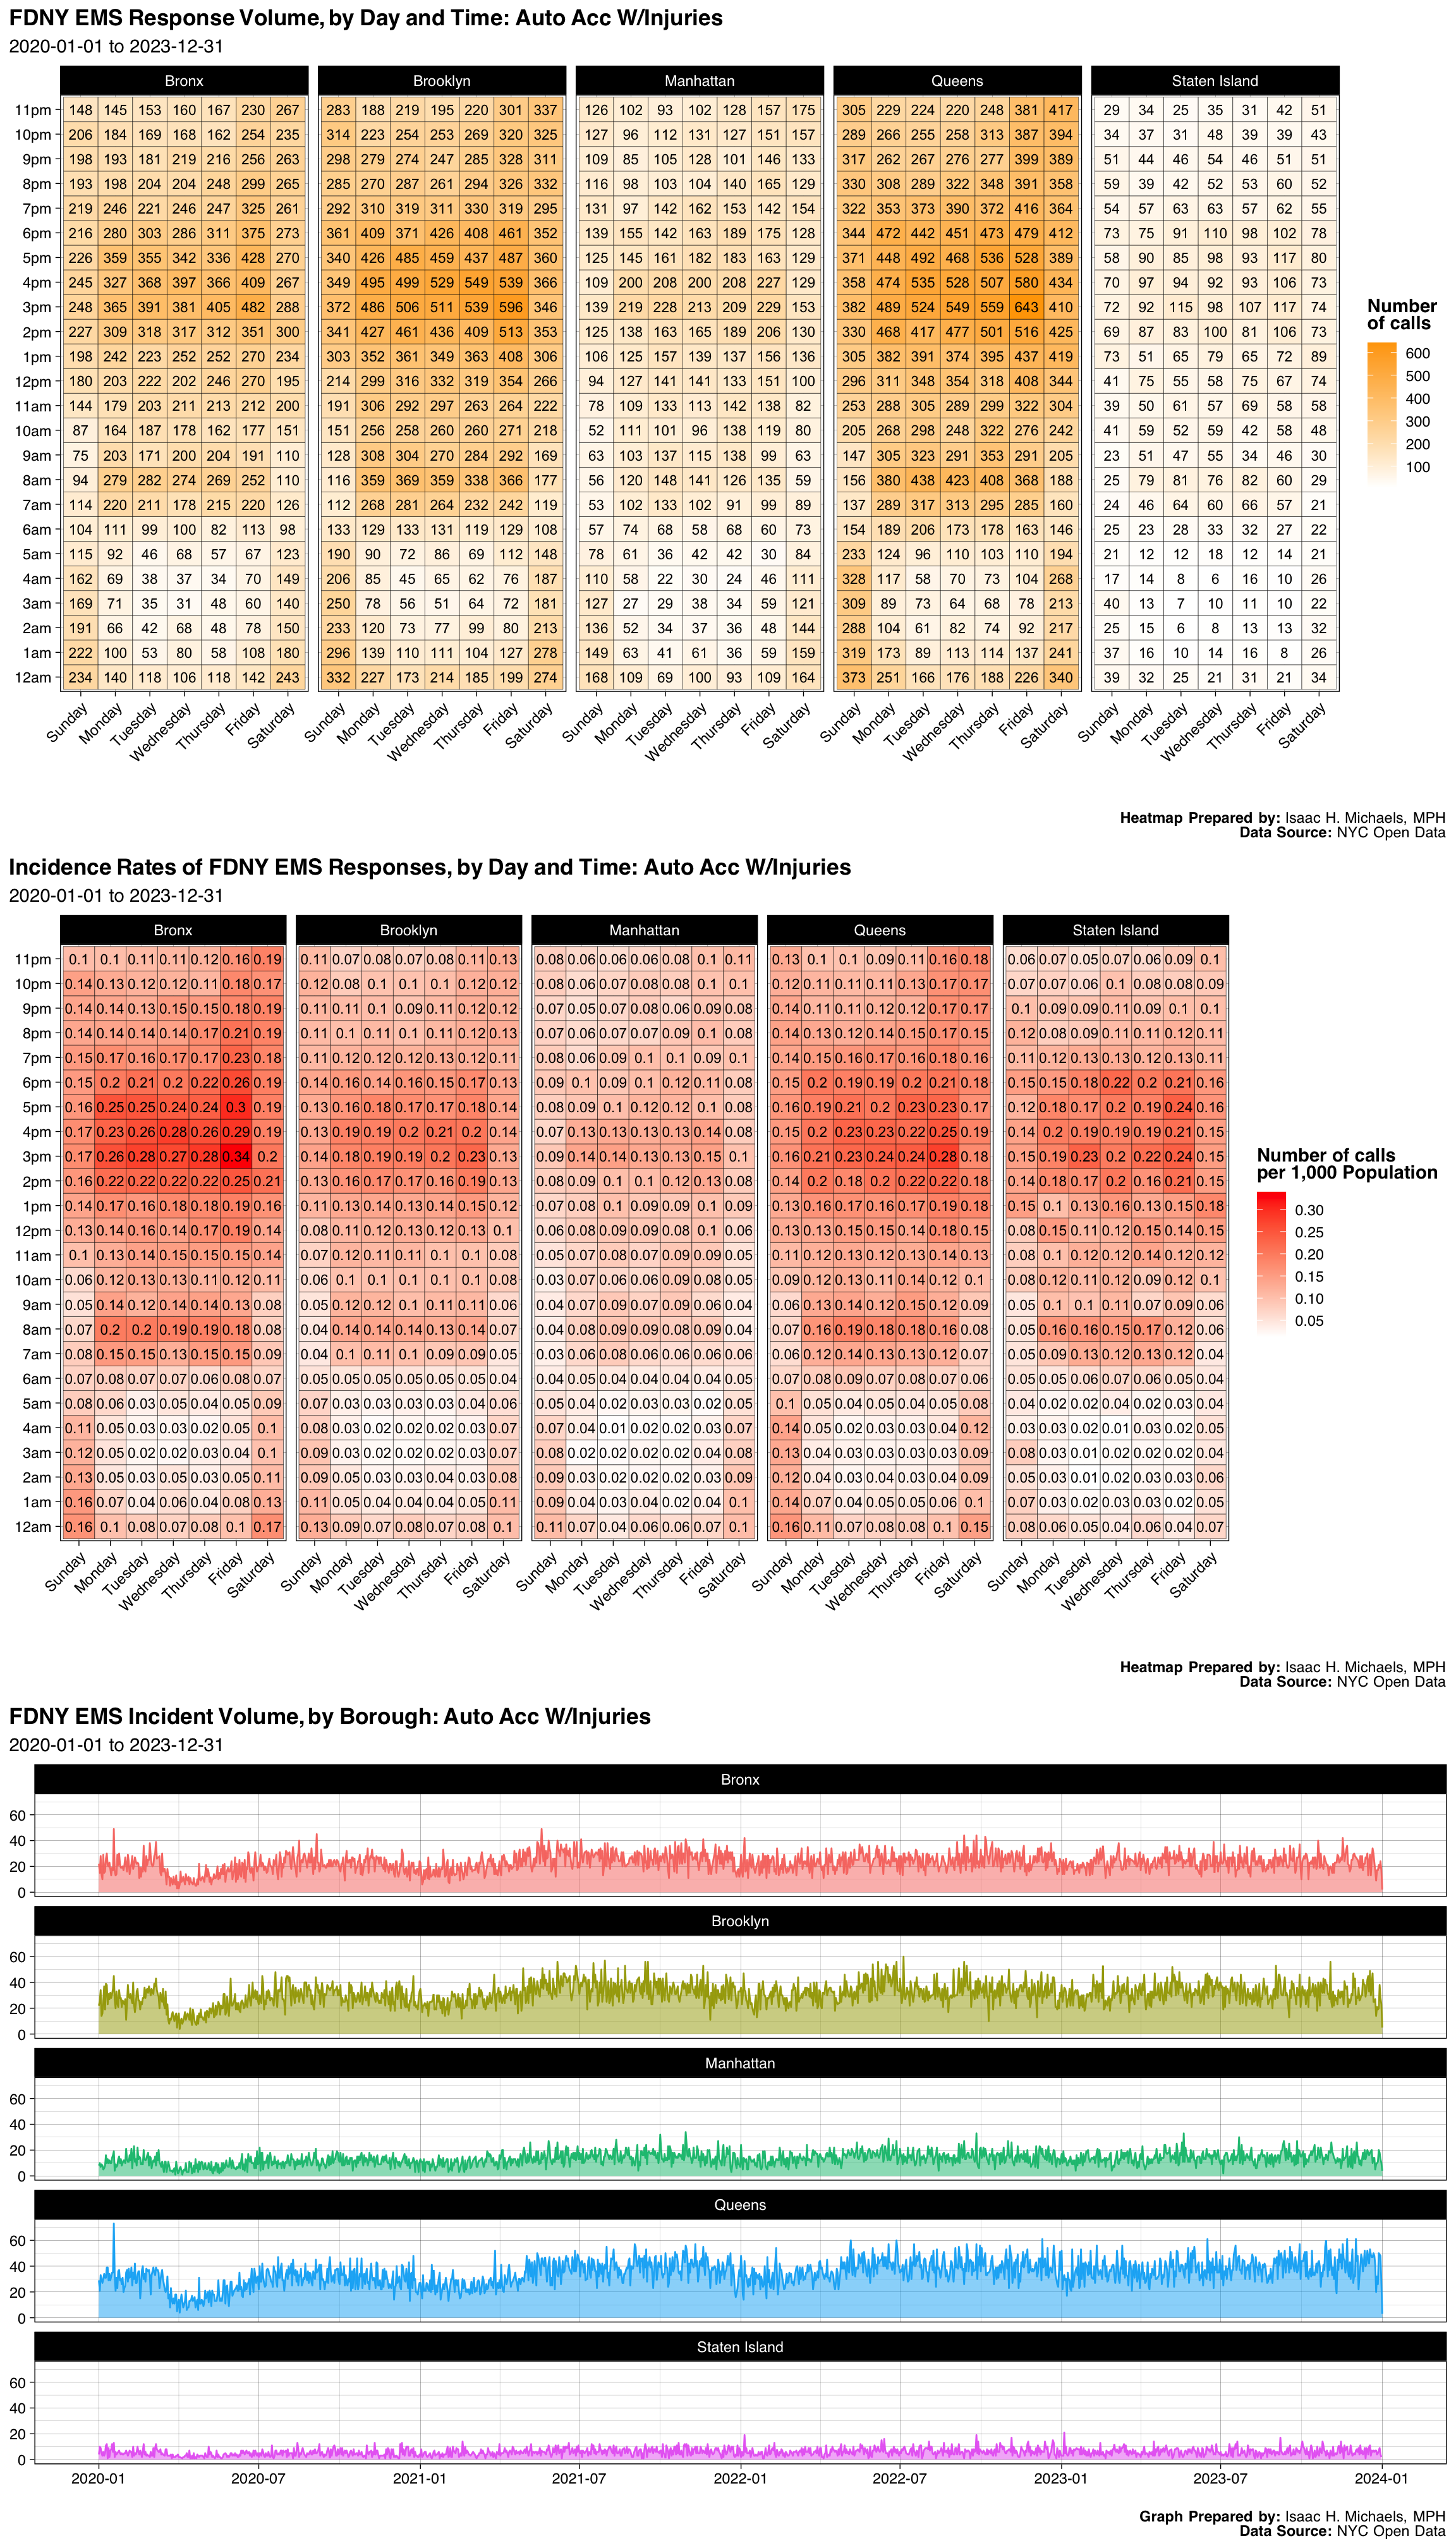
- Auto Acc W/Injuries
- Altered Mental Status
- Cardiac Arrest
- Diff Breathing - Fever&Cough
- Status Epilepticus
- Pedestrian Struck
- Sick - Cough & Fever
- Respiratory Distress
- Cva (Stroke)
- Minor Injury
- Minor Illness
- Internal Bleeding
- Seizures
- Stabbing
- Multiple Trauma Patient
- Asthma Attack
- Anaphylaxis
- Abdominal Pain-Fever & Cough
- Resp Distress - Fever&Cough
- Cardiac Condition-Fever&Cough
- Female In Labor
- Hypertension
- Sick Pediatric, <5 Year Old
- Major Obstetrical Complaint
- Stroke
- Sick Ped<5 Yrs-Fever & Cough
- Gyn Bleeding/Pt Not Pregnant
- Asthma Attack - Fever&Cough
- Request For Stand-By
- Gun Shot Wound
- Police 10-13, Confirmed
- Miscarriage
- Alt Mental Status-Fever&Cough
- Reaction To Medication
- Gyn/Severe Pain/Bleeding
- One Alarm Fire
- Choking
- Inhalation Of Smoke
- Unc Patient - Fever & Cough
- Obstetric Complications
- Minor Burns <18% Adlt Or <10%
- Anaphylactic Shock-Fever&Cough
- Hypothermia
- Major Burns 18% Adlt 10% Child
- Hx Drug Or Alchl Abuse-Fev&Cou
- Card Or Resp Arrest-Fevercough
- Police 10-13, Unconfirmed
- Auto Accident, No Confirmd Inj
- Internal Bleeding-Fever&Cough
- Mult Or Prolong Seizur-Fev&Cou
- Jumper Up
- Jumper Down
- Stroke Critical - Fever&Cough
- Heat Exhaustion
- Hostage Situation / Barricaded
- Sick - Rash And Fever
- Drowning
- Electrocution
- Seizures - Fever & Cough
- Stroke - Fever & Cough
- Baby Out Or Imminent Birth
- Child Abuse
- Amputation, Fingers Or Toes
- Reaction To Med - Fever&Cough
- Choking Fever&Cough
- Two Alarm Fire
- Ground Transport Incident
- Sick Ped<5 Yrs-Rash & Fever
- Difficult Breather Rf
- Special Event
- Amputation, Arm, Hand,Leg,Foot
- Active Shooter
- Three Alarm Fire
- All Other Mci’s
- Hazardous Materials Incident
- Unconscious Patient-Rash&Fever
- Report Of Explosives
- Stat Transfer Request
- Construction/Demolition Incid
- Medevac, T/C Authority Only
- Death Confirm By Medical Auth
- Venom (Snake Bites)
- Four Alarm Fire
- Structural Collaspe [Specify]
- Mci25
- Mci35
- Mci42
- Sick Patient Fever
- Marine / Harbor Incident
- Cardiac Patient Fever/Travel Condition
- Difficult Breathing Fever/Travel
- Internal Bleeding Fever/Travel
- Power Failure / Blackout
- Abdominal Pain Fever
- Altered Mental Status Fever/Travel
- Rapid Transit/Rail Incident
- Active Shooter
- Cardiac Arrest Patient Fever/Travel
- Criminal Detection Facil Incid
- Pediatric Fiver
- Unconscious Fever/Travel Patient
- Anaphylactic Fever/Travel
- Asthma Patient Fever/Travel
- Mci40
- Mci57
- Respiratory Distress Fever/Travel
- Stroke Critical Fever
- Seizure Patient Fever/Travel
- Status Epilepticus Fever/Travel
Published: July 18, 2019
Updated: April 16, 2024 at 01:19AM
Introduction
Welcome to the page on EMS calls in New York City by the Fire Department of New York (FDNY). Emergency medical services (EMS) play a vital role in maintaining the health and wellbeing of communities. On this page, analyses on EMS calls in New York City from 2020 to the present are presented, based on data reported by FDNY via the NYC Open Data platform and updated annually. These analyses were conducted by Isaac H. Michaels, MPH.
Key Features
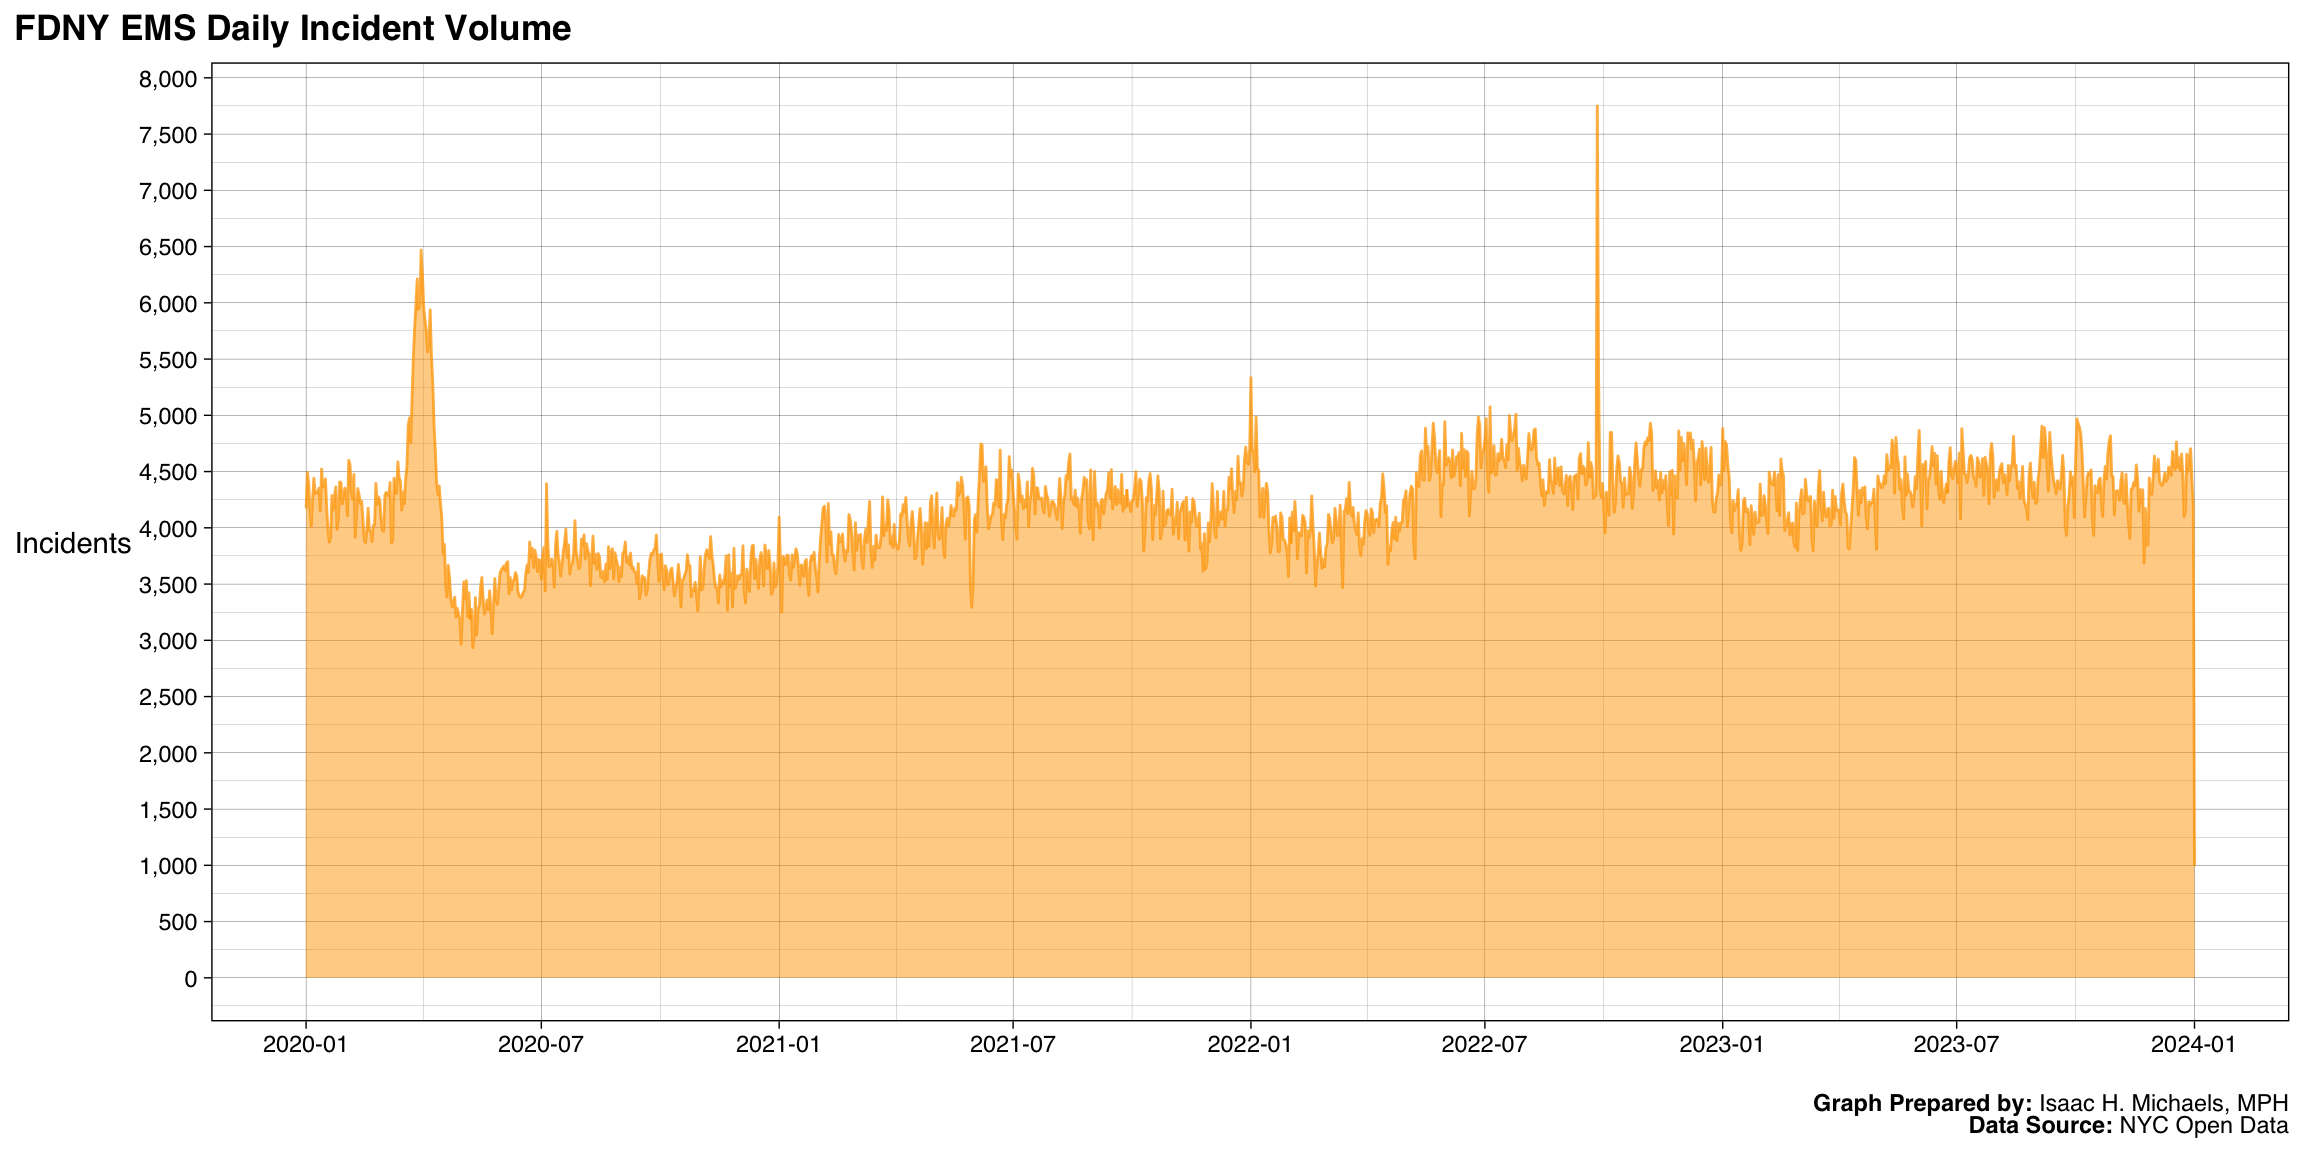
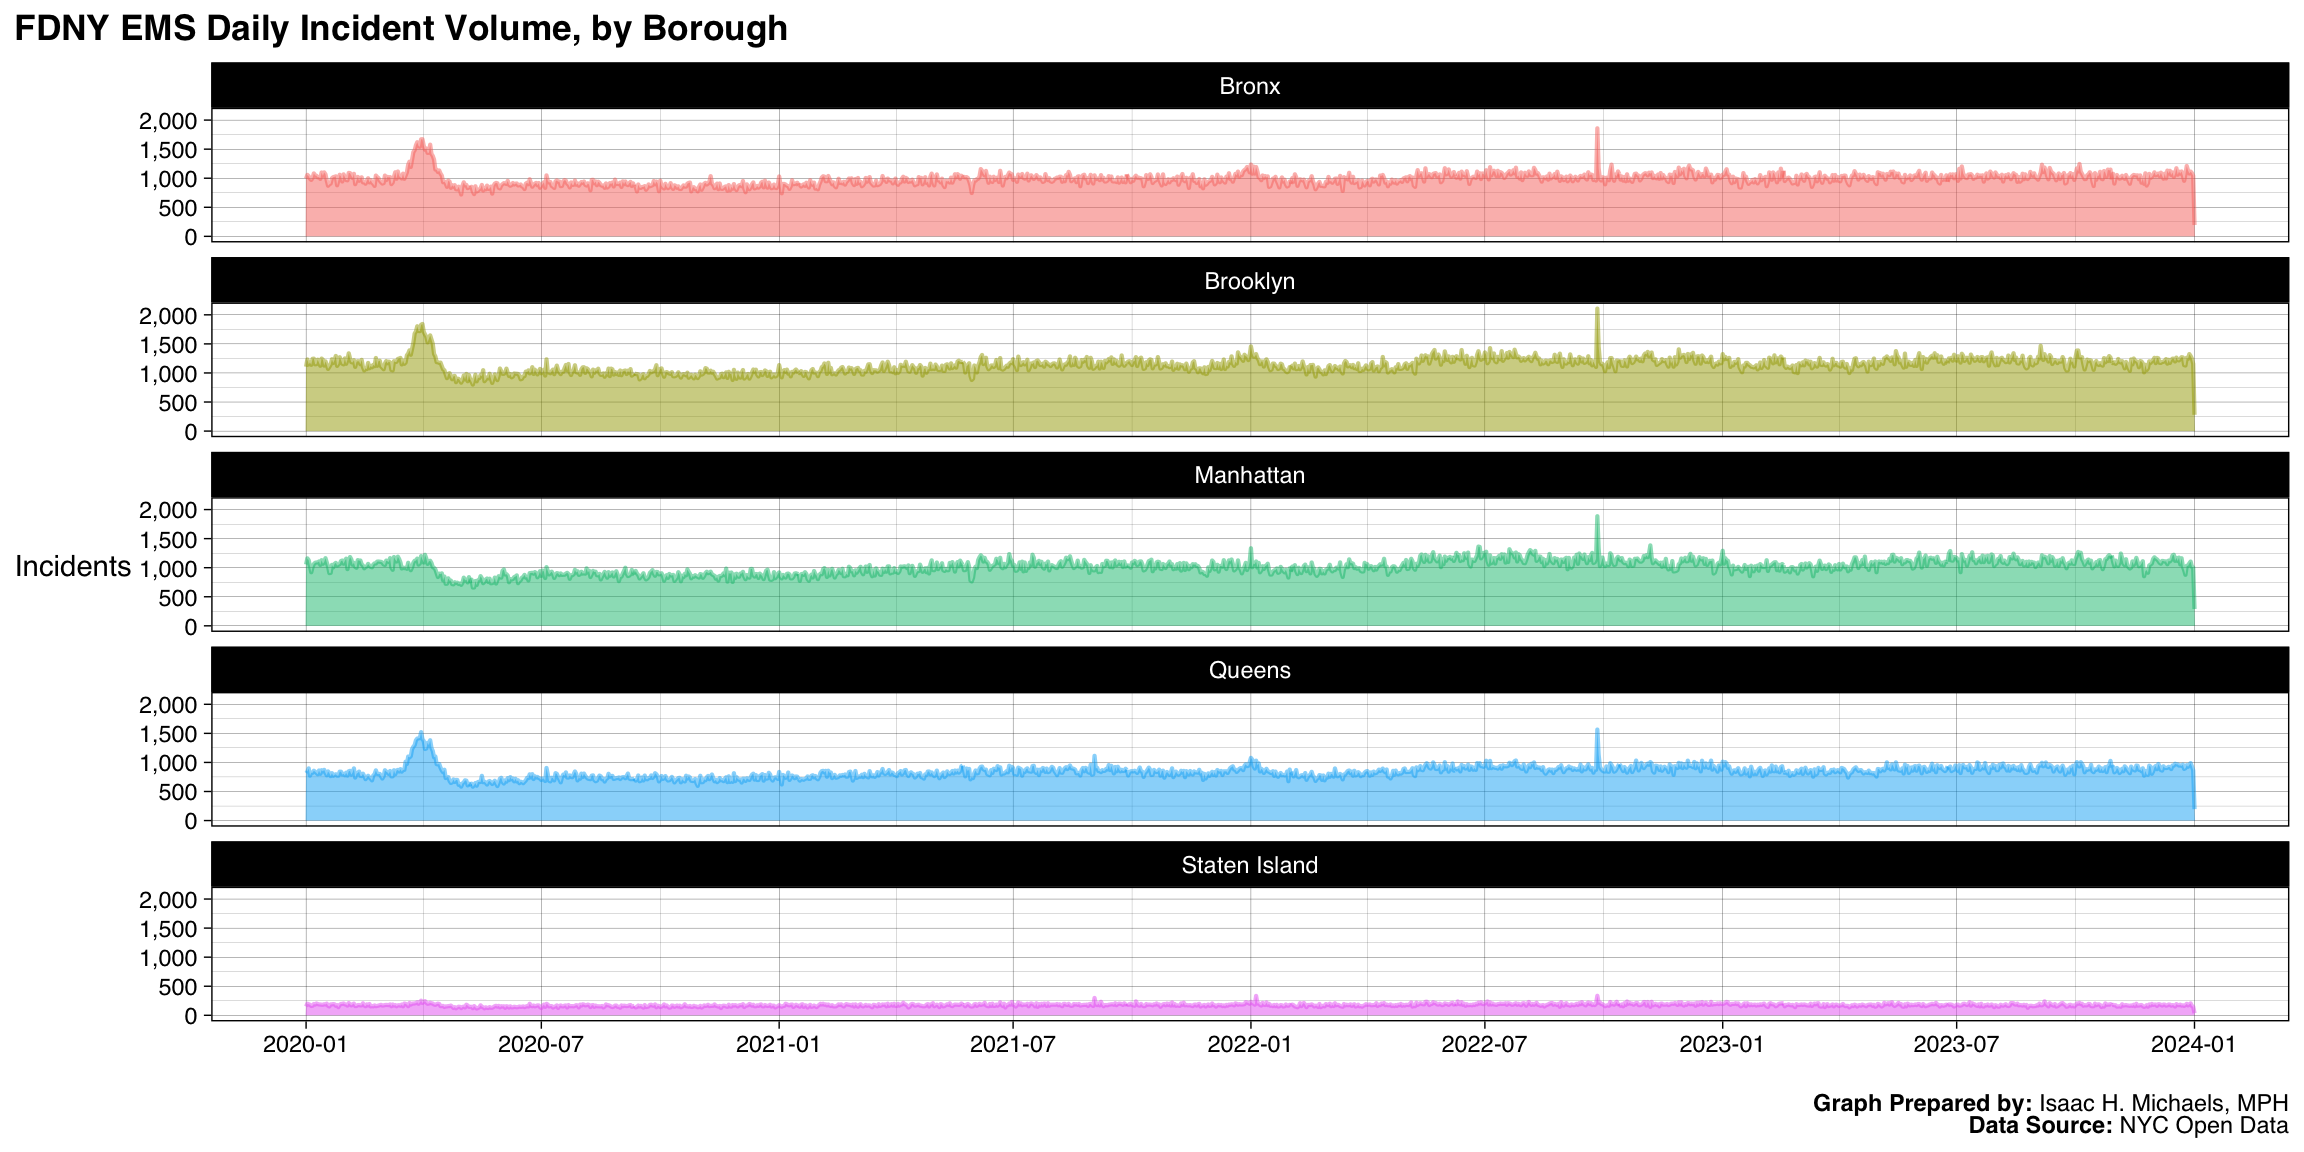
Two of the key features of this page are graphs displaying the daily volume of EMS calls, both citywide and by borough. This allows for the visualization of trends in EMS calls and comparison of call volumes across different parts of the city. By analyzing the volume and distribution of EMS calls, public health practitioners and policymakers can identify areas that may require additional resources or targeted interventions.
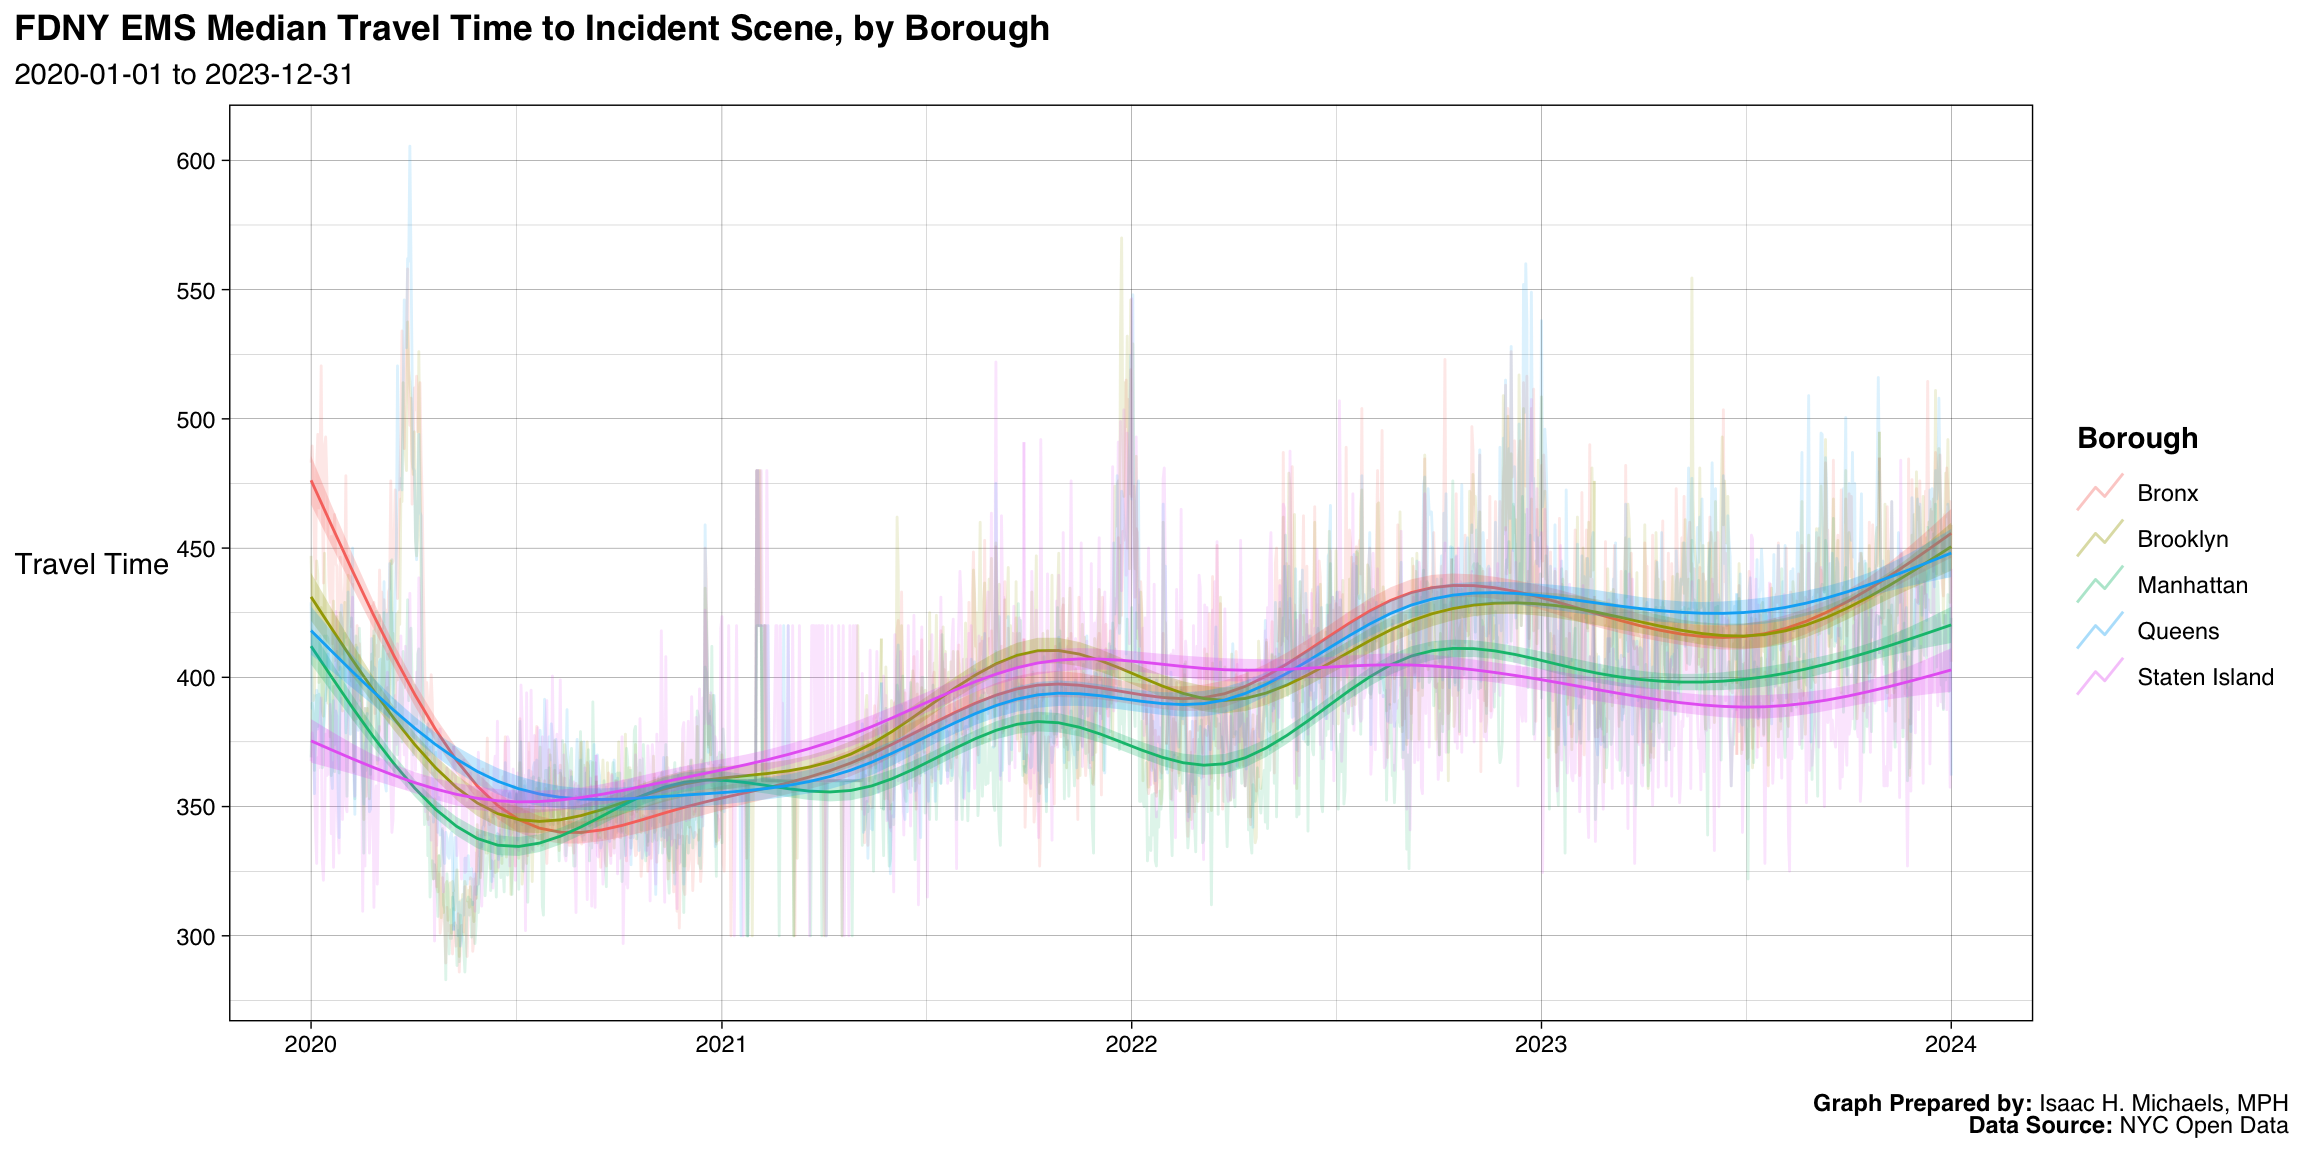
Daily EMS call travel times by borough are also presented. This information can be used to evaluate the efficiency of the EMS system and identify potential bottlenecks or areas that may require additional resources. By understanding response times for EMS calls in different parts of the city, public health practitioners can work to ensure that all communities have access to timely and effective emergency medical care.
Cumulative Incidence and Volume
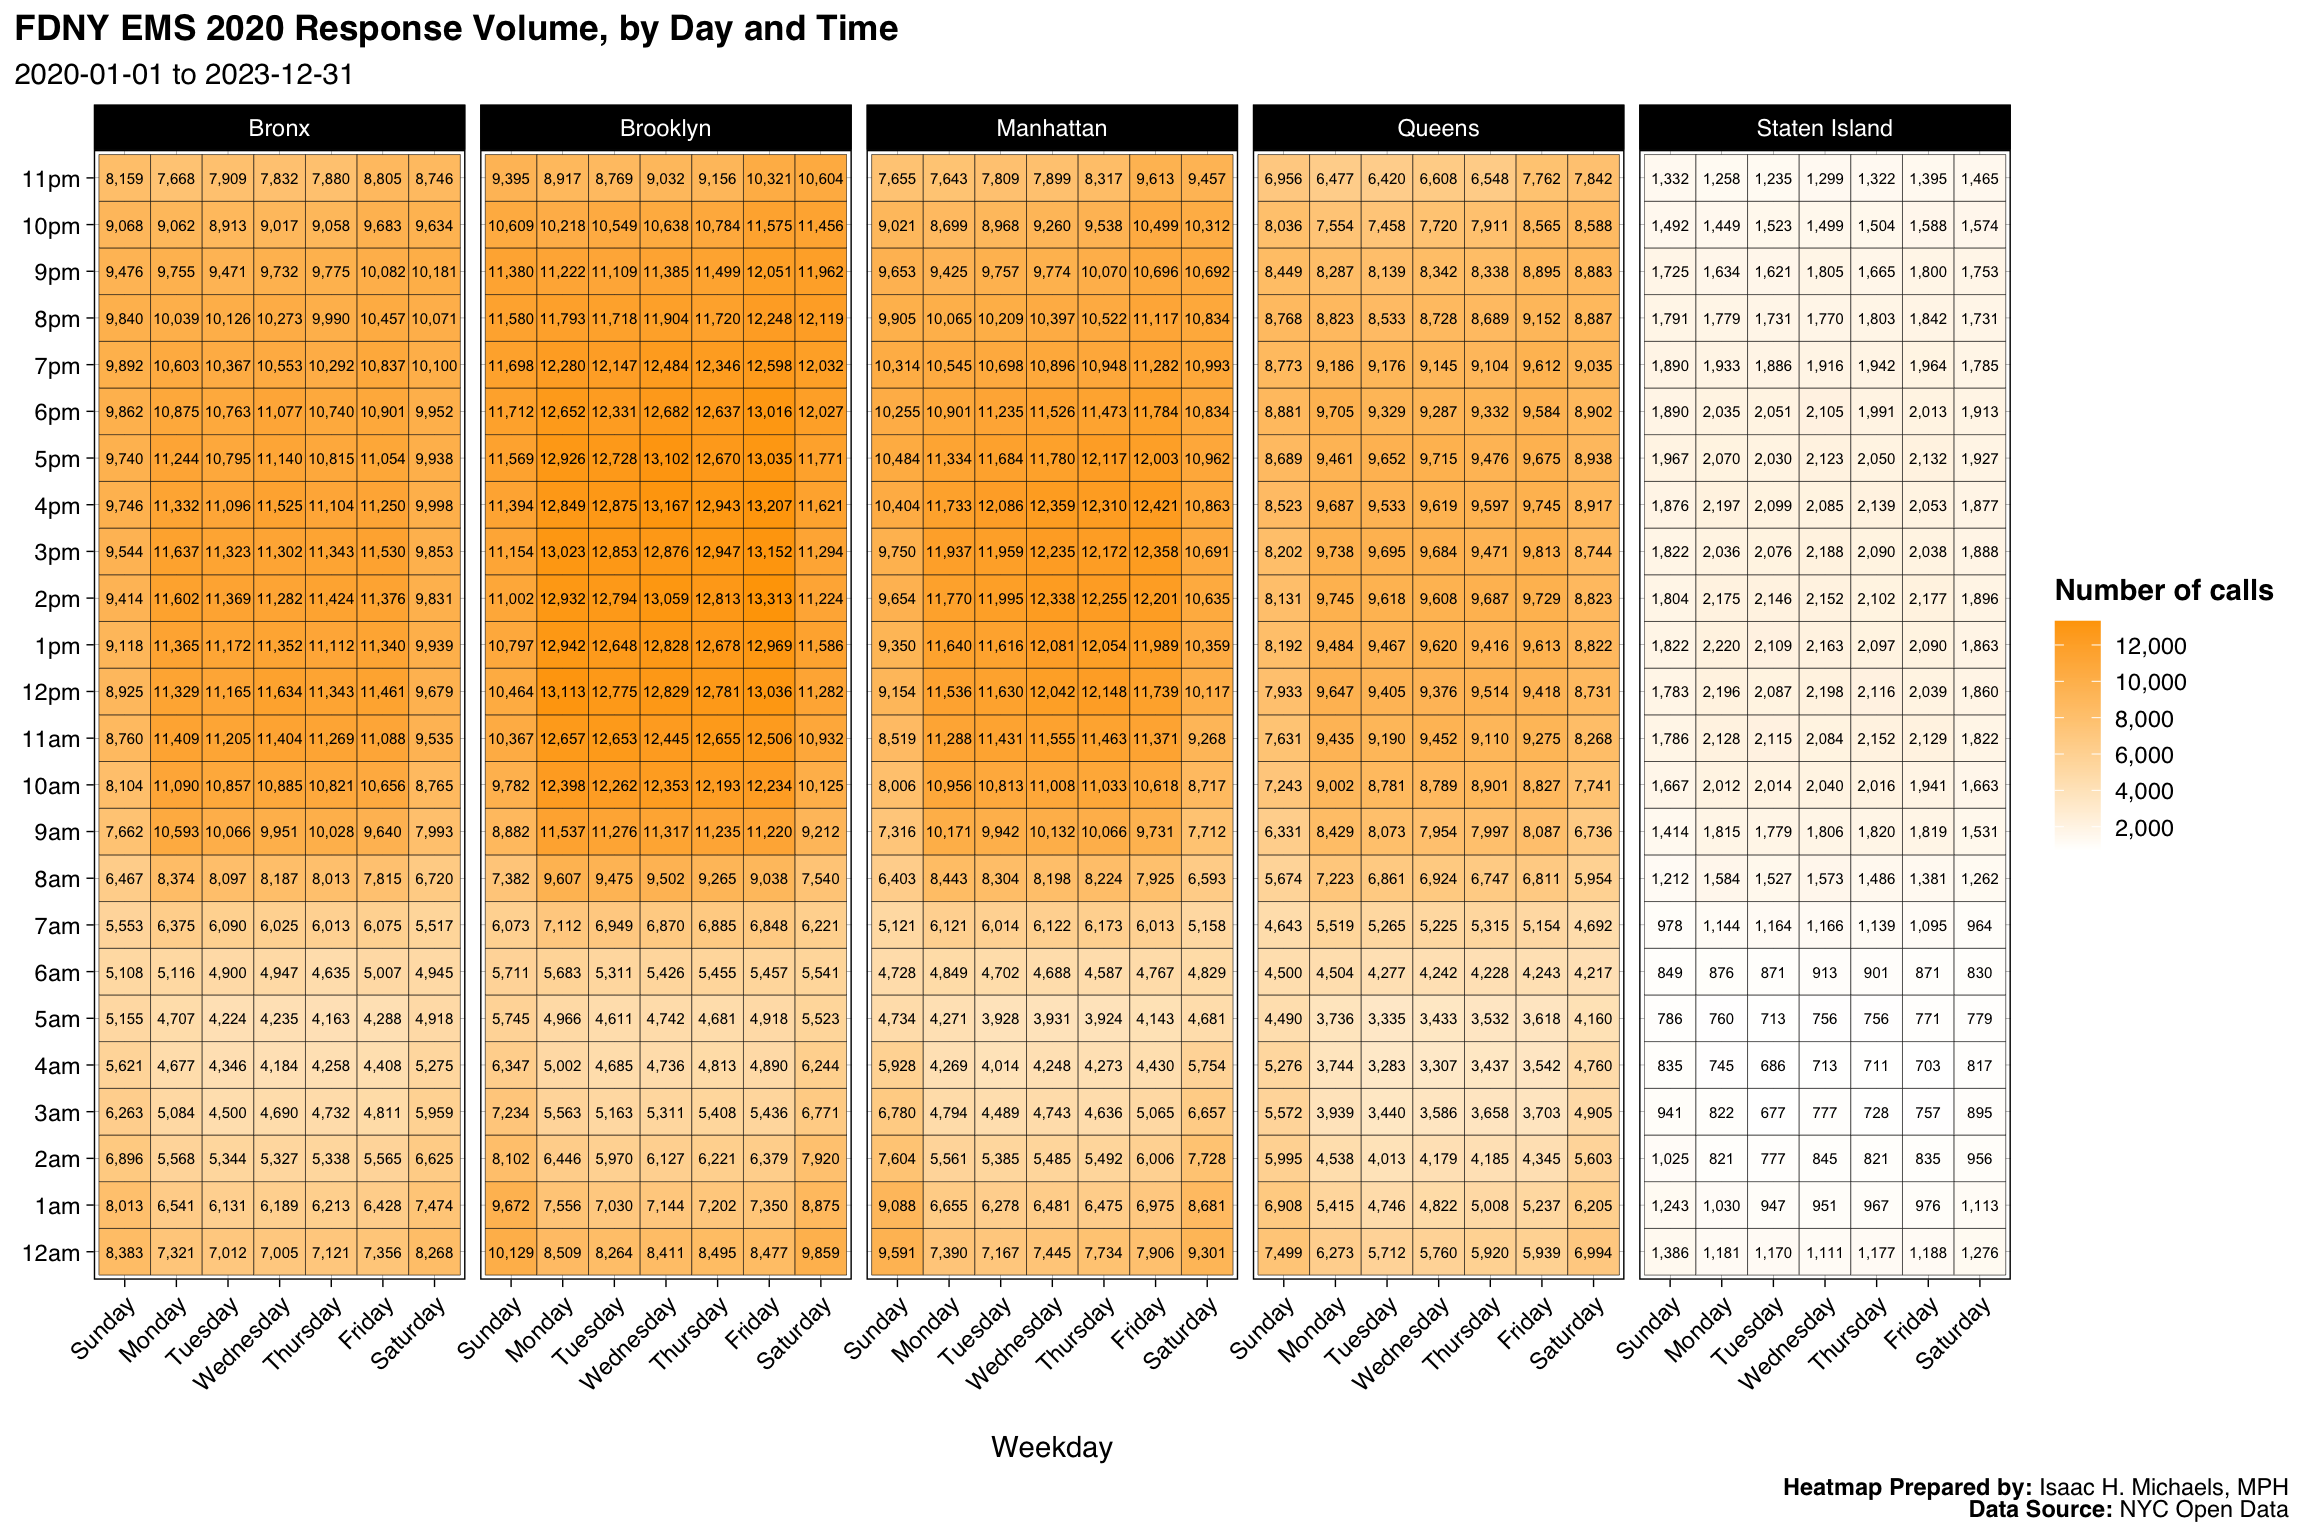
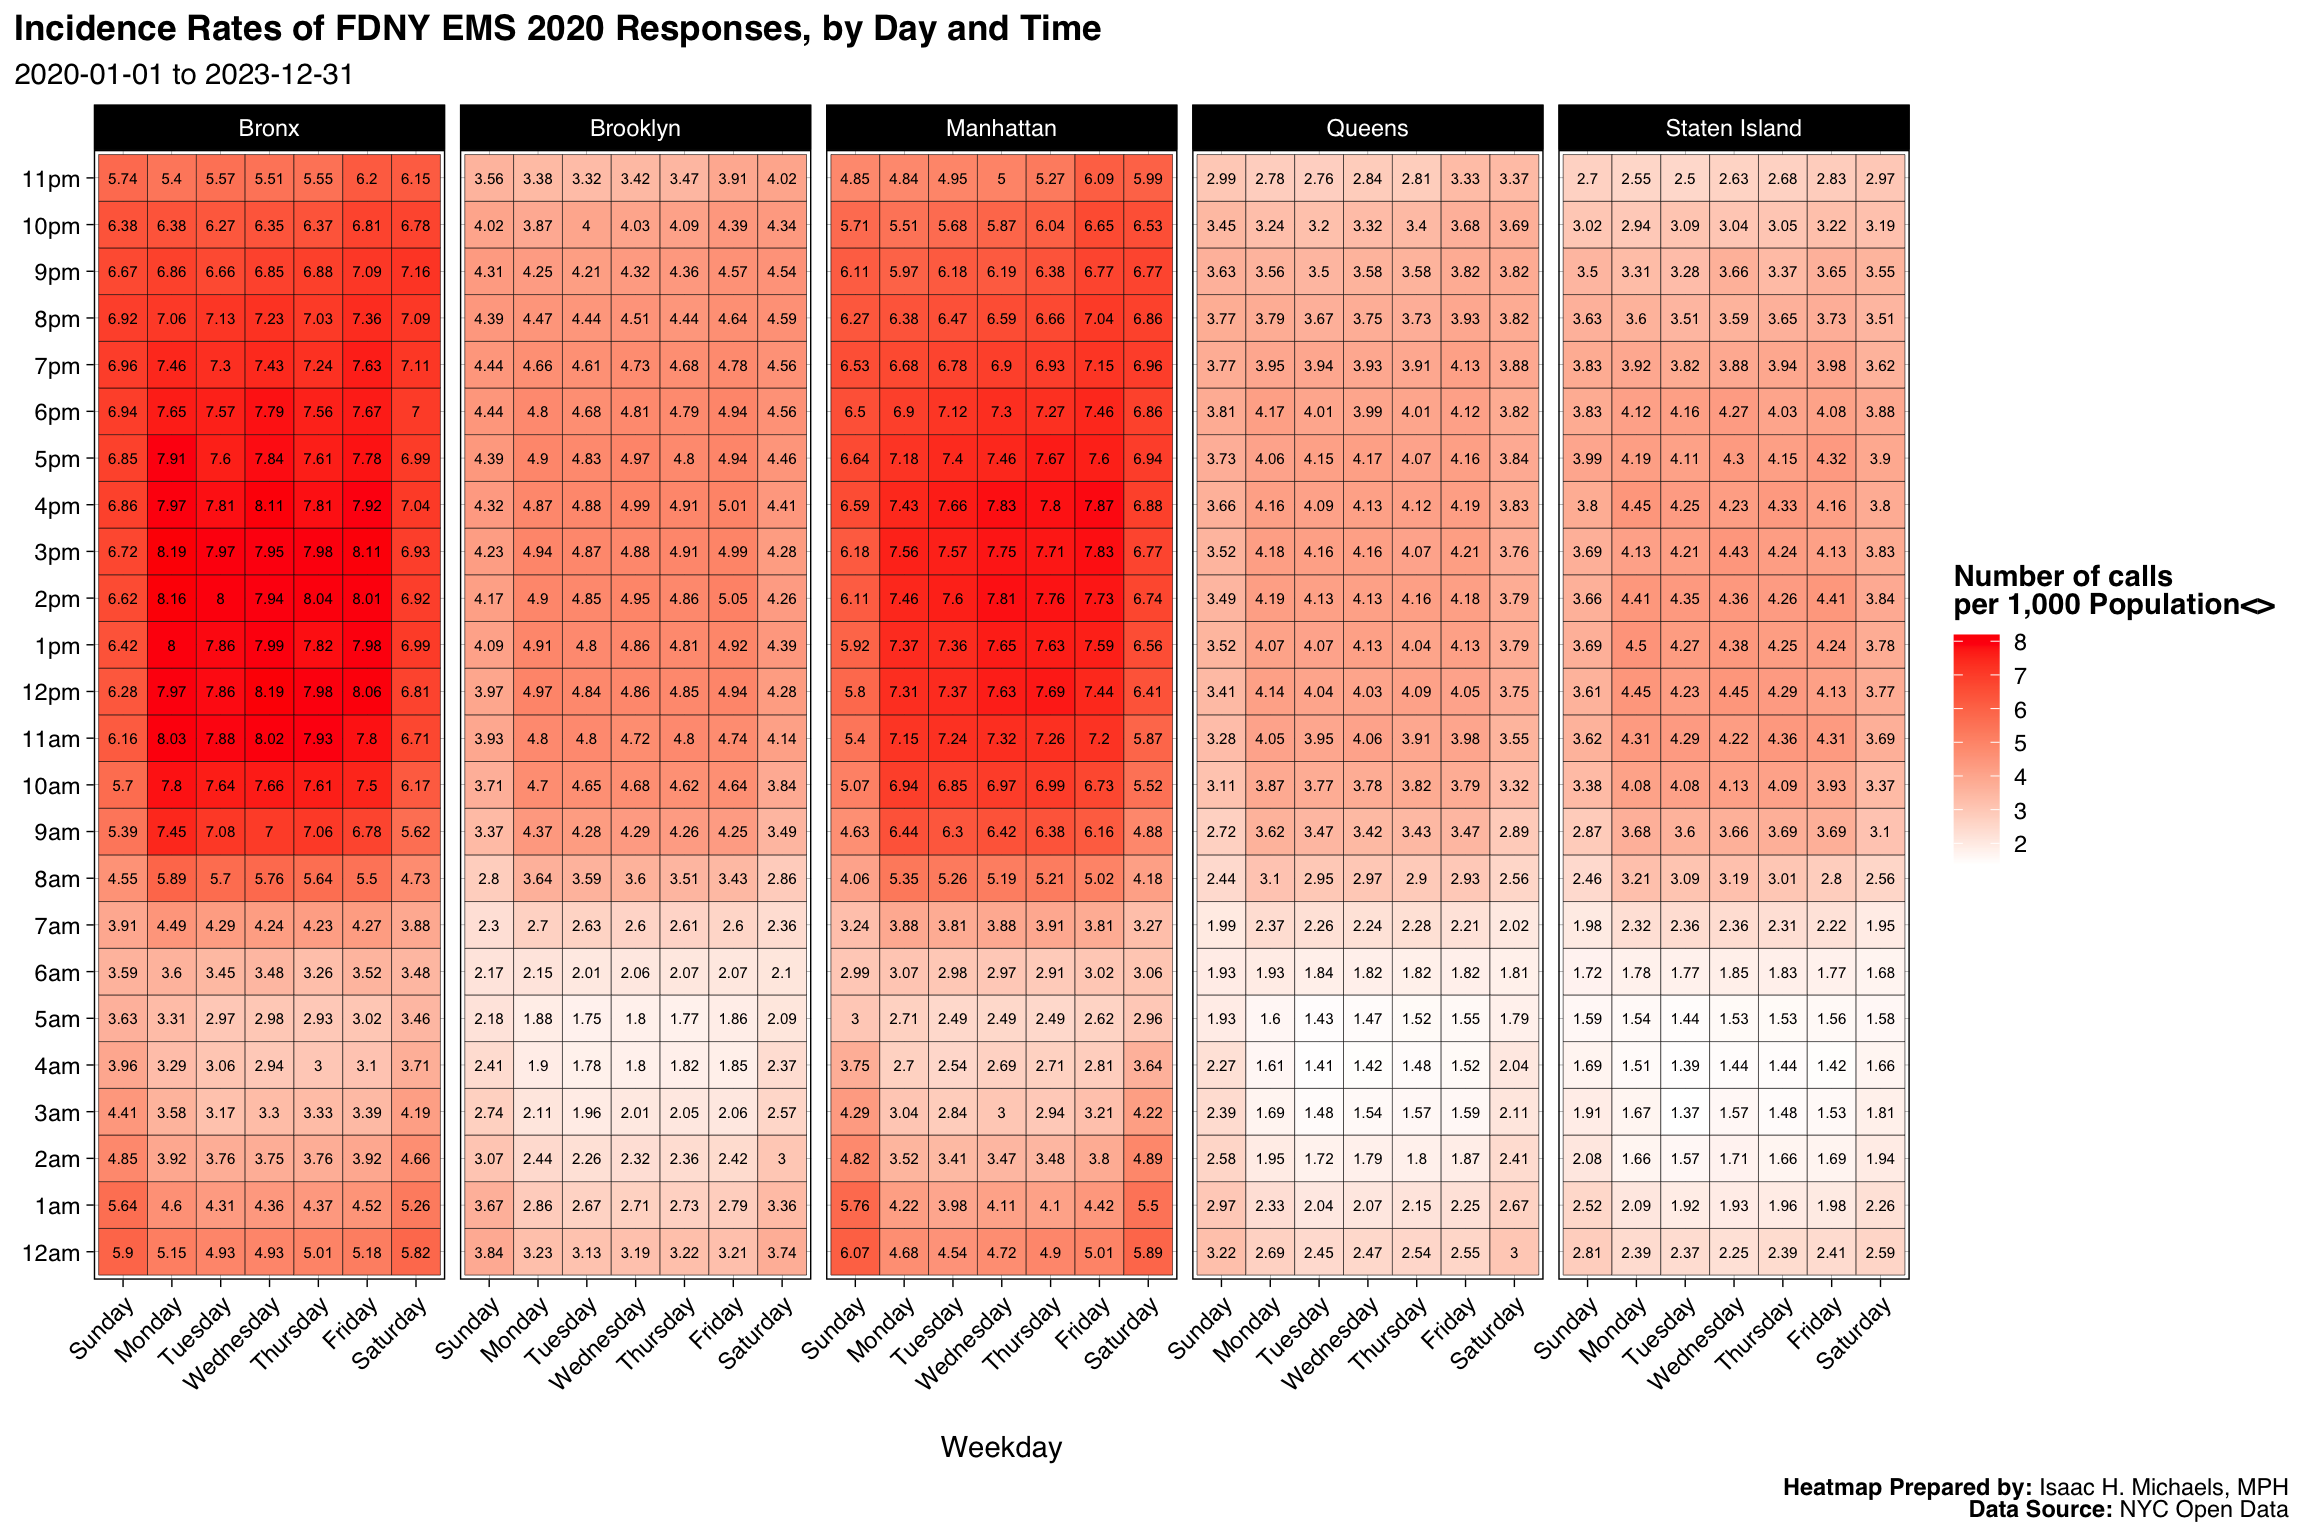
Cumulative incidence rates and total volumes of EMS calls by weekday, hour, and borough are provided. This allows for the analysis of when and where EMS calls are most likely to occur. This information can be utilized to allocate resources and personnel more efficiently, and to identify potential risk factors or trends contributing to higher rates of EMS calls in certain areas or at specific times.
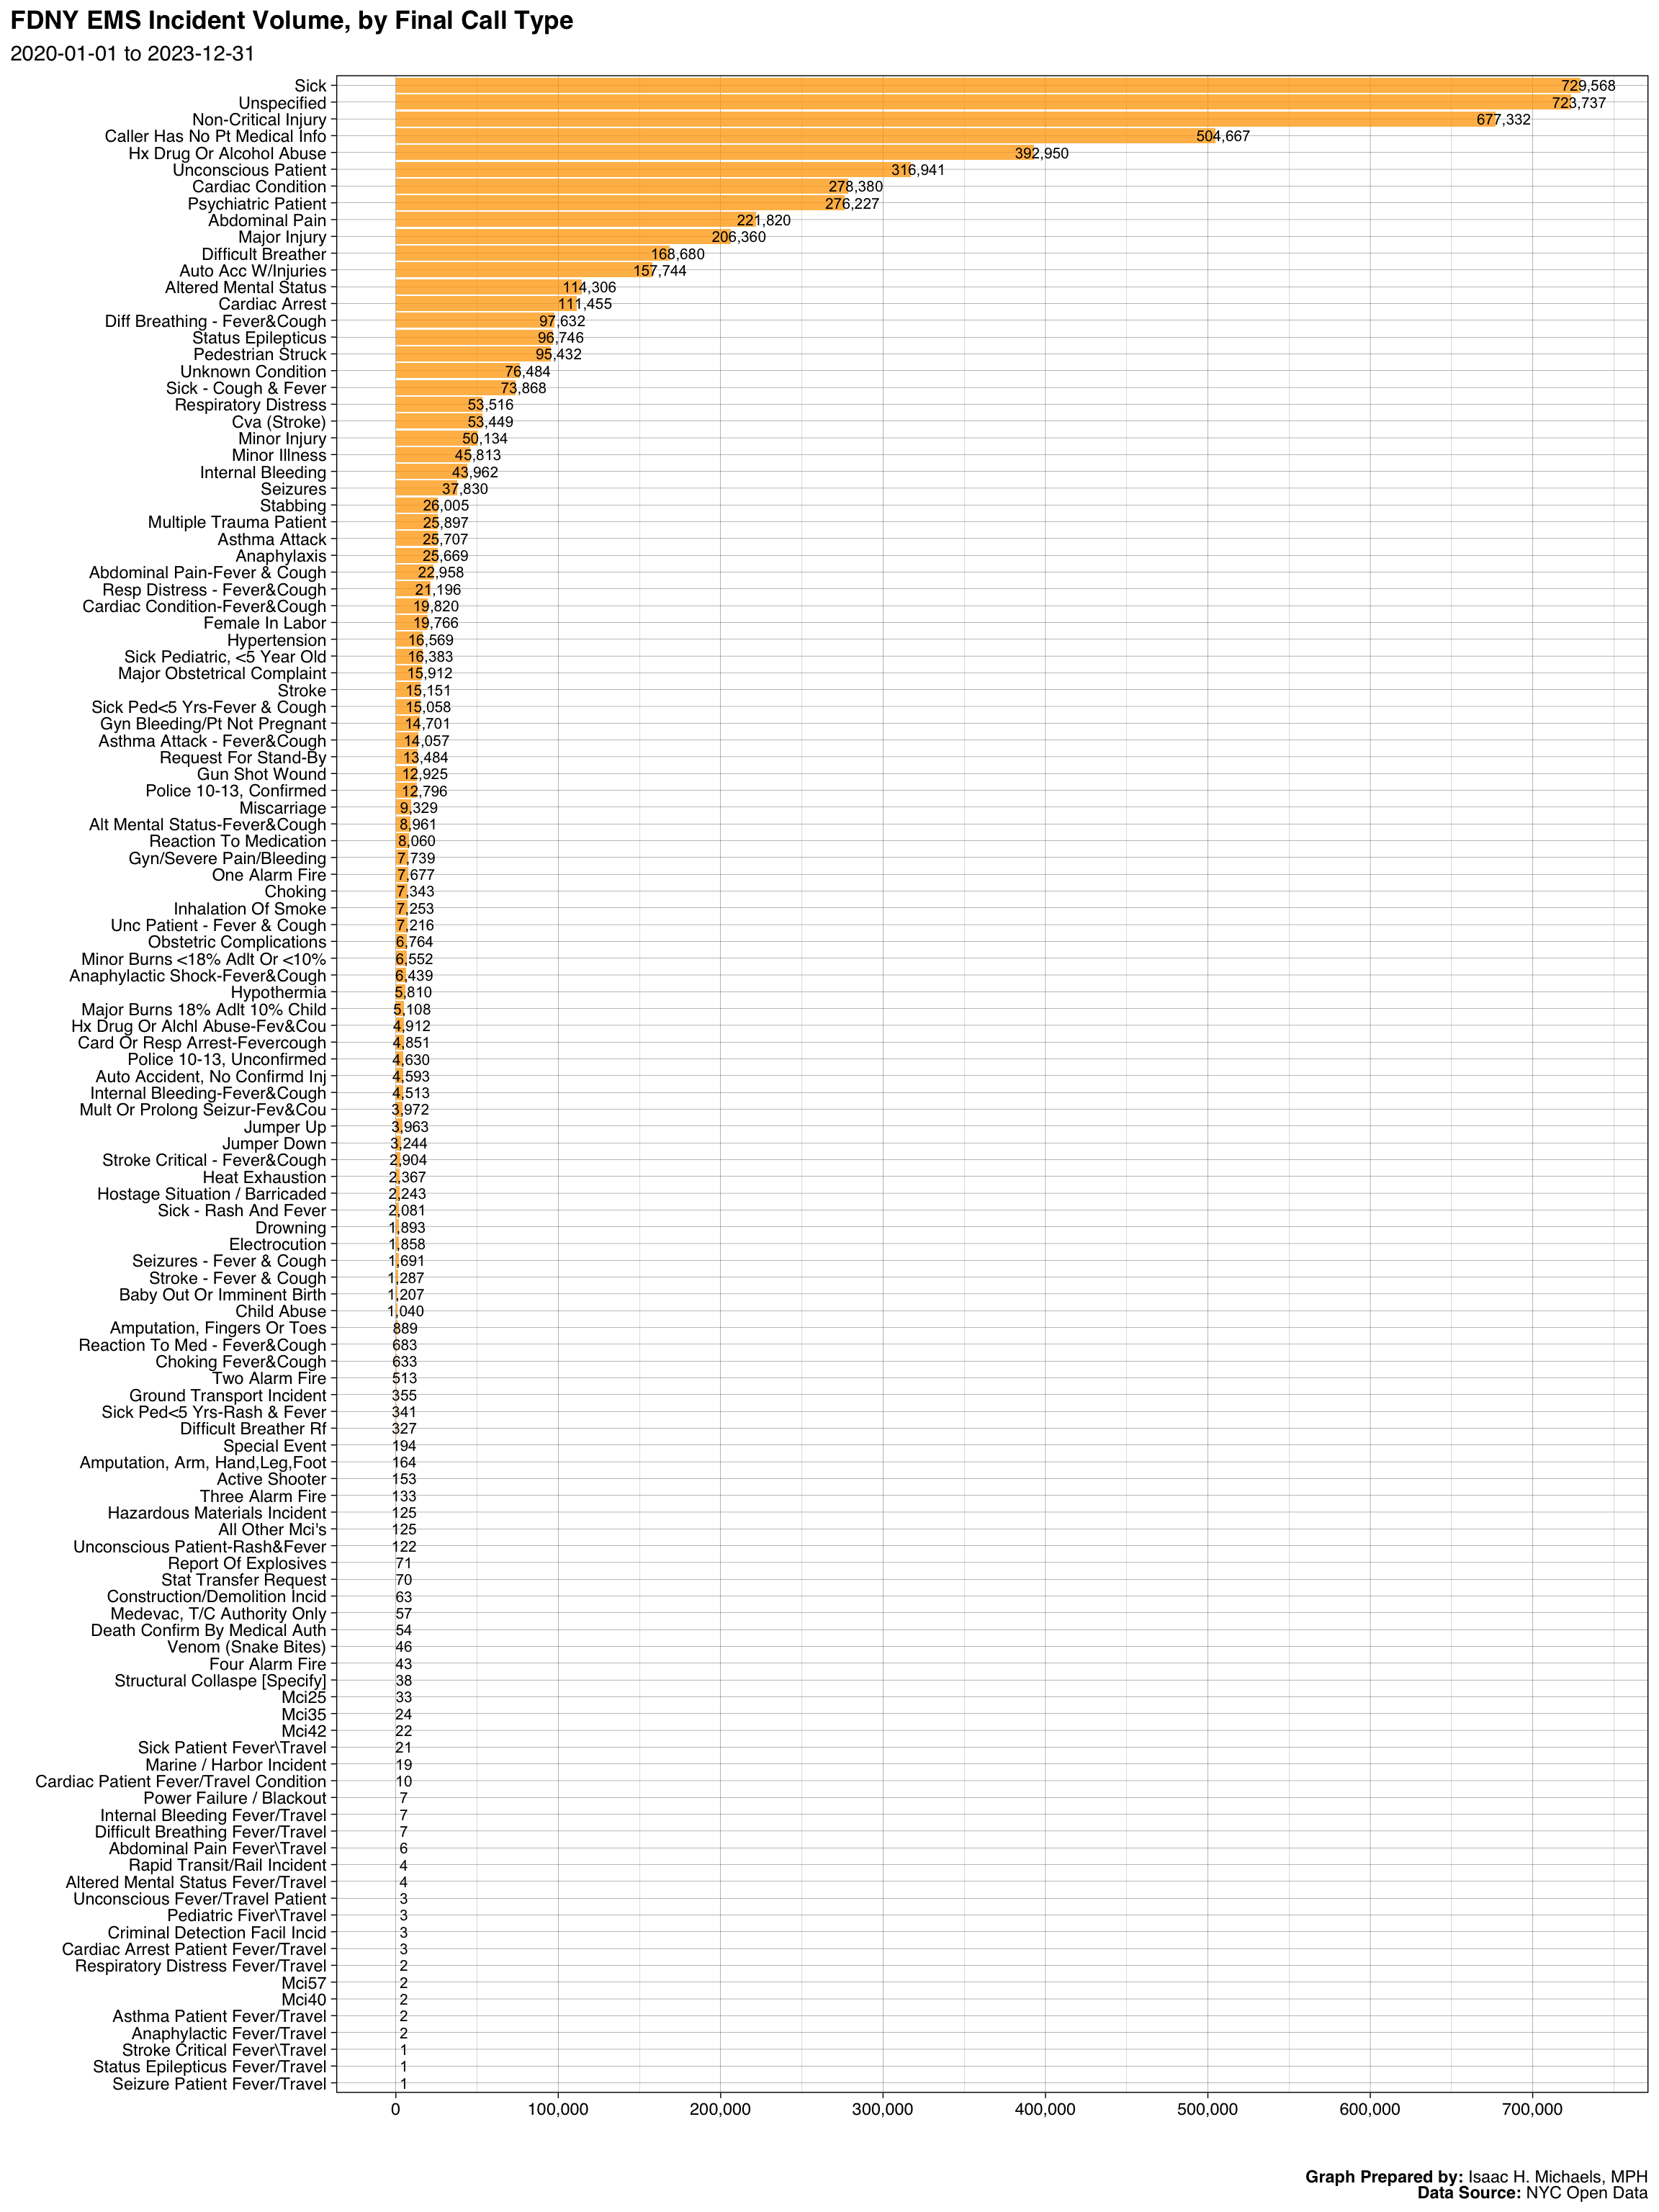
A cumulative frequency of final call types is also included. This displays the most common types of EMS calls made in the city. By understanding the types of emergencies frequently encountered by EMS providers, public health practitioners can better prepare for and respond to these events.
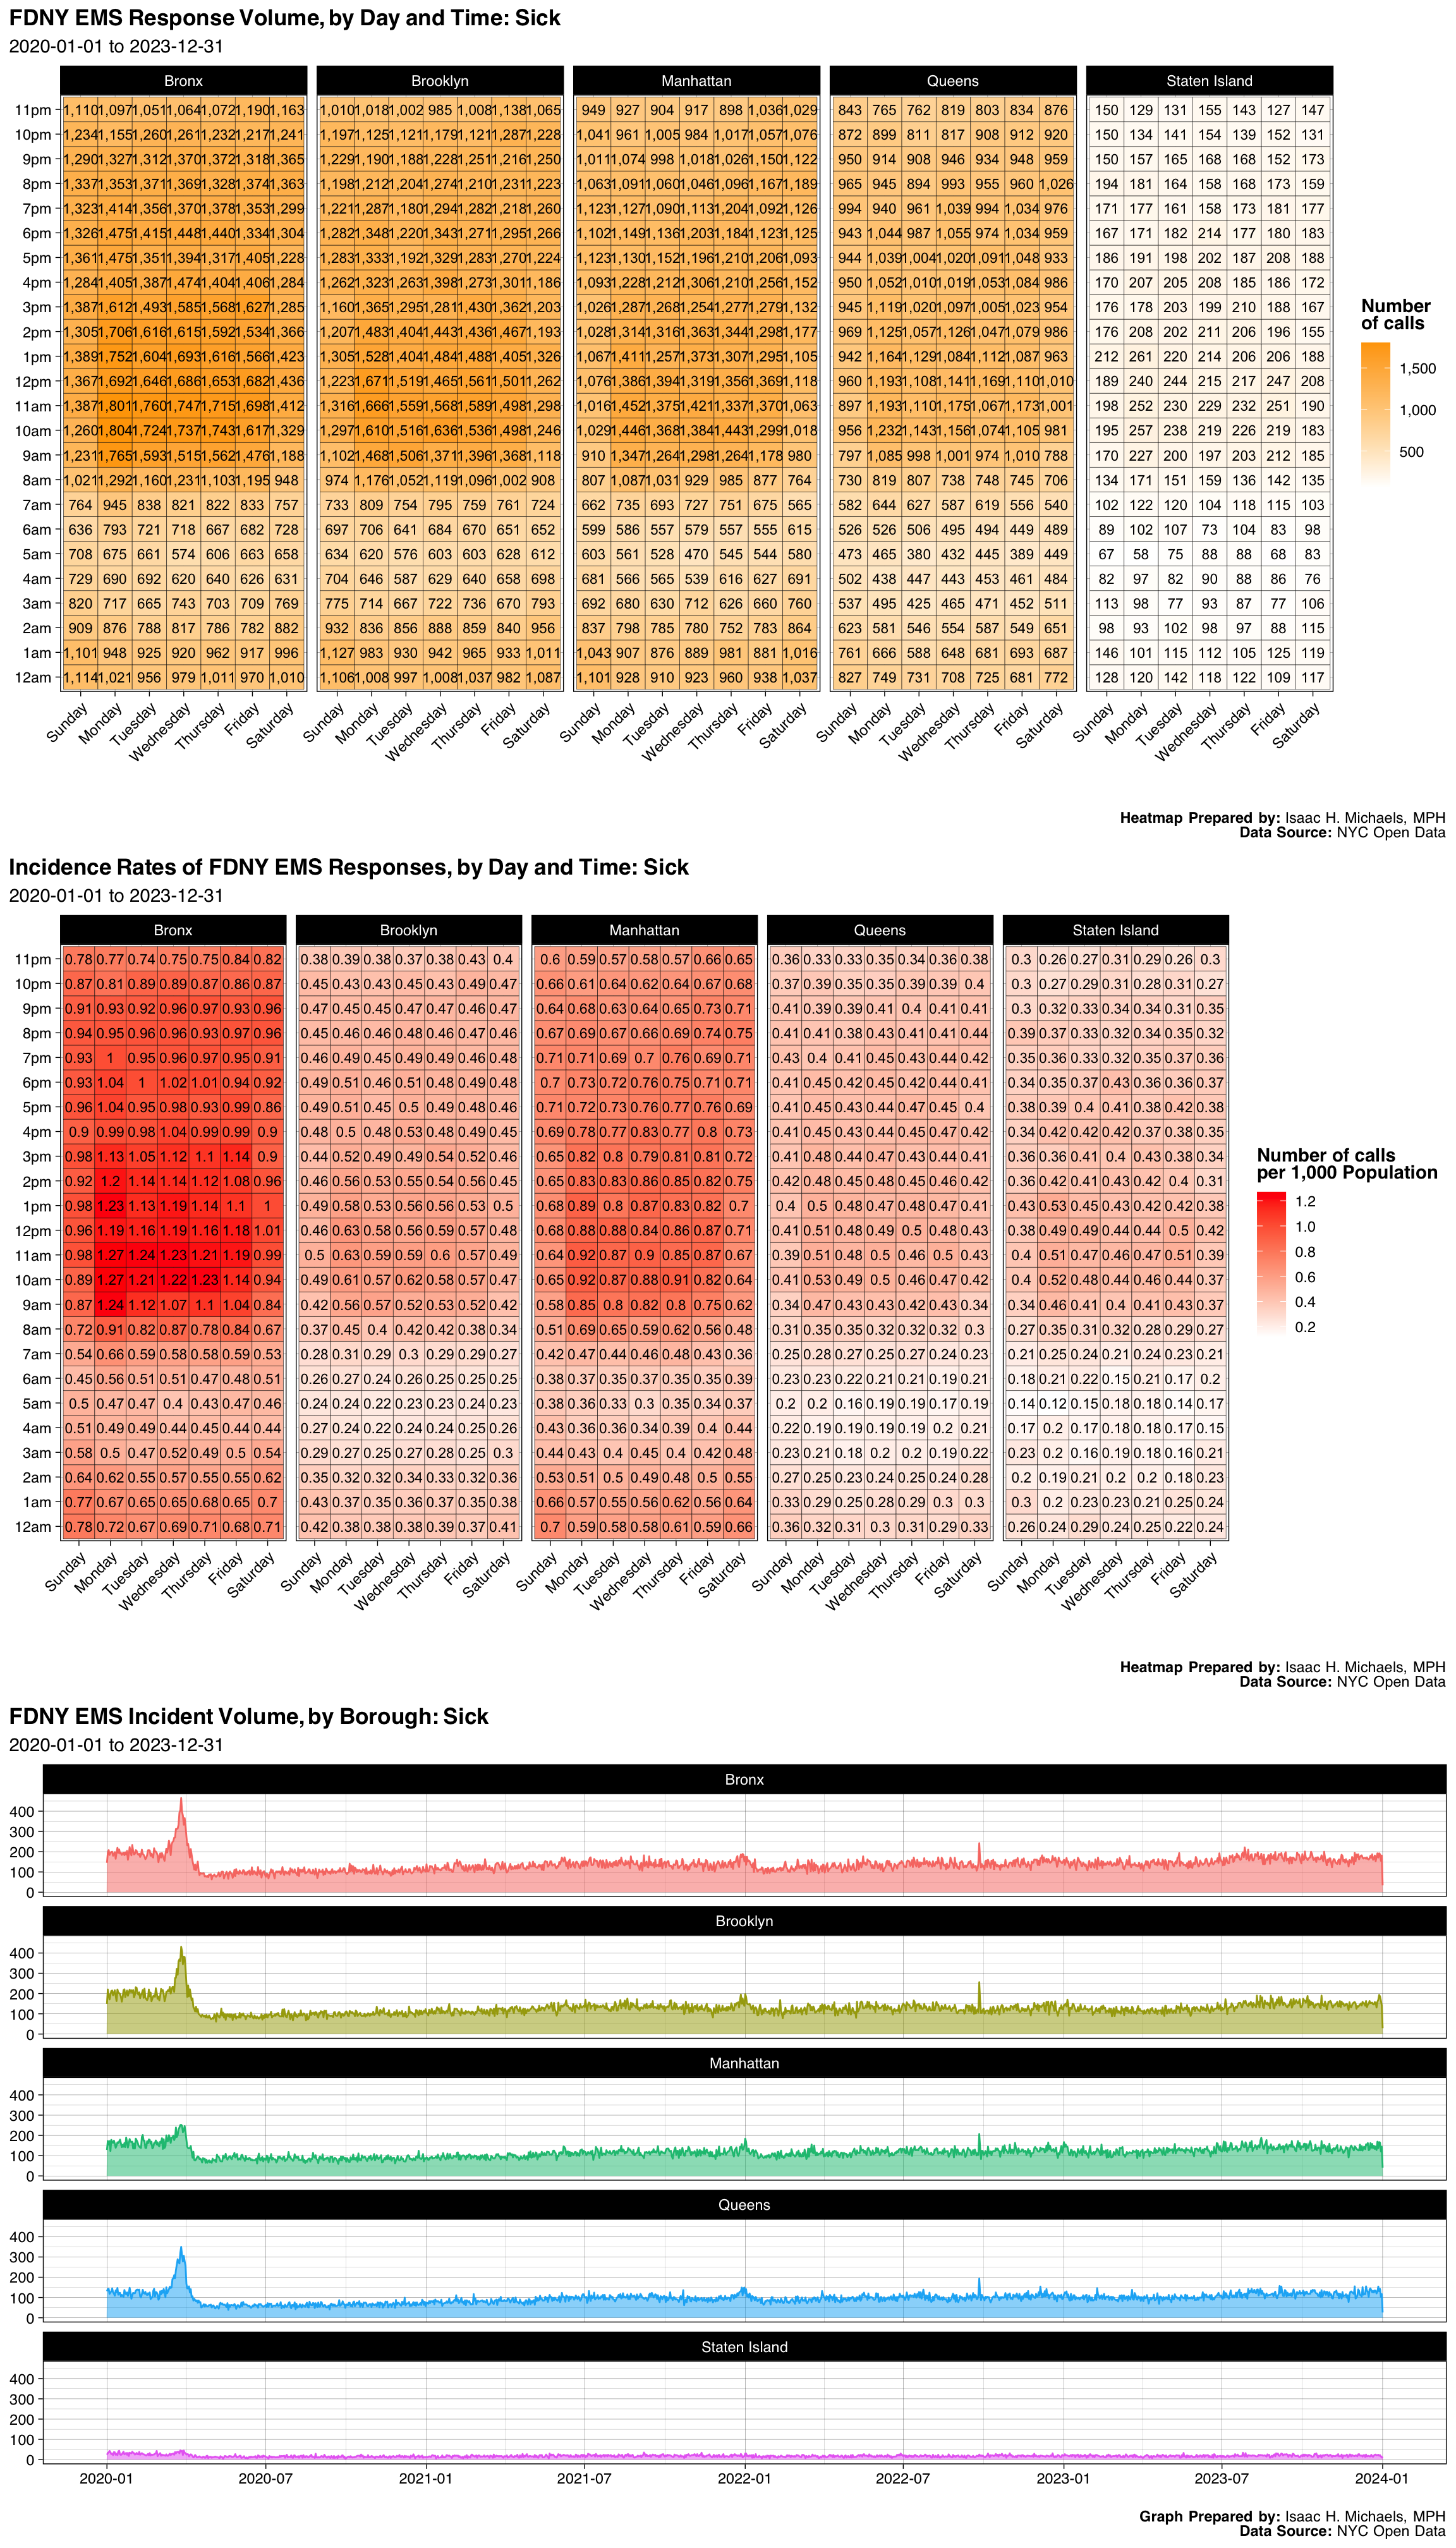
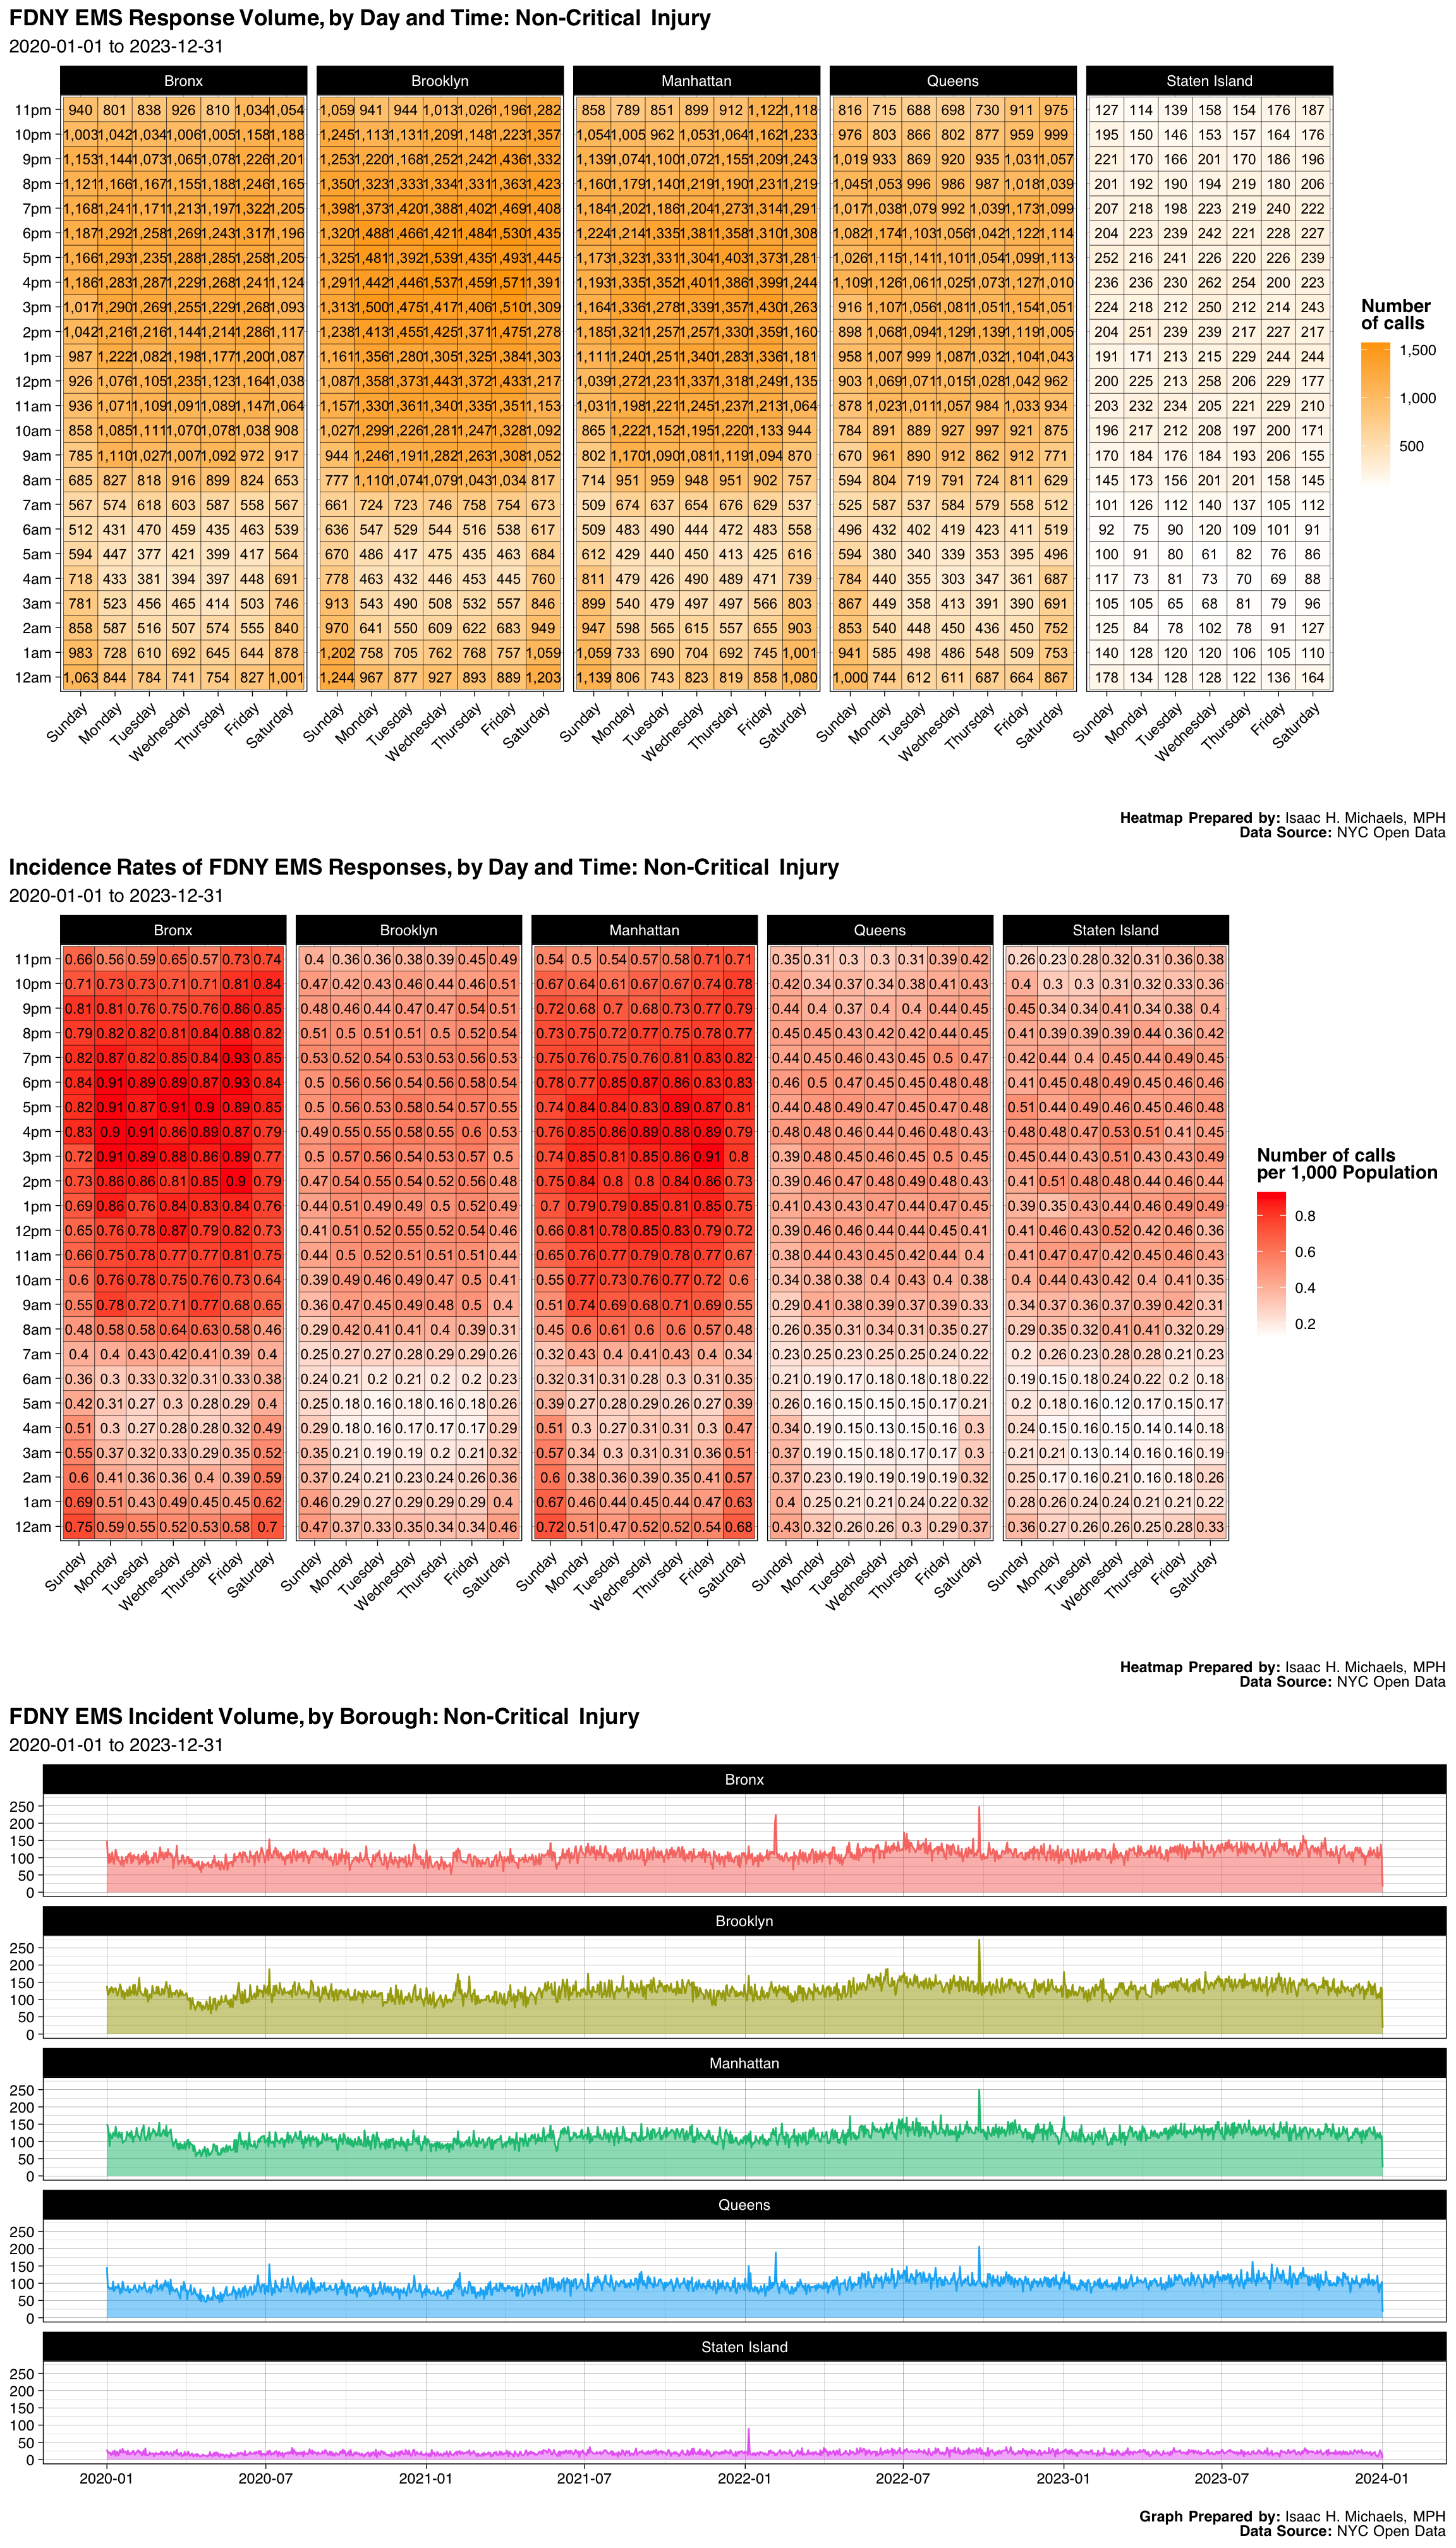
For each of the most common call types, heat maps of cumulative incidence rates and total volume of EMS calls by weekday, hour, and borough are provided. These heat maps allow for the visualization of spatial and temporal patterns in these specific types of calls, which can be useful for identifying areas of particular need.
Trend Analysis
Trend graphs of daily incident volume by borough for each of the most common call types are also included. This allows for the analysis of how the volume of these types of calls varies by borough over time. By understanding the trends in EMS calls over time, public health practitioners can identify emerging issues and plan for potential future needs.
Cumulative frequencies of borough, final severity level, and disposition for each of the most common call types are also presented. This allows for the analysis of how these variables vary across different types of calls and can provide a better understanding of the context in which EMS calls are made. This information can be used to tailor interventions and resources to the specific needs of different communities and types of emergencies.
Conclusion
Overall, this page offers a wealth of information on EMS calls in New York City that can be utilized by public health practitioners and policymakers to improve the efficiency and effectiveness of emergency medical services. By understanding the patterns and trends in EMS calls, we can work to ensure that all communities have access to the care they need when it is needed most.
Daily EMS Call Volume
 Graph Prepared By: Isaac H. Michaels, MPH
Data Source: NYC Open Data
Daily EMS Call Volume, by Borough
 Graph Prepared By: Isaac H. Michaels, MPH
Data Source: NYC Open Data
 Graph Prepared By:
 Call Times
 Graph Prepared By:
 Incidence Rates
 Graph Prepared By: Isaac H. Michaels, MPH
Data Source: NYC Open Data
Population Data Source: Health Data NY
Final Call Types
 Graph Prepared By: Isaac H. Michaels, MPH
Data Source: NYC Open Data
Sick
| Borough | Number | Percent |
|---|---|---|
| Bronx | 202810 | 0.2779864 |
| Brooklyn | 188869 | 0.2588779 |
| Manhattan | 170035 | 0.2330626 |
| Queens | 141503 | 0.1939545 |
| Staten Island | 26350 | 0.0361173 |
| Unknown | 1 | 0.0000014 |
| Final Severity Level | Number | Percent |
|---|---|---|
| 1 | 0 | 0% |
| 2 | 69 | 9.45765165138822e-05 |
| 3 | 379 | 0.000519485503750164 |
| 4 | 1893 | 0.00259468617044607 |
| 5 | 19 | 2.6042808895127e-05 |
| 6 | 727201 | 0.996755614281328 |
| 7 | 6 | 8.22404491425063e-06 |
| 8 | 1 | 1.3706741523751e-06 |
| Disposition | Number | Percent |
|---|---|---|
| Transporting Patient | 519270 | 0.7117500 |
| Refused Medical Aid | 151065 | 0.2070609 |
| Unfounded | 25311 | 0.0346931 |
| Patient Gone on Arrival | 13678 | 0.0187481 |
| Other | 9881 | 0.0135436 |
| Cancelled | 6980 | 0.0095673 |
| Condition Corrected | 2747 | 0.0037652 |
| Treated and Transported | 336 | 0.0004605 |
| Triaged at Scene No Transport | 182 | 0.0002495 |
| Patient Pronounced Dead | 109 | 0.0001494 |
| Treated Not Transported | 9 | 0.0000123 |
Graphs, Heatmaps, and Tables Prepared By: Isaac H. Michaels, MPH
Data Source: NYC Open Data
Back to top
Non-Critical Injury
| Borough | Number | Percent |
|---|---|---|
| Bronx | 157660 | 0.2327662 |
| Brooklyn | 184022 | 0.2716866 |
| Manhattan | 167459 | 0.2472333 |
| Queens | 139606 | 0.2061116 |
| Staten Island | 28585 | 0.0422023 |
| Final Severity Level | Number | Percent |
|---|---|---|
| 1 | 2 | 2.95276171803488e-06 |
| 2 | 189 | 0.000279035982354296 |
| 3 | 897 | 0.00132431363053864 |
| 4 | 13319 | 0.0196639166612533 |
| 5 | 662913 | 0.978712064393828 |
| 6 | 2 | 2.95276171803488e-06 |
| 7 | 10 | 1.47638085901744e-05 |
| 8 | 0 | 0% |
| Disposition | Number | Percent |
|---|---|---|
| Transporting Patient | 352436 | 0.5203298 |
| Refused Medical Aid | 197764 | 0.2919750 |
| Unfounded | 53530 | 0.0790307 |
| Condition Corrected | 28937 | 0.0427220 |
| Patient Gone on Arrival | 25933 | 0.0382870 |
| Cancelled | 13353 | 0.0197141 |
| Other | 4786 | 0.0070660 |
| Treated and Transported | 408 | 0.0006024 |
| Triaged at Scene No Transport | 86 | 0.0001270 |
| Patient Pronounced Dead | 81 | 0.0001196 |
| Treated Not Transported | 18 | 0.0000266 |
Graphs, Heatmaps, and Tables Prepared By: Isaac H. Michaels, MPH
Data Source: NYC Open Data
Back to top
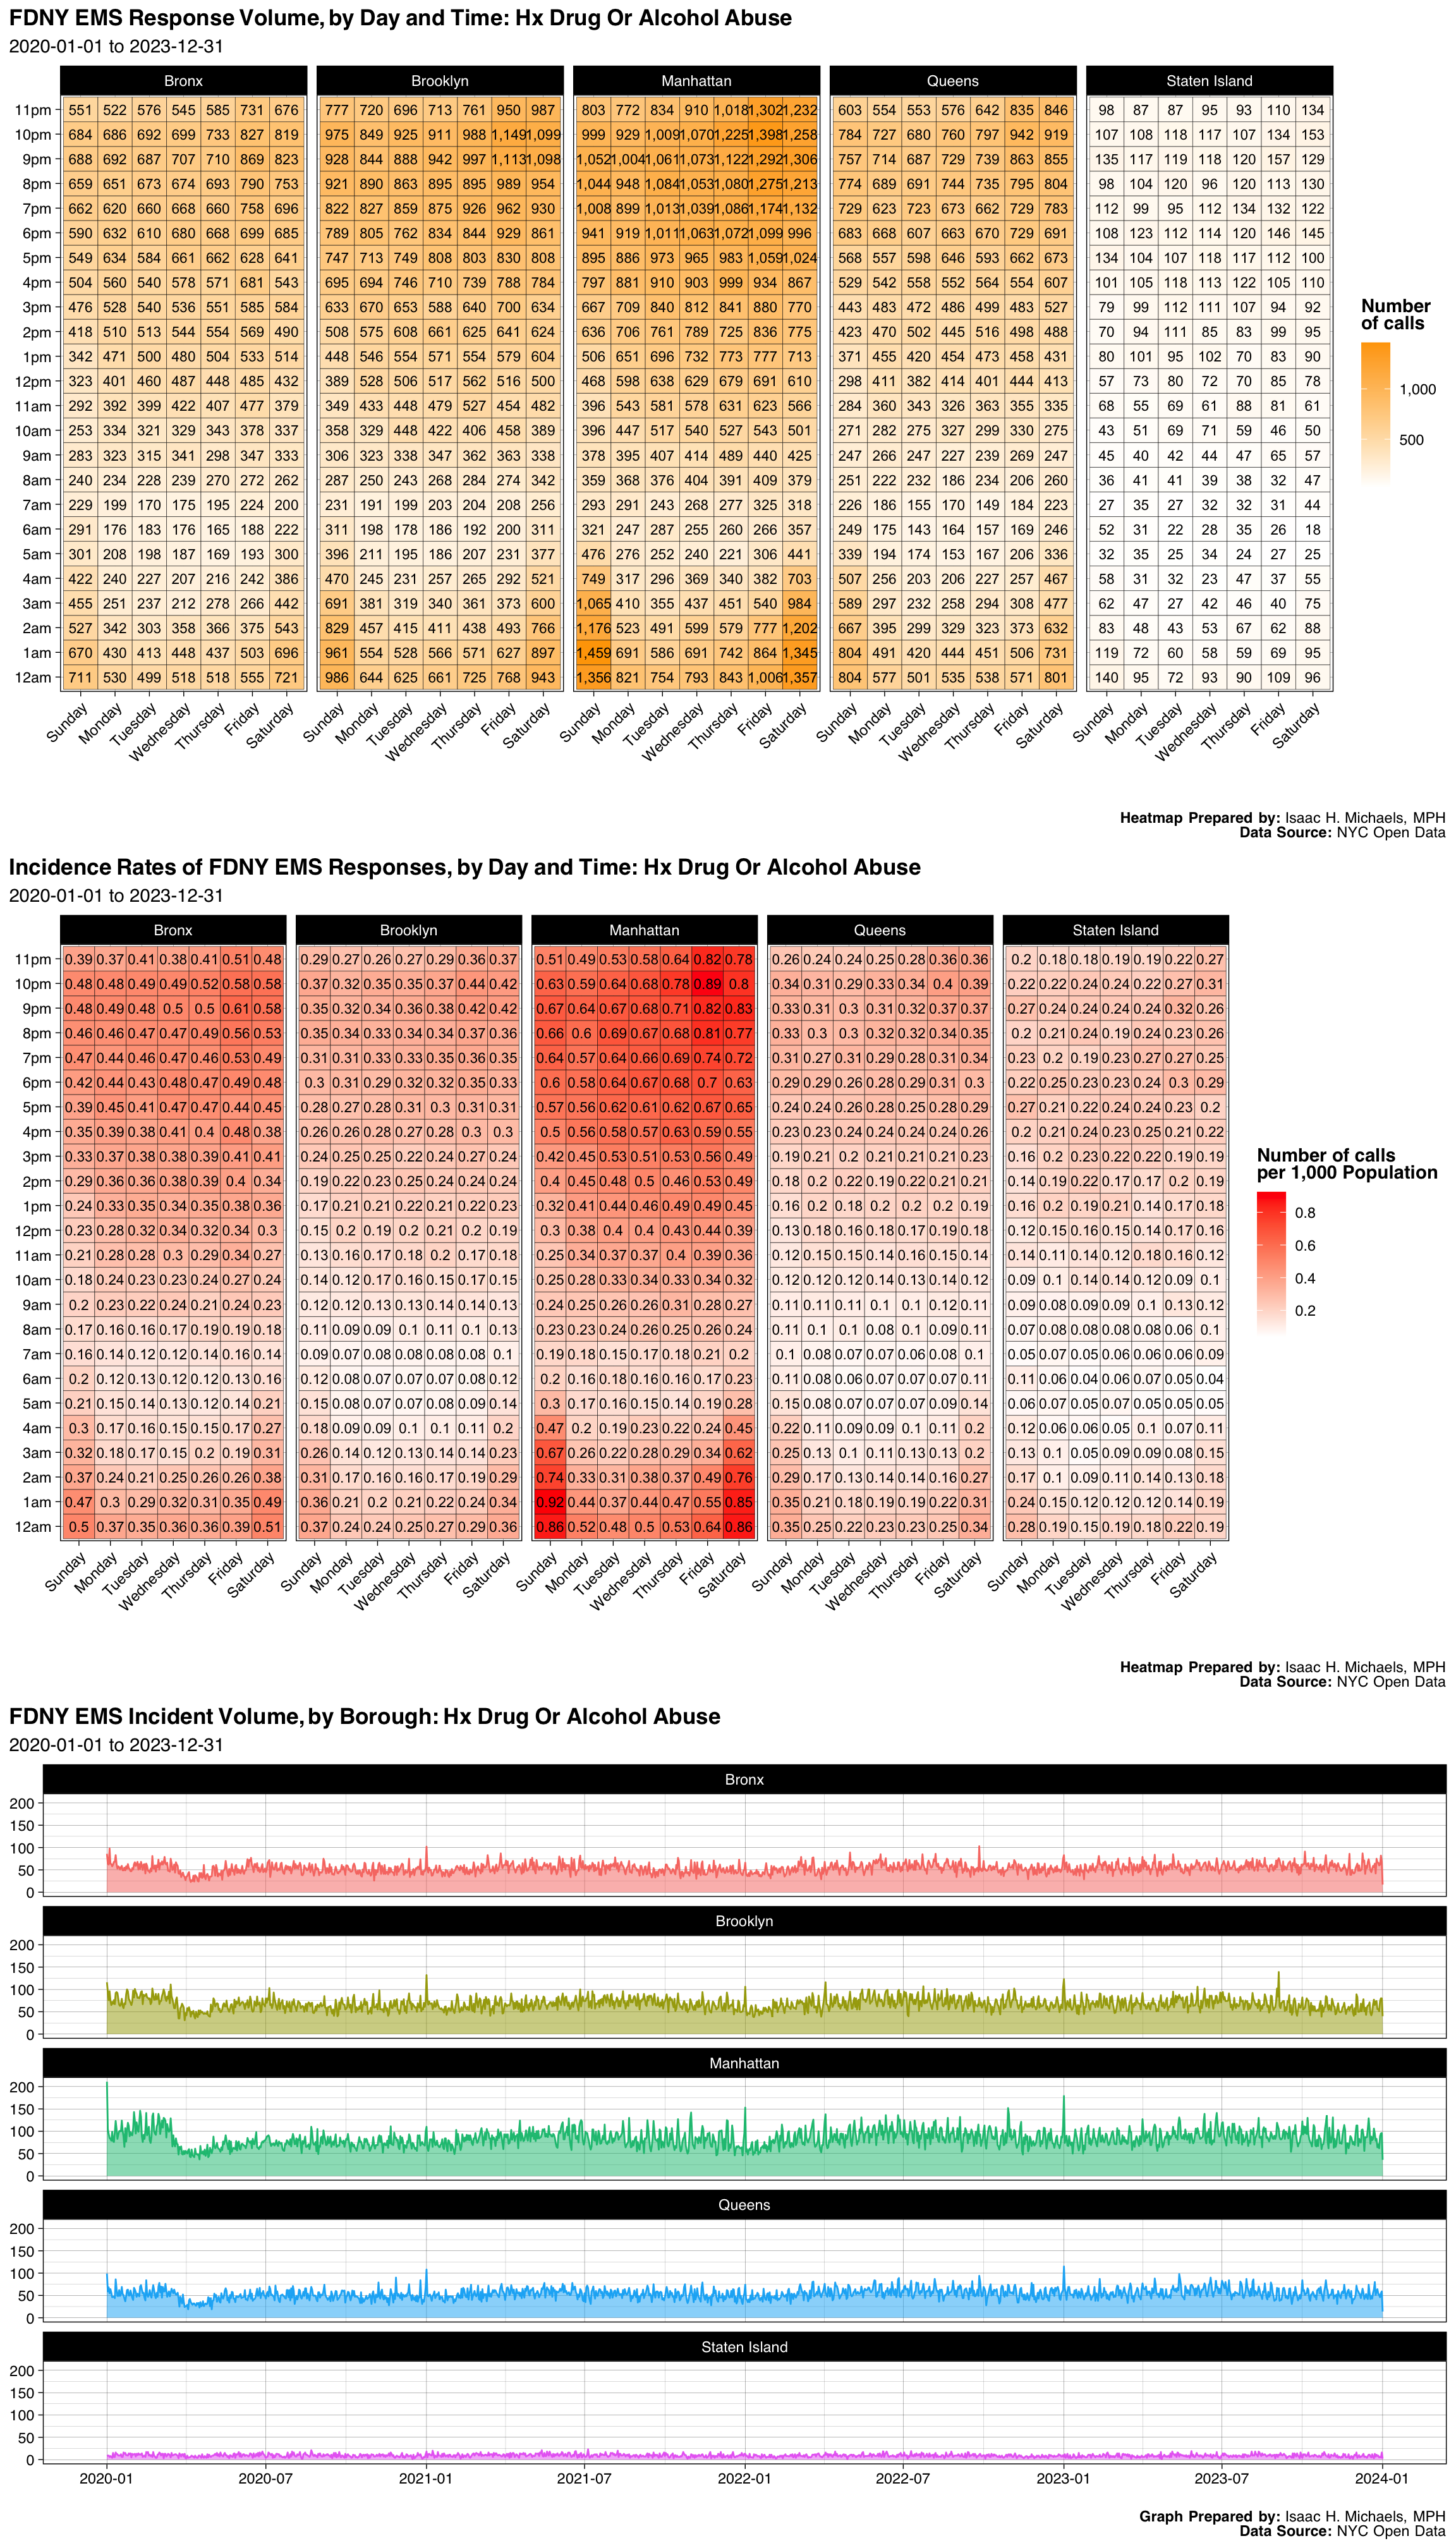
Hx Drug Or Alcohol Abuse
| Borough | Number | Percent |
|---|---|---|
| Bronx | 78738 | 0.2003766 |
| Brooklyn | 98879 | 0.2516325 |
| Manhattan | 123098 | 0.3132663 |
| Queens | 78883 | 0.2007456 |
| Staten Island | 13352 | 0.0339789 |
| Final Severity Level | Number | Percent |
|---|---|---|
| 1 | 1 | 2.54485303473724e-06 |
| 2 | 64 | 0.000162870594223184 |
| 3 | 494 | 0.0012571573991602 |
| 4 | 392390 | 0.998574882300547 |
| 5 | 0 | 0% |
| 6 | 1 | 2.54485303473724e-06 |
| 7 | 0 | 0% |
| 8 | 0 | 0% |
| Disposition | Number | Percent |
|---|---|---|
| Transporting Patient | 237168 | 0.6035577 |
| Refused Medical Aid | 59301 | 0.1509123 |
| Unfounded | 39731 | 0.1011096 |
| Patient Gone on Arrival | 30829 | 0.0784553 |
| Condition Corrected | 14208 | 0.0361573 |
| Cancelled | 8902 | 0.0226543 |
| Other | 2301 | 0.0058557 |
| Triaged at Scene No Transport | 275 | 0.0006998 |
| Treated and Transported | 170 | 0.0004326 |
| Patient Pronounced Dead | 58 | 0.0001476 |
| Treated Not Transported | 7 | 0.0000178 |
Graphs, Heatmaps, and Tables Prepared By: Isaac H. Michaels, MPH
Data Source: NYC Open Data
Back to top
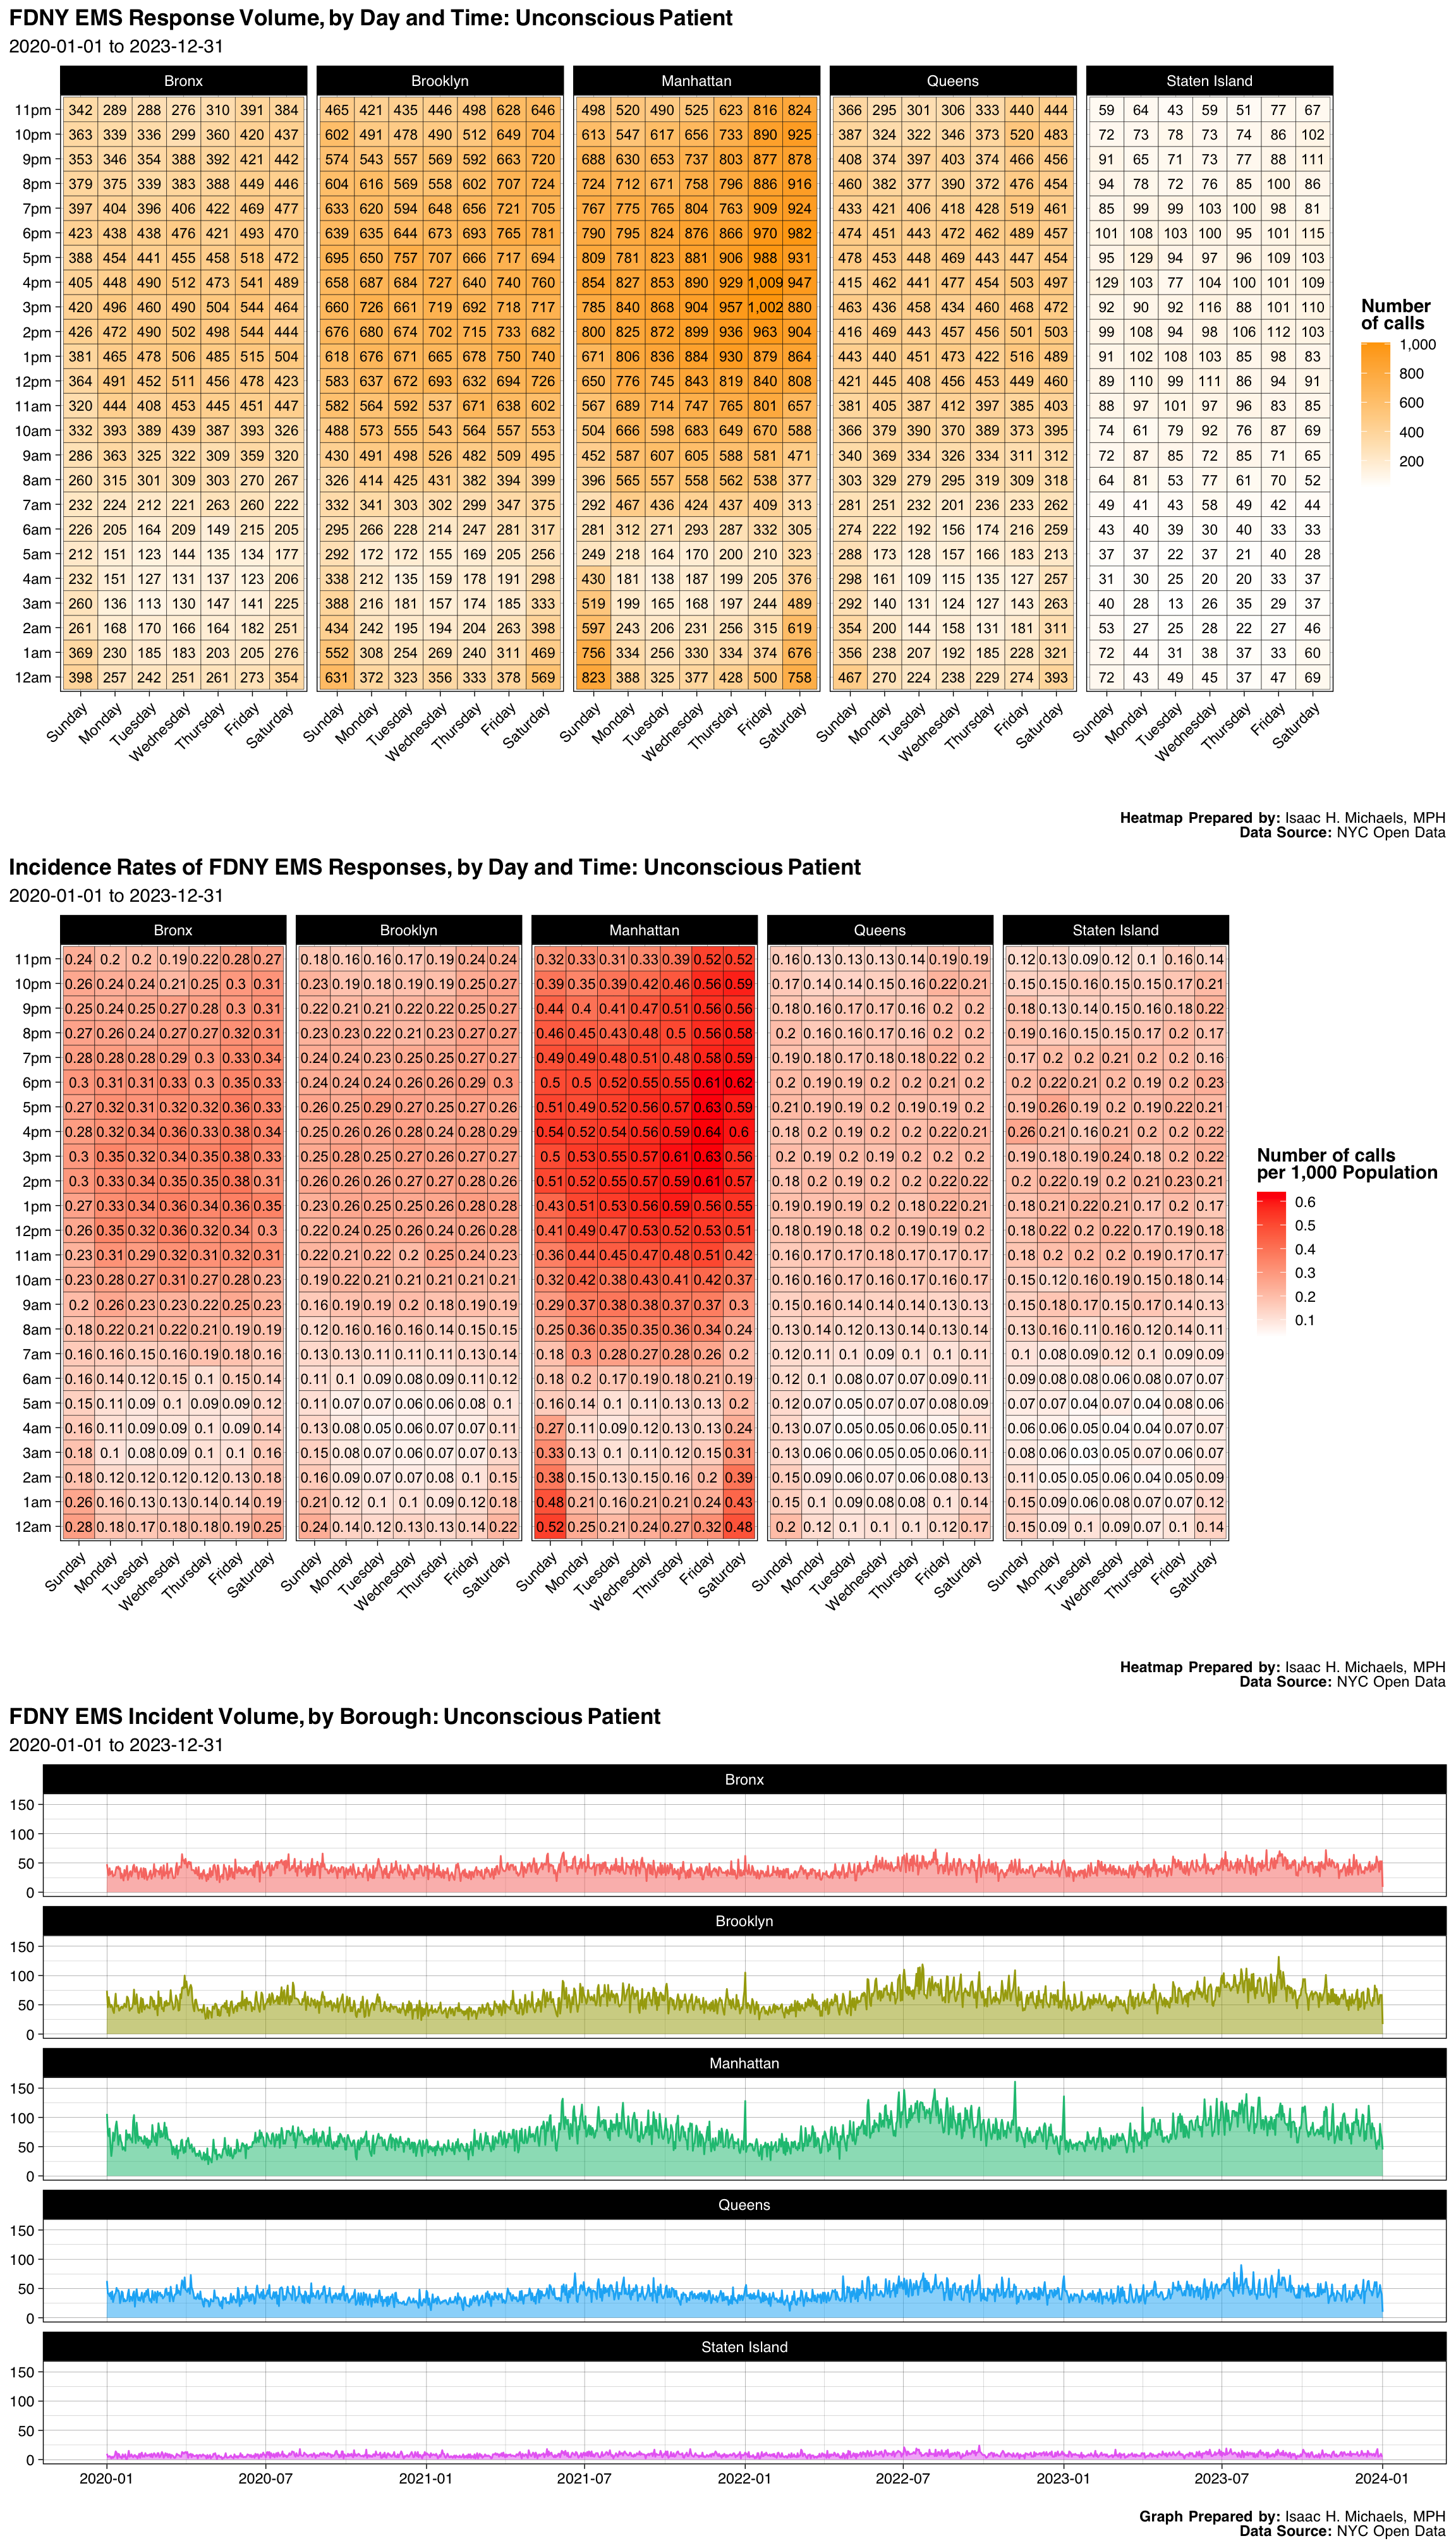
Unconscious Patient
| Borough | Number | Percent |
|---|---|---|
| Bronx | 57553 | 0.1815890 |
| Brooklyn | 84671 | 0.2671507 |
| Manhattan | 103988 | 0.3280989 |
| Queens | 58696 | 0.1851954 |
| Staten Island | 12033 | 0.0379661 |
| Final Severity Level | Number | Percent |
|---|---|---|
| 1 | 56 | 0.000176689036760785 |
| 2 | 316870 | 0.999775983542678 |
| 3 | 4 | 1.26206454829132e-05 |
| 4 | 10 | 3.15516137072831e-05 |
| 5 | 0 | 0% |
| 6 | 1 | 3.15516137072831e-06 |
| 7 | 0 | 0% |
| 8 | 0 | 0% |
| Disposition | Number | Percent |
|---|---|---|
| Transporting Patient | 172246 | 0.5434639 |
| Refused Medical Aid | 58105 | 0.1833307 |
| Unfounded | 50254 | 0.1585595 |
| Patient Gone on Arrival | 23471 | 0.0740548 |
| Cancelled | 5711 | 0.0180191 |
| Patient Pronounced Dead | 3685 | 0.0116268 |
| Condition Corrected | 2821 | 0.0089007 |
| Other | 370 | 0.0011674 |
| Treated and Transported | 247 | 0.0007793 |
| Triaged at Scene No Transport | 26 | 0.0000820 |
| Treated Not Transported | 5 | 0.0000158 |
Graphs, Heatmaps, and Tables Prepared By: Isaac H. Michaels, MPH
Data Source: NYC Open Data
Back to top
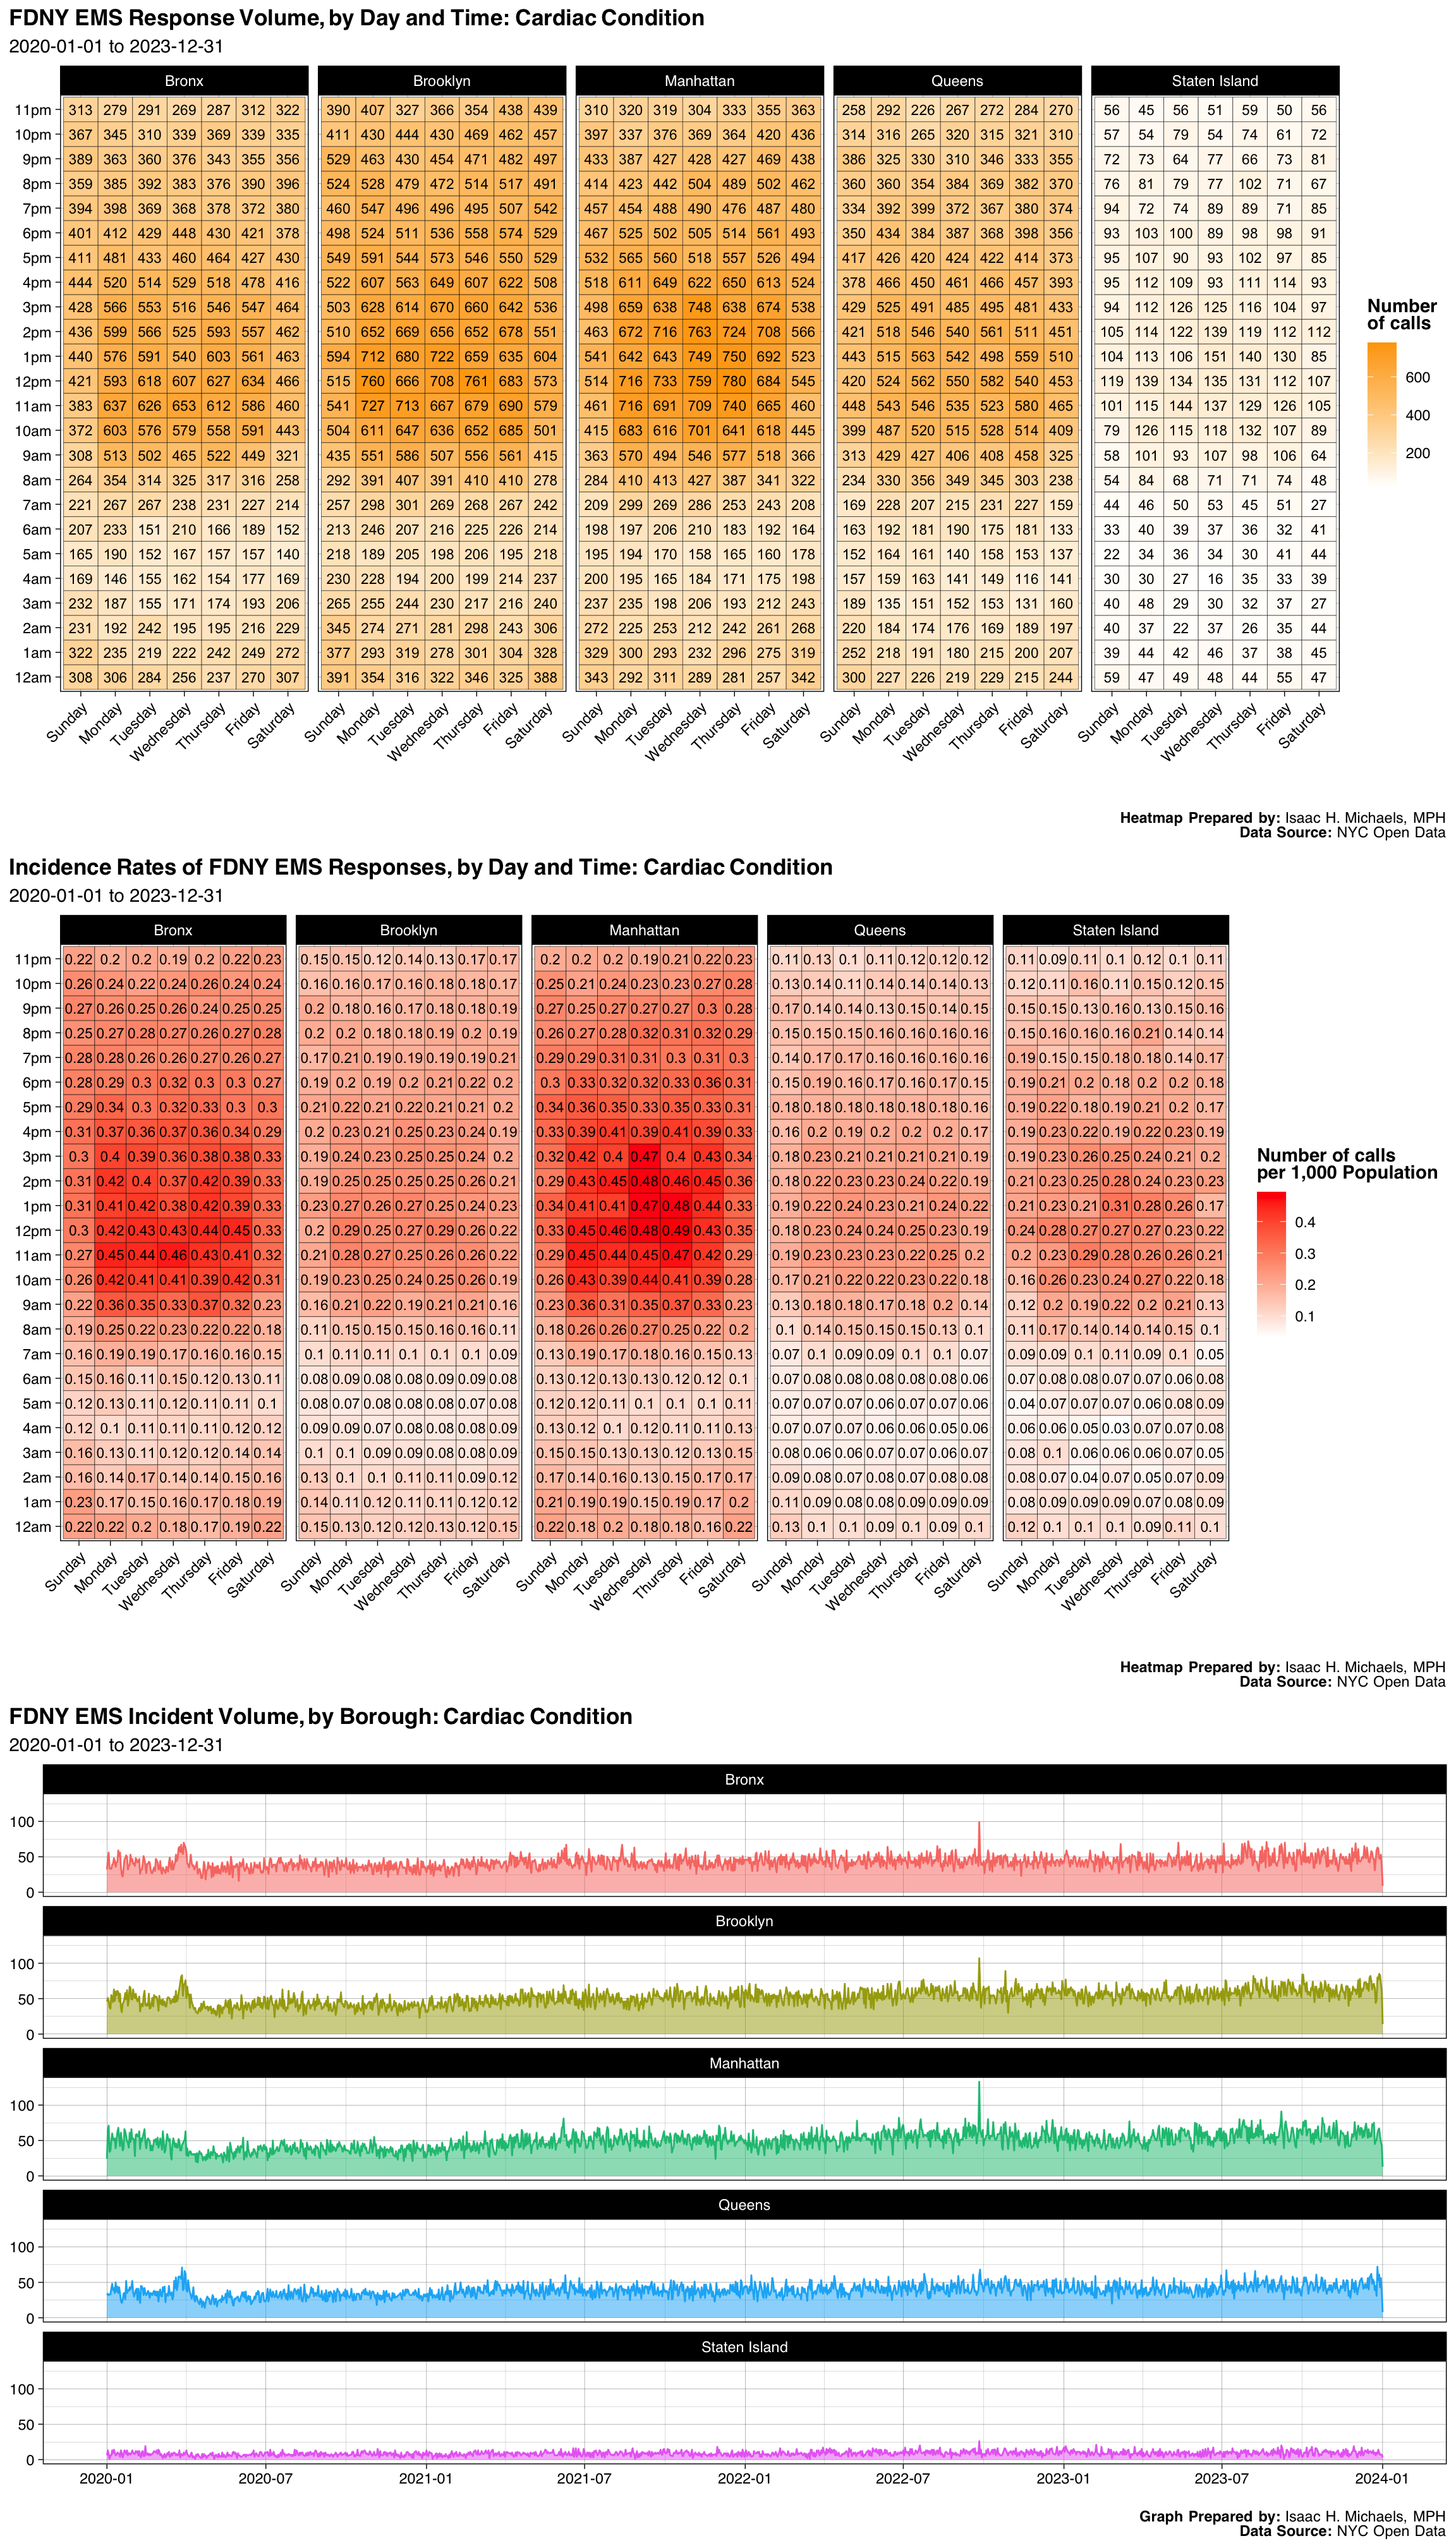
Cardiac Condition
| Borough | Number | Percent |
|---|---|---|
| Bronx | 61588 | 0.2212372 |
| Brooklyn | 75530 | 0.2713198 |
| Manhattan | 71982 | 0.2585746 |
| Queens | 56582 | 0.2032545 |
| Staten Island | 12697 | 0.0456103 |
| Unknown | 1 | 0.0000036 |
| Final Severity Level | Number | Percent |
|---|---|---|
| 1 | 1 | 3.59221208420145e-06 |
| 2 | 14 | 5.02909691788203e-05 |
| 3 | 278342 | 0.9998634959408 |
| 4 | 16 | 5.74753933472232e-05 |
| 5 | 1 | 3.59221208420145e-06 |
| 6 | 5 | 1.79610604210073e-05 |
| 7 | 1 | 3.59221208420145e-06 |
| 8 | 0 | 0% |
| Disposition | Number | Percent |
|---|---|---|
| Transporting Patient | 211681 | 0.7604030 |
| Refused Medical Aid | 52332 | 0.1879876 |
| Unfounded | 6875 | 0.0246965 |
| Patient Gone on Arrival | 4557 | 0.0163697 |
| Cancelled | 1986 | 0.0071341 |
| Condition Corrected | 416 | 0.0014944 |
| Treated and Transported | 218 | 0.0007831 |
| Other | 187 | 0.0006717 |
| Triaged at Scene No Transport | 79 | 0.0002838 |
| Patient Pronounced Dead | 44 | 0.0001581 |
| Treated Not Transported | 5 | 0.0000180 |
Graphs, Heatmaps, and Tables Prepared By: Isaac H. Michaels, MPH
Data Source: NYC Open Data
Back to top
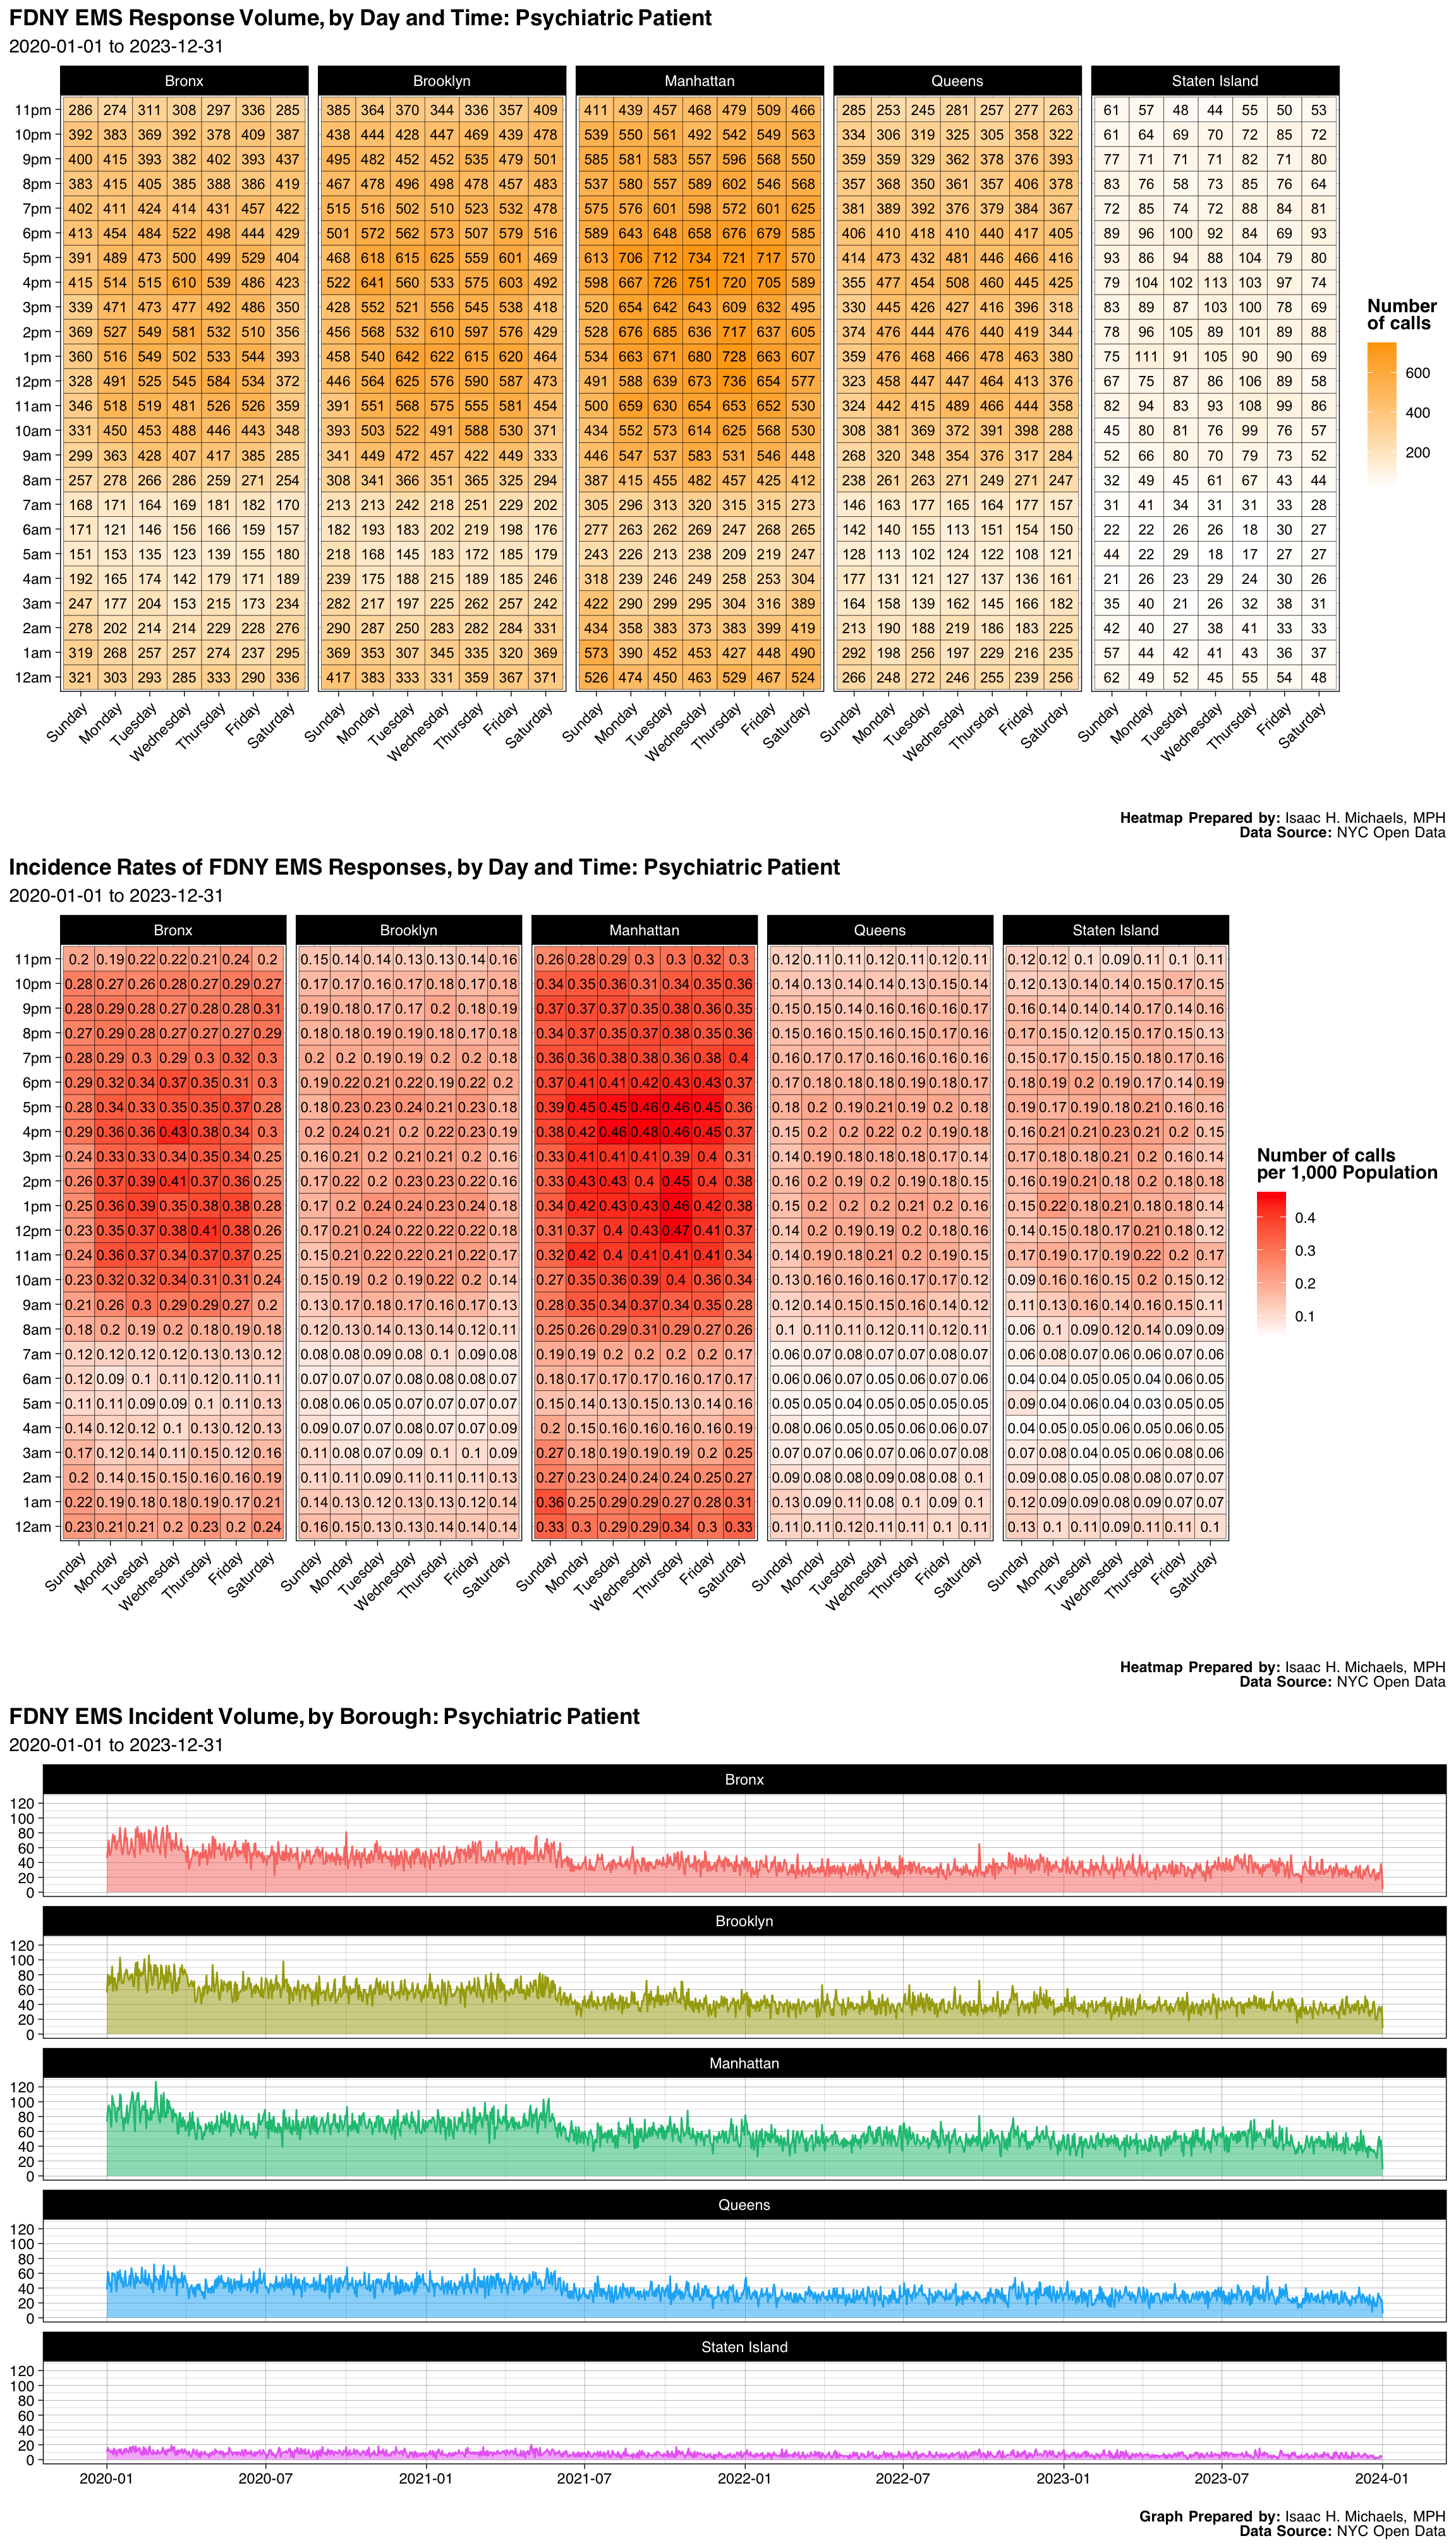
Psychiatric Patient
| Borough | Number | Percent |
|---|---|---|
| Bronx | 59020 | 0.2136648 |
| Brooklyn | 69478 | 0.2515250 |
| Manhattan | 84787 | 0.3069468 |
| Queens | 52237 | 0.1891090 |
| Staten Island | 10705 | 0.0387544 |
| Final Severity Level | Number | Percent |
|---|---|---|
| 1 | 1 | 3.62021091348782e-06 |
| 2 | 90 | 0.000325818982213904 |
| 3 | 987 | 0.00357314817161248 |
| 4 | 90 | 0.000325818982213904 |
| 5 | 11 | 3.9822320048366e-05 |
| 6 | 2 | 7.24042182697564e-06 |
| 7 | 275046 | 0.995724530911171 |
| 8 | 0 | 0% |
| Disposition | Number | Percent |
|---|---|---|
| Transporting Patient | 157323 | 0.5695424 |
| Unfounded | 36854 | 0.1334193 |
| Condition Corrected | 20820 | 0.0753728 |
| Patient Gone on Arrival | 20462 | 0.0740768 |
| Refused Medical Aid | 18427 | 0.0667096 |
| Cancelled | 14321 | 0.0518450 |
| Other | 7172 | 0.0259642 |
| Treated and Transported | 737 | 0.0026681 |
| Patient Pronounced Dead | 55 | 0.0001991 |
| Triaged at Scene No Transport | 42 | 0.0001520 |
| Treated Not Transported | 14 | 0.0000507 |
Graphs, Heatmaps, and Tables Prepared By: Isaac H. Michaels, MPH
Data Source: NYC Open Data
Back to top
Abdominal Pain
| Borough | Number | Percent |
|---|---|---|
| Bronx | 63764 | 0.2874583 |
| Brooklyn | 61216 | 0.2759715 |
| Manhattan | 45937 | 0.2070913 |
| Queens | 42778 | 0.1928501 |
| Staten Island | 8125 | 0.0366288 |
| Final Severity Level | Number | Percent |
|---|---|---|
| 1 | 0 | 0% |
| 2 | 3 | 1.35244793075467e-05 |
| 3 | 46 | 0.000207375349382382 |
| 4 | 1903 | 0.00857902804075376 |
| 5 | 219867 | 0.991195563970787 |
| 6 | 1 | 4.50815976918222e-06 |
| 7 | 0 | 0% |
| 8 | 0 | 0% |
| Disposition | Number | Percent |
|---|---|---|
| Transporting Patient | 189547 | 0.8545082 |
| Refused Medical Aid | 22241 | 0.1002660 |
| Unfounded | 4853 | 0.0218781 |
| Patient Gone on Arrival | 2945 | 0.0132765 |
| Cancelled | 1224 | 0.0055180 |
| Other | 597 | 0.0026914 |
| Condition Corrected | 304 | 0.0013705 |
| Treated and Transported | 59 | 0.0002660 |
| Triaged at Scene No Transport | 44 | 0.0001984 |
| Patient Pronounced Dead | 6 | 0.0000270 |
Graphs, Heatmaps, and Tables Prepared By: Isaac H. Michaels, MPH
Data Source: NYC Open Data
Back to top
Major Injury
| Borough | Number | Percent |
|---|---|---|
| Bronx | 43434 | 0.2104768 |
| Brooklyn | 52877 | 0.2562367 |
| Manhattan | 55331 | 0.2681285 |
| Queens | 44279 | 0.2145716 |
| Staten Island | 10439 | 0.0505864 |
| Final Severity Level | Number | Percent |
|---|---|---|
| 1 | 1 | 4.84590036828843e-06 |
| 2 | 35 | 0.000169606512890095 |
| 3 | 206087 | 0.998677069199457 |
| 4 | 232 | 0.00112424888544292 |
| 5 | 4 | 1.93836014731537e-05 |
| 6 | 0 | 0% |
| 7 | 1 | 4.84590036828843e-06 |
| 8 | 0 | 0% |
| Disposition | Number | Percent |
|---|---|---|
| Transporting Patient | 153013 | 0.7414858 |
| Refused Medical Aid | 36055 | 0.1747189 |
| Unfounded | 7456 | 0.0361310 |
| Patient Gone on Arrival | 5181 | 0.0251066 |
| Condition Corrected | 2195 | 0.0106368 |
| Cancelled | 2058 | 0.0099729 |
| Other | 180 | 0.0008723 |
| Treated and Transported | 172 | 0.0008335 |
| Patient Pronounced Dead | 25 | 0.0001211 |
| Triaged at Scene No Transport | 23 | 0.0001115 |
| Treated Not Transported | 2 | 0.0000097 |
Graphs, Heatmaps, and Tables Prepared By: Isaac H. Michaels, MPH
Data Source: NYC Open Data
Back to top
Difficult Breather
| Borough | Number | Percent |
|---|---|---|
| Bronx | 45749 | 0.2712177 |
| Brooklyn | 46665 | 0.2766481 |
| Manhattan | 35713 | 0.2117204 |
| Queens | 32817 | 0.1945518 |
| Staten Island | 7736 | 0.0458620 |
| Final Severity Level | Number | Percent |
|---|---|---|
| 1 | 2 | 1.18567702157932e-05 |
| 2 | 168609 | 0.999579084657339 |
| 3 | 12 | 7.11406212947593e-05 |
| 4 | 56 | 0.00033198956604221 |
| 5 | 1 | 5.92838510789661e-06 |
| 6 | 0 | 0% |
| 7 | 0 | 0% |
| 8 | 0 | 0% |
| Disposition | Number | Percent |
|---|---|---|
| Transporting Patient | 131024 | 0.7767607 |
| Refused Medical Aid | 28583 | 0.1694510 |
| Unfounded | 4873 | 0.0288890 |
| Patient Gone on Arrival | 2023 | 0.0119931 |
| Cancelled | 1062 | 0.0062959 |
| Condition Corrected | 699 | 0.0041439 |
| Treated and Transported | 141 | 0.0008359 |
| Patient Pronounced Dead | 136 | 0.0008063 |
| Other | 122 | 0.0007233 |
| Triaged at Scene No Transport | 14 | 0.0000830 |
| Treated Not Transported | 3 | 0.0000178 |
Graphs, Heatmaps, and Tables Prepared By: Isaac H. Michaels, MPH
Data Source: NYC Open Data
Back to top
Auto Acc W/Injuries
| Borough | Number | Percent |
|---|---|---|
| Bronx | 33571 | 0.2128195 |
| Brooklyn | 45557 | 0.2888034 |
| Manhattan | 19434 | 0.1231996 |
| Queens | 50708 | 0.3214576 |
| Staten Island | 8474 | 0.0537200 |
| Final Severity Level | Number | Percent |
|---|---|---|
| 1 | 0 | 0% |
| 2 | 131 | 0.00083045947864895 |
| 3 | 91 | 0.000576884065321026 |
| 4 | 157522 | 0.99859265645603 |
| 5 | 0 | 0% |
| 6 | 0 | 0% |
| 7 | 0 | 0% |
| 8 | 0 | 0% |
| Disposition | Number | Percent |
|---|---|---|
| Transporting Patient | 59936 | 0.3799574 |
| Refused Medical Aid | 48396 | 0.3068009 |
| Condition Corrected | 26500 | 0.1679937 |
| Unfounded | 12206 | 0.0773785 |
| Cancelled | 5621 | 0.0356337 |
| Patient Gone on Arrival | 3840 | 0.0243432 |
| Other | 1097 | 0.0069543 |
| Treated and Transported | 128 | 0.0008114 |
| Patient Pronounced Dead | 8 | 0.0000507 |
| Treated Not Transported | 7 | 0.0000444 |
| Triaged at Scene No Transport | 5 | 0.0000317 |
Graphs, Heatmaps, and Tables Prepared By: Isaac H. Michaels, MPH
Data Source: NYC Open Data
Back to top
Altered Mental Status
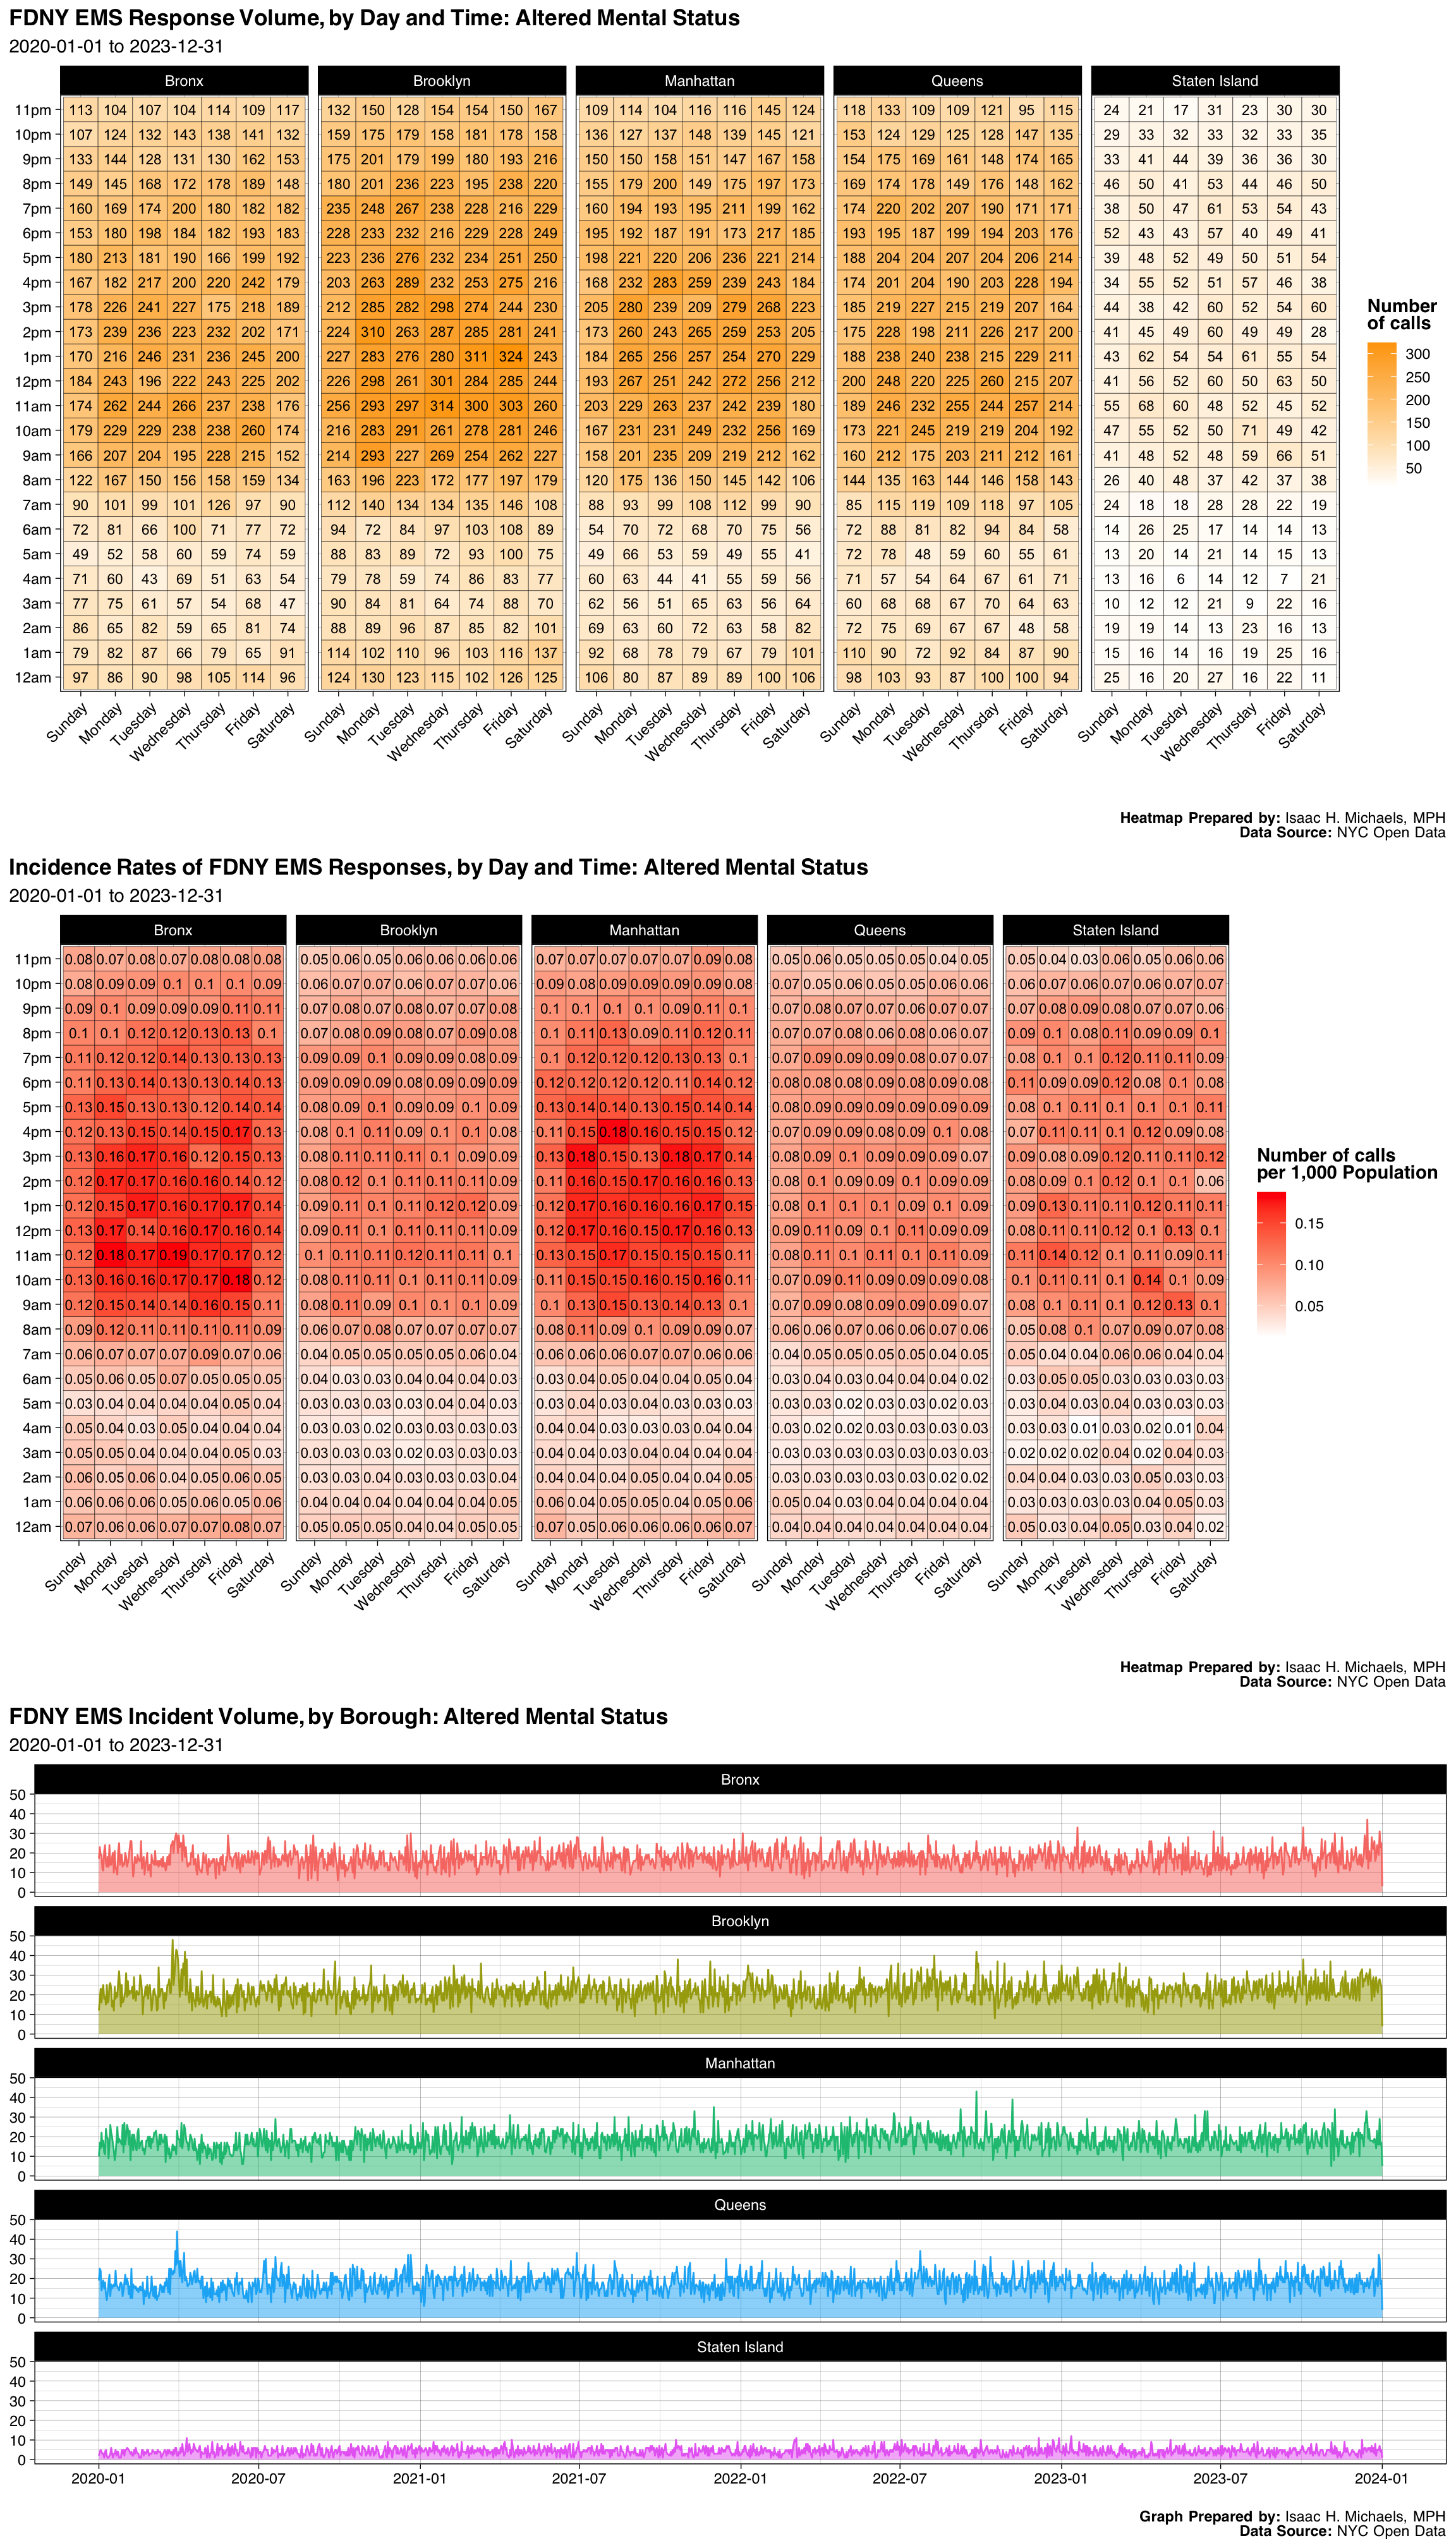
| Borough | Number | Percent |
|---|---|---|
| Bronx | 24860 | 0.2174864 |
| Brooklyn | 31753 | 0.2777894 |
| Manhattan | 26144 | 0.2287194 |
| Queens | 25449 | 0.2226392 |
| Staten Island | 6100 | 0.0533655 |
| Final Severity Level | Number | Percent |
|---|---|---|
| 1 | 1 | 8.74844715063076e-06 |
| 2 | 11 | 9.62329186569384e-05 |
| 3 | 114285 | 0.999816282609837 |
| 4 | 9 | 7.87360243556769e-05 |
| 5 | 0 | 0% |
| 6 | 0 | 0% |
| 7 | 0 | 0% |
| 8 | 0 | 0% |
| Disposition | Number | Percent |
|---|---|---|
| Transporting Patient | 88217 | 0.7717618 |
| Refused Medical Aid | 18894 | 0.1652932 |
| Unfounded | 3679 | 0.0321855 |
| Patient Gone on Arrival | 1976 | 0.0172869 |
| Cancelled | 785 | 0.0068675 |
| Condition Corrected | 547 | 0.0047854 |
| Treated and Transported | 95 | 0.0008311 |
| Patient Pronounced Dead | 56 | 0.0004899 |
| Other | 47 | 0.0004112 |
| Triaged at Scene No Transport | 10 | 0.0000875 |
Graphs, Heatmaps, and Tables Prepared By: Isaac H. Michaels, MPH
Data Source: NYC Open Data
Back to top
Cardiac Arrest
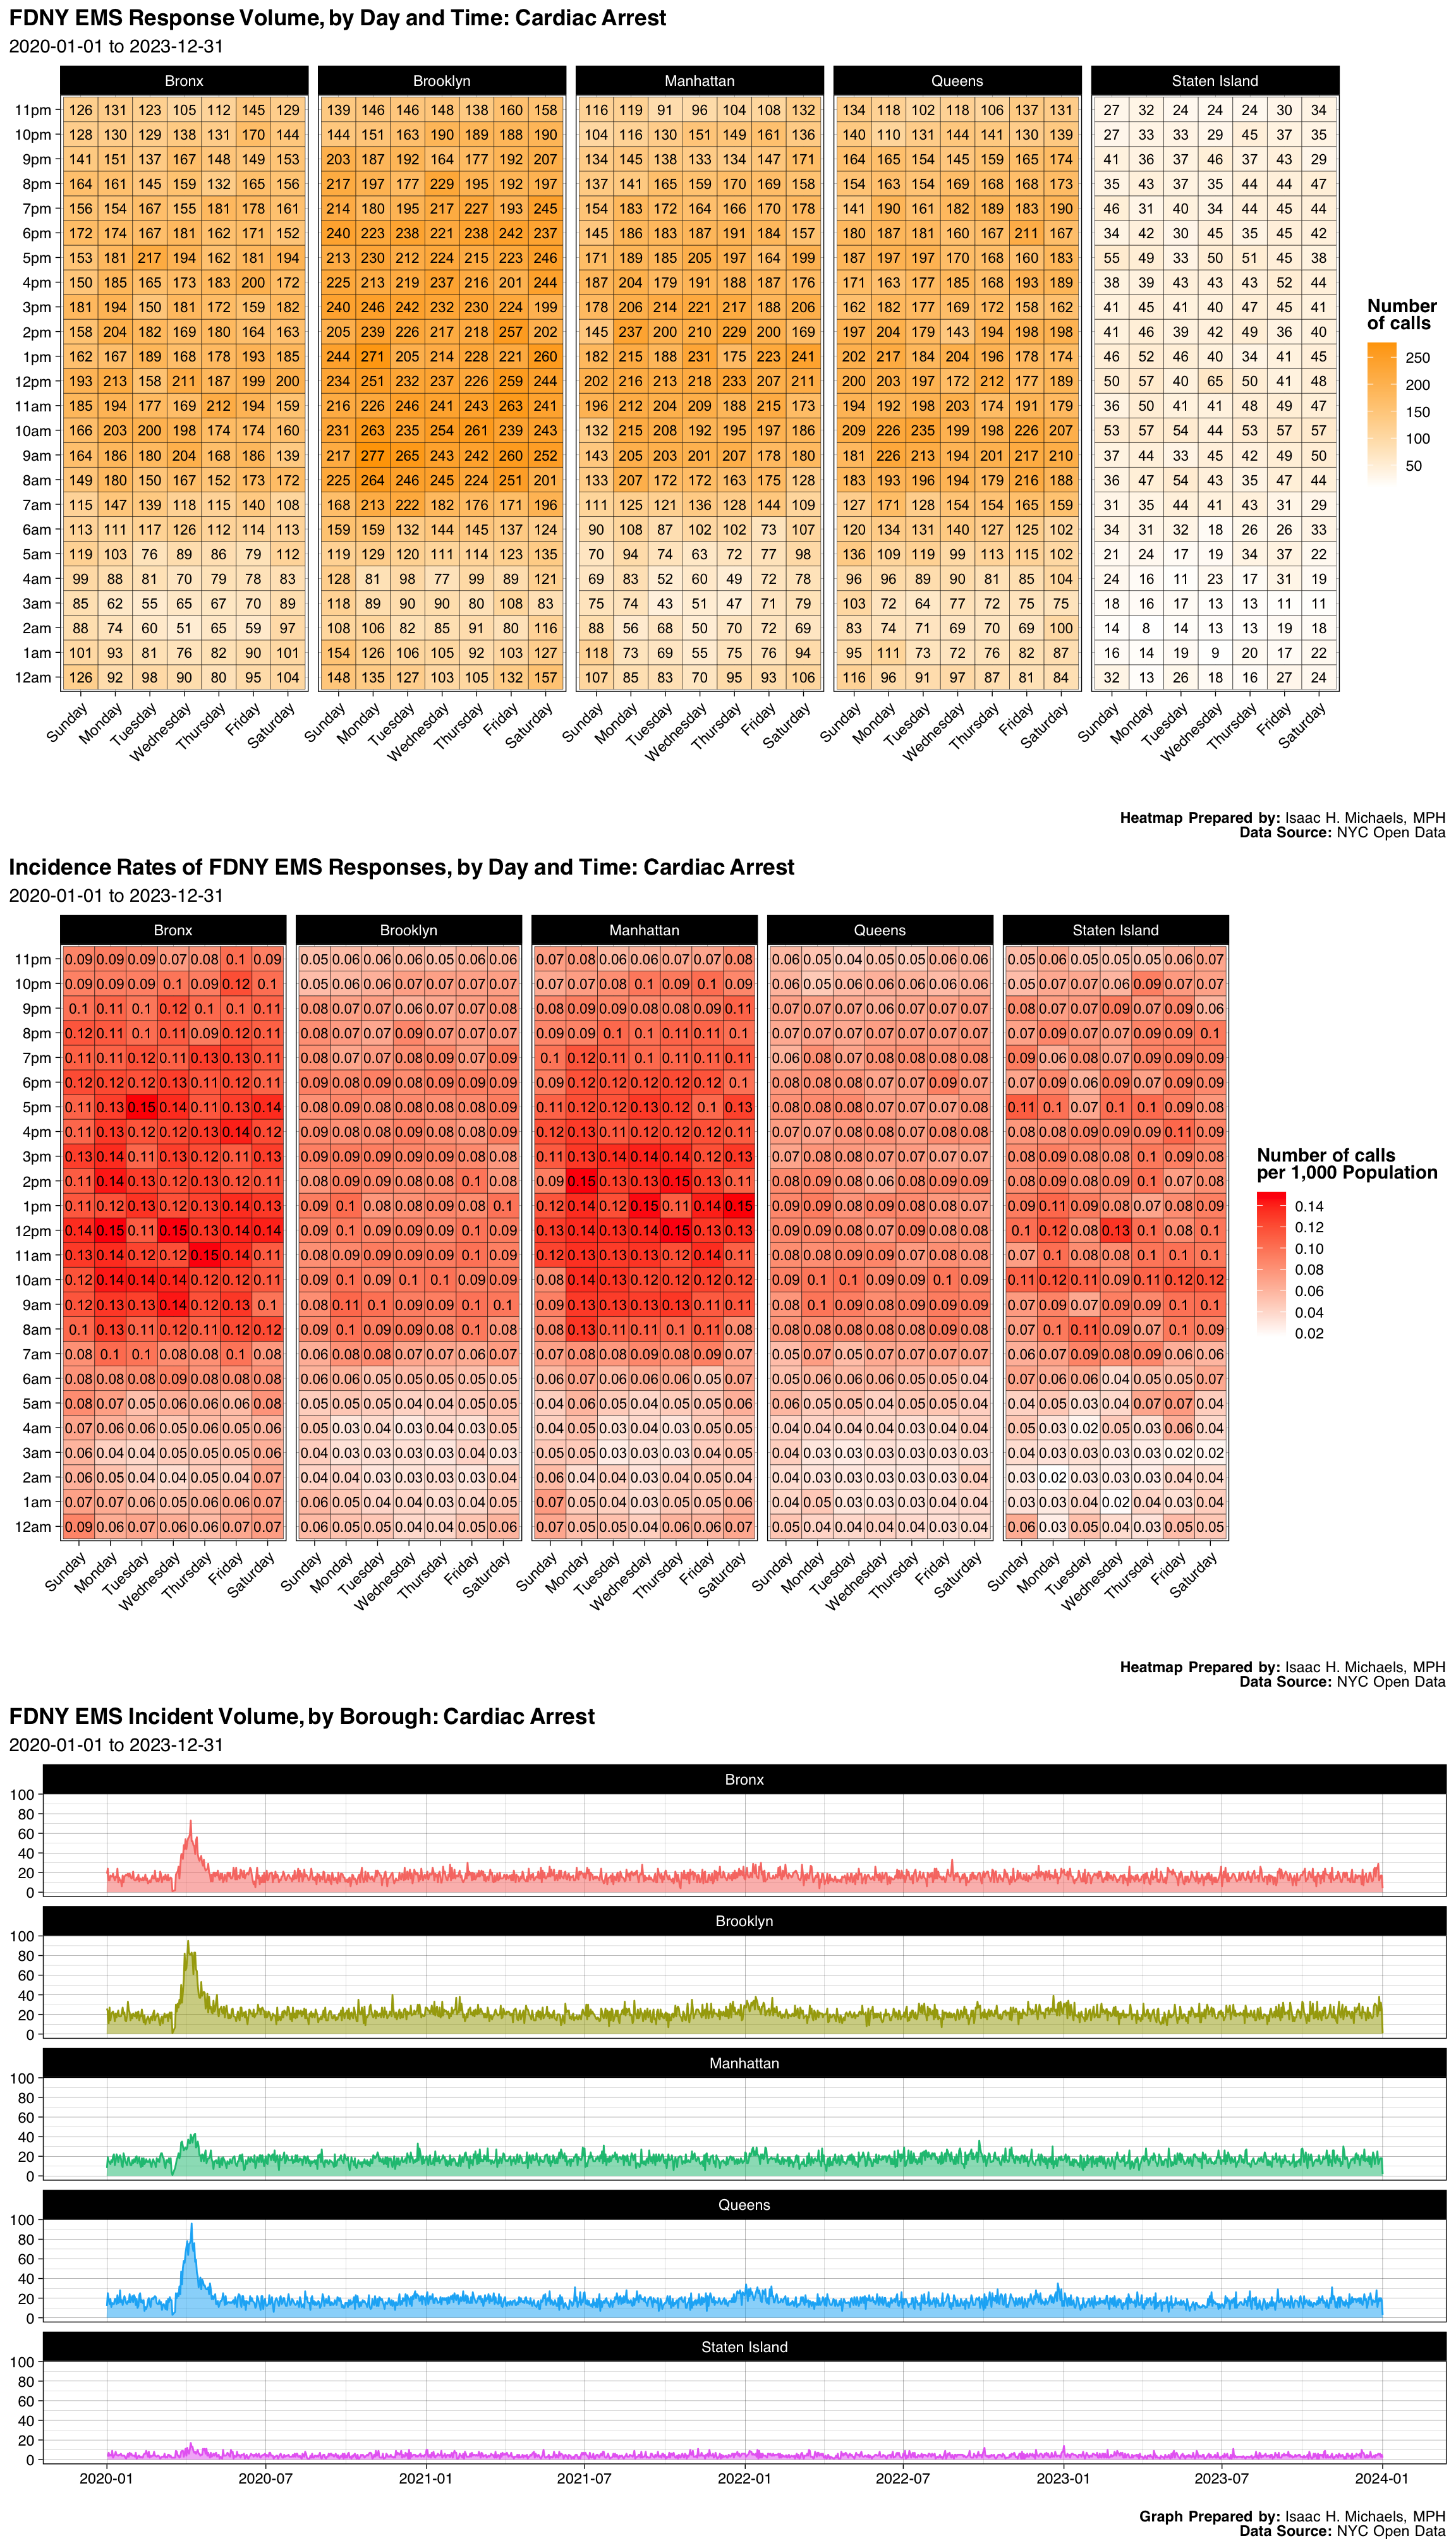
| Borough | Number | Percent |
|---|---|---|
| Bronx | 24013 | 0.2154502 |
| Brooklyn | 31439 | 0.2820780 |
| Manhattan | 24486 | 0.2196940 |
| Queens | 25568 | 0.2294020 |
| Staten Island | 5949 | 0.0533758 |
| Final Severity Level | Number | Percent |
|---|---|---|
| 1 | 111431 | 0.999784666457315 |
| 2 | 17 | 0.000152527926068817 |
| 3 | 3 | 2.69166928356736e-05 |
| 4 | 3 | 2.69166928356736e-05 |
| 5 | 0 | 0% |
| 6 | 1 | 8.97223094522453e-06 |
| 7 | 0 | 0% |
| 8 | 0 | 0% |
| Disposition | Number | Percent |
|---|---|---|
| Patient Pronounced Dead | 48248 | 0.4328922 |
| Transporting Patient | 47673 | 0.4277332 |
| Unfounded | 6736 | 0.0604369 |
| Refused Medical Aid | 5050 | 0.0453098 |
| Patient Gone on Arrival | 1608 | 0.0144273 |
| Cancelled | 1598 | 0.0143376 |
| Condition Corrected | 249 | 0.0022341 |
| Other | 187 | 0.0016778 |
| Treated and Transported | 103 | 0.0009241 |
| Triaged at Scene No Transport | 3 | 0.0000269 |
Graphs, Heatmaps, and Tables Prepared By: Isaac H. Michaels, MPH
Data Source: NYC Open Data
Back to top
Diff Breathing - Fever&Cough
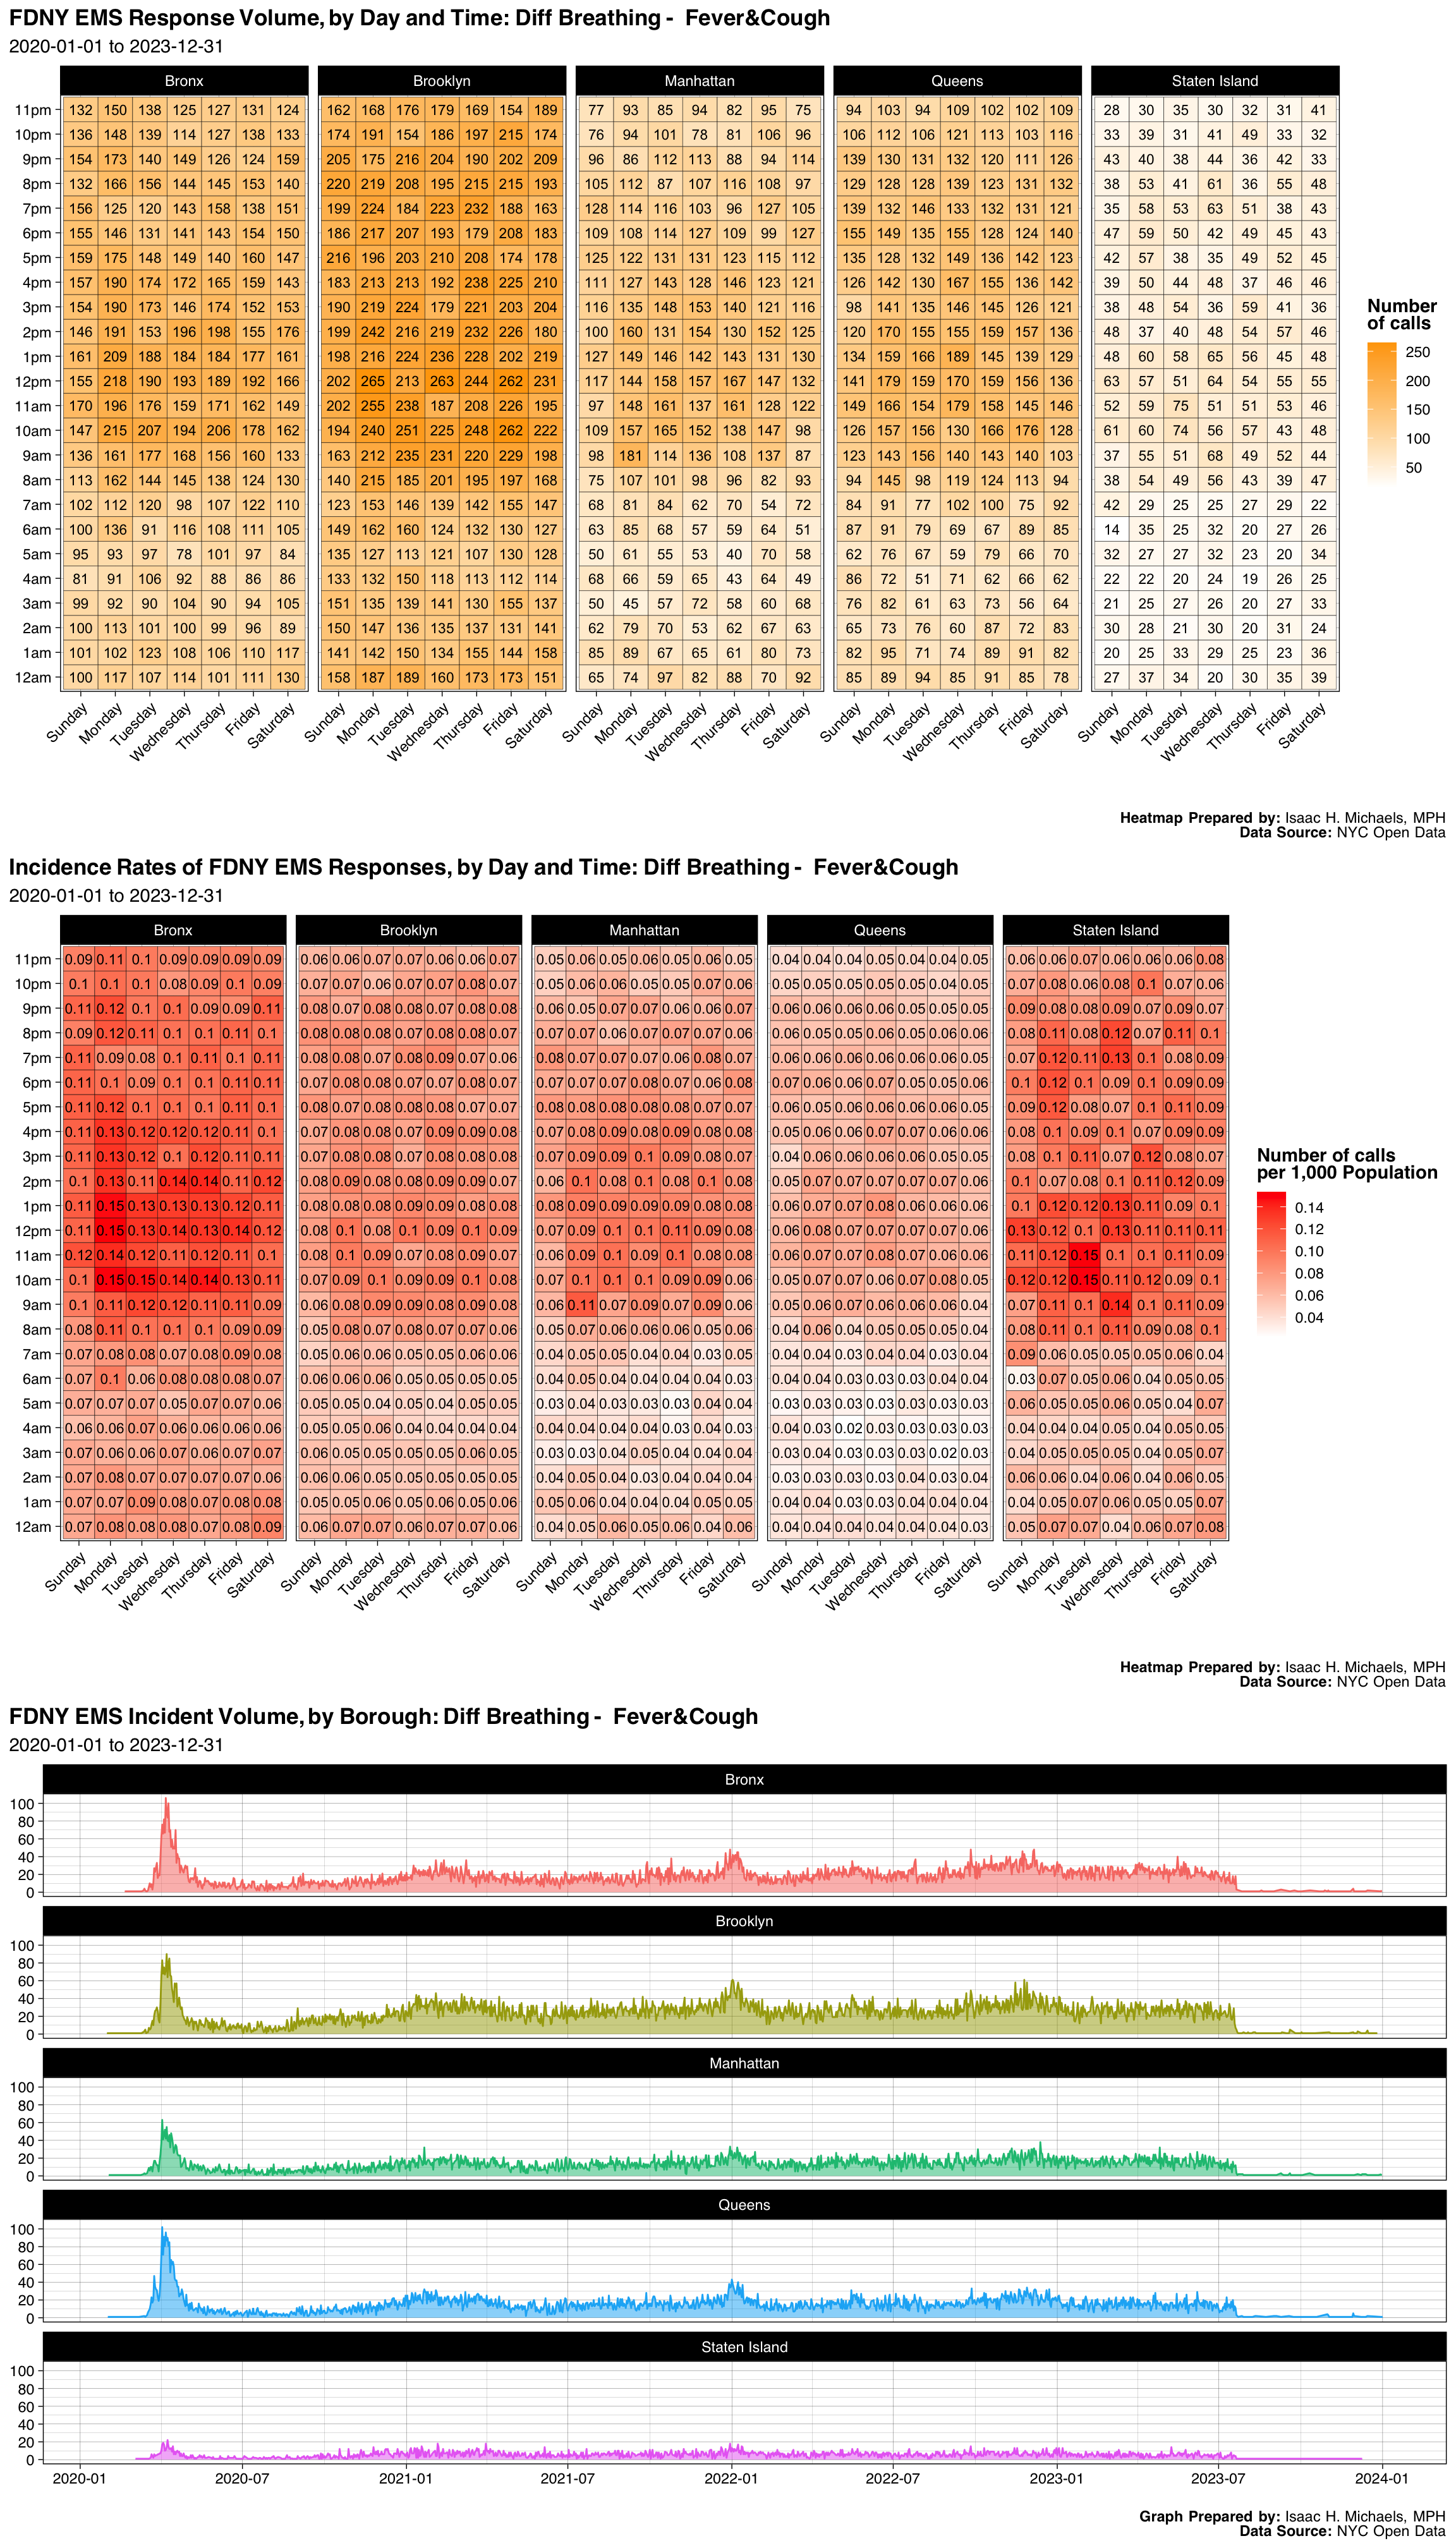
| Borough | Number | Percent |
|---|---|---|
| Bronx | 23367 | 0.2393375 |
| Brooklyn | 31000 | 0.3175188 |
| Manhattan | 17005 | 0.1741745 |
| Queens | 19467 | 0.1993916 |
| Staten Island | 6793 | 0.0695776 |
| Final Severity Level | Number | Percent |
|---|---|---|
| 1 | 0 | 0% |
| 2 | 97611 | 0.999784906588004 |
| 3 | 11 | 0.000112667977712225 |
| 4 | 10 | 0.000102425434283841 |
| 5 | 0 | 0% |
| 6 | 0 | 0% |
| 7 | 0 | 0% |
| 8 | 0 | 0% |
| Disposition | Number | Percent |
|---|---|---|
| Transporting Patient | 78943 | 0.8085771 |
| Refused Medical Aid | 15194 | 0.1556252 |
| Unfounded | 1868 | 0.0191331 |
| Patient Gone on Arrival | 726 | 0.0074361 |
| Cancelled | 451 | 0.0046194 |
| Condition Corrected | 240 | 0.0024582 |
| Treated and Transported | 90 | 0.0009218 |
| Other | 50 | 0.0005121 |
| Patient Pronounced Dead | 48 | 0.0004916 |
| Triaged at Scene No Transport | 21 | 0.0002151 |
| Treated Not Transported | 1 | 0.0000102 |
Graphs, Heatmaps, and Tables Prepared By: Isaac H. Michaels, MPH
Data Source: NYC Open Data
Back to top
Status Epilepticus
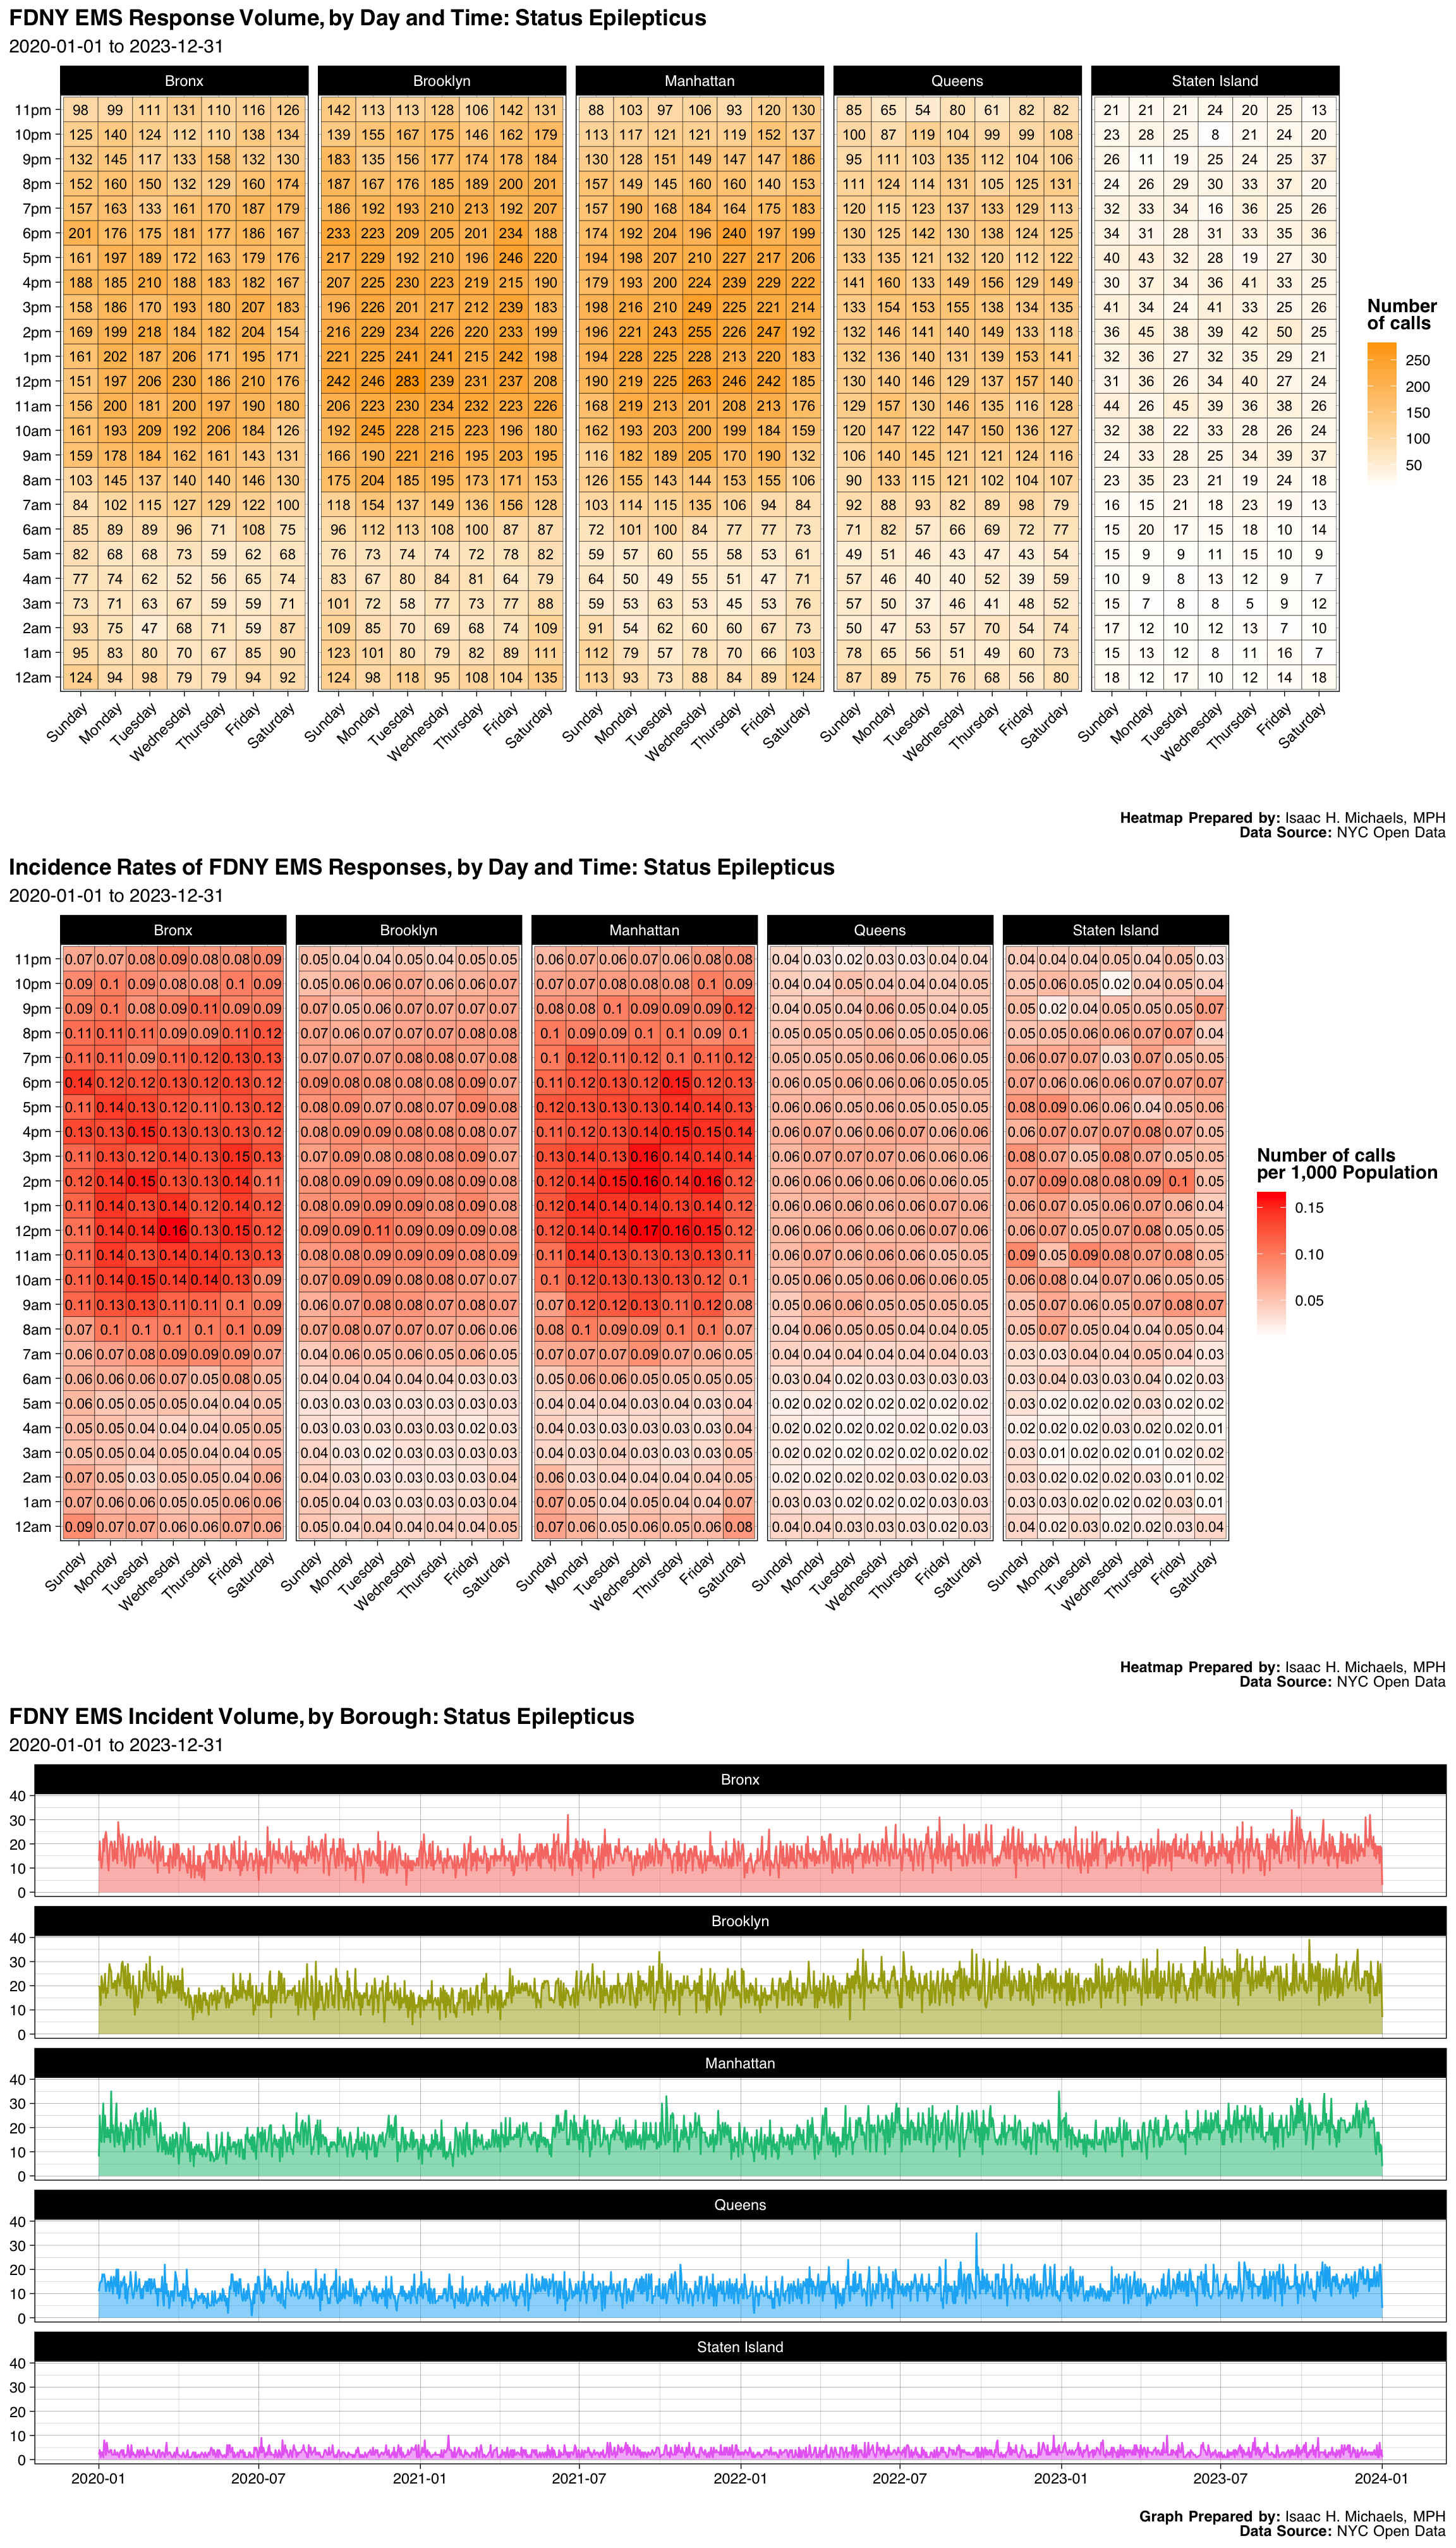
| Borough | Number | Percent |
|---|---|---|
| Bronx | 23026 | 0.2380047 |
| Brooklyn | 27715 | 0.2864718 |
| Manhattan | 24548 | 0.2537366 |
| Queens | 17435 | 0.1802142 |
| Staten Island | 4022 | 0.0415728 |
| Final Severity Level | Number | Percent |
|---|---|---|
| 1 | 44 | 0.000454799164823352 |
| 2 | 96691 | 0.999431501043971 |
| 3 | 6 | 6.20180679304571e-05 |
| 4 | 5 | 5.16817232753809e-05 |
| 5 | 0 | 0% |
| 6 | 0 | 0% |
| 7 | 0 | 0% |
| 8 | 0 | 0% |
| Disposition | Number | Percent |
|---|---|---|
| Transporting Patient | 74422 | 0.7692514 |
| Refused Medical Aid | 14248 | 0.1472722 |
| Unfounded | 3671 | 0.0379447 |
| Patient Gone on Arrival | 2956 | 0.0305542 |
| Cancelled | 1100 | 0.0113700 |
| Condition Corrected | 155 | 0.0016021 |
| Other | 93 | 0.0009613 |
| Treated and Transported | 68 | 0.0007029 |
| Triaged at Scene No Transport | 18 | 0.0001861 |
| Patient Pronounced Dead | 15 | 0.0001550 |
Graphs, Heatmaps, and Tables Prepared By: Isaac H. Michaels, MPH
Data Source: NYC Open Data
Back to top
Pedestrian Struck
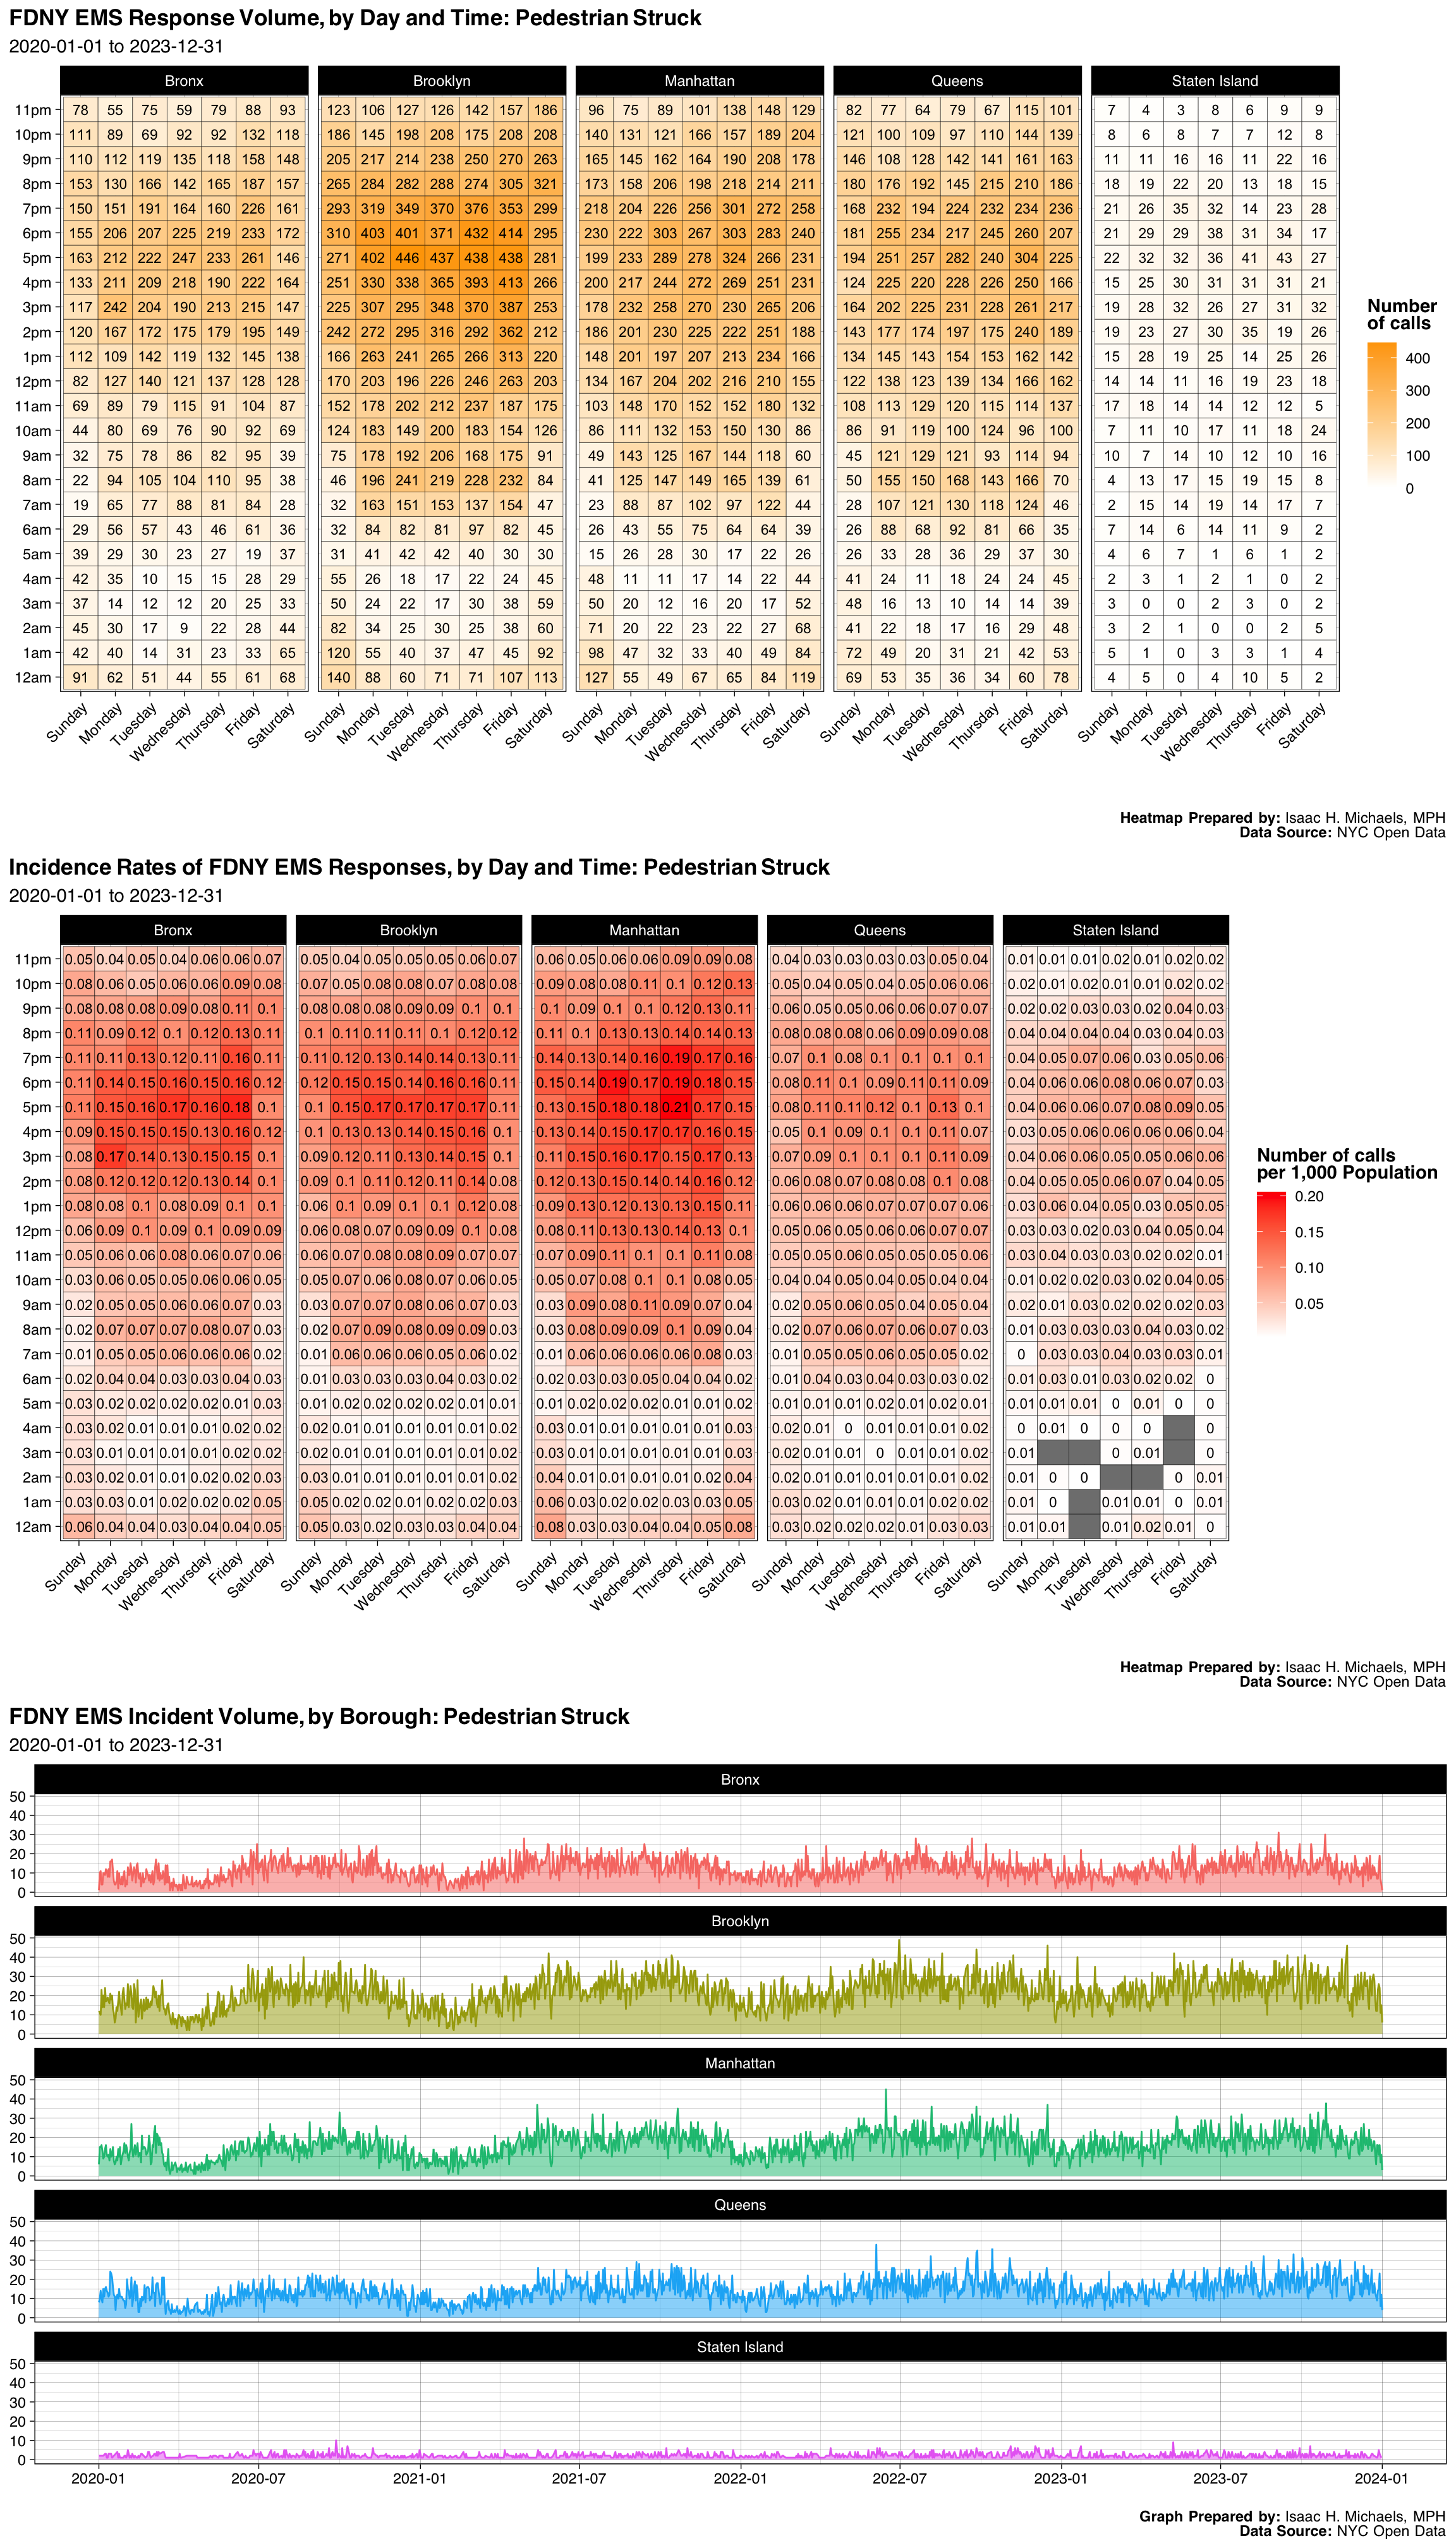
| Borough | Number | Percent |
|---|---|---|
| Bronx | 17311 | 0.1813962 |
| Brooklyn | 31658 | 0.3317336 |
| Manhattan | 23524 | 0.2465001 |
| Queens | 20554 | 0.2153785 |
| Staten Island | 2385 | 0.0249916 |
| Final Severity Level | Number | Percent |
|---|---|---|
| 1 | 1 | 1.04786654371699e-05 |
| 2 | 8 | 8.38293234973594e-05 |
| 3 | 95413 | 0.999800905356694 |
| 4 | 10 | 0.000104786654371699 |
| 5 | 0 | 0% |
| 6 | 0 | 0% |
| 7 | 0 | 0% |
| 8 | 0 | 0% |
| Disposition | Number | Percent |
|---|---|---|
| Transporting Patient | 52125 | 0.5462004 |
| Refused Medical Aid | 22845 | 0.2393851 |
| Unfounded | 6620 | 0.0693688 |
| Patient Gone on Arrival | 5708 | 0.0598122 |
| Condition Corrected | 4479 | 0.0469339 |
| Cancelled | 3184 | 0.0333641 |
| Other | 324 | 0.0033951 |
| Treated and Transported | 128 | 0.0013413 |
| Patient Pronounced Dead | 17 | 0.0001781 |
| Treated Not Transported | 1 | 0.0000105 |
| Triaged at Scene No Transport | 1 | 0.0000105 |
Graphs, Heatmaps, and Tables Prepared By: Isaac H. Michaels, MPH
Data Source: NYC Open Data
Back to top
Sick - Cough & Fever
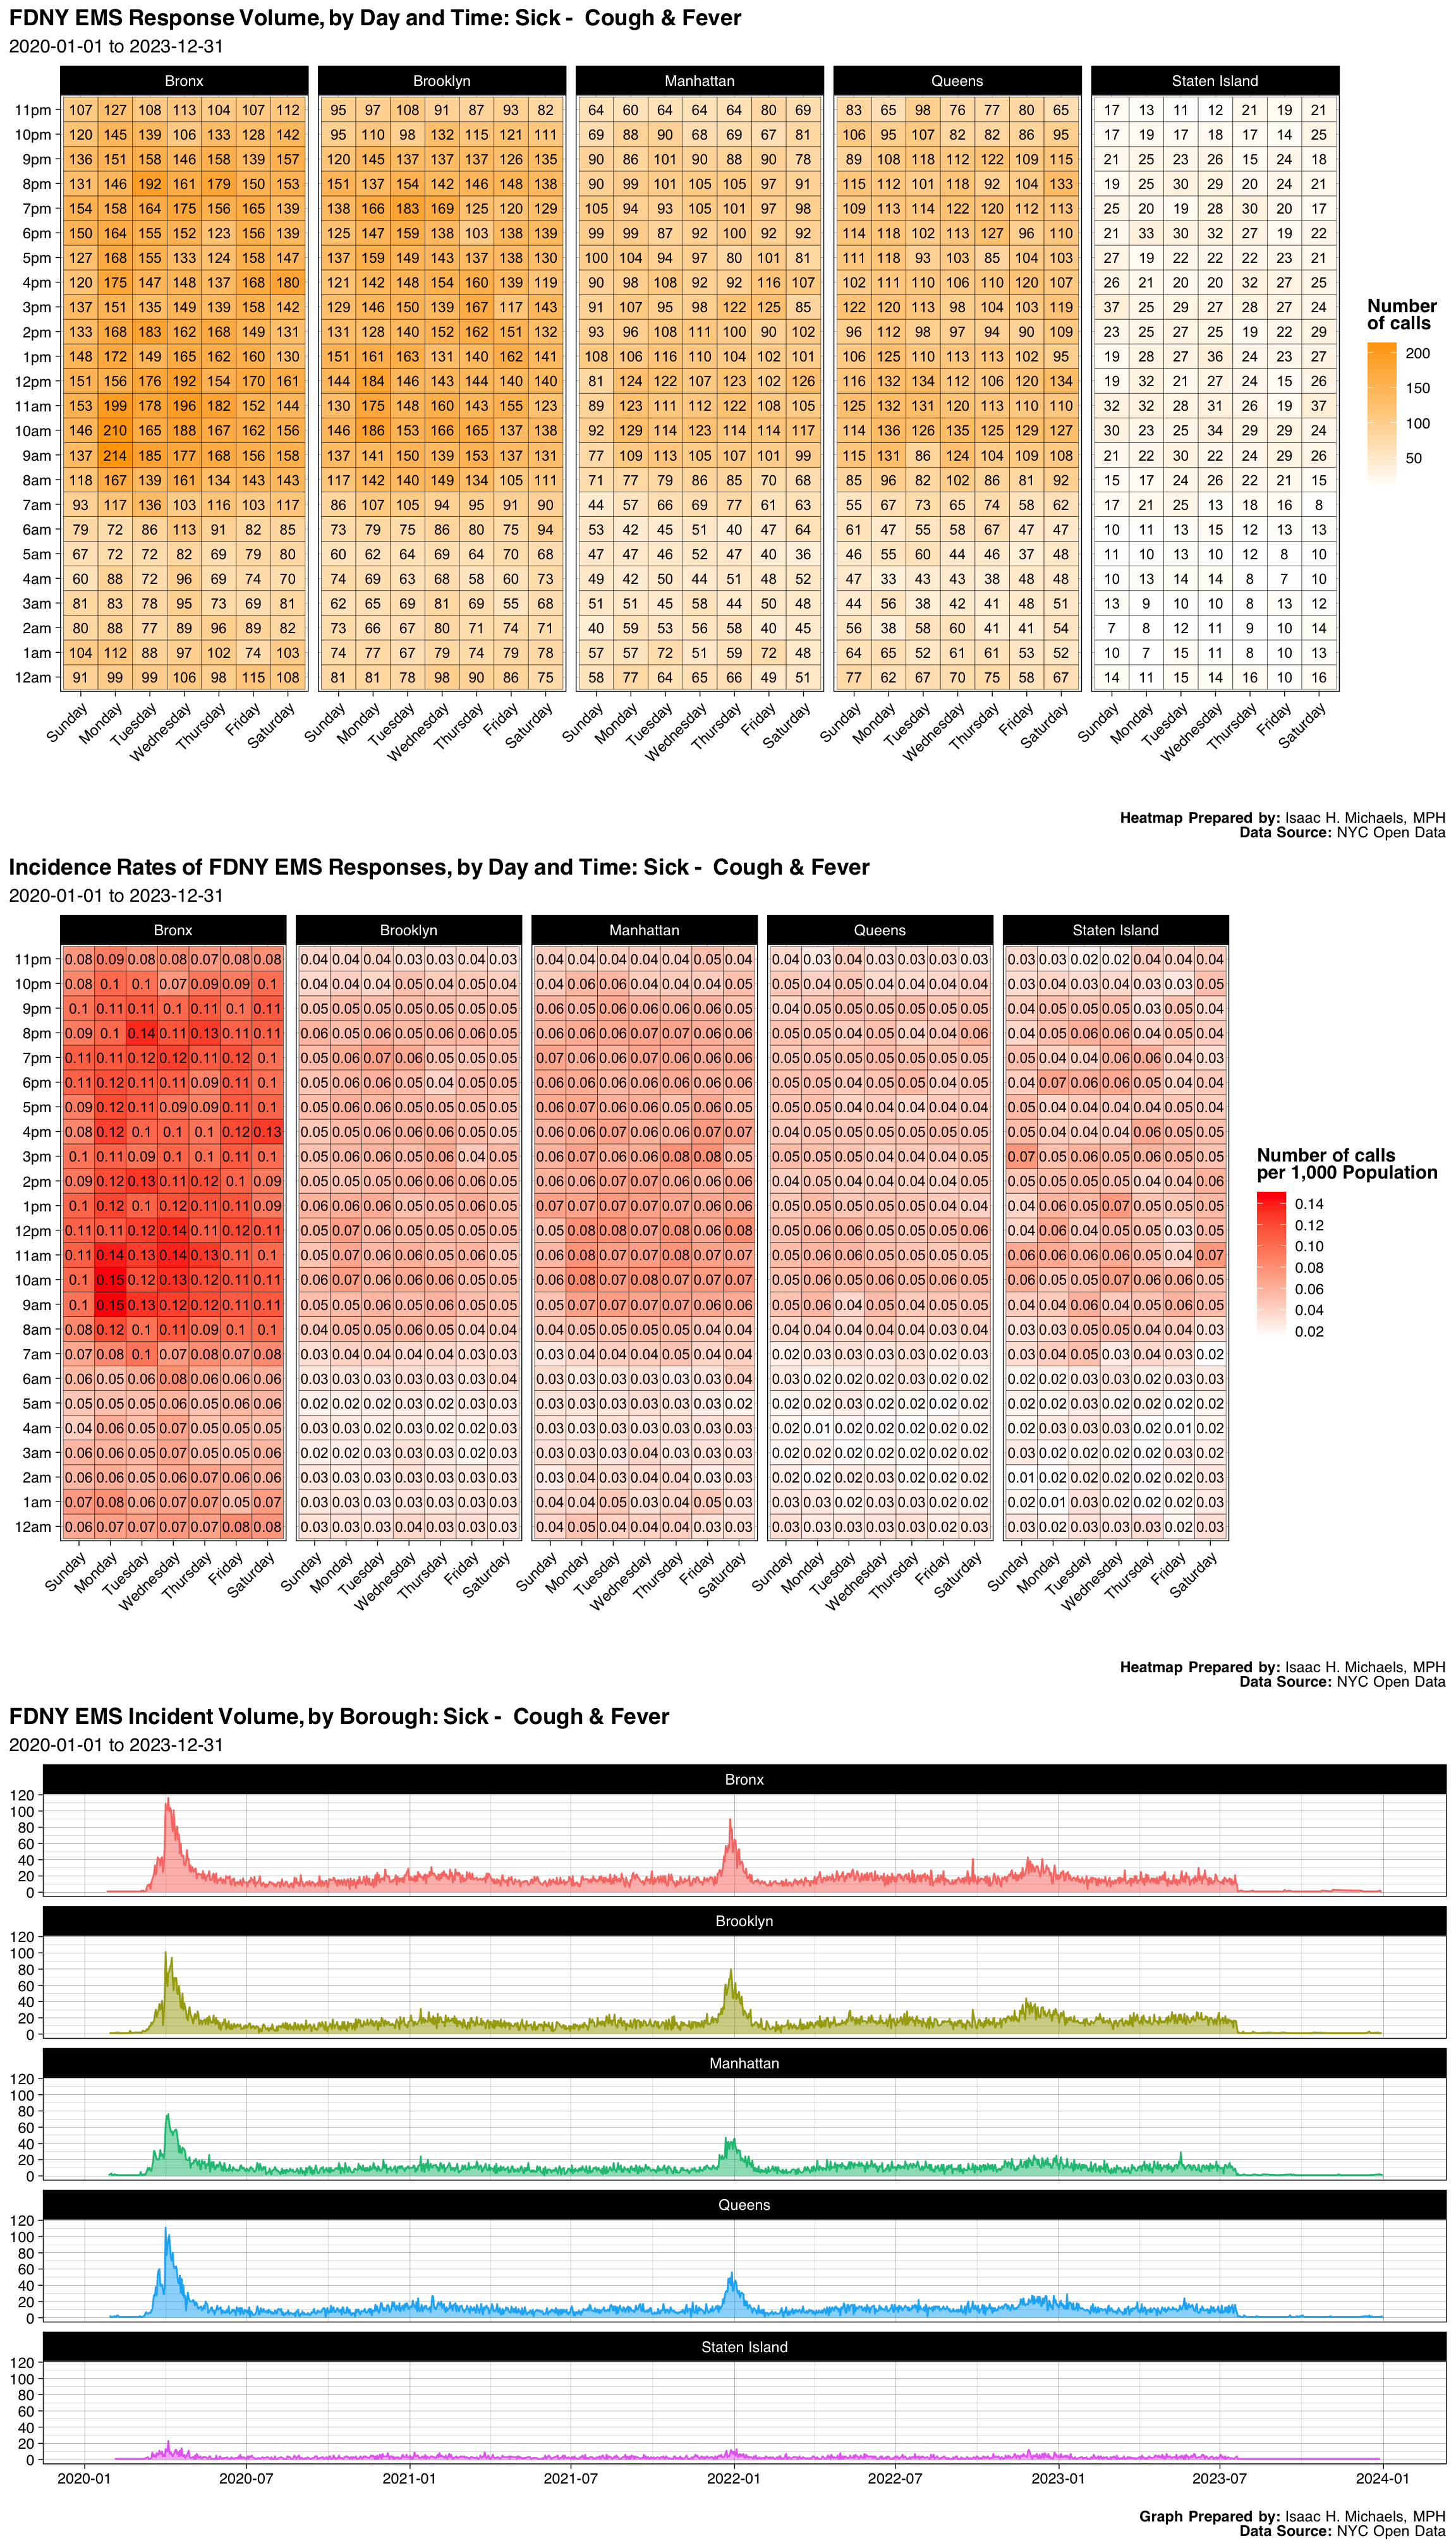
| Borough | Number | Percent |
|---|---|---|
| Bronx | 22034 | 0.2982888 |
| Brooklyn | 19671 | 0.2662993 |
| Manhattan | 13771 | 0.1864271 |
| Queens | 15062 | 0.2039043 |
| Staten Island | 3330 | 0.0450804 |
| Final Severity Level | Number | Percent |
|---|---|---|
| 1 | 0 | 0% |
| 2 | 4 | 5.41506471002328e-05 |
| 3 | 18 | 0.000243677911951048 |
| 4 | 231 | 0.00312719987003845 |
| 5 | 4 | 5.41506471002328e-05 |
| 6 | 73608 | 0.996480207938485 |
| 7 | 3 | 4.06129853251746e-05 |
| 8 | 0 | 0% |
| Disposition | Number | Percent |
|---|---|---|
| Transporting Patient | 51383 | 0.6956057 |
| Refused Medical Aid | 14722 | 0.1993015 |
| Other | 3532 | 0.0478150 |
| Unfounded | 2427 | 0.0328559 |
| Patient Gone on Arrival | 804 | 0.0108843 |
| Cancelled | 720 | 0.0097471 |
| Condition Corrected | 215 | 0.0029106 |
| Treated and Transported | 31 | 0.0004197 |
| Triaged at Scene No Transport | 21 | 0.0002843 |
| Patient Pronounced Dead | 11 | 0.0001489 |
| Treated Not Transported | 2 | 0.0000271 |
Graphs, Heatmaps, and Tables Prepared By: Isaac H. Michaels, MPH
Data Source: NYC Open Data
Back to top
Respiratory Distress
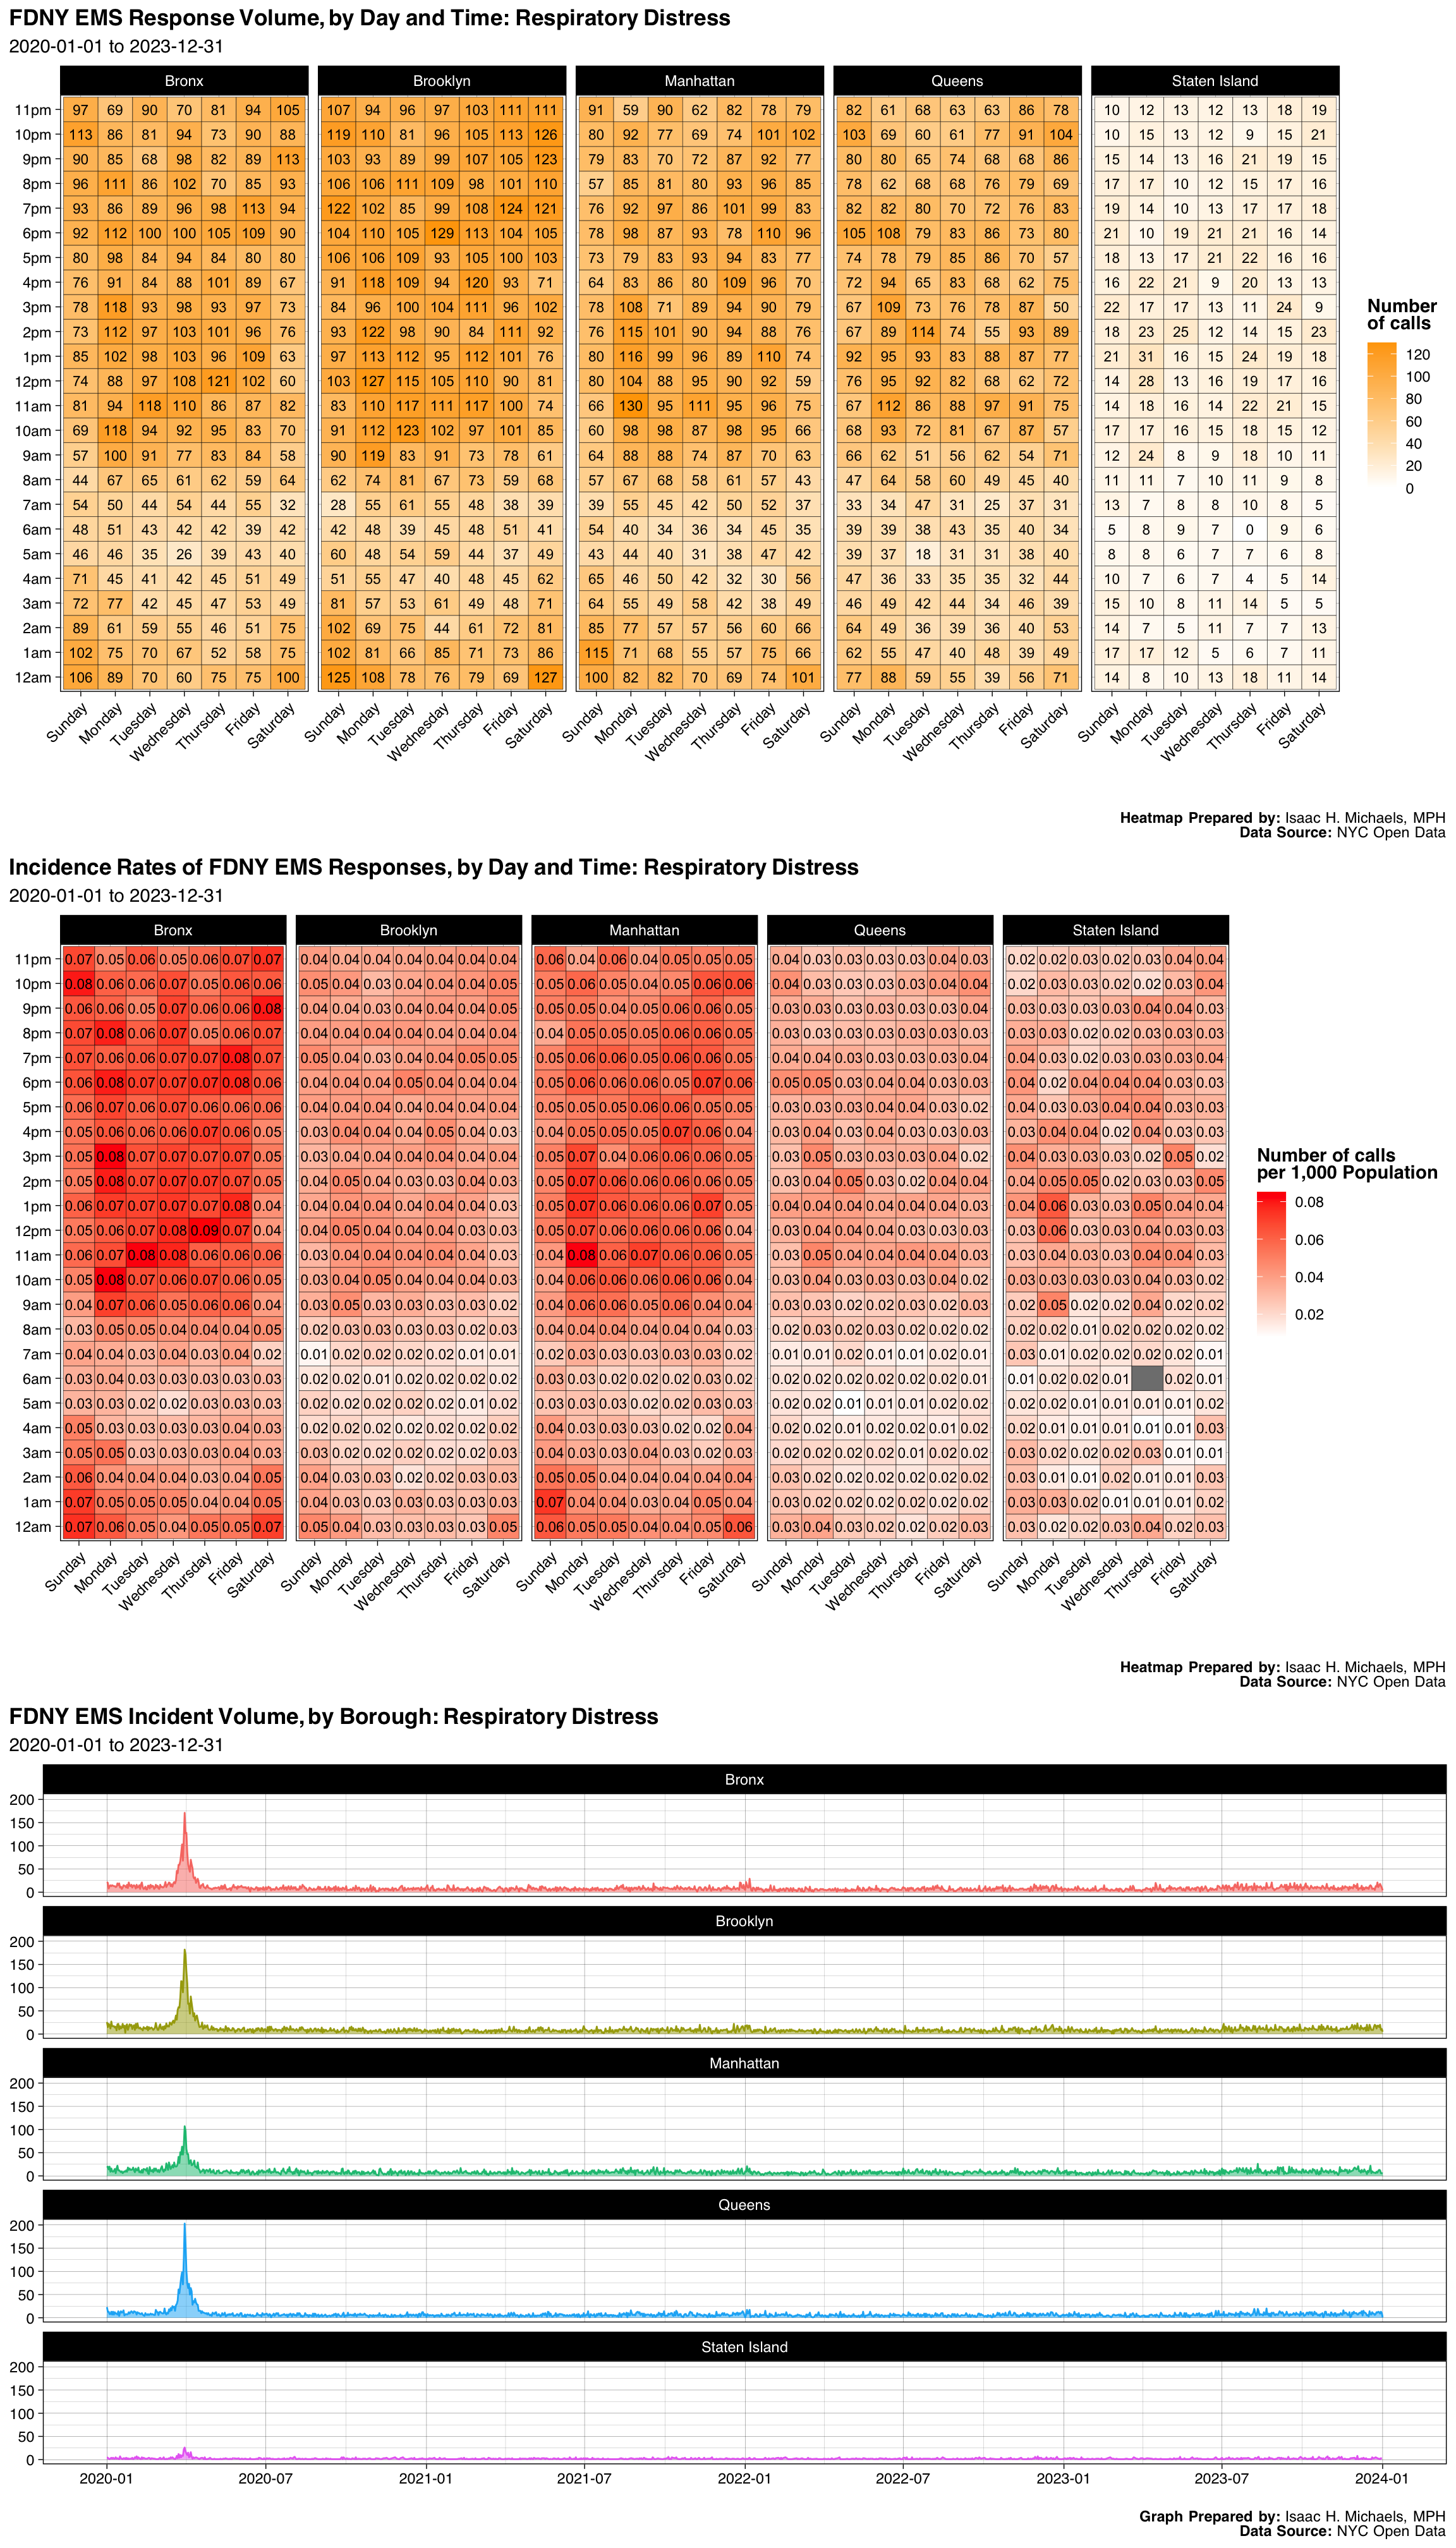
| Borough | Number | Percent |
|---|---|---|
| Bronx | 13091 | 0.2446184 |
| Brooklyn | 14687 | 0.2744413 |
| Manhattan | 12555 | 0.2346027 |
| Queens | 10907 | 0.2038082 |
| Staten Island | 2276 | 0.0425293 |
| Final Severity Level | Number | Percent |
|---|---|---|
| 1 | 1 | 1.8686000448464e-05 |
| 2 | 9 | 0.000168174004036176 |
| 3 | 35 | 0.00065401001569624 |
| 4 | 53470 | 0.999140443979371 |
| 5 | 0 | 0% |
| 6 | 0 | 0% |
| 7 | 1 | 1.8686000448464e-05 |
| 8 | 0 | 0% |
| Disposition | Number | Percent |
|---|---|---|
| Transporting Patient | 33485 | 0.6257007 |
| Refused Medical Aid | 12371 | 0.2311645 |
| Unfounded | 3871 | 0.0723335 |
| Patient Gone on Arrival | 1731 | 0.0323455 |
| Cancelled | 900 | 0.0168174 |
| Condition Corrected | 567 | 0.0105950 |
| Other | 490 | 0.0091561 |
| Treated and Transported | 50 | 0.0009343 |
| Patient Pronounced Dead | 33 | 0.0006166 |
| Triaged at Scene No Transport | 16 | 0.0002990 |
| Treated Not Transported | 2 | 0.0000374 |
Graphs, Heatmaps, and Tables Prepared By: Isaac H. Michaels, MPH
Data Source: NYC Open Data
Back to top
Cva (Stroke)
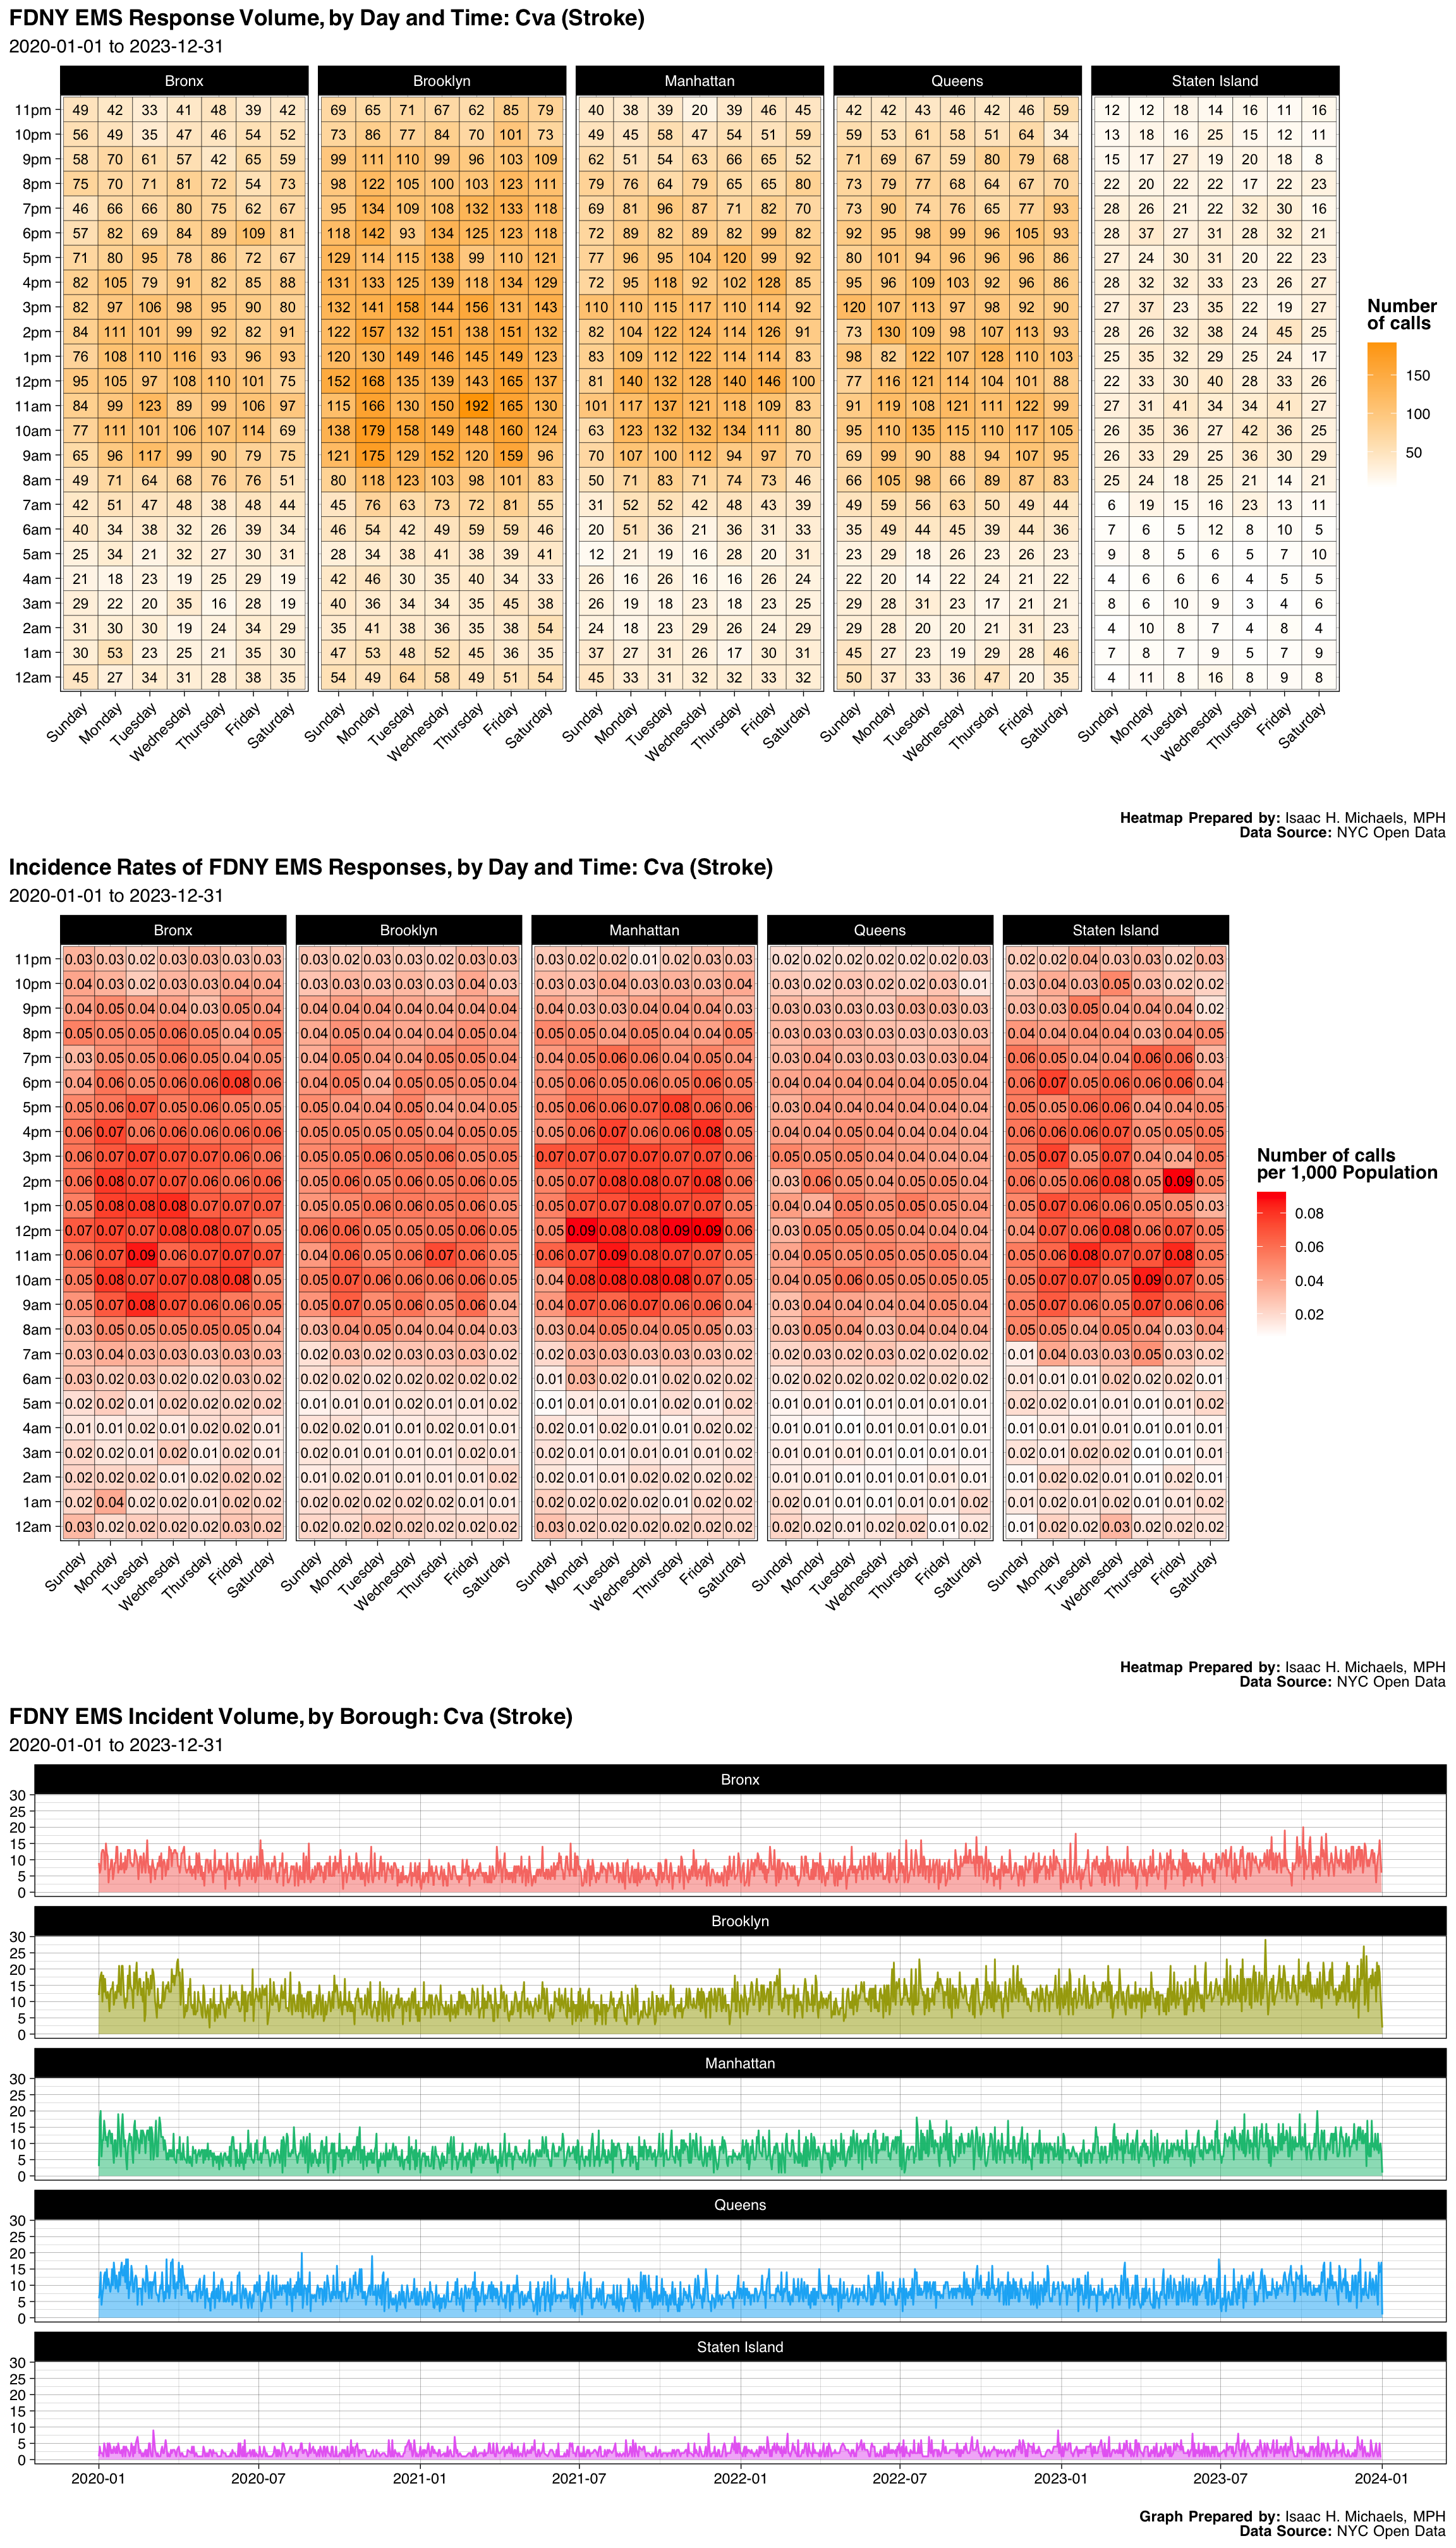
| Borough | Number | Percent |
|---|---|---|
| Bronx | 10620 | 0.1986941 |
| Brooklyn | 16292 | 0.3048139 |
| Manhattan | 11485 | 0.2148777 |
| Queens | 11740 | 0.2196486 |
| Staten Island | 3312 | 0.0619656 |
| Final Severity Level | Number | Percent |
|---|---|---|
| 1 | 0 | 0% |
| 2 | 53443 | 0.999887743456379 |
| 3 | 5 | 9.35471196841849e-05 |
| 4 | 1 | 1.8709423936837e-05 |
| 5 | 0 | 0% |
| 6 | 0 | 0% |
| 7 | 0 | 0% |
| 8 | 0 | 0% |
| Disposition | Number | Percent |
|---|---|---|
| Transporting Patient | 44520 | 0.8329436 |
| Refused Medical Aid | 6642 | 0.1242680 |
| Unfounded | 1158 | 0.0216655 |
| Patient Gone on Arrival | 584 | 0.0109263 |
| Cancelled | 356 | 0.0066606 |
| Condition Corrected | 80 | 0.0014968 |
| Treated and Transported | 57 | 0.0010664 |
| Other | 33 | 0.0006174 |
| Patient Pronounced Dead | 16 | 0.0002994 |
| Triaged at Scene No Transport | 3 | 0.0000561 |
Graphs, Heatmaps, and Tables Prepared By: Isaac H. Michaels, MPH
Data Source: NYC Open Data
Back to top
Minor Injury
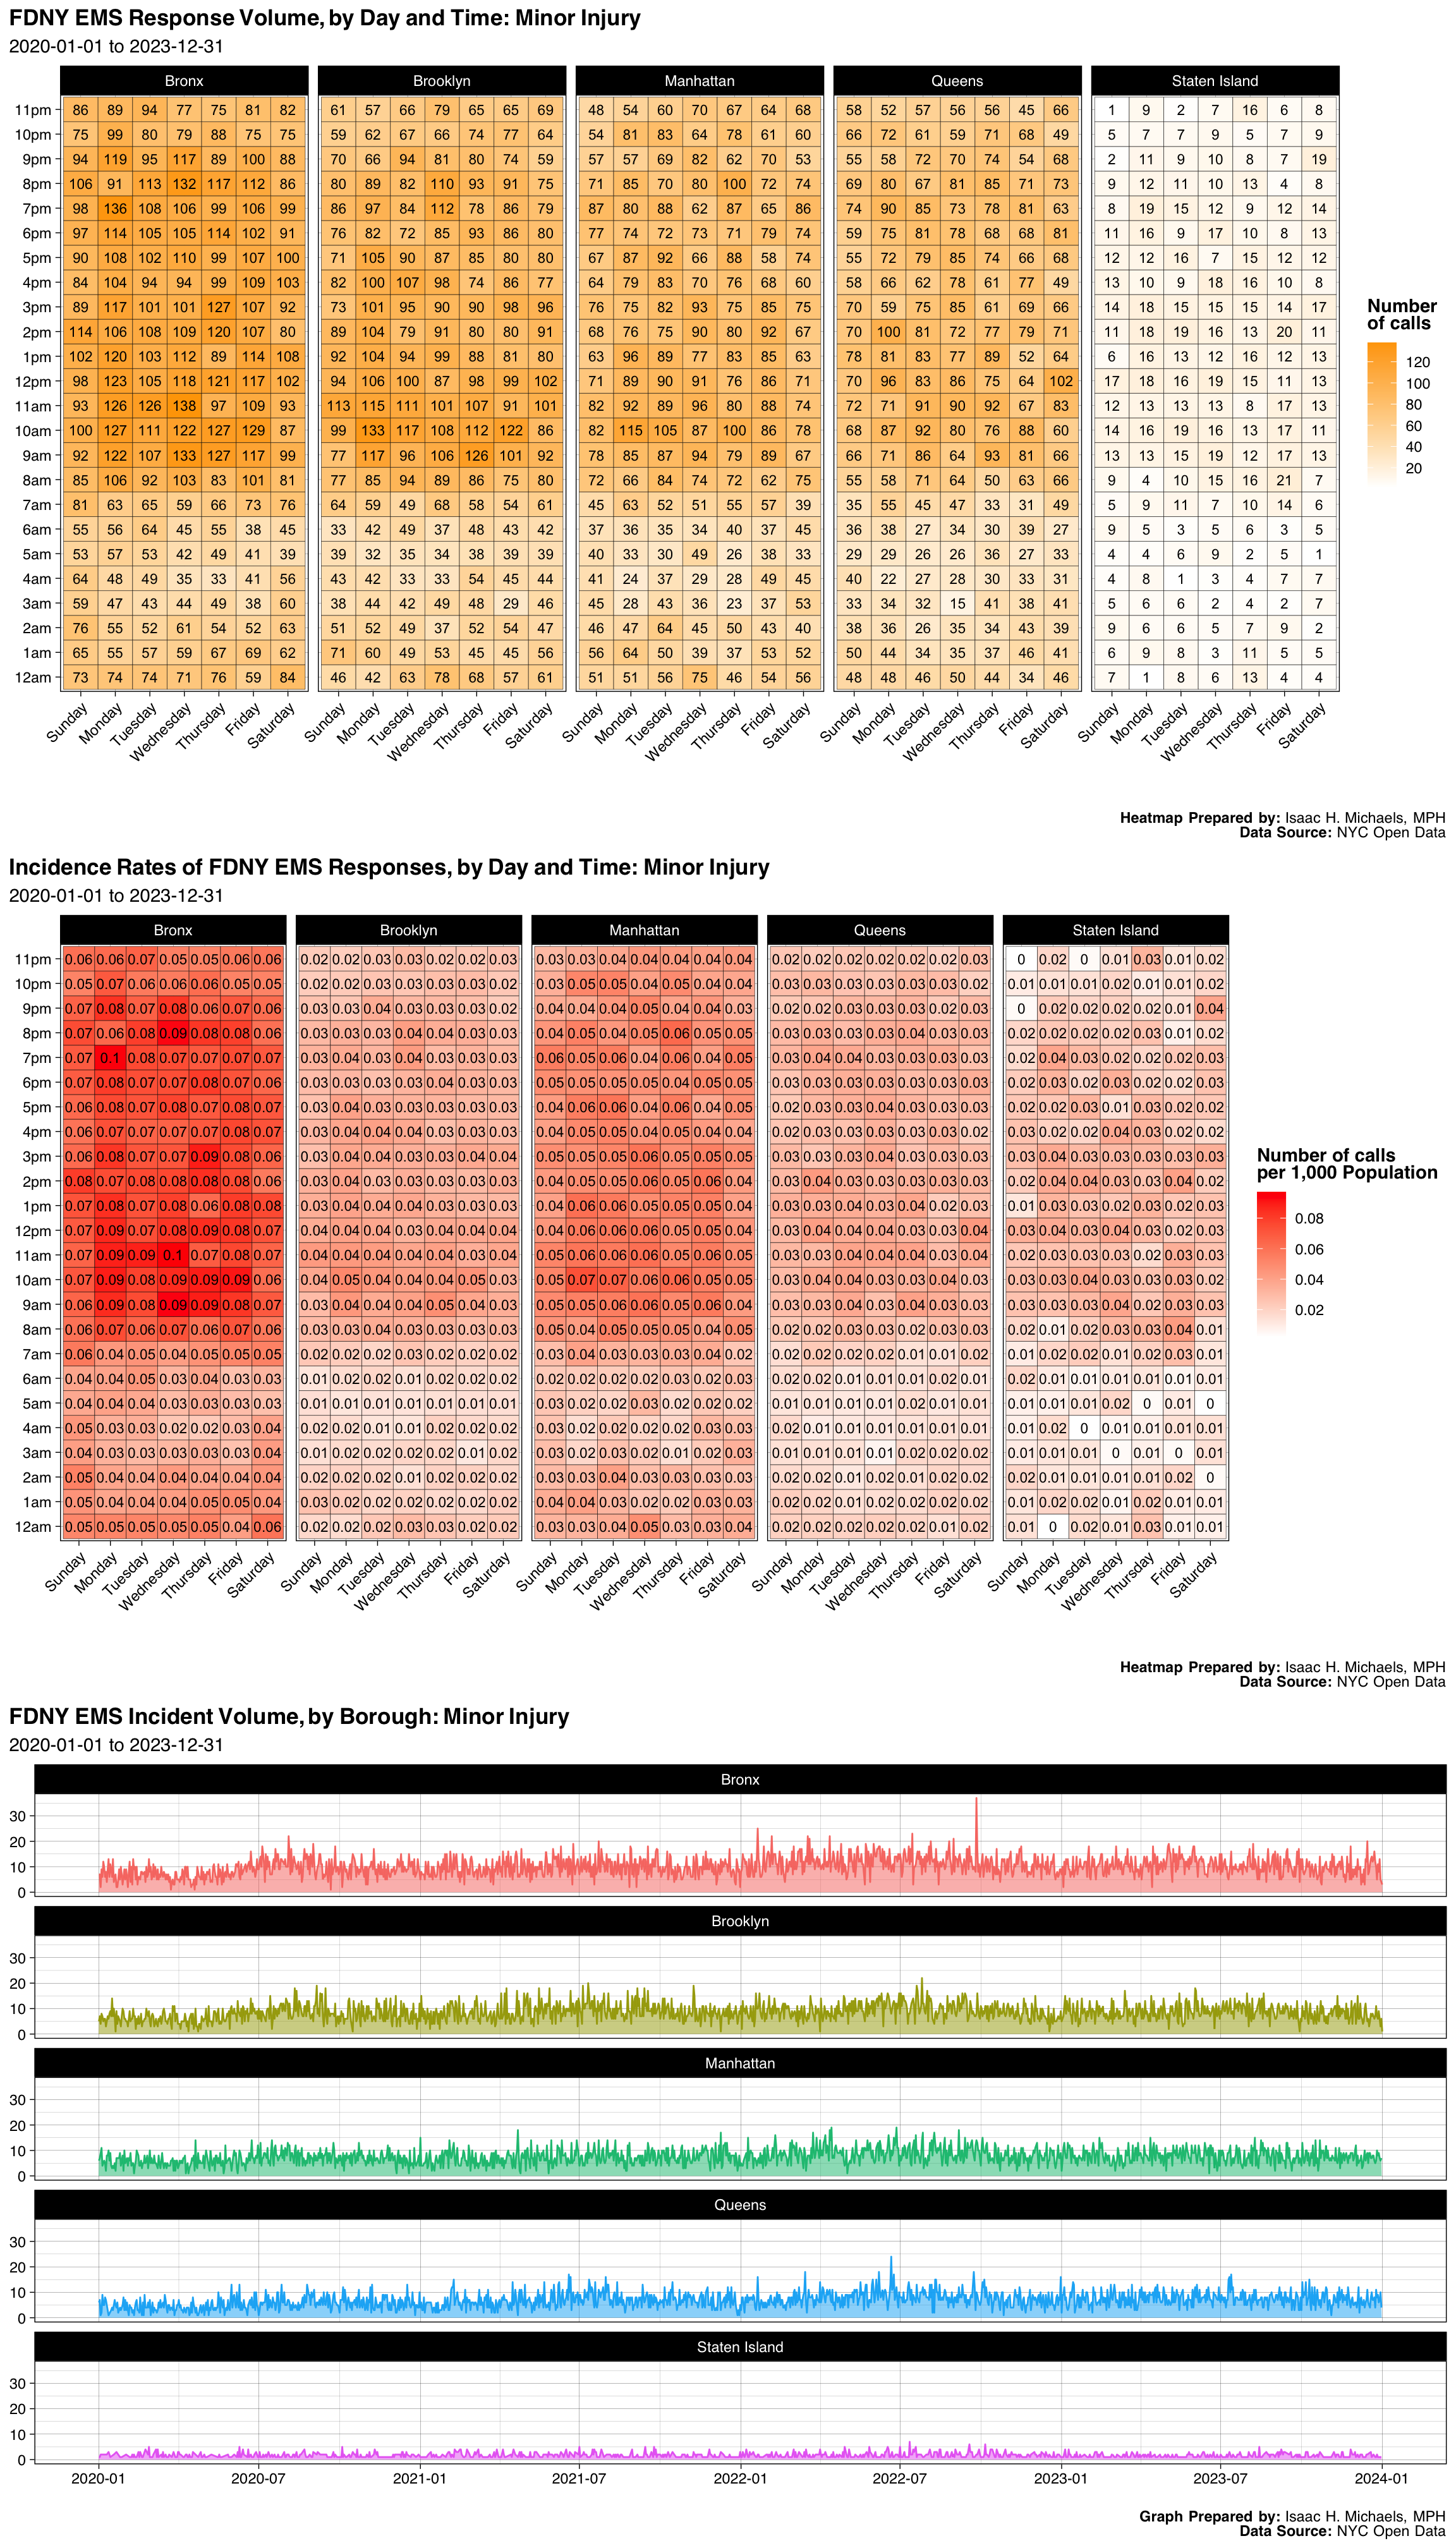
| Borough | Number | Percent |
|---|---|---|
| Bronx | 14739 | 0.2939921 |
| Brooklyn | 12580 | 0.2509275 |
| Manhattan | 11066 | 0.2207284 |
| Queens | 10054 | 0.2005425 |
| Staten Island | 1695 | 0.0338094 |
| Final Severity Level | Number | Percent |
|---|---|---|
| 1 | 0 | 0% |
| 2 | 4 | 7.97861730562094e-05 |
| 3 | 32 | 0.000638289384449675 |
| 4 | 641 | 0.0127857342322575 |
| 5 | 2 | 3.98930865281047e-05 |
| 6 | 3 | 5.9839629792157e-05 |
| 7 | 49452 | 0.986396457493916 |
| 8 | 0 | 0% |
| Disposition | Number | Percent |
|---|---|---|
| Transporting Patient | 32896 | 0.6561615 |
| Refused Medical Aid | 12556 | 0.2504488 |
| Unfounded | 2293 | 0.0457374 |
| Patient Gone on Arrival | 1079 | 0.0215223 |
| Condition Corrected | 456 | 0.0090956 |
| Cancelled | 437 | 0.0087166 |
| Other | 368 | 0.0073403 |
| Treated and Transported | 30 | 0.0005984 |
| Triaged at Scene No Transport | 17 | 0.0003391 |
| Patient Pronounced Dead | 1 | 0.0000199 |
| Treated Not Transported | 1 | 0.0000199 |
Graphs, Heatmaps, and Tables Prepared By: Isaac H. Michaels, MPH
Data Source: NYC Open Data
Back to top
Minor Illness
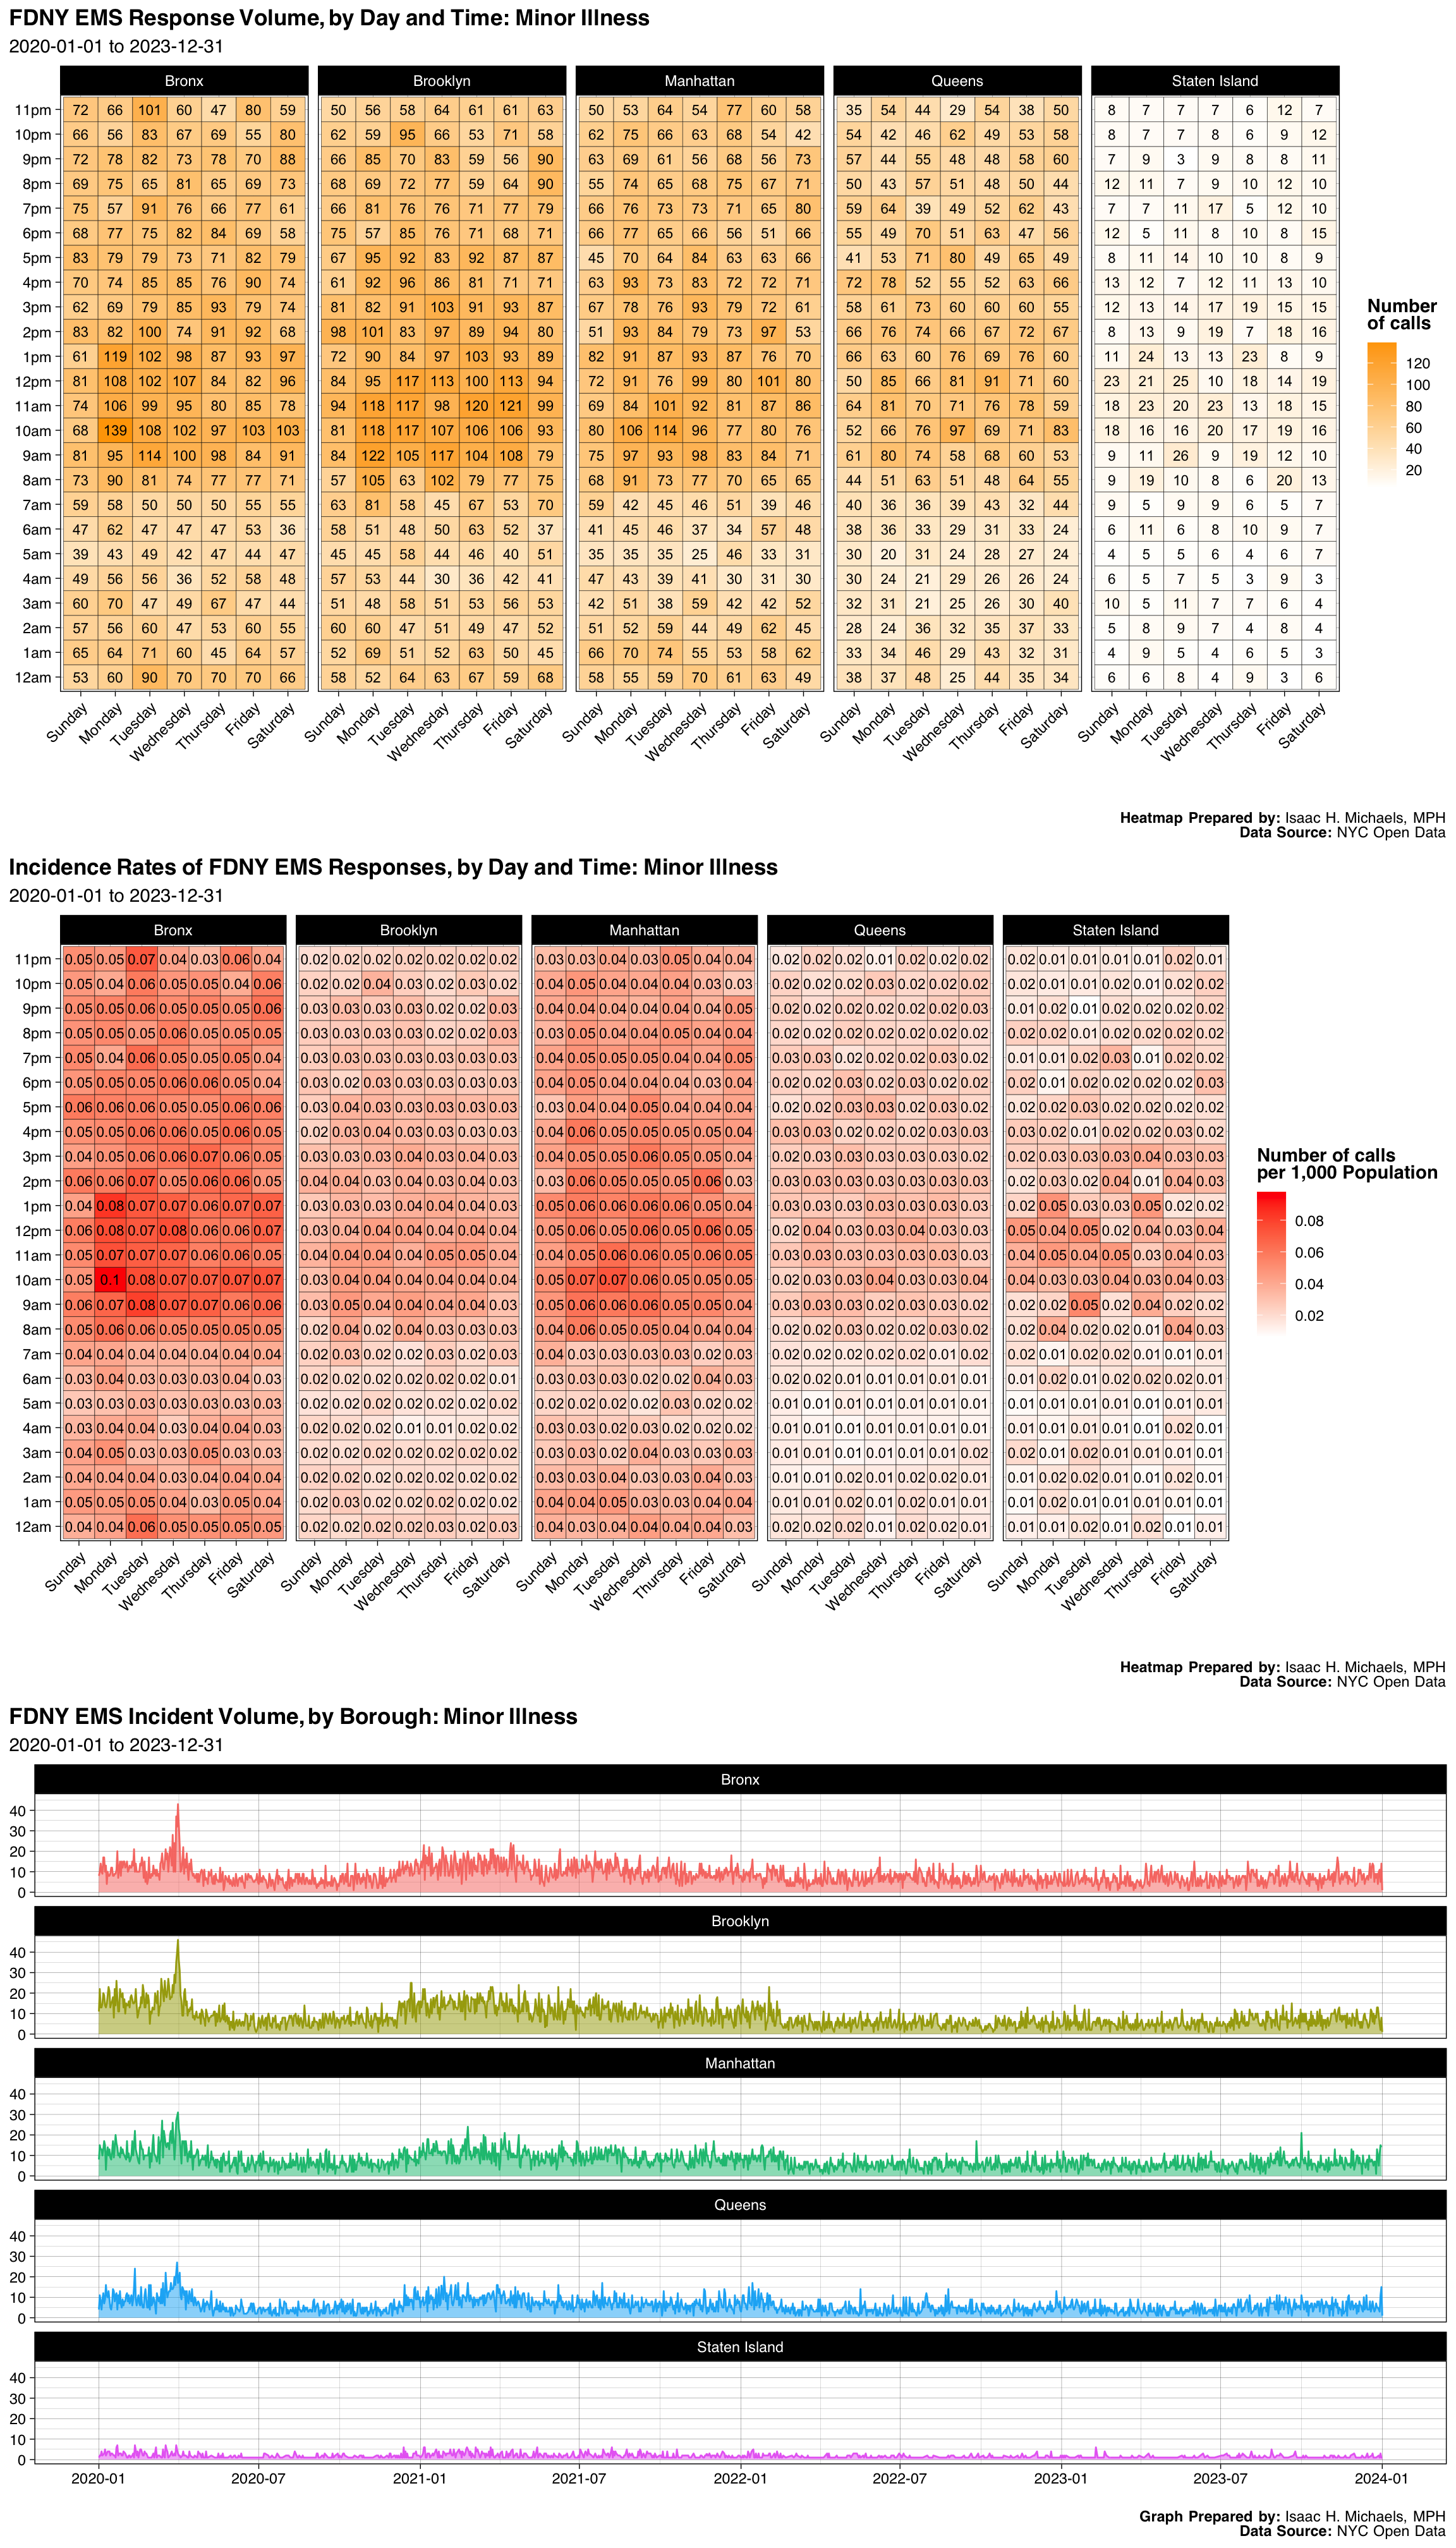
| Borough | Number | Percent |
|---|---|---|
| Bronx | 12165 | 0.2655360 |
| Brooklyn | 12438 | 0.2714950 |
| Manhattan | 10958 | 0.2391897 |
| Queens | 8515 | 0.1858643 |
| Staten Island | 1737 | 0.0379150 |
| Final Severity Level | Number | Percent |
|---|---|---|
| 1 | 0 | 0% |
| 2 | 1 | 2.18278654530373e-05 |
| 3 | 29 | 0.000633008098138083 |
| 4 | 10 | 0.000218278654530373 |
| 5 | 0 | 0% |
| 6 | 3 | 6.5483596359112e-05 |
| 7 | 45770 | 0.999061401785519 |
| 8 | 0 | 0% |
| Disposition | Number | Percent |
|---|---|---|
| Transporting Patient | 30462 | 0.6649204 |
| Refused Medical Aid | 10415 | 0.2273372 |
| Unfounded | 2114 | 0.0461441 |
| Other | 1202 | 0.0262371 |
| Patient Gone on Arrival | 977 | 0.0213258 |
| Cancelled | 402 | 0.0087748 |
| Condition Corrected | 184 | 0.0040163 |
| Treated and Transported | 27 | 0.0005894 |
| Triaged at Scene No Transport | 20 | 0.0004366 |
| Patient Pronounced Dead | 10 | 0.0002183 |
Graphs, Heatmaps, and Tables Prepared By: Isaac H. Michaels, MPH
Data Source: NYC Open Data
Back to top
Internal Bleeding
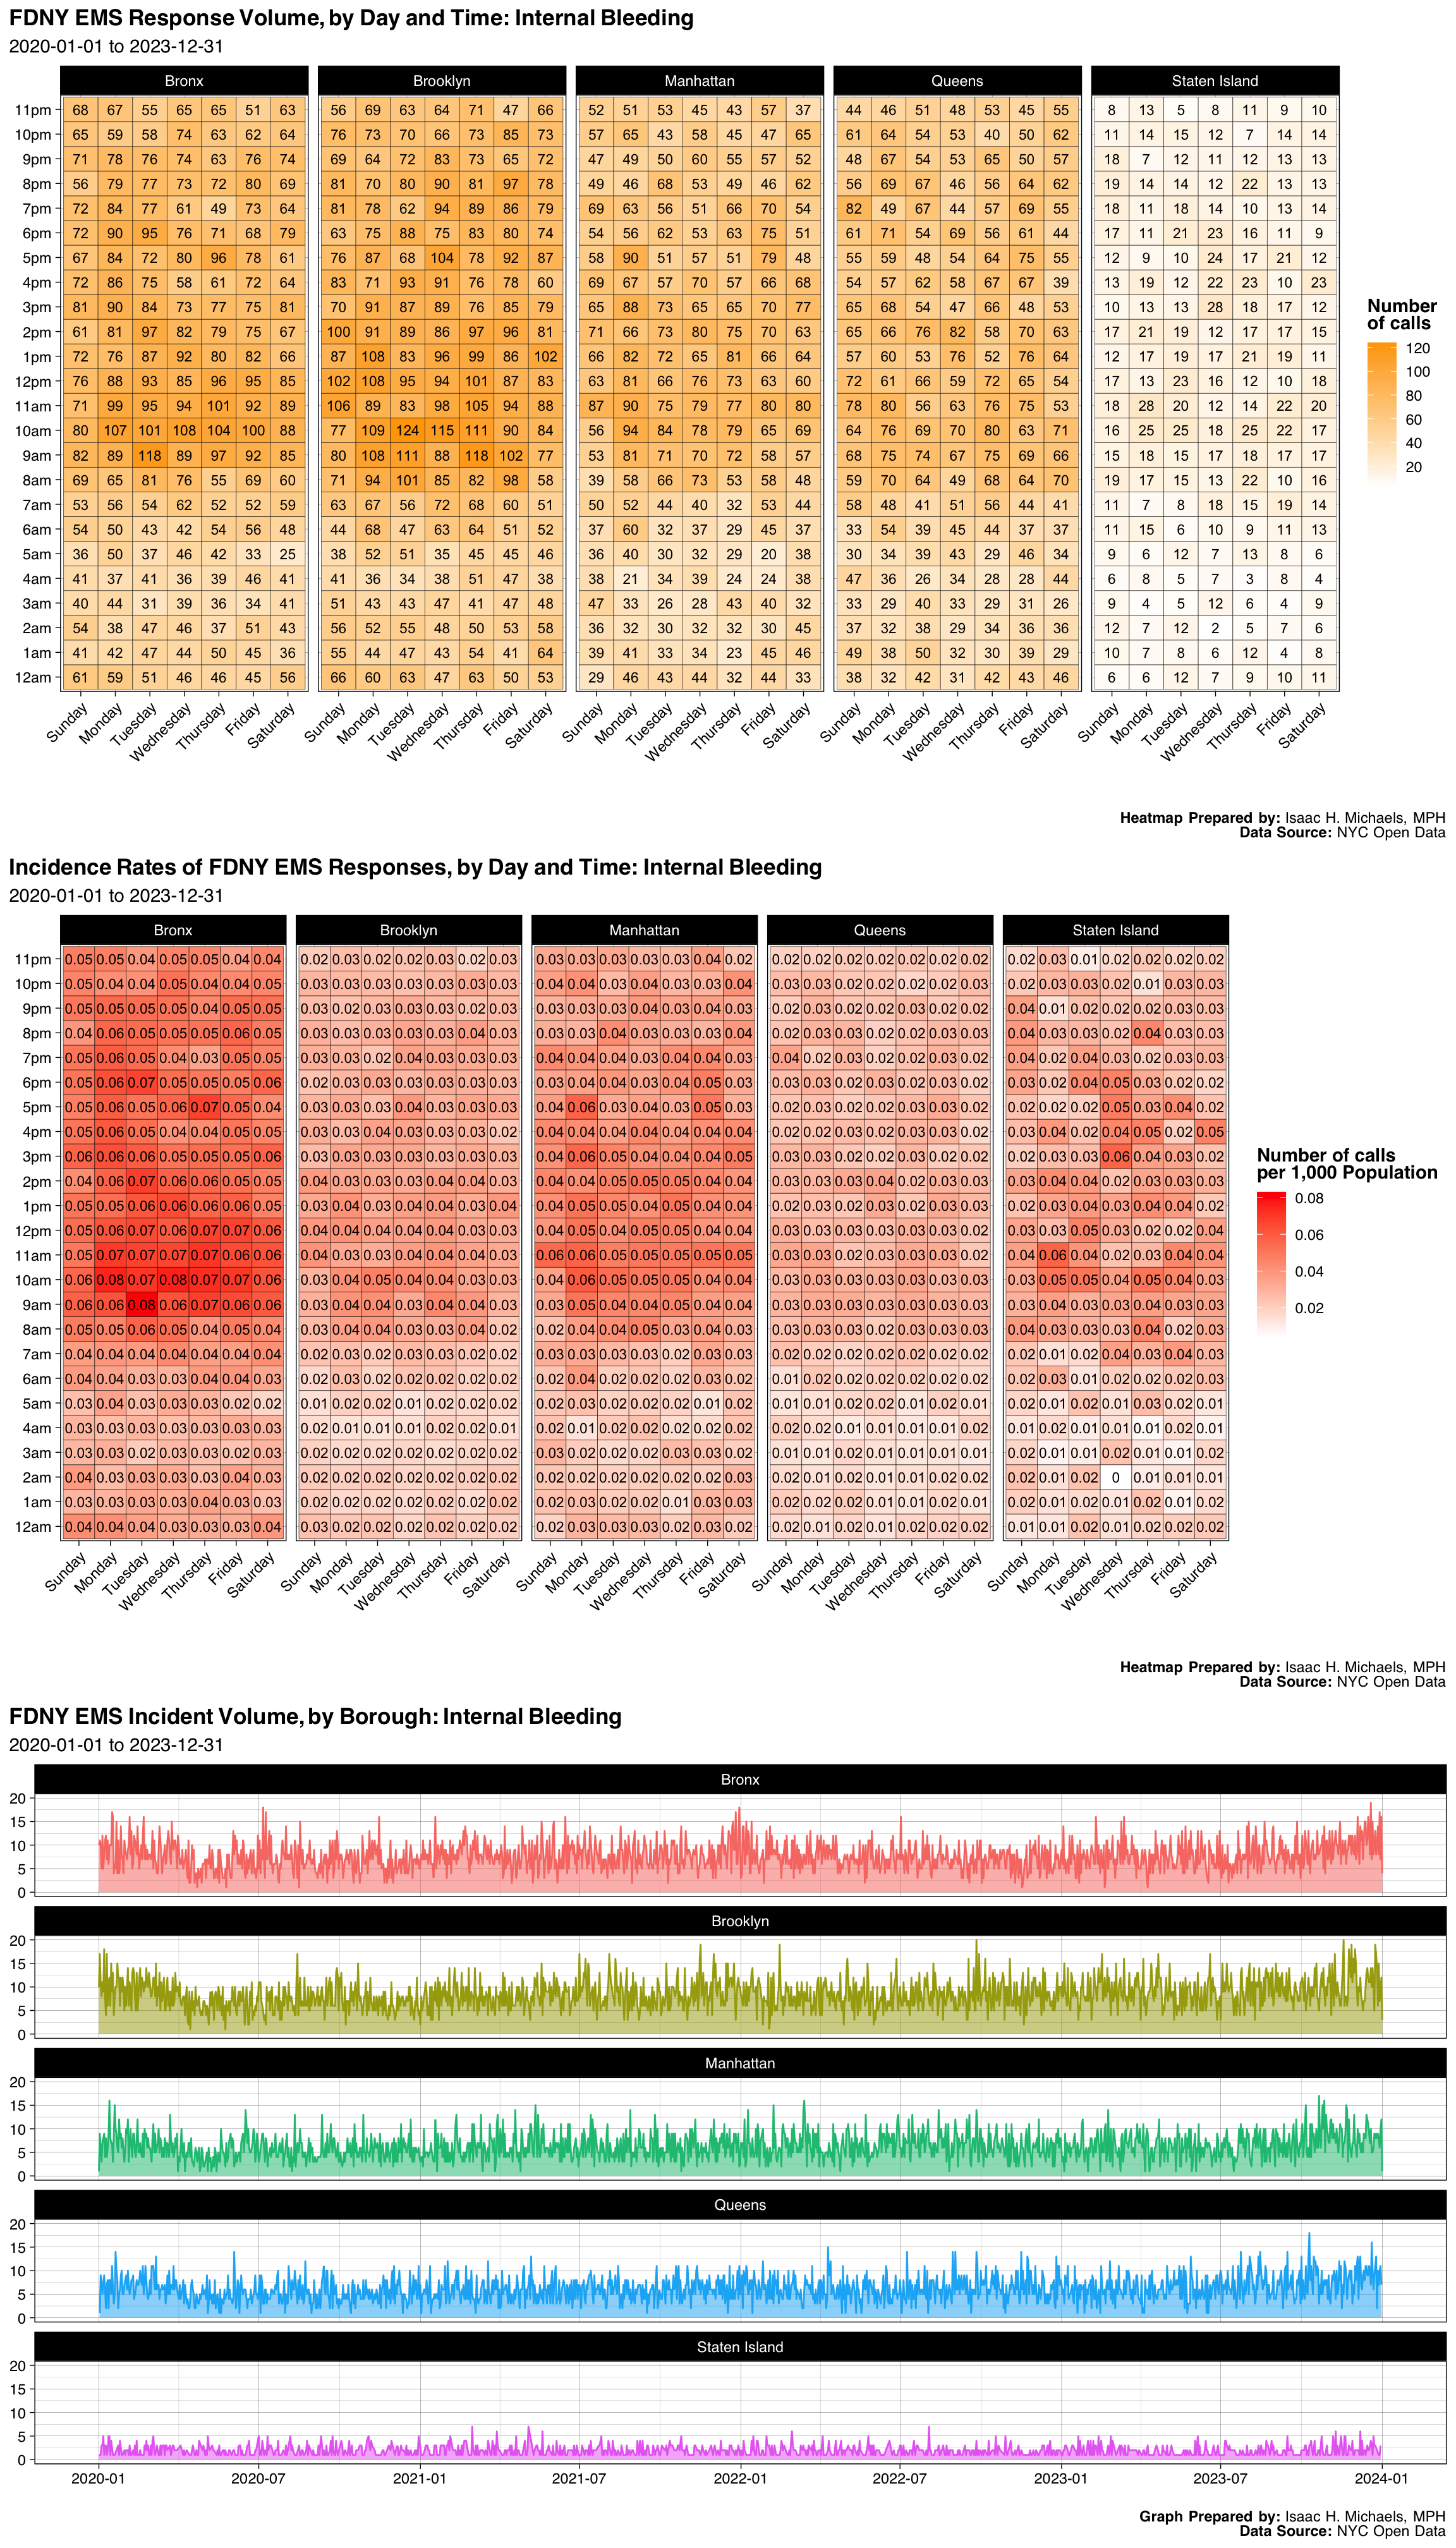
| Borough | Number | Percent |
|---|---|---|
| Bronx | 11221 | 0.2552432 |
| Brooklyn | 12337 | 0.2806287 |
| Manhattan | 9174 | 0.2086802 |
| Queens | 9003 | 0.2047905 |
| Staten Island | 2227 | 0.0506574 |
| Final Severity Level | Number | Percent |
|---|---|---|
| 1 | 0 | 0% |
| 2 | 3 | 6.82407533779173e-05 |
| 3 | 43906 | 0.998726172603612 |
| 4 | 53 | 0.00120558664300987 |
| 5 | 0 | 0% |
| 6 | 0 | 0% |
| 7 | 0 | 0% |
| 8 | 0 | 0% |
| Disposition | Number | Percent |
|---|---|---|
| Transporting Patient | 39407 | 0.8963878 |
| Refused Medical Aid | 3115 | 0.0708566 |
| Unfounded | 874 | 0.0198808 |
| Patient Gone on Arrival | 283 | 0.0064374 |
| Cancelled | 184 | 0.0041854 |
| Condition Corrected | 40 | 0.0009099 |
| Treated and Transported | 24 | 0.0005459 |
| Other | 22 | 0.0005004 |
| Patient Pronounced Dead | 11 | 0.0002502 |
| Triaged at Scene No Transport | 2 | 0.0000455 |
Graphs, Heatmaps, and Tables Prepared By: Isaac H. Michaels, MPH
Data Source: NYC Open Data
Back to top
Seizures
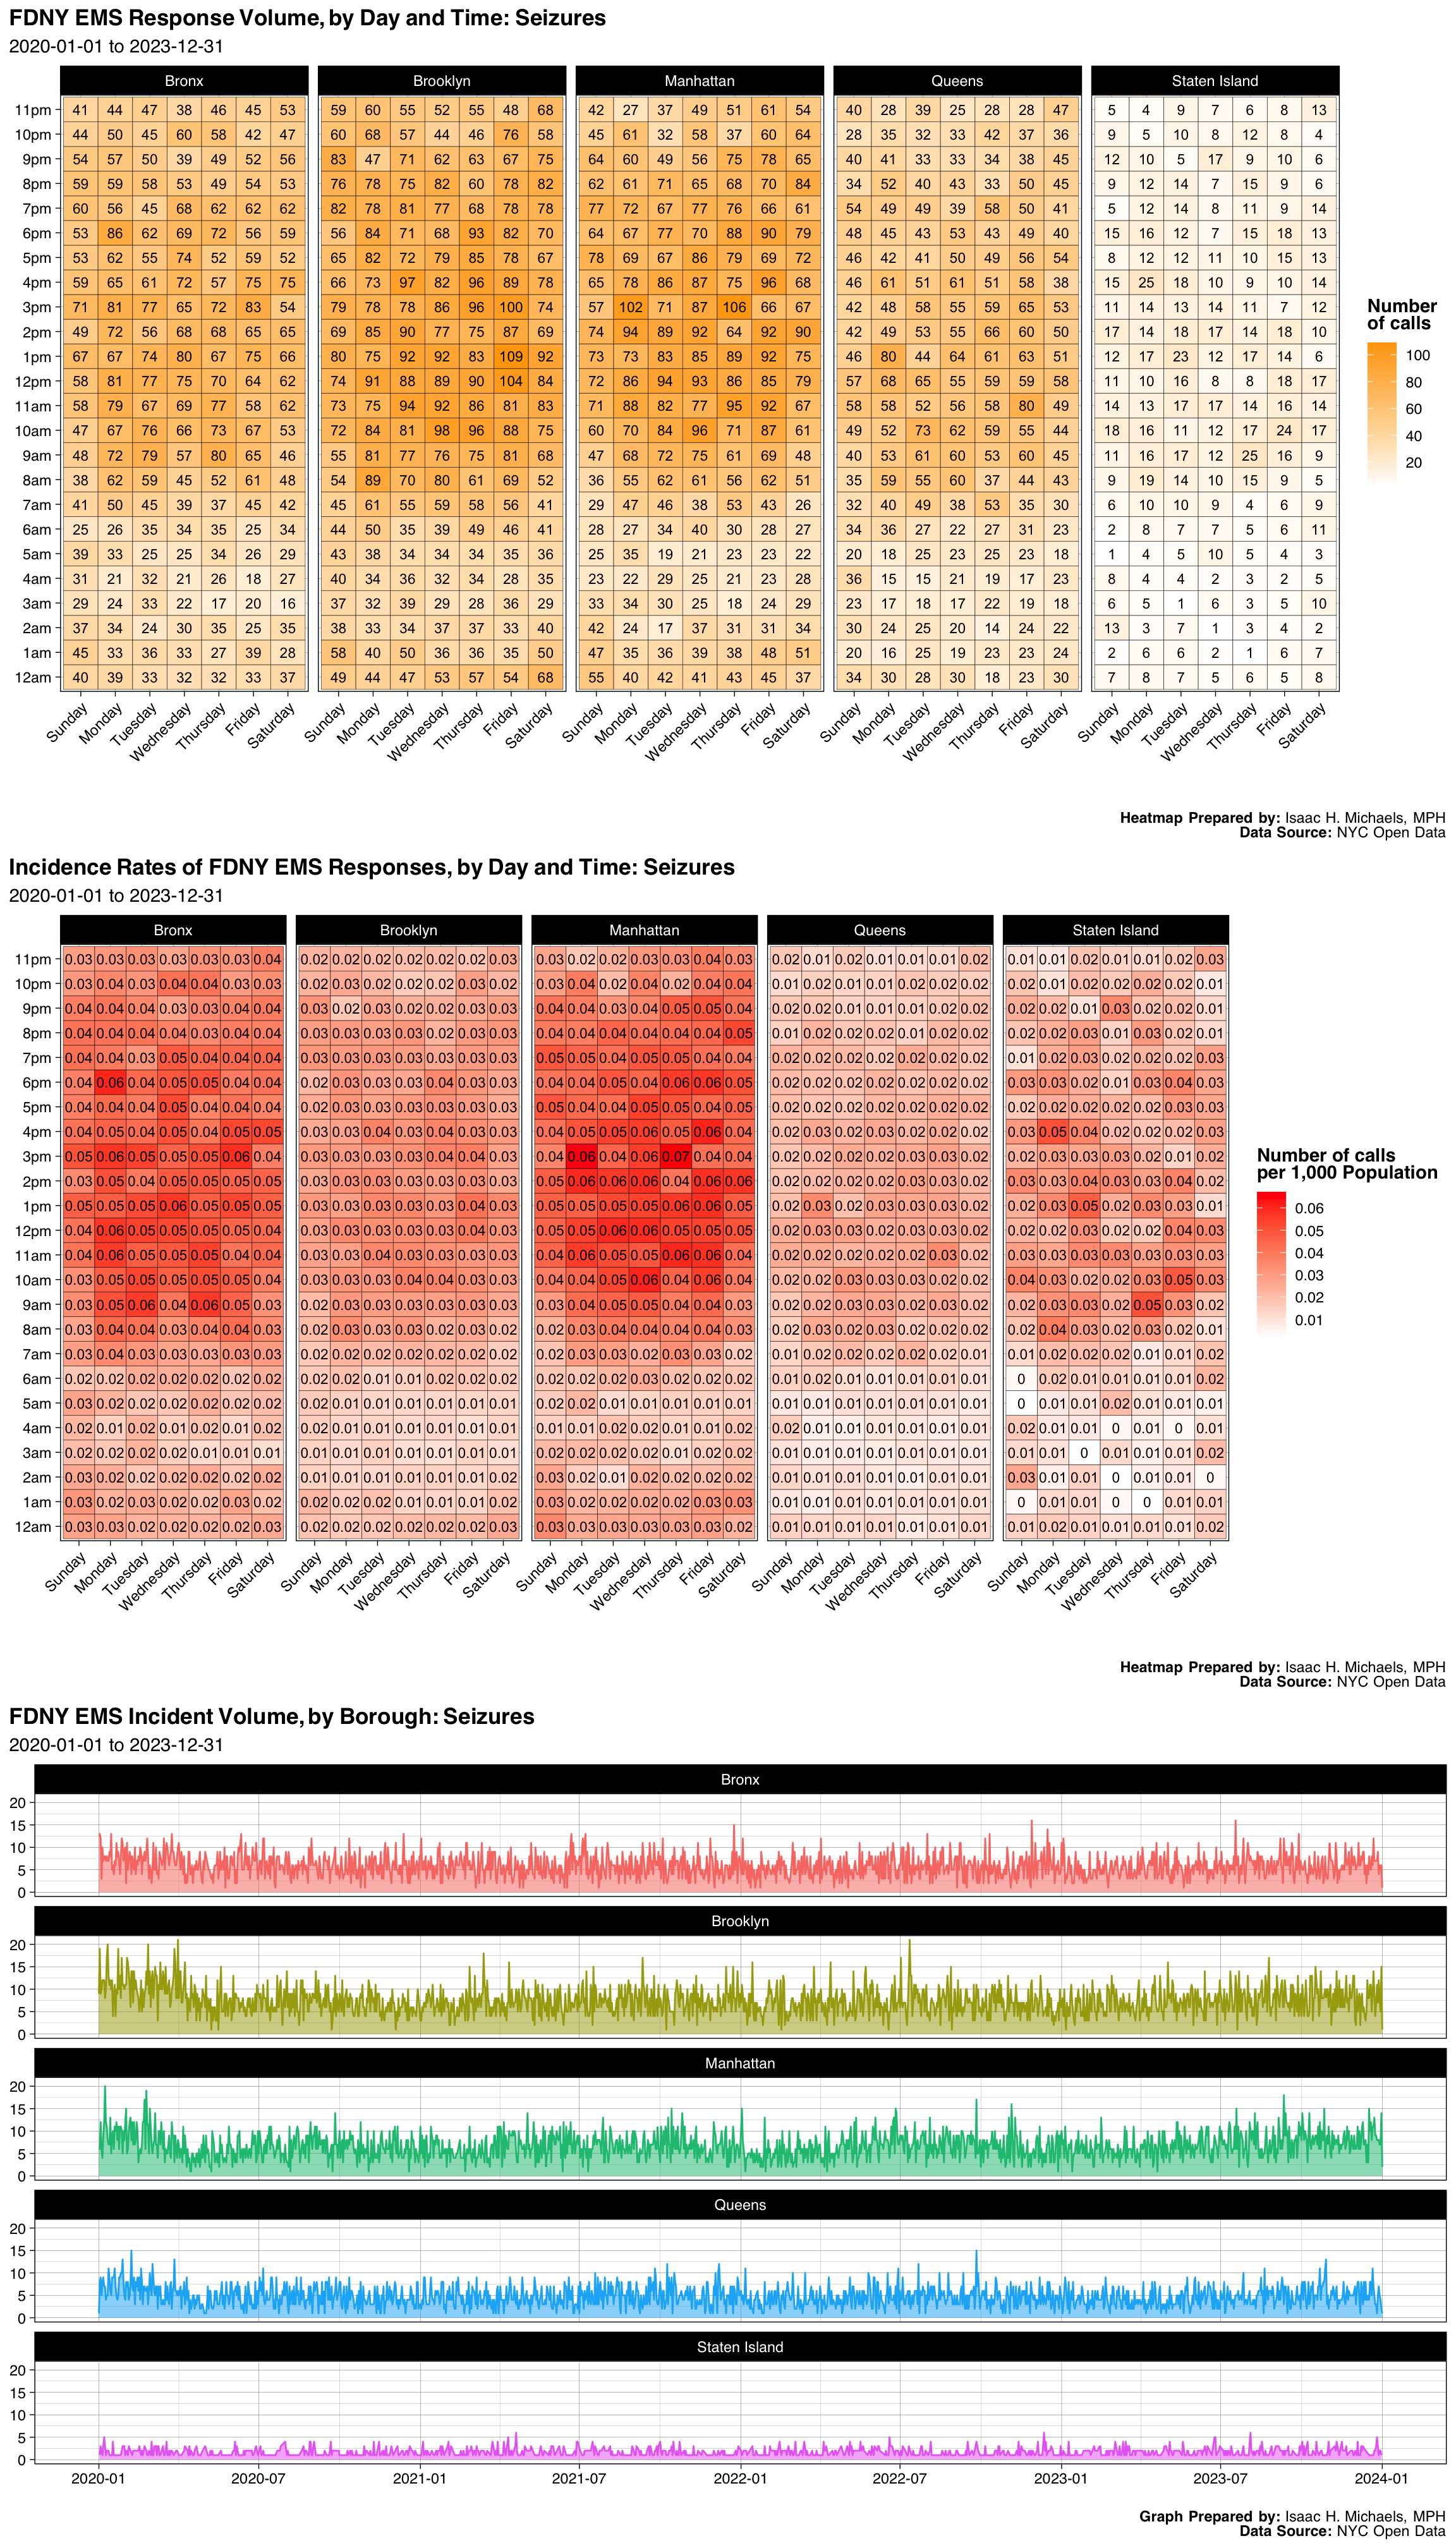
| Borough | Number | Percent |
|---|---|---|
| Bronx | 8573 | 0.2266191 |
| Brooklyn | 10863 | 0.2871531 |
| Manhattan | 9793 | 0.2588686 |
| Queens | 6910 | 0.1826593 |
| Staten Island | 1691 | 0.0447000 |
| Final Severity Level | Number | Percent |
|---|---|---|
| 1 | 2 | 5.28680941052075e-05 |
| 2 | 3 | 7.93021411578113e-05 |
| 3 | 37818 | 0.999682791435369 |
| 4 | 6 | 0.000158604282315623 |
| 5 | 0 | 0% |
| 6 | 1 | 2.64340470526038e-05 |
| 7 | 0 | 0% |
| 8 | 0 | 0% |
| Disposition | Number | Percent |
|---|---|---|
| Transporting Patient | 26771 | 0.7076659 |
| Refused Medical Aid | 6904 | 0.1825007 |
| Unfounded | 1869 | 0.0494052 |
| Patient Gone on Arrival | 1545 | 0.0408406 |
| Cancelled | 503 | 0.0132963 |
| Condition Corrected | 97 | 0.0025641 |
| Treated and Transported | 67 | 0.0017711 |
| Other | 52 | 0.0013746 |
| Triaged at Scene No Transport | 12 | 0.0003172 |
| Patient Pronounced Dead | 10 | 0.0002643 |
Graphs, Heatmaps, and Tables Prepared By: Isaac H. Michaels, MPH
Data Source: NYC Open Data
Back to top
Stabbing
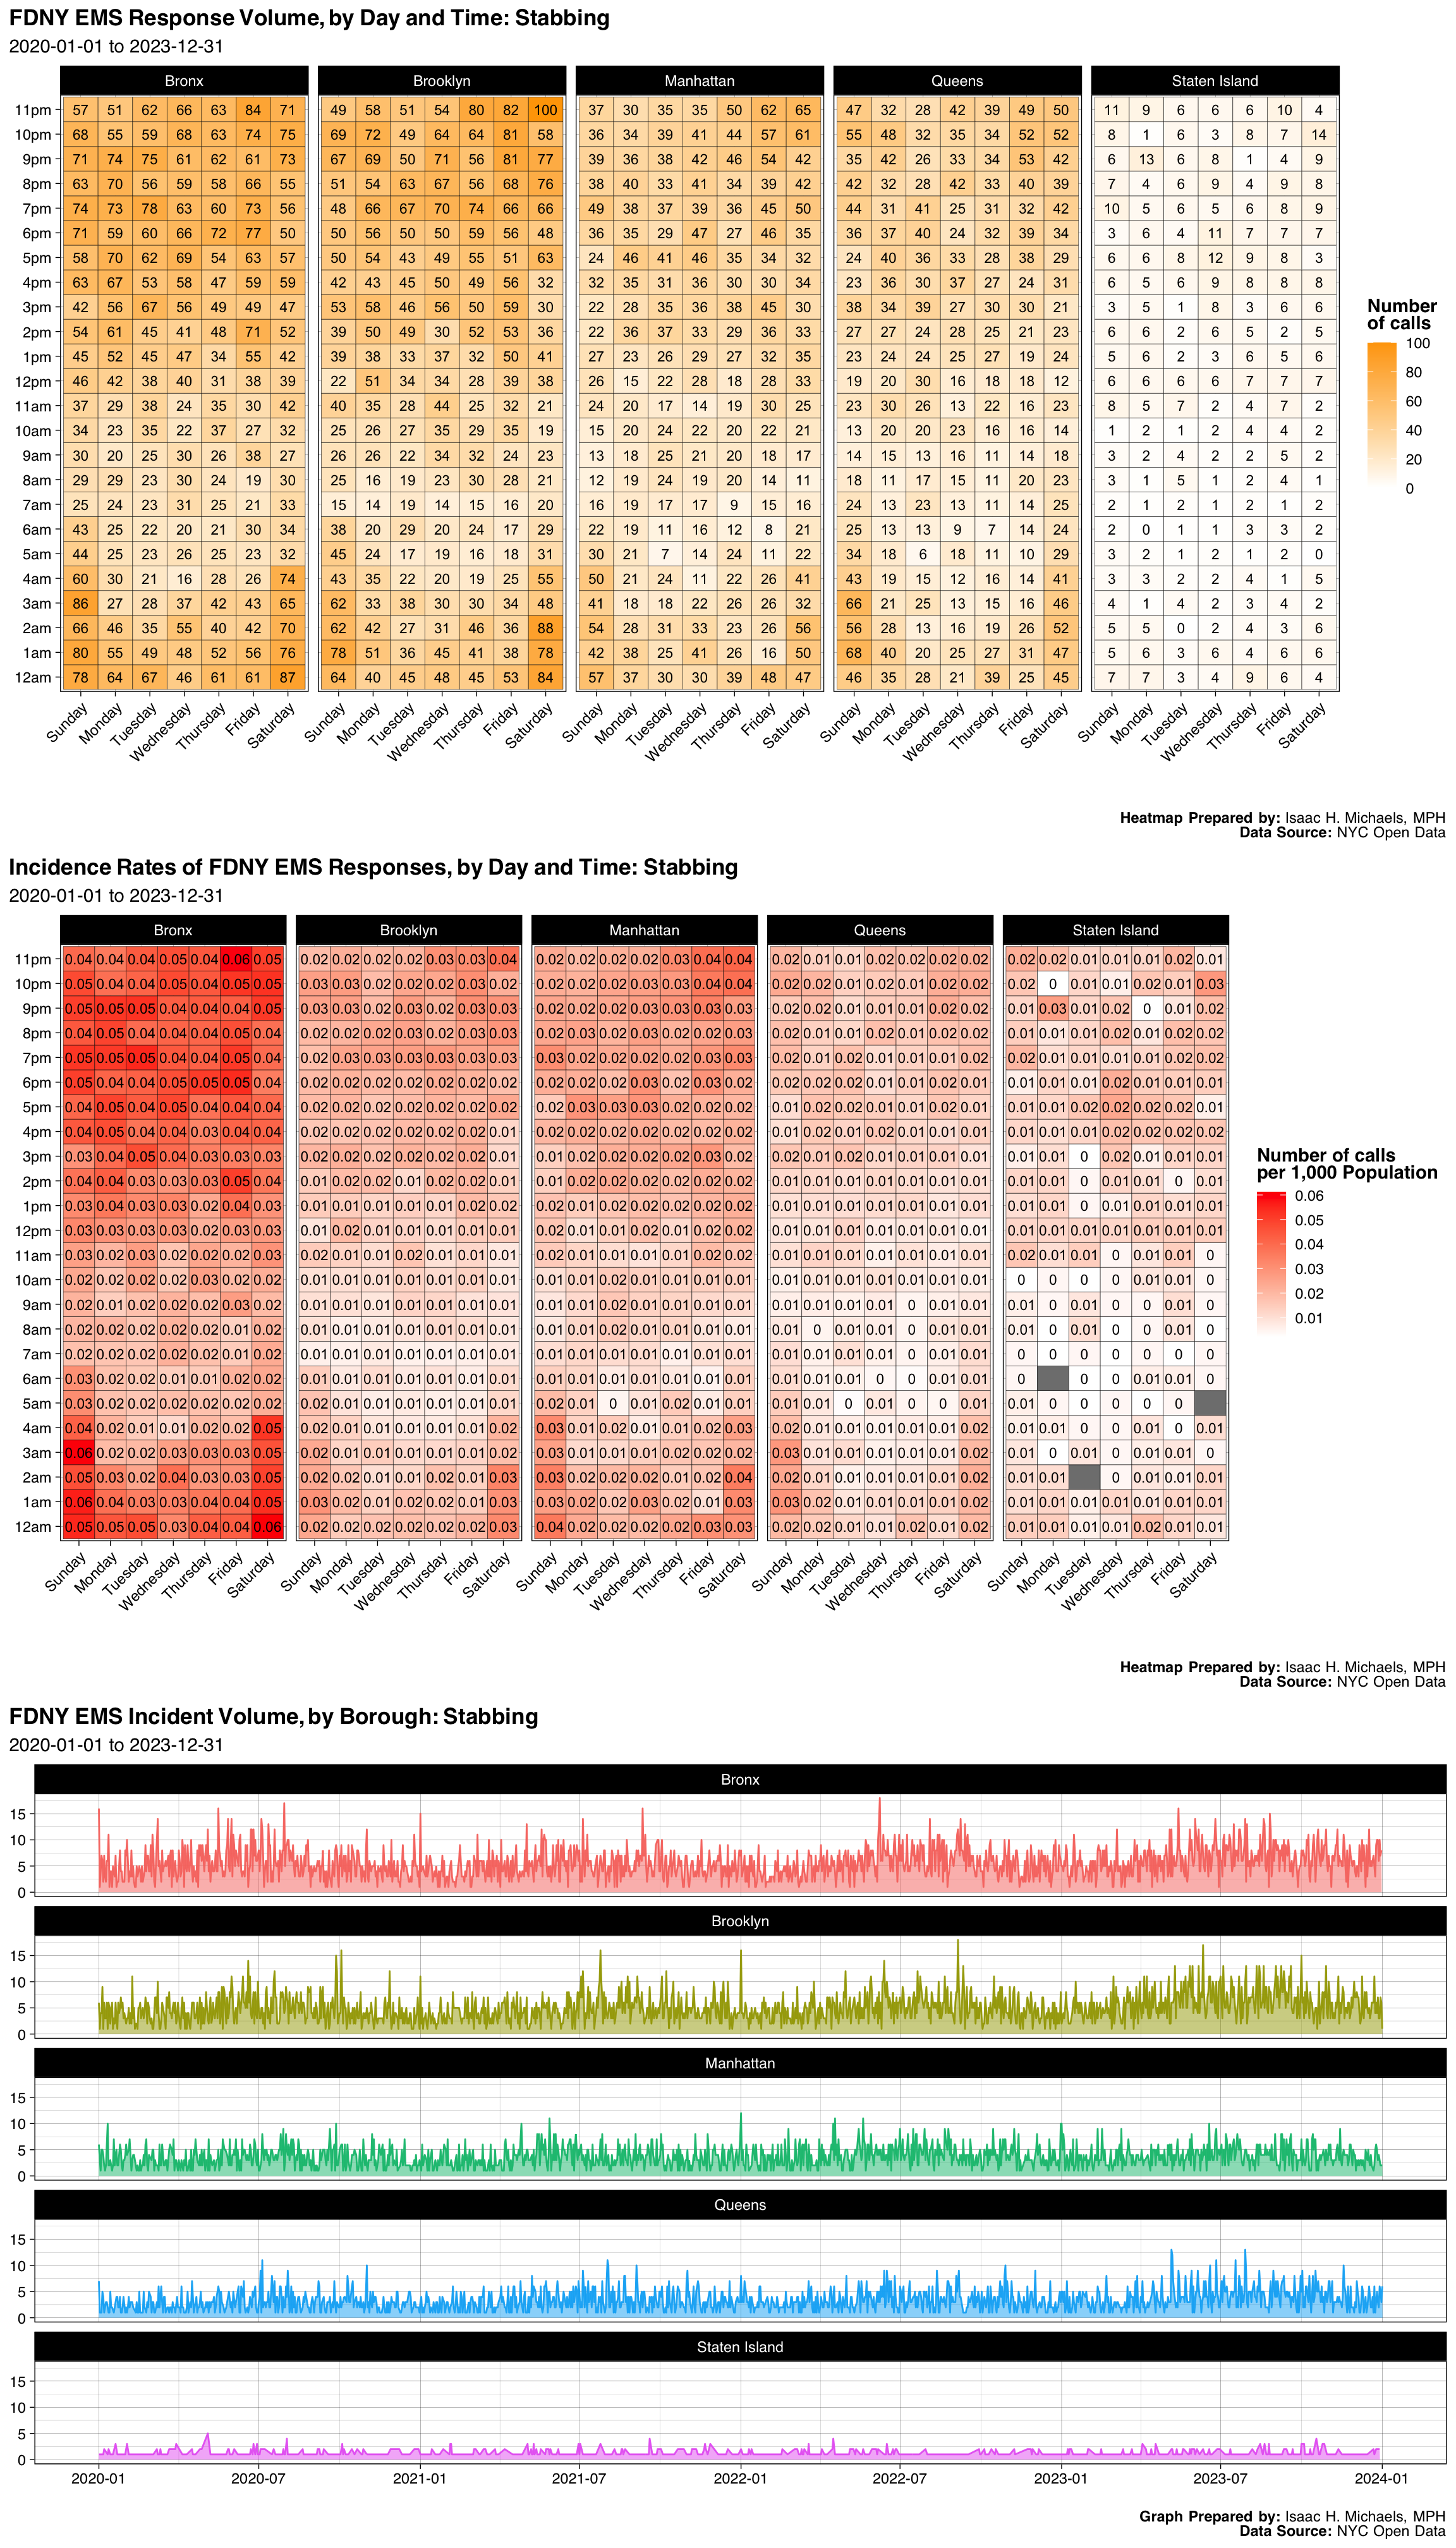
| Borough | Number | Percent |
|---|---|---|
| Bronx | 8140 | 0.3130167 |
| Brooklyn | 7324 | 0.2816381 |
| Manhattan | 5100 | 0.1961161 |
| Queens | 4647 | 0.1786964 |
| Staten Island | 794 | 0.0305326 |
| Final Severity Level | Number | Percent |
|---|---|---|
| 1 | 0 | 0% |
| 2 | 3 | 0.000115362430301865 |
| 3 | 26002 | 0.999884637569698 |
| 4 | 0 | 0% |
| 5 | 0 | 0% |
| 6 | 0 | 0% |
| 7 | 0 | 0% |
| 8 | 0 | 0% |
| Disposition | Number | Percent |
|---|---|---|
| Transporting Patient | 12129 | 0.4664103 |
| Unfounded | 5928 | 0.2279562 |
| Refused Medical Aid | 3288 | 0.1264372 |
| Condition Corrected | 2375 | 0.0913286 |
| Patient Gone on Arrival | 1231 | 0.0473371 |
| Cancelled | 860 | 0.0330706 |
| Other | 156 | 0.0059988 |
| Treated and Transported | 19 | 0.0007306 |
| Patient Pronounced Dead | 11 | 0.0004230 |
| Triaged at Scene No Transport | 7 | 0.0002692 |
| Treated Not Transported | 1 | 0.0000385 |
Graphs, Heatmaps, and Tables Prepared By: Isaac H. Michaels, MPH
Data Source: NYC Open Data
Back to top
Multiple Trauma Patient
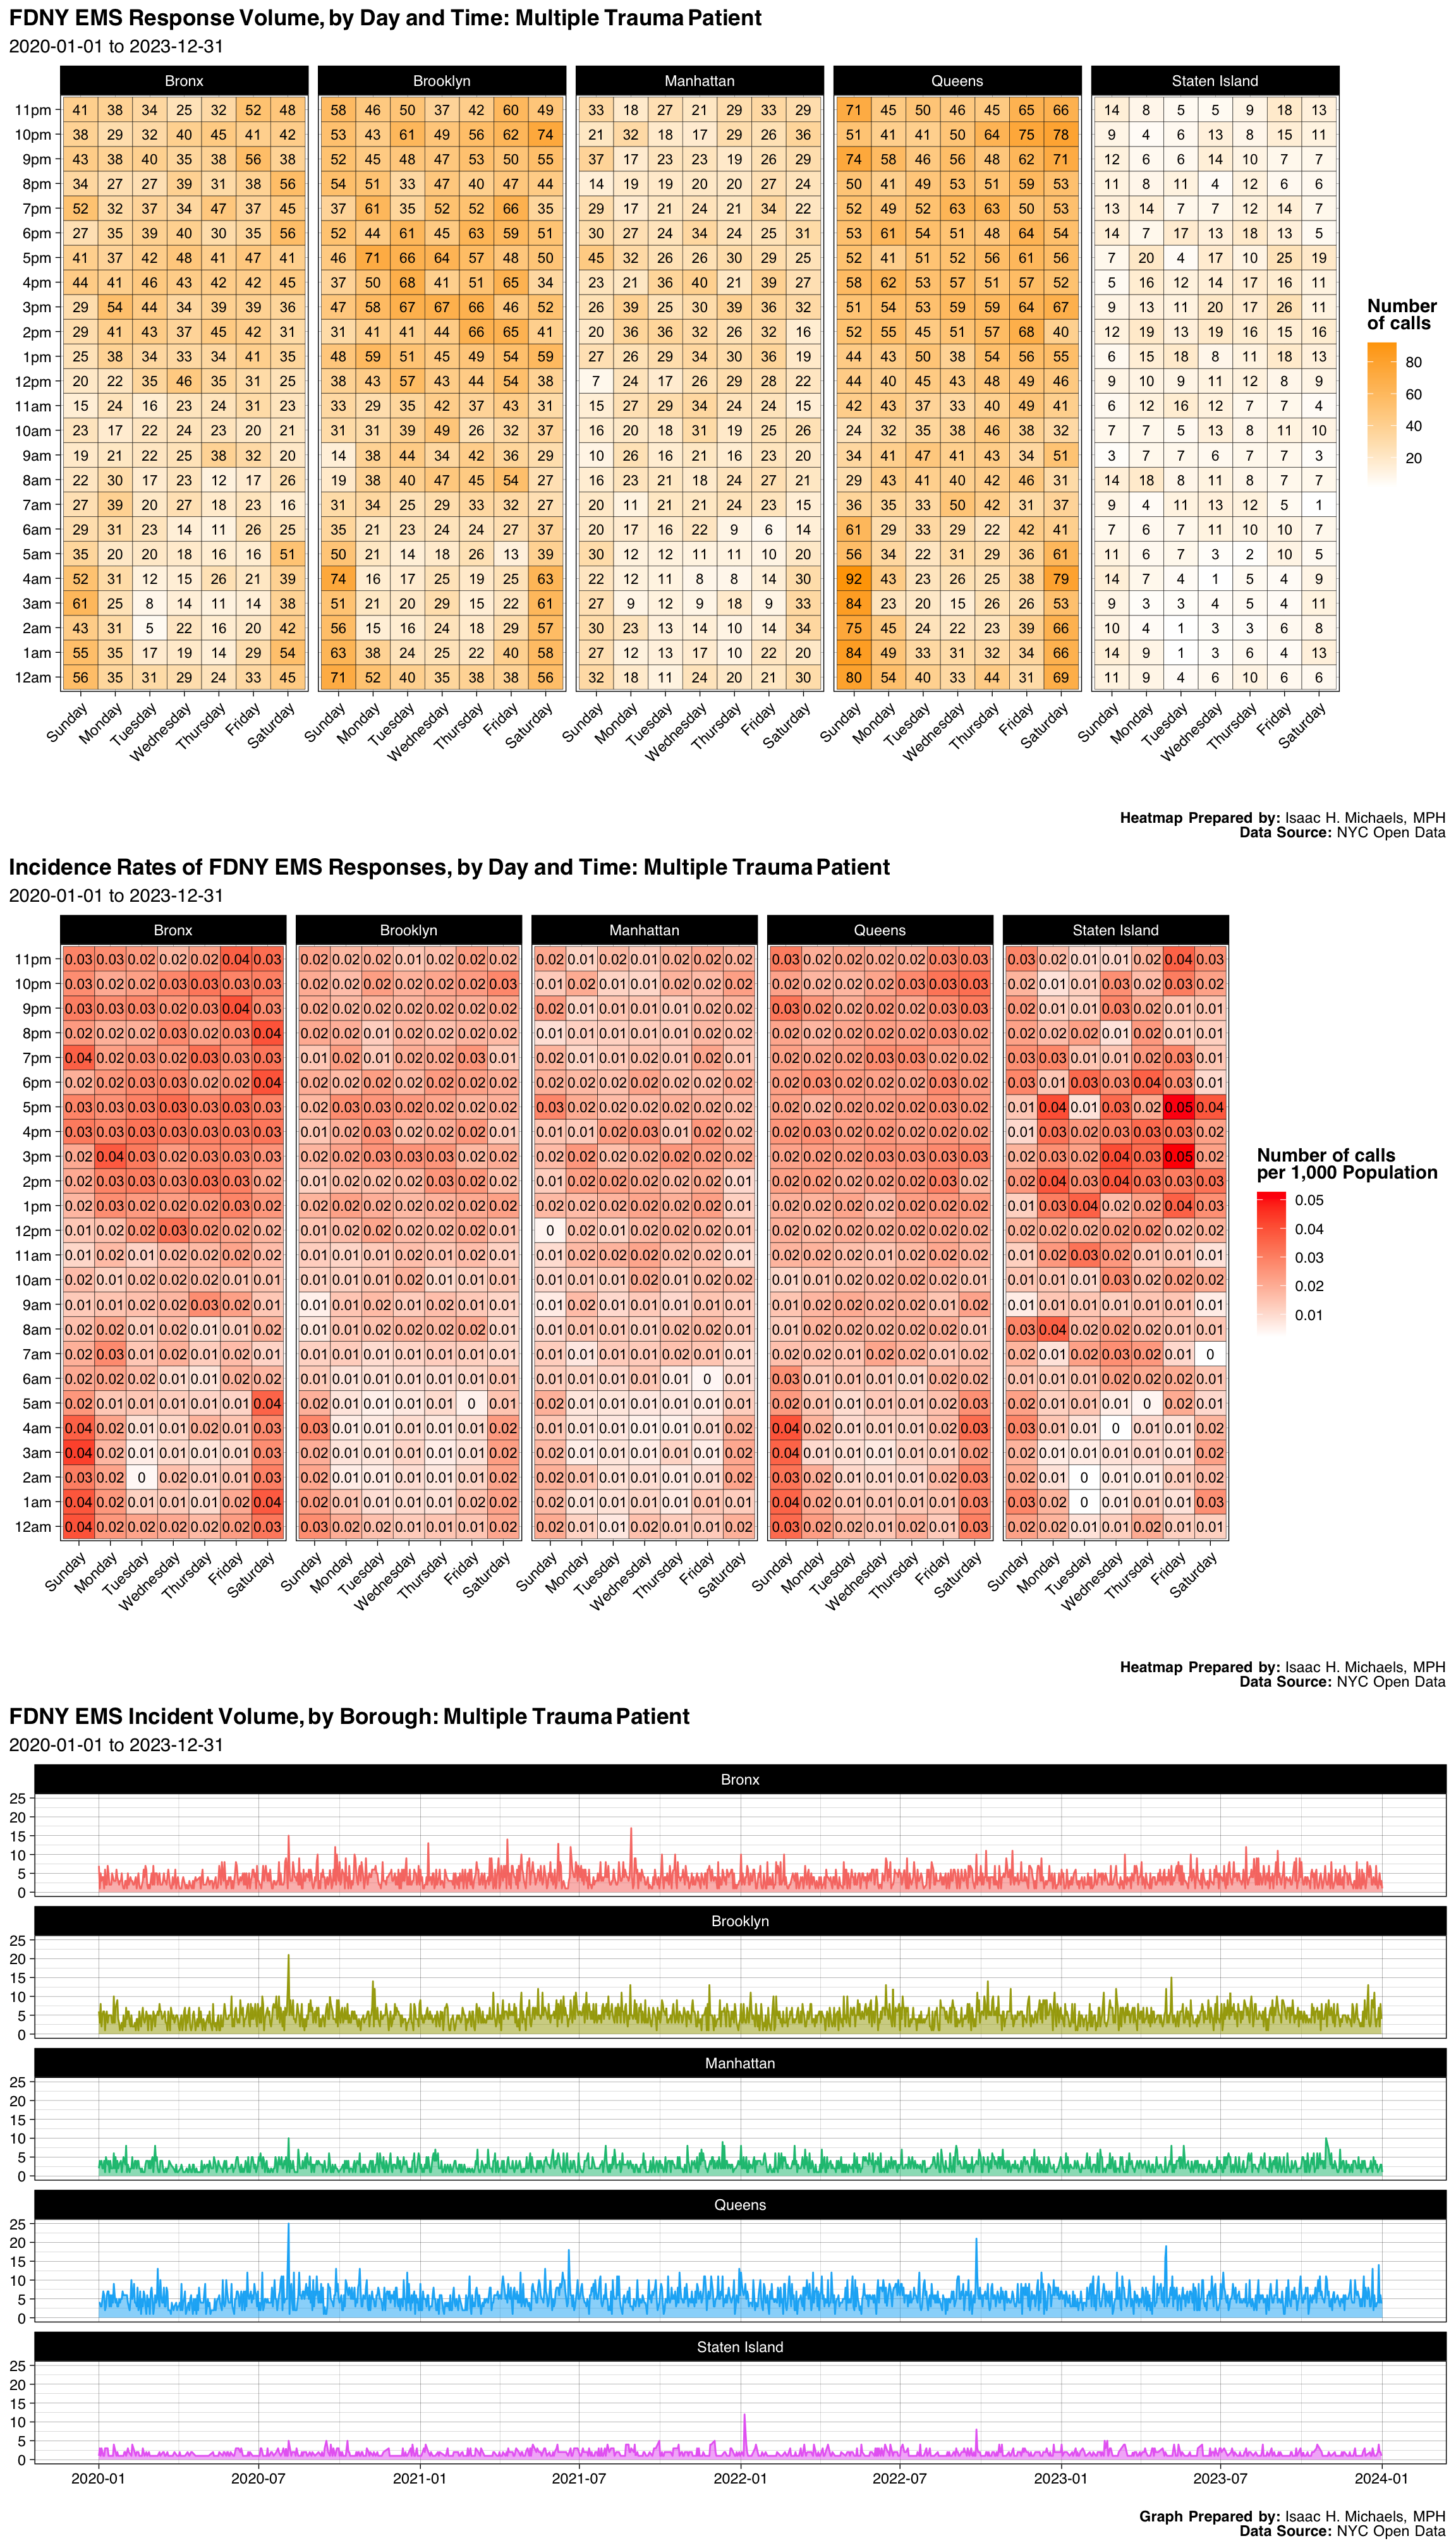
| Borough | Number | Percent |
|---|---|---|
| Bronx | 5377 | 0.2076302 |
| Brooklyn | 7139 | 0.2756690 |
| Manhattan | 3835 | 0.1480867 |
| Queens | 7945 | 0.3067923 |
| Staten Island | 1601 | 0.0618218 |
| Final Severity Level | Number | Percent |
|---|---|---|
| 1 | 1 | 3.86145113333591e-05 |
| 2 | 25874 | 0.999111866239333 |
| 3 | 2 | 7.72290226667182e-05 |
| 4 | 19 | 0.000733675715333822 |
| 5 | 1 | 3.86145113333591e-05 |
| 6 | 0 | 0% |
| 7 | 0 | 0% |
| 8 | 0 | 0% |
| Disposition | Number | Percent |
|---|---|---|
| Transporting Patient | 14197 | 0.5482102 |
| Refused Medical Aid | 4629 | 0.1787466 |
| Cancelled | 2255 | 0.0870757 |
| Unfounded | 1907 | 0.0736379 |
| Condition Corrected | 1754 | 0.0677299 |
| Patient Gone on Arrival | 733 | 0.0283044 |
| Other | 205 | 0.0079160 |
| Patient Pronounced Dead | 186 | 0.0071823 |
| Treated and Transported | 30 | 0.0011584 |
| Triaged at Scene No Transport | 1 | 0.0000386 |
Graphs, Heatmaps, and Tables Prepared By: Isaac H. Michaels, MPH
Data Source: NYC Open Data
Back to top
Asthma Attack
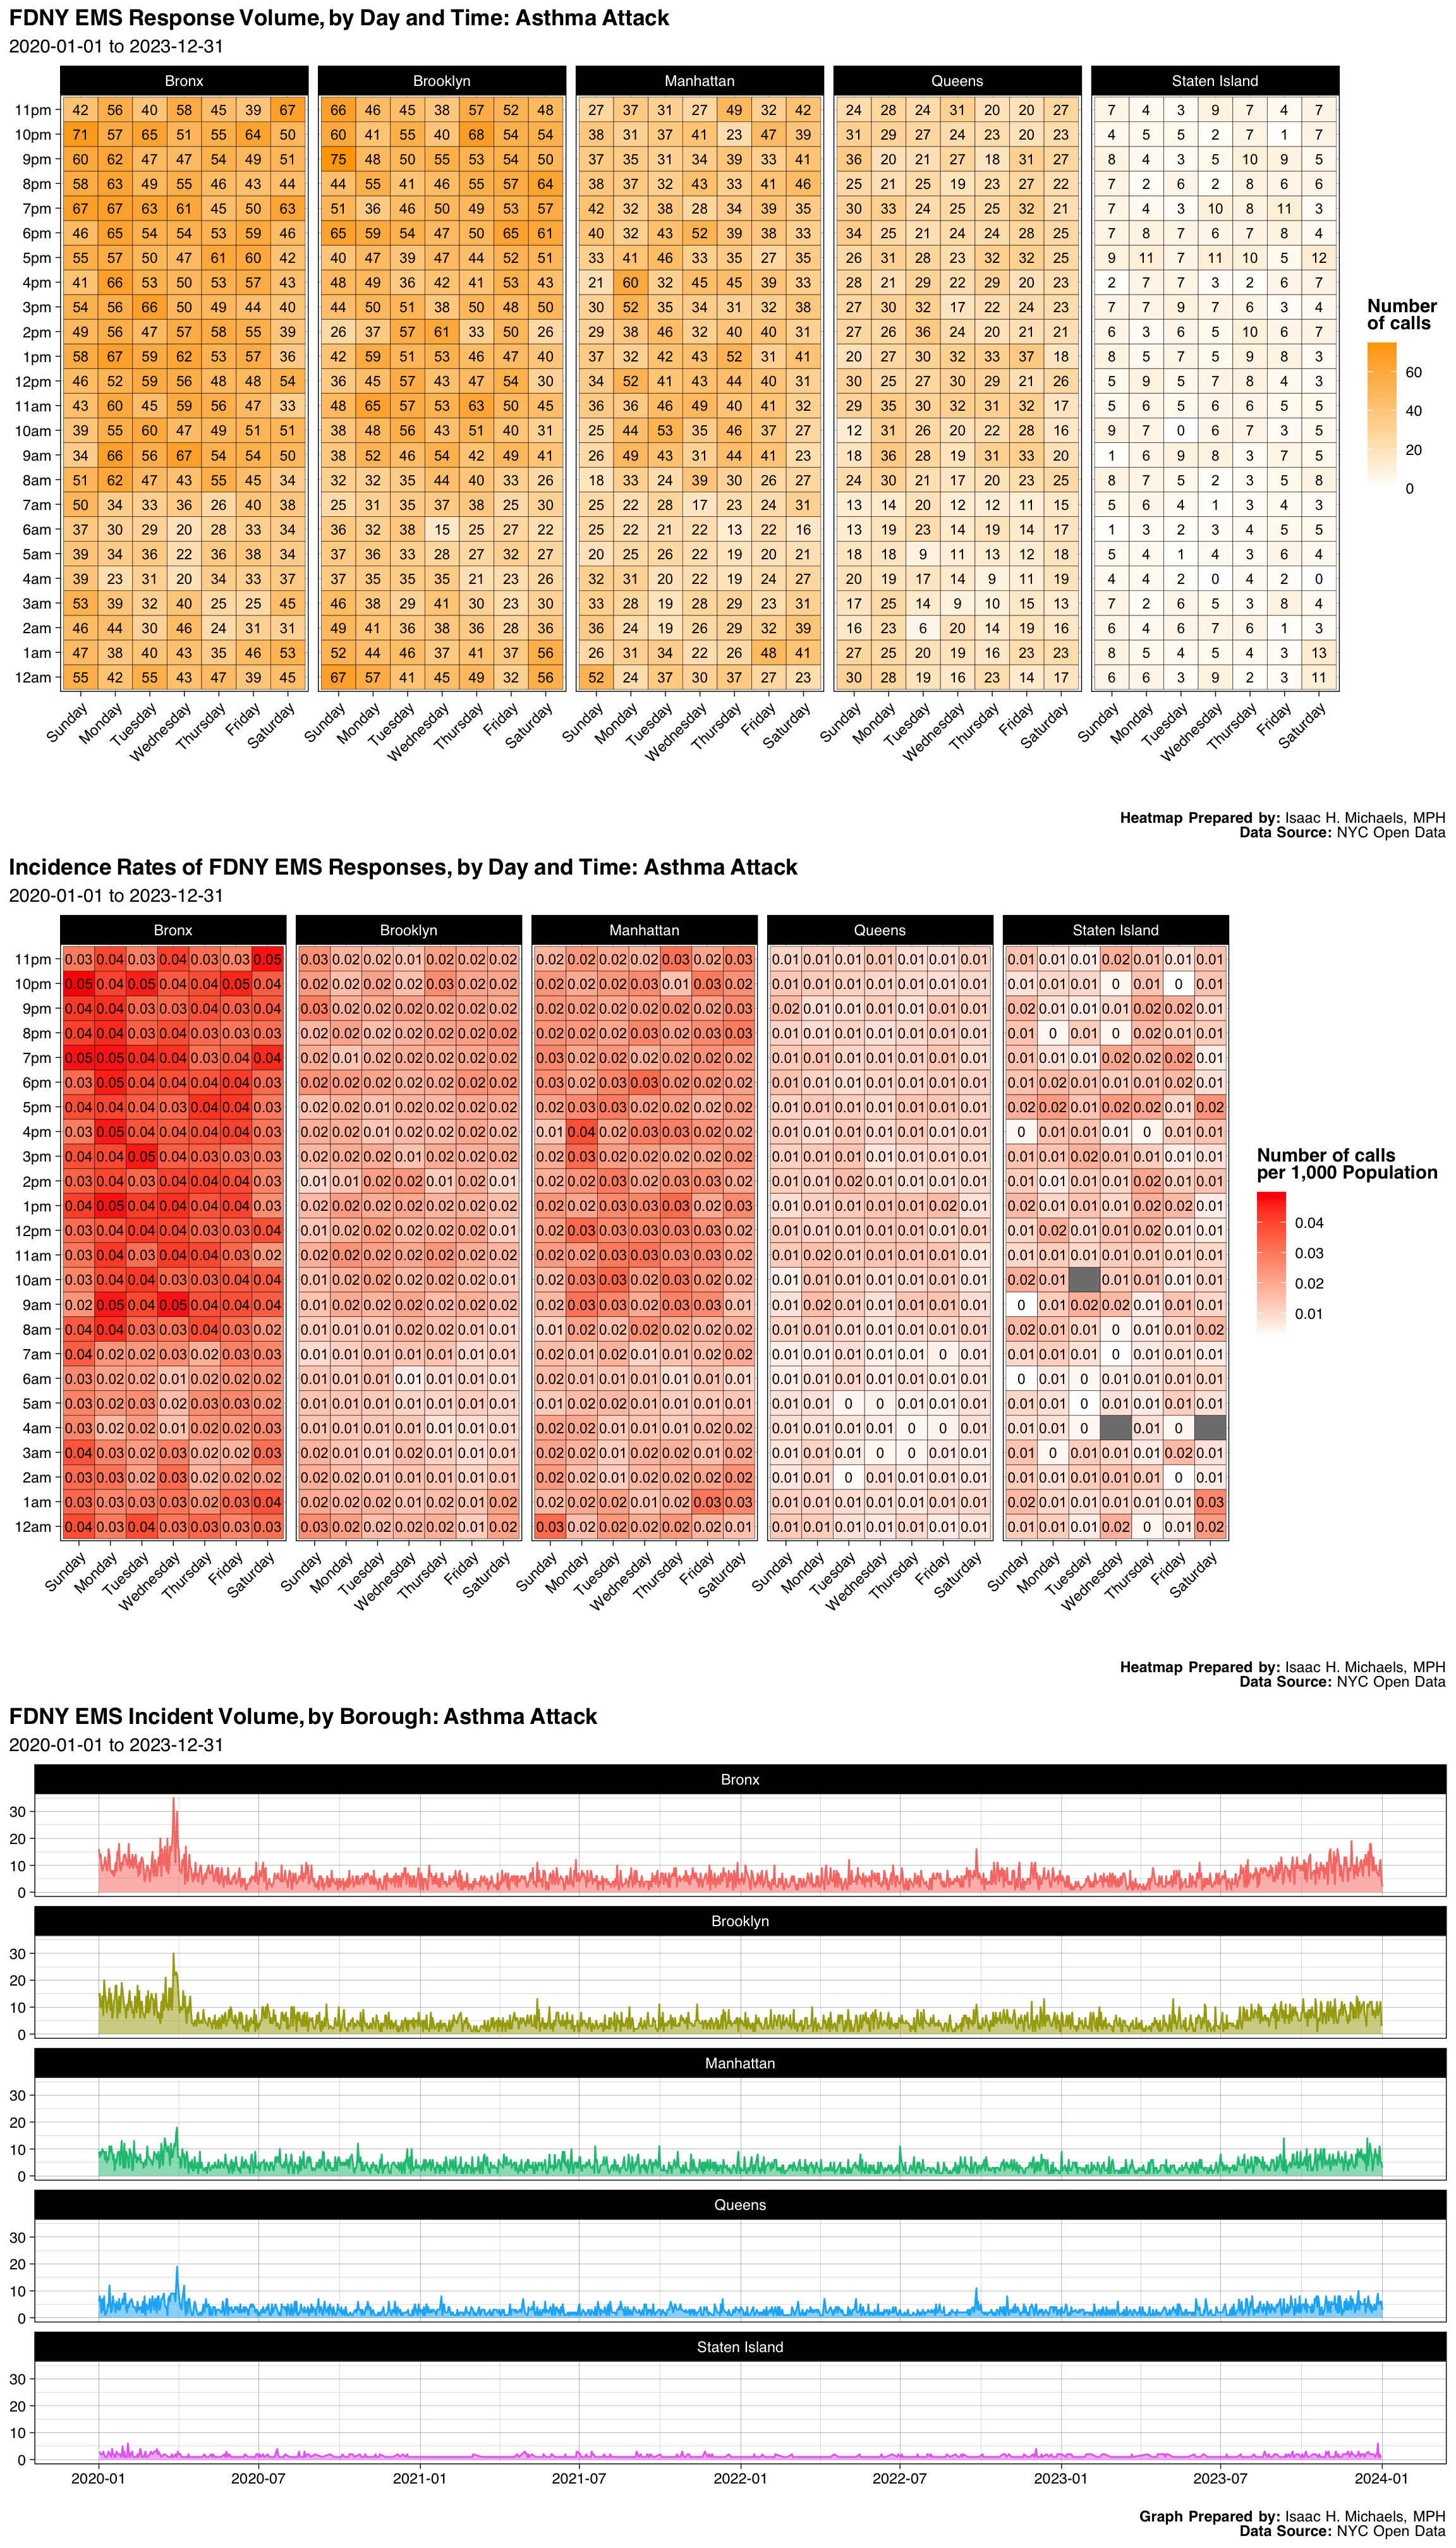
| Borough | Number | Percent |
|---|---|---|
| Bronx | 7967 | 0.3099156 |
| Brooklyn | 7378 | 0.2870035 |
| Manhattan | 5636 | 0.2192399 |
| Queens | 3815 | 0.1484032 |
| Staten Island | 911 | 0.0354378 |
| Final Severity Level | Number | Percent |
|---|---|---|
| 1 | 0 | 0% |
| 2 | 25702 | 0.999805500447349 |
| 3 | 1 | 3.88999105302058e-05 |
| 4 | 4 | 0.000155599642120823 |
| 5 | 0 | 0% |
| 6 | 0 | 0% |
| 7 | 0 | 0% |
| 8 | 0 | 0% |
| Disposition | Number | Percent |
|---|---|---|
| Transporting Patient | 18294 | 0.7116350 |
| Refused Medical Aid | 5390 | 0.2096705 |
| Unfounded | 1134 | 0.0441125 |
| Patient Gone on Arrival | 459 | 0.0178551 |
| Cancelled | 195 | 0.0075855 |
| Condition Corrected | 175 | 0.0068075 |
| Other | 33 | 0.0012837 |
| Treated and Transported | 12 | 0.0004668 |
| Triaged at Scene No Transport | 11 | 0.0004279 |
| Patient Pronounced Dead | 4 | 0.0001556 |
Graphs, Heatmaps, and Tables Prepared By: Isaac H. Michaels, MPH
Data Source: NYC Open Data
Back to top
Anaphylaxis
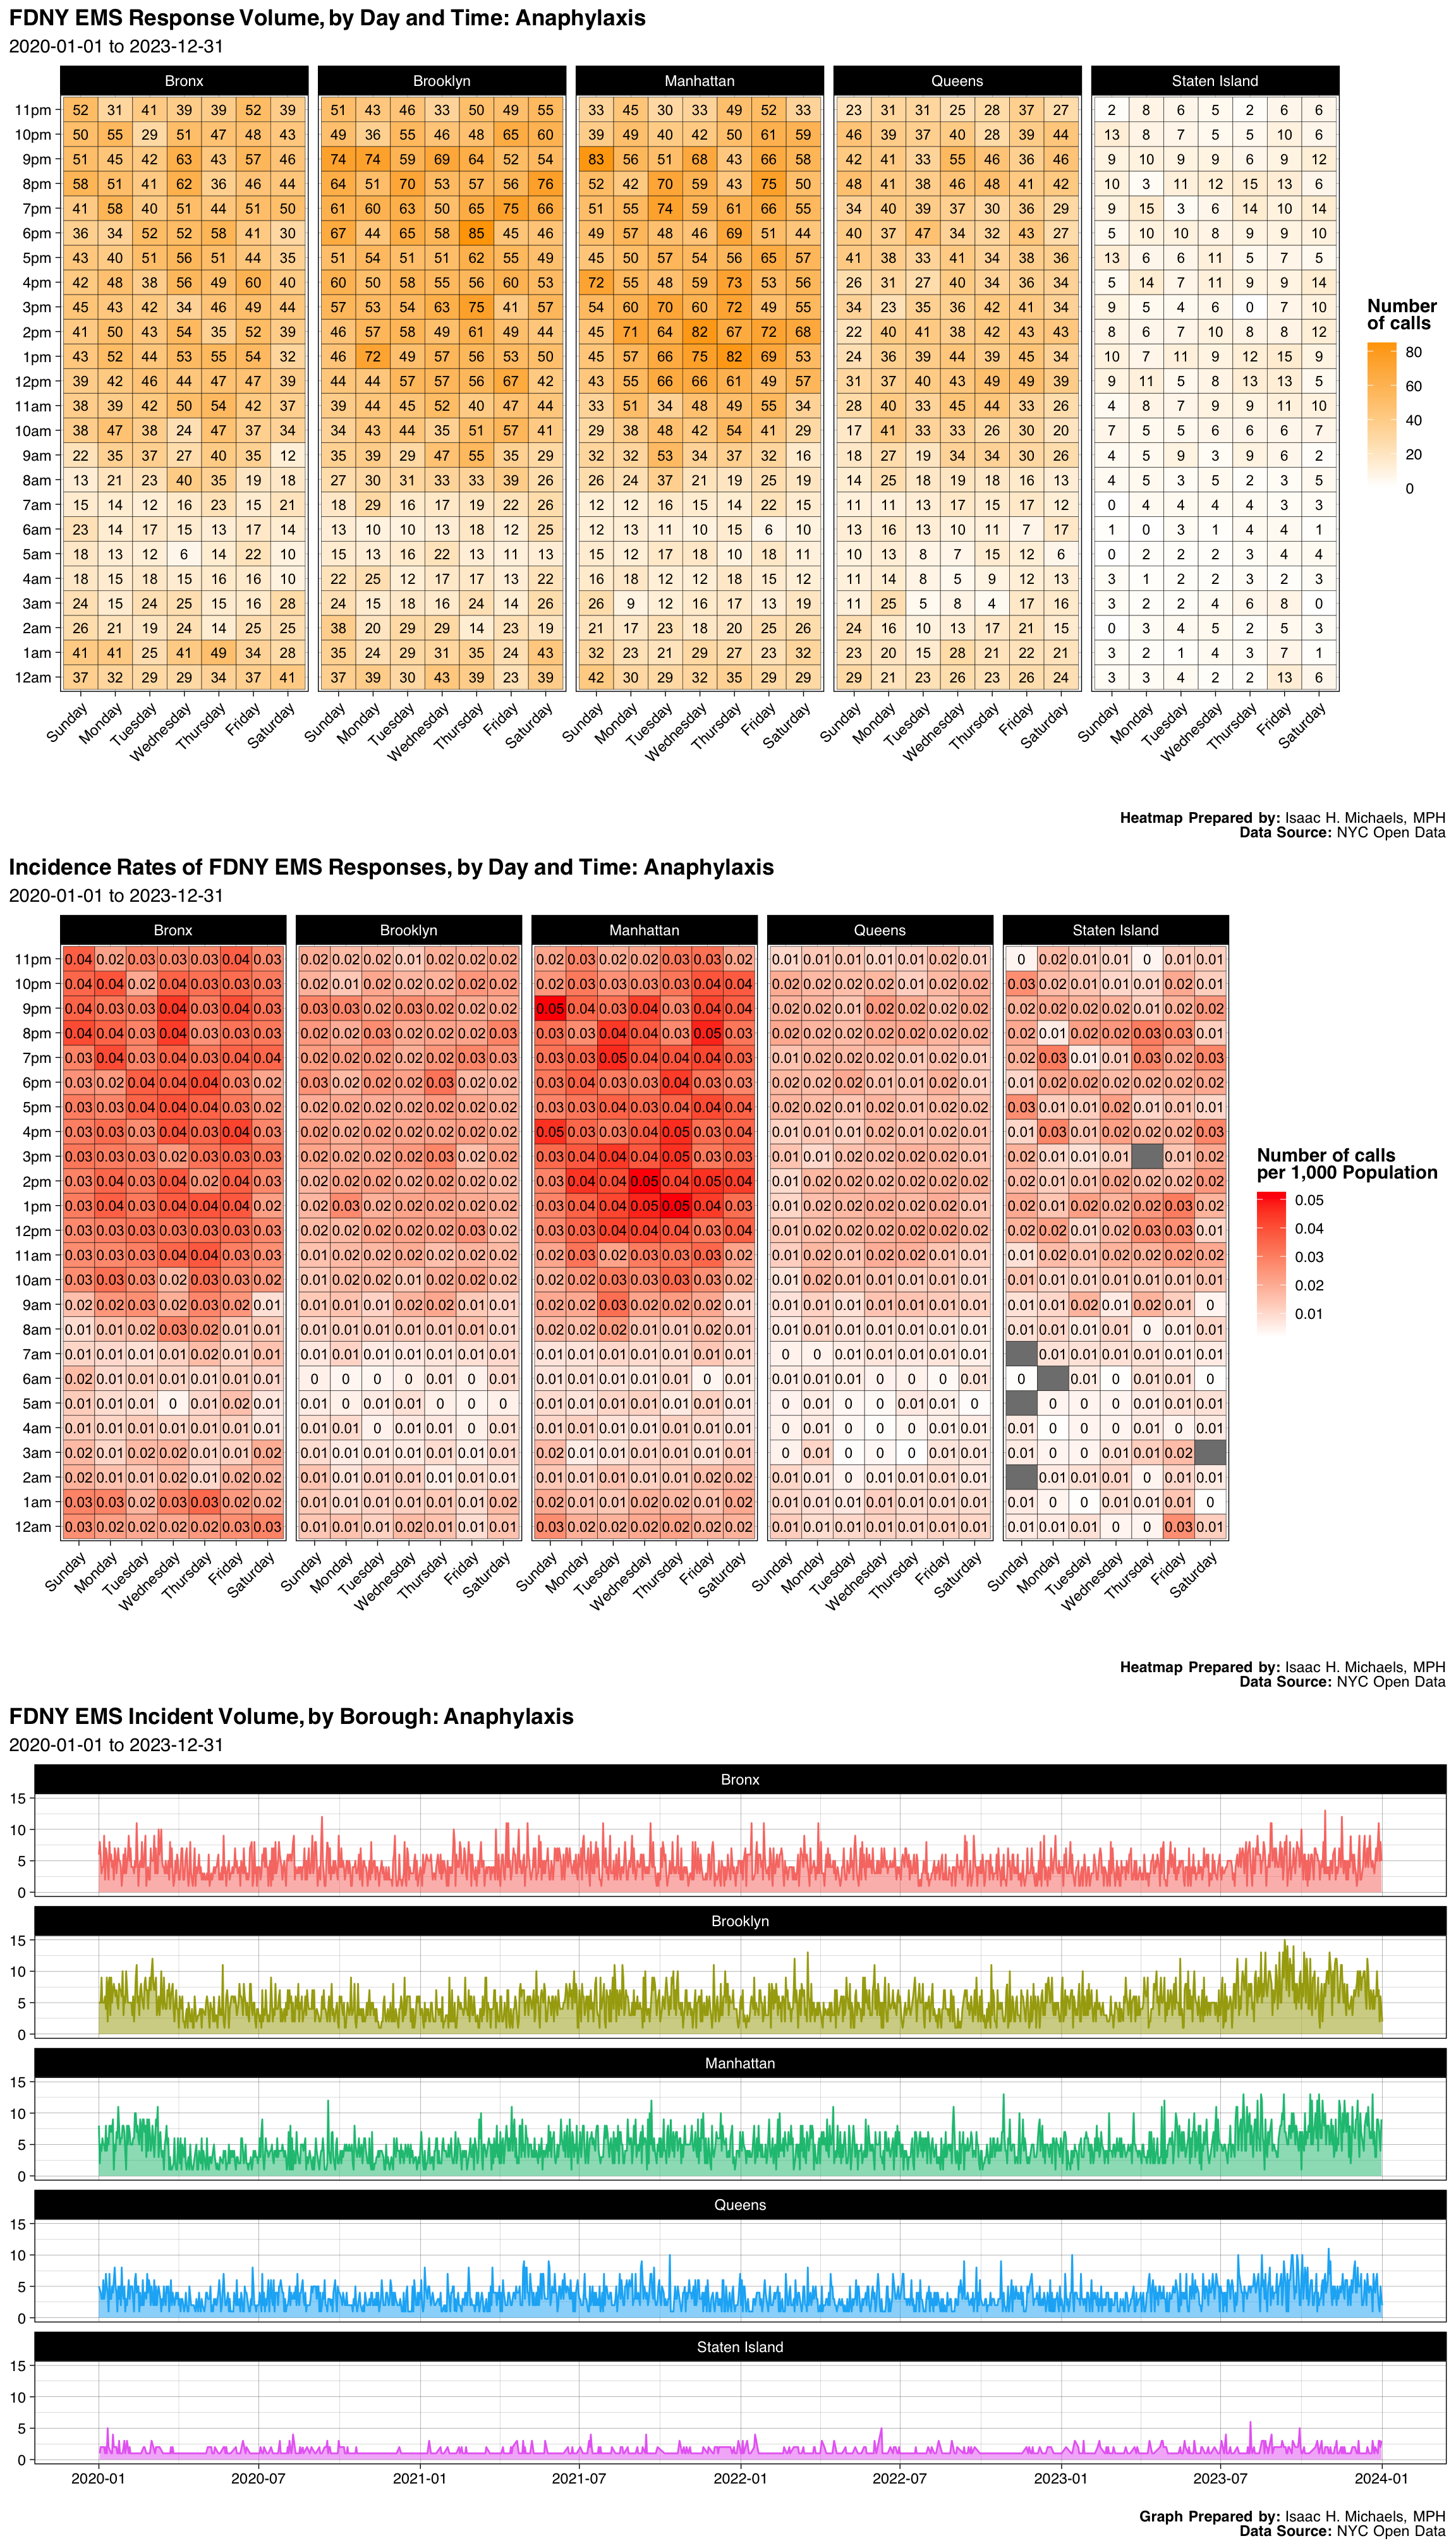
| Borough | Number | Percent |
|---|---|---|
| Bronx | 6021 | 0.2345631 |
| Brooklyn | 7051 | 0.2746893 |
| Manhattan | 6803 | 0.2650279 |
| Queens | 4745 | 0.1848533 |
| Staten Island | 1049 | 0.0408664 |
| Final Severity Level | Number | Percent |
|---|---|---|
| 1 | 0 | 0% |
| 2 | 25619 | 0.998052125131482 |
| 3 | 0 | 0% |
| 4 | 50 | 0.00194787486851845 |
| 5 | 0 | 0% |
| 6 | 0 | 0% |
| 7 | 0 | 0% |
| 8 | 0 | 0% |
| Disposition | Number | Percent |
|---|---|---|
| Transporting Patient | 21013 | 0.8186139 |
| Refused Medical Aid | 3735 | 0.1455063 |
| Unfounded | 401 | 0.0156220 |
| Patient Gone on Arrival | 286 | 0.0111418 |
| Cancelled | 174 | 0.0067786 |
| Condition Corrected | 21 | 0.0008181 |
| Other | 17 | 0.0006623 |
| Treated and Transported | 16 | 0.0006233 |
| Triaged at Scene No Transport | 4 | 0.0001558 |
| Patient Pronounced Dead | 2 | 0.0000779 |
Graphs, Heatmaps, and Tables Prepared By: Isaac H. Michaels, MPH
Data Source: NYC Open Data
Back to top
Abdominal Pain-Fever & Cough
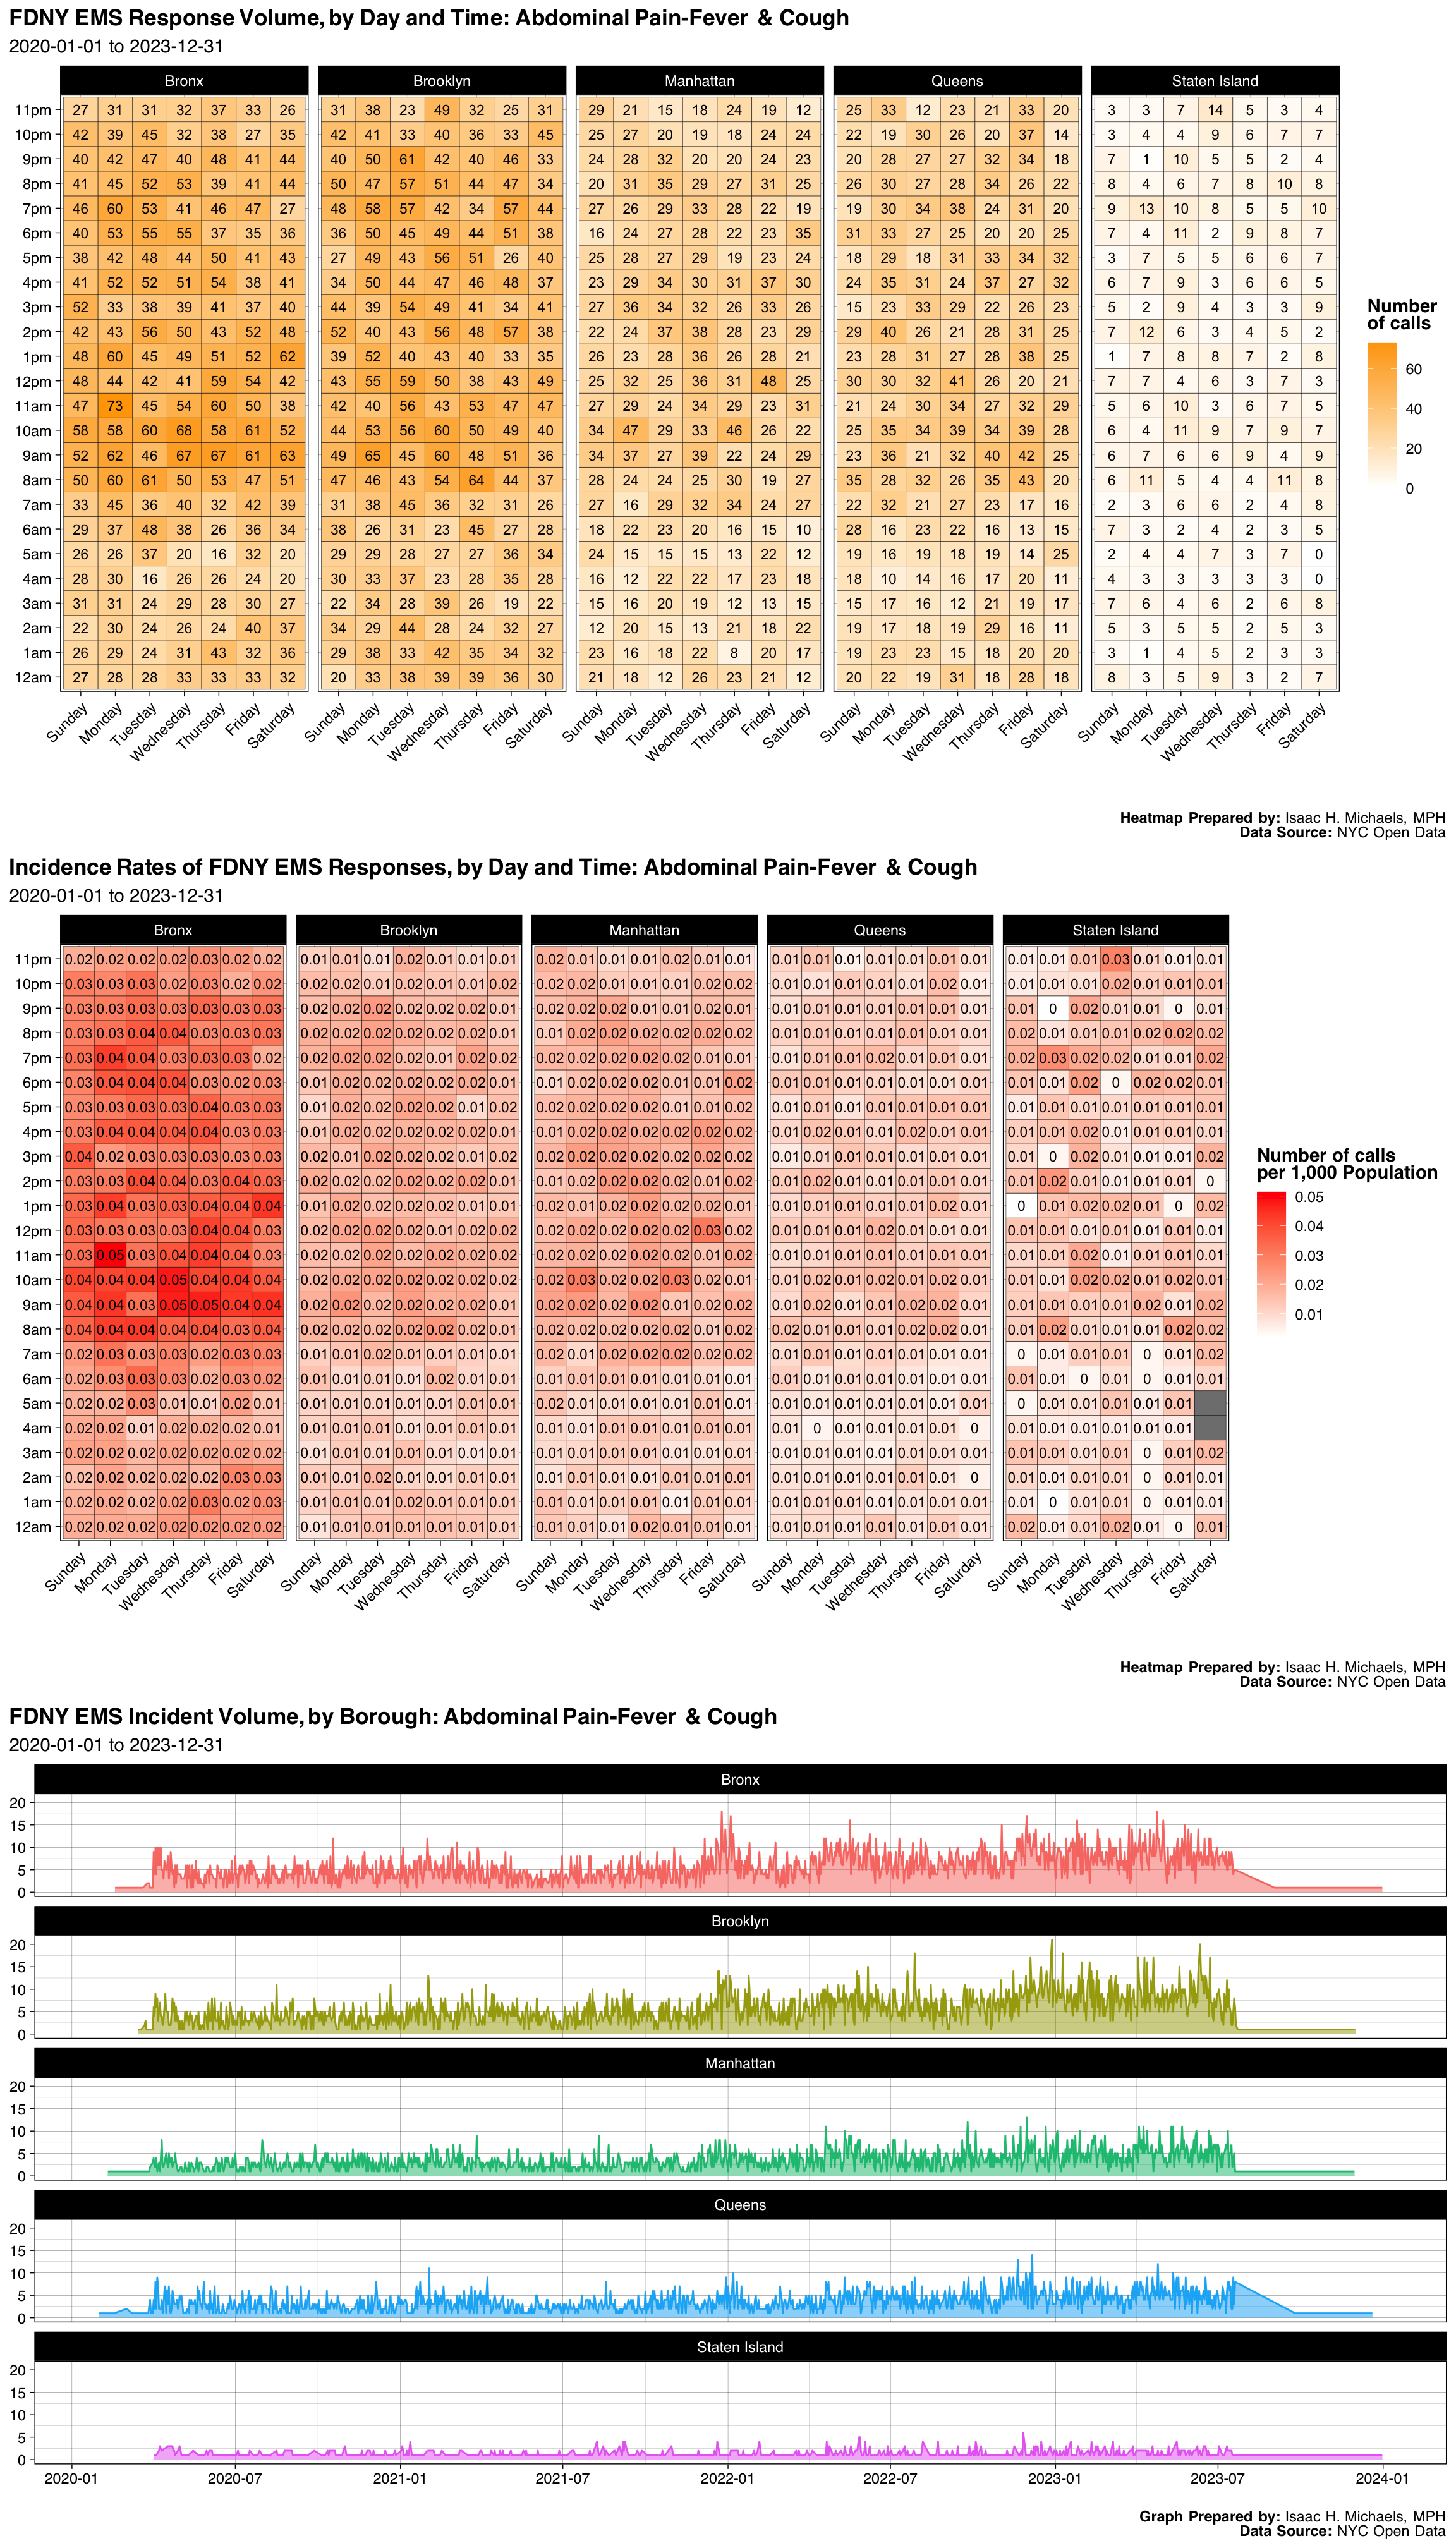
| Borough | Number | Percent |
|---|---|---|
| Bronx | 6941 | 0.3023347 |
| Brooklyn | 6783 | 0.2954526 |
| Manhattan | 4107 | 0.1788919 |
| Queens | 4203 | 0.1830734 |
| Staten Island | 924 | 0.0402474 |
| Final Severity Level | Number | Percent |
|---|---|---|
| 1 | 0 | 0% |
| 2 | 0 | 0% |
| 3 | 5 | 0.000217789006010977 |
| 4 | 719 | 0.0313180590643784 |
| 5 | 22234 | 0.968464151929611 |
| 6 | 0 | 0% |
| 7 | 0 | 0% |
| 8 | 0 | 0% |
| Disposition | Number | Percent |
|---|---|---|
| Transporting Patient | 19953 | 0.8691088 |
| Refused Medical Aid | 2271 | 0.0989198 |
| Unfounded | 386 | 0.0168133 |
| Patient Gone on Arrival | 180 | 0.0078404 |
| Cancelled | 82 | 0.0035717 |
| Other | 59 | 0.0025699 |
| Condition Corrected | 21 | 0.0009147 |
| Treated and Transported | 6 | 0.0002613 |
Graphs, Heatmaps, and Tables Prepared By: Isaac H. Michaels, MPH
Data Source: NYC Open Data
Back to top
Resp Distress - Fever&Cough
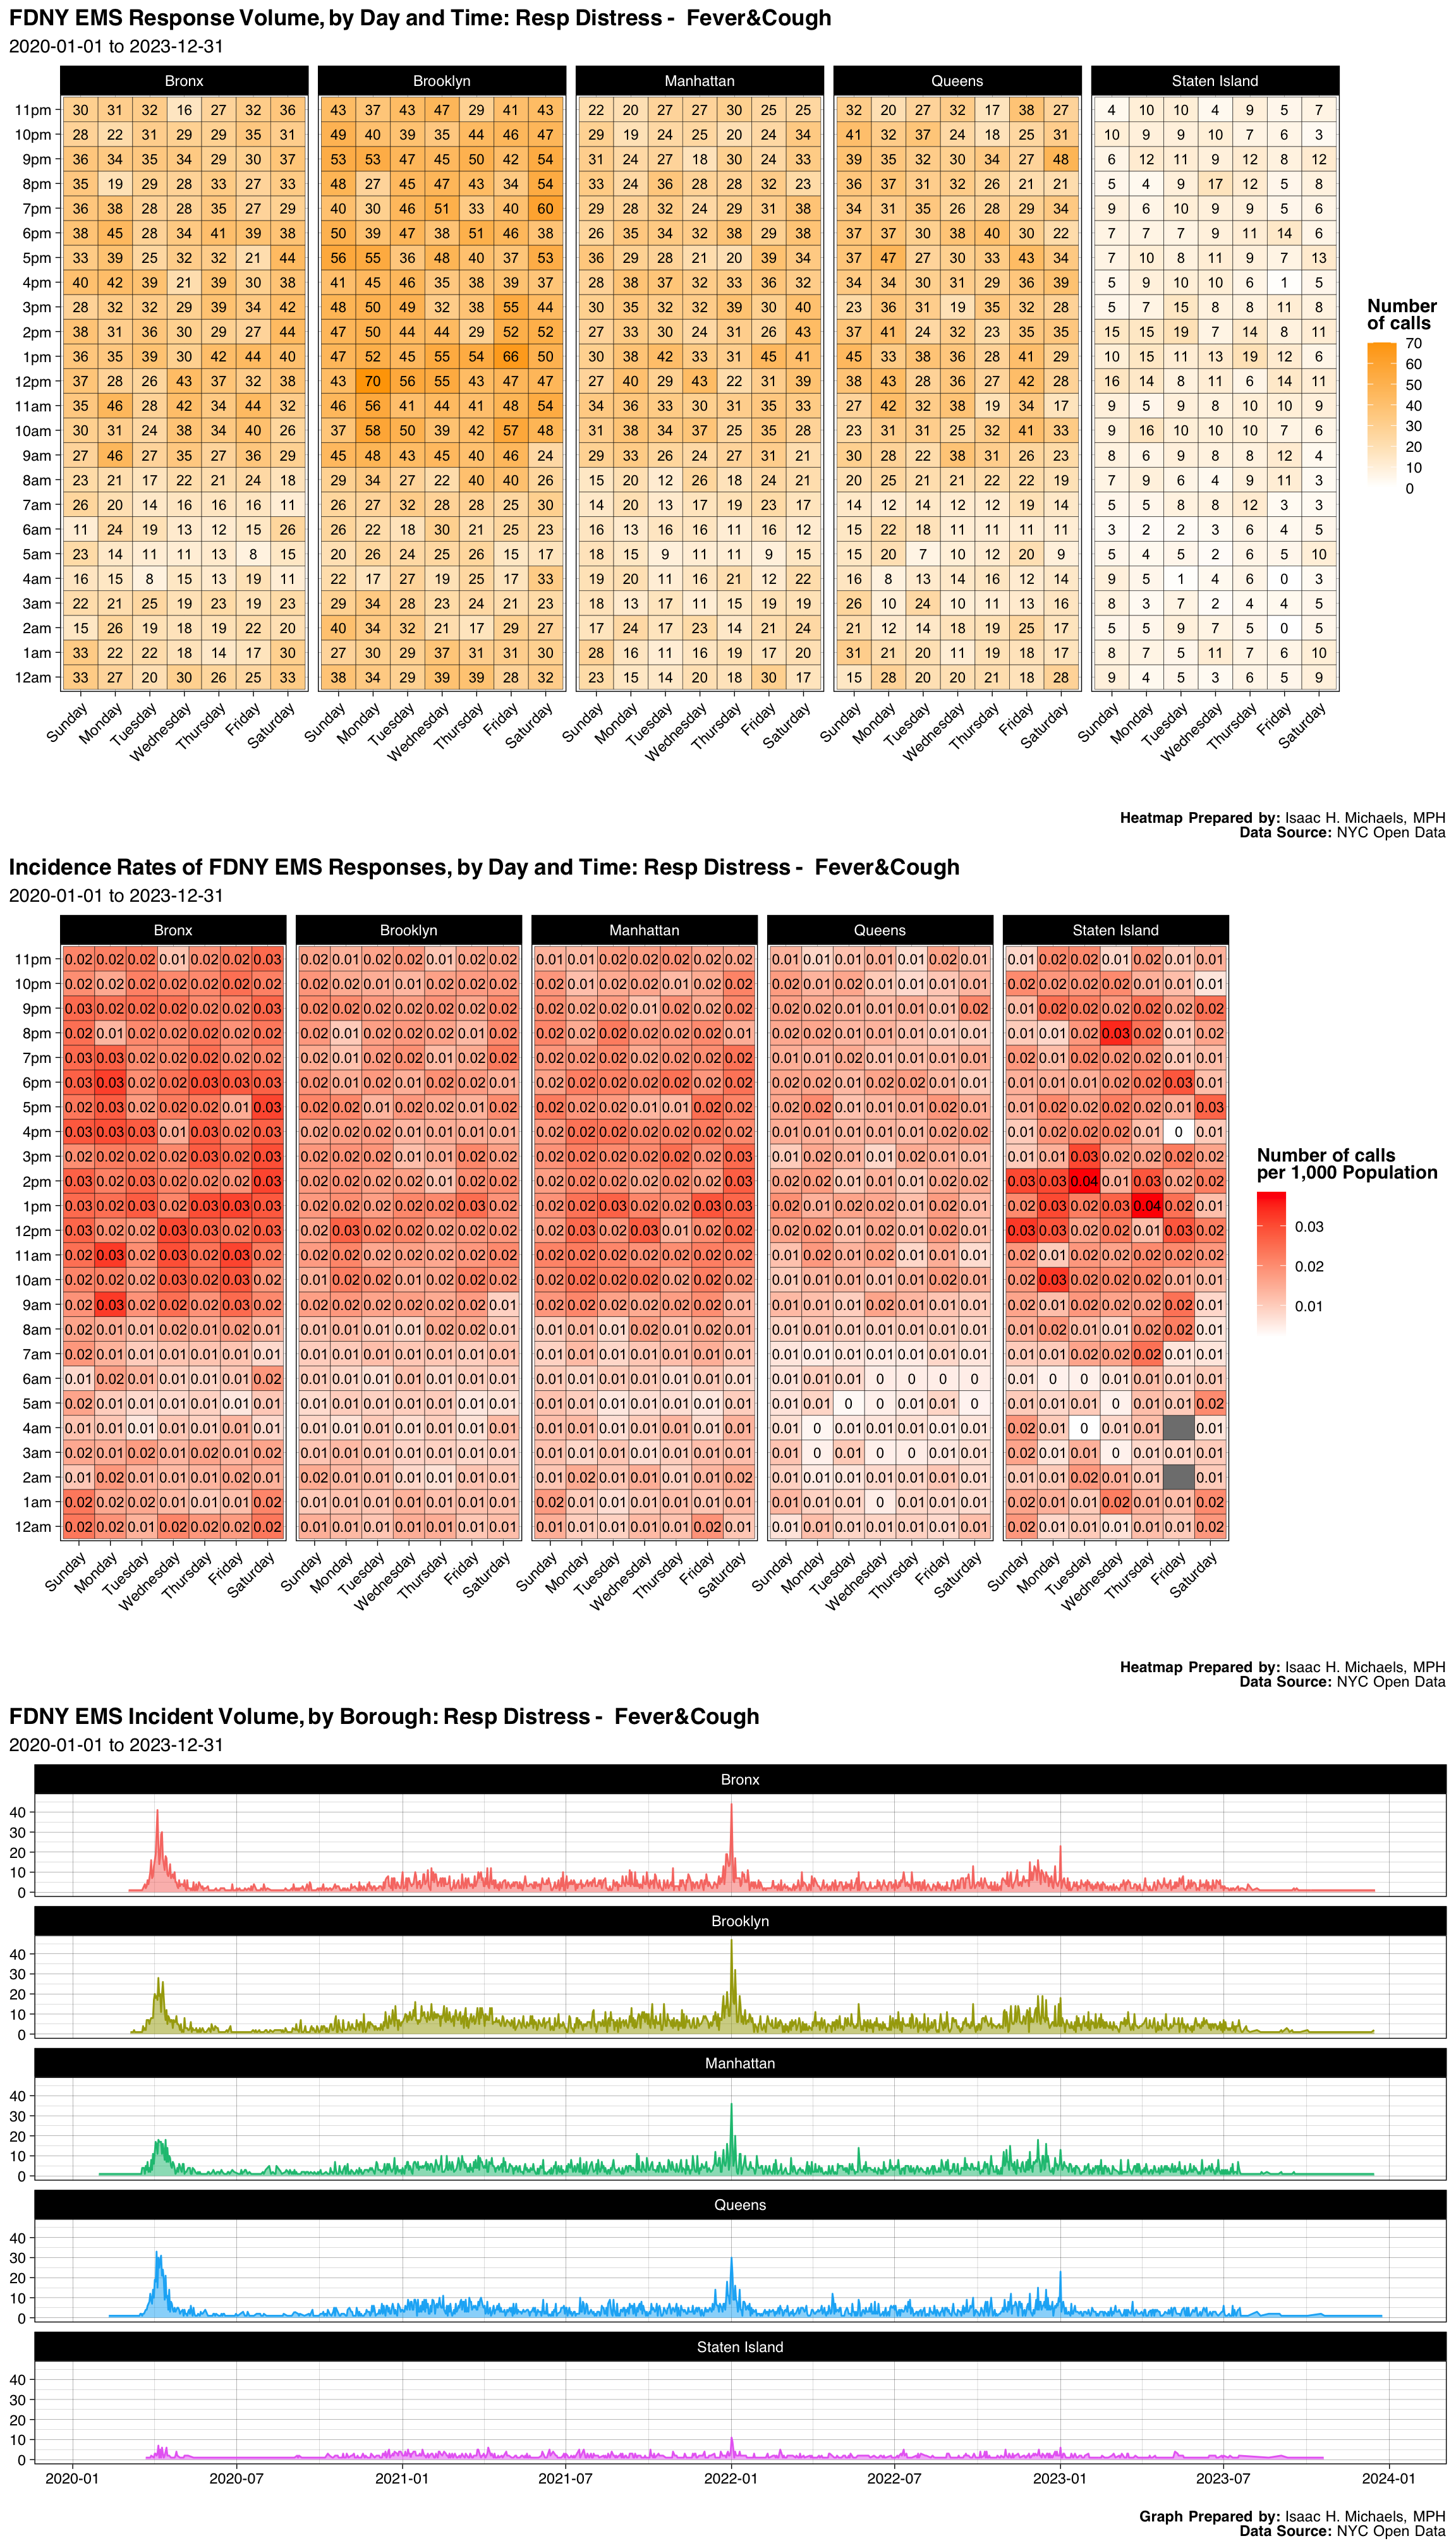
| Borough | Number | Percent |
|---|---|---|
| Bronx | 4714 | 0.2224005 |
| Brooklyn | 6484 | 0.3059068 |
| Manhattan | 4306 | 0.2031515 |
| Queens | 4386 | 0.2069258 |
| Staten Island | 1306 | 0.0616154 |
| Final Severity Level | Number | Percent |
|---|---|---|
| 1 | 0 | 0% |
| 2 | 1 | 4.71787129647103e-05 |
| 3 | 12 | 0.000566144555576524 |
| 4 | 21182 | 0.999339498018494 |
| 5 | 1 | 4.71787129647103e-05 |
| 6 | 0 | 0% |
| 7 | 0 | 0% |
| 8 | 0 | 0% |
| Disposition | Number | Percent |
|---|---|---|
| Transporting Patient | 14550 | 0.6864503 |
| Refused Medical Aid | 4565 | 0.2153708 |
| Unfounded | 995 | 0.0469428 |
| Patient Gone on Arrival | 431 | 0.0203340 |
| Cancelled | 252 | 0.0118890 |
| Other | 245 | 0.0115588 |
| Condition Corrected | 124 | 0.0058502 |
| Treated and Transported | 14 | 0.0006605 |
| Patient Pronounced Dead | 11 | 0.0005190 |
| Triaged at Scene No Transport | 8 | 0.0003774 |
| Treated Not Transported | 1 | 0.0000472 |
Graphs, Heatmaps, and Tables Prepared By: Isaac H. Michaels, MPH
Data Source: NYC Open Data
Back to top
Cardiac Condition-Fever&Cough
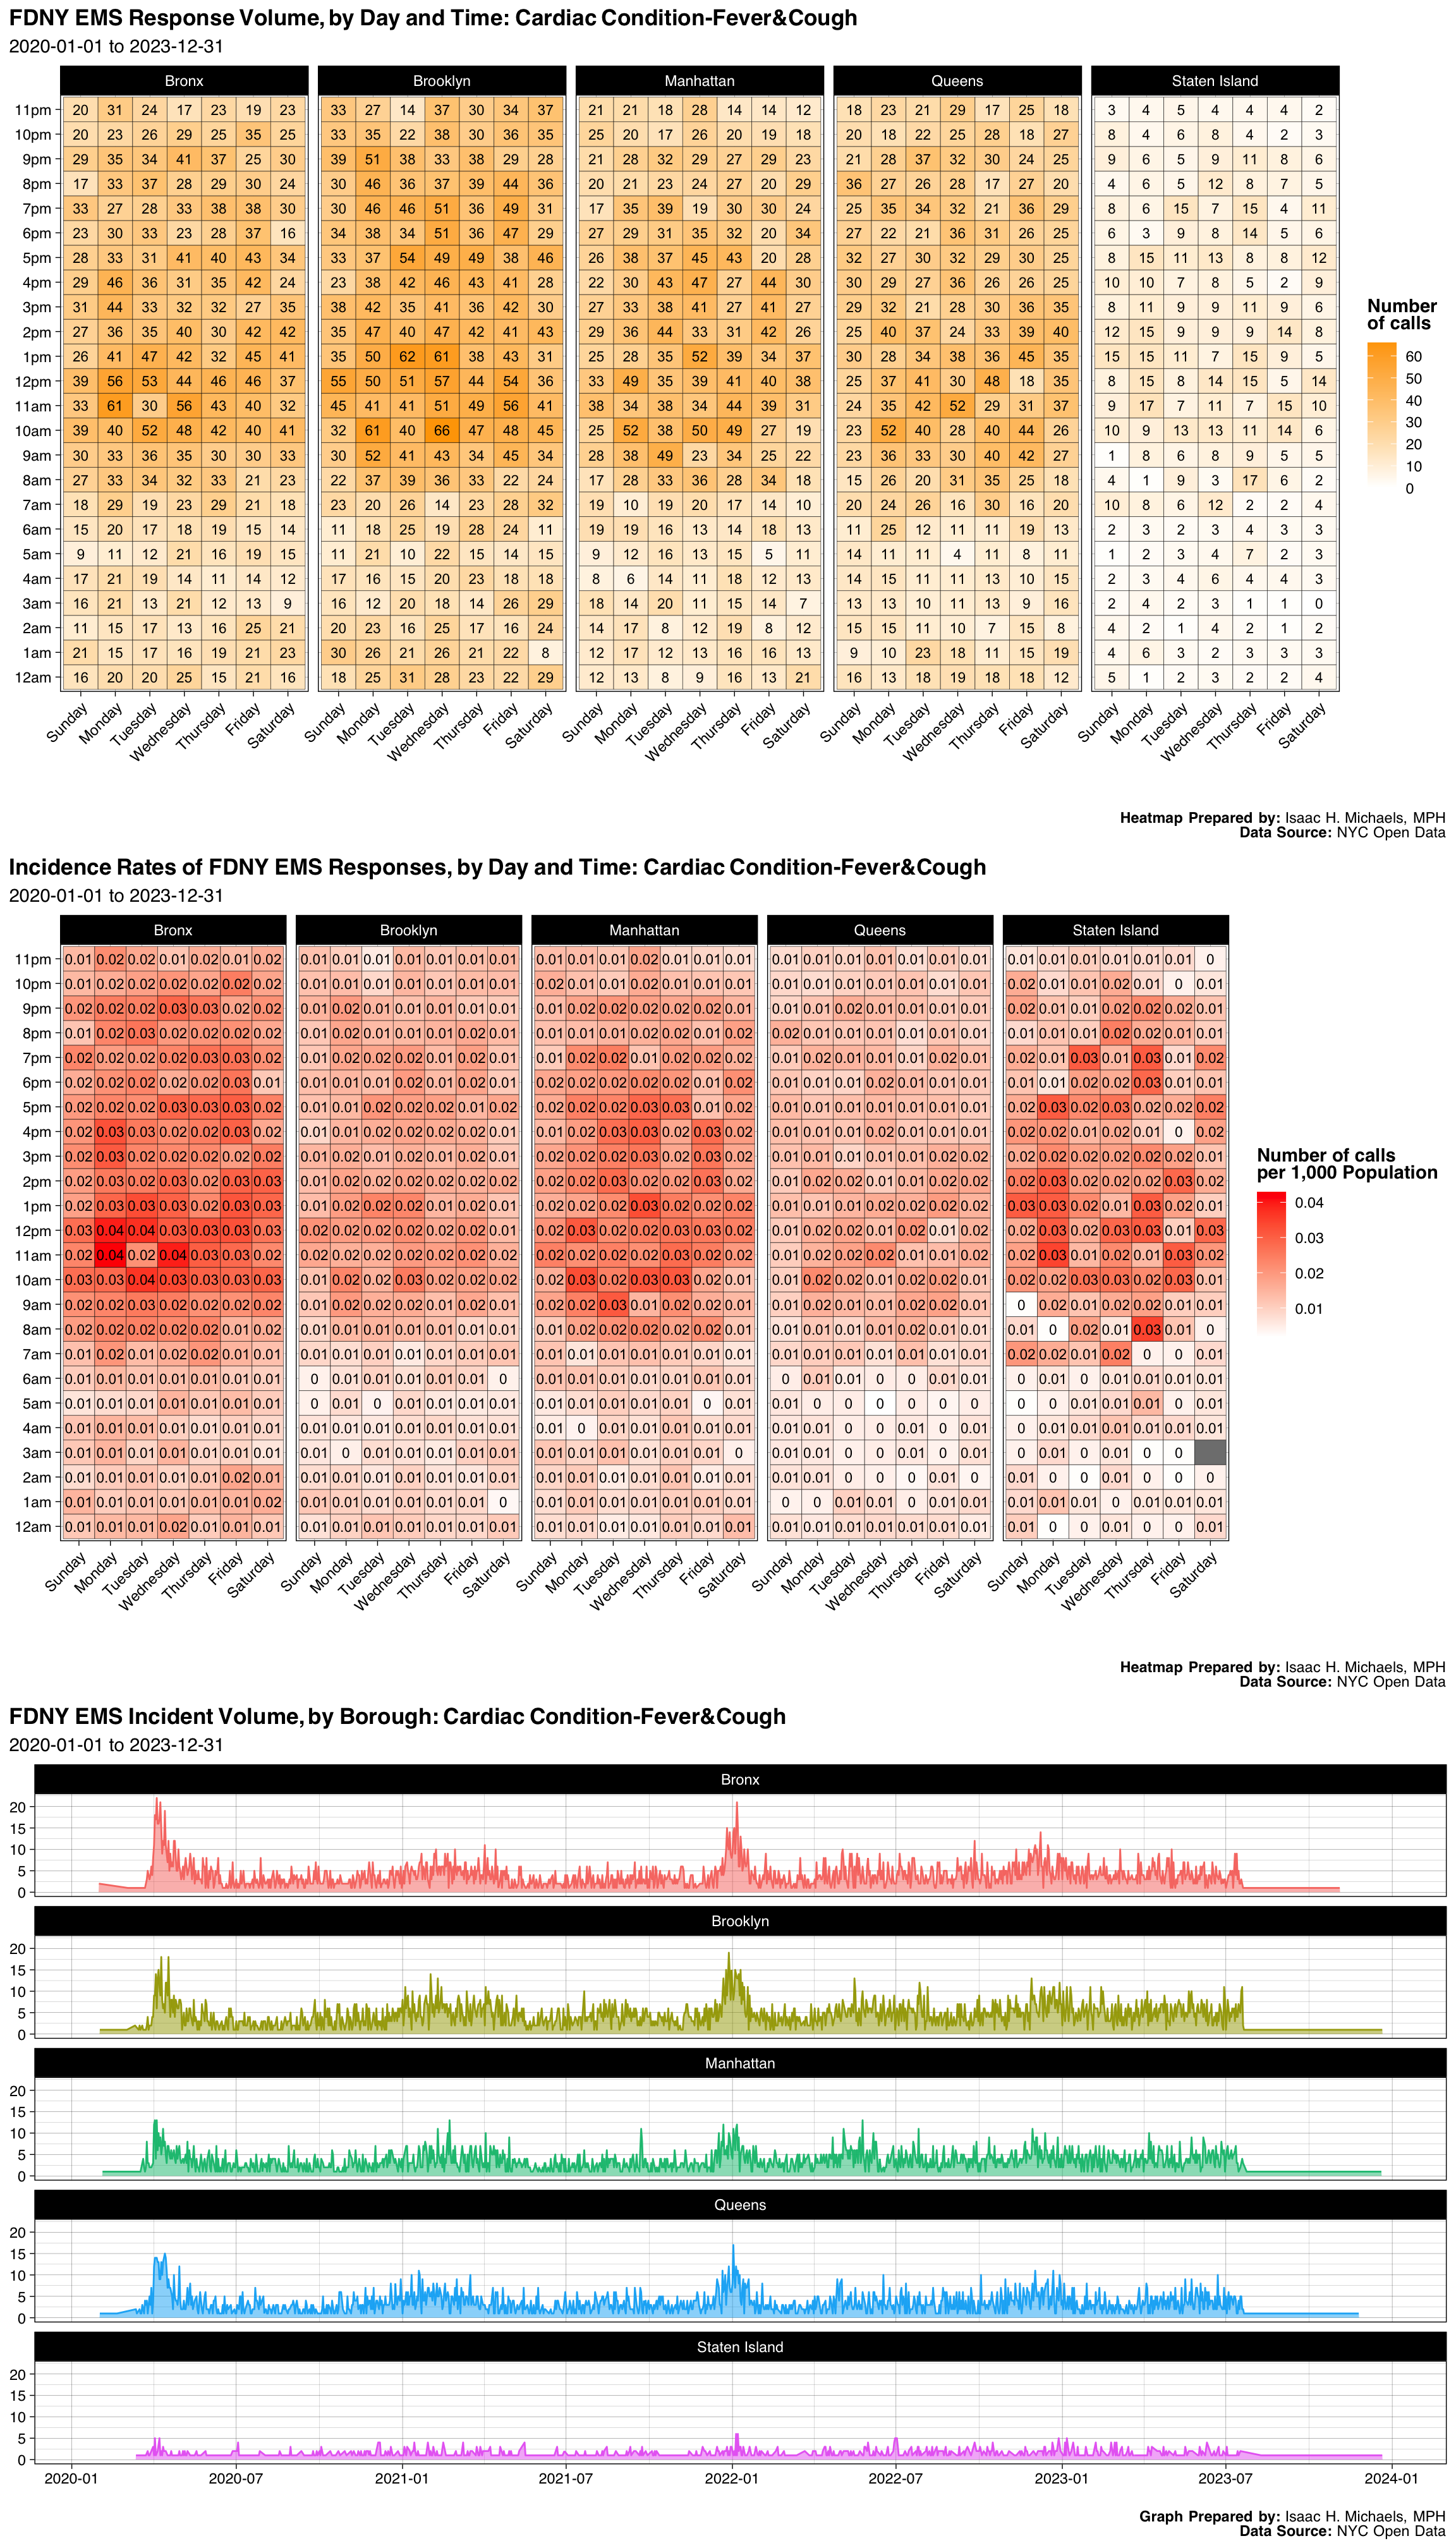
| Borough | Number | Percent |
|---|---|---|
| Bronx | 4761 | 0.2402119 |
| Brooklyn | 5614 | 0.2832492 |
| Manhattan | 4203 | 0.2120585 |
| Queens | 4122 | 0.2079717 |
| Staten Island | 1120 | 0.0565086 |
| Final Severity Level | Number | Percent |
|---|---|---|
| 1 | 0 | 0% |
| 2 | 3 | 0.000151362260343088 |
| 3 | 19816 | 0.999798183652876 |
| 4 | 1 | 5.04540867810293e-05 |
| 5 | 0 | 0% |
| 6 | 0 | 0% |
| 7 | 0 | 0% |
| 8 | 0 | 0% |
| Disposition | Number | Percent |
|---|---|---|
| Transporting Patient | 15485 | 0.7812815 |
| Refused Medical Aid | 3798 | 0.1916246 |
| Unfounded | 284 | 0.0143290 |
| Patient Gone on Arrival | 137 | 0.0069122 |
| Cancelled | 75 | 0.0037841 |
| Treated and Transported | 13 | 0.0006559 |
| Other | 11 | 0.0005550 |
| Condition Corrected | 10 | 0.0005045 |
| Triaged at Scene No Transport | 4 | 0.0002018 |
| Patient Pronounced Dead | 3 | 0.0001514 |
Graphs, Heatmaps, and Tables Prepared By: Isaac H. Michaels, MPH
Data Source: NYC Open Data
Back to top
Female In Labor
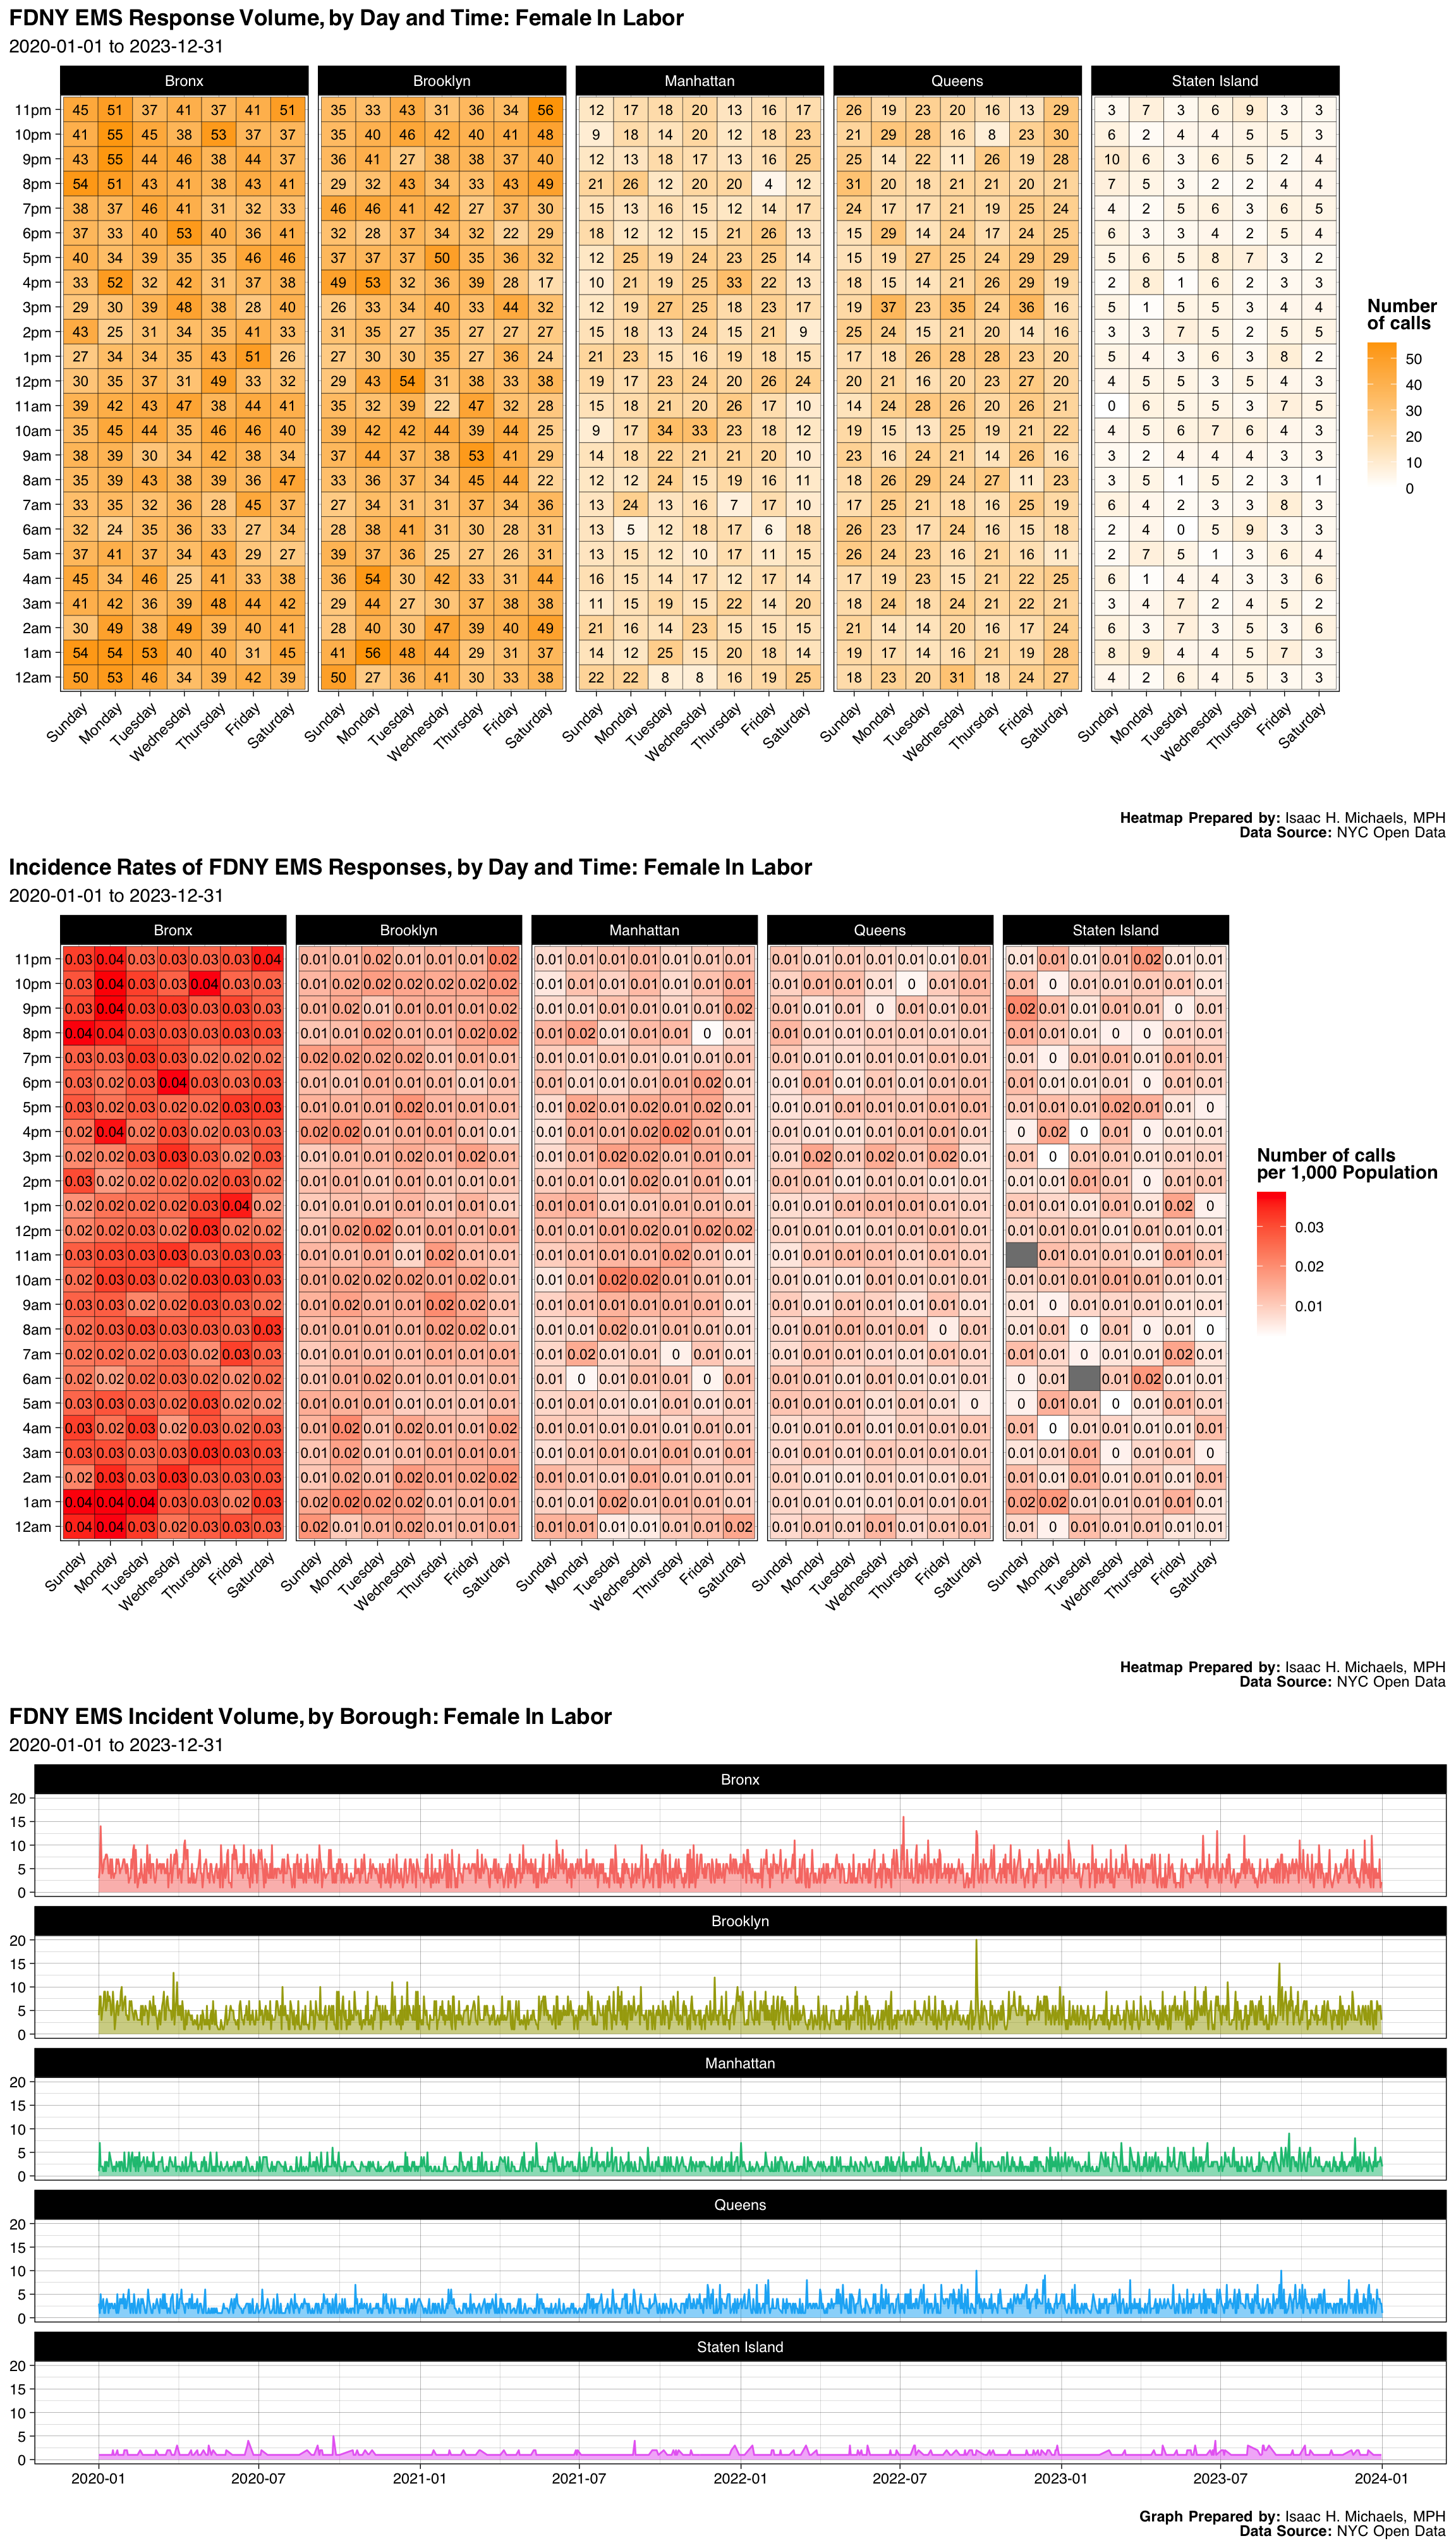
| Borough | Number | Percent |
|---|---|---|
| Bronx | 6588 | 0.3332996 |
| Brooklyn | 6052 | 0.3061823 |
| Manhattan | 2864 | 0.1448953 |
| Queens | 3554 | 0.1798037 |
| Staten Island | 708 | 0.0358191 |
| Final Severity Level | Number | Percent |
|---|---|---|
| 1 | 0 | 0% |
| 2 | 3 | 0.000151775776586057 |
| 3 | 7 | 0.000354143478700799 |
| 4 | 15 | 0.000758878882930284 |
| 5 | 19741 | 0.998735201861783 |
| 6 | 0 | 0% |
| 7 | 0 | 0% |
| 8 | 0 | 0% |
| Disposition | Number | Percent |
|---|---|---|
| Transporting Patient | 17621 | 0.8914803 |
| Refused Medical Aid | 950 | 0.0480623 |
| Unfounded | 501 | 0.0253466 |
| Patient Gone on Arrival | 415 | 0.0209956 |
| Cancelled | 137 | 0.0069311 |
| Other | 83 | 0.0041991 |
| Condition Corrected | 54 | 0.0027320 |
| Treated and Transported | 5 | 0.0002530 |
Graphs, Heatmaps, and Tables Prepared By: Isaac H. Michaels, MPH
Data Source: NYC Open Data
Back to top
Hypertension
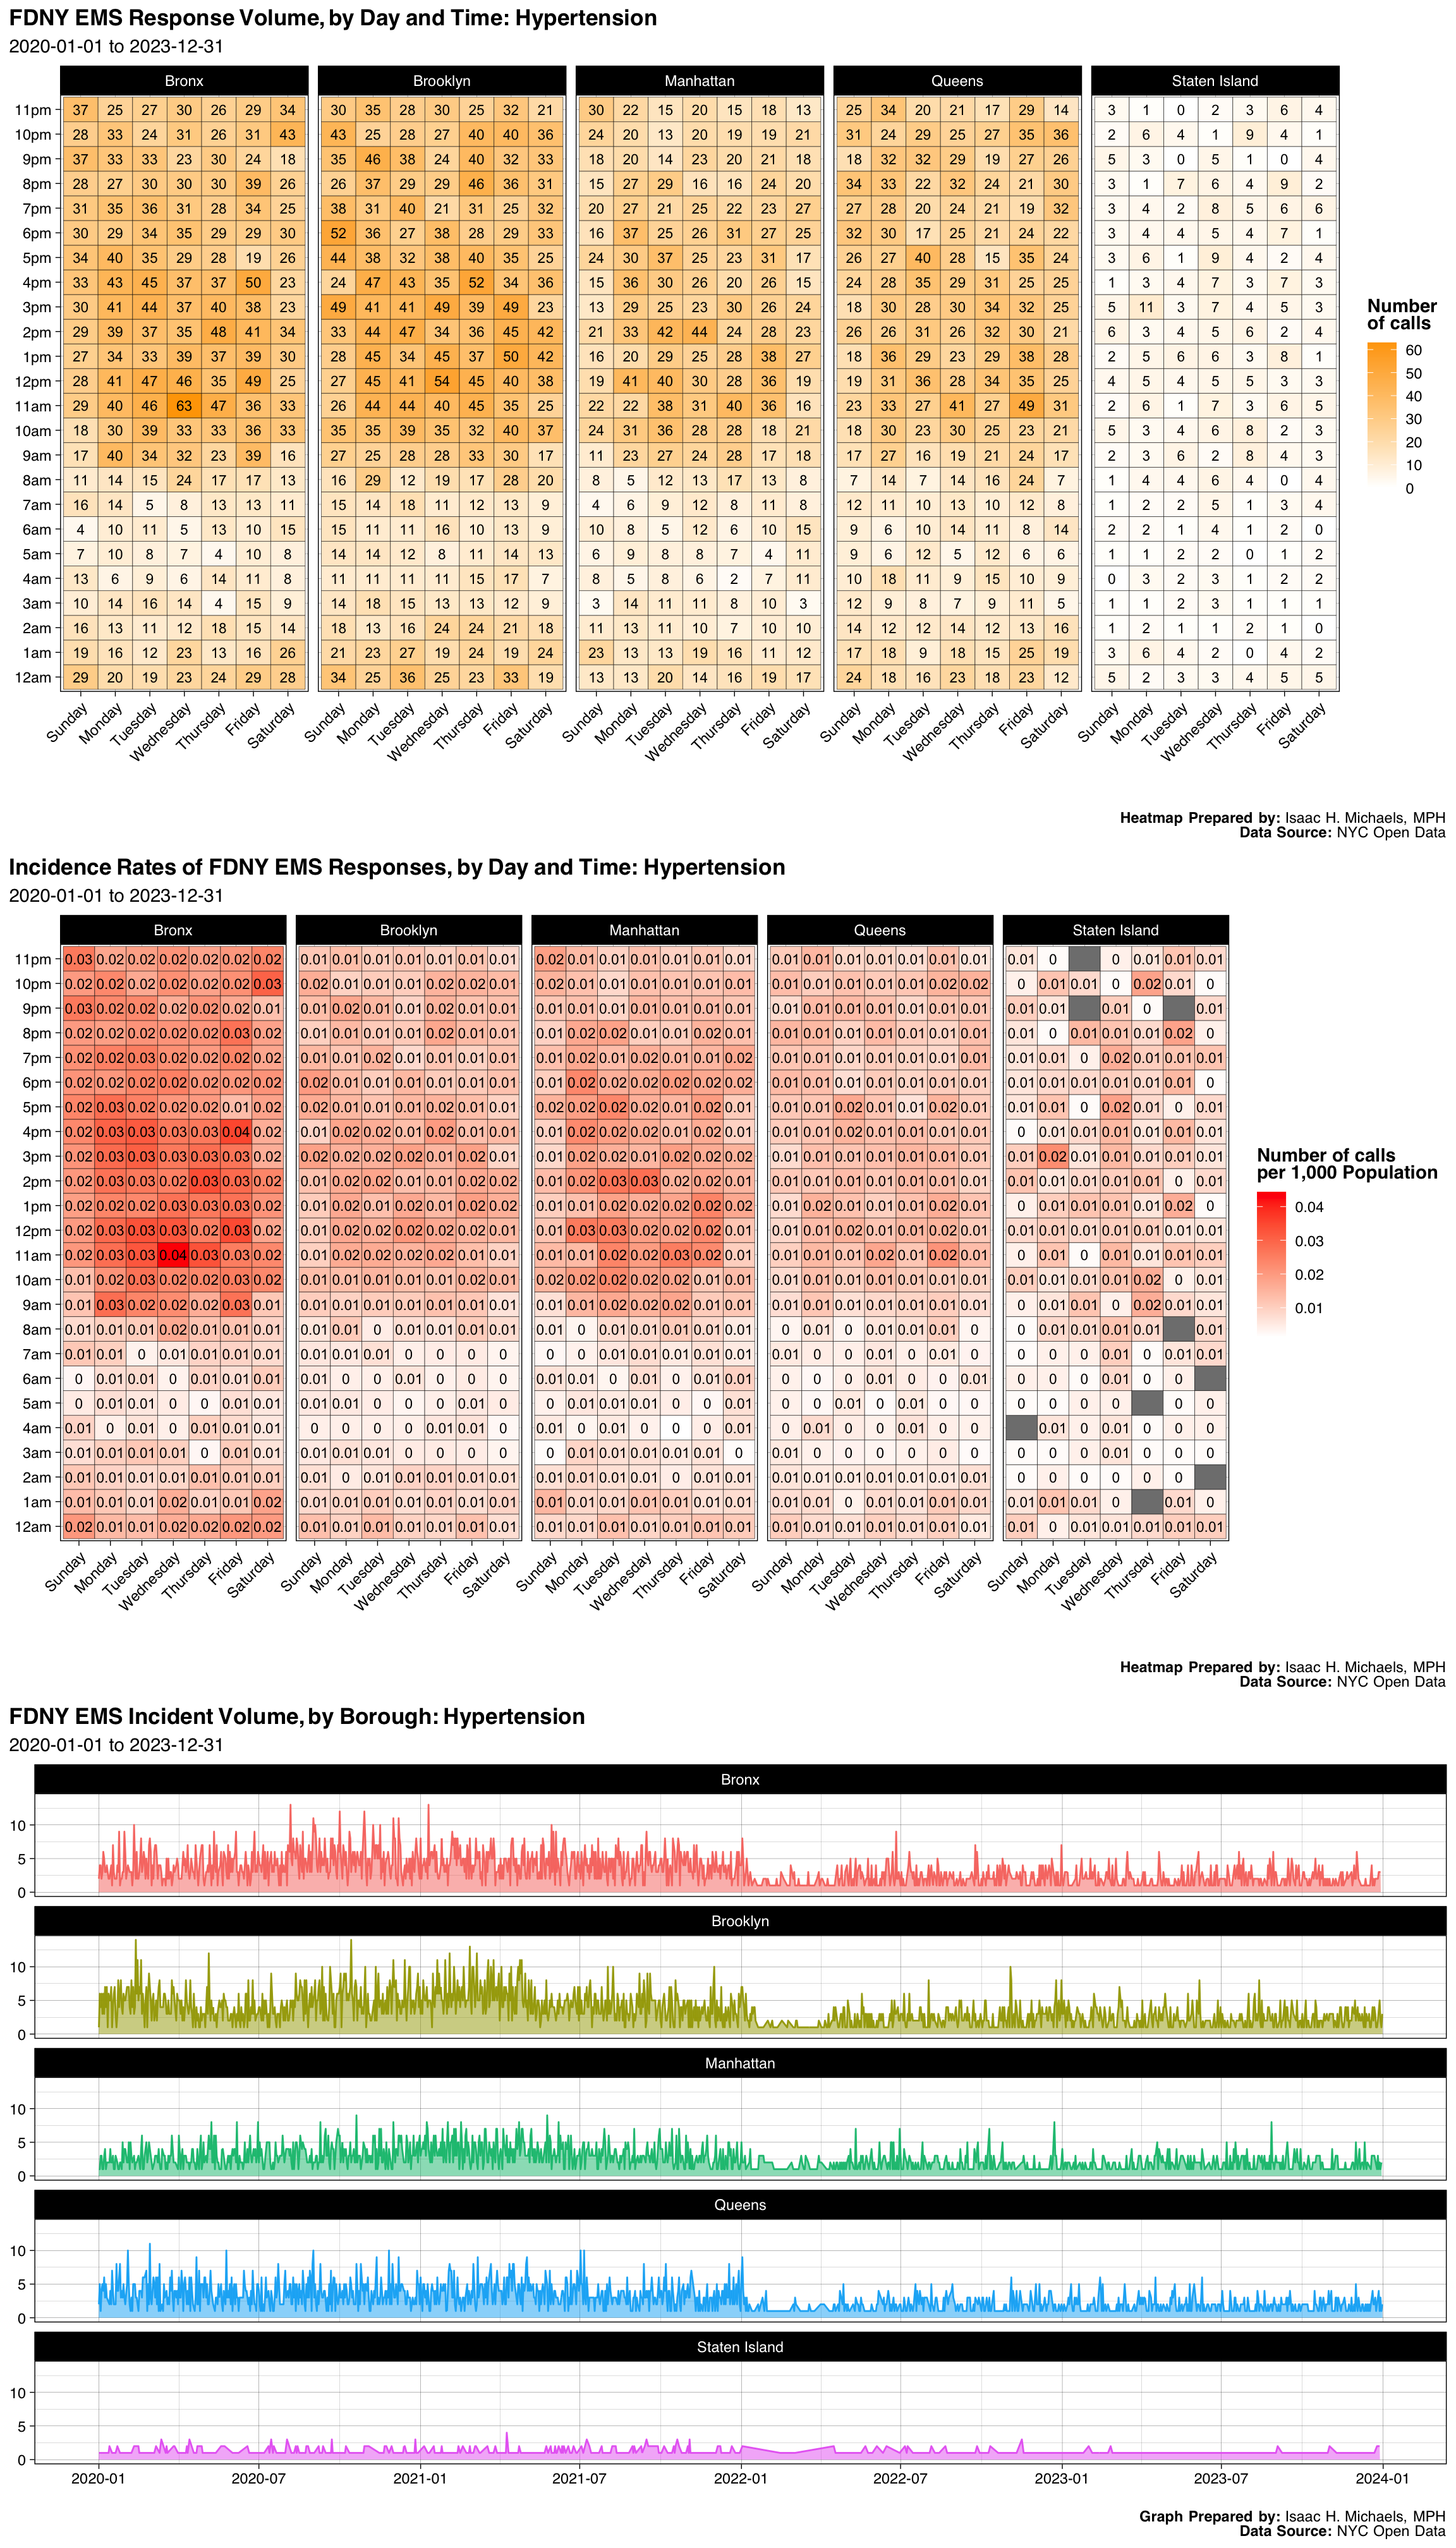
| Borough | Number | Percent |
|---|---|---|
| Bronx | 4348 | 0.2624178 |
| Brooklyn | 4816 | 0.2906633 |
| Manhattan | 3228 | 0.1948217 |
| Queens | 3604 | 0.2175146 |
| Staten Island | 573 | 0.0345827 |
| Final Severity Level | Number | Percent |
|---|---|---|
| 1 | 0 | 0% |
| 2 | 2 | 0.000120707345041946 |
| 3 | 10 | 0.000603536725209729 |
| 4 | 9 | 0.000543183052688756 |
| 5 | 0 | 0% |
| 6 | 7 | 0.00042247570764681 |
| 7 | 16541 | 0.998310097169413 |
| 8 | 0 | 0% |
| Disposition | Number | Percent |
|---|---|---|
| Transporting Patient | 10335 | 0.6237552 |
| Refused Medical Aid | 5512 | 0.3326694 |
| Unfounded | 275 | 0.0165973 |
| Patient Gone on Arrival | 200 | 0.0120707 |
| Cancelled | 113 | 0.0068200 |
| Other | 85 | 0.0051301 |
| Condition Corrected | 28 | 0.0016899 |
| Treated and Transported | 15 | 0.0009053 |
| Triaged at Scene No Transport | 4 | 0.0002414 |
| Patient Pronounced Dead | 2 | 0.0001207 |
Graphs, Heatmaps, and Tables Prepared By: Isaac H. Michaels, MPH
Data Source: NYC Open Data
Back to top
Sick Pediatric, <5 Year Old
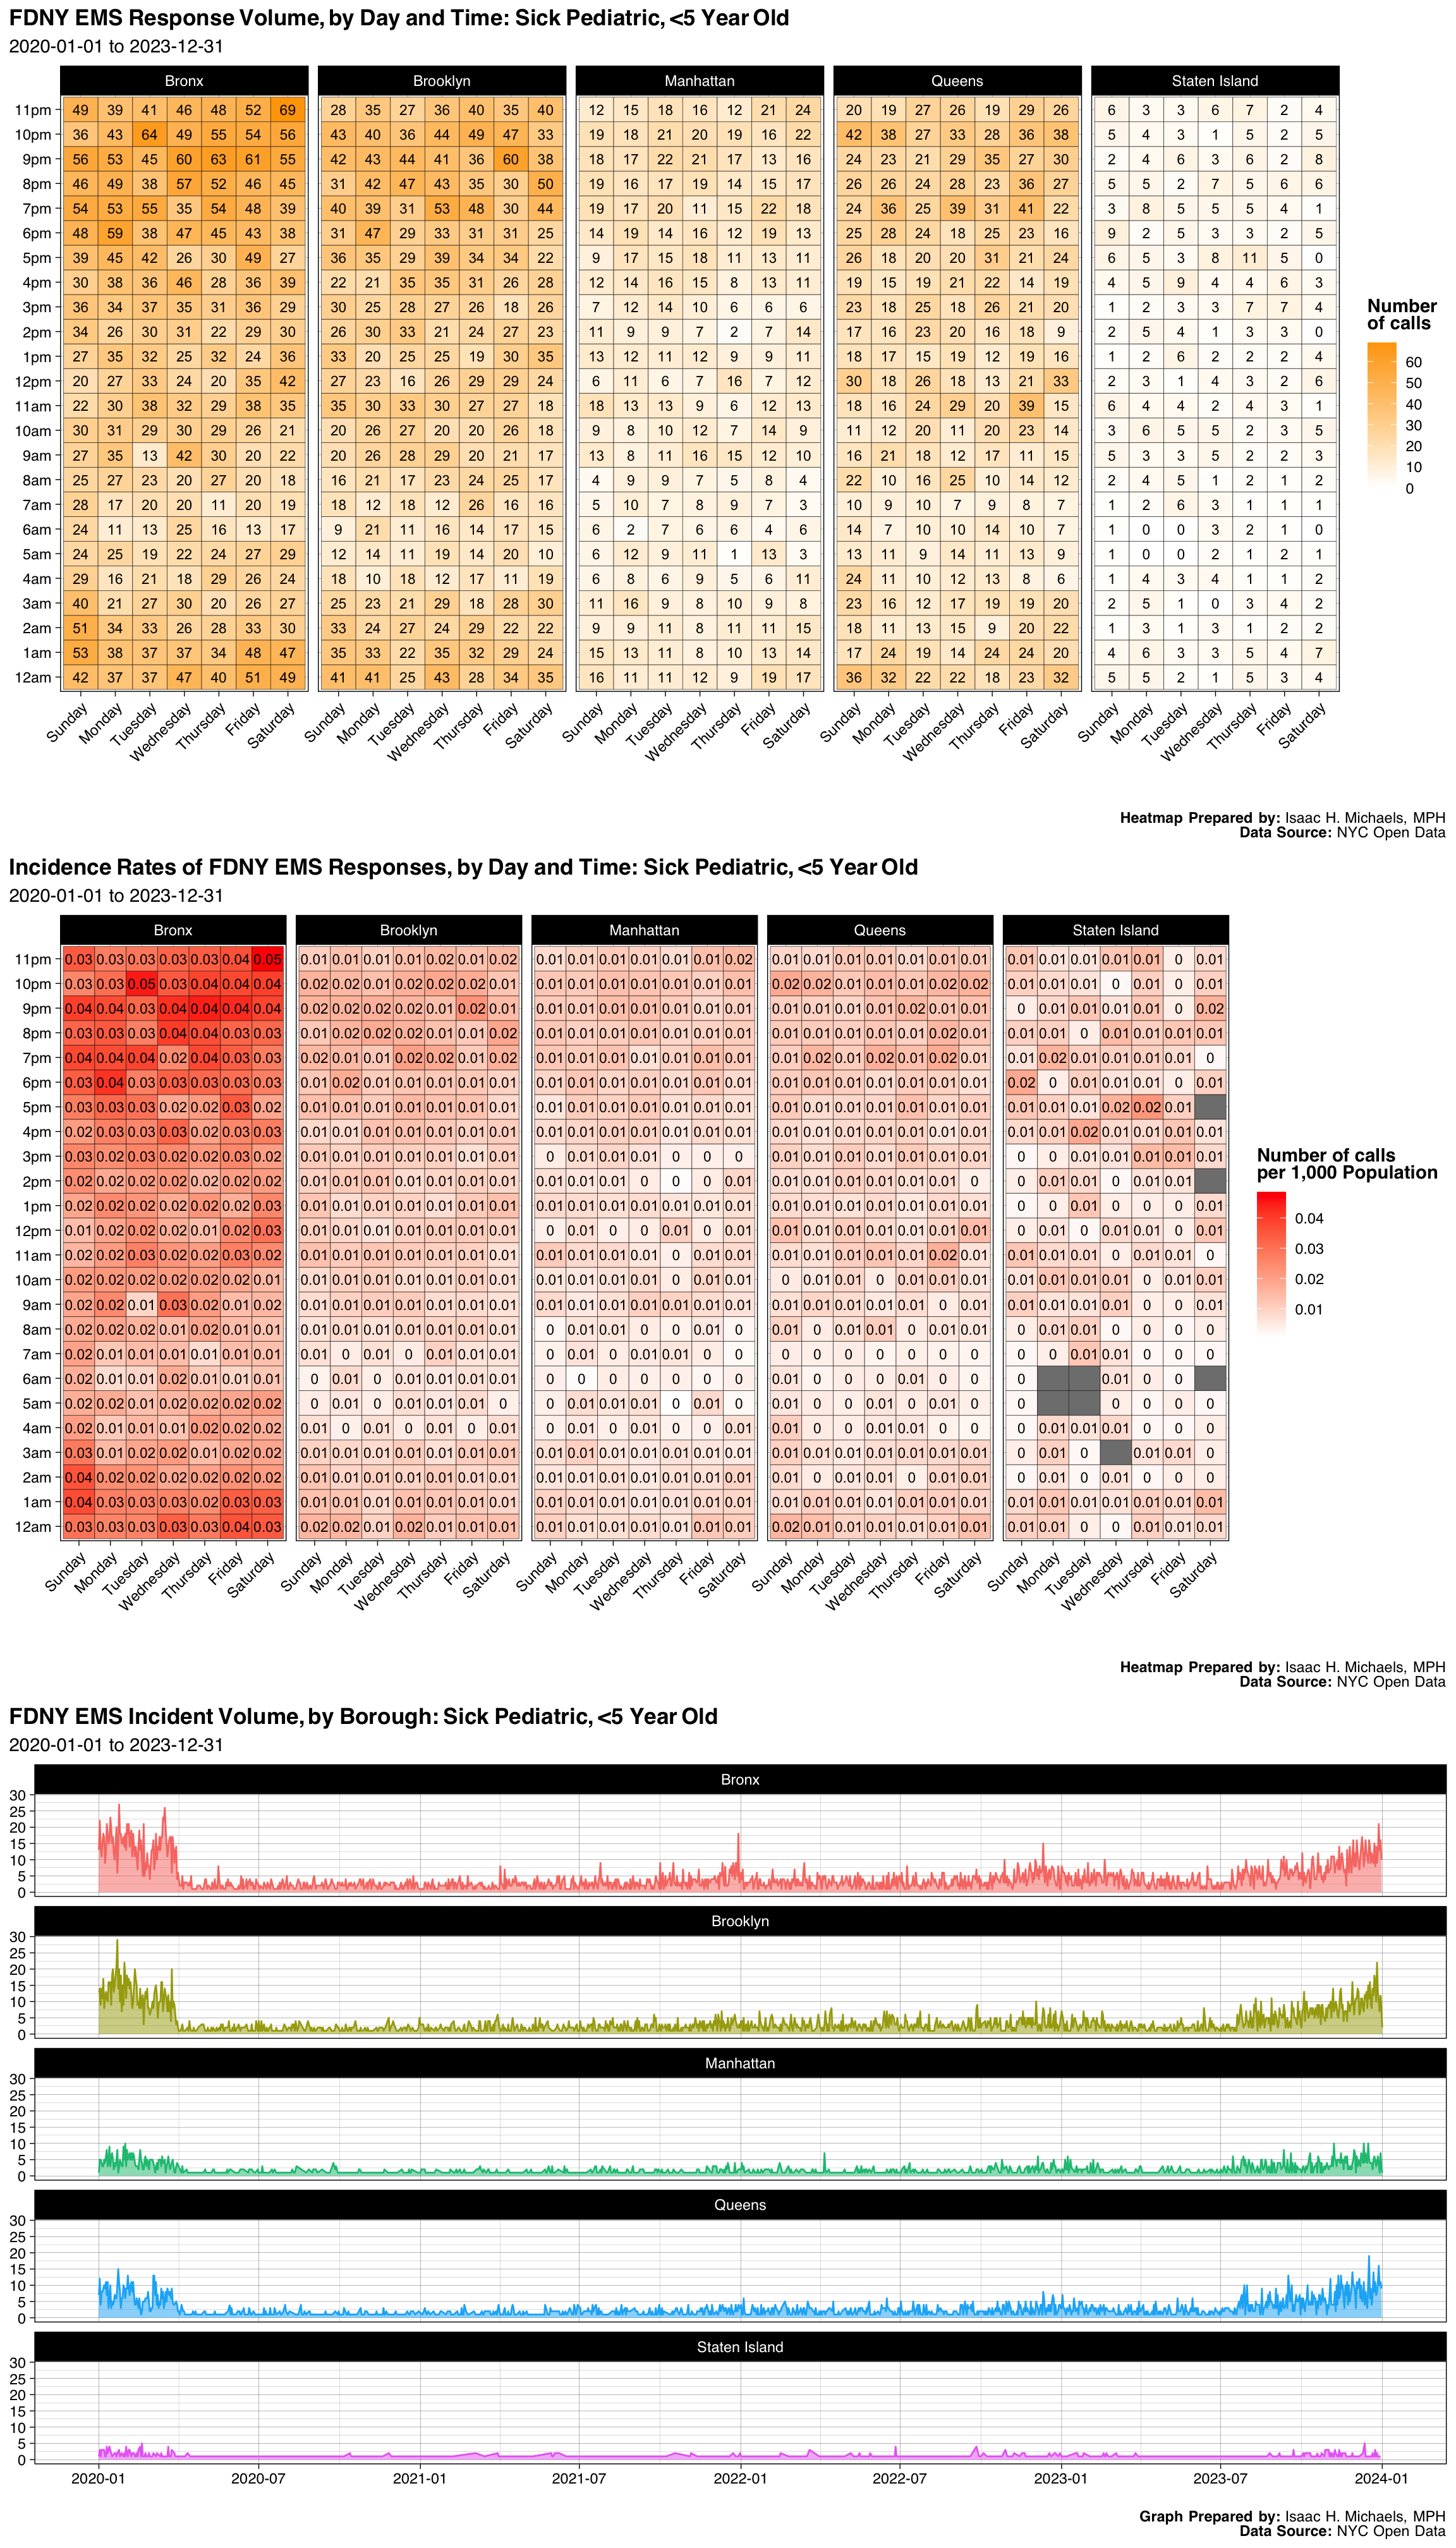
| Borough | Number | Percent |
|---|---|---|
| Bronx | 5825 | 0.3555515 |
| Brooklyn | 4678 | 0.2855399 |
| Manhattan | 1968 | 0.1201245 |
| Queens | 3346 | 0.2042361 |
| Staten Island | 566 | 0.0345480 |
| Final Severity Level | Number | Percent |
|---|---|---|
| 1 | 0 | 0% |
| 2 | 2 | 0.000122077763535372 |
| 3 | 9 | 0.000549349935909174 |
| 4 | 16372 | 0.999328572300555 |
| 5 | 0 | 0% |
| 6 | 0 | 0% |
| 7 | 0 | 0% |
| 8 | 0 | 0% |
| Disposition | Number | Percent |
|---|---|---|
| Transporting Patient | 14287 | 0.8720625 |
| Refused Medical Aid | 1392 | 0.0849661 |
| Patient Gone on Arrival | 311 | 0.0189831 |
| Unfounded | 209 | 0.0127571 |
| Cancelled | 100 | 0.0061039 |
| Condition Corrected | 47 | 0.0028688 |
| Other | 32 | 0.0019532 |
| Treated and Transported | 4 | 0.0002442 |
| Patient Pronounced Dead | 1 | 0.0000610 |
Graphs, Heatmaps, and Tables Prepared By: Isaac H. Michaels, MPH
Data Source: NYC Open Data
Back to top
Major Obstetrical Complaint
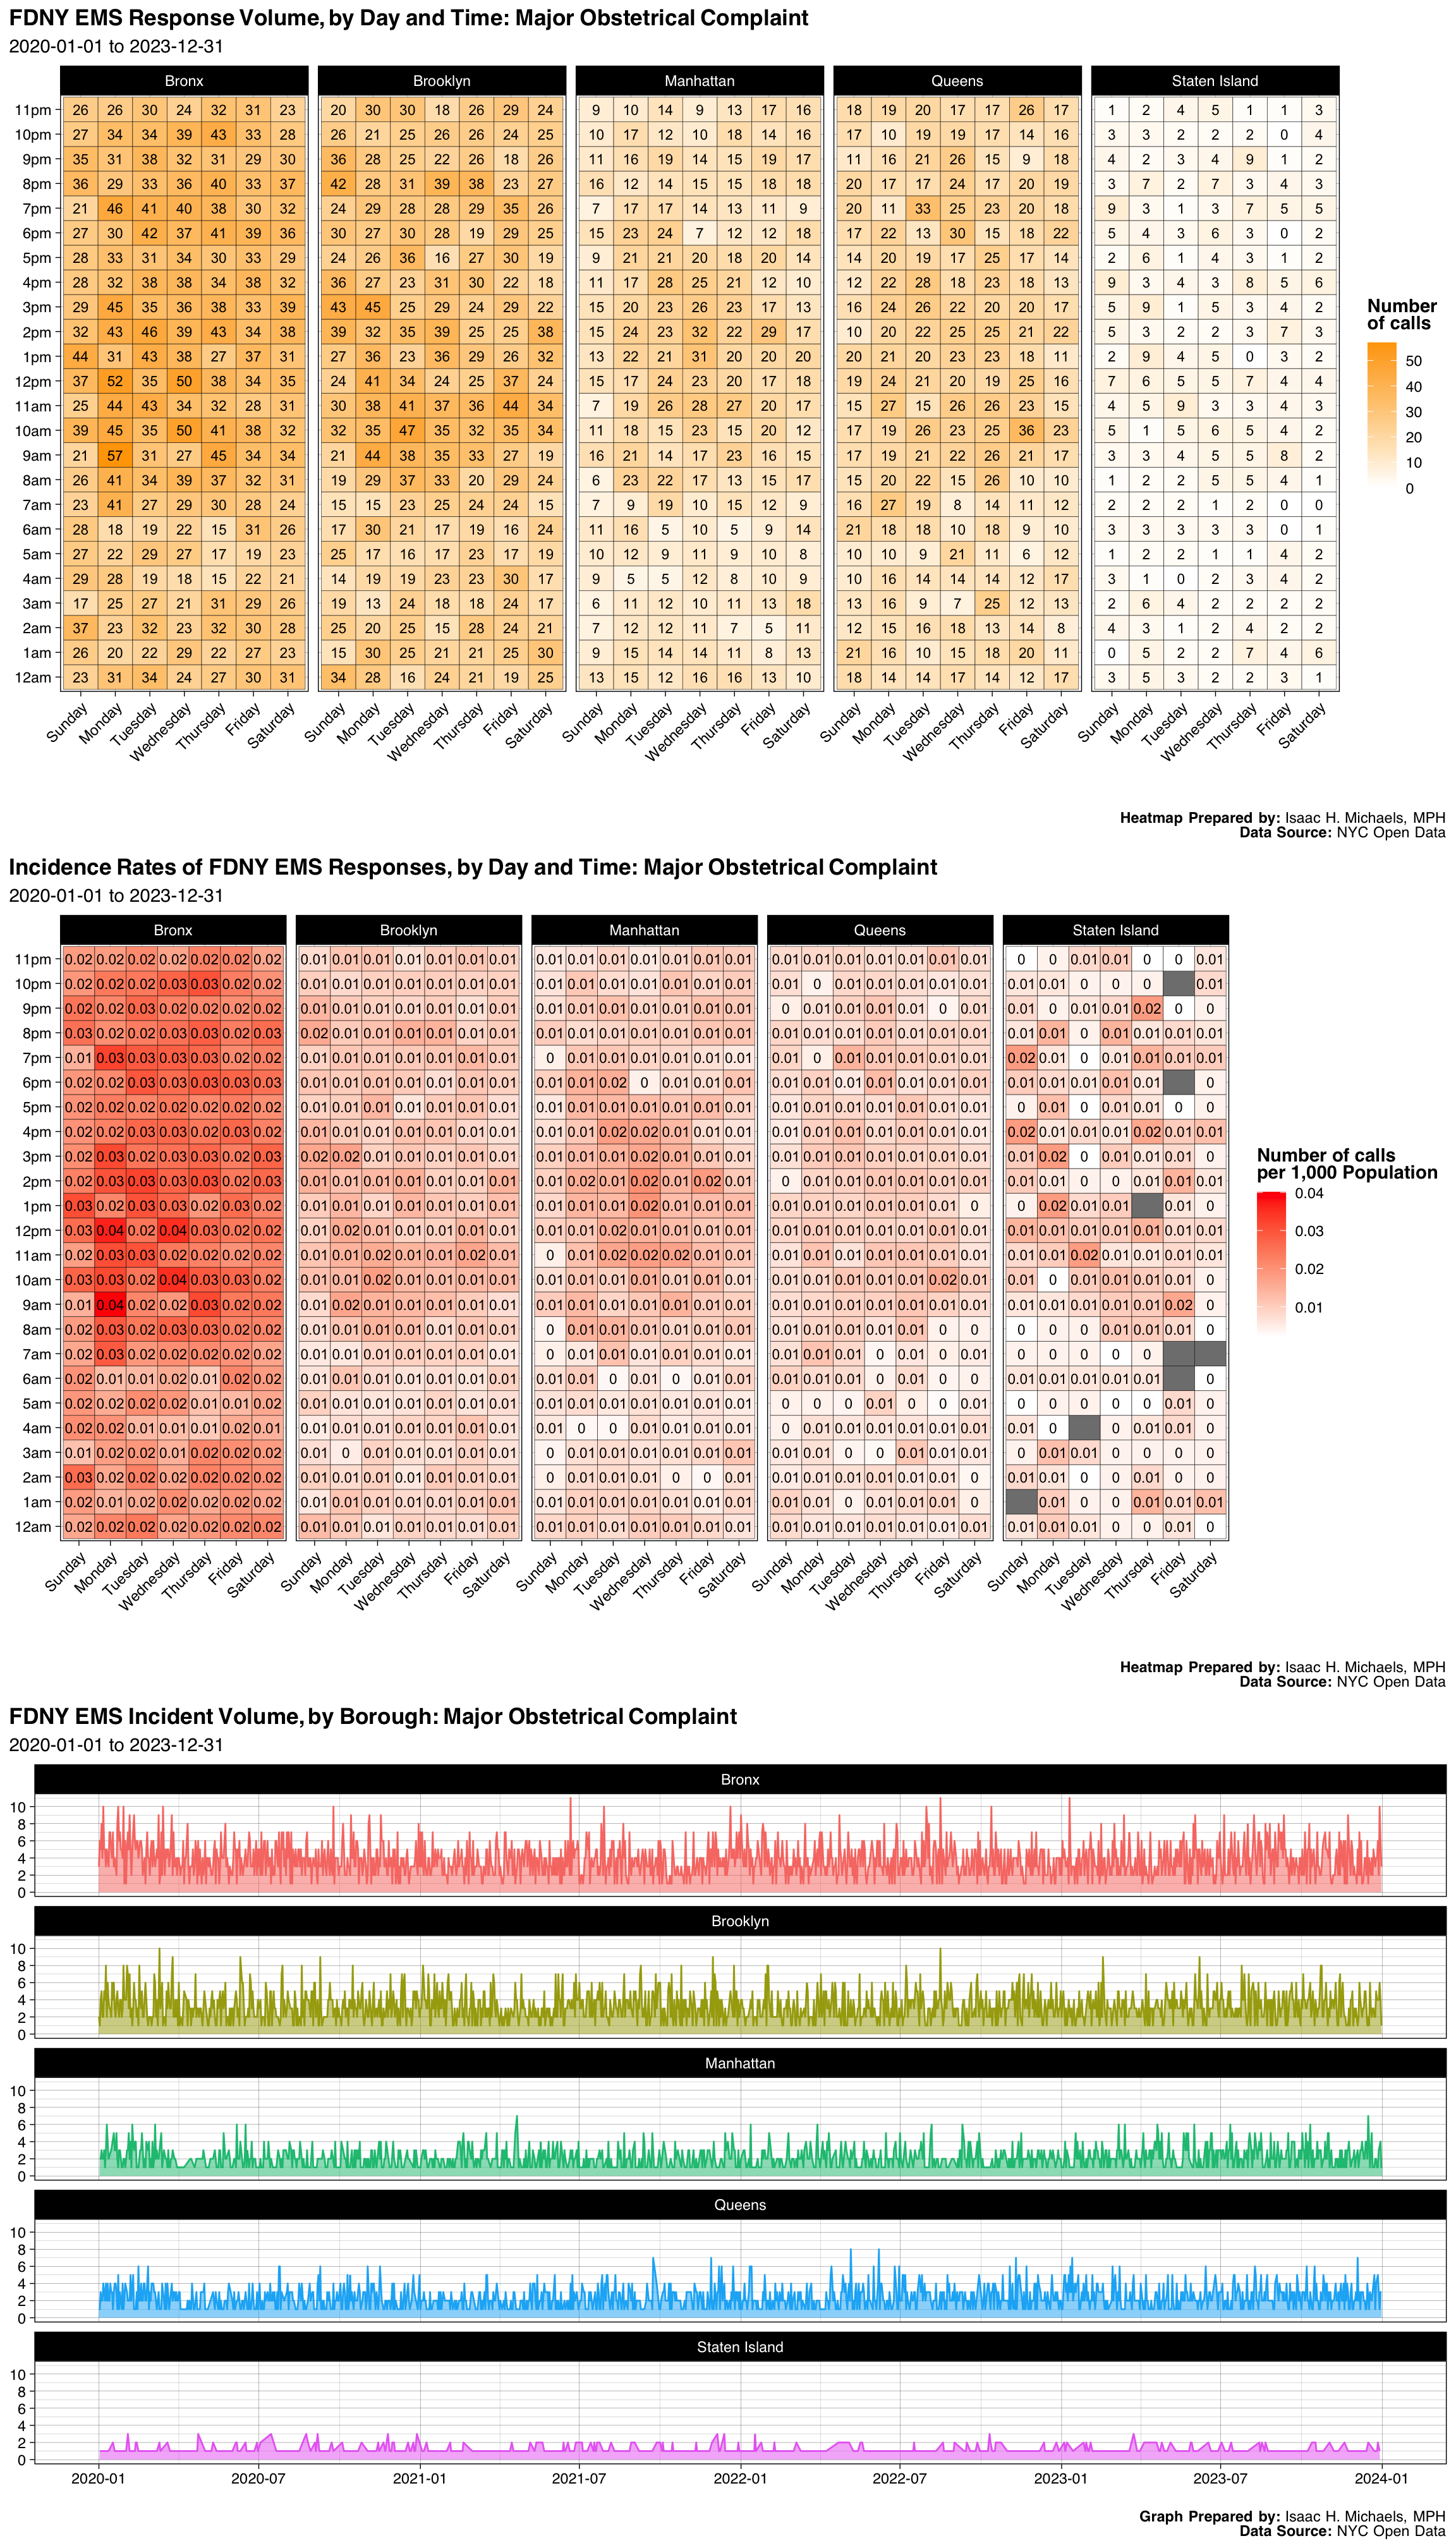
| Borough | Number | Percent |
|---|---|---|
| Bronx | 5353 | 0.3364128 |
| Brooklyn | 4486 | 0.2819256 |
| Manhattan | 2526 | 0.1587481 |
| Queens | 2985 | 0.1875943 |
| Staten Island | 562 | 0.0353193 |
| Final Severity Level | Number | Percent |
|---|---|---|
| 1 | 0 | 0% |
| 2 | 208 | 0.0130718954248366 |
| 3 | 15704 | 0.986928104575163 |
| 4 | 0 | 0% |
| 5 | 0 | 0% |
| 6 | 0 | 0% |
| 7 | 0 | 0% |
| 8 | 0 | 0% |
| Disposition | Number | Percent |
|---|---|---|
| Transporting Patient | 14396 | 0.9047260 |
| Refused Medical Aid | 1031 | 0.0647939 |
| Unfounded | 231 | 0.0145173 |
| Patient Gone on Arrival | 142 | 0.0089241 |
| Cancelled | 69 | 0.0043363 |
| Condition Corrected | 29 | 0.0018225 |
| Other | 9 | 0.0005656 |
| Treated and Transported | 4 | 0.0002514 |
| Triaged at Scene No Transport | 1 | 0.0000628 |
Graphs, Heatmaps, and Tables Prepared By: Isaac H. Michaels, MPH
Data Source: NYC Open Data
Back to top
Stroke
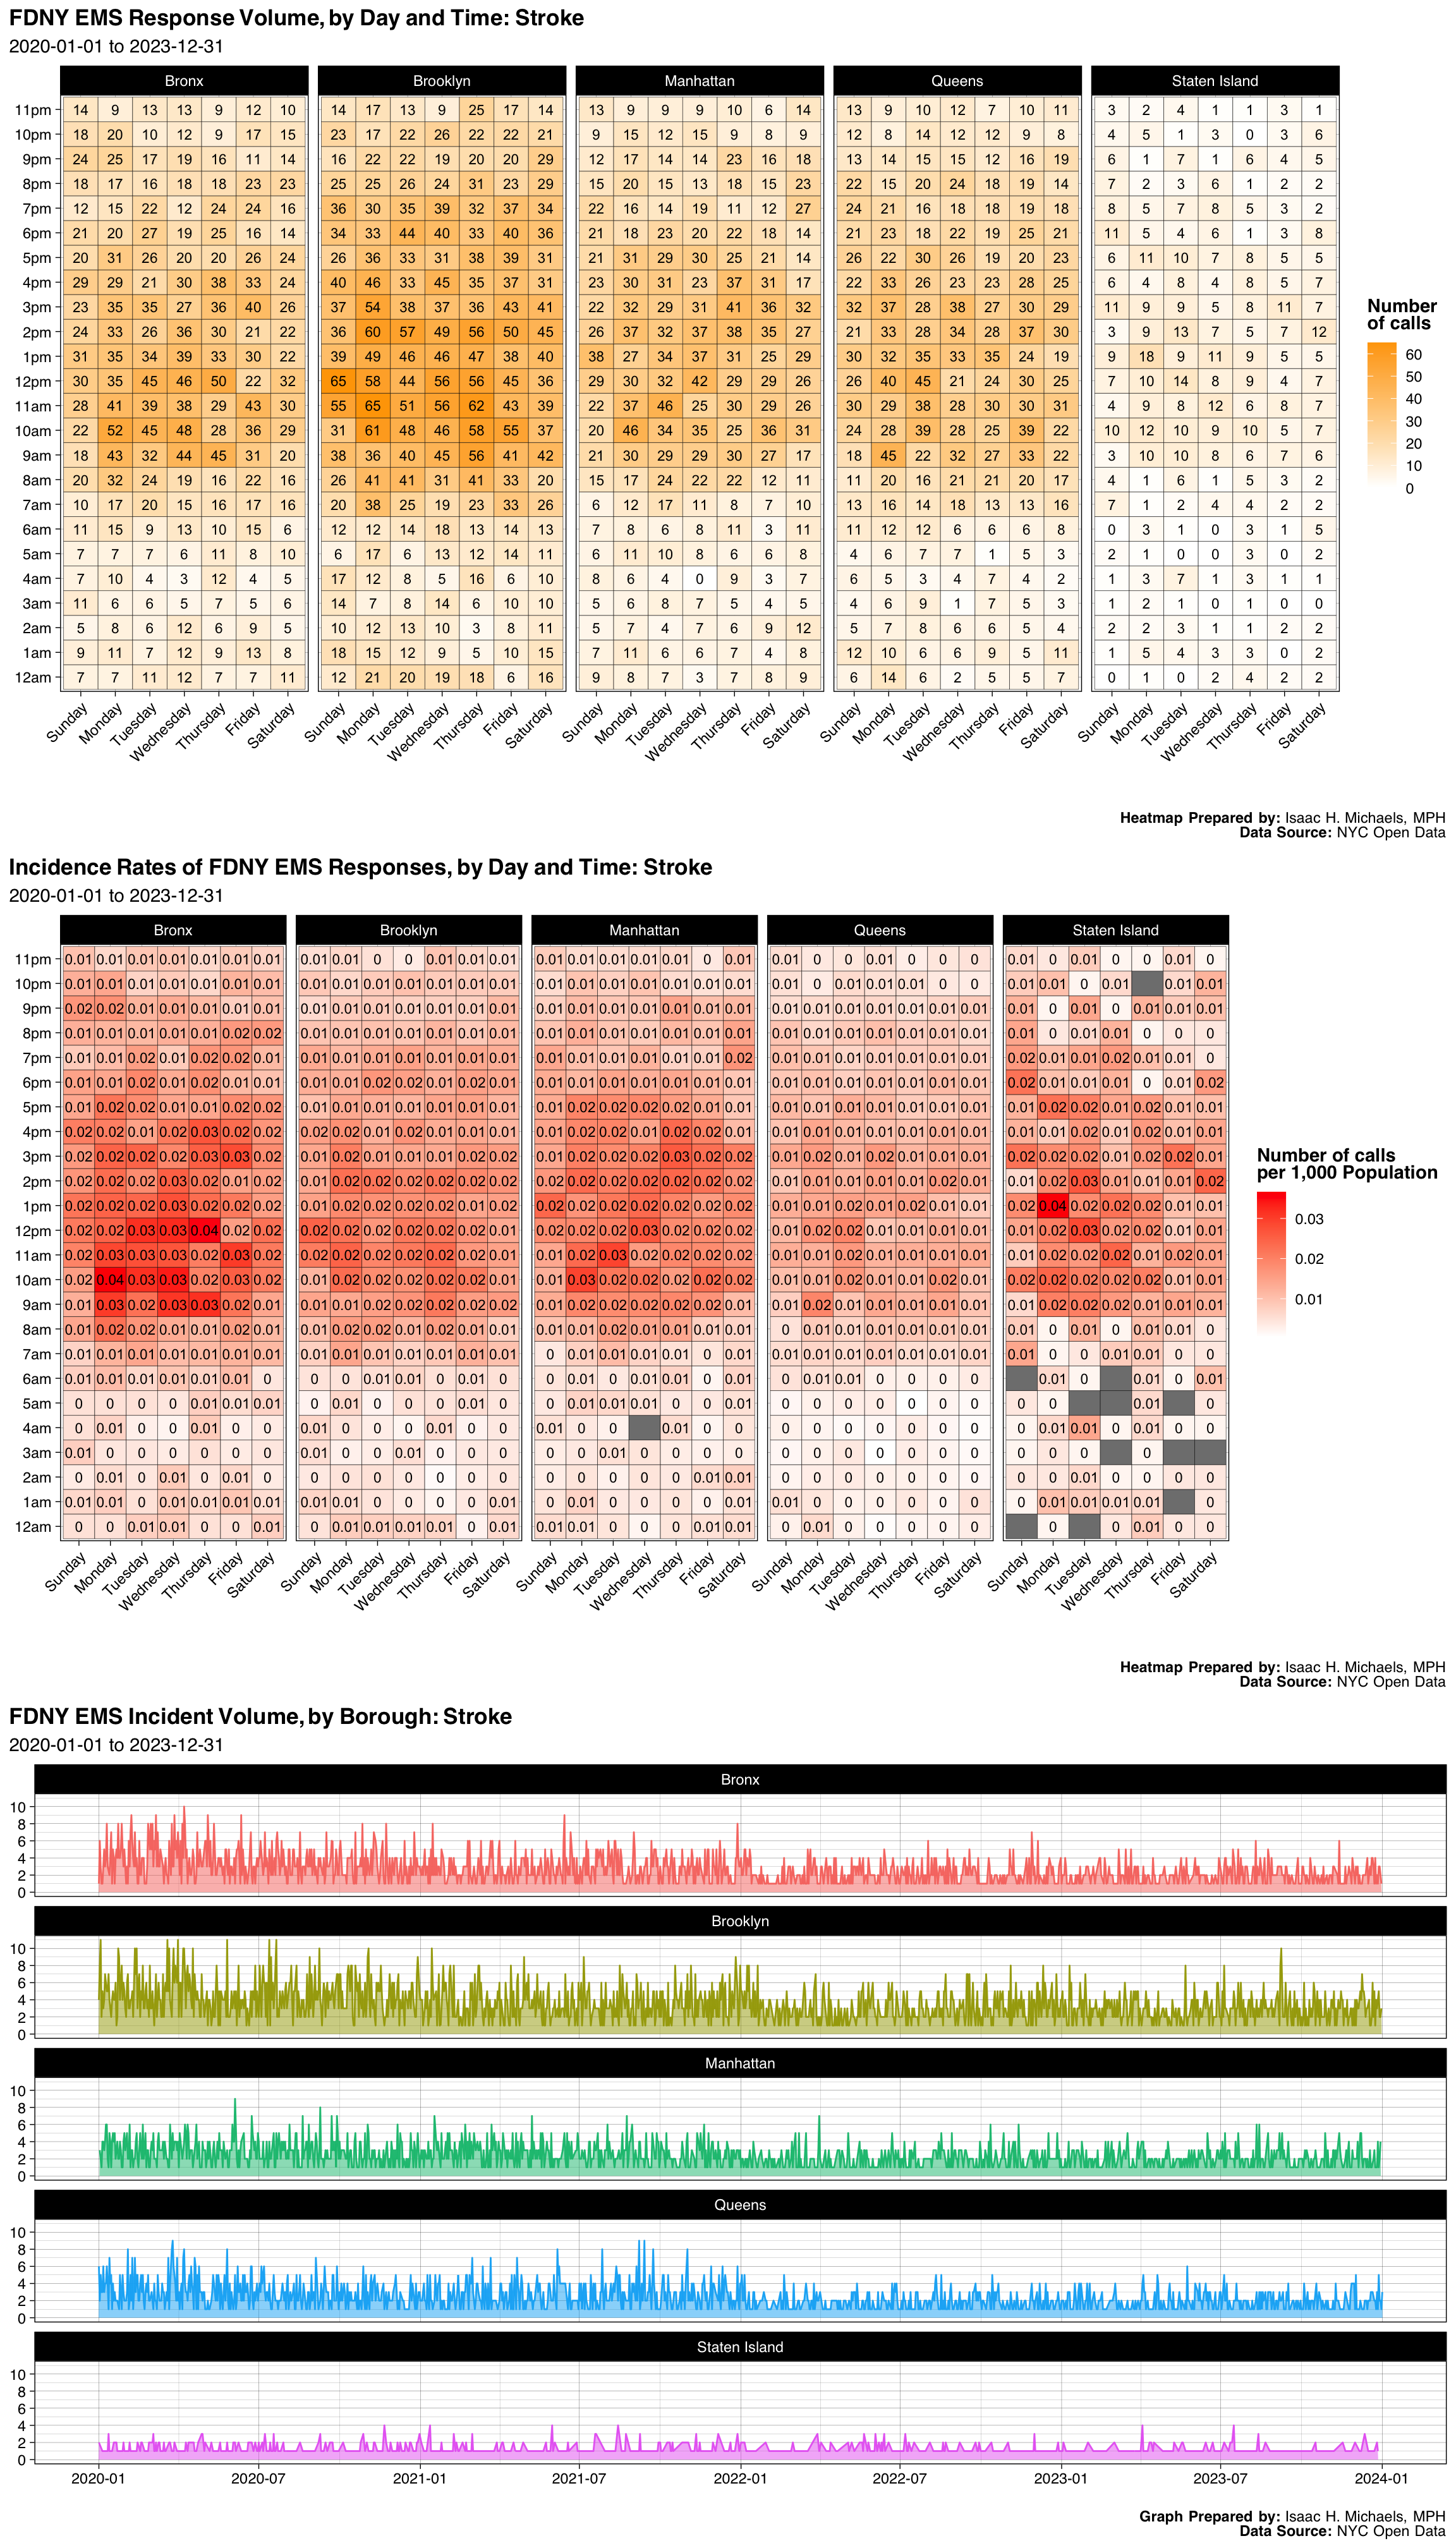
| Borough | Number | Percent |
|---|---|---|
| Bronx | 3385 | 0.2234176 |
| Brooklyn | 4904 | 0.3236750 |
| Manhattan | 3048 | 0.2011748 |
| Queens | 3017 | 0.1991288 |
| Staten Island | 797 | 0.0526038 |
| Final Severity Level | Number | Percent |
|---|---|---|
| 1 | 1 | 6.60022440762986e-05 |
| 2 | 7 | 0.00046201570853409 |
| 3 | 14 | 0.00092403141706818 |
| 4 | 15129 | 0.998547950630321 |
| 5 | 0 | 0% |
| 6 | 0 | 0% |
| 7 | 0 | 0% |
| 8 | 0 | 0% |
| Disposition | Number | Percent |
|---|---|---|
| Transporting Patient | 12930 | 0.8534090 |
| Refused Medical Aid | 1617 | 0.1067256 |
| Unfounded | 335 | 0.0221108 |
| Patient Gone on Arrival | 131 | 0.0086463 |
| Cancelled | 84 | 0.0055442 |
| Condition Corrected | 25 | 0.0016501 |
| Other | 16 | 0.0010560 |
| Treated and Transported | 11 | 0.0007260 |
| Patient Pronounced Dead | 1 | 0.0000660 |
| Triaged at Scene No Transport | 1 | 0.0000660 |
Graphs, Heatmaps, and Tables Prepared By: Isaac H. Michaels, MPH
Data Source: NYC Open Data
Back to top
Sick Ped<5 Yrs-Fever & Cough
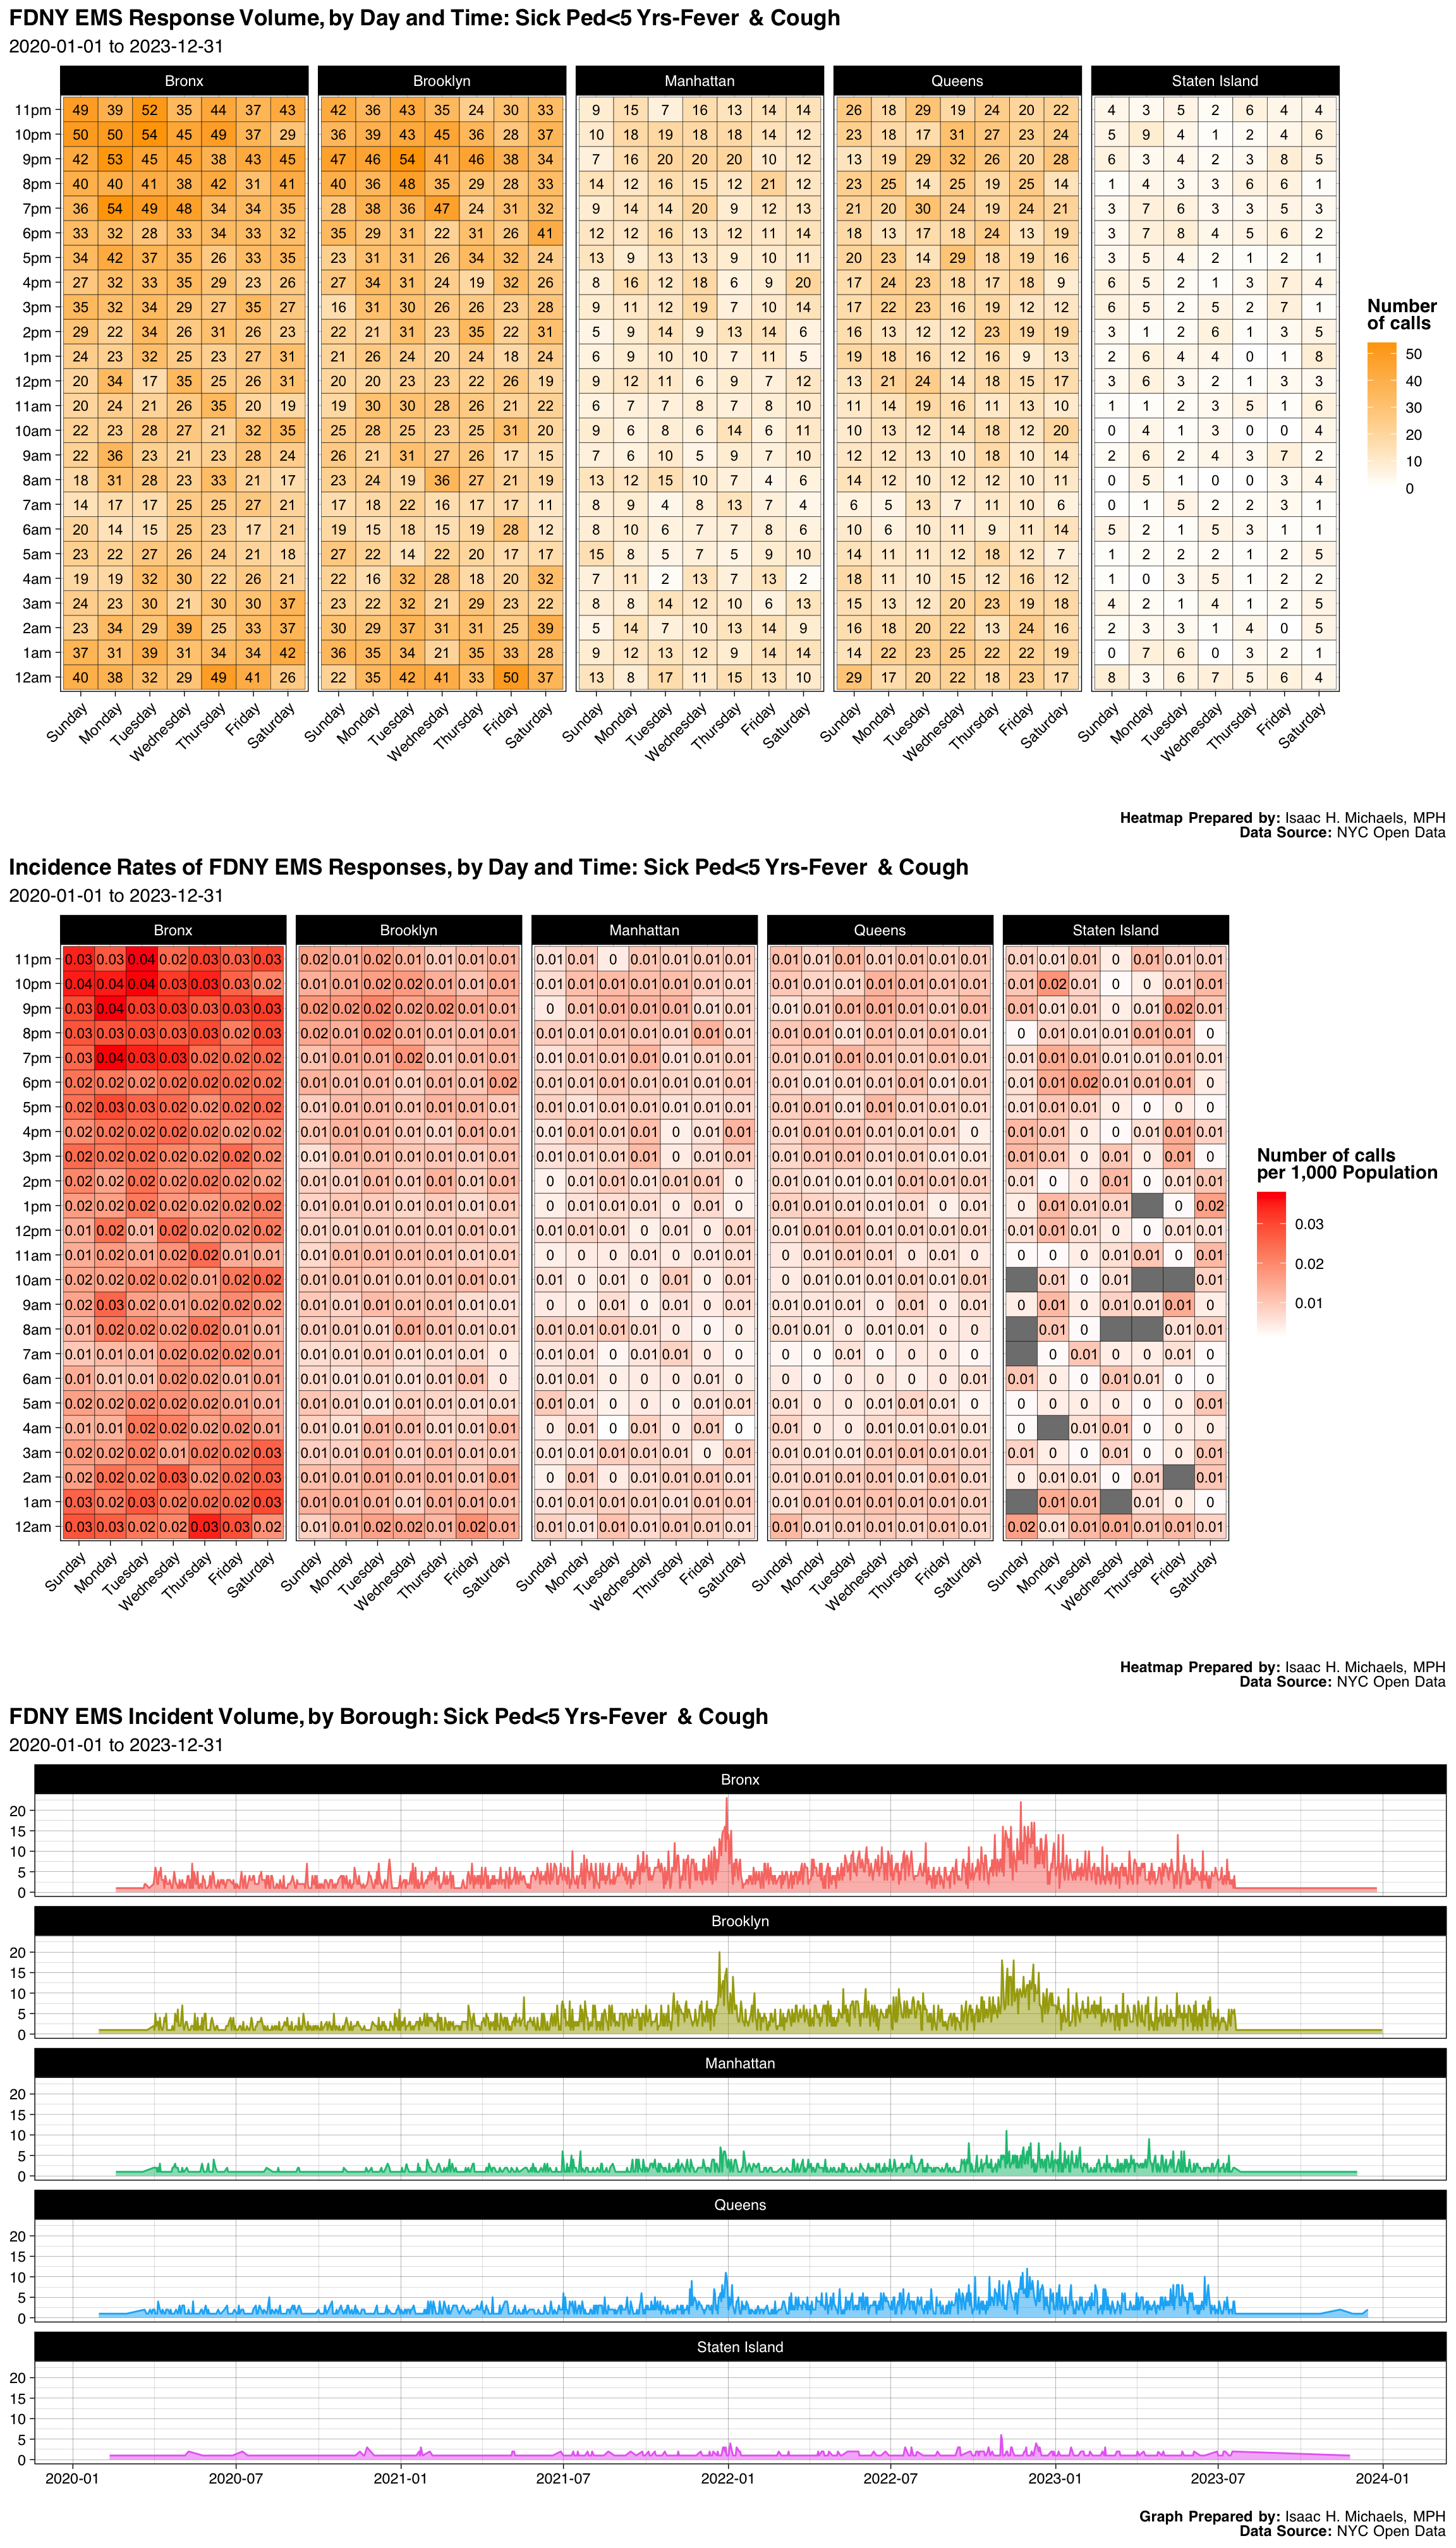
| Borough | Number | Percent |
|---|---|---|
| Bronx | 5172 | 0.3434719 |
| Brooklyn | 4694 | 0.3117280 |
| Manhattan | 1794 | 0.1191393 |
| Queens | 2852 | 0.1894010 |
| Staten Island | 546 | 0.0362598 |
| Final Severity Level | Number | Percent |
|---|---|---|
| 1 | 0 | 0% |
| 2 | 1 | 6.64098817904104e-05 |
| 3 | 7 | 0.000464869172532873 |
| 4 | 15050 | 0.999468720945677 |
| 5 | 0 | 0% |
| 6 | 0 | 0% |
| 7 | 0 | 0% |
| 8 | 0 | 0% |
| Disposition | Number | Percent |
|---|---|---|
| Transporting Patient | 13698 | 0.9096826 |
| Refused Medical Aid | 958 | 0.0636207 |
| Patient Gone on Arrival | 216 | 0.0143445 |
| Unfounded | 109 | 0.0072387 |
| Cancelled | 40 | 0.0026564 |
| Other | 18 | 0.0011954 |
| Condition Corrected | 16 | 0.0010626 |
| Treated and Transported | 3 | 0.0001992 |
Graphs, Heatmaps, and Tables Prepared By: Isaac H. Michaels, MPH
Data Source: NYC Open Data
Back to top
Gyn Bleeding/Pt Not Pregnant
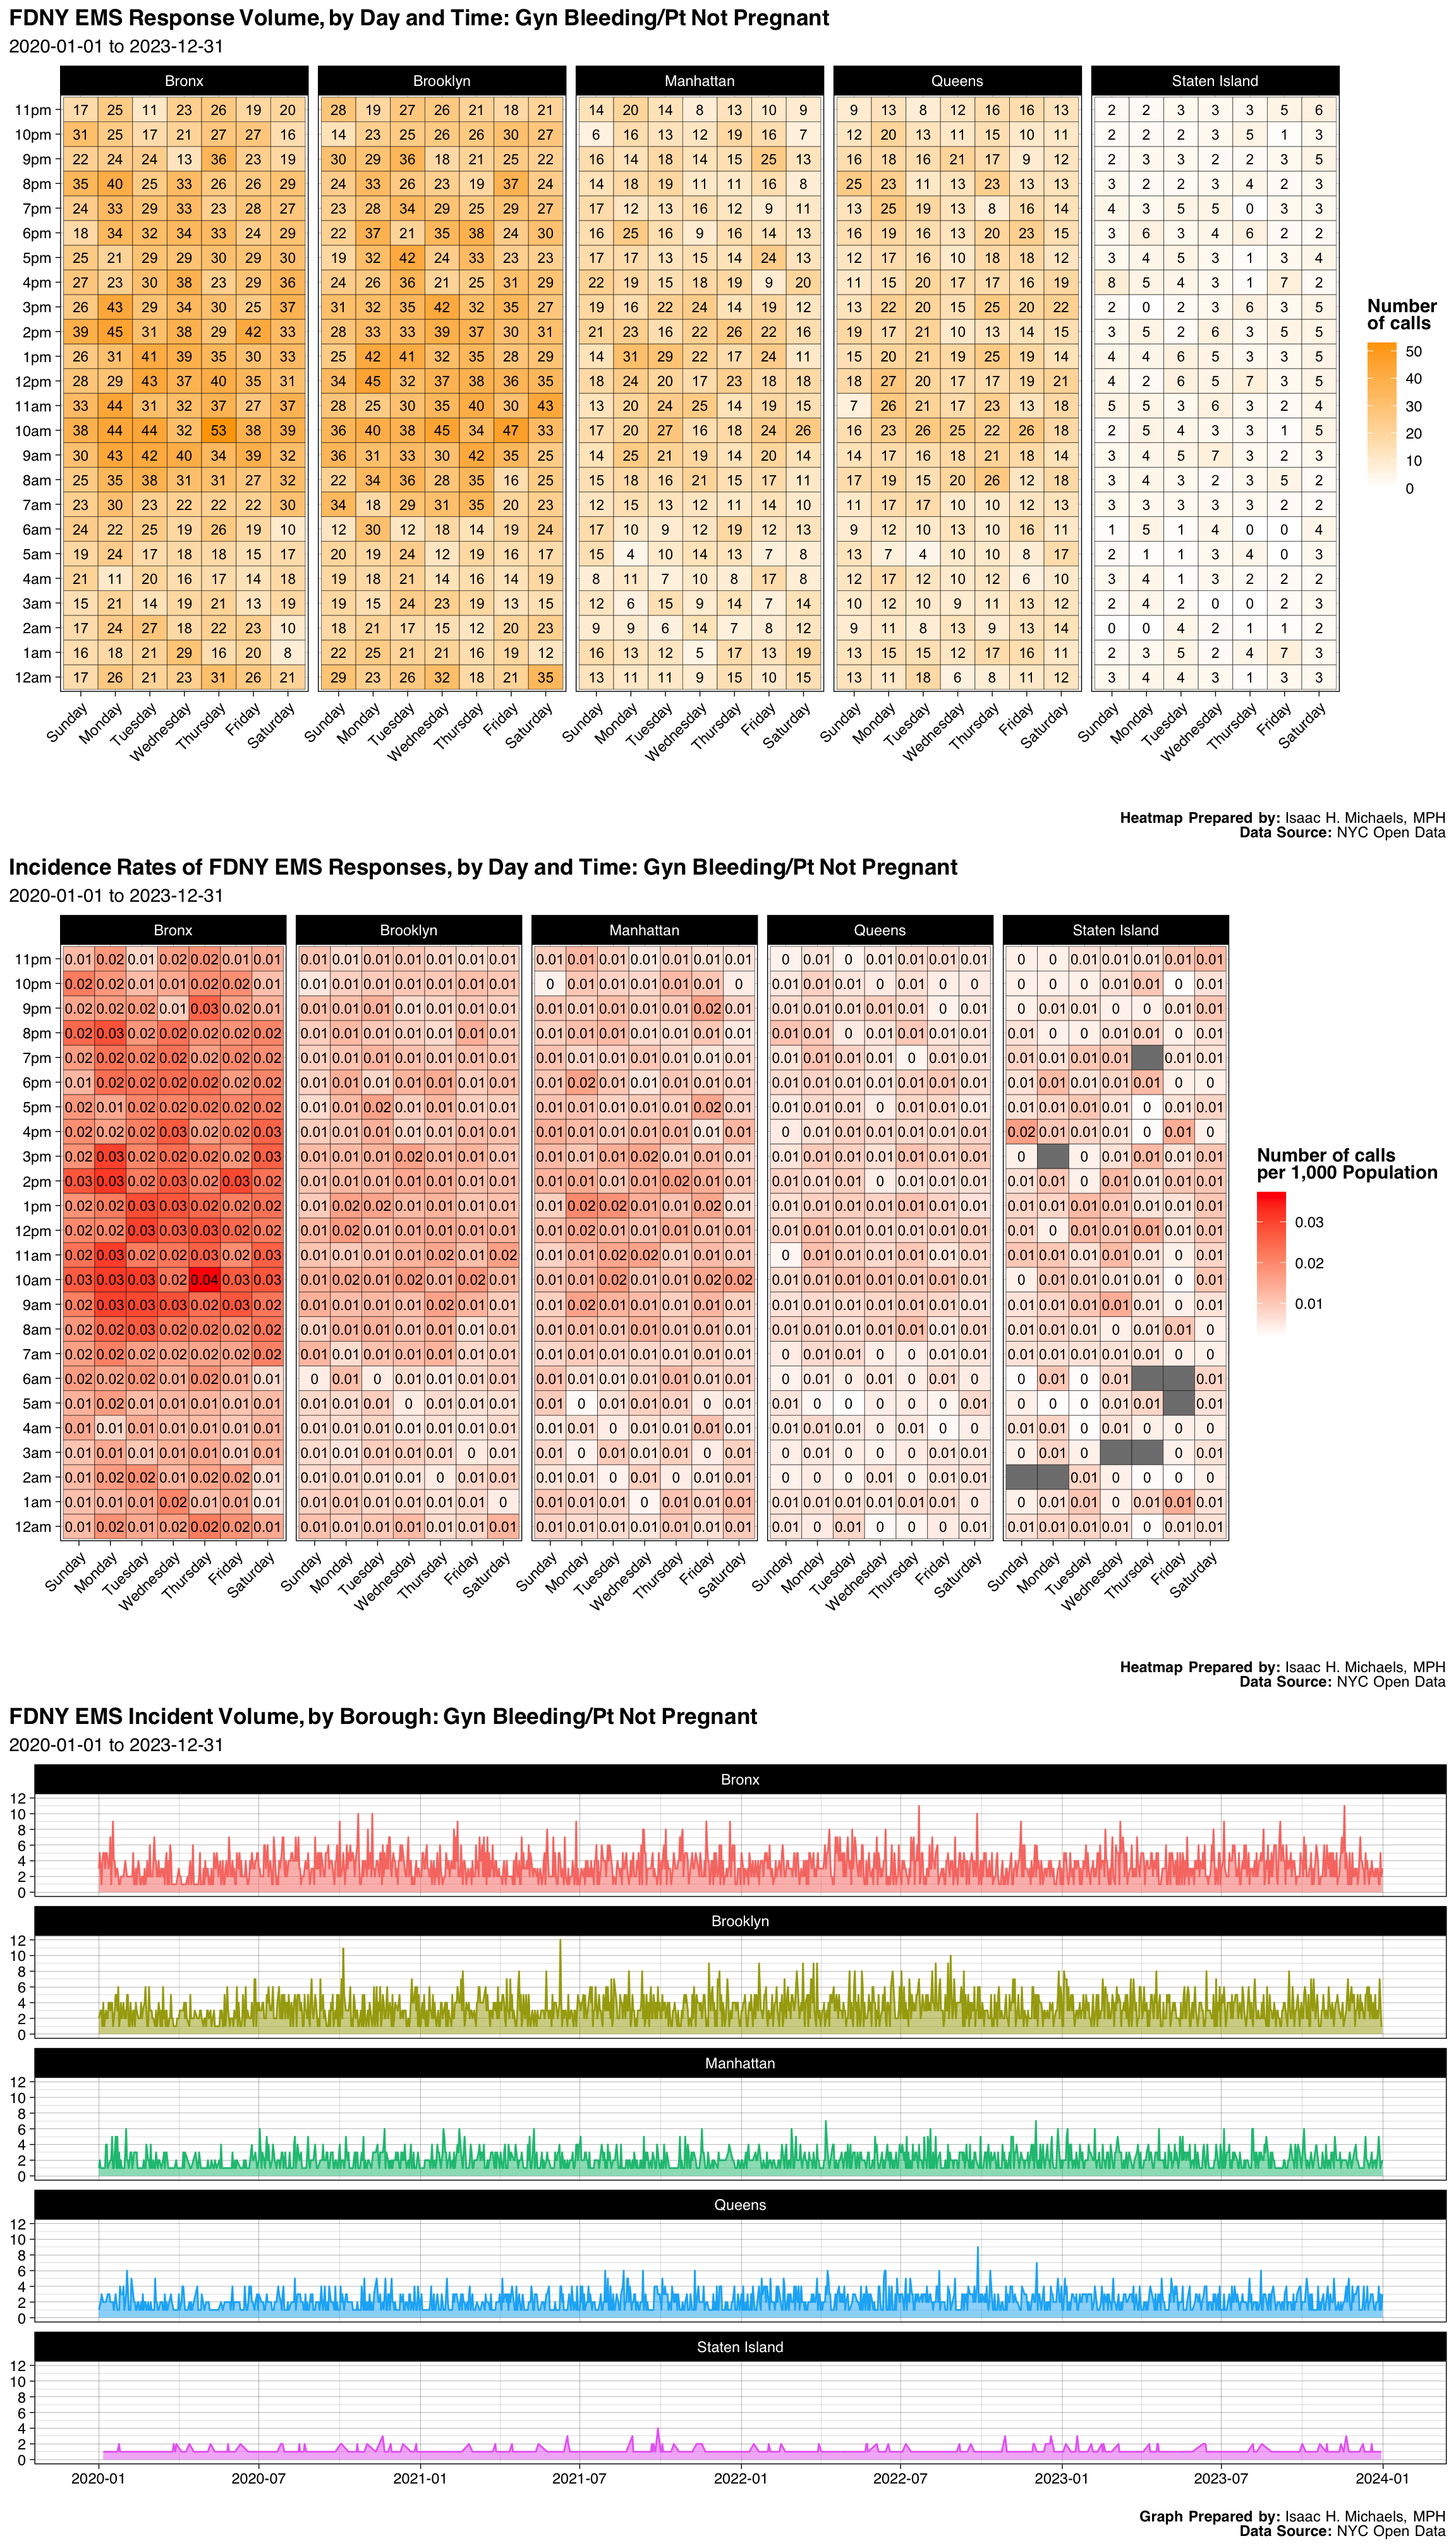
| Borough | Number | Percent |
|---|---|---|
| Bronx | 4565 | 0.3105231 |
| Brooklyn | 4515 | 0.3071220 |
| Manhattan | 2539 | 0.1727093 |
| Queens | 2552 | 0.1735936 |
| Staten Island | 530 | 0.0360520 |
| Final Severity Level | Number | Percent |
|---|---|---|
| 1 | 0 | 0% |
| 2 | 2 | 0.000136045166995442 |
| 3 | 2 | 0.000136045166995442 |
| 4 | 55 | 0.00374124209237467 |
| 5 | 14641 | 0.995918644990137 |
| 6 | 0 | 0% |
| 7 | 1 | 6.80225834977212e-05 |
| 8 | 0 | 0% |
| Disposition | Number | Percent |
|---|---|---|
| Transporting Patient | 12700 | 0.8638868 |
| Refused Medical Aid | 1197 | 0.0814230 |
| Unfounded | 424 | 0.0288416 |
| Patient Gone on Arrival | 157 | 0.0106795 |
| Condition Corrected | 81 | 0.0055098 |
| Cancelled | 77 | 0.0052377 |
| Other | 61 | 0.0041494 |
| Treated and Transported | 4 | 0.0002721 |
Graphs, Heatmaps, and Tables Prepared By: Isaac H. Michaels, MPH
Data Source: NYC Open Data
Back to top
Asthma Attack - Fever&Cough
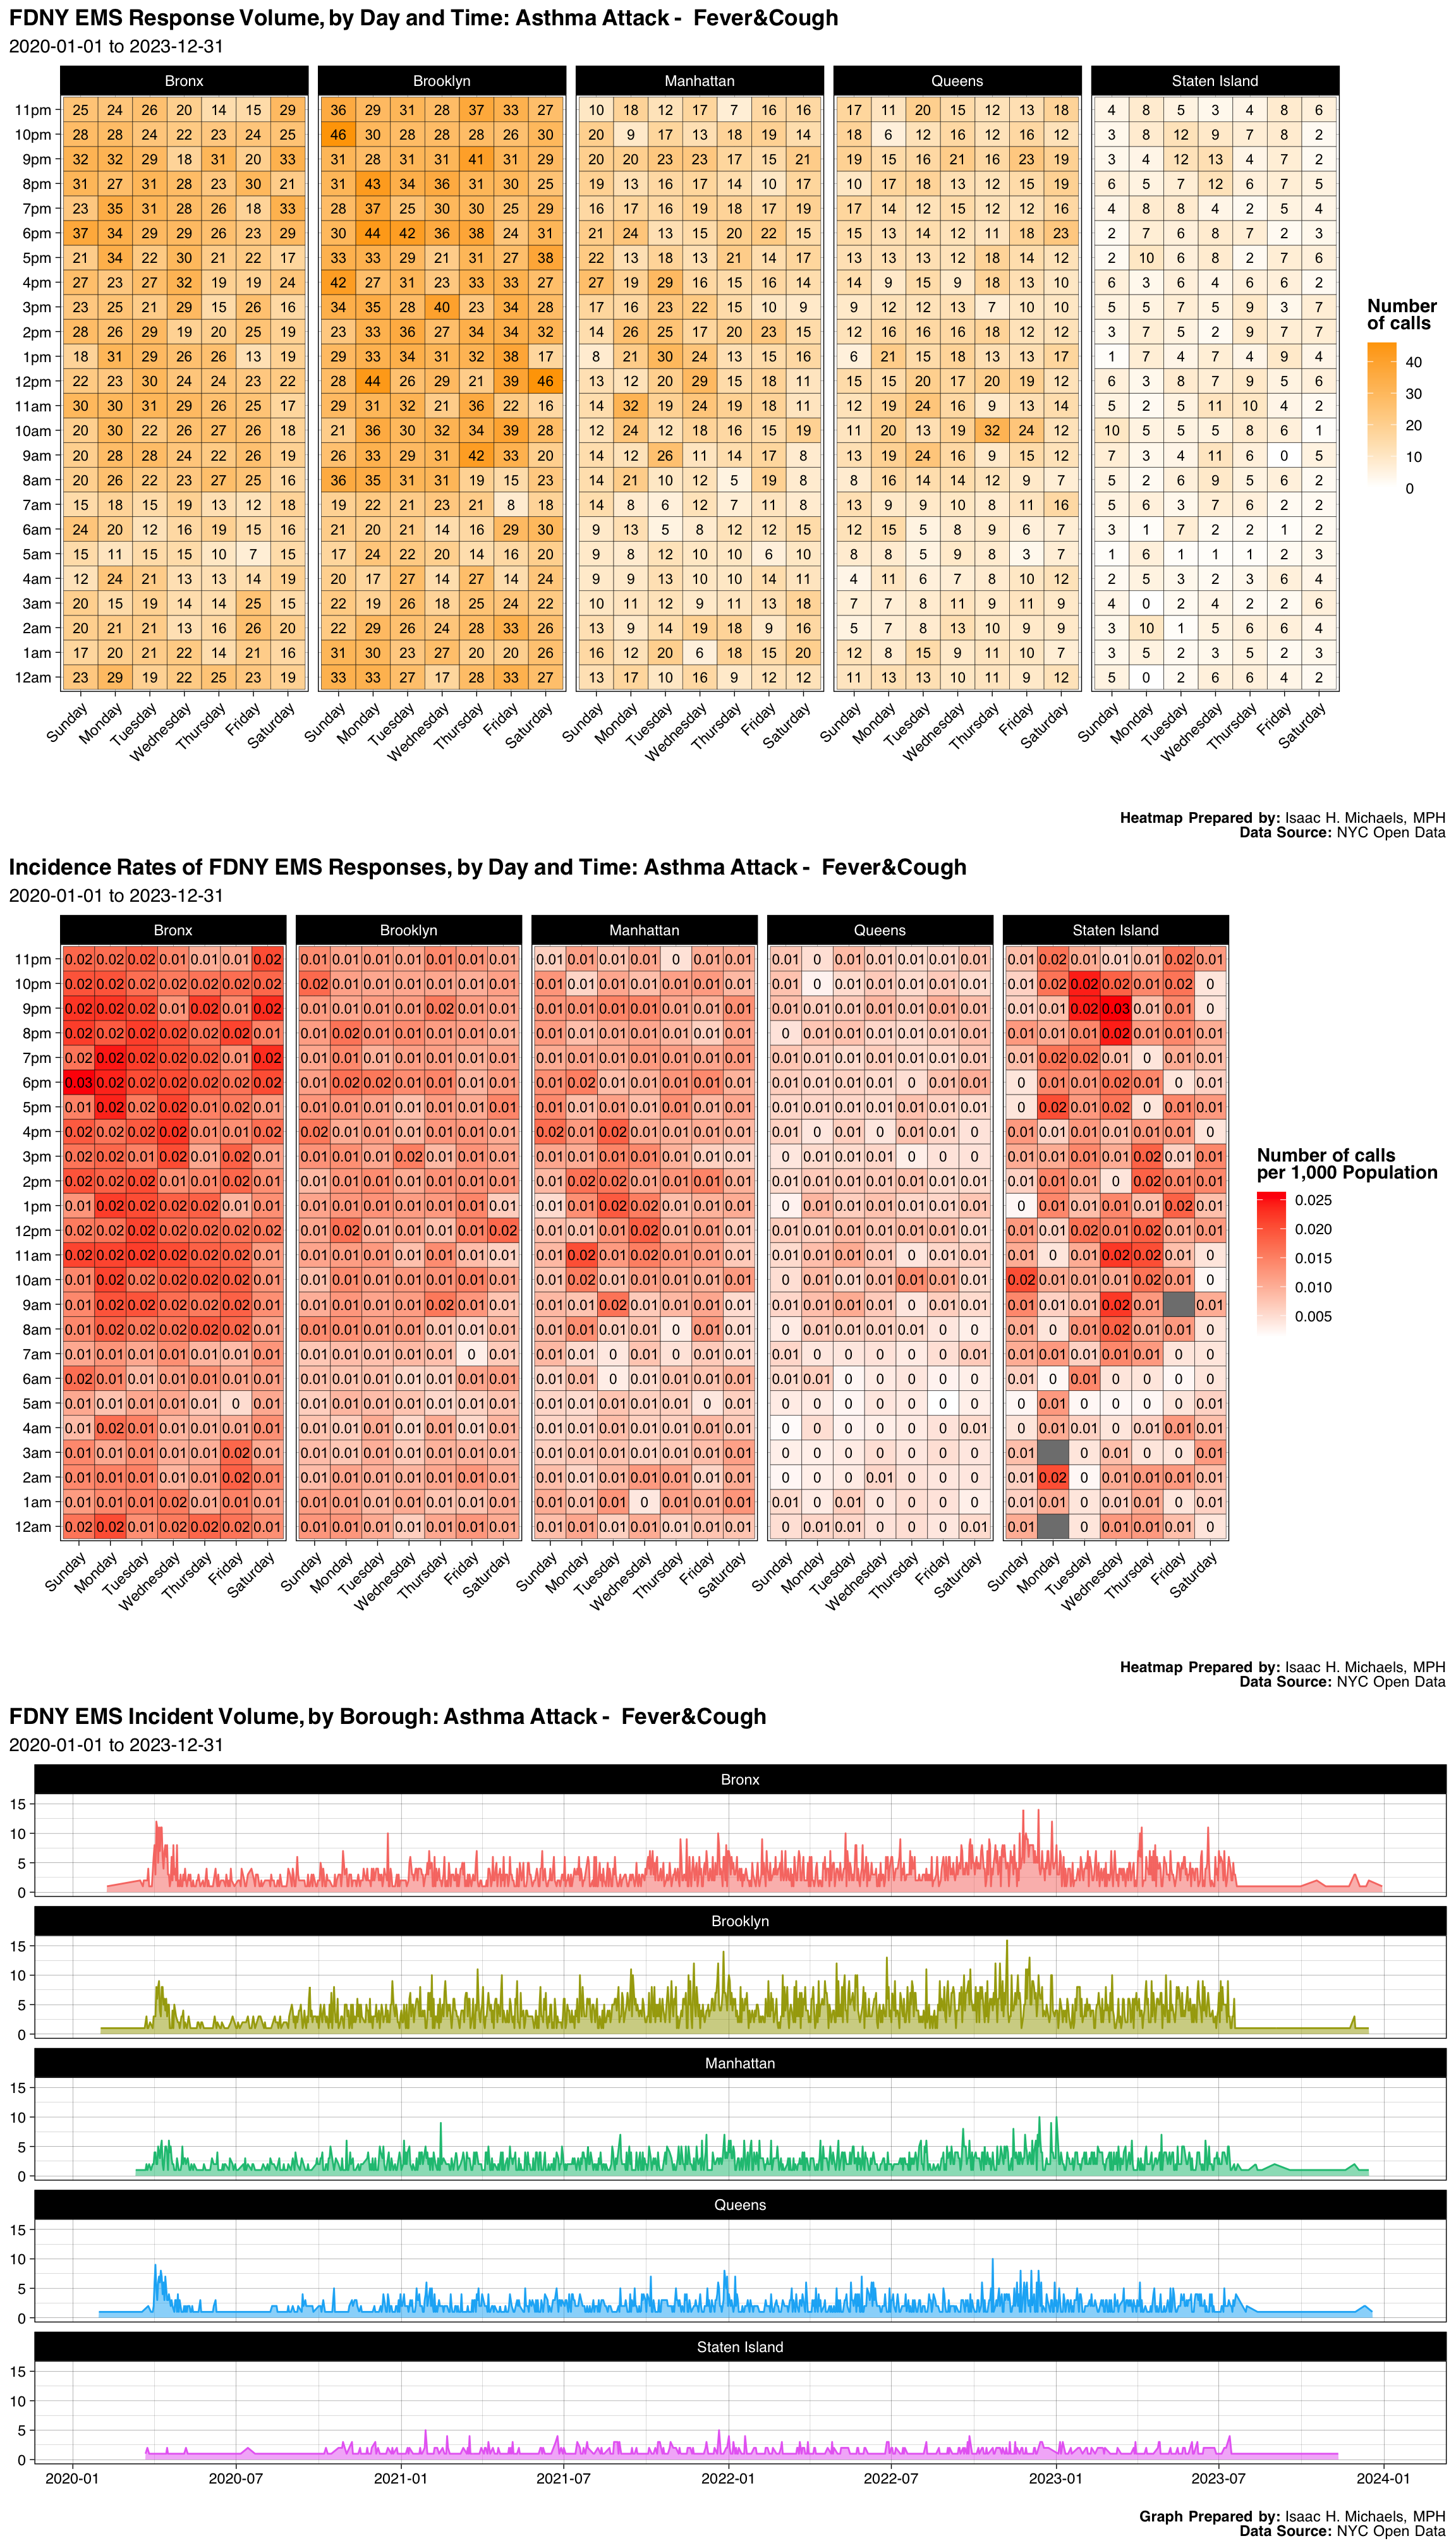
| Borough | Number | Percent |
|---|---|---|
| Bronx | 3772 | 0.2683361 |
| Brooklyn | 4743 | 0.3374120 |
| Manhattan | 2557 | 0.1819023 |
| Queens | 2158 | 0.1535178 |
| Staten Island | 827 | 0.0588319 |
| Final Severity Level | Number | Percent |
|---|---|---|
| 1 | 0 | 0% |
| 2 | 14053 | 0.999715444262645 |
| 3 | 1 | 7.11389343387636e-05 |
| 4 | 3 | 0.000213416803016291 |
| 5 | 0 | 0% |
| 6 | 0 | 0% |
| 7 | 0 | 0% |
| 8 | 0 | 0% |
| Disposition | Number | Percent |
|---|---|---|
| Transporting Patient | 10626 | 0.7559223 |
| Refused Medical Aid | 2652 | 0.1886605 |
| Unfounded | 445 | 0.0316568 |
| Patient Gone on Arrival | 172 | 0.0122359 |
| Condition Corrected | 72 | 0.0051220 |
| Cancelled | 71 | 0.0050509 |
| Other | 8 | 0.0005691 |
| Triaged at Scene No Transport | 6 | 0.0004268 |
| Treated and Transported | 5 | 0.0003557 |
Graphs, Heatmaps, and Tables Prepared By: Isaac H. Michaels, MPH
Data Source: NYC Open Data
Back to top
Request For Stand-By
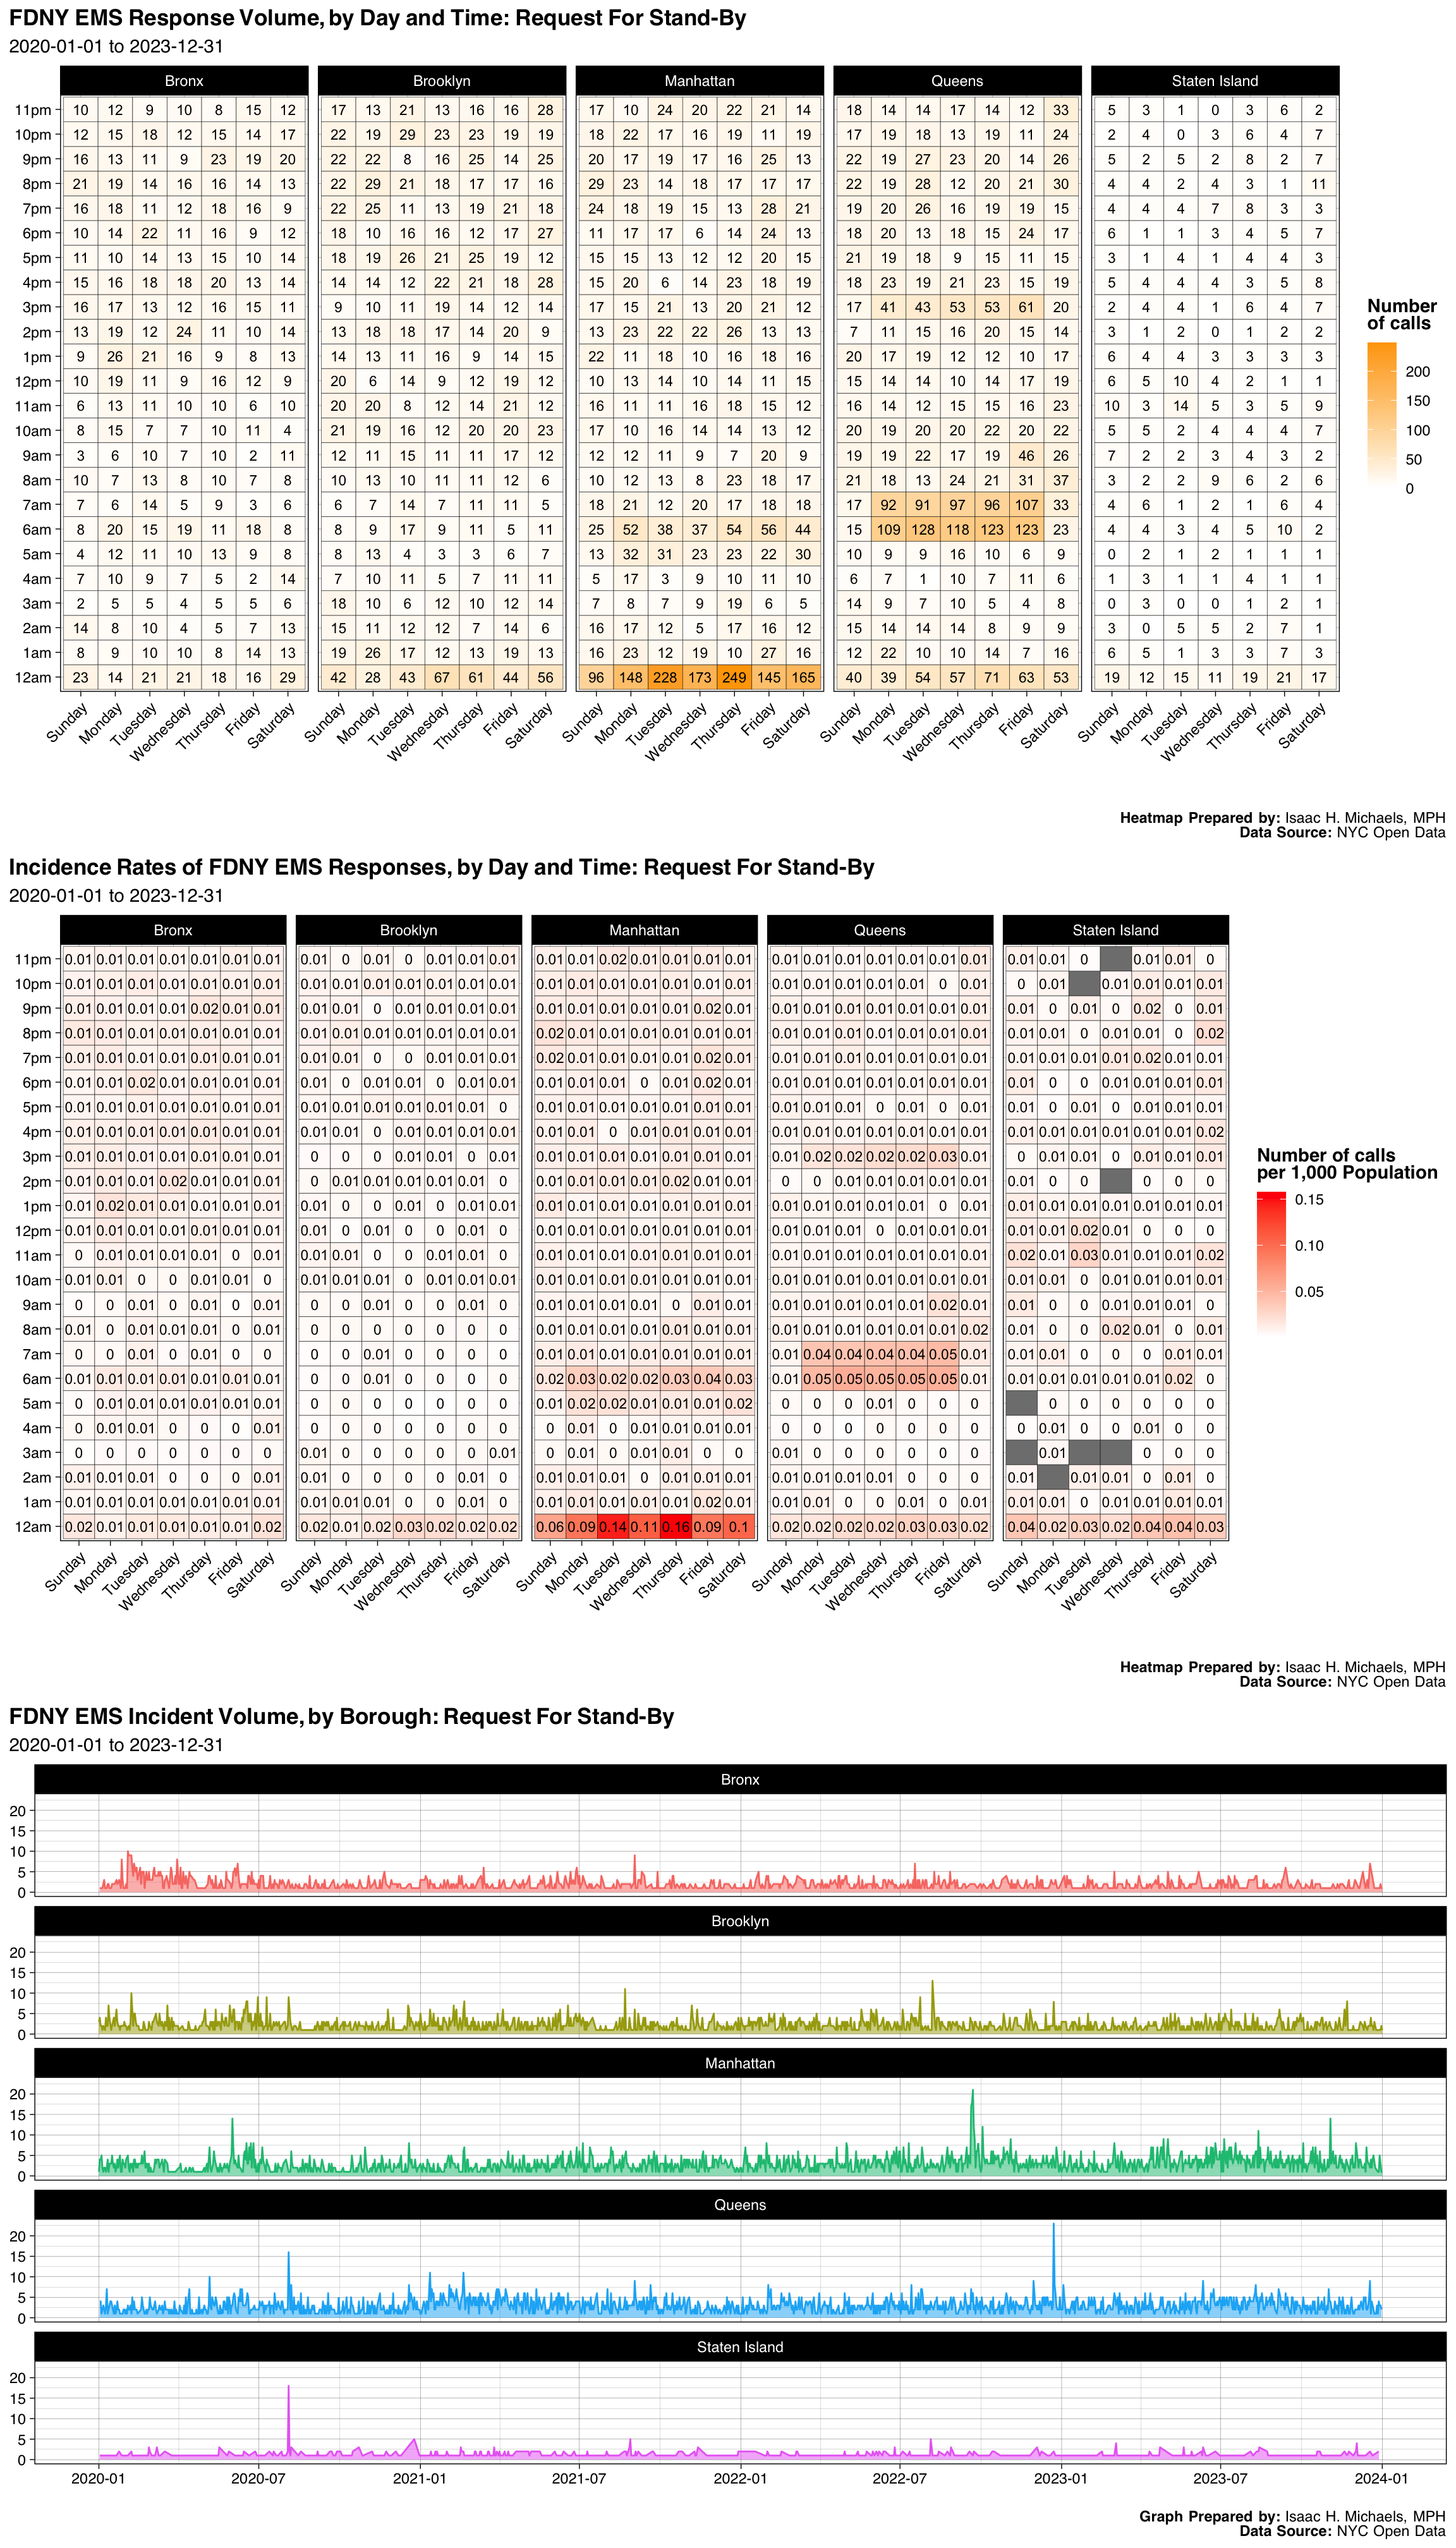
| Borough | Number | Percent |
|---|---|---|
| Bronx | 2006 | 0.1487689 |
| Brooklyn | 2702 | 0.2003856 |
| Manhattan | 3946 | 0.2926431 |
| Queens | 4131 | 0.3063631 |
| Staten Island | 694 | 0.0514684 |
| Unknown | 5 | 0.0003708 |
| Final Severity Level | Number | Percent |
|---|---|---|
| 1 | 1 | 7.41619697419163e-05 |
| 2 | 3 | 0.000222485909225749 |
| 3 | 3 | 0.000222485909225749 |
| 4 | 8 | 0.000593295757935331 |
| 5 | 0 | 0% |
| 6 | 3 | 0.000222485909225749 |
| 7 | 3 | 0.000222485909225749 |
| 8 | 13463 | 0.99844259863542 |
| Disposition | Number | Percent |
|---|---|---|
| Condition Corrected | 5318 | 0.3943934 |
| Unfounded | 3743 | 0.2775883 |
| Cancelled | 2394 | 0.1775438 |
| Other | 1126 | 0.0835064 |
| Transporting Patient | 495 | 0.0367102 |
| Refused Medical Aid | 301 | 0.0223228 |
| Patient Gone on Arrival | 88 | 0.0065263 |
| Patient Pronounced Dead | 9 | 0.0006675 |
| Treated and Transported | 7 | 0.0005191 |
| Treated Not Transported | 3 | 0.0002225 |
Graphs, Heatmaps, and Tables Prepared By: Isaac H. Michaels, MPH
Data Source: NYC Open Data
Back to top
Gun Shot Wound
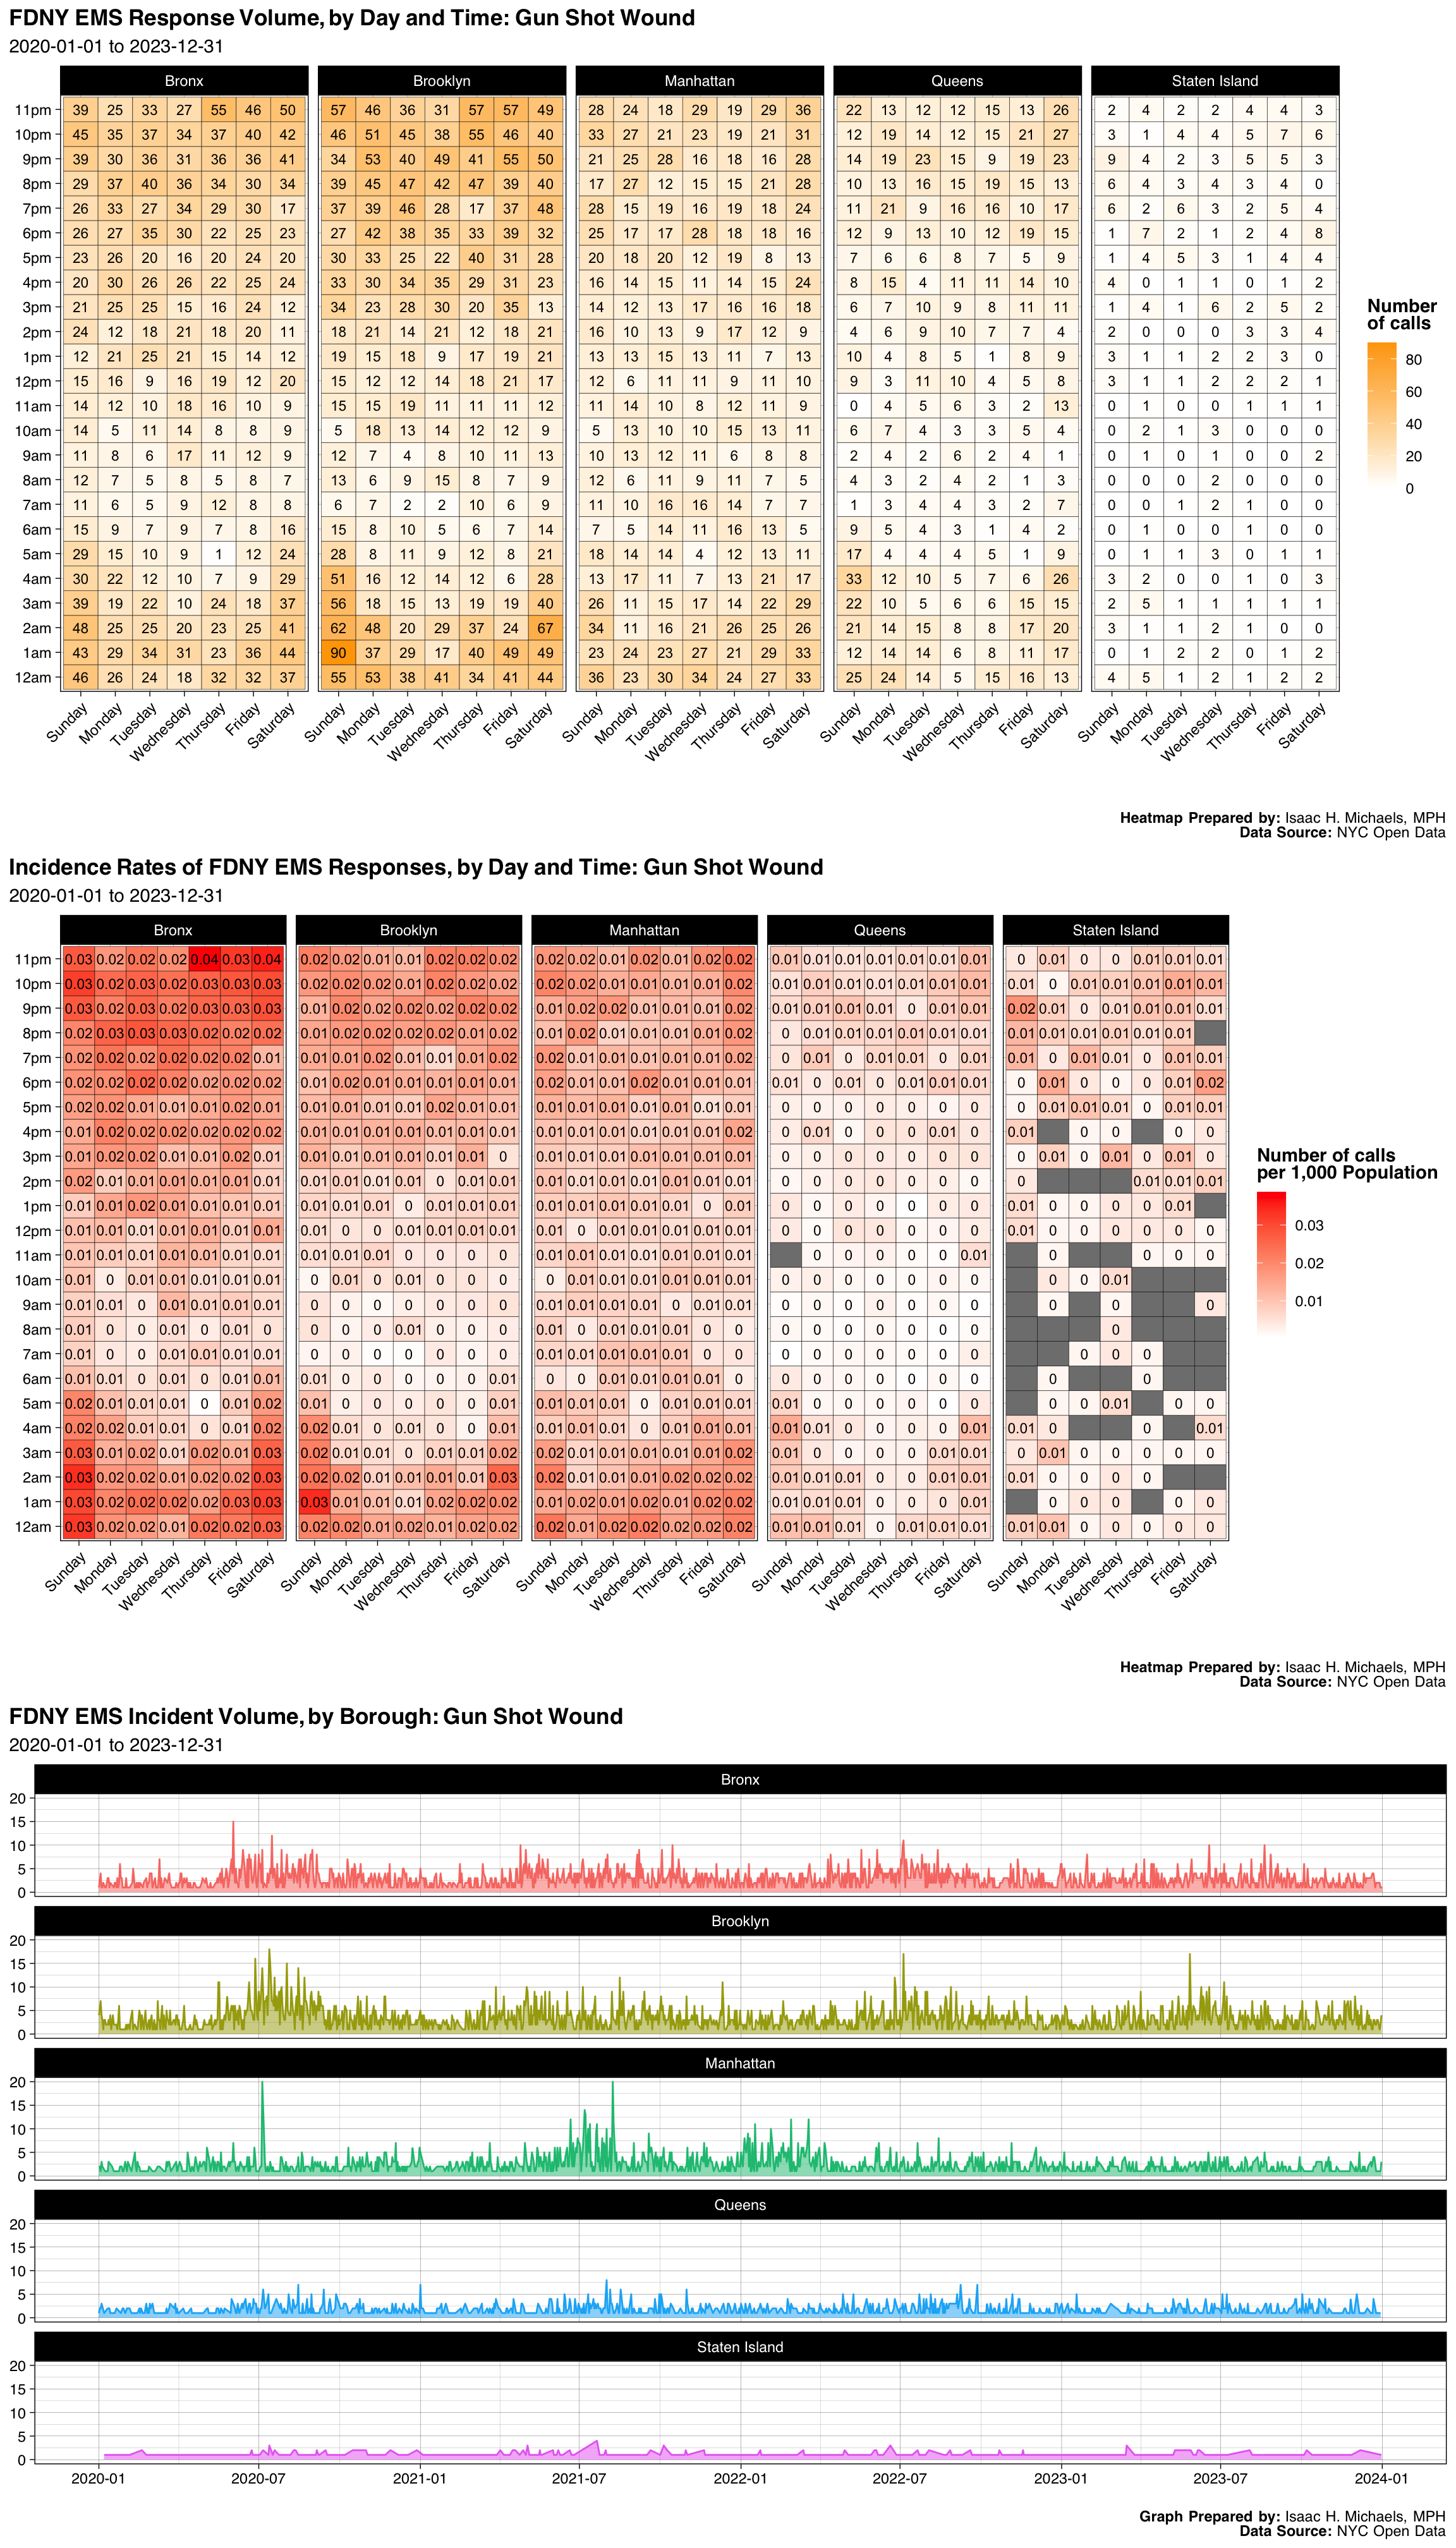
| Borough | Number | Percent |
|---|---|---|
| Bronx | 3693 | 0.2857253 |
| Brooklyn | 4468 | 0.3456867 |
| Manhattan | 2787 | 0.2156286 |
| Queens | 1647 | 0.1274275 |
| Staten Island | 330 | 0.0255319 |
| Final Severity Level | Number | Percent |
|---|---|---|
| 1 | 0 | 0% |
| 2 | 0 | 0% |
| 3 | 12924 | 0.999922630560928 |
| 4 | 1 | 7.73694390715667e-05 |
| 5 | 0 | 0% |
| 6 | 0 | 0% |
| 7 | 0 | 0% |
| 8 | 0 | 0% |
| Disposition | Number | Percent |
|---|---|---|
| Unfounded | 5324 | 0.4119149 |
| Transporting Patient | 4204 | 0.3252611 |
| Cancelled | 929 | 0.0718762 |
| Condition Corrected | 829 | 0.0641393 |
| Other | 733 | 0.0567118 |
| Patient Gone on Arrival | 431 | 0.0333462 |
| Refused Medical Aid | 413 | 0.0319536 |
| Patient Pronounced Dead | 46 | 0.0035590 |
| Treated and Transported | 16 | 0.0012379 |
Graphs, Heatmaps, and Tables Prepared By: Isaac H. Michaels, MPH
Data Source: NYC Open Data
Back to top
Police 10-13, Confirmed
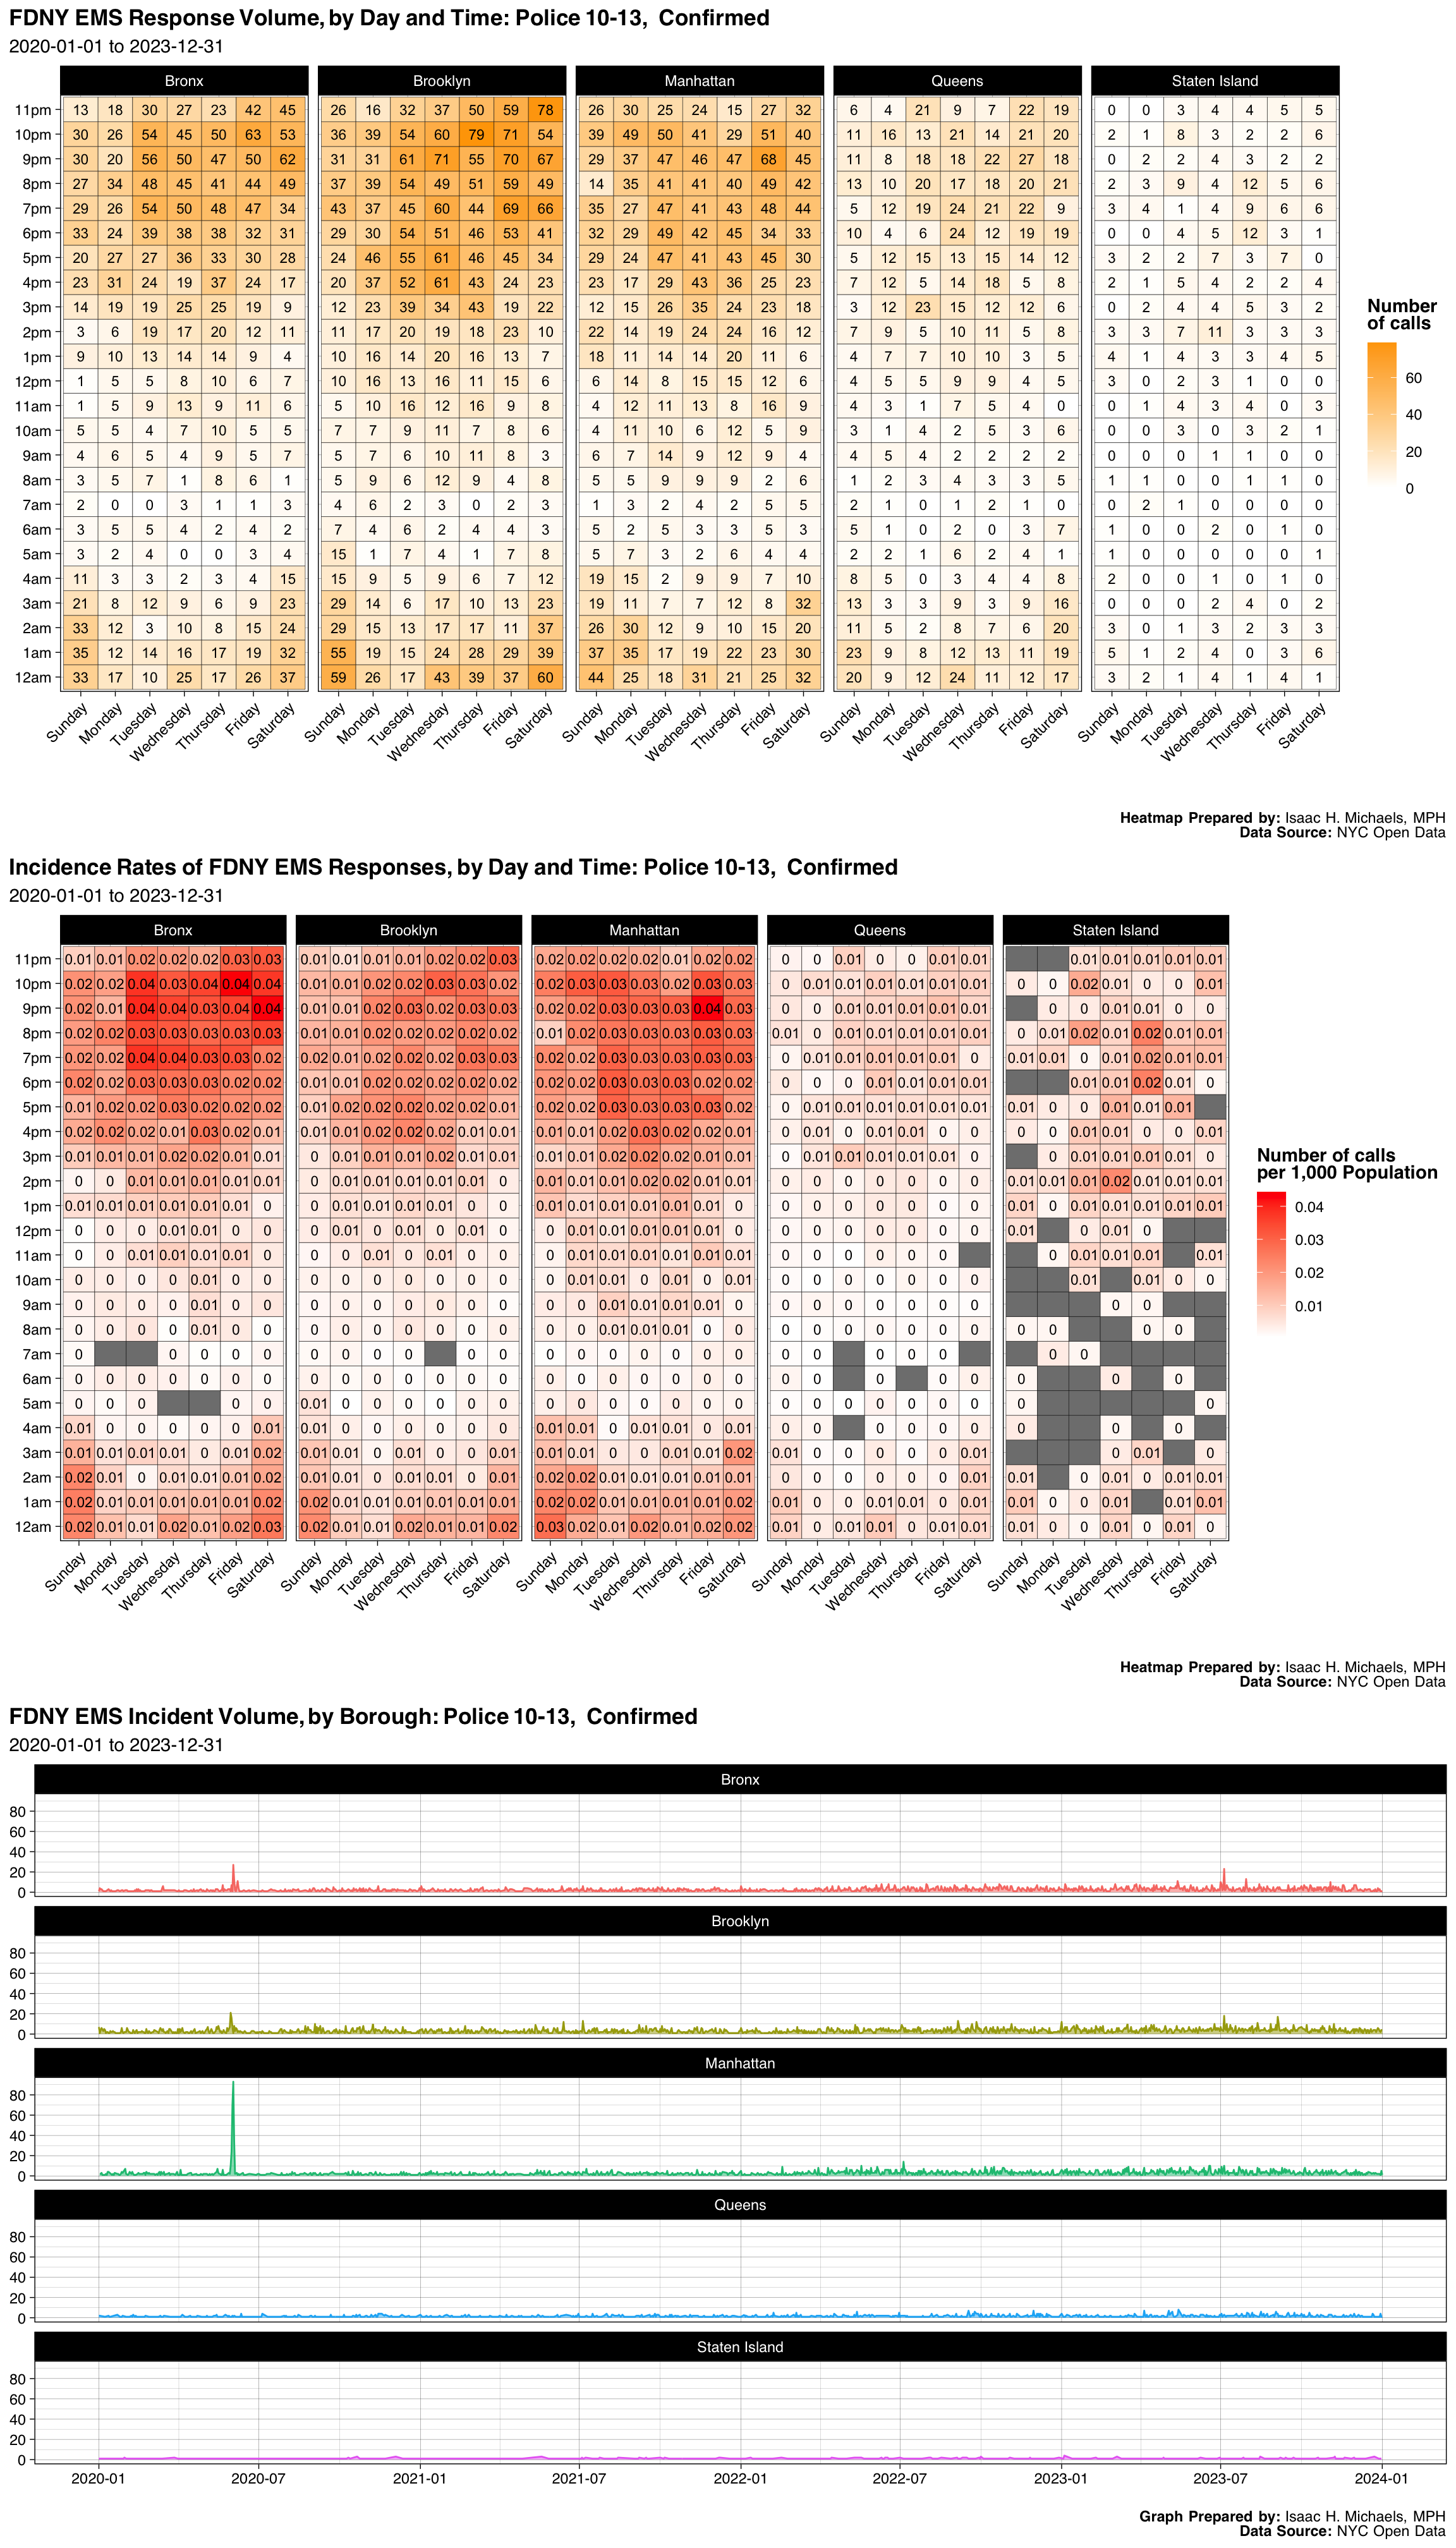
| Borough | Number | Percent |
|---|---|---|
| Bronx | 3115 | 0.2434354 |
| Brooklyn | 4278 | 0.3343232 |
| Manhattan | 3500 | 0.2735230 |
| Queens | 1511 | 0.1180838 |
| Staten Island | 392 | 0.0306346 |
| Final Severity Level | Number | Percent |
|---|---|---|
| 1 | 0 | 0% |
| 2 | 2 | 0.000156298843388559 |
| 3 | 12791 | 0.999609252891529 |
| 4 | 1 | 7.81494216942795e-05 |
| 5 | 0 | 0% |
| 6 | 0 | 0% |
| 7 | 2 | 0.000156298843388559 |
| 8 | 0 | 0% |
| Disposition | Number | Percent |
|---|---|---|
| Condition Corrected | 4356 | 0.3404189 |
| Unfounded | 4150 | 0.3243201 |
| Transporting Patient | 2066 | 0.1614567 |
| Cancelled | 1075 | 0.0840106 |
| Refused Medical Aid | 769 | 0.0600969 |
| Other | 219 | 0.0171147 |
| Patient Gone on Arrival | 149 | 0.0116443 |
| Treated and Transported | 6 | 0.0004689 |
| Patient Pronounced Dead | 3 | 0.0002344 |
| Treated Not Transported | 2 | 0.0001563 |
| Triaged at Scene No Transport | 1 | 0.0000781 |
Graphs, Heatmaps, and Tables Prepared By: Isaac H. Michaels, MPH
Data Source: NYC Open Data
Back to top
Miscarriage
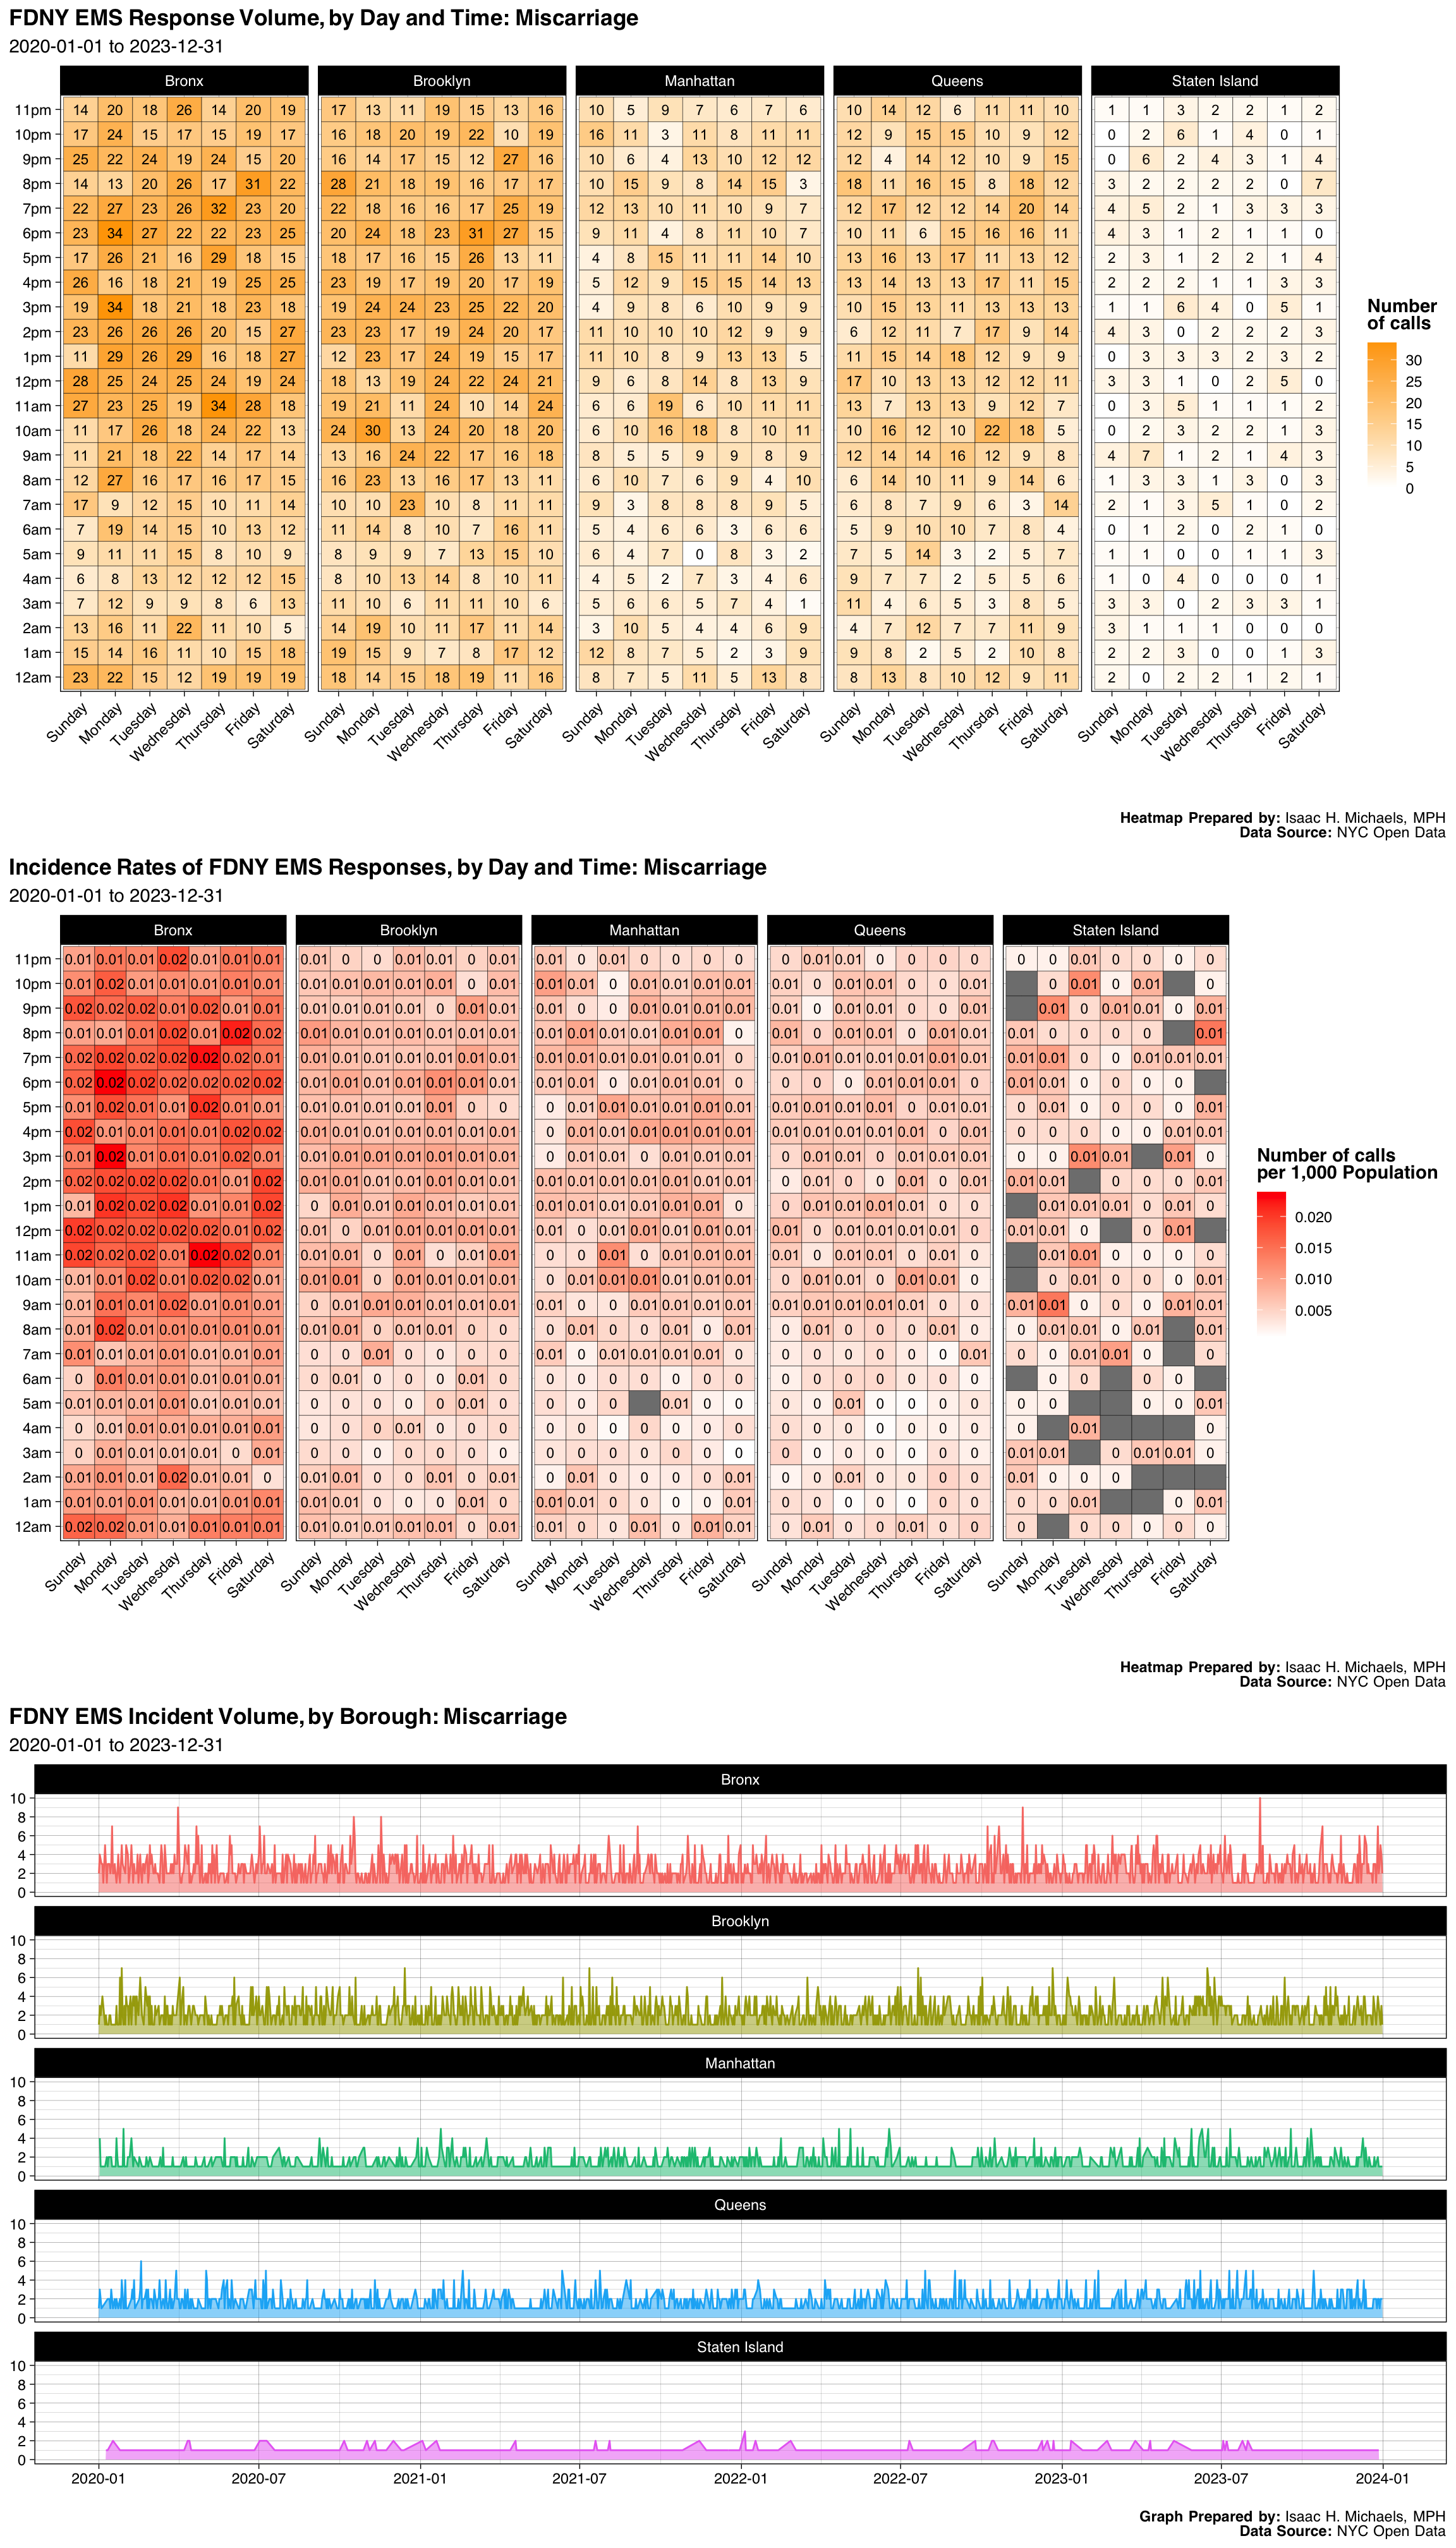
| Borough | Number | Percent |
|---|---|---|
| Bronx | 3078 | 0.3299389 |
| Brooklyn | 2761 | 0.2959588 |
| Manhattan | 1390 | 0.1489977 |
| Queens | 1773 | 0.1900525 |
| Staten Island | 327 | 0.0350520 |
| Final Severity Level | Number | Percent |
|---|---|---|
| 1 | 0 | 0% |
| 2 | 0 | 0% |
| 3 | 3 | 0.00032157787544217 |
| 4 | 9326 | 0.999678422124558 |
| 5 | 0 | 0% |
| 6 | 0 | 0% |
| 7 | 0 | 0% |
| 8 | 0 | 0% |
| Disposition | Number | Percent |
|---|---|---|
| Transporting Patient | 8380 | 0.8982742 |
| Refused Medical Aid | 450 | 0.0482367 |
| Unfounded | 235 | 0.0251903 |
| Patient Gone on Arrival | 168 | 0.0180084 |
| Cancelled | 64 | 0.0068603 |
| Condition Corrected | 16 | 0.0017151 |
| Other | 14 | 0.0015007 |
| Triaged at Scene No Transport | 2 | 0.0002144 |
Graphs, Heatmaps, and Tables Prepared By: Isaac H. Michaels, MPH
Data Source: NYC Open Data
Back to top
Alt Mental Status-Fever&Cough
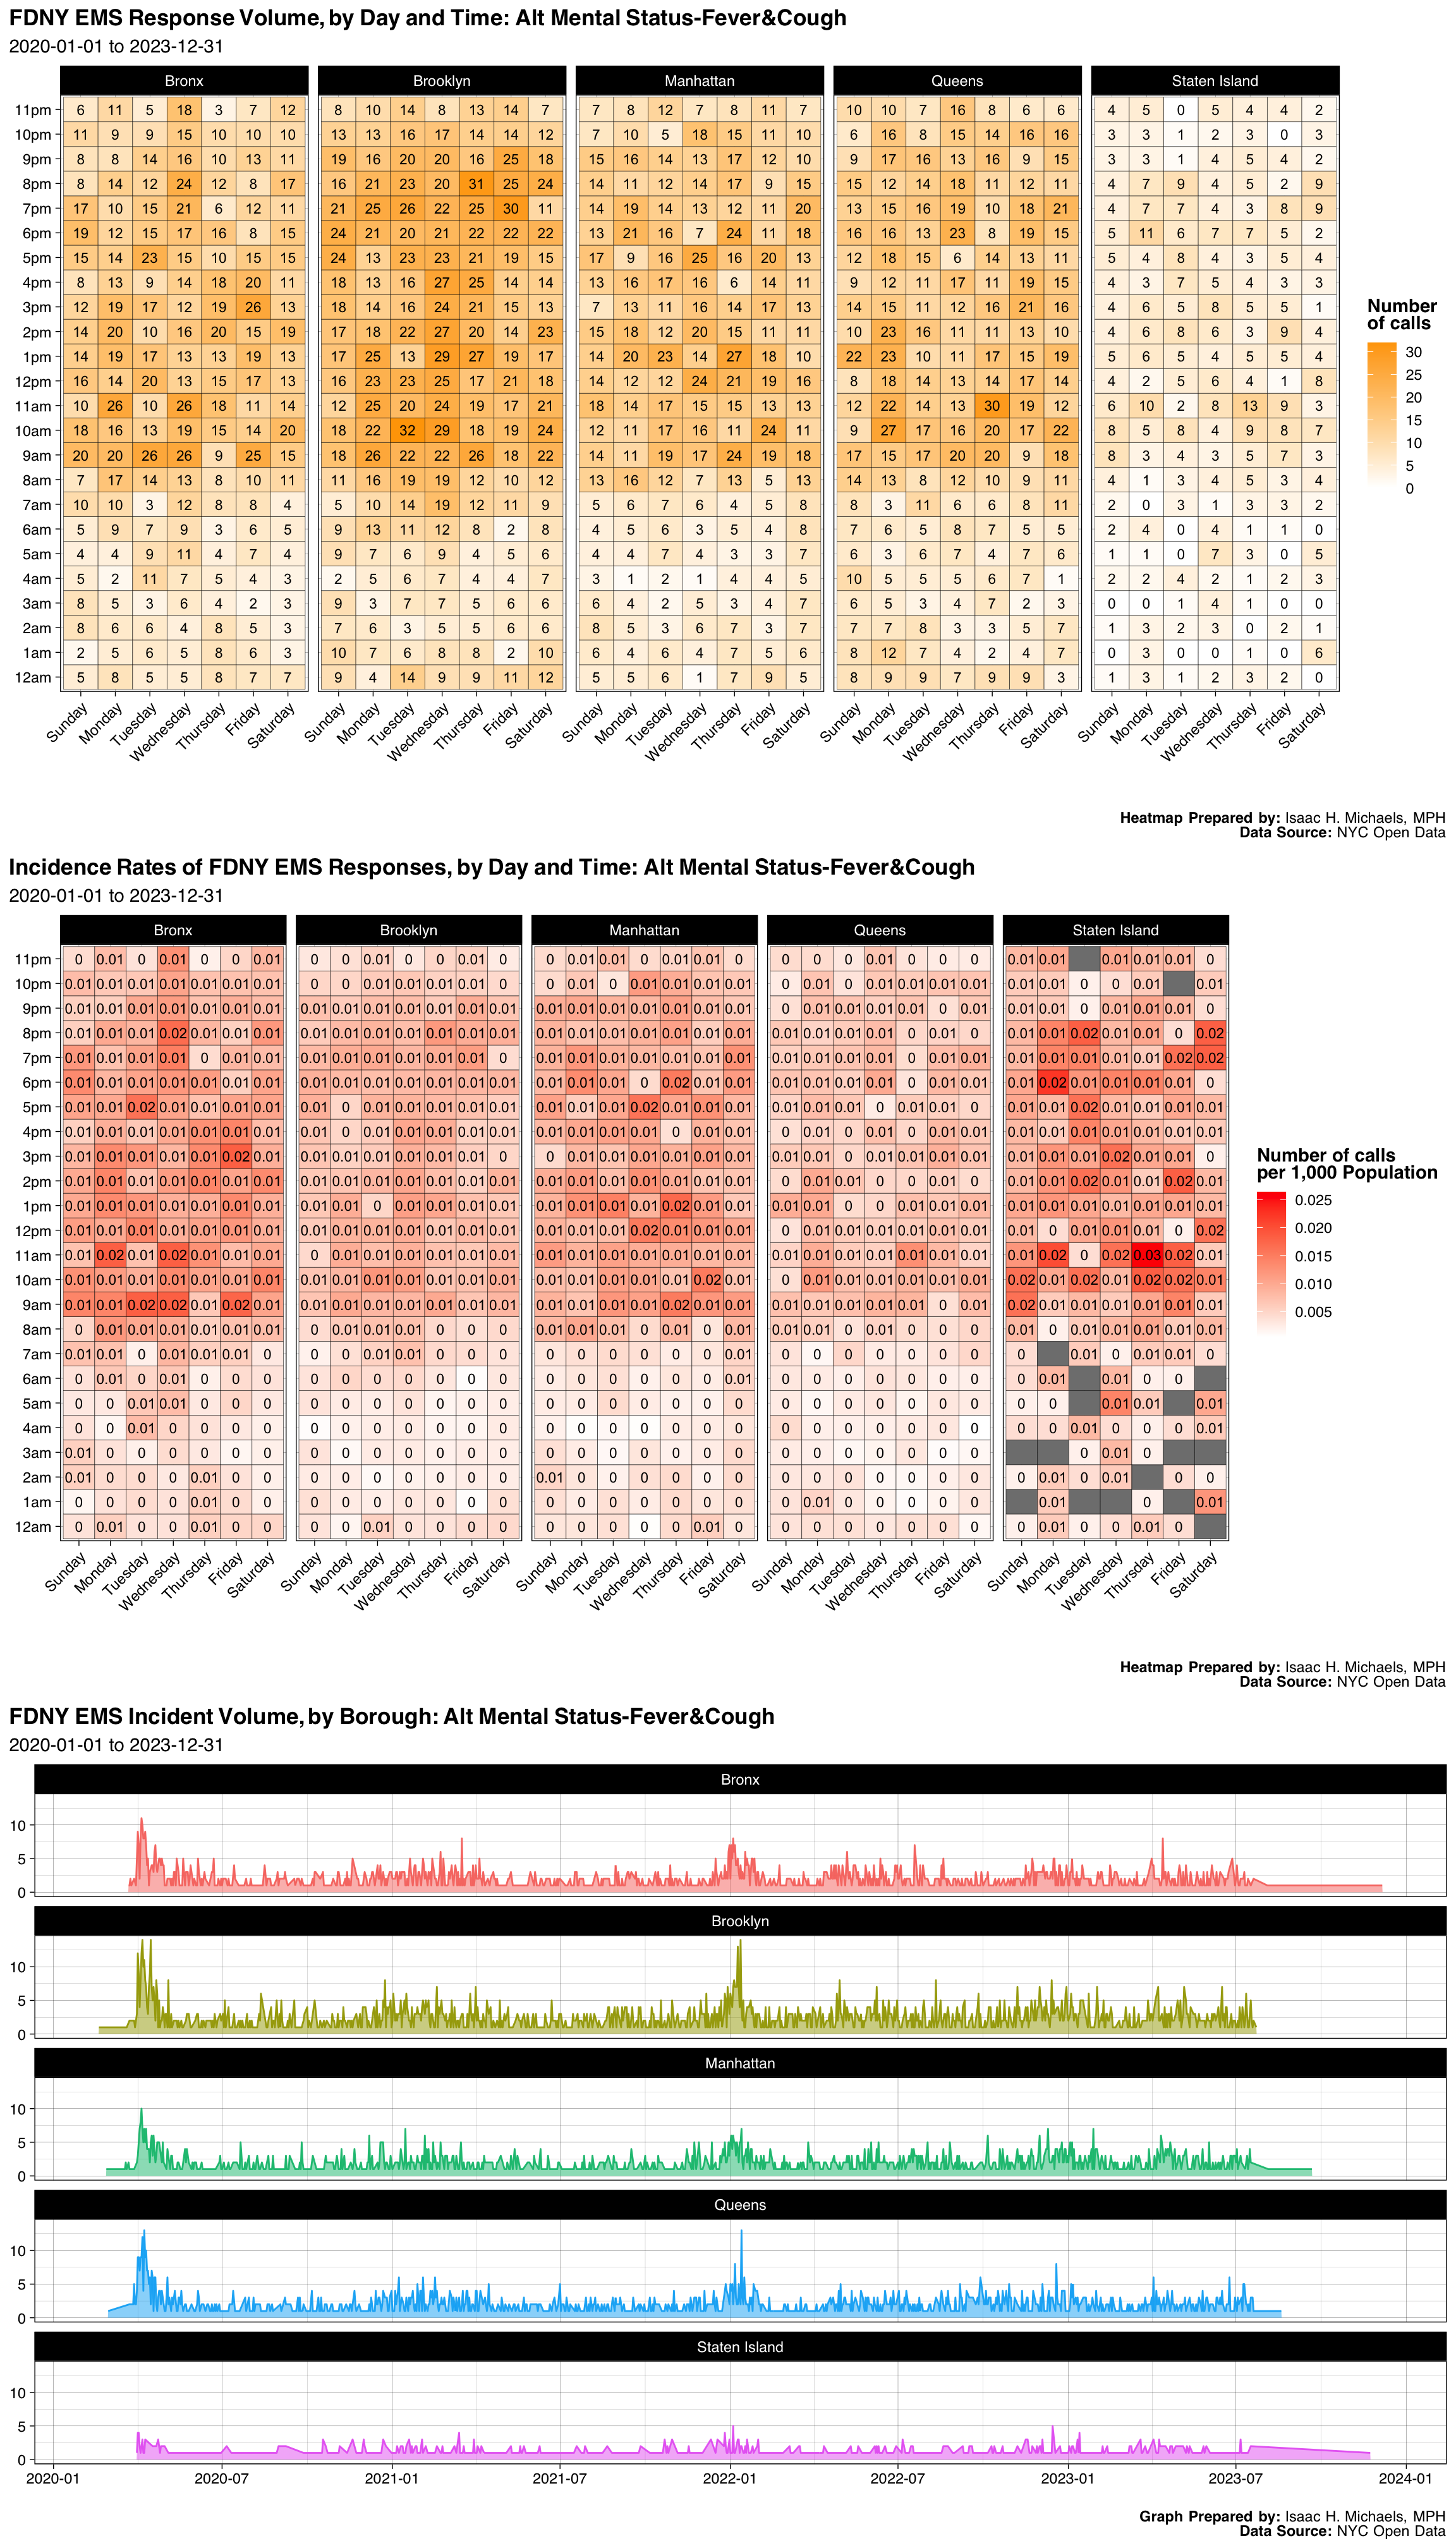
| Borough | Number | Percent |
|---|---|---|
| Bronx | 1934 | 0.2158241 |
| Brooklyn | 2573 | 0.2871331 |
| Manhattan | 1866 | 0.2082357 |
| Queens | 1946 | 0.2171633 |
| Staten Island | 642 | 0.0716438 |
| Final Severity Level | Number | Percent |
|---|---|---|
| 1 | 0 | 0% |
| 2 | 0 | 0% |
| 3 | 8961 | 1 |
| 4 | 0 | 0% |
| 5 | 0 | 0% |
| 6 | 0 | 0% |
| 7 | 0 | 0% |
| 8 | 0 | 0% |
| Disposition | Number | Percent |
|---|---|---|
| Transporting Patient | 7482 | 0.8349515 |
| Refused Medical Aid | 1264 | 0.1410557 |
| Unfounded | 128 | 0.0142841 |
| Patient Gone on Arrival | 37 | 0.0041290 |
| Cancelled | 26 | 0.0029015 |
| Condition Corrected | 11 | 0.0012275 |
| Treated and Transported | 6 | 0.0006696 |
| Patient Pronounced Dead | 5 | 0.0005580 |
| Other | 2 | 0.0002232 |
Graphs, Heatmaps, and Tables Prepared By: Isaac H. Michaels, MPH
Data Source: NYC Open Data
Back to top
Reaction To Medication
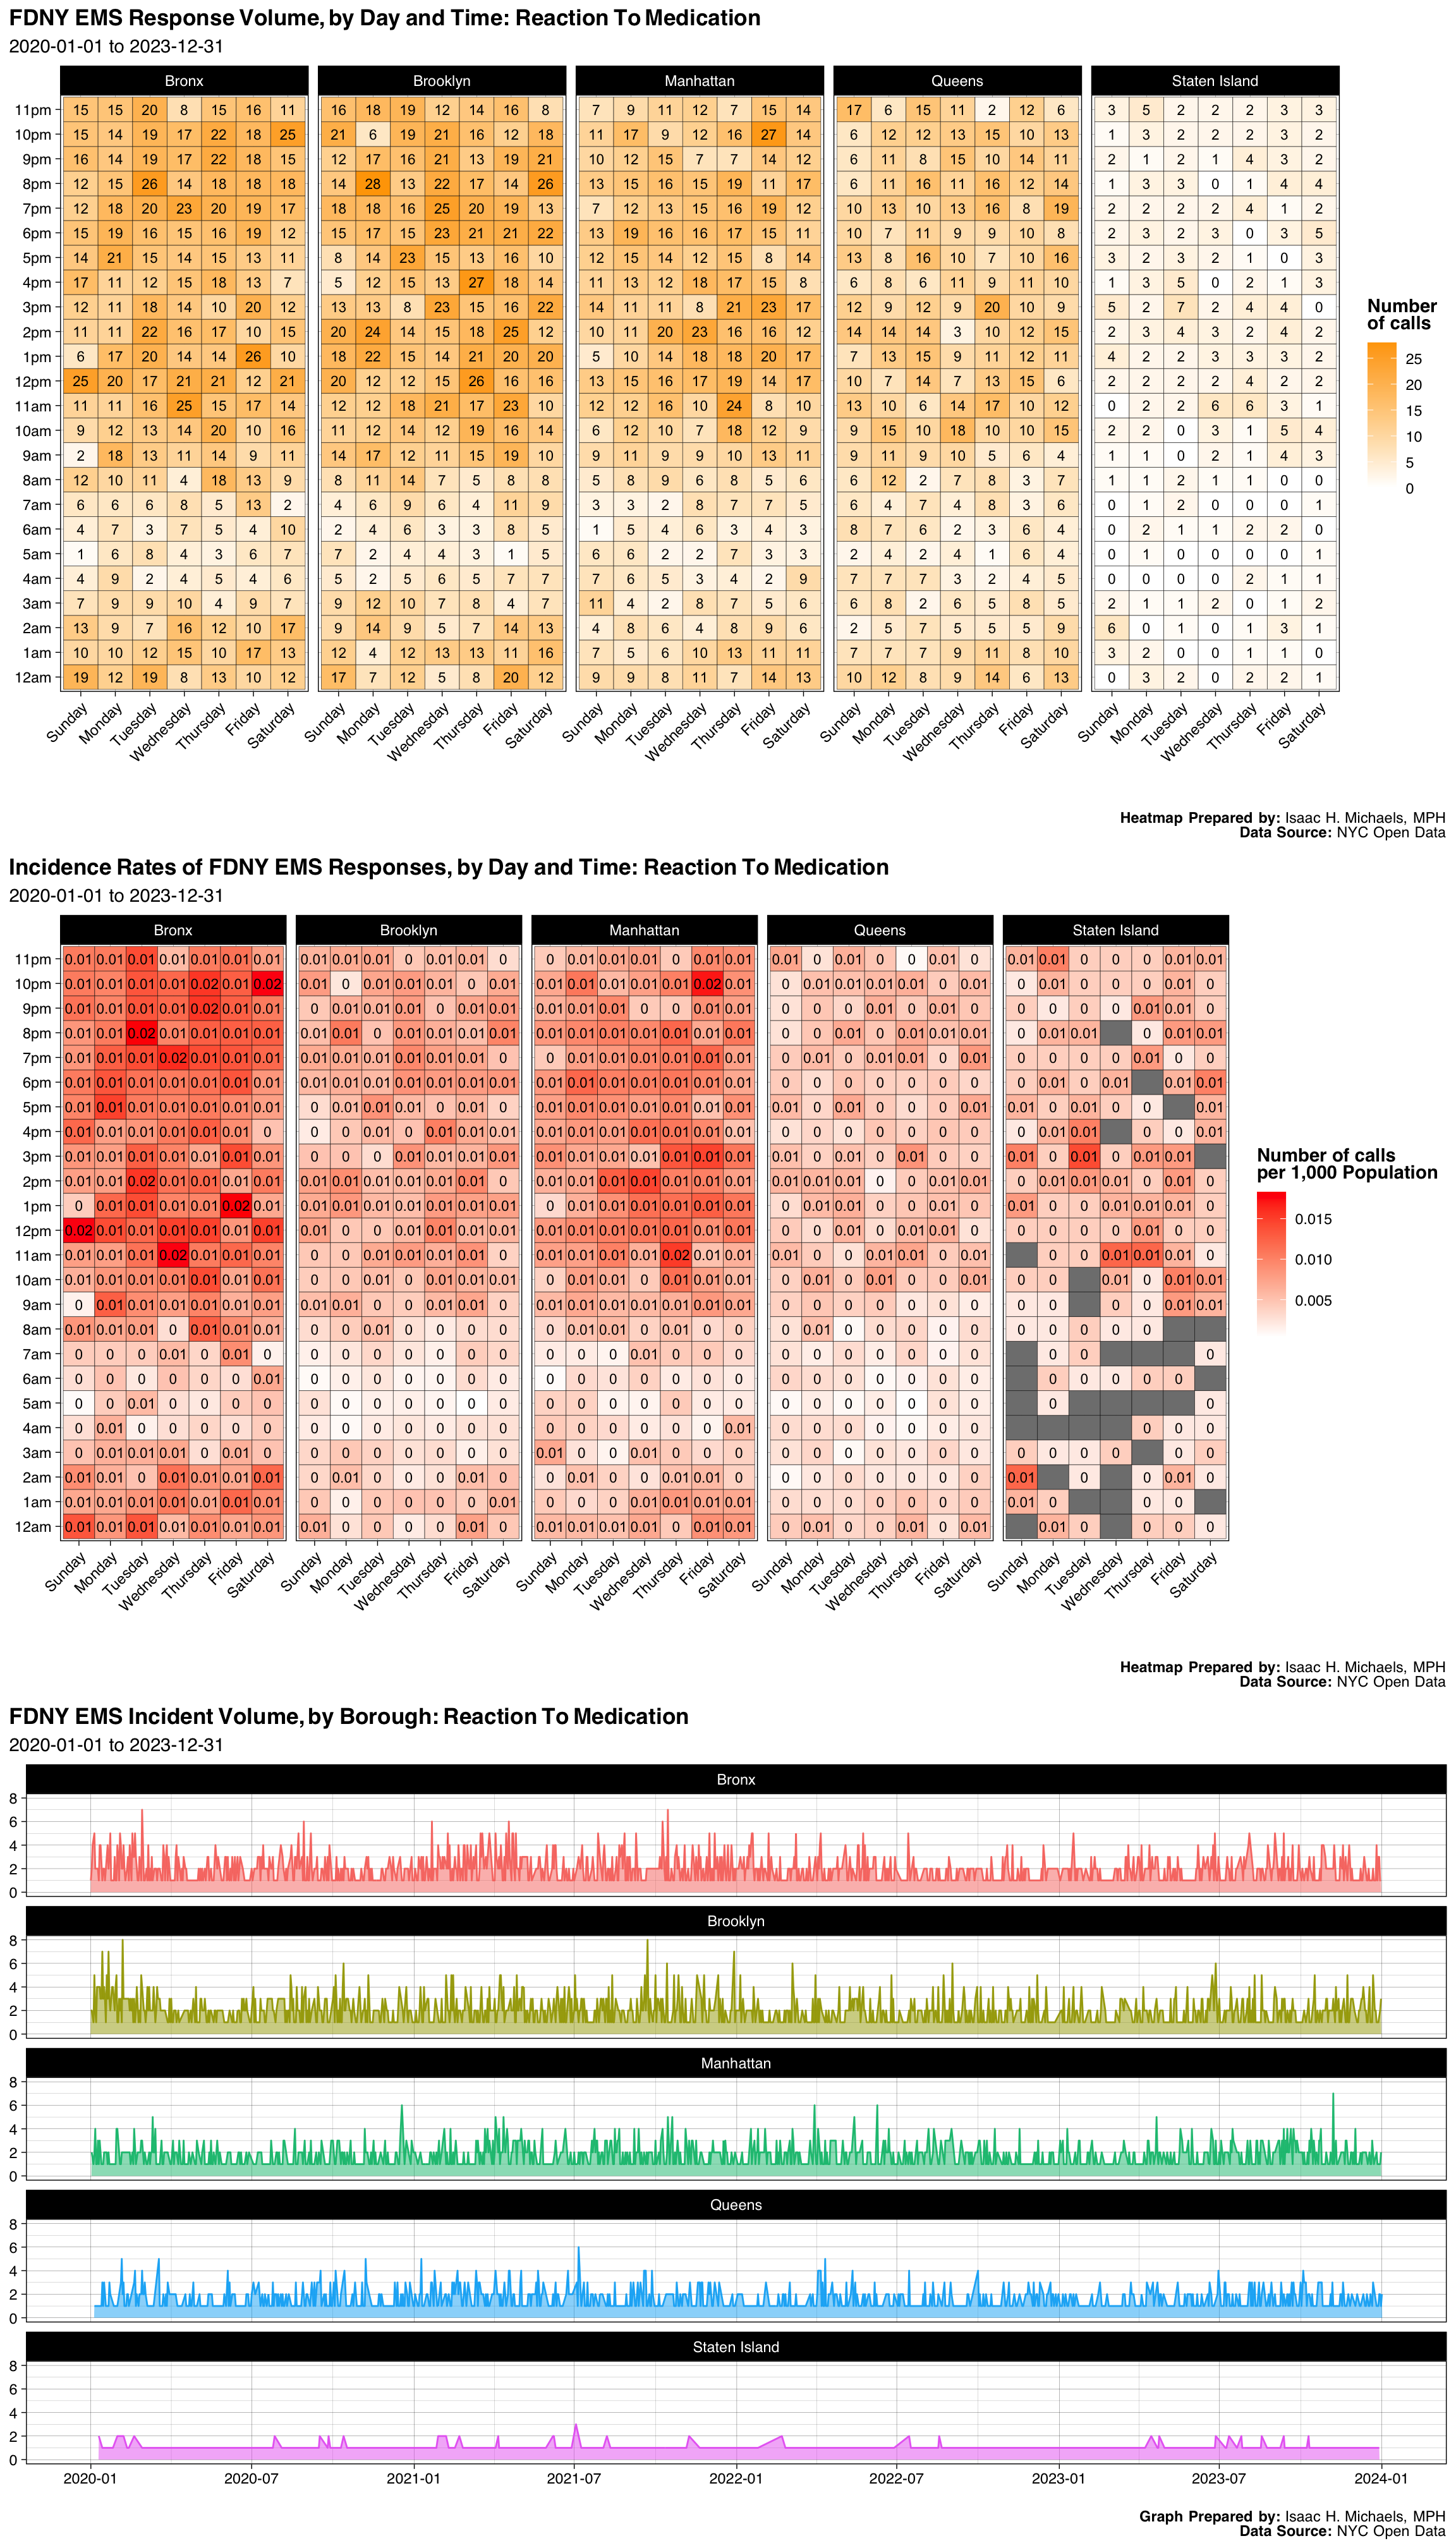
| Borough | Number | Percent |
|---|---|---|
| Bronx | 2184 | 0.2709677 |
| Brooklyn | 2223 | 0.2758065 |
| Manhattan | 1808 | 0.2243176 |
| Queens | 1527 | 0.1894541 |
| Staten Island | 318 | 0.0394541 |
| Final Severity Level | Number | Percent |
|---|---|---|
| 1 | 0 | 0% |
| 2 | 2 | 0.000248138957816377 |
| 3 | 3 | 0.000372208436724566 |
| 4 | 566 | 0.0702233250620347 |
| 5 | 7489 | 0.929156327543424 |
| 6 | 0 | 0% |
| 7 | 0 | 0% |
| 8 | 0 | 0% |
| Disposition | Number | Percent |
|---|---|---|
| Transporting Patient | 5693 | 0.7063275 |
| Refused Medical Aid | 1921 | 0.2383375 |
| Unfounded | 164 | 0.0203474 |
| Patient Gone on Arrival | 138 | 0.0171216 |
| Other | 67 | 0.0083127 |
| Cancelled | 55 | 0.0068238 |
| Condition Corrected | 18 | 0.0022333 |
| Treated and Transported | 2 | 0.0002481 |
| Triaged at Scene No Transport | 2 | 0.0002481 |
Graphs, Heatmaps, and Tables Prepared By: Isaac H. Michaels, MPH
Data Source: NYC Open Data
Back to top
Gyn/Severe Pain/Bleeding
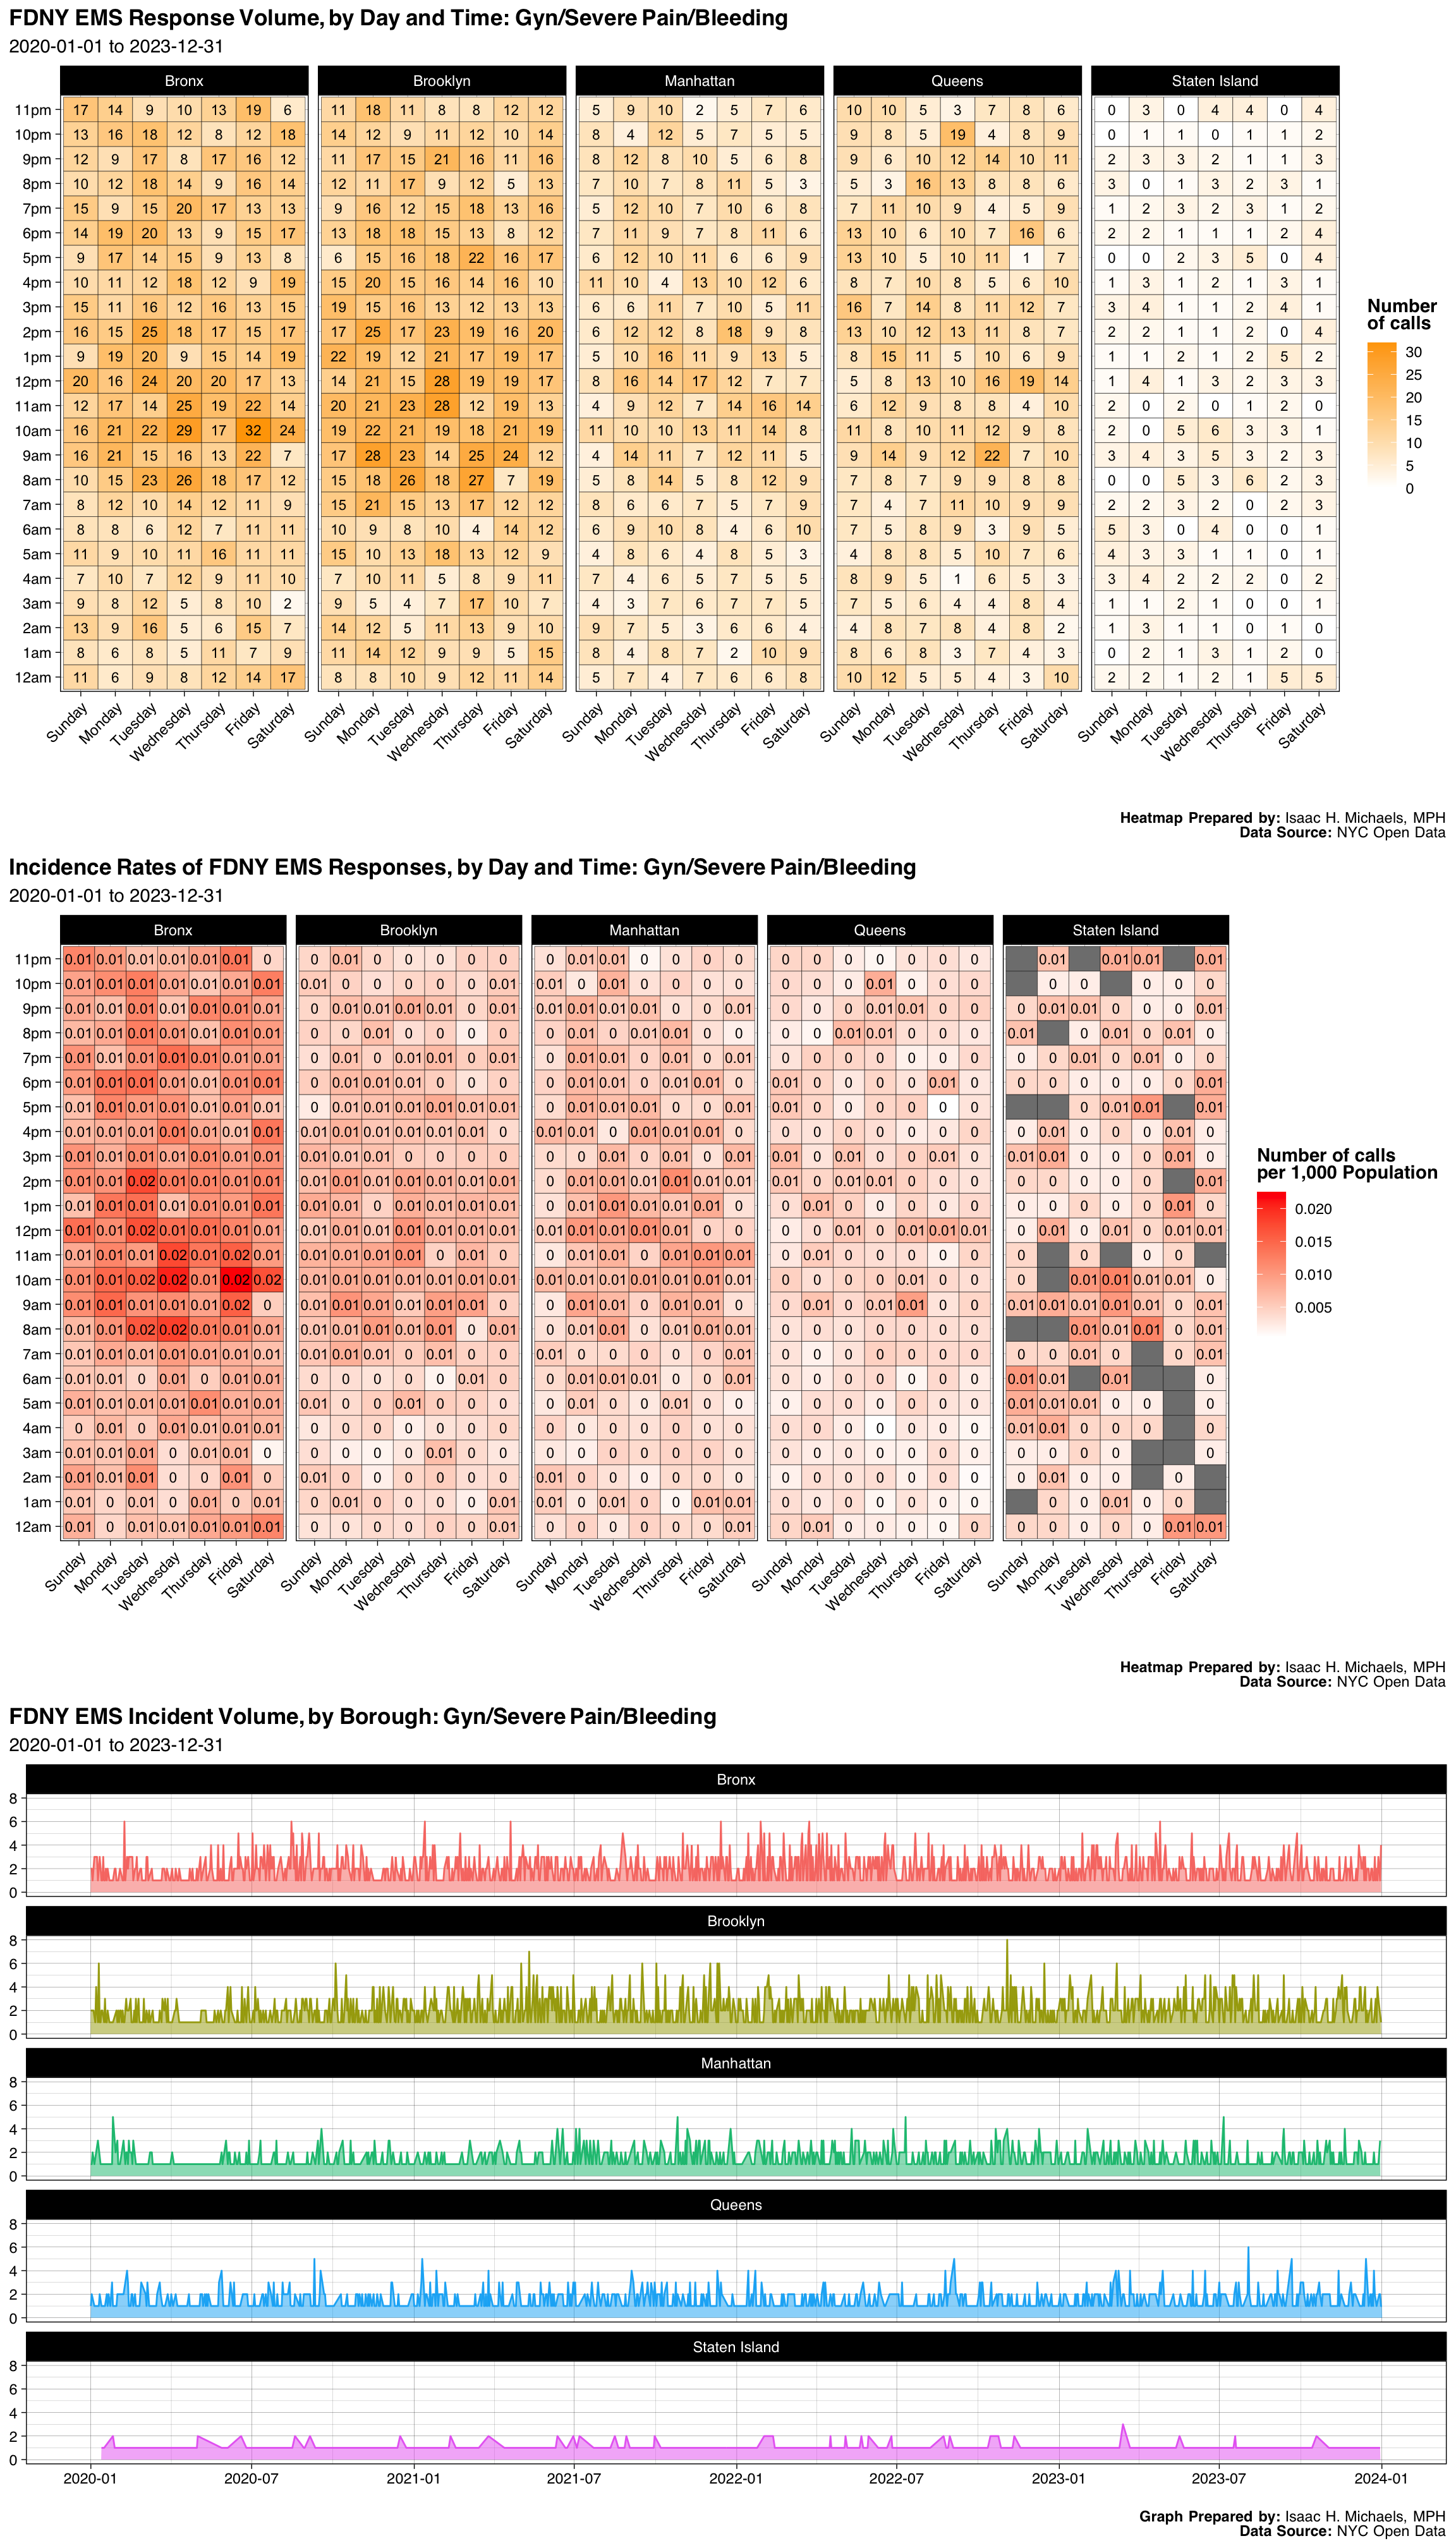
| Borough | Number | Percent |
|---|---|---|
| Bronx | 2265 | 0.2926735 |
| Brooklyn | 2409 | 0.3112805 |
| Manhattan | 1346 | 0.1739243 |
| Queens | 1394 | 0.1801266 |
| Staten Island | 325 | 0.0419951 |
| Final Severity Level | Number | Percent |
|---|---|---|
| 1 | 0 | 0% |
| 2 | 0 | 0% |
| 3 | 7739 | 1 |
| 4 | 0 | 0% |
| 5 | 0 | 0% |
| 6 | 0 | 0% |
| 7 | 0 | 0% |
| 8 | 0 | 0% |
| Disposition | Number | Percent |
|---|---|---|
| Transporting Patient | 6953 | 0.8984365 |
| Refused Medical Aid | 565 | 0.0730068 |
| Unfounded | 118 | 0.0152474 |
| Patient Gone on Arrival | 49 | 0.0063316 |
| Cancelled | 37 | 0.0047810 |
| Condition Corrected | 9 | 0.0011629 |
| Other | 5 | 0.0006461 |
| Treated and Transported | 3 | 0.0003876 |
Graphs, Heatmaps, and Tables Prepared By: Isaac H. Michaels, MPH
Data Source: NYC Open Data
Back to top
One Alarm Fire
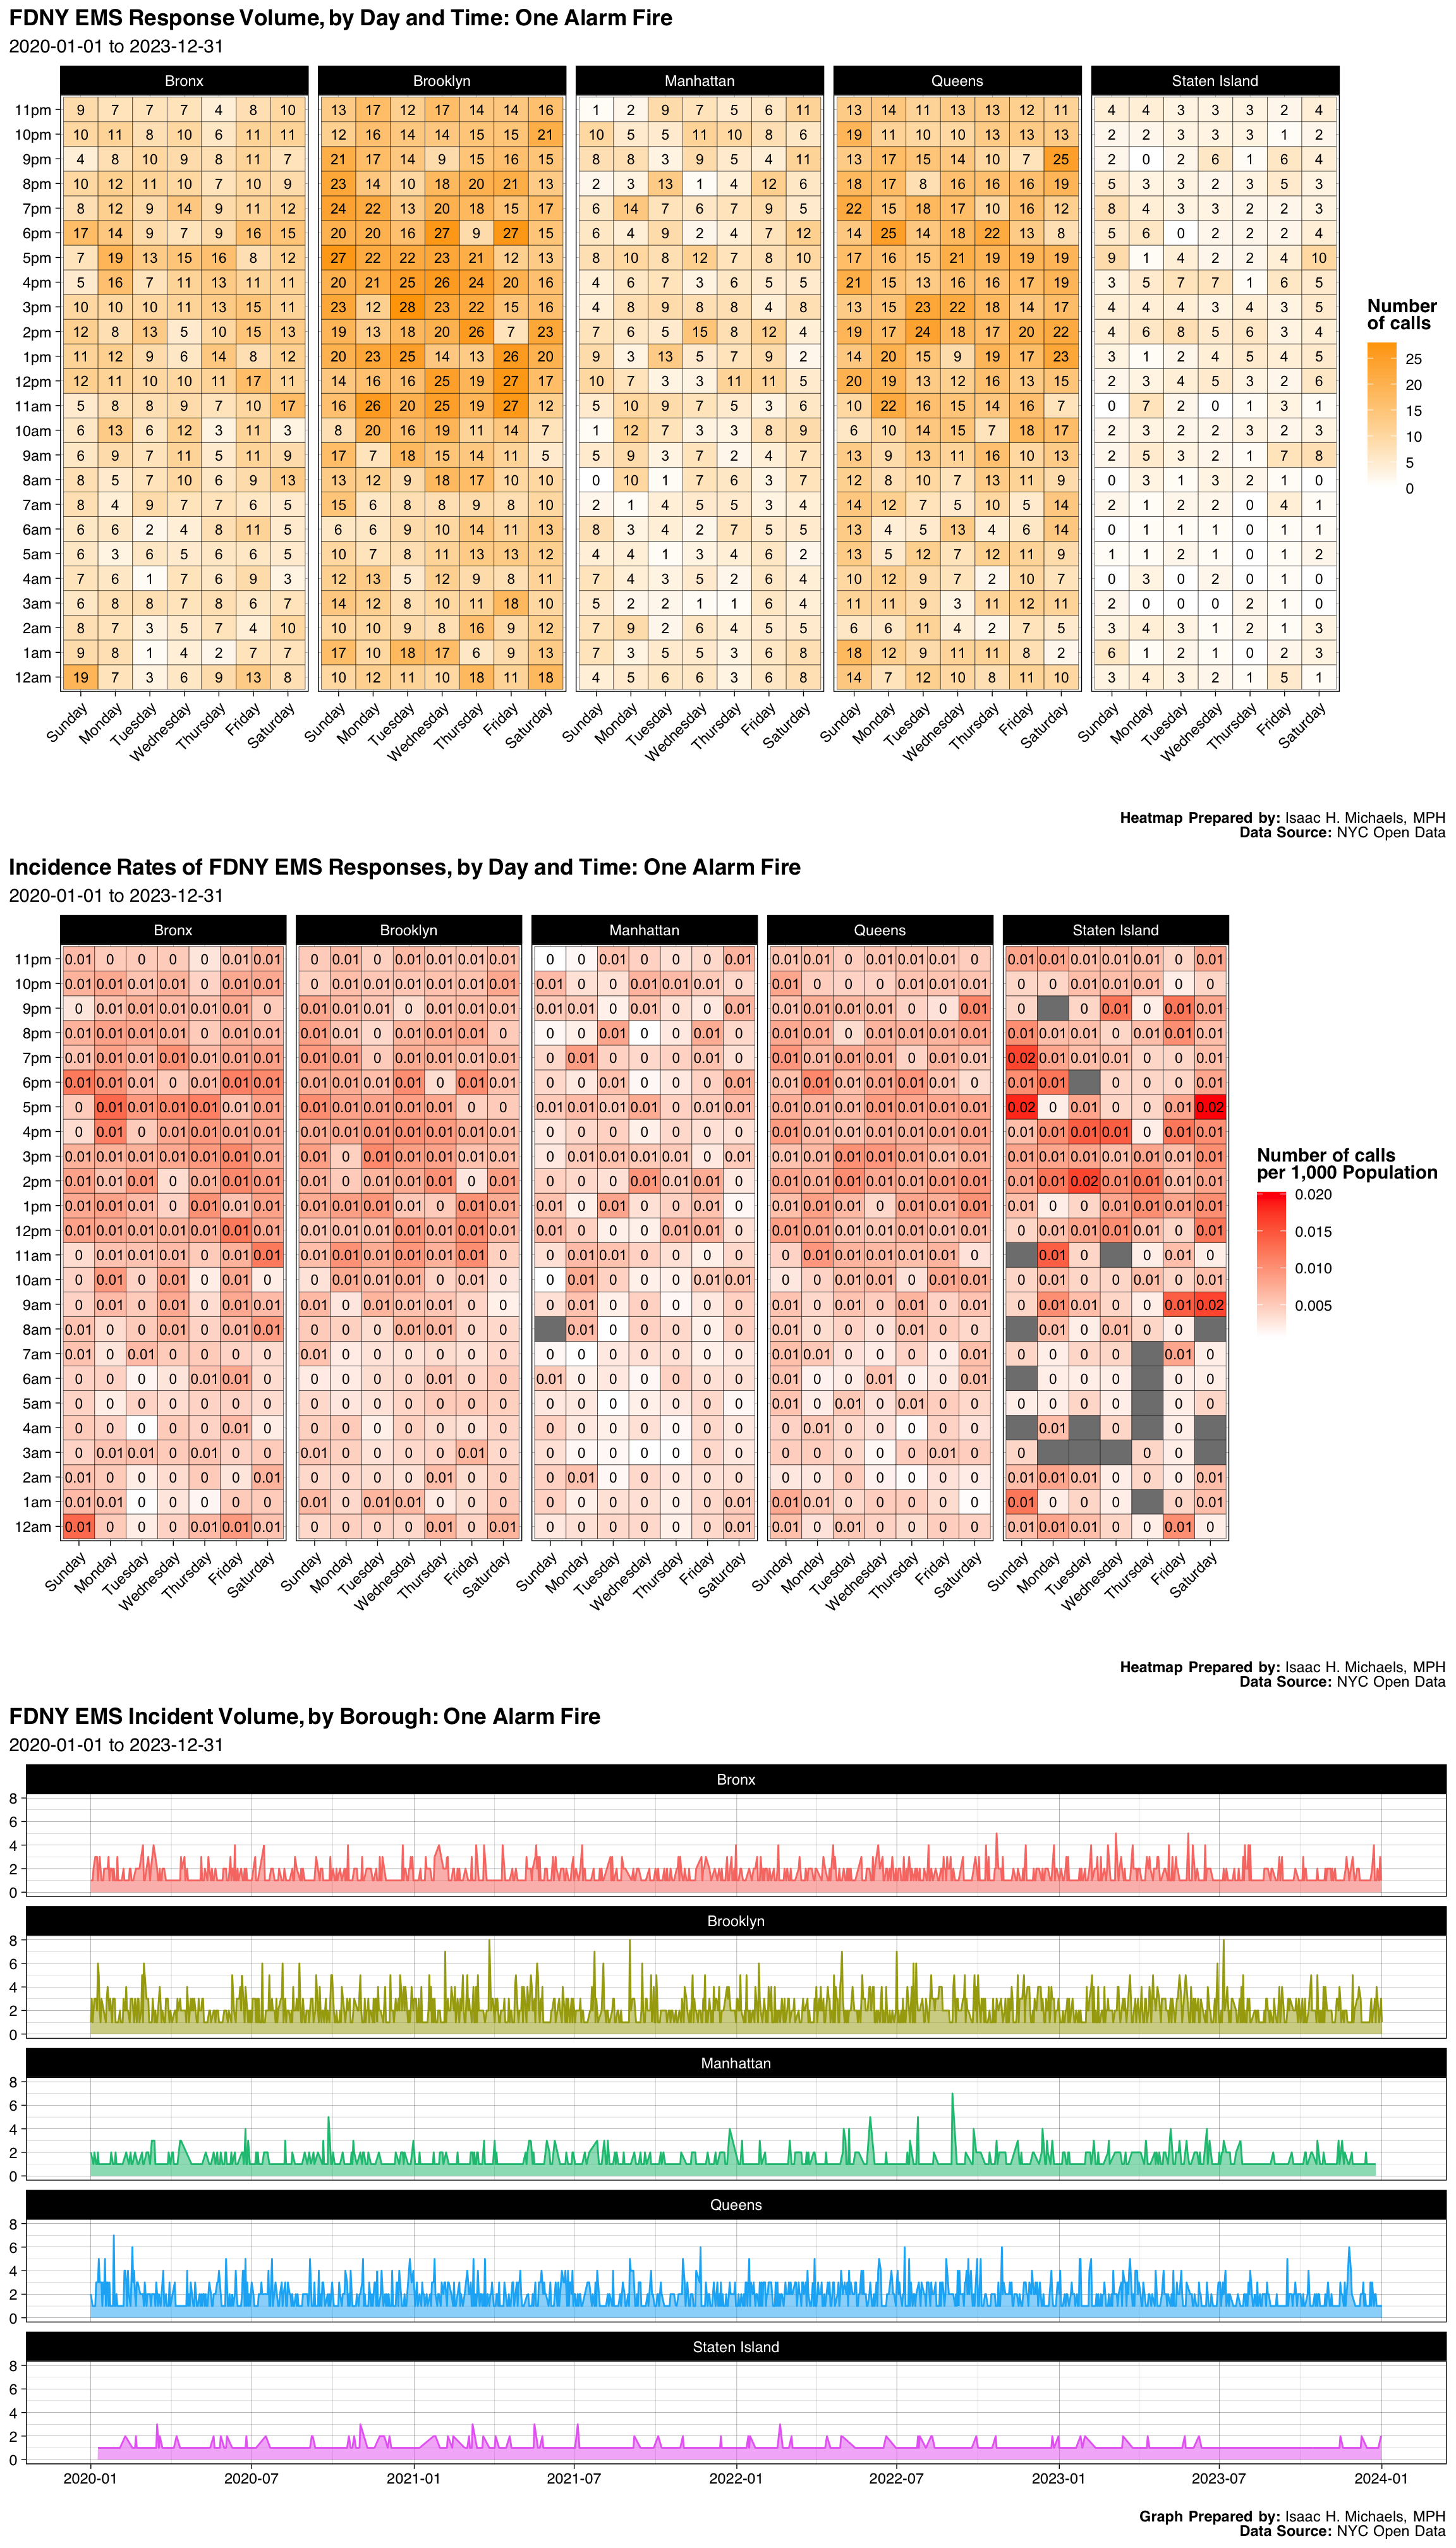
| Borough | Number | Percent |
|---|---|---|
| Bronx | 1476 | 0.1922626 |
| Brooklyn | 2561 | 0.3335939 |
| Manhattan | 992 | 0.1292171 |
| Queens | 2184 | 0.2844861 |
| Staten Island | 464 | 0.0604403 |
| Final Severity Level | Number | Percent |
|---|---|---|
| 1 | 0 | 0% |
| 2 | 7677 | 1 |
| 3 | 0 | 0% |
| 4 | 0 | 0% |
| 5 | 0 | 0% |
| 6 | 0 | 0% |
| 7 | 0 | 0% |
| 8 | 0 | 0% |
| Disposition | Number | Percent |
|---|---|---|
| Cancelled | 2636 | 0.3433633 |
| Condition Corrected | 2625 | 0.3419304 |
| Transporting Patient | 1776 | 0.2313404 |
| Other | 311 | 0.0405106 |
| Refused Medical Aid | 212 | 0.0276150 |
| Unfounded | 108 | 0.0140680 |
| Patient Pronounced Dead | 5 | 0.0006513 |
| Treated Not Transported | 2 | 0.0002605 |
| Patient Gone on Arrival | 1 | 0.0001303 |
| Treated and Transported | 1 | 0.0001303 |
Graphs, Heatmaps, and Tables Prepared By: Isaac H. Michaels, MPH
Data Source: NYC Open Data
Back to top
Choking
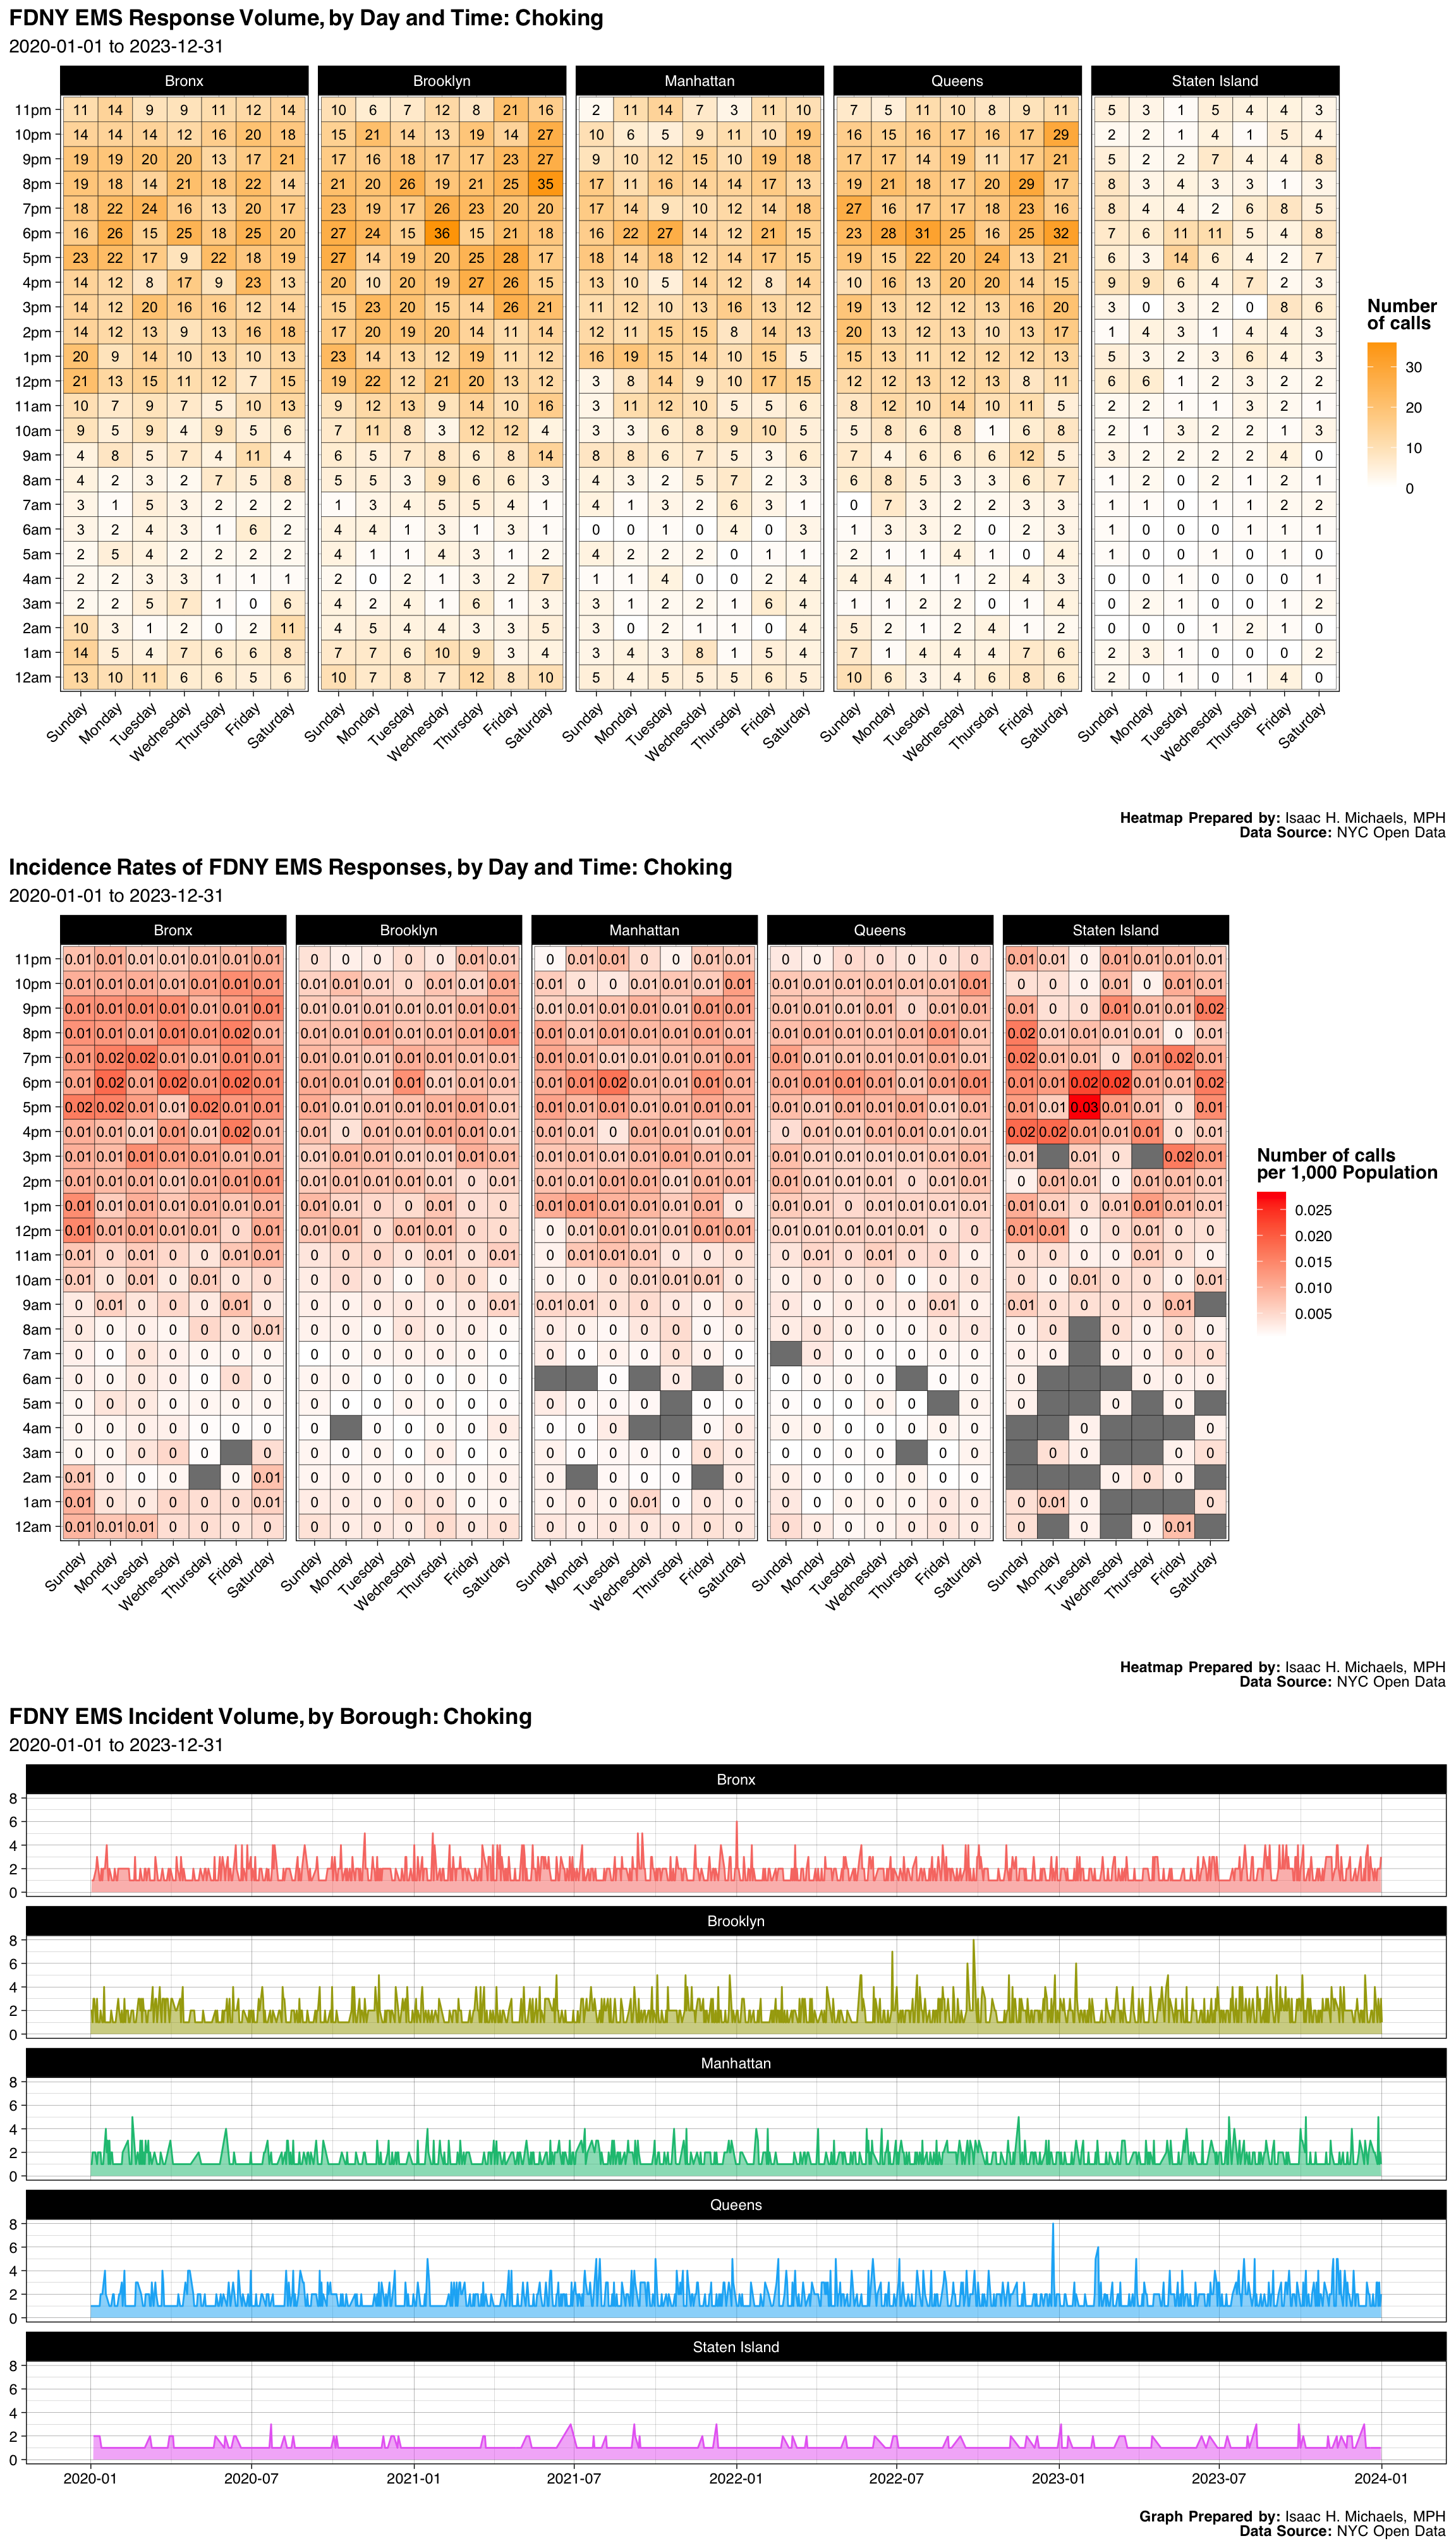
| Borough | Number | Percent |
|---|---|---|
| Bronx | 1738 | 0.2366880 |
| Brooklyn | 2029 | 0.2763176 |
| Manhattan | 1383 | 0.1883426 |
| Queens | 1738 | 0.2366880 |
| Staten Island | 455 | 0.0619638 |
| Final Severity Level | Number | Percent |
|---|---|---|
| 1 | 7336 | 0.99904671115348 |
| 2 | 1 | 0.000136184120931499 |
| 3 | 0 | 0% |
| 4 | 6 | 0.000817104725588996 |
| 5 | 0 | 0% |
| 6 | 0 | 0% |
| 7 | 0 | 0% |
| 8 | 0 | 0% |
| Disposition | Number | Percent |
|---|---|---|
| Transporting Patient | 4866 | 0.6626719 |
| Refused Medical Aid | 1839 | 0.2504426 |
| Unfounded | 319 | 0.0434427 |
| Patient Gone on Arrival | 144 | 0.0196105 |
| Cancelled | 122 | 0.0166145 |
| Patient Pronounced Dead | 16 | 0.0021789 |
| Condition Corrected | 14 | 0.0019066 |
| Treated and Transported | 11 | 0.0014980 |
| Other | 11 | 0.0014980 |
| Triaged at Scene No Transport | 1 | 0.0001362 |
Graphs, Heatmaps, and Tables Prepared By: Isaac H. Michaels, MPH
Data Source: NYC Open Data
Back to top
Inhalation Of Smoke
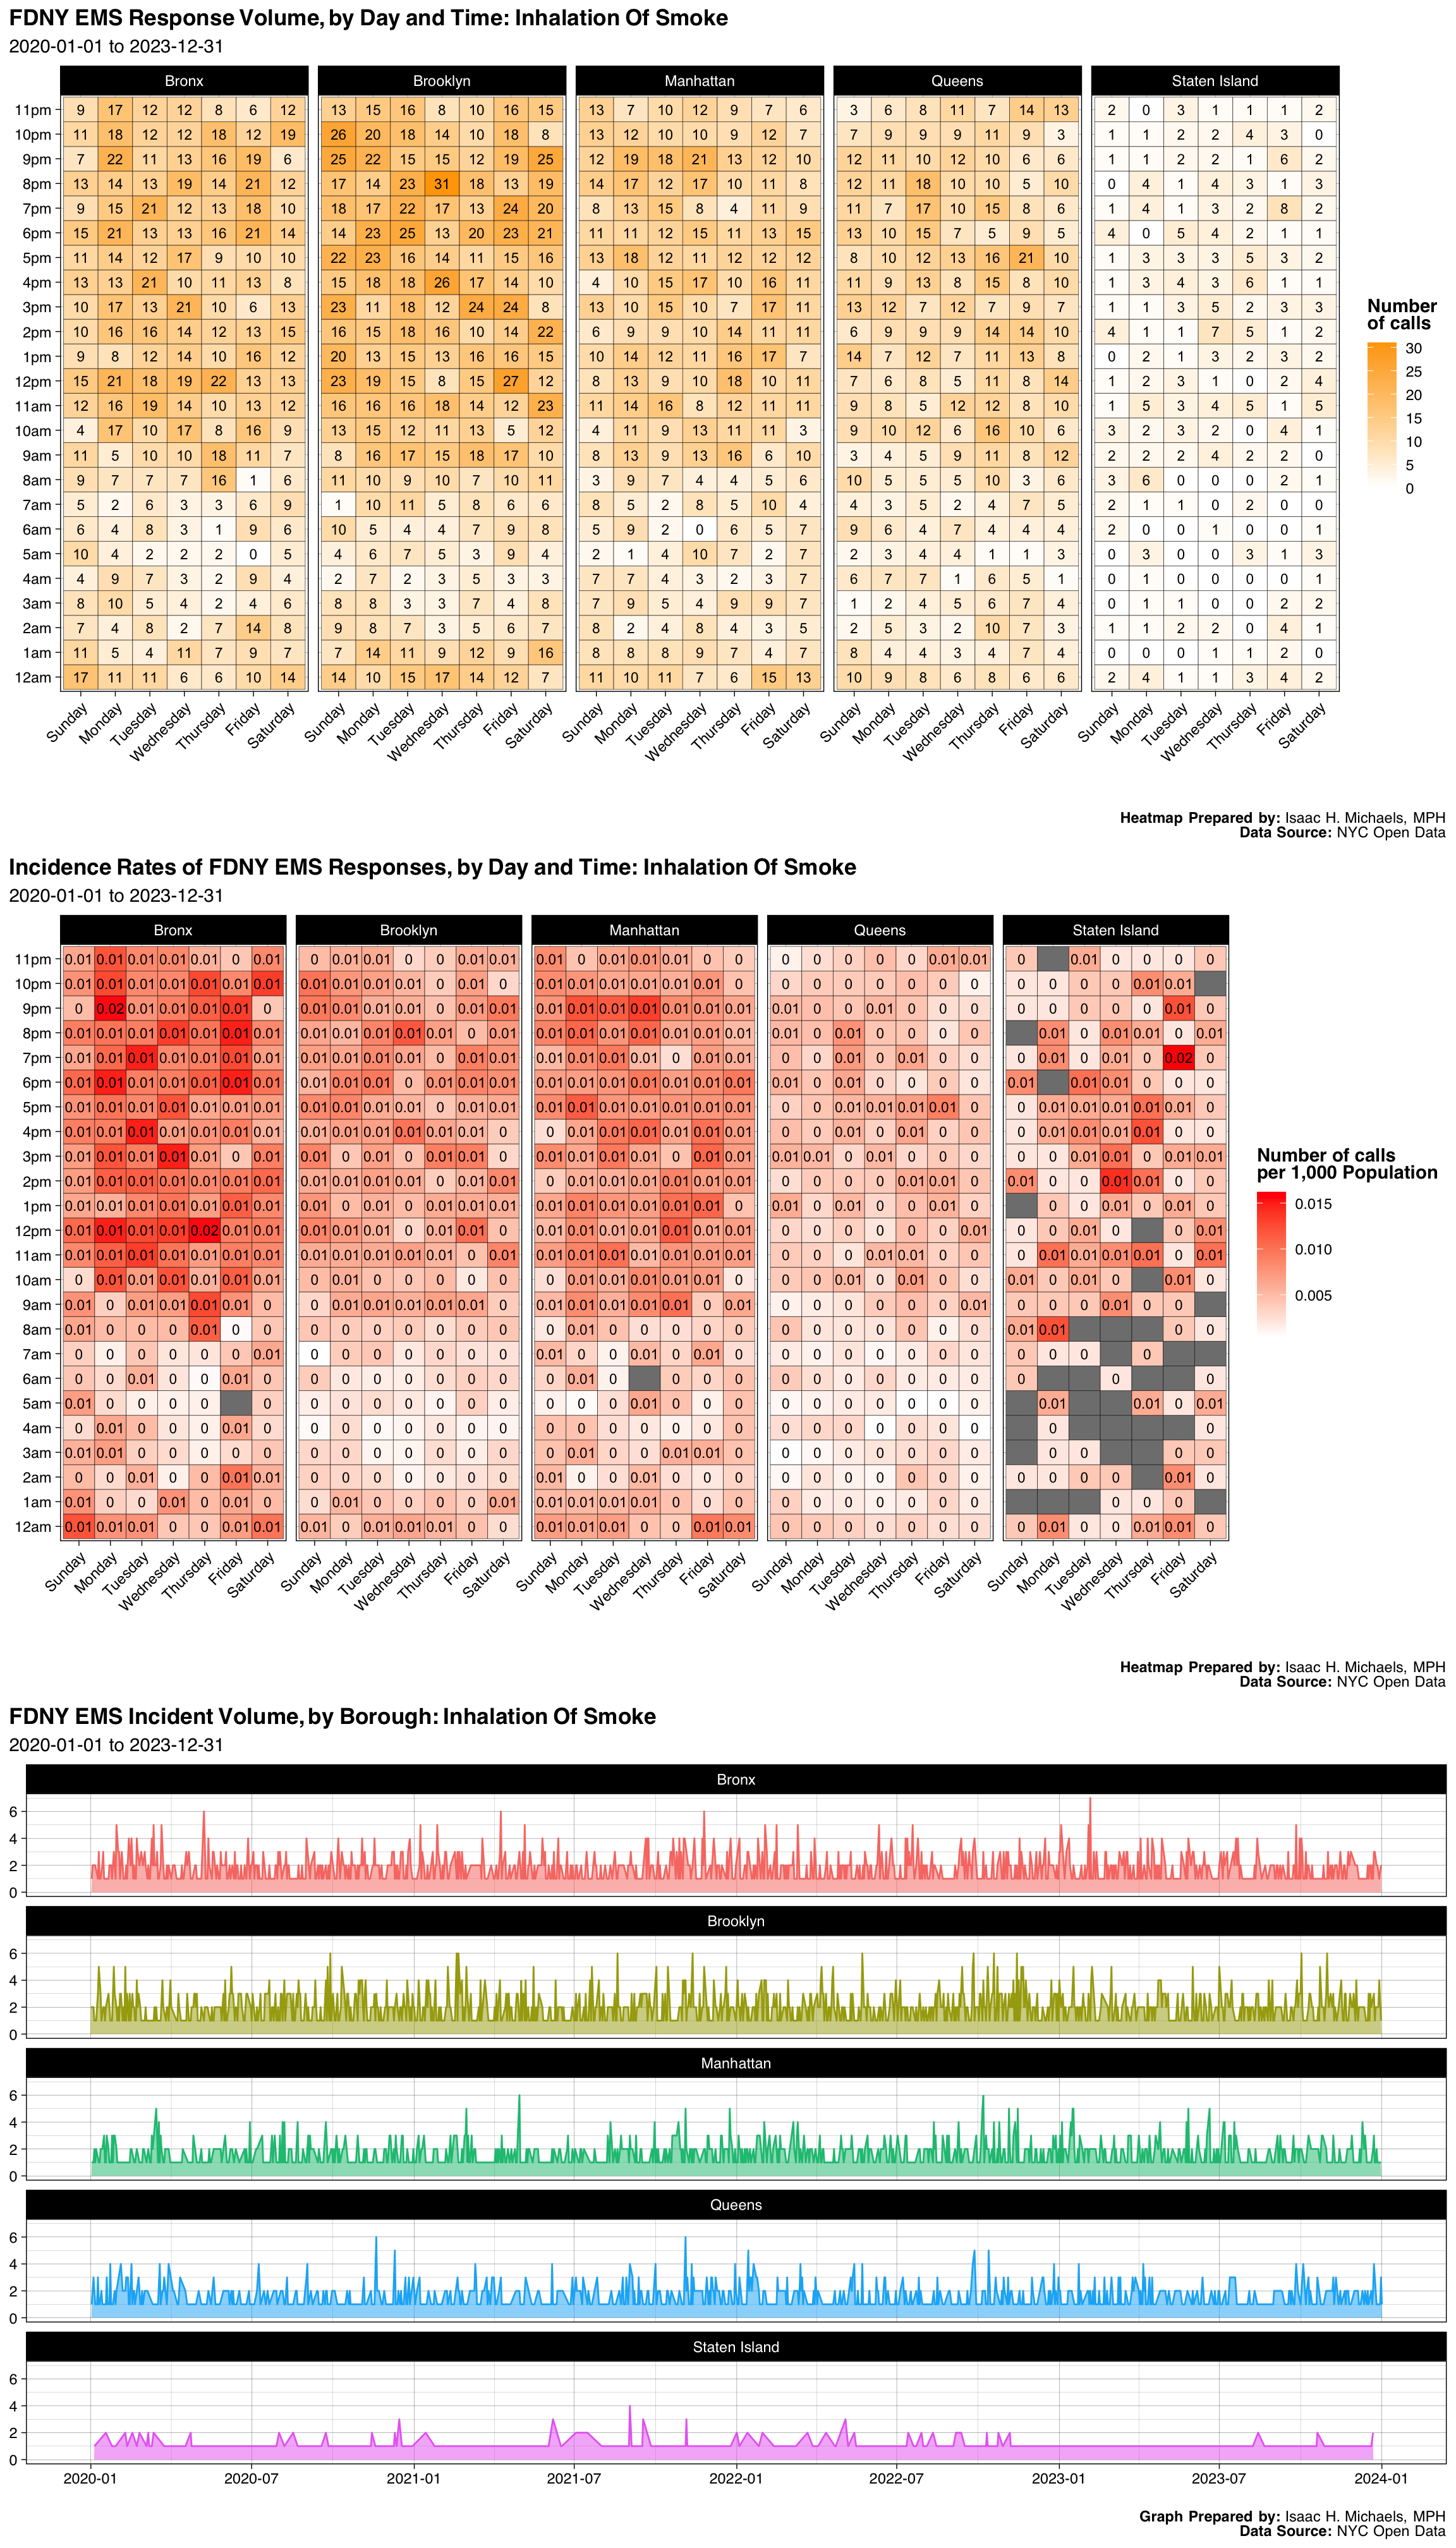
| Borough | Number | Percent |
|---|---|---|
| Bronx | 1803 | 0.2485868 |
| Brooklyn | 2213 | 0.3051151 |
| Manhattan | 1587 | 0.2188060 |
| Queens | 1329 | 0.1832345 |
| Staten Island | 321 | 0.0442575 |
| Final Severity Level | Number | Percent |
|---|---|---|
| 1 | 0 | 0% |
| 2 | 2 | 0.000275747966358748 |
| 3 | 6 | 0.000827243899076244 |
| 4 | 74 | 0.0102026747552737 |
| 5 | 7171 | 0.988694333379291 |
| 6 | 0 | 0% |
| 7 | 0 | 0% |
| 8 | 0 | 0% |
| Disposition | Number | Percent |
|---|---|---|
| Refused Medical Aid | 2663 | 0.3671584 |
| Unfounded | 1699 | 0.2342479 |
| Transporting Patient | 1419 | 0.1956432 |
| Condition Corrected | 985 | 0.1358059 |
| Cancelled | 280 | 0.0386047 |
| Patient Gone on Arrival | 119 | 0.0164070 |
| Other | 66 | 0.0090997 |
| Patient Pronounced Dead | 14 | 0.0019302 |
| Treated and Transported | 4 | 0.0005515 |
| Treated Not Transported | 2 | 0.0002757 |
| Triaged at Scene No Transport | 2 | 0.0002757 |
Graphs, Heatmaps, and Tables Prepared By: Isaac H. Michaels, MPH
Data Source: NYC Open Data
Back to top
Unc Patient - Fever & Cough
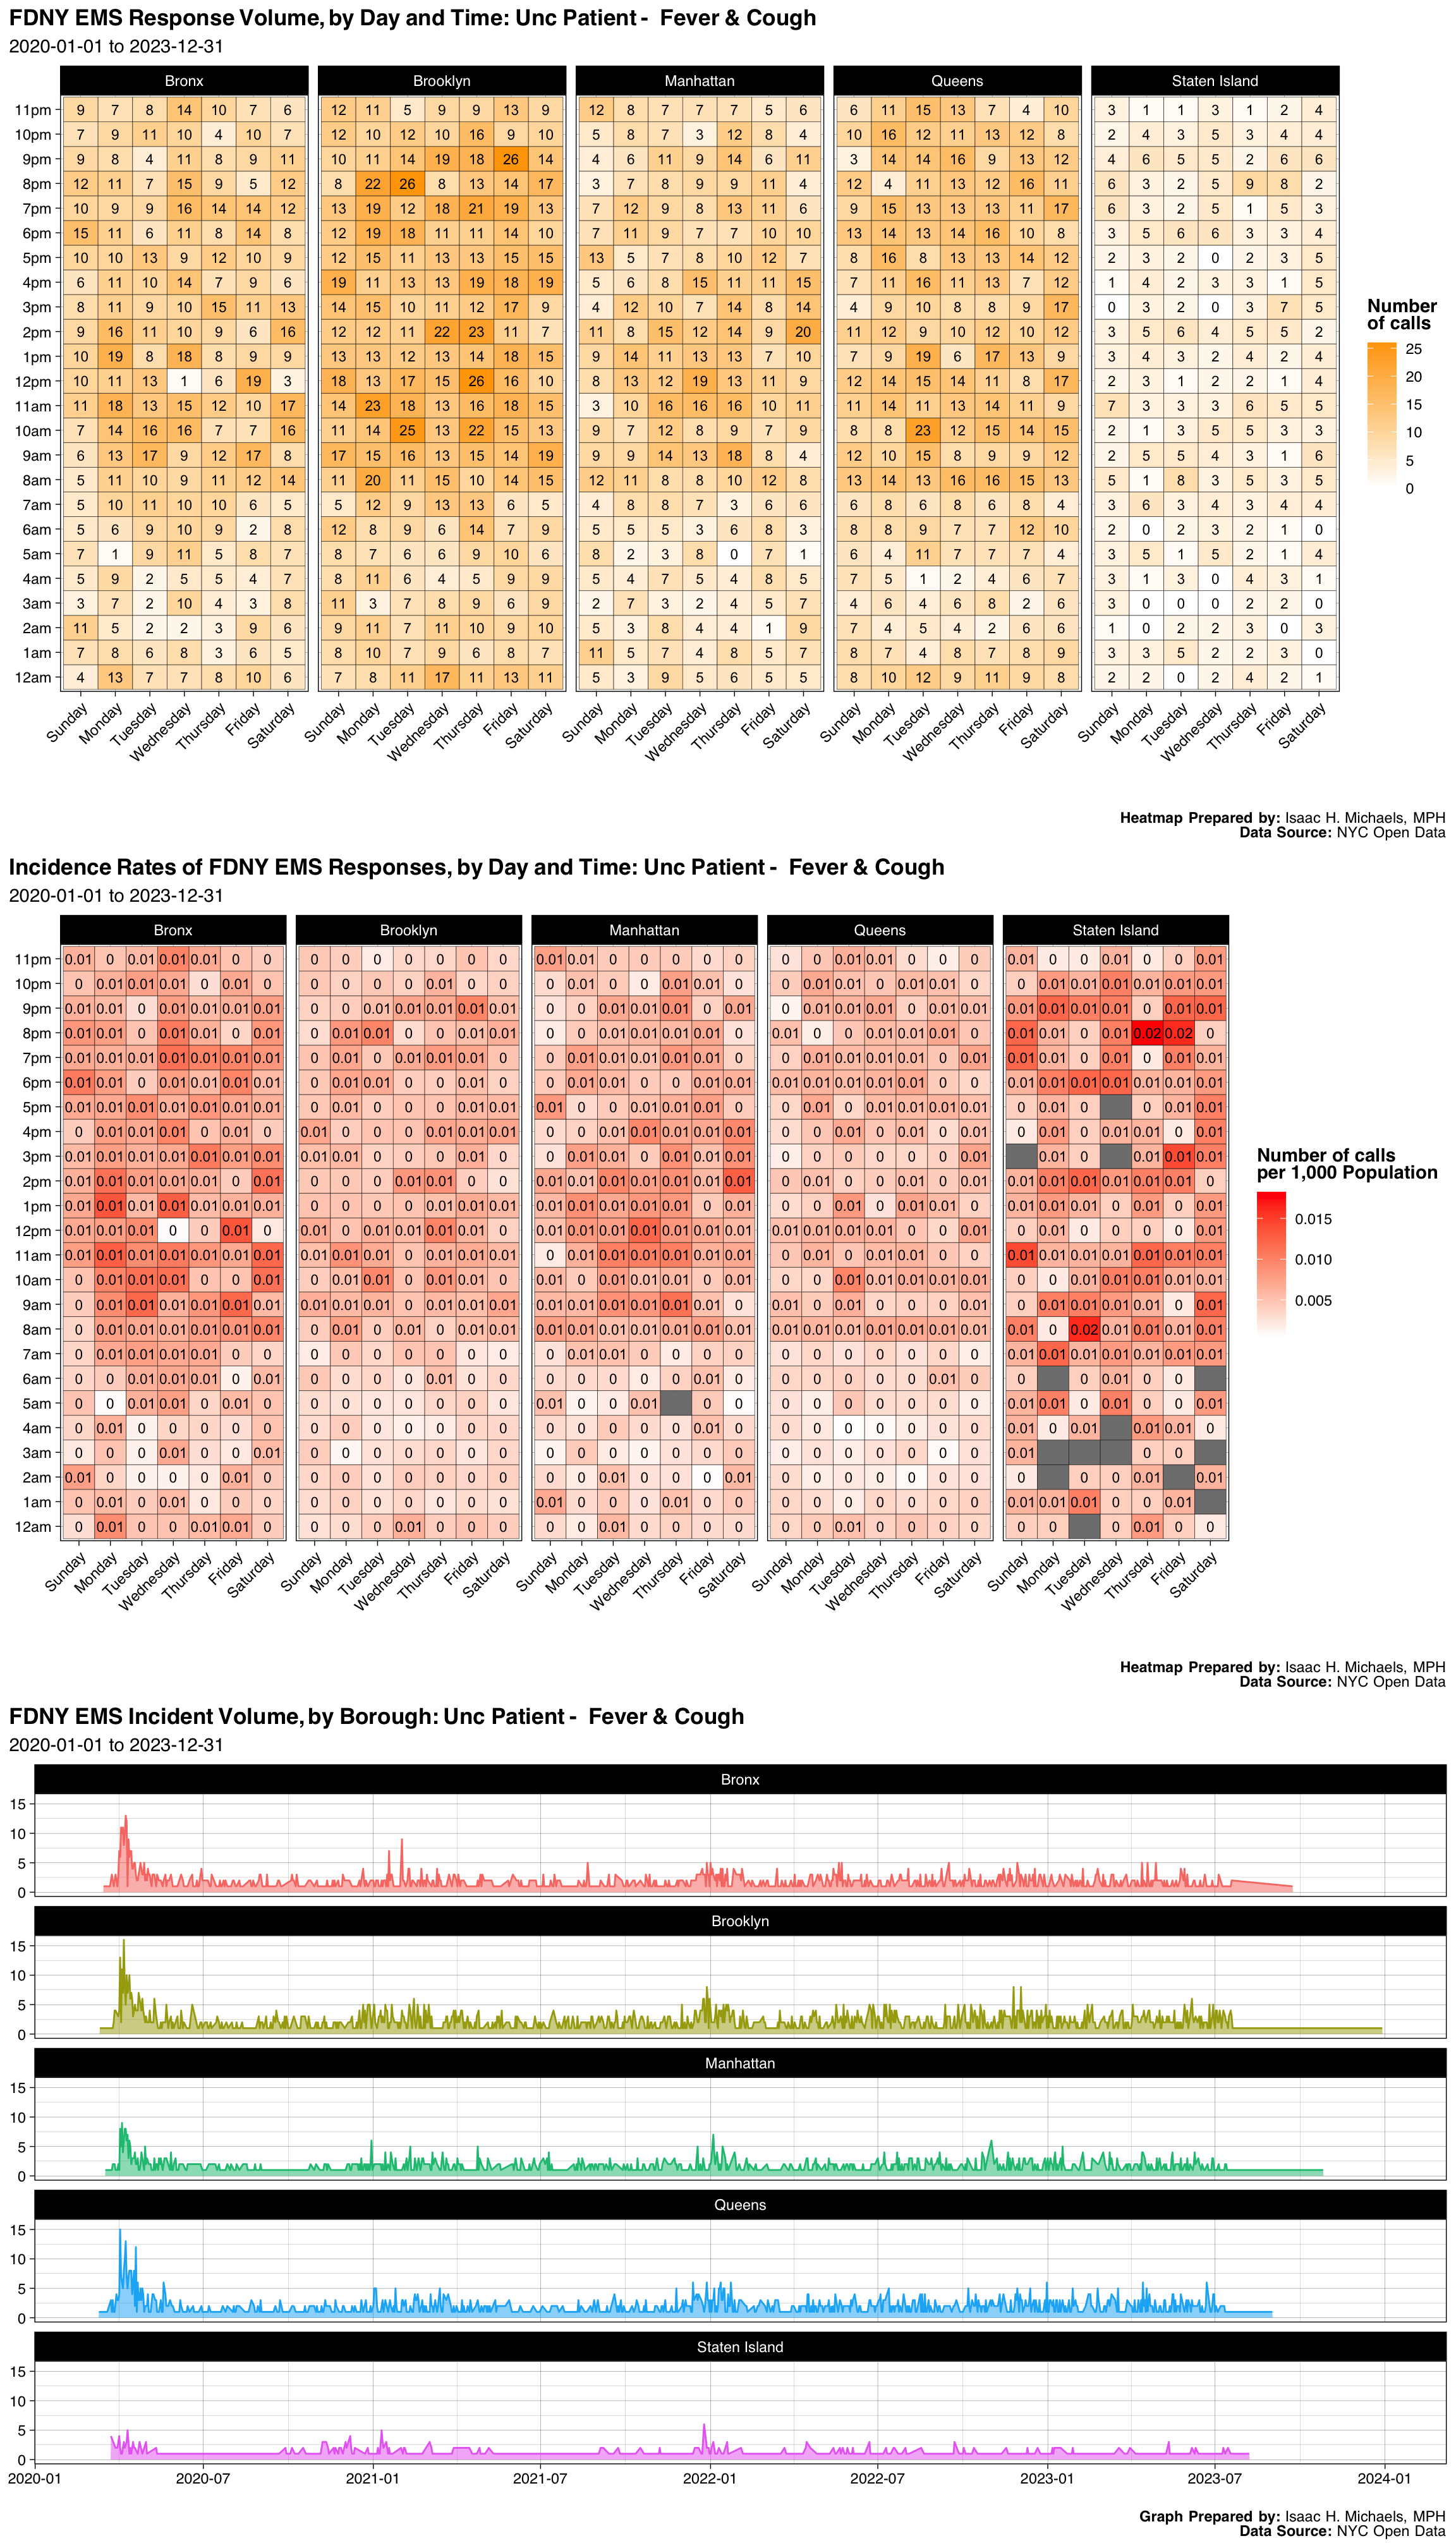
| Borough | Number | Percent |
|---|---|---|
| Bronx | 1538 | 0.2131375 |
| Brooklyn | 2102 | 0.2912971 |
| Manhattan | 1371 | 0.1899945 |
| Queens | 1686 | 0.2336475 |
| Staten Island | 519 | 0.0719235 |
| Final Severity Level | Number | Percent |
|---|---|---|
| 1 | 3 | 0.000415742793791574 |
| 2 | 7213 | 0.999584257206208 |
| 3 | 0 | 0% |
| 4 | 0 | 0% |
| 5 | 0 | 0% |
| 6 | 0 | 0% |
| 7 | 0 | 0% |
| 8 | 0 | 0% |
| Disposition | Number | Percent |
|---|---|---|
| Transporting Patient | 5897 | 0.8172118 |
| Refused Medical Aid | 880 | 0.1219512 |
| Unfounded | 210 | 0.0291020 |
| Patient Pronounced Dead | 99 | 0.0137195 |
| Patient Gone on Arrival | 73 | 0.0101164 |
| Cancelled | 37 | 0.0051275 |
| Condition Corrected | 10 | 0.0013858 |
| Treated and Transported | 7 | 0.0009701 |
| Triaged at Scene No Transport | 2 | 0.0002772 |
| Other | 1 | 0.0001386 |
Graphs, Heatmaps, and Tables Prepared By: Isaac H. Michaels, MPH
Data Source: NYC Open Data
Back to top
Obstetric Complications
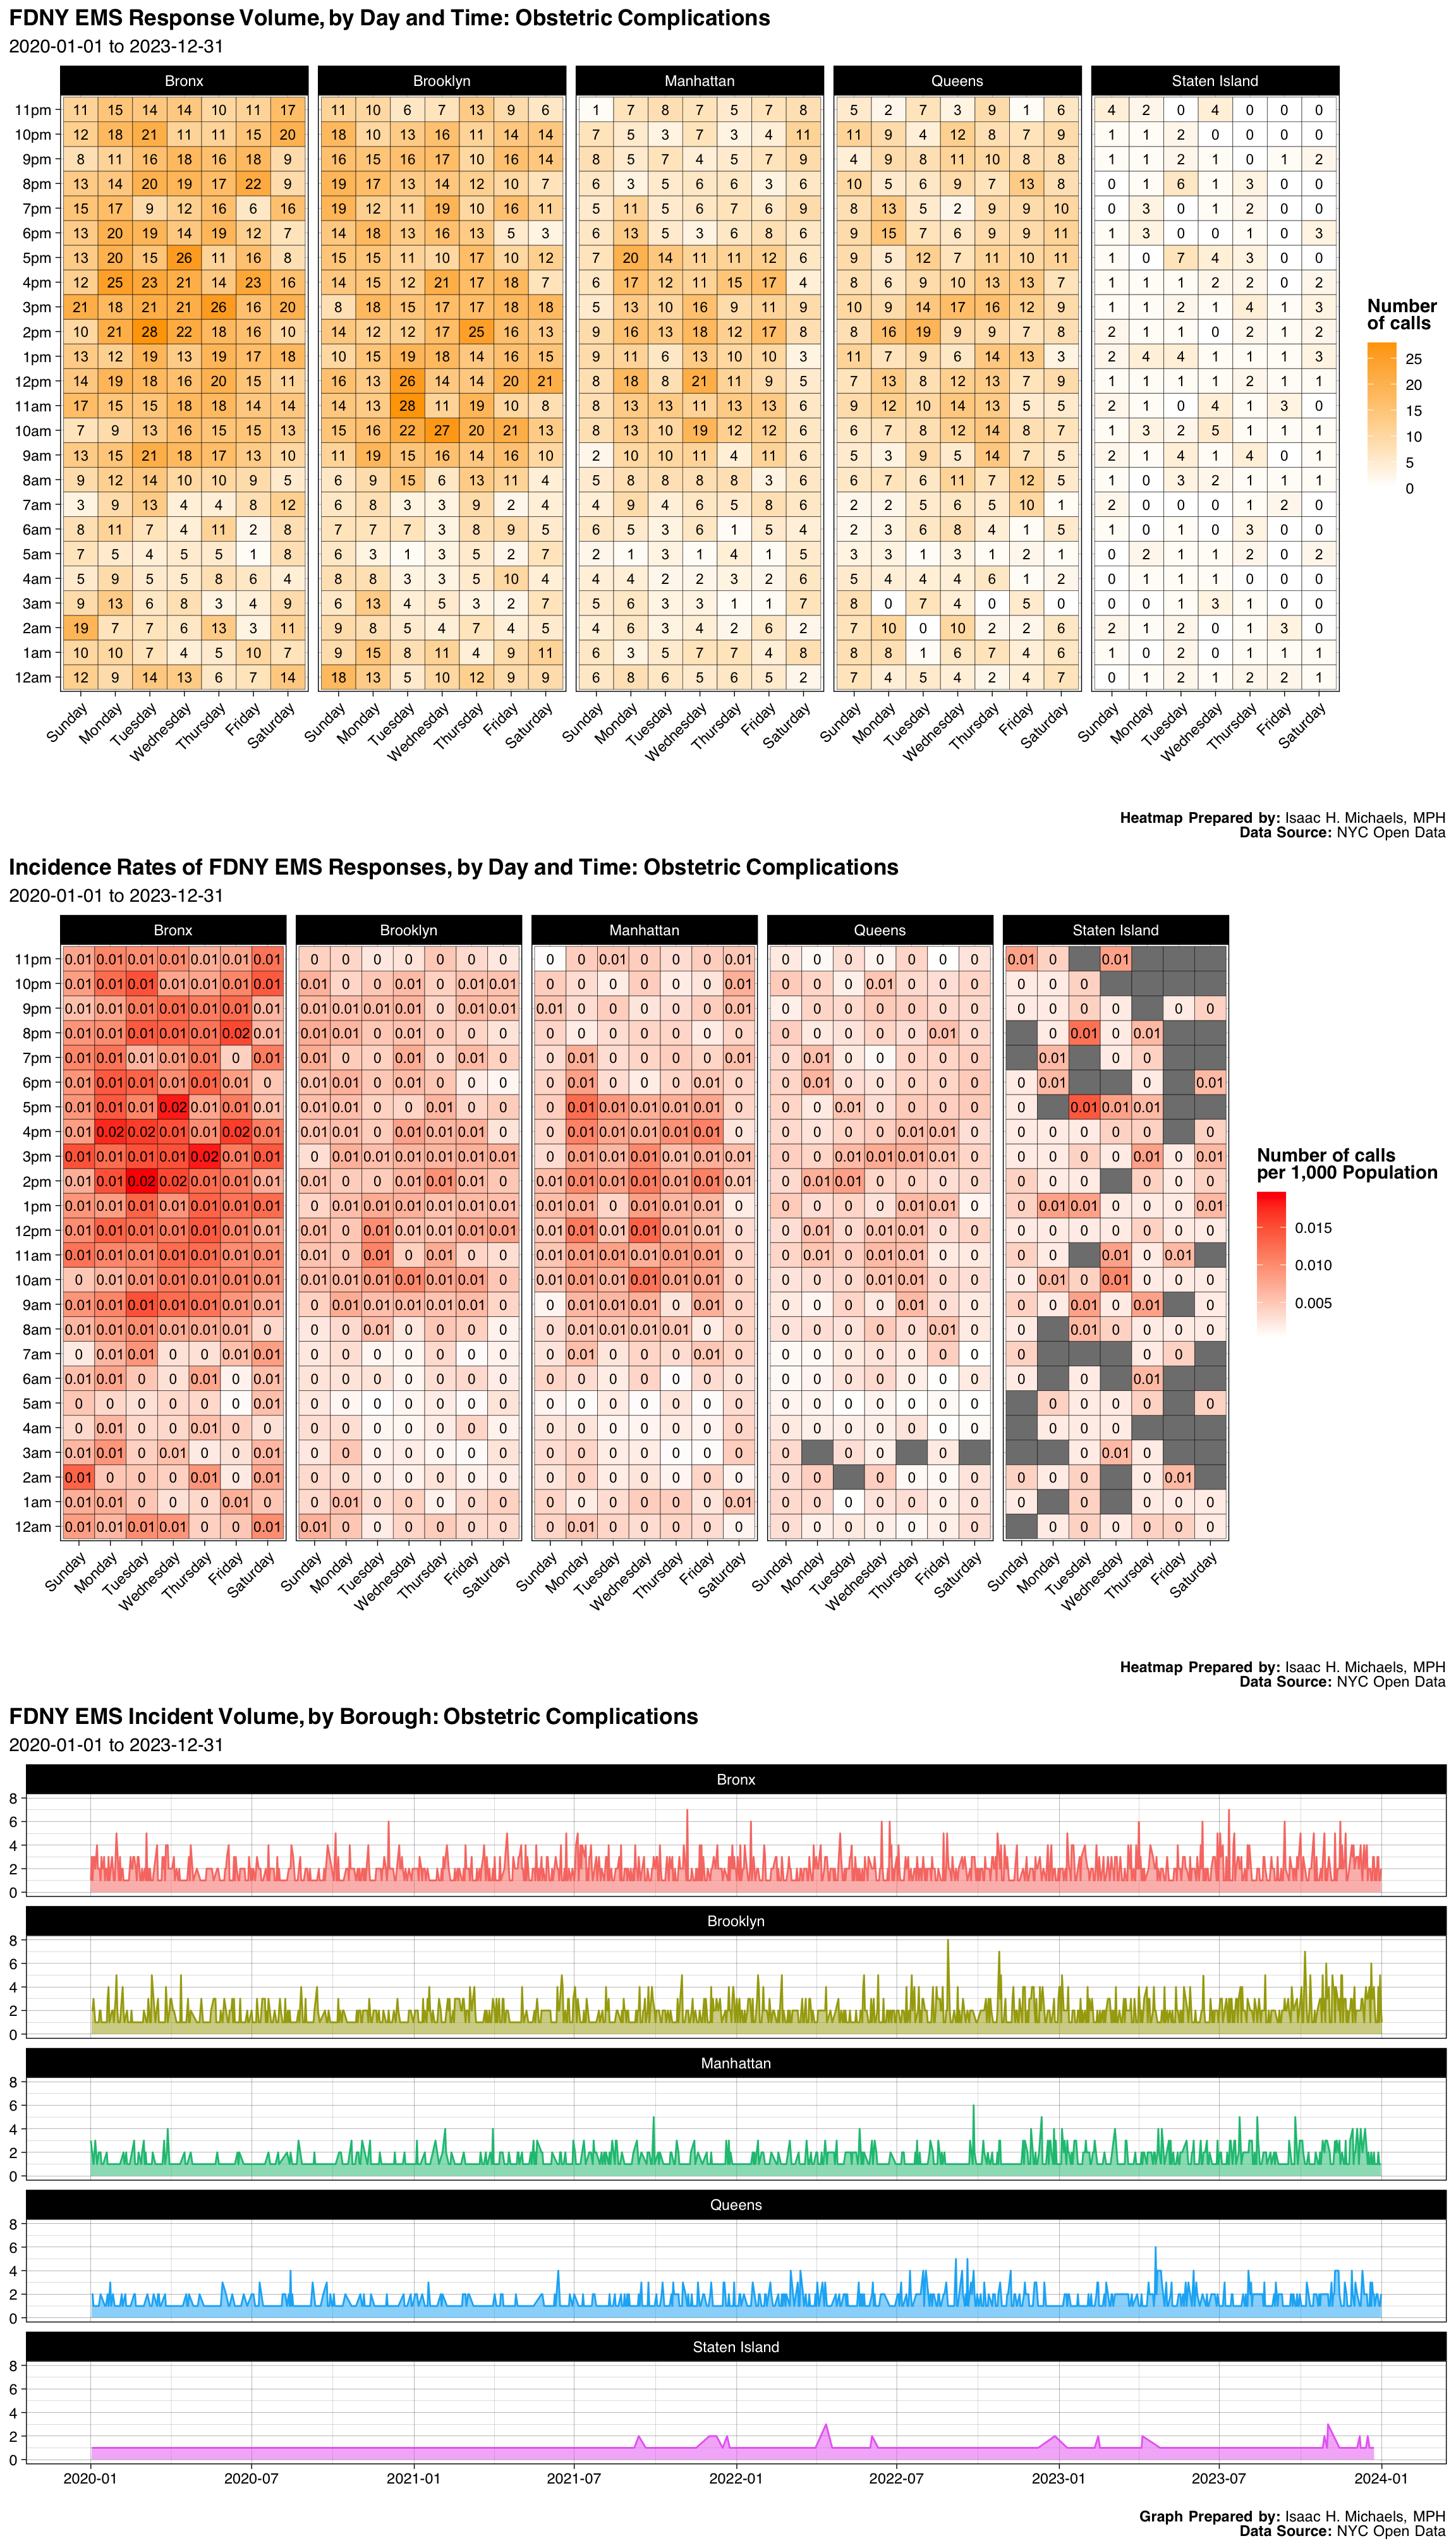
| Borough | Number | Percent |
|---|---|---|
| Bronx | 2142 | 0.3166765 |
| Brooklyn | 1955 | 0.2890302 |
| Manhattan | 1230 | 0.1818451 |
| Queens | 1223 | 0.1808102 |
| Staten Island | 214 | 0.0316381 |
| Final Severity Level | Number | Percent |
|---|---|---|
| 1 | 0 | 0% |
| 2 | 6762 | 0.999704316972206 |
| 3 | 0 | 0% |
| 4 | 2 | 0.000295683027794205 |
| 5 | 0 | 0% |
| 6 | 0 | 0% |
| 7 | 0 | 0% |
| 8 | 0 | 0% |
| Disposition | Number | Percent |
|---|---|---|
| Transporting Patient | 5828 | 0.8616203 |
| Refused Medical Aid | 542 | 0.0801301 |
| Unfounded | 186 | 0.0274985 |
| Patient Gone on Arrival | 123 | 0.0181845 |
| Cancelled | 58 | 0.0085748 |
| Condition Corrected | 14 | 0.0020698 |
| Other | 8 | 0.0011827 |
| Treated and Transported | 4 | 0.0005914 |
| Triaged at Scene No Transport | 1 | 0.0001478 |
Graphs, Heatmaps, and Tables Prepared By: Isaac H. Michaels, MPH
Data Source: NYC Open Data
Back to top
Minor Burns <18% Adlt Or <10%
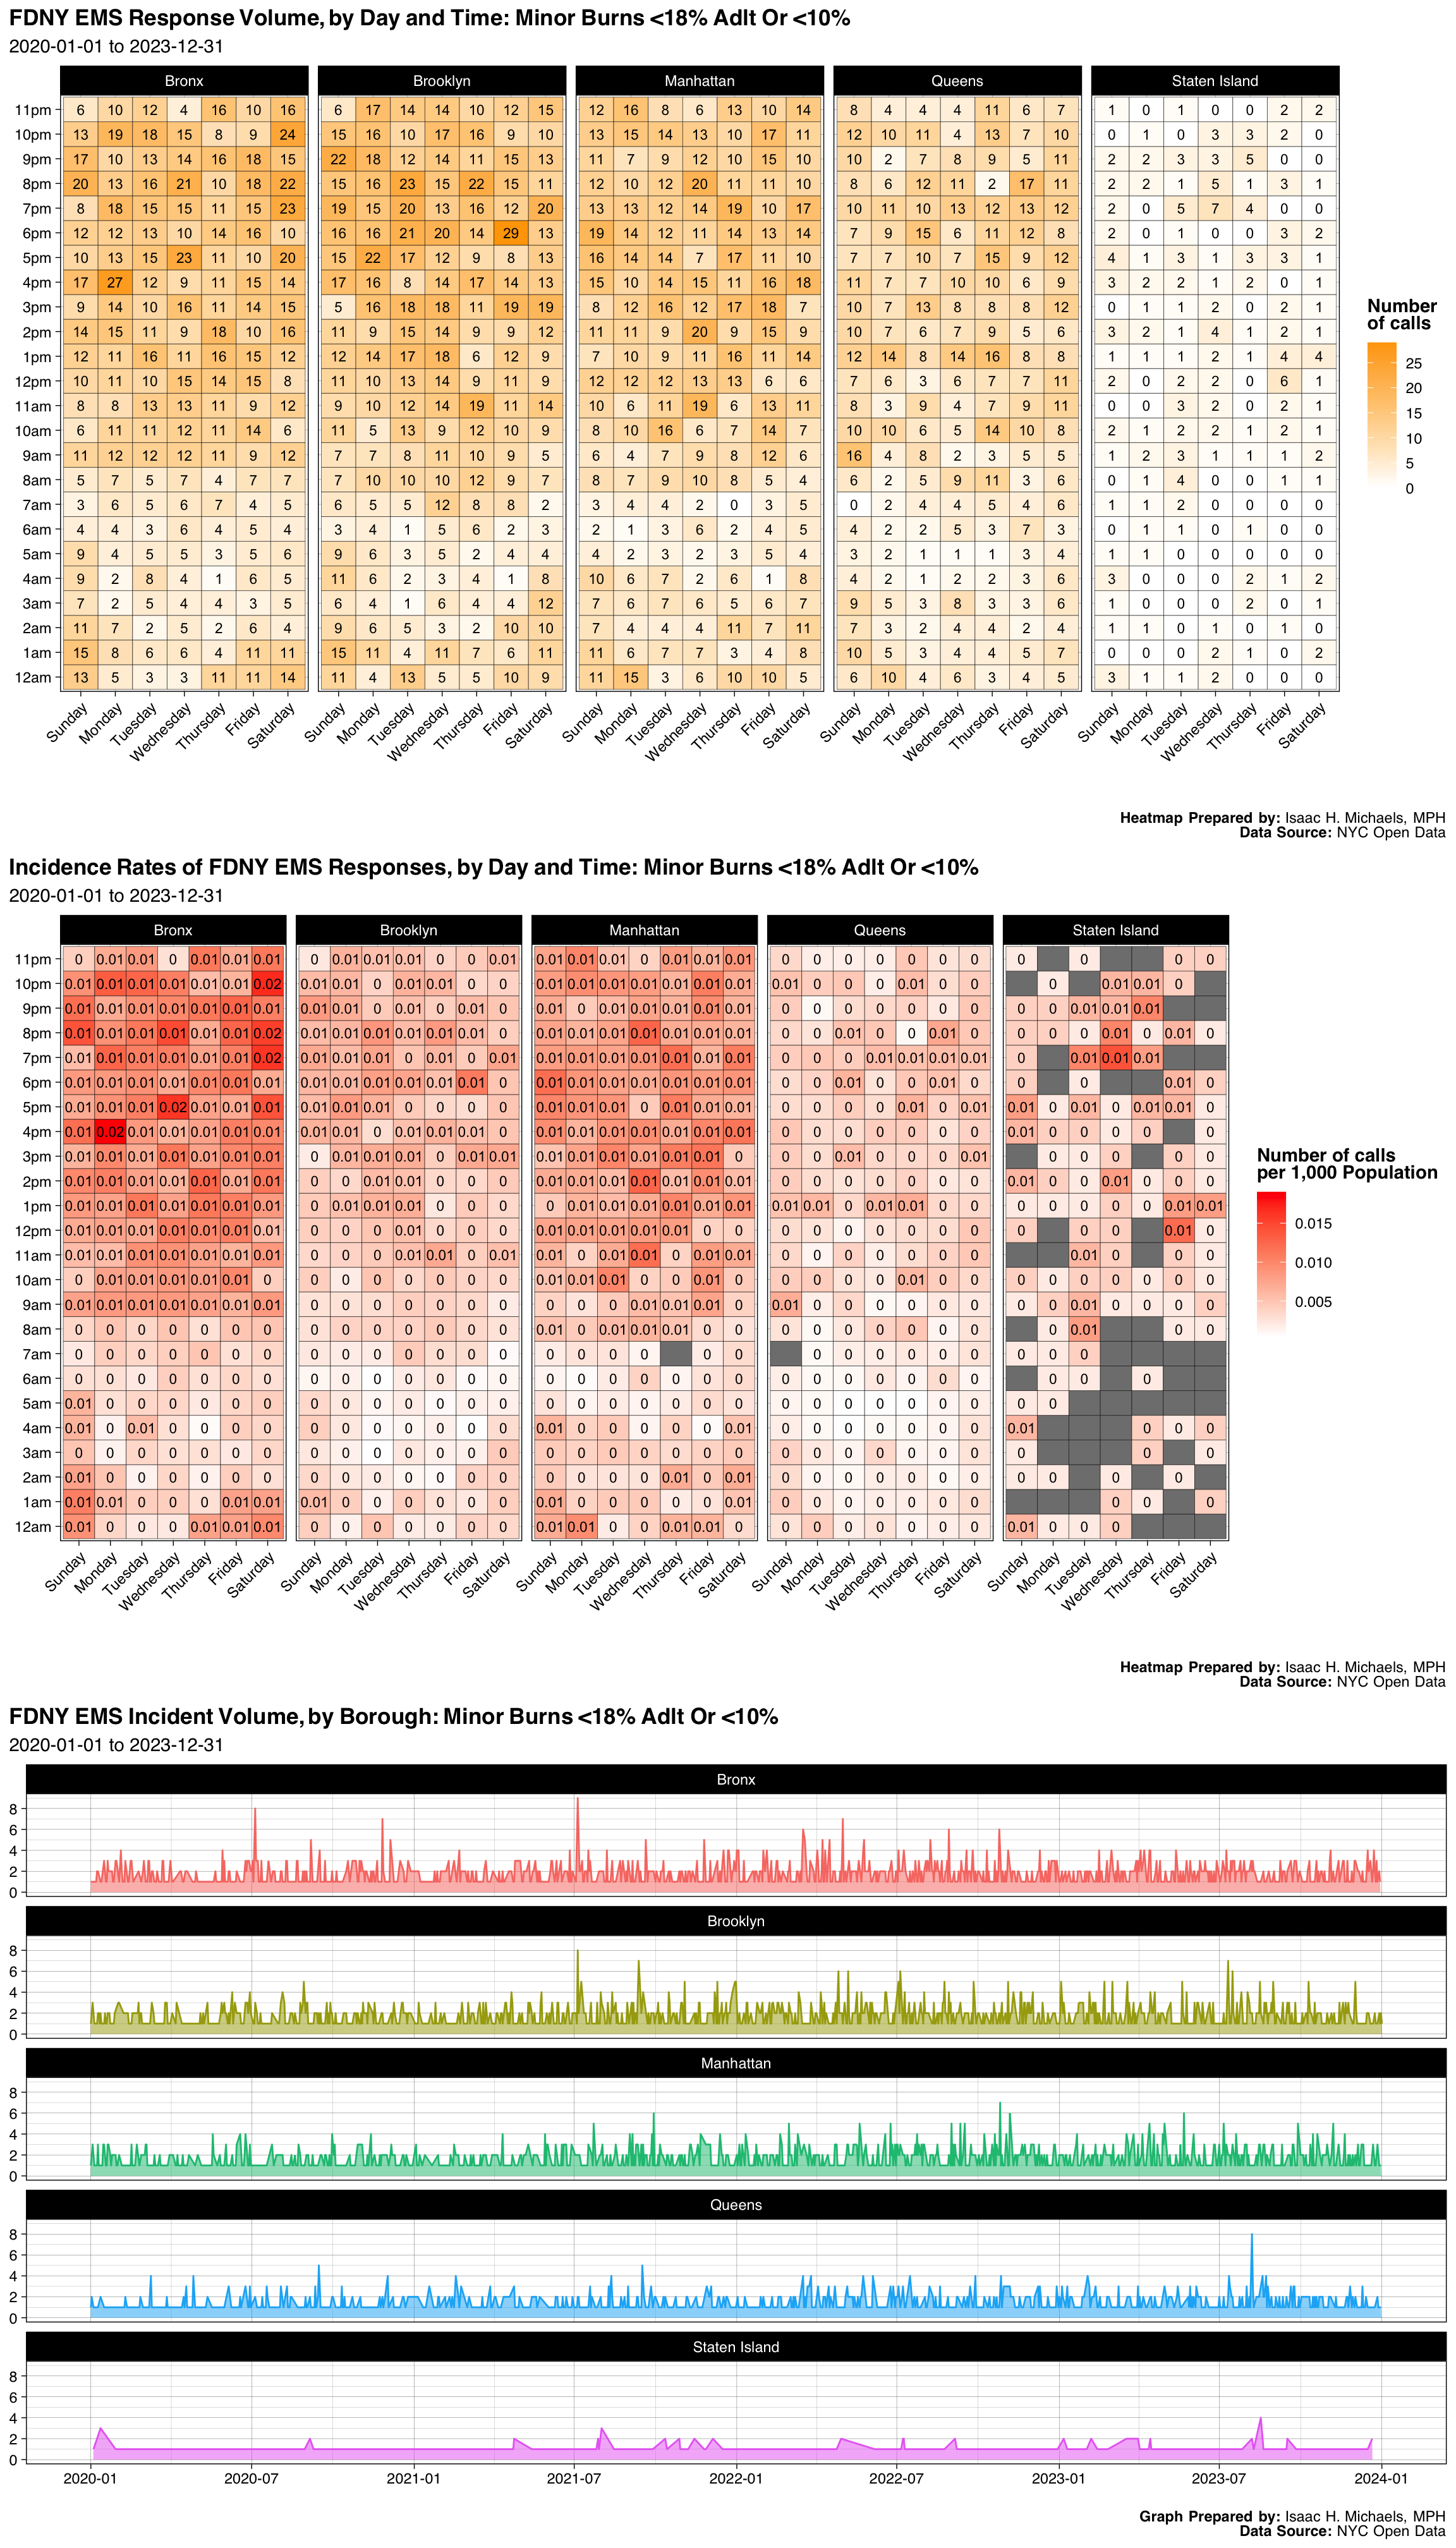
| Borough | Number | Percent |
|---|---|---|
| Bronx | 1752 | 0.2673993 |
| Brooklyn | 1814 | 0.2768620 |
| Manhattan | 1593 | 0.2431319 |
| Queens | 1173 | 0.1790293 |
| Staten Island | 220 | 0.0335775 |
| Final Severity Level | Number | Percent |
|---|---|---|
| 1 | 2 | 0.000305250305250305 |
| 2 | 0 | 0% |
| 3 | 19 | 0.0028998778998779 |
| 4 | 6530 | 0.996642246642247 |
| 5 | 1 | 0.000152625152625153 |
| 6 | 0 | 0% |
| 7 | 0 | 0% |
| 8 | 0 | 0% |
| Disposition | Number | Percent |
|---|---|---|
| Transporting Patient | 3126 | 0.4771062 |
| Refused Medical Aid | 2254 | 0.3440171 |
| Unfounded | 472 | 0.0720391 |
| Patient Gone on Arrival | 261 | 0.0398352 |
| Condition Corrected | 257 | 0.0392247 |
| Cancelled | 144 | 0.0219780 |
| Other | 33 | 0.0050366 |
| Treated and Transported | 4 | 0.0006105 |
| Triaged at Scene No Transport | 1 | 0.0001526 |
Graphs, Heatmaps, and Tables Prepared By: Isaac H. Michaels, MPH
Data Source: NYC Open Data
Back to top
Anaphylactic Shock-Fever&Cough
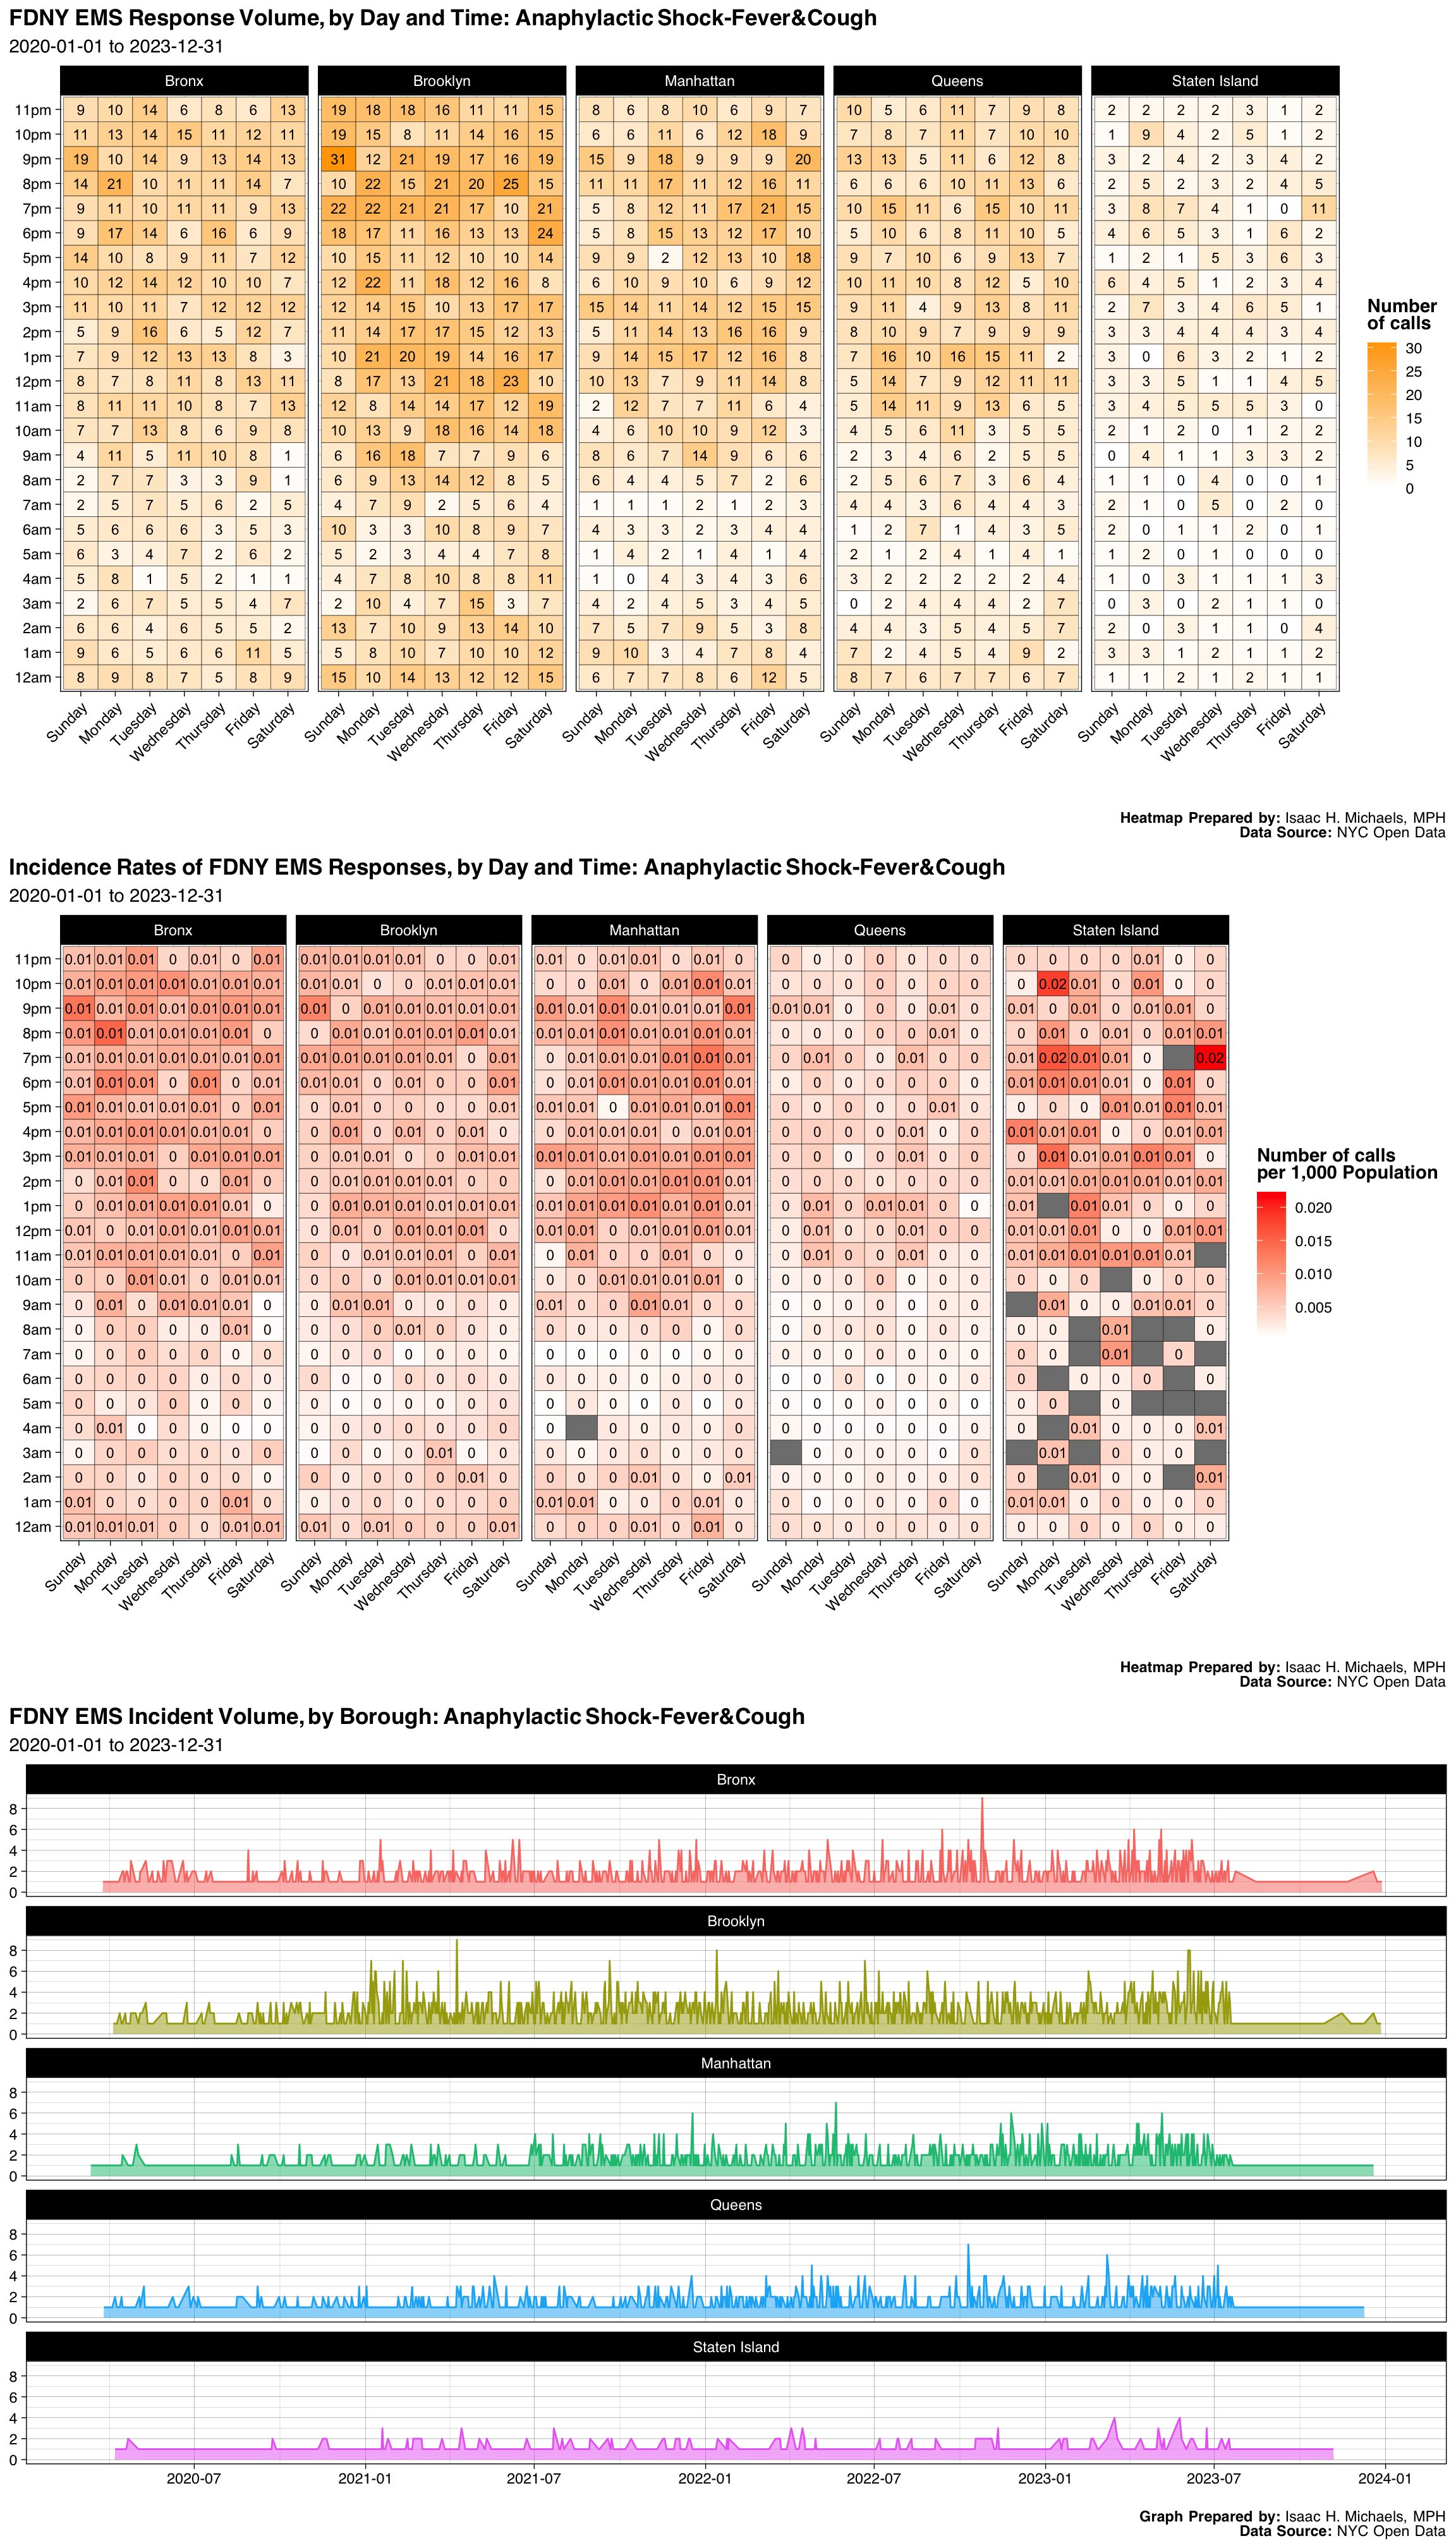
| Borough | Number | Percent |
|---|---|---|
| Bronx | 1395 | 0.2166485 |
| Brooklyn | 2103 | 0.3266035 |
| Manhattan | 1379 | 0.2141637 |
| Queens | 1155 | 0.1793757 |
| Staten Island | 407 | 0.0632086 |
| Final Severity Level | Number | Percent |
|---|---|---|
| 1 | 0 | 0% |
| 2 | 6439 | 1 |
| 3 | 0 | 0% |
| 4 | 0 | 0% |
| 5 | 0 | 0% |
| 6 | 0 | 0% |
| 7 | 0 | 0% |
| 8 | 0 | 0% |
| Disposition | Number | Percent |
|---|---|---|
| Transporting Patient | 5388 | 0.8367759 |
| Refused Medical Aid | 880 | 0.1366672 |
| Unfounded | 75 | 0.0116478 |
| Patient Gone on Arrival | 51 | 0.0079205 |
| Cancelled | 34 | 0.0052803 |
| Condition Corrected | 5 | 0.0007765 |
| Treated and Transported | 3 | 0.0004659 |
| Other | 2 | 0.0003106 |
| Triaged at Scene No Transport | 1 | 0.0001553 |
Graphs, Heatmaps, and Tables Prepared By: Isaac H. Michaels, MPH
Data Source: NYC Open Data
Back to top
Hypothermia
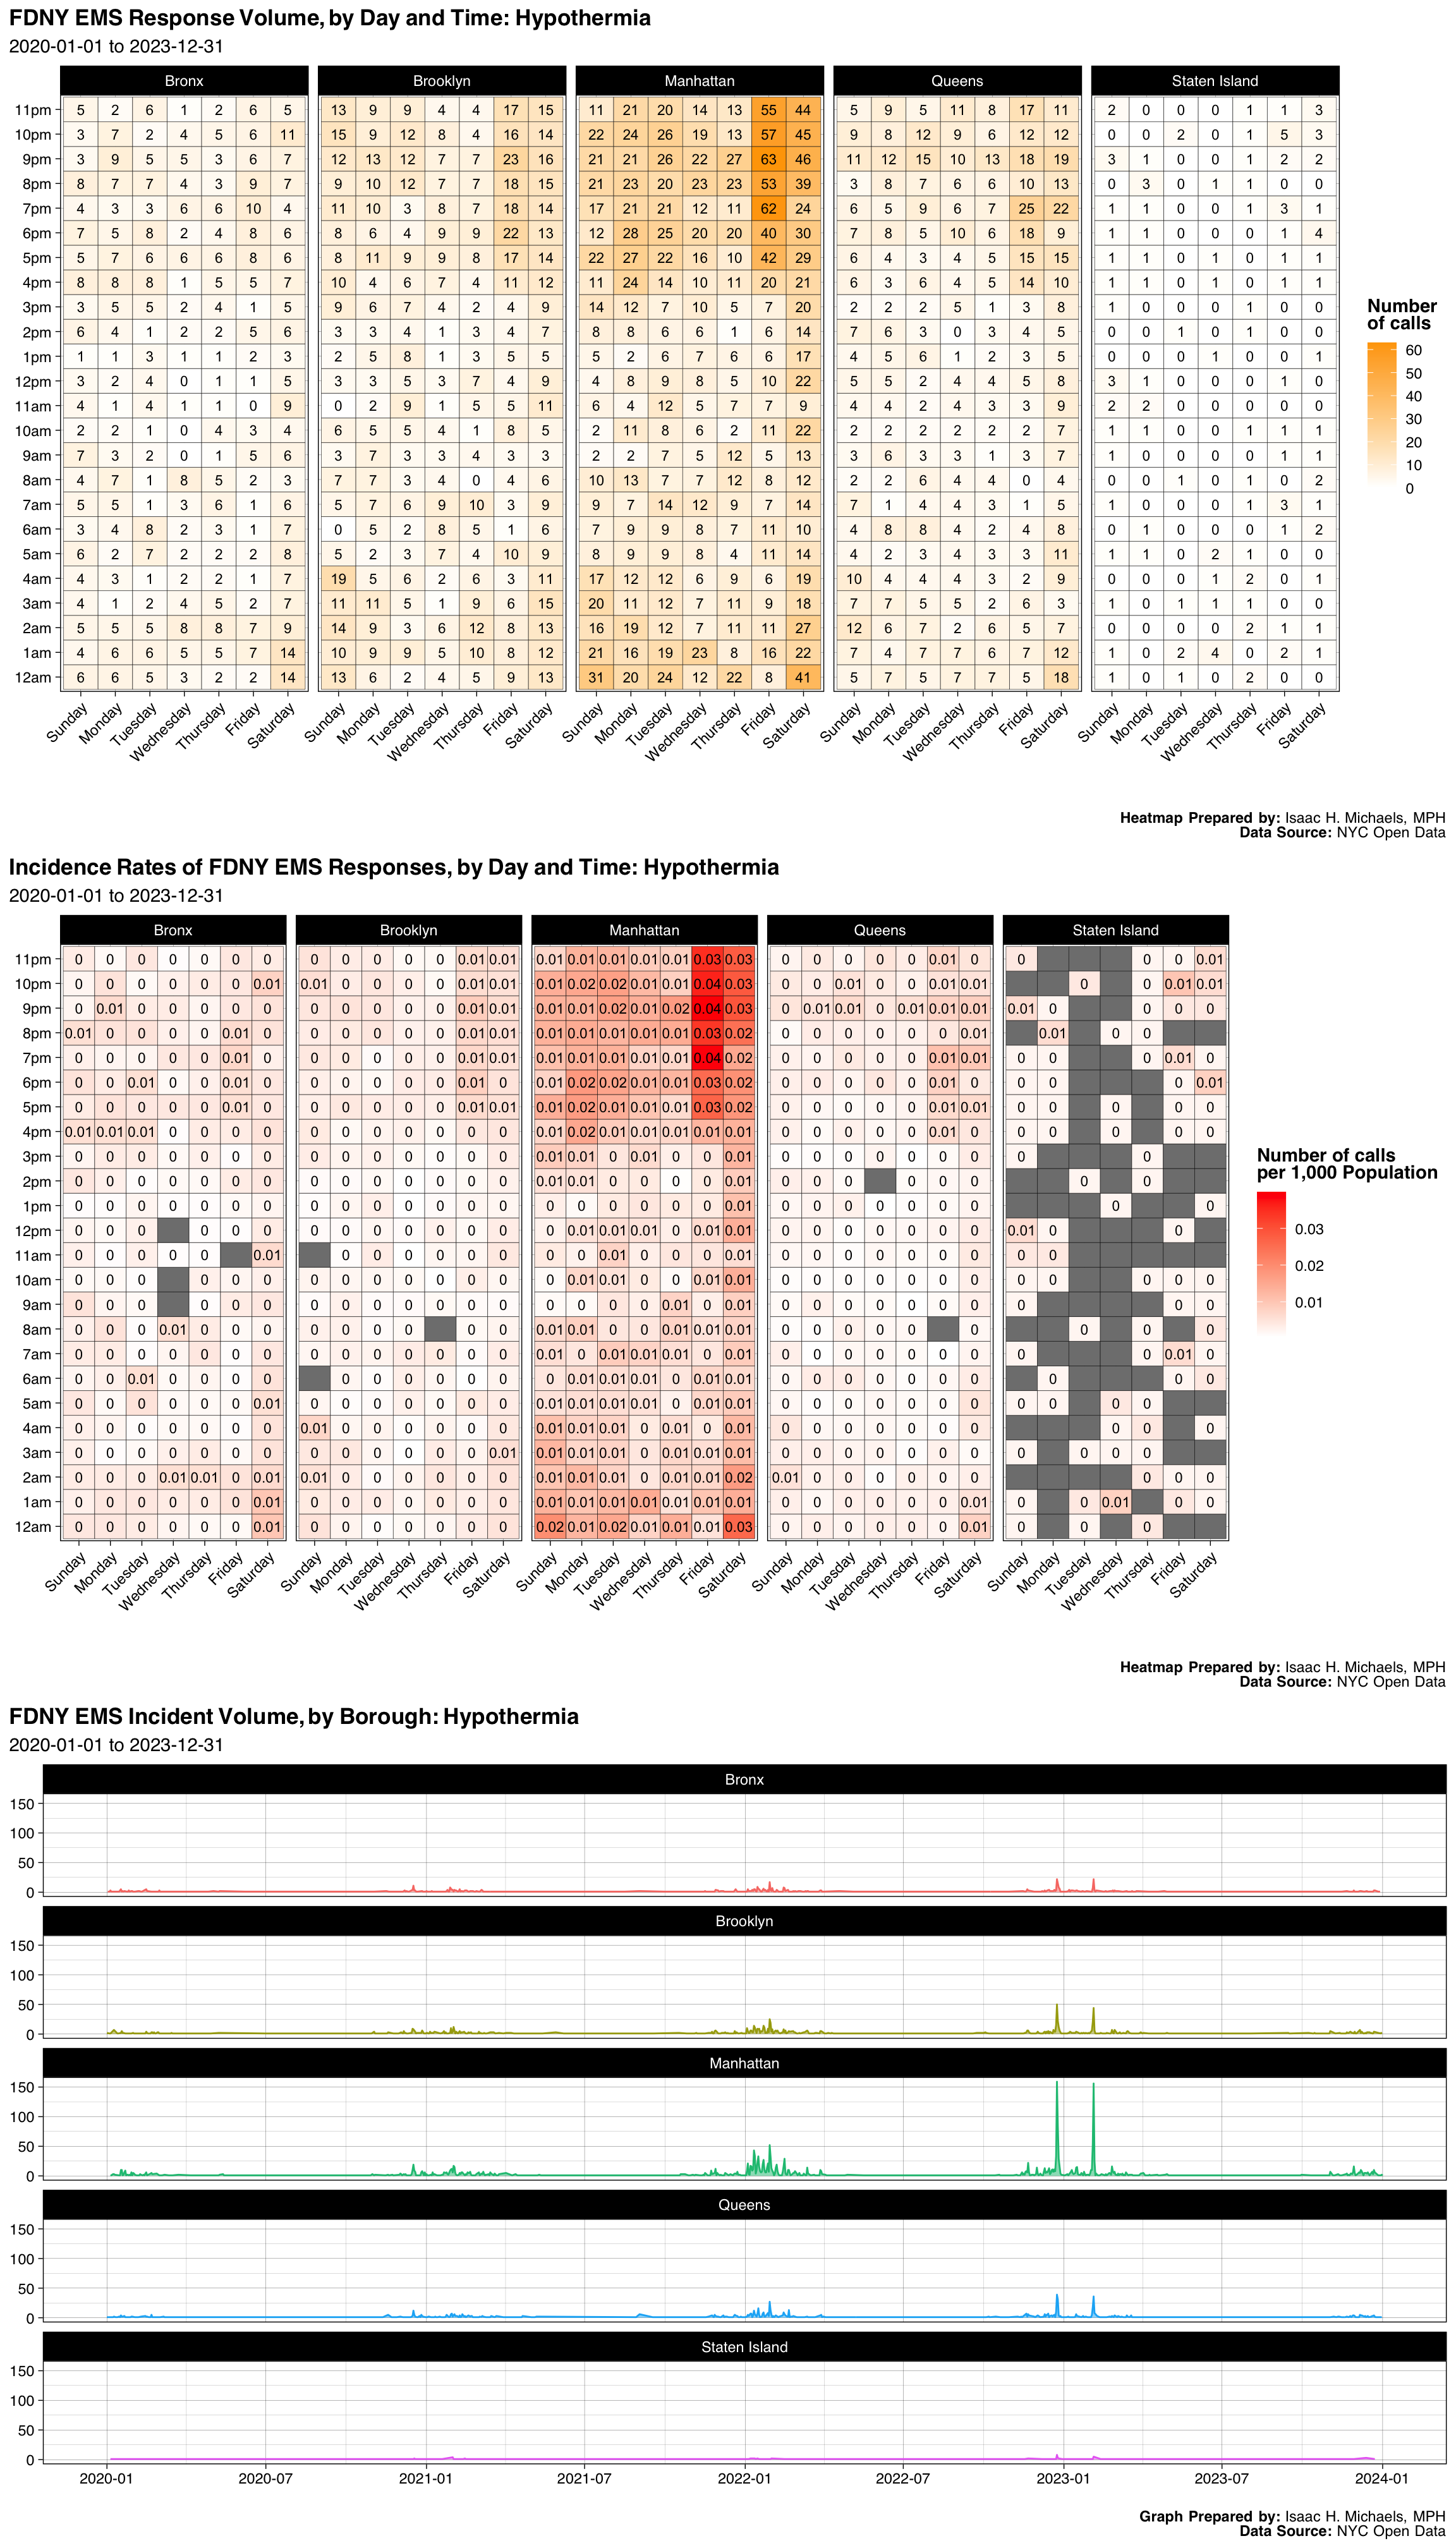
| Borough | Number | Percent |
|---|---|---|
| Bronx | 740 | 0.1273666 |
| Brooklyn | 1248 | 0.2148021 |
| Manhattan | 2651 | 0.4562823 |
| Queens | 1047 | 0.1802065 |
| Staten Island | 124 | 0.0213425 |
| Final Severity Level | Number | Percent |
|---|---|---|
| 1 | 0 | 0% |
| 2 | 0 | 0% |
| 3 | 0 | 0% |
| 4 | 40 | 0.00688468158347676 |
| 5 | 5770 | 0.993115318416523 |
| 6 | 0 | 0% |
| 7 | 0 | 0% |
| 8 | 0 | 0% |
| Disposition | Number | Percent |
|---|---|---|
| Transporting Patient | 2219 | 0.3819277 |
| Unfounded | 1767 | 0.3041308 |
| Refused Medical Aid | 1399 | 0.2407917 |
| Patient Gone on Arrival | 231 | 0.0397590 |
| Condition Corrected | 95 | 0.0163511 |
| Cancelled | 80 | 0.0137694 |
| Other | 17 | 0.0029260 |
| Patient Pronounced Dead | 1 | 0.0001721 |
| Treated and Transported | 1 | 0.0001721 |
Graphs, Heatmaps, and Tables Prepared By: Isaac H. Michaels, MPH
Data Source: NYC Open Data
Back to top
Major Burns 18% Adlt 10% Child
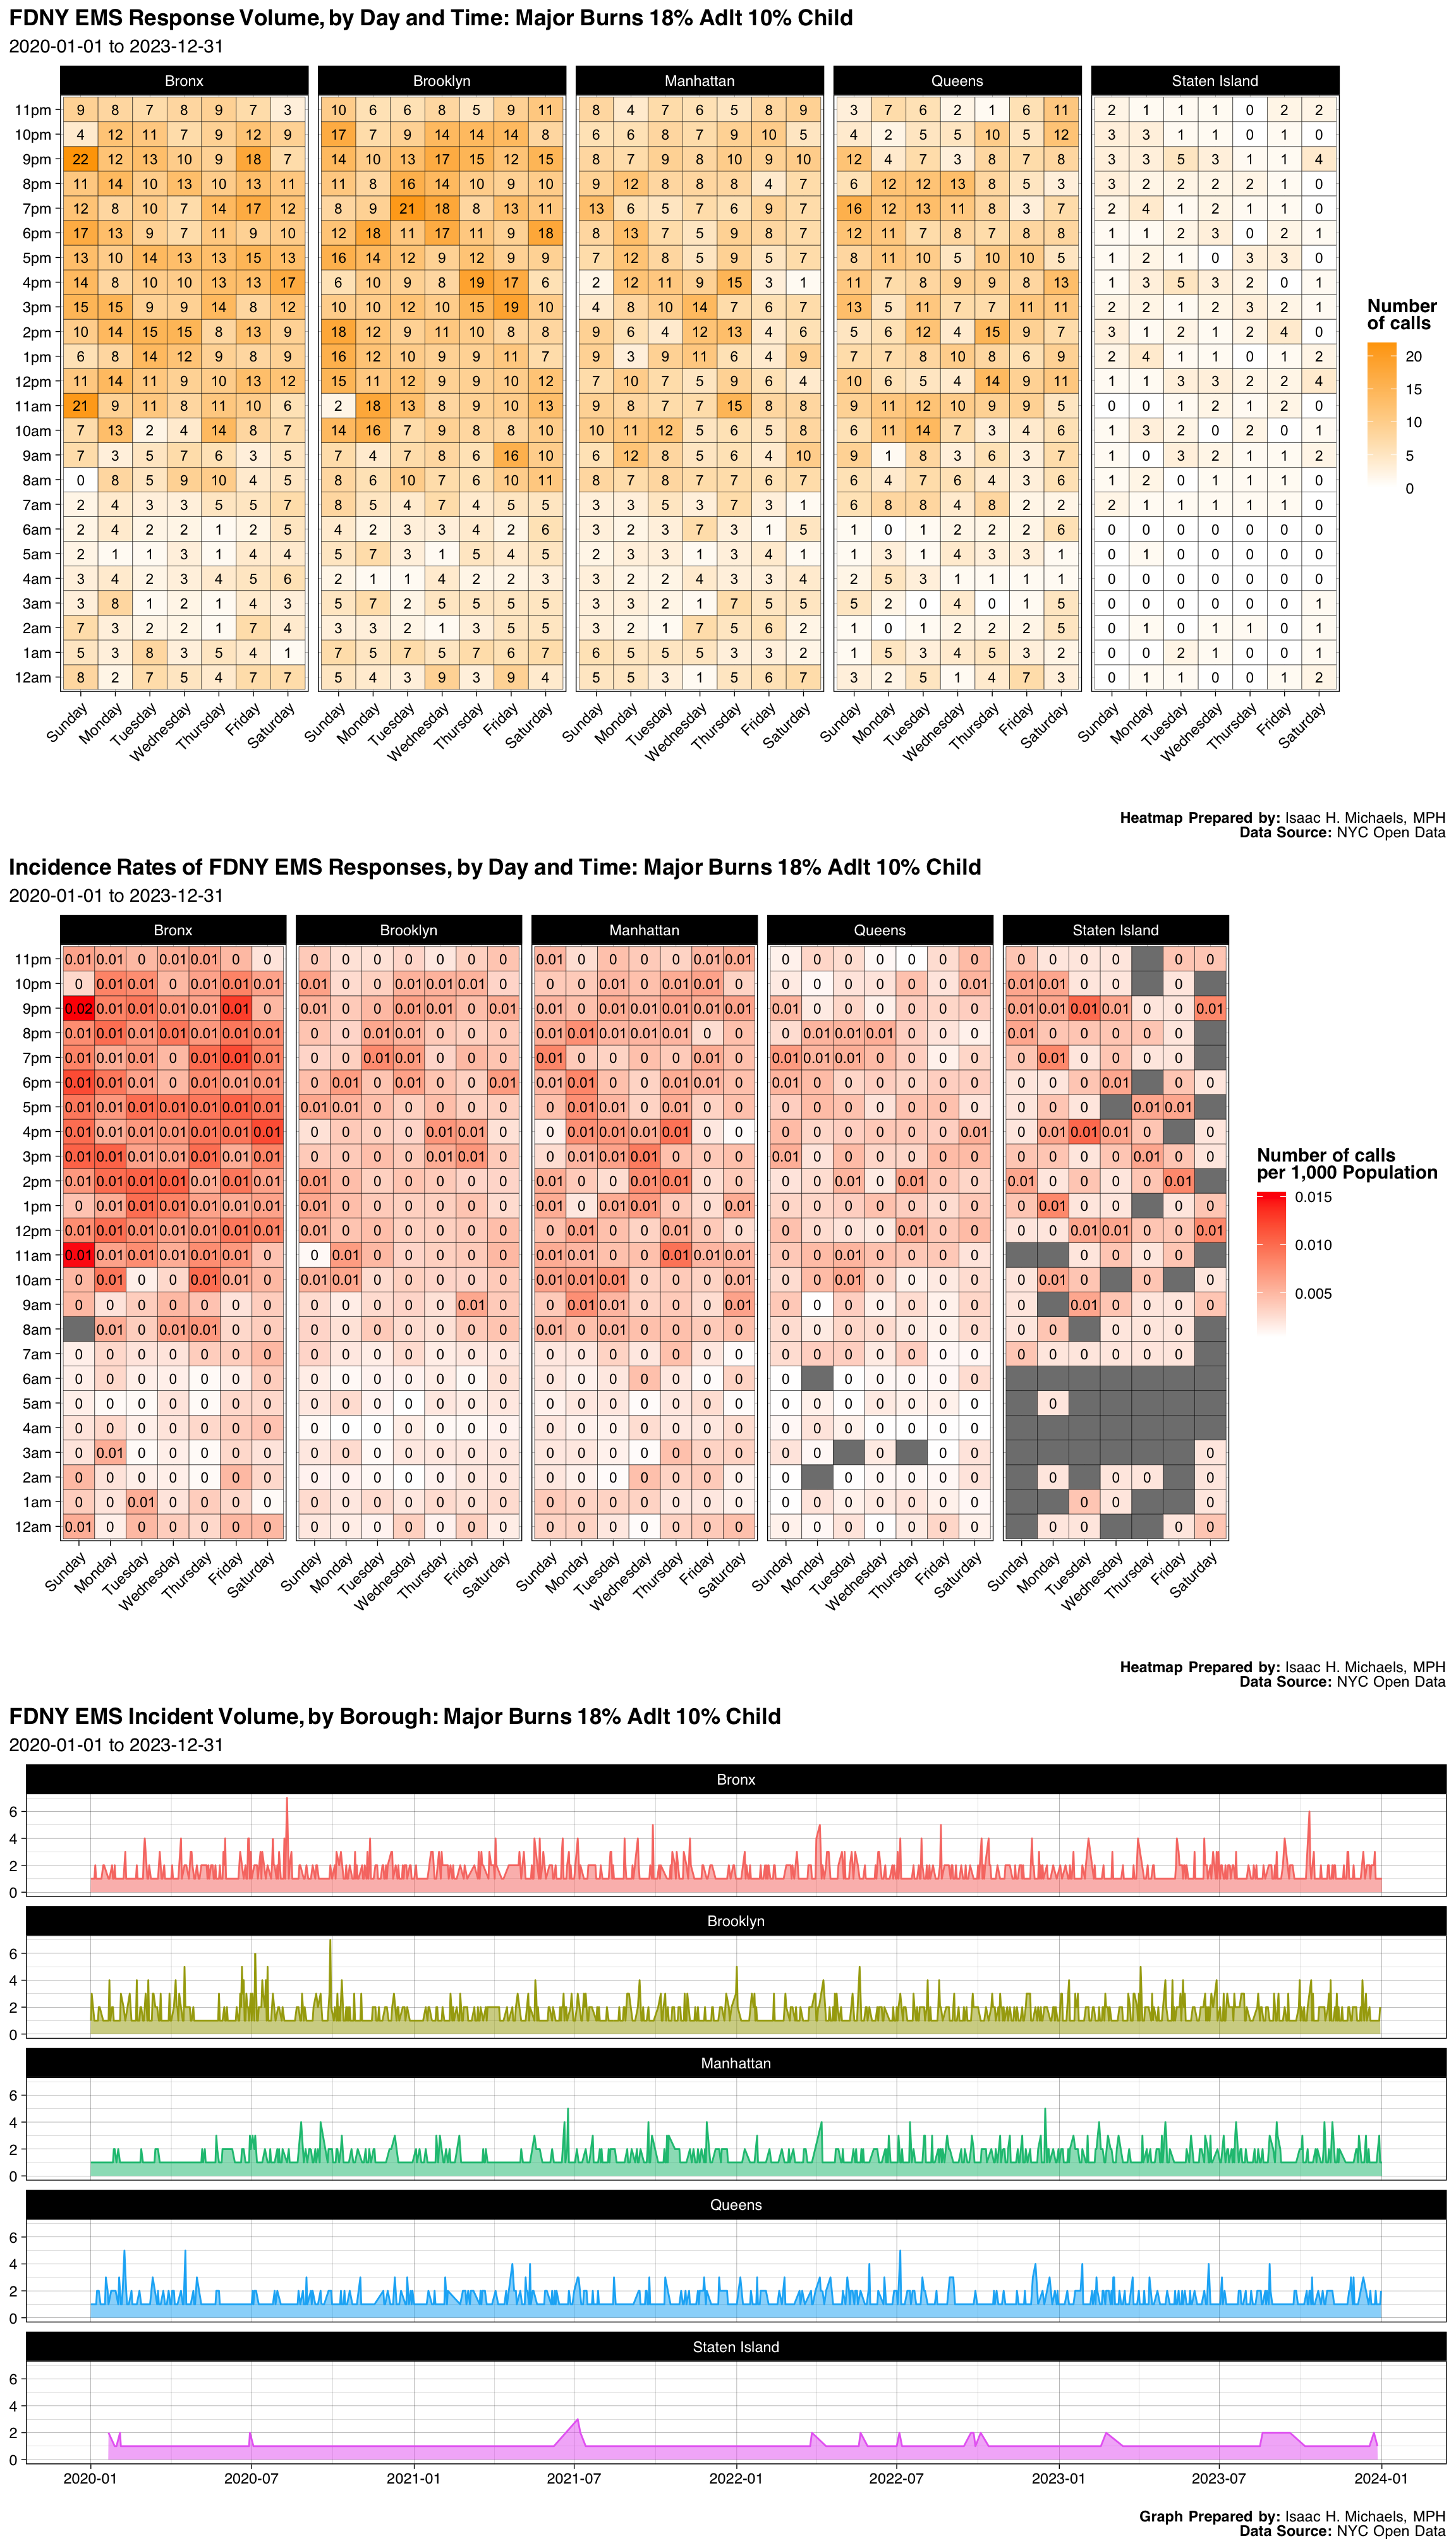
| Borough | Number | Percent |
|---|---|---|
| Bronx | 1347 | 0.2637040 |
| Brooklyn | 1471 | 0.2879796 |
| Manhattan | 1060 | 0.2075176 |
| Queens | 1028 | 0.2012529 |
| Staten Island | 202 | 0.0395458 |
| Final Severity Level | Number | Percent |
|---|---|---|
| 1 | 2 | 0.000391542678151919 |
| 2 | 0 | 0% |
| 3 | 5098 | 0.99804228660924 |
| 4 | 8 | 0.00156617071260767 |
| 5 | 0 | 0% |
| 6 | 0 | 0% |
| 7 | 0 | 0% |
| 8 | 0 | 0% |
| Disposition | Number | Percent |
|---|---|---|
| Transporting Patient | 3474 | 0.6801096 |
| Refused Medical Aid | 952 | 0.1863743 |
| Unfounded | 330 | 0.0646045 |
| Condition Corrected | 119 | 0.0232968 |
| Cancelled | 112 | 0.0219264 |
| Patient Gone on Arrival | 110 | 0.0215348 |
| Other | 9 | 0.0017619 |
| Treated and Transported | 2 | 0.0003915 |
Graphs, Heatmaps, and Tables Prepared By: Isaac H. Michaels, MPH
Data Source: NYC Open Data
Back to top
Hx Drug Or Alchl Abuse-Fev&Cou
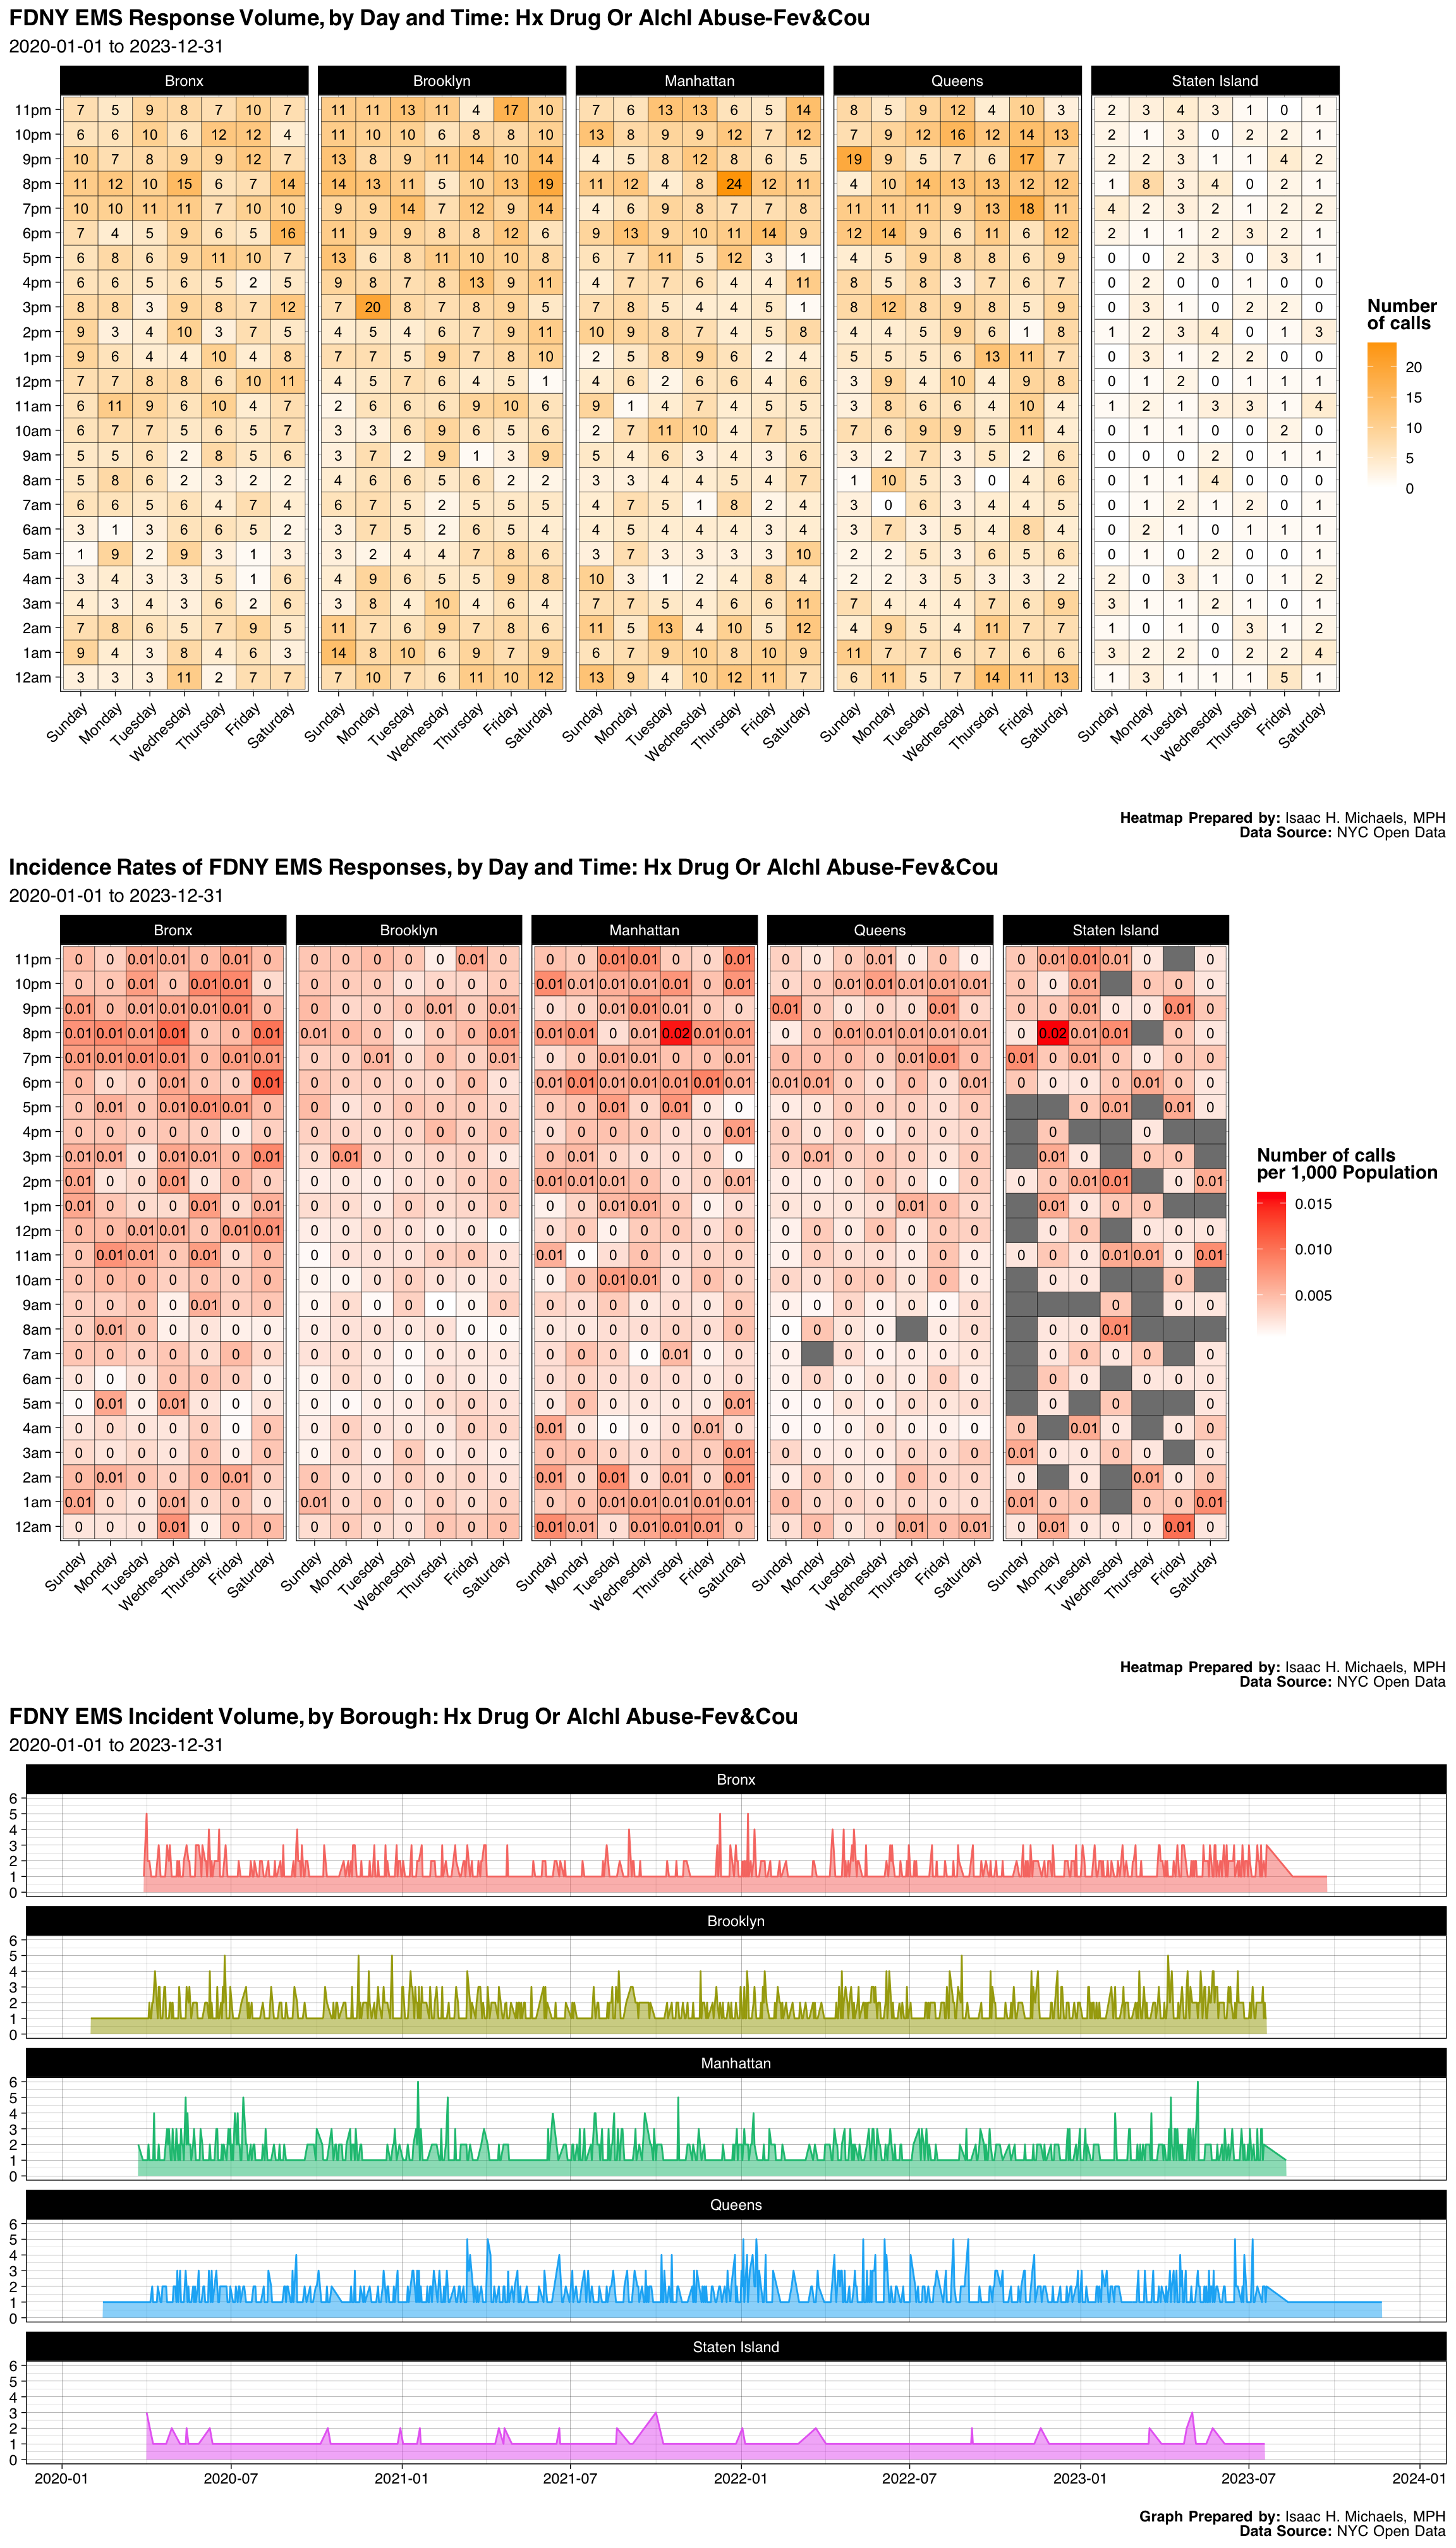
| Borough | Number | Percent |
|---|---|---|
| Bronx | 1083 | 0.2204805 |
| Brooklyn | 1281 | 0.2607899 |
| Manhattan | 1127 | 0.2294381 |
| Queens | 1186 | 0.2414495 |
| Staten Island | 235 | 0.0478420 |
| Final Severity Level | Number | Percent |
|---|---|---|
| 1 | 0 | 0% |
| 2 | 0 | 0% |
| 3 | 3 | 0.000610749185667752 |
| 4 | 4909 | 0.999389250814332 |
| 5 | 0 | 0% |
| 6 | 0 | 0% |
| 7 | 0 | 0% |
| 8 | 0 | 0% |
| Disposition | Number | Percent |
|---|---|---|
| Transporting Patient | 3430 | 0.6982899 |
| Refused Medical Aid | 701 | 0.1427117 |
| Unfounded | 409 | 0.0832655 |
| Patient Gone on Arrival | 169 | 0.0344055 |
| Condition Corrected | 137 | 0.0278909 |
| Cancelled | 54 | 0.0109935 |
| Other | 7 | 0.0014251 |
| Treated and Transported | 2 | 0.0004072 |
| Triaged at Scene No Transport | 2 | 0.0004072 |
| Treated Not Transported | 1 | 0.0002036 |
Graphs, Heatmaps, and Tables Prepared By: Isaac H. Michaels, MPH
Data Source: NYC Open Data
Back to top
Card Or Resp Arrest-Fevercough
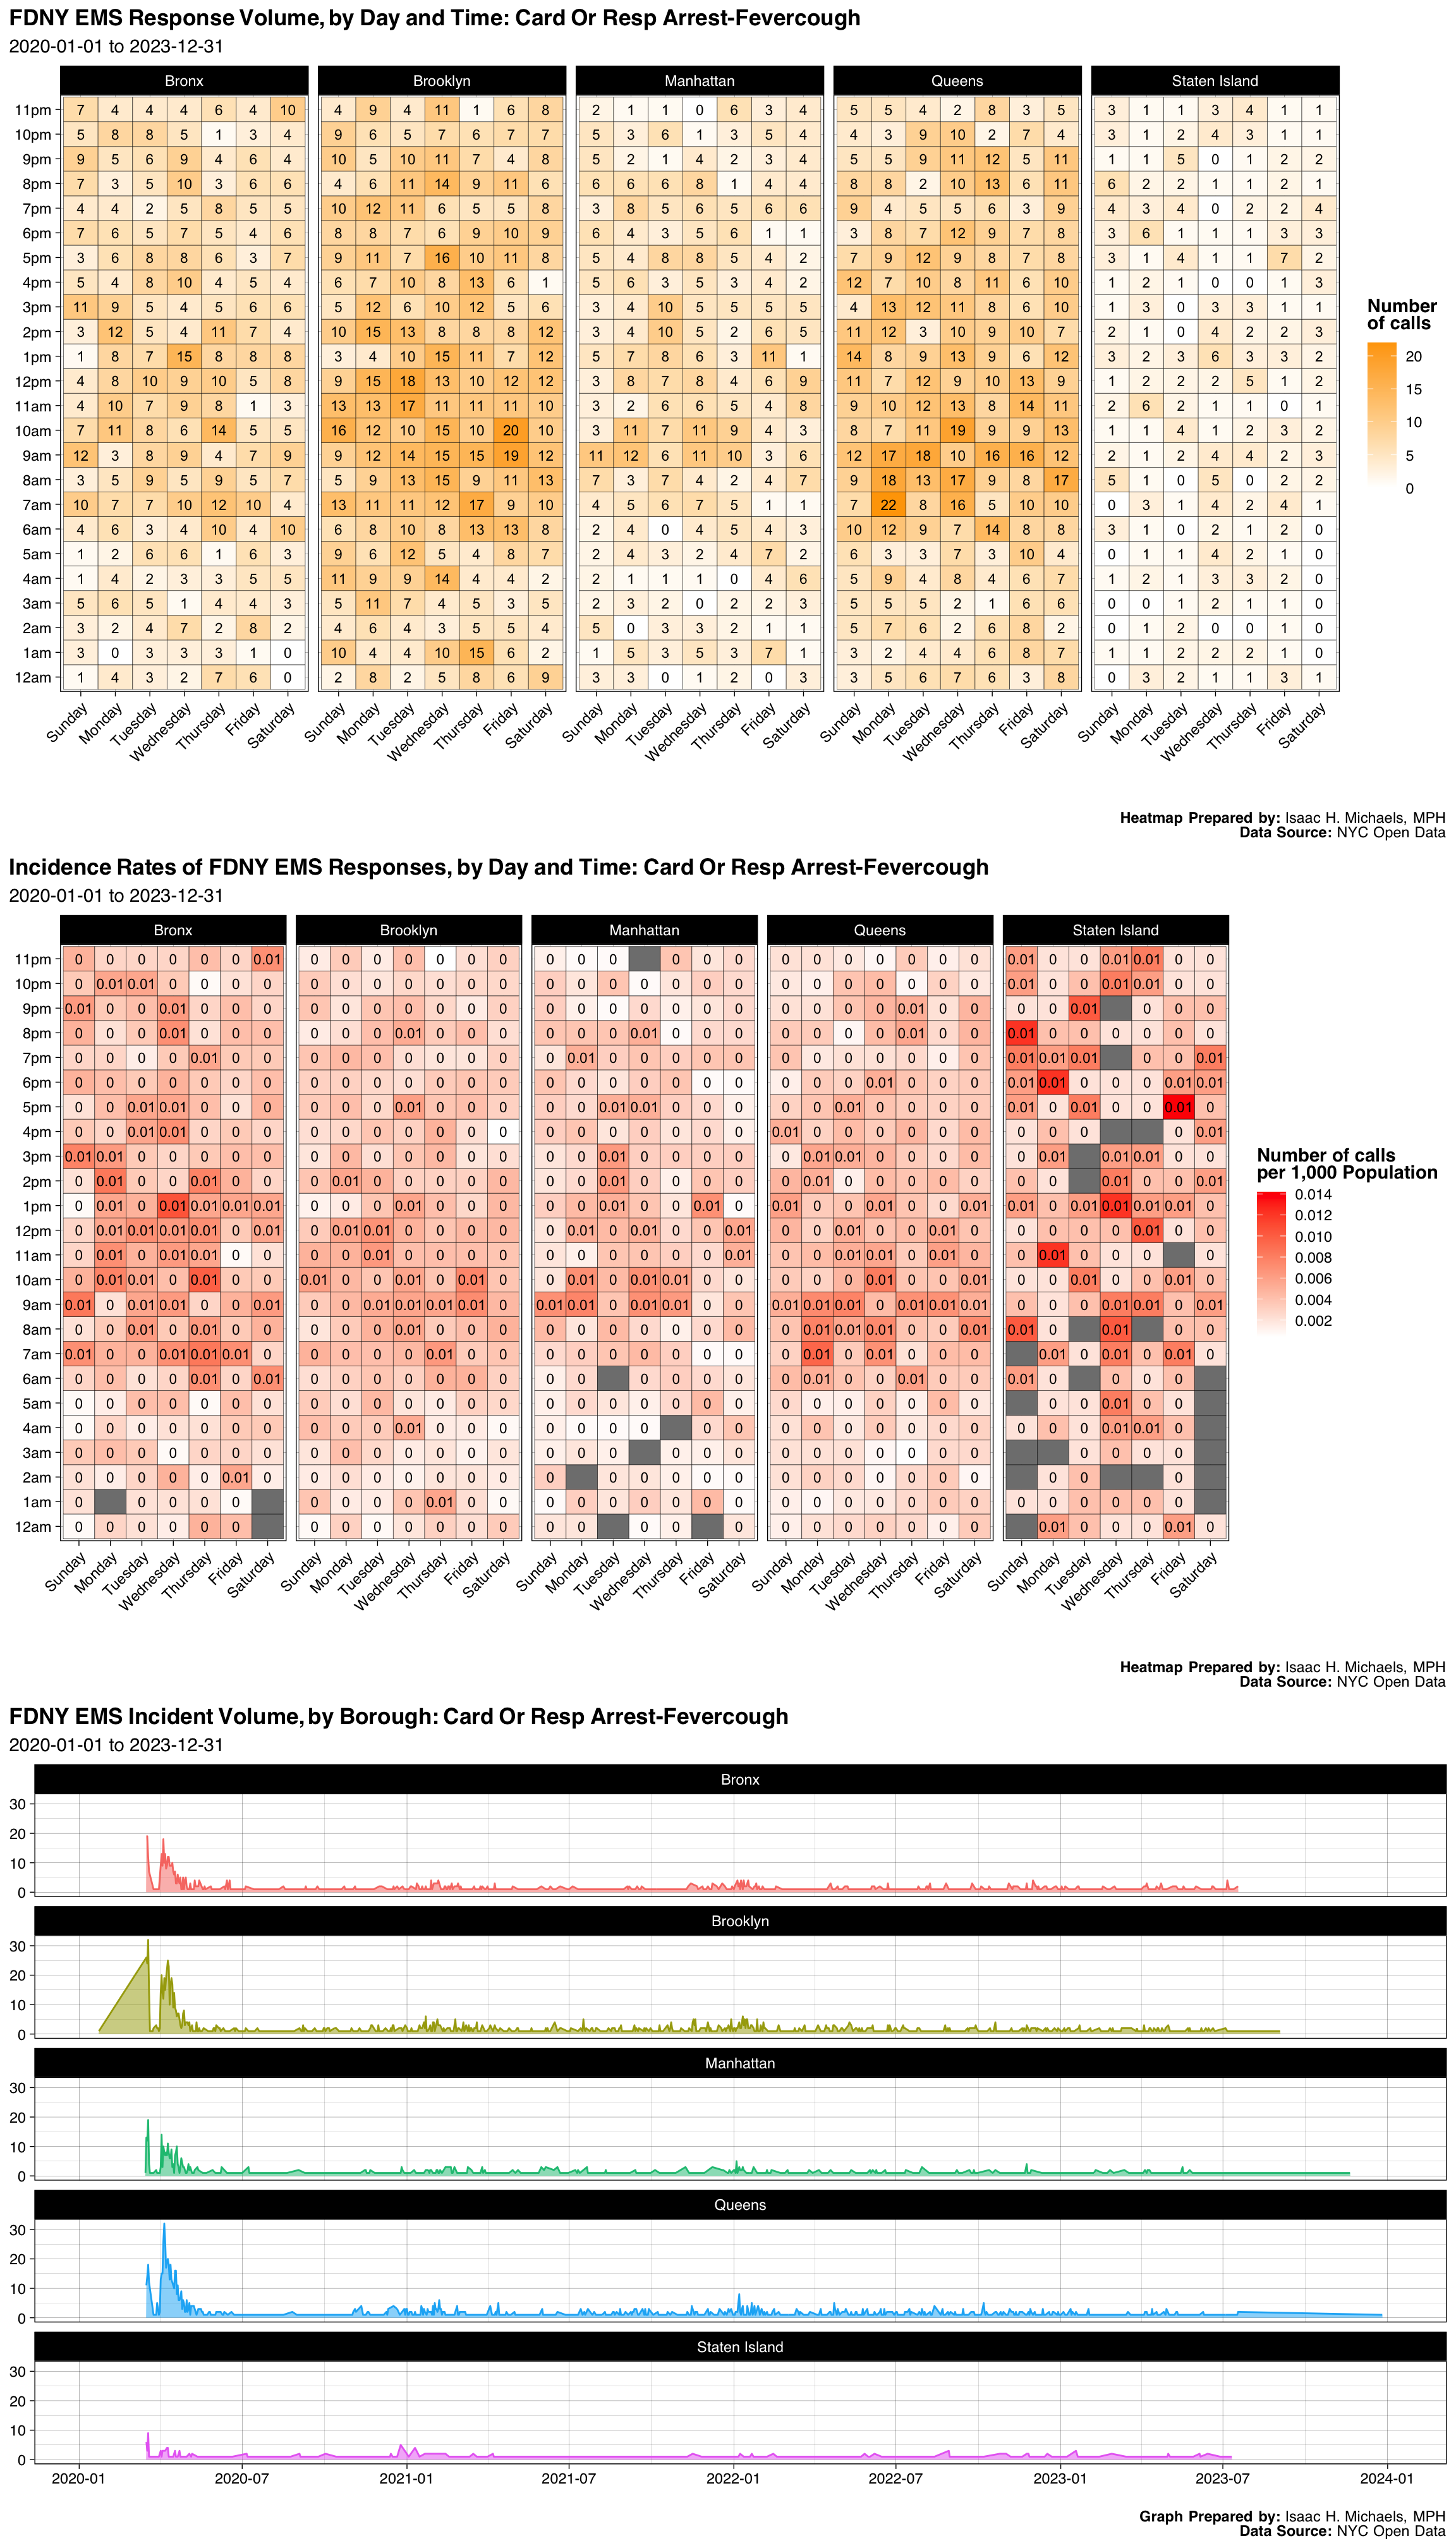
| Borough | Number | Percent |
|---|---|---|
| Bronx | 945 | 0.1948052 |
| Brooklyn | 1489 | 0.3069470 |
| Manhattan | 718 | 0.1480107 |
| Queens | 1382 | 0.2848897 |
| Staten Island | 317 | 0.0653474 |
| Final Severity Level | Number | Percent |
|---|---|---|
| 1 | 4850 | 0.999793856936714 |
| 2 | 1 | 0.00020614306328592 |
| 3 | 0 | 0% |
| 4 | 0 | 0% |
| 5 | 0 | 0% |
| 6 | 0 | 0% |
| 7 | 0 | 0% |
| 8 | 0 | 0% |
| Disposition | Number | Percent |
|---|---|---|
| Patient Pronounced Dead | 2554 | 0.5264894 |
| Transporting Patient | 1938 | 0.3995053 |
| Refused Medical Aid | 138 | 0.0284477 |
| Unfounded | 130 | 0.0267986 |
| Cancelled | 46 | 0.0094826 |
| Patient Gone on Arrival | 34 | 0.0070089 |
| Treated and Transported | 5 | 0.0010307 |
| Condition Corrected | 4 | 0.0008246 |
| Other | 2 | 0.0004123 |
Graphs, Heatmaps, and Tables Prepared By: Isaac H. Michaels, MPH
Data Source: NYC Open Data
Back to top
Police 10-13, Unconfirmed
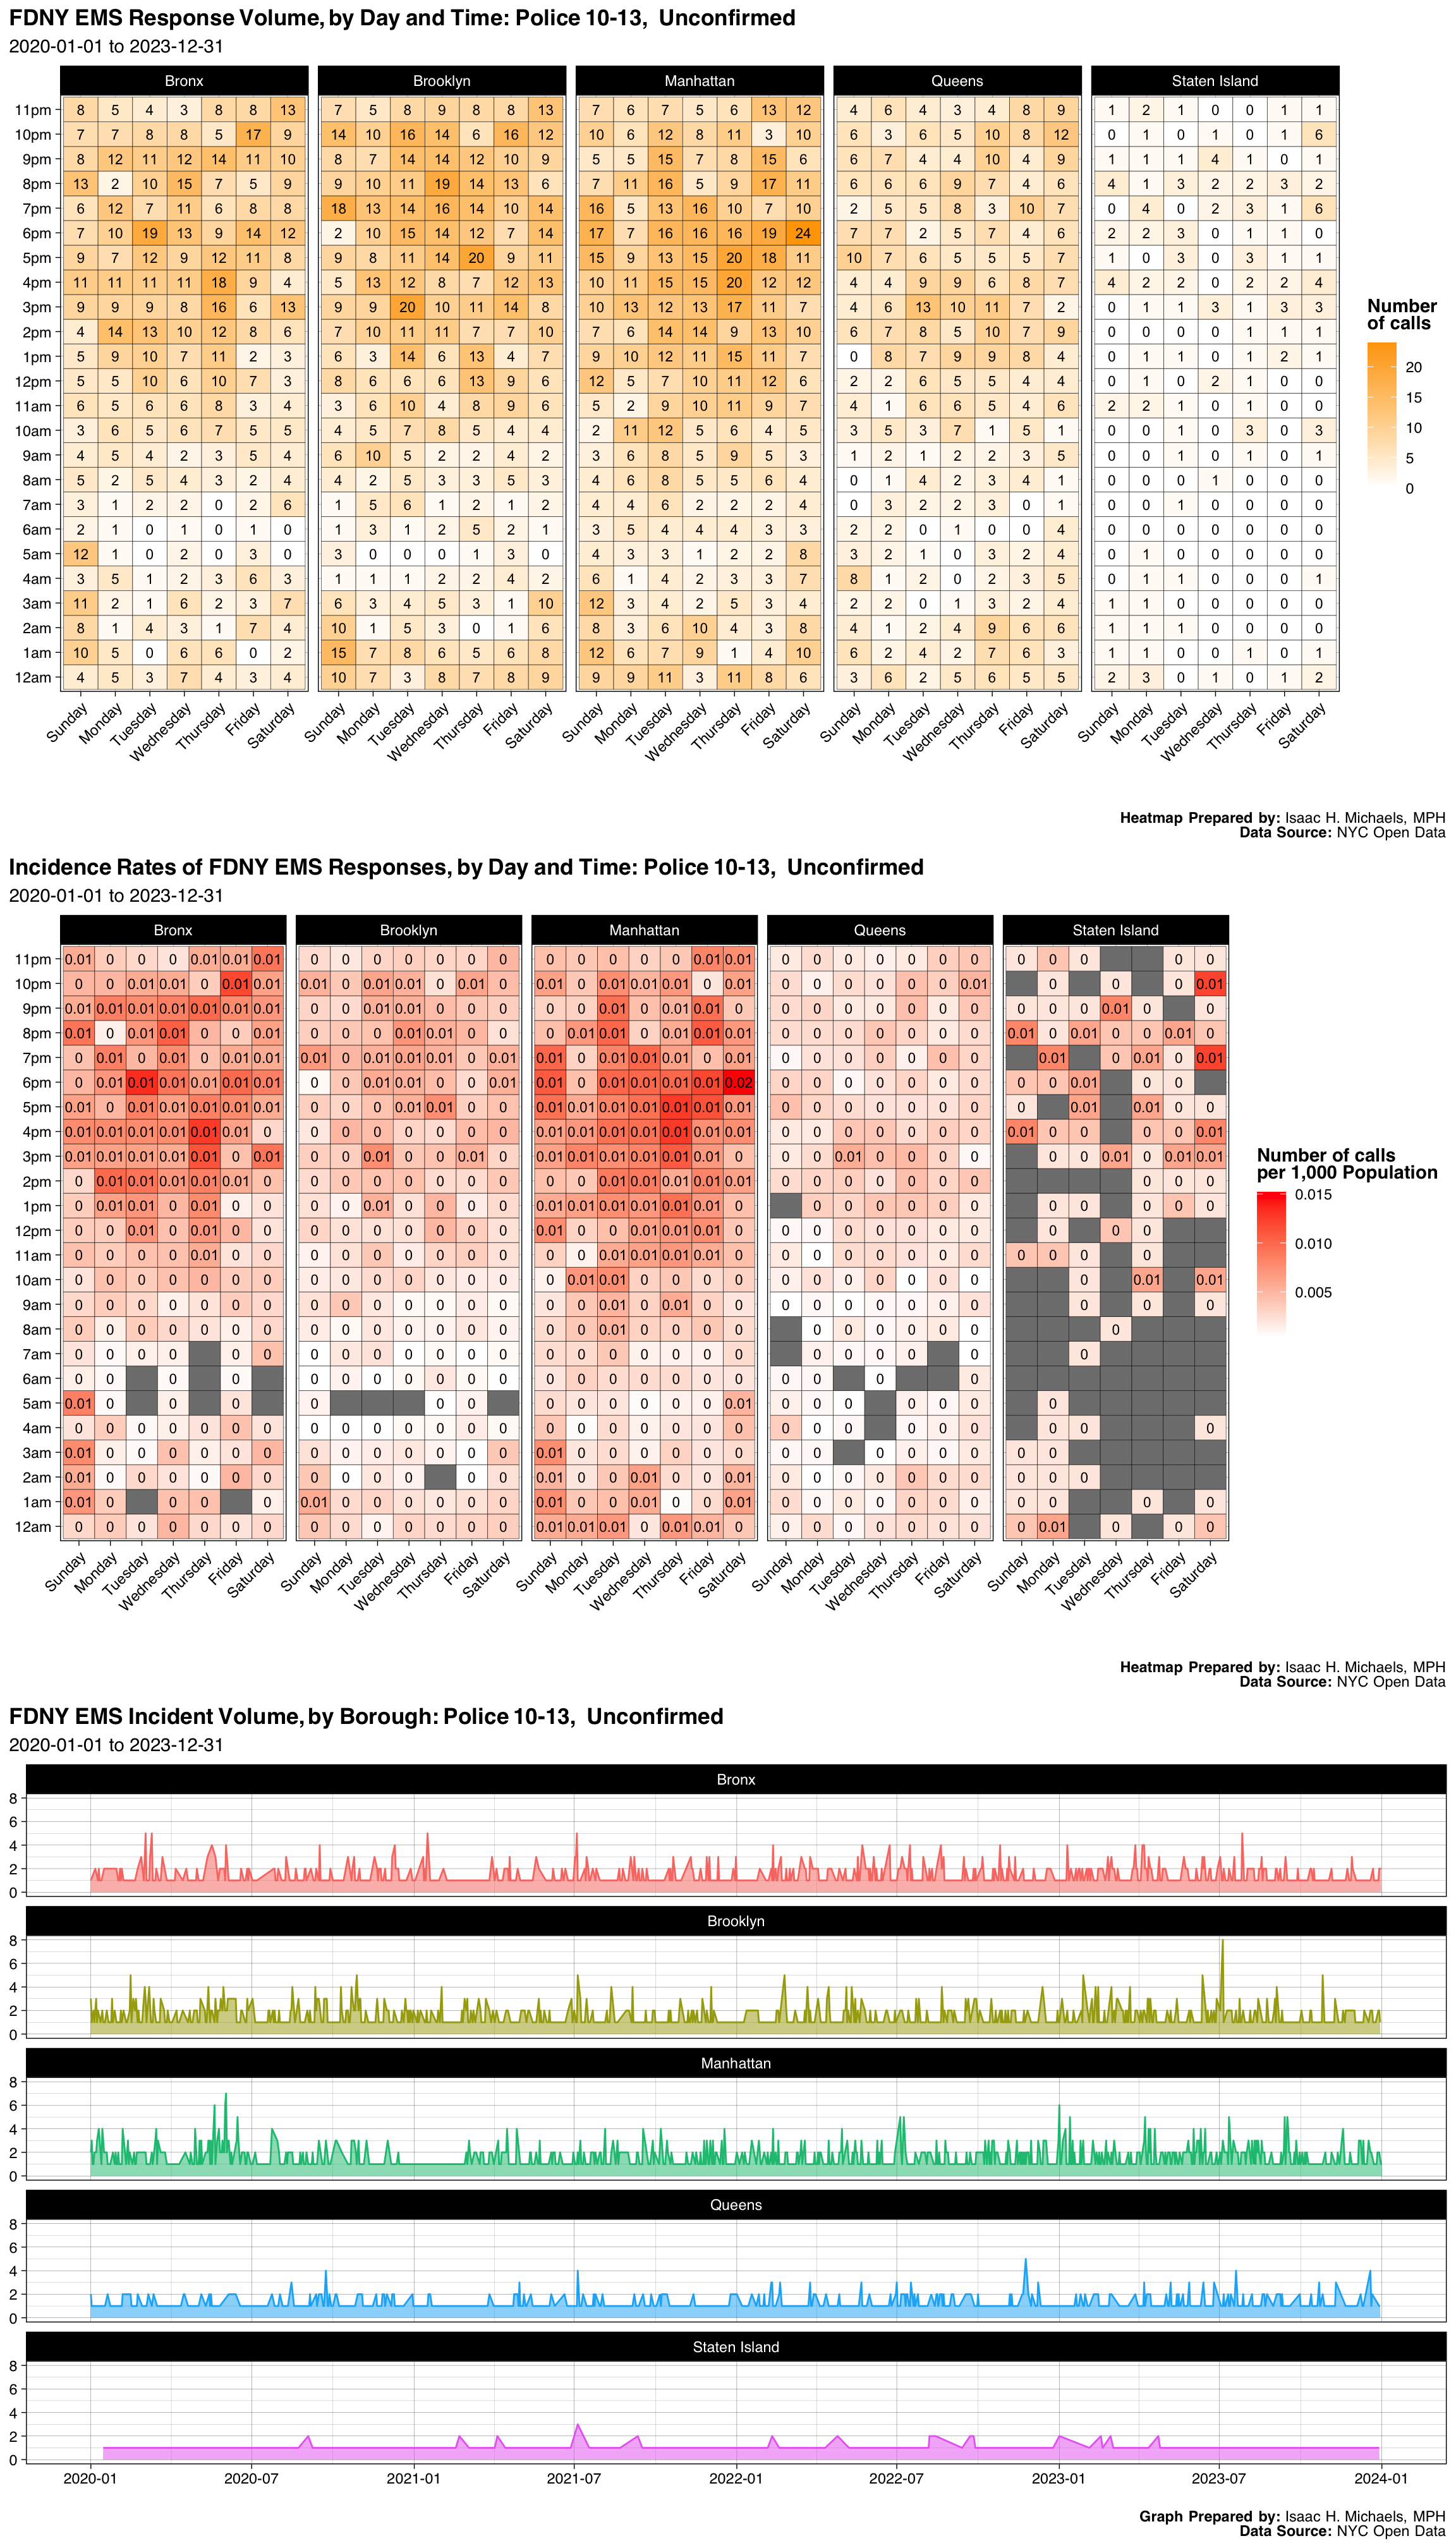
| Borough | Number | Percent |
|---|---|---|
| Bronx | 1072 | 0.2315335 |
| Brooklyn | 1235 | 0.2667387 |
| Manhattan | 1390 | 0.3002160 |
| Queens | 776 | 0.1676026 |
| Staten Island | 156 | 0.0336933 |
| Unknown | 1 | 0.0002160 |
| Final Severity Level | Number | Percent |
|---|---|---|
| 1 | 0 | 0% |
| 2 | 1 | 0.000215982721382289 |
| 3 | 5 | 0.00107991360691145 |
| 4 | 0 | 0% |
| 5 | 0 | 0% |
| 6 | 0 | 0% |
| 7 | 4624 | 0.998704103671706 |
| 8 | 0 | 0% |
| Disposition | Number | Percent |
|---|---|---|
| Unfounded | 1651 | 0.3565875 |
| Condition Corrected | 1192 | 0.2574514 |
| Cancelled | 696 | 0.1503240 |
| Transporting Patient | 451 | 0.0974082 |
| Other | 313 | 0.0676026 |
| Refused Medical Aid | 235 | 0.0507559 |
| Patient Gone on Arrival | 90 | 0.0194384 |
| Patient Pronounced Dead | 1 | 0.0002160 |
| Treated and Transported | 1 | 0.0002160 |
Graphs, Heatmaps, and Tables Prepared By: Isaac H. Michaels, MPH
Data Source: NYC Open Data
Back to top
Auto Accident, No Confirmd Inj
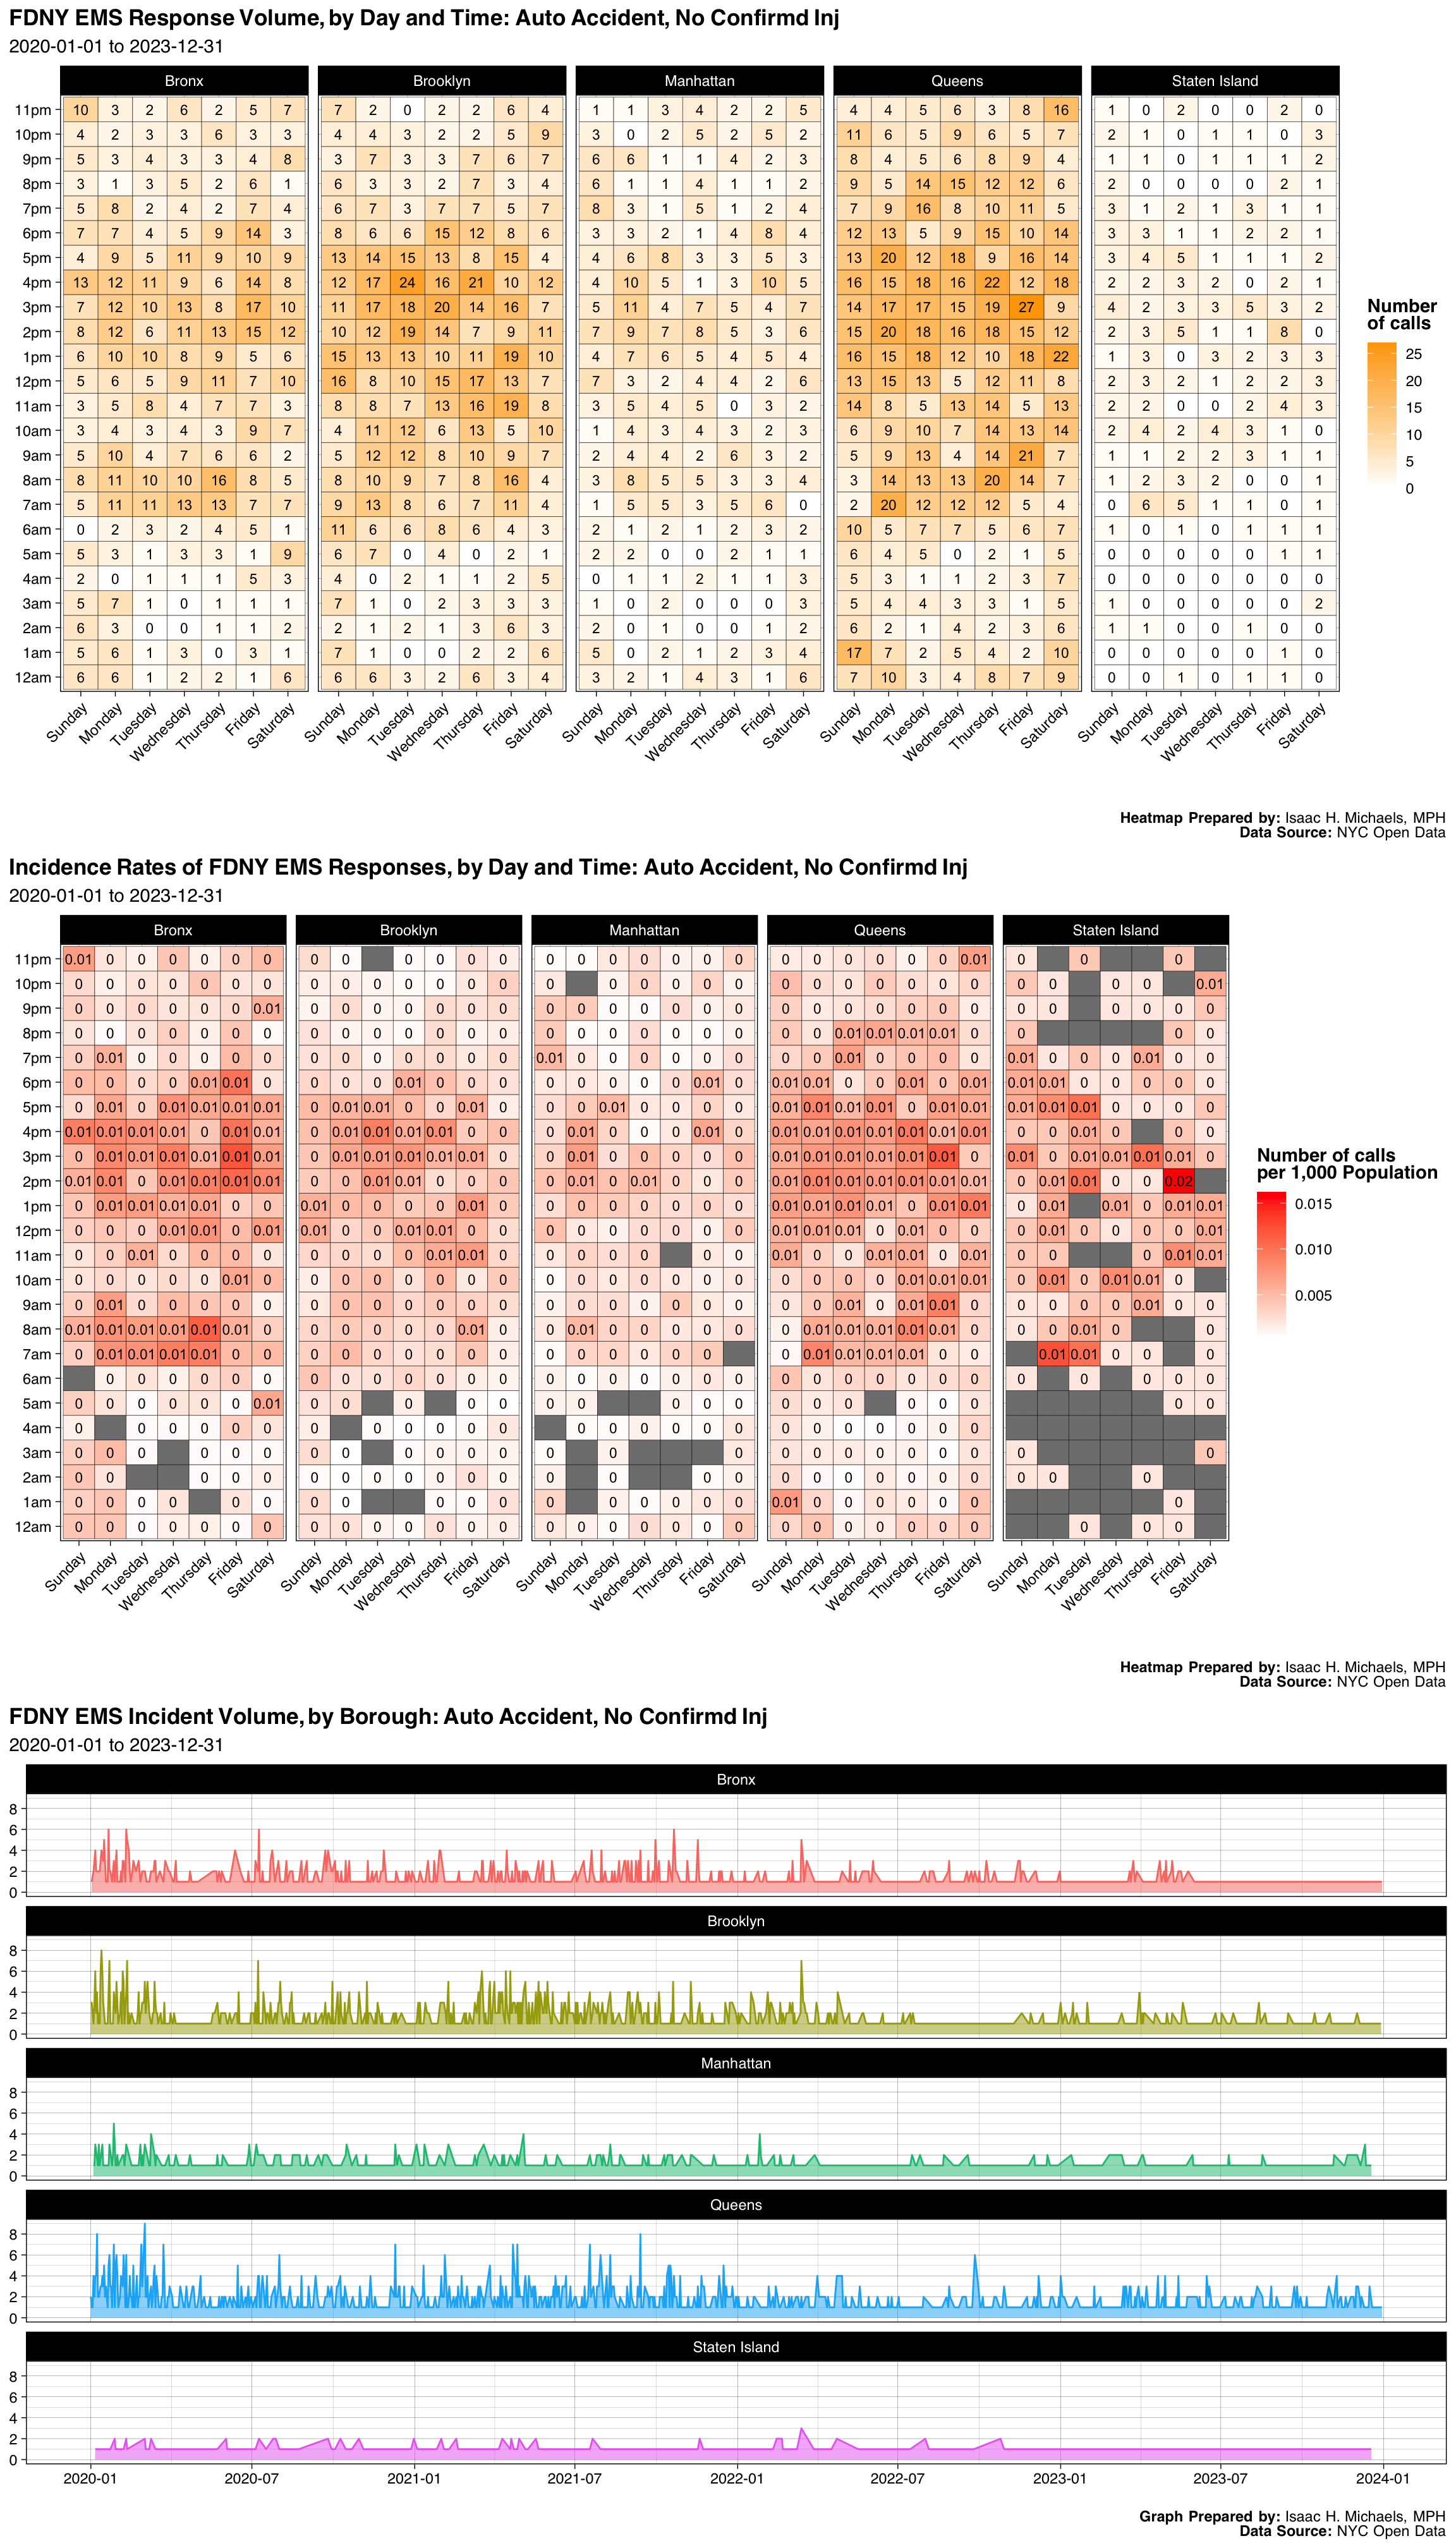
| Borough | Number | Percent |
|---|---|---|
| Bronx | 954 | 0.2077074 |
| Brooklyn | 1262 | 0.2747659 |
| Manhattan | 546 | 0.1188766 |
| Queens | 1600 | 0.3483562 |
| Staten Island | 231 | 0.0502939 |
| Final Severity Level | Number | Percent |
|---|---|---|
| 1 | 0 | 0% |
| 2 | 1 | 0.000217722621380361 |
| 3 | 0 | 0% |
| 4 | 5 | 0.00108861310690181 |
| 5 | 0 | 0% |
| 6 | 4587 | 0.998693664271718 |
| 7 | 0 | 0% |
| 8 | 0 | 0% |
| Disposition | Number | Percent |
|---|---|---|
| Condition Corrected | 1292 | 0.2812976 |
| Refused Medical Aid | 1202 | 0.2617026 |
| Transporting Patient | 982 | 0.2138036 |
| Unfounded | 417 | 0.0907903 |
| Cancelled | 337 | 0.0733725 |
| Other | 268 | 0.0583497 |
| Patient Gone on Arrival | 91 | 0.0198128 |
| Treated and Transported | 3 | 0.0006532 |
| Treated Not Transported | 1 | 0.0002177 |
Graphs, Heatmaps, and Tables Prepared By: Isaac H. Michaels, MPH
Data Source: NYC Open Data
Back to top
Internal Bleeding-Fever&Cough
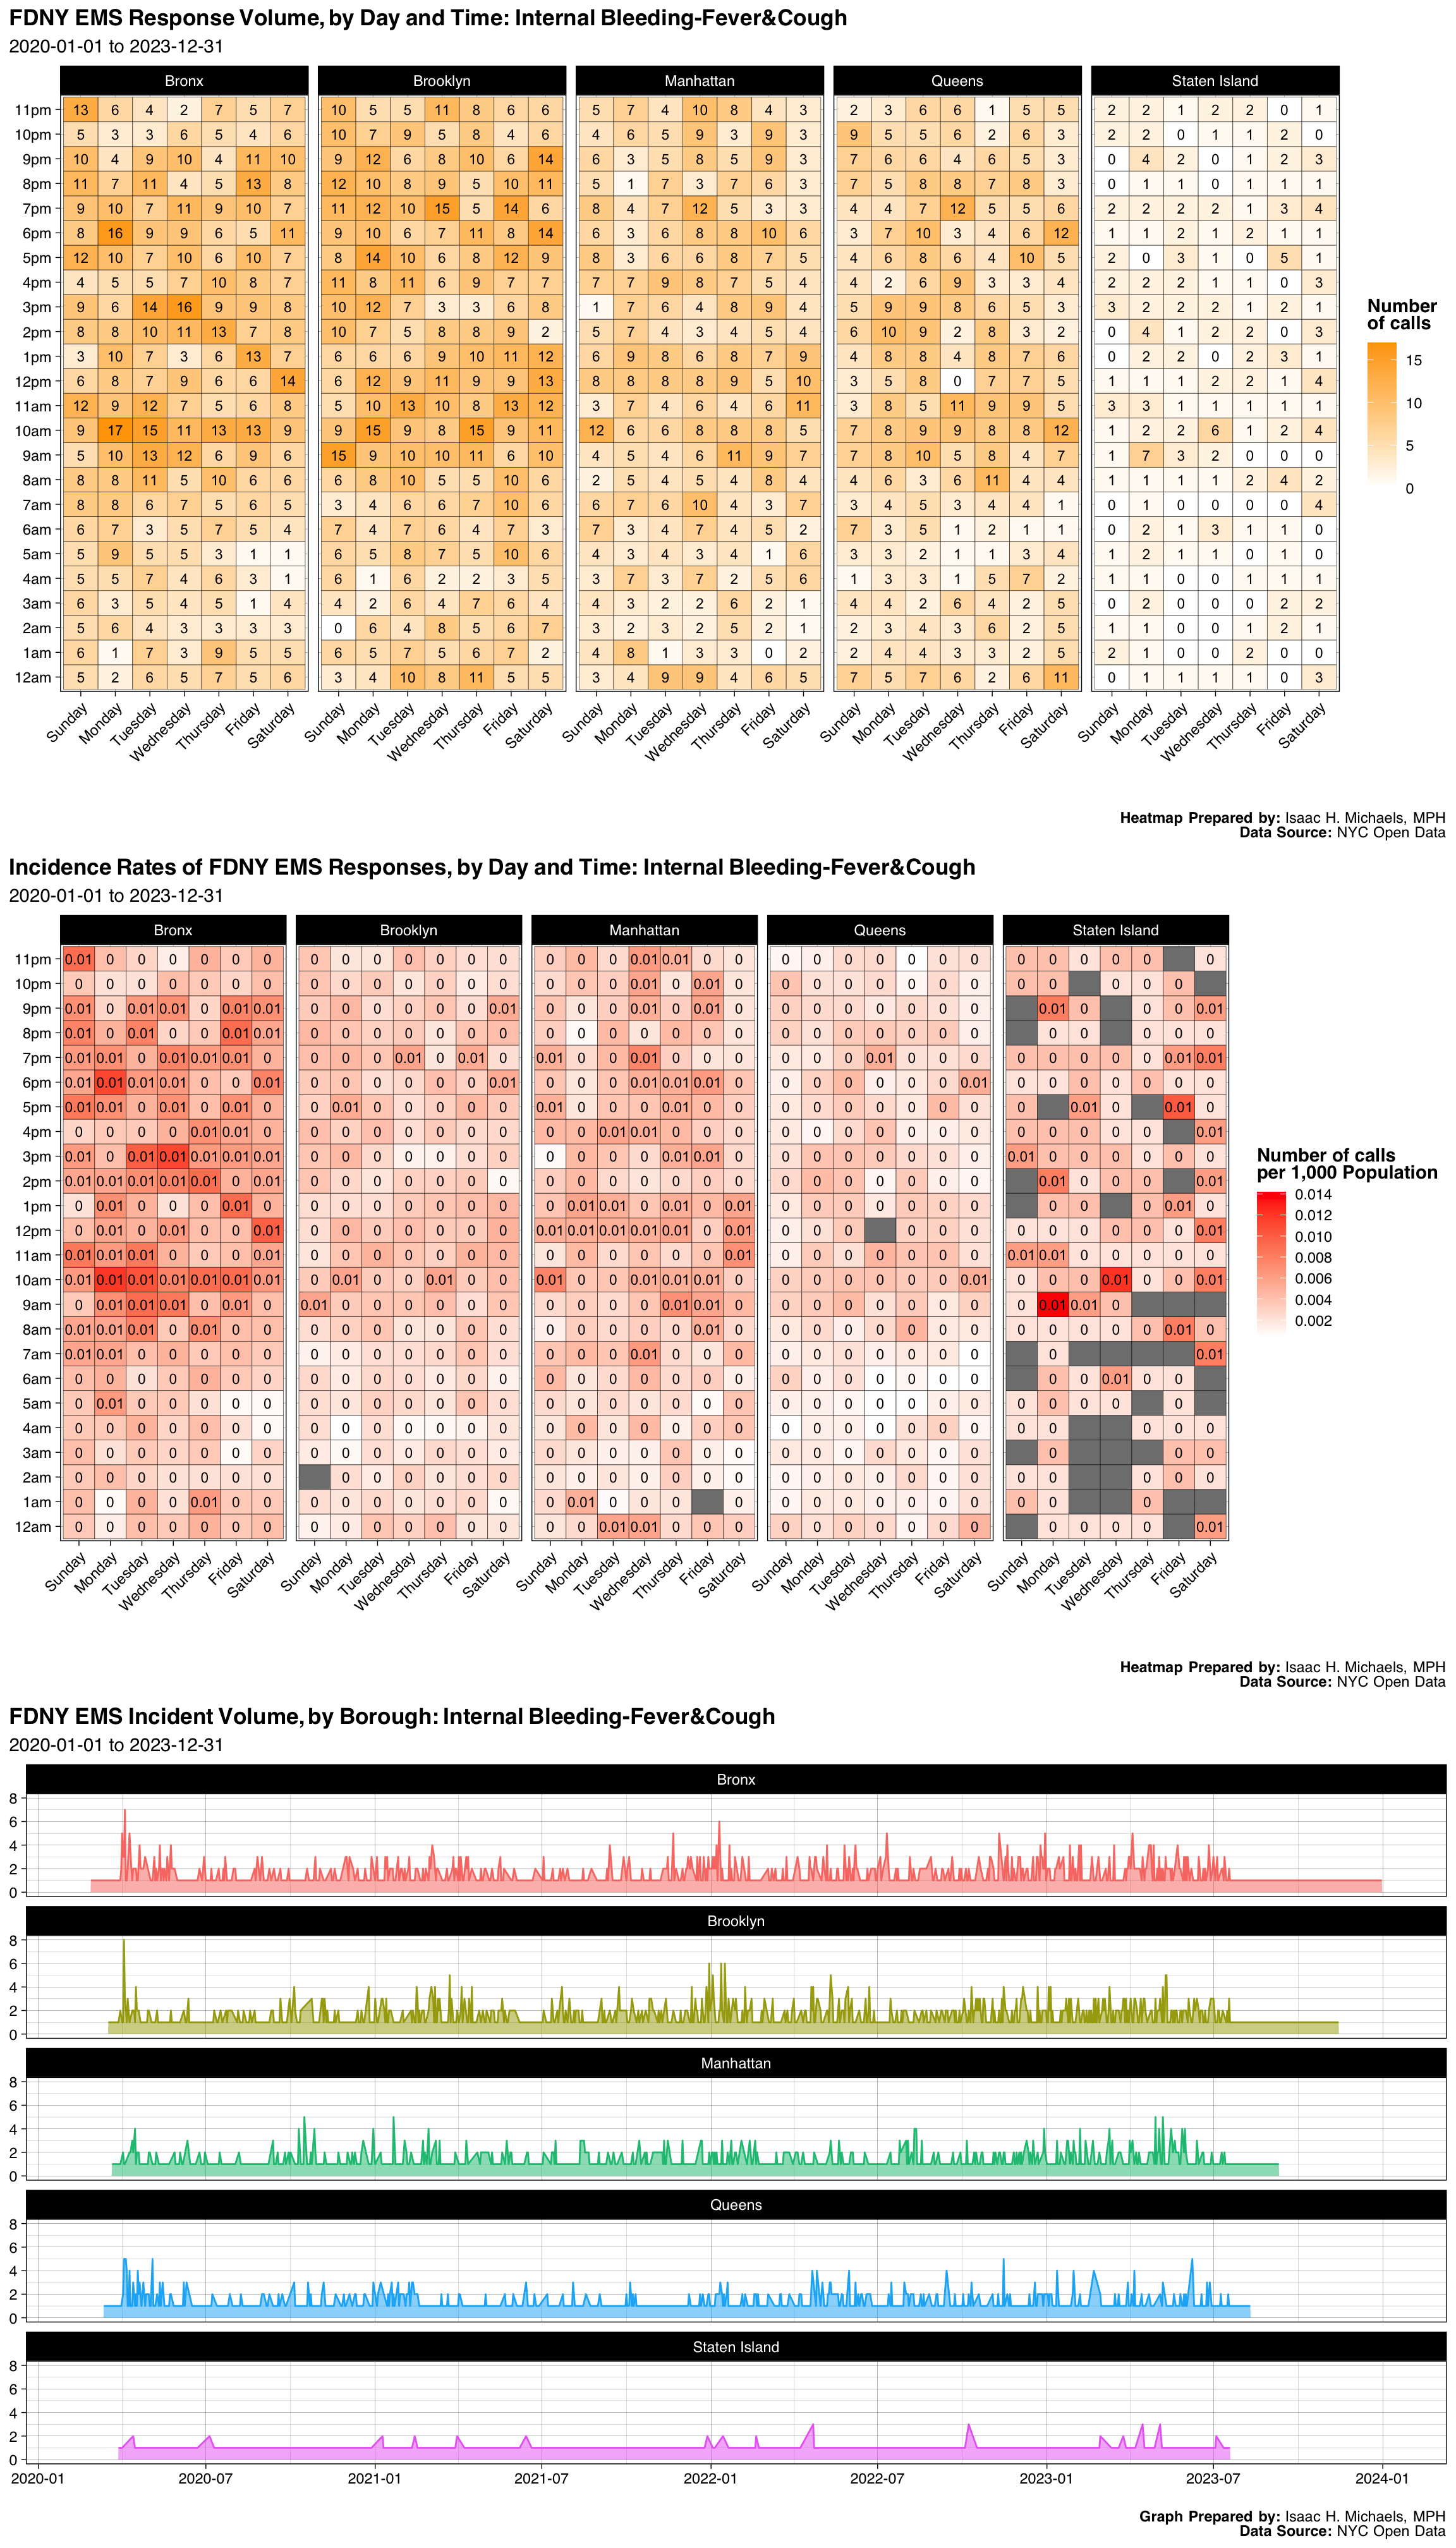
| Borough | Number | Percent |
|---|---|---|
| Bronx | 1199 | 0.2656769 |
| Brooklyn | 1294 | 0.2867272 |
| Manhattan | 914 | 0.2025260 |
| Queens | 874 | 0.1936628 |
| Staten Island | 232 | 0.0514070 |
| Final Severity Level | Number | Percent |
|---|---|---|
| 1 | 0 | 0% |
| 2 | 0 | 0% |
| 3 | 4511 | 0.999556835807667 |
| 4 | 2 | 0.000443164192333259 |
| 5 | 0 | 0% |
| 6 | 0 | 0% |
| 7 | 0 | 0% |
| 8 | 0 | 0% |
| Disposition | Number | Percent |
|---|---|---|
| Transporting Patient | 4087 | 0.9056060 |
| Refused Medical Aid | 309 | 0.0684689 |
| Unfounded | 80 | 0.0177266 |
| Patient Gone on Arrival | 12 | 0.0026590 |
| Cancelled | 11 | 0.0024374 |
| Condition Corrected | 6 | 0.0013295 |
| Treated and Transported | 4 | 0.0008863 |
| Other | 3 | 0.0006647 |
| Patient Pronounced Dead | 1 | 0.0002216 |
Graphs, Heatmaps, and Tables Prepared By: Isaac H. Michaels, MPH
Data Source: NYC Open Data
Back to top
Mult Or Prolong Seizur-Fev&Cou
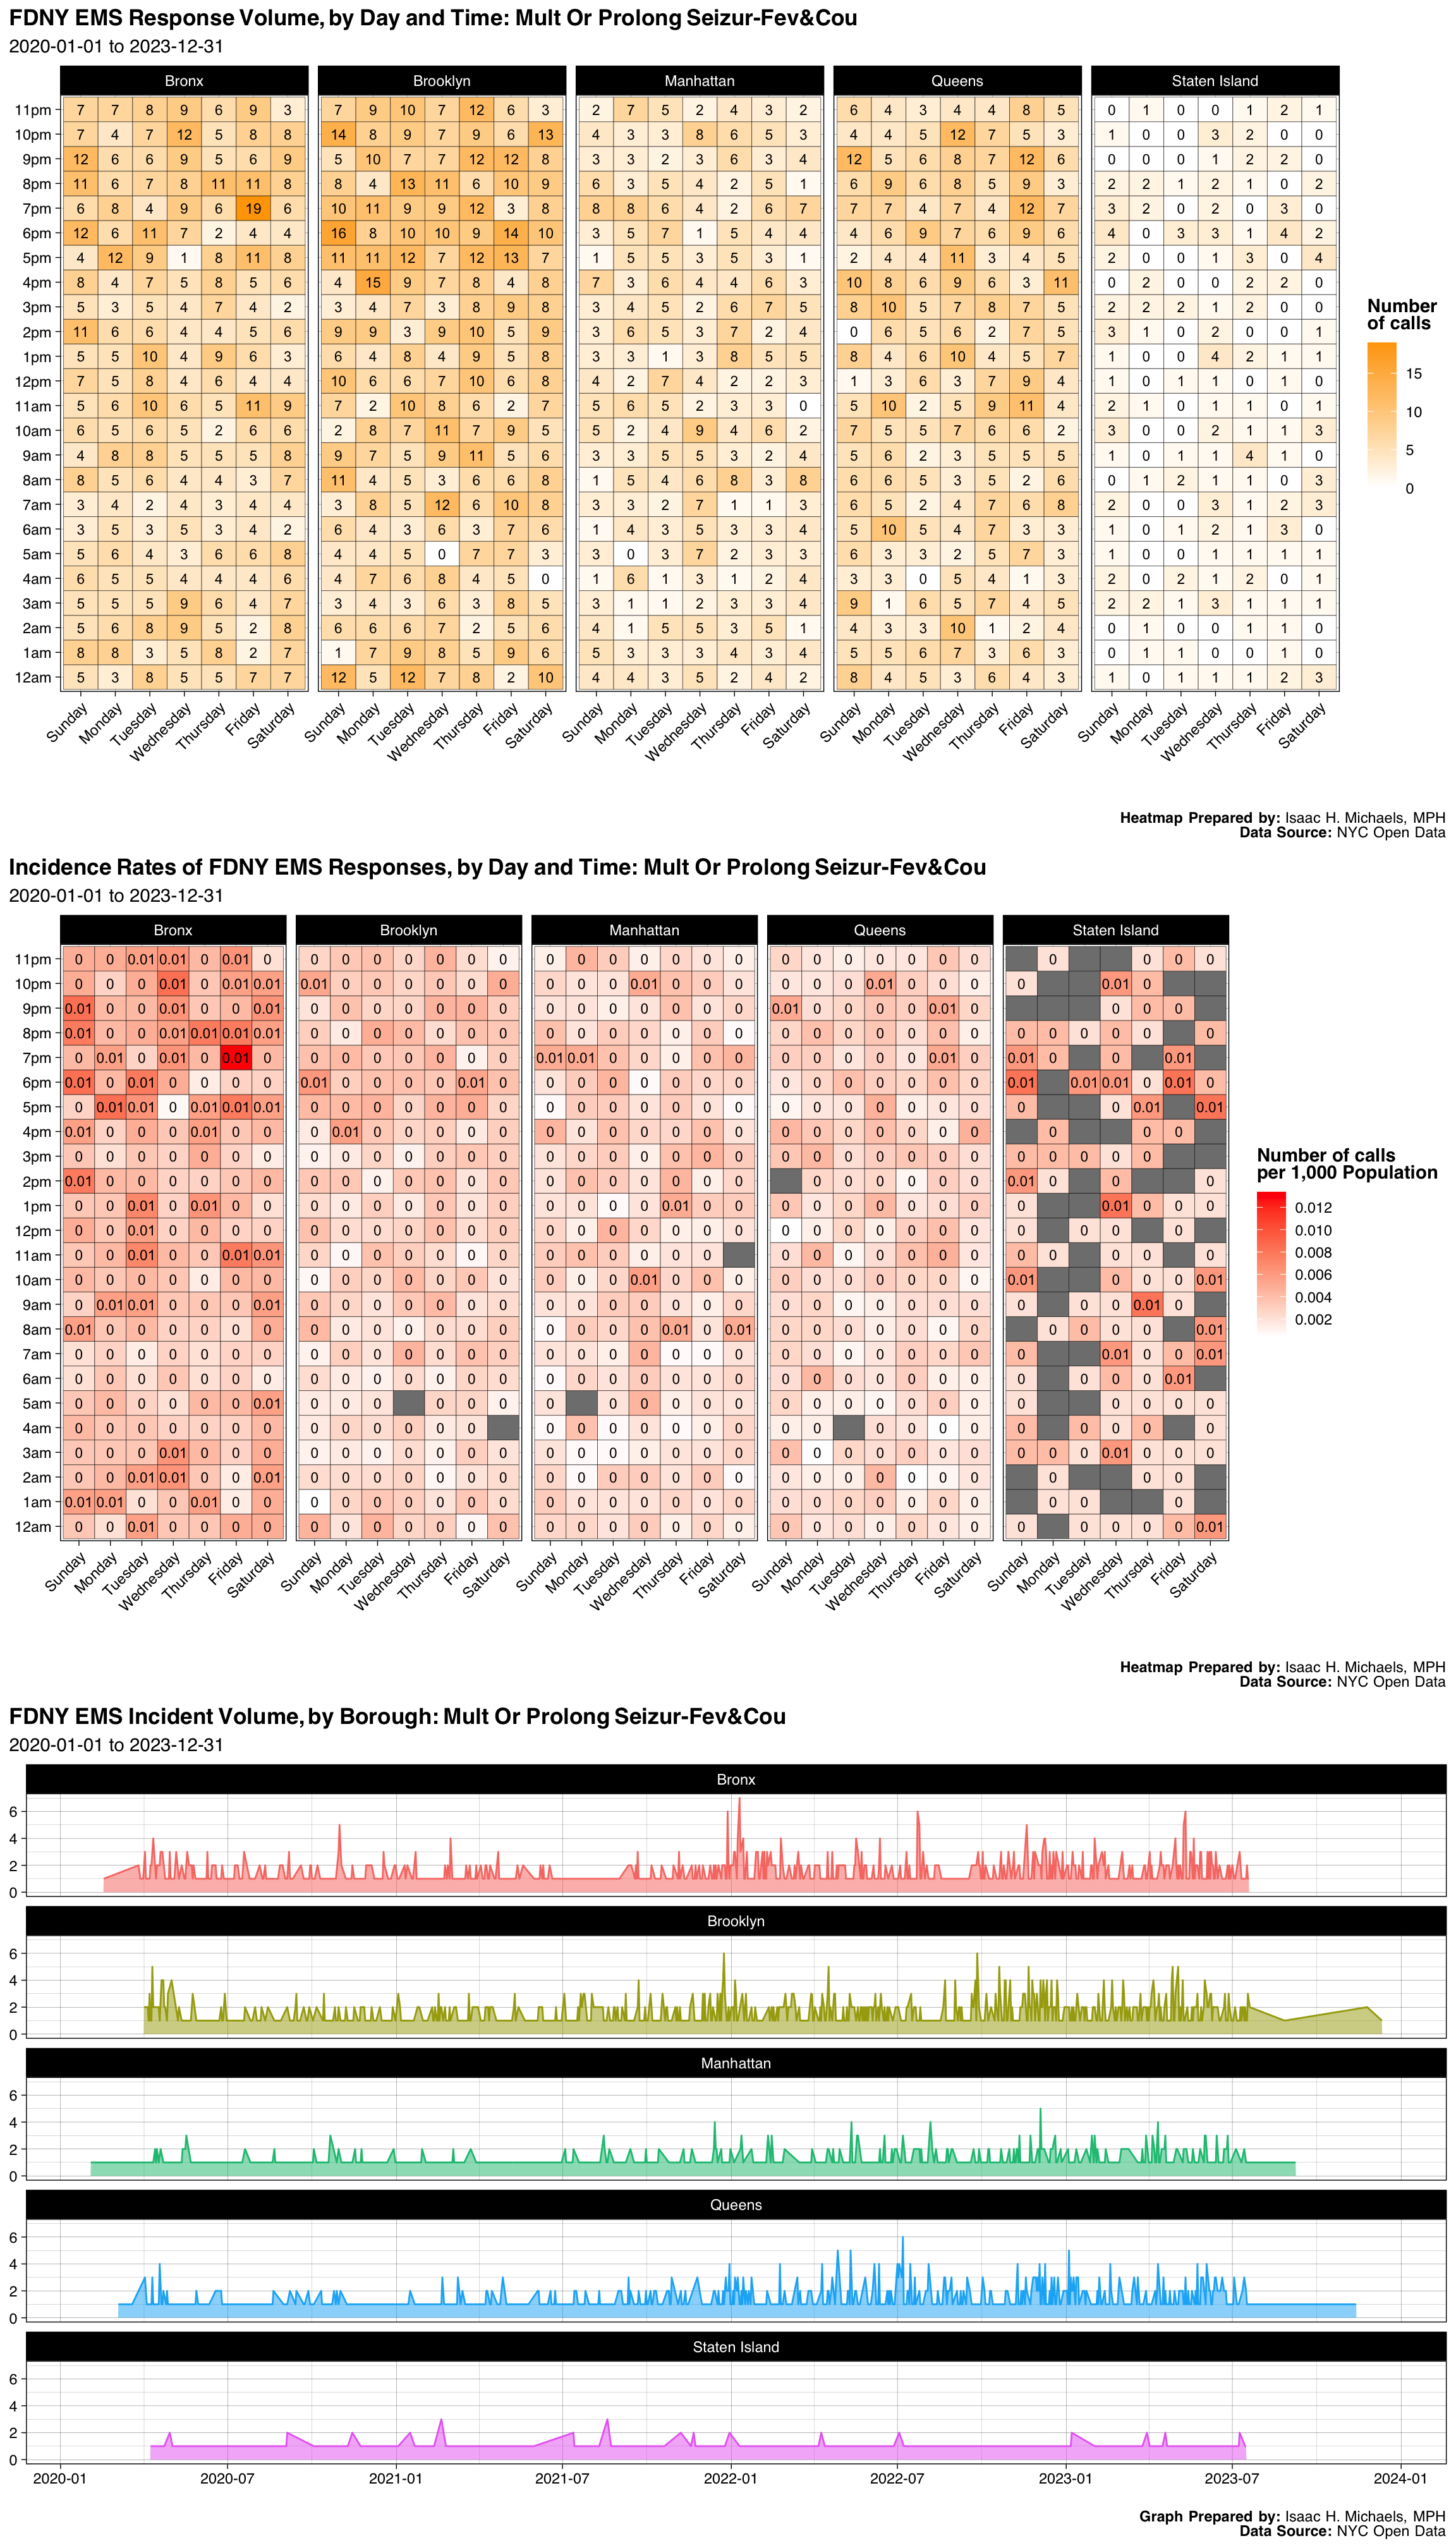
| Borough | Number | Percent |
|---|---|---|
| Bronx | 1021 | 0.2570493 |
| Brooklyn | 1210 | 0.3046324 |
| Manhattan | 635 | 0.1598691 |
| Queens | 918 | 0.2311178 |
| Staten Island | 188 | 0.0473313 |
| Final Severity Level | Number | Percent |
|---|---|---|
| 1 | 1 | 0.000251762336354481 |
| 2 | 3970 | 0.999496475327291 |
| 3 | 1 | 0.000251762336354481 |
| 4 | 0 | 0% |
| 5 | 0 | 0% |
| 6 | 0 | 0% |
| 7 | 0 | 0% |
| 8 | 0 | 0% |
| Disposition | Number | Percent |
|---|---|---|
| Transporting Patient | 3508 | 0.8831823 |
| Refused Medical Aid | 316 | 0.0795569 |
| Unfounded | 69 | 0.0173716 |
| Patient Gone on Arrival | 42 | 0.0105740 |
| Cancelled | 25 | 0.0062941 |
| Condition Corrected | 7 | 0.0017623 |
| Other | 3 | 0.0007553 |
| Treated and Transported | 2 | 0.0005035 |
Graphs, Heatmaps, and Tables Prepared By: Isaac H. Michaels, MPH
Data Source: NYC Open Data
Back to top
Jumper Up
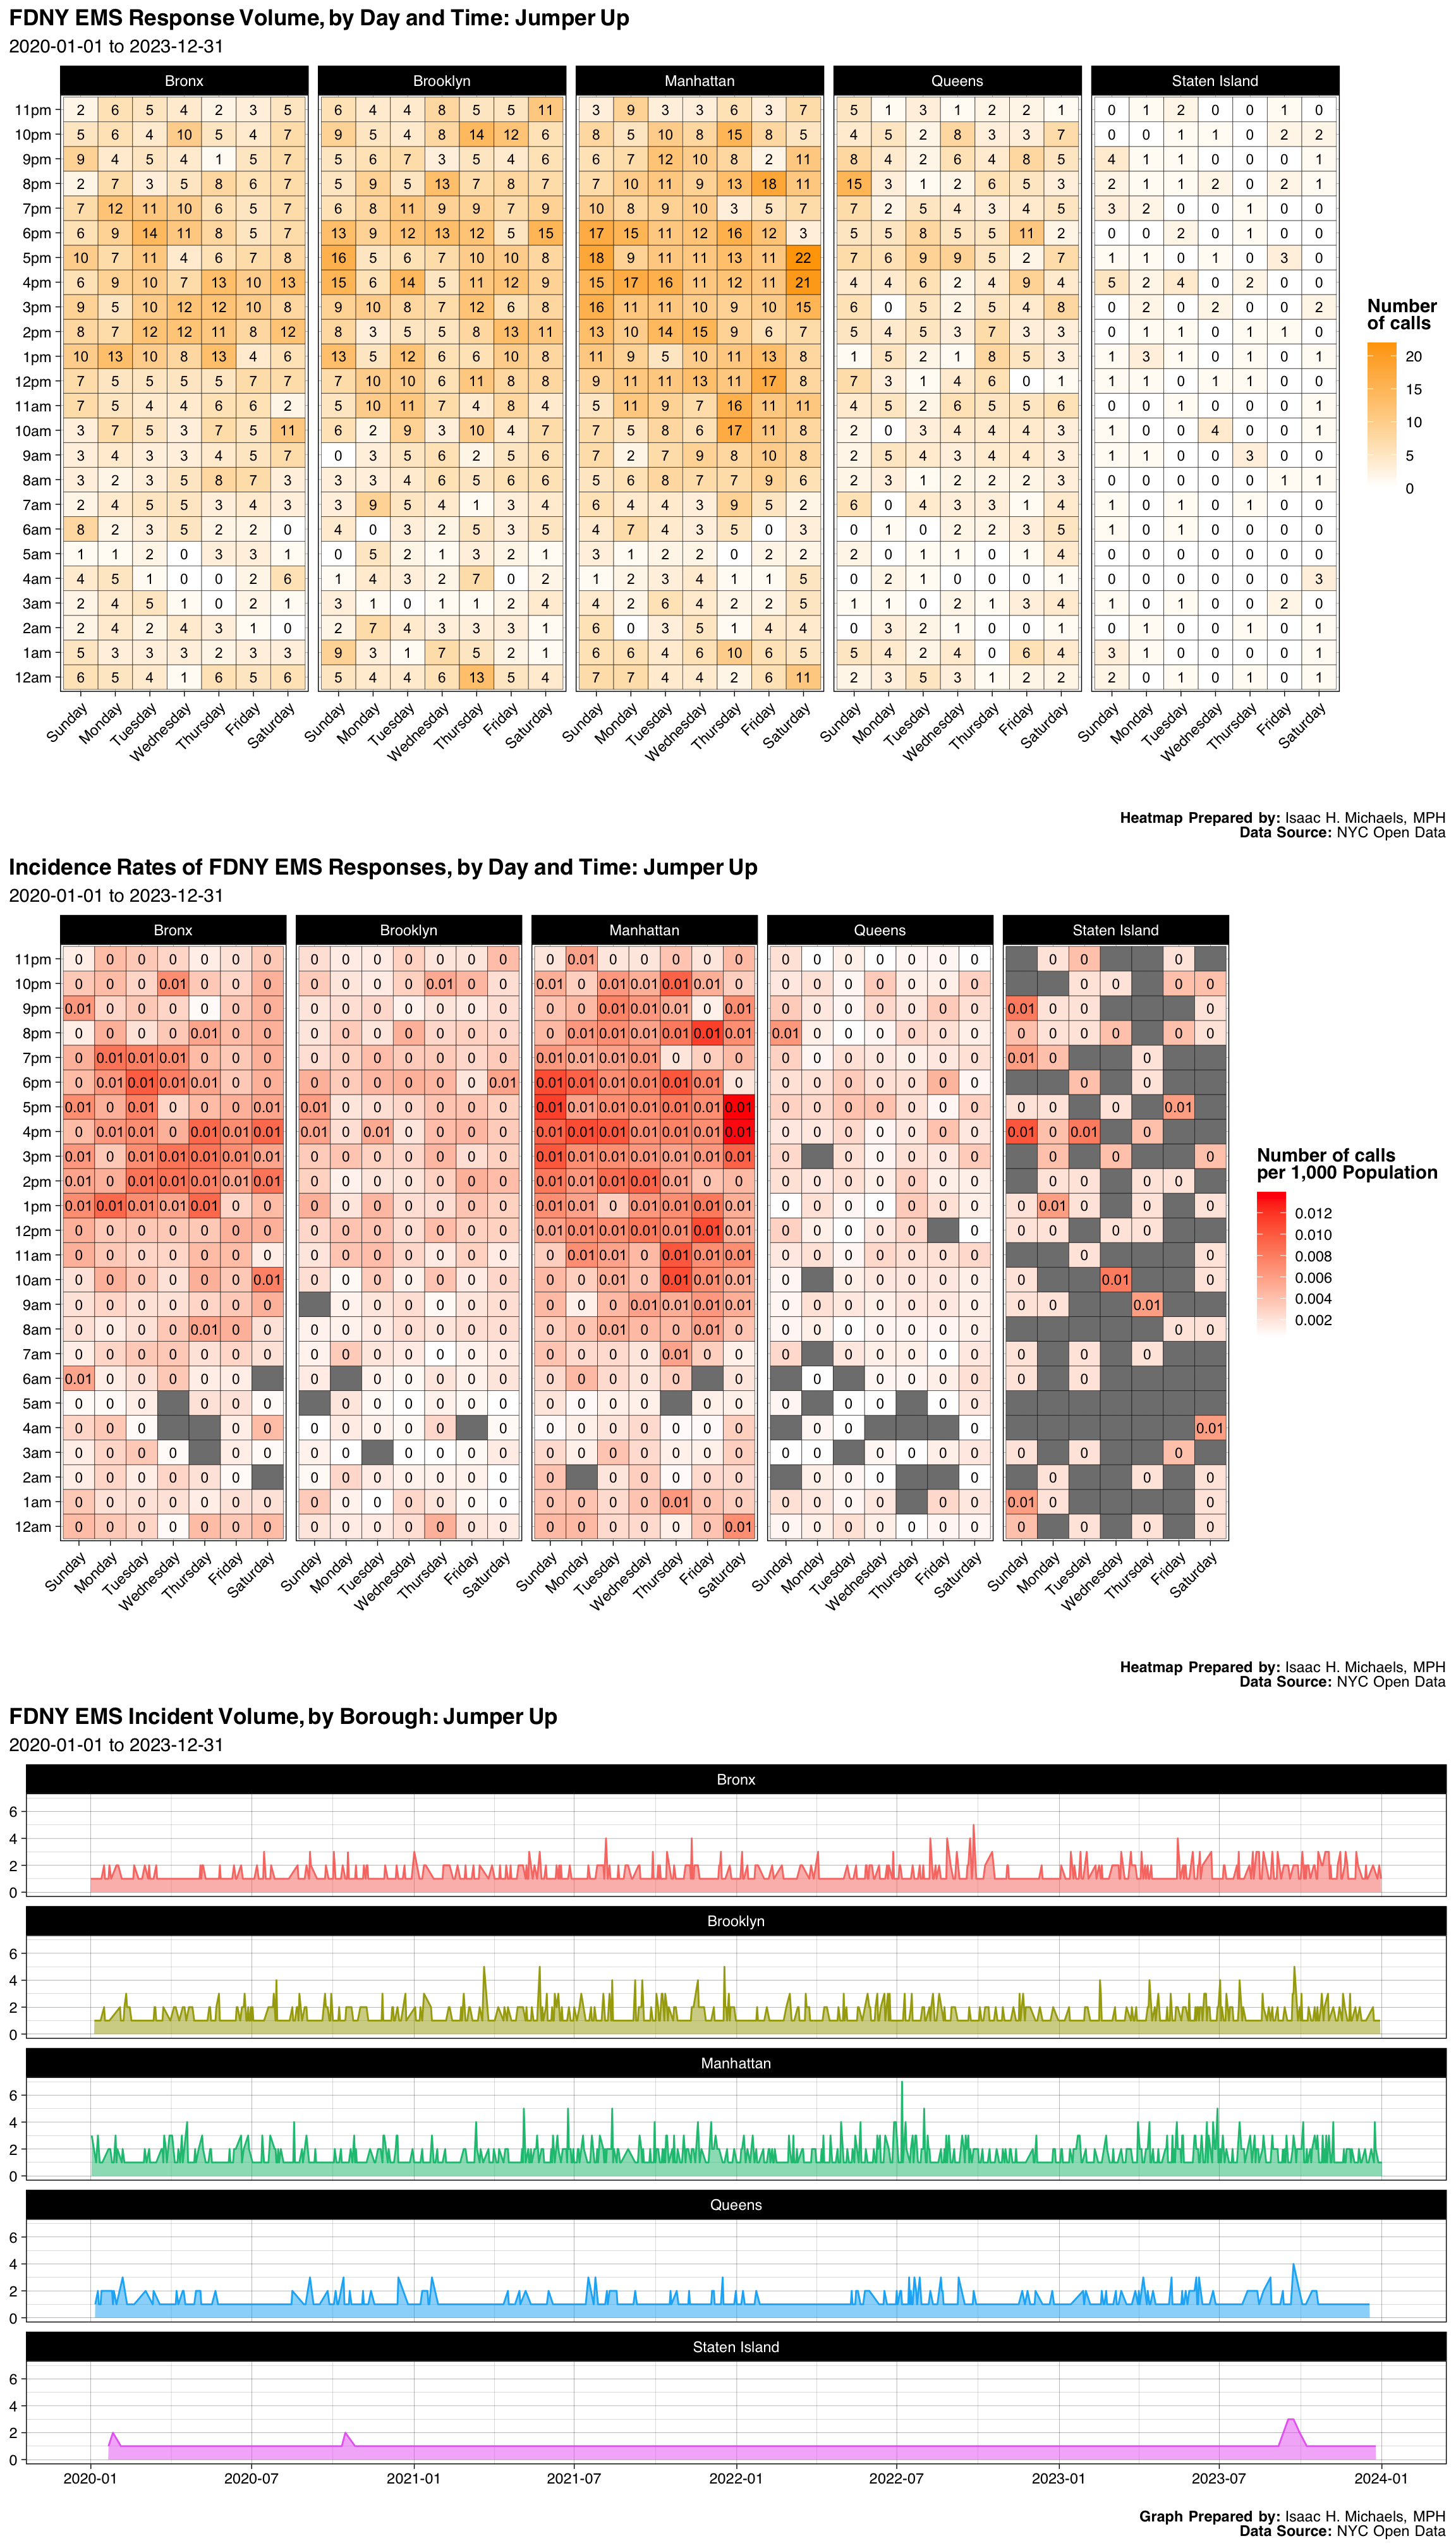
| Borough | Number | Percent |
|---|---|---|
| Bronx | 919 | 0.2318950 |
| Brooklyn | 1034 | 0.2609134 |
| Manhattan | 1318 | 0.3325763 |
| Queens | 577 | 0.1455968 |
| Staten Island | 115 | 0.0290184 |
| Final Severity Level | Number | Percent |
|---|---|---|
| 1 | 0 | 0% |
| 2 | 4 | 0.00100933636134242 |
| 3 | 12 | 0.00302800908402725 |
| 4 | 5 | 0.00126167045167802 |
| 5 | 3942 | 0.994700984102952 |
| 6 | 0 | 0% |
| 7 | 0 | 0% |
| 8 | 0 | 0% |
| Disposition | Number | Percent |
|---|---|---|
| Transporting Patient | 1667 | 0.4206409 |
| Unfounded | 1416 | 0.3573051 |
| Condition Corrected | 249 | 0.0628312 |
| Patient Gone on Arrival | 214 | 0.0539995 |
| Cancelled | 197 | 0.0497098 |
| Refused Medical Aid | 130 | 0.0328034 |
| Other | 82 | 0.0206914 |
| Patient Pronounced Dead | 6 | 0.0015140 |
| Treated and Transported | 2 | 0.0005047 |
Graphs, Heatmaps, and Tables Prepared By: Isaac H. Michaels, MPH
Data Source: NYC Open Data
Back to top
Jumper Down
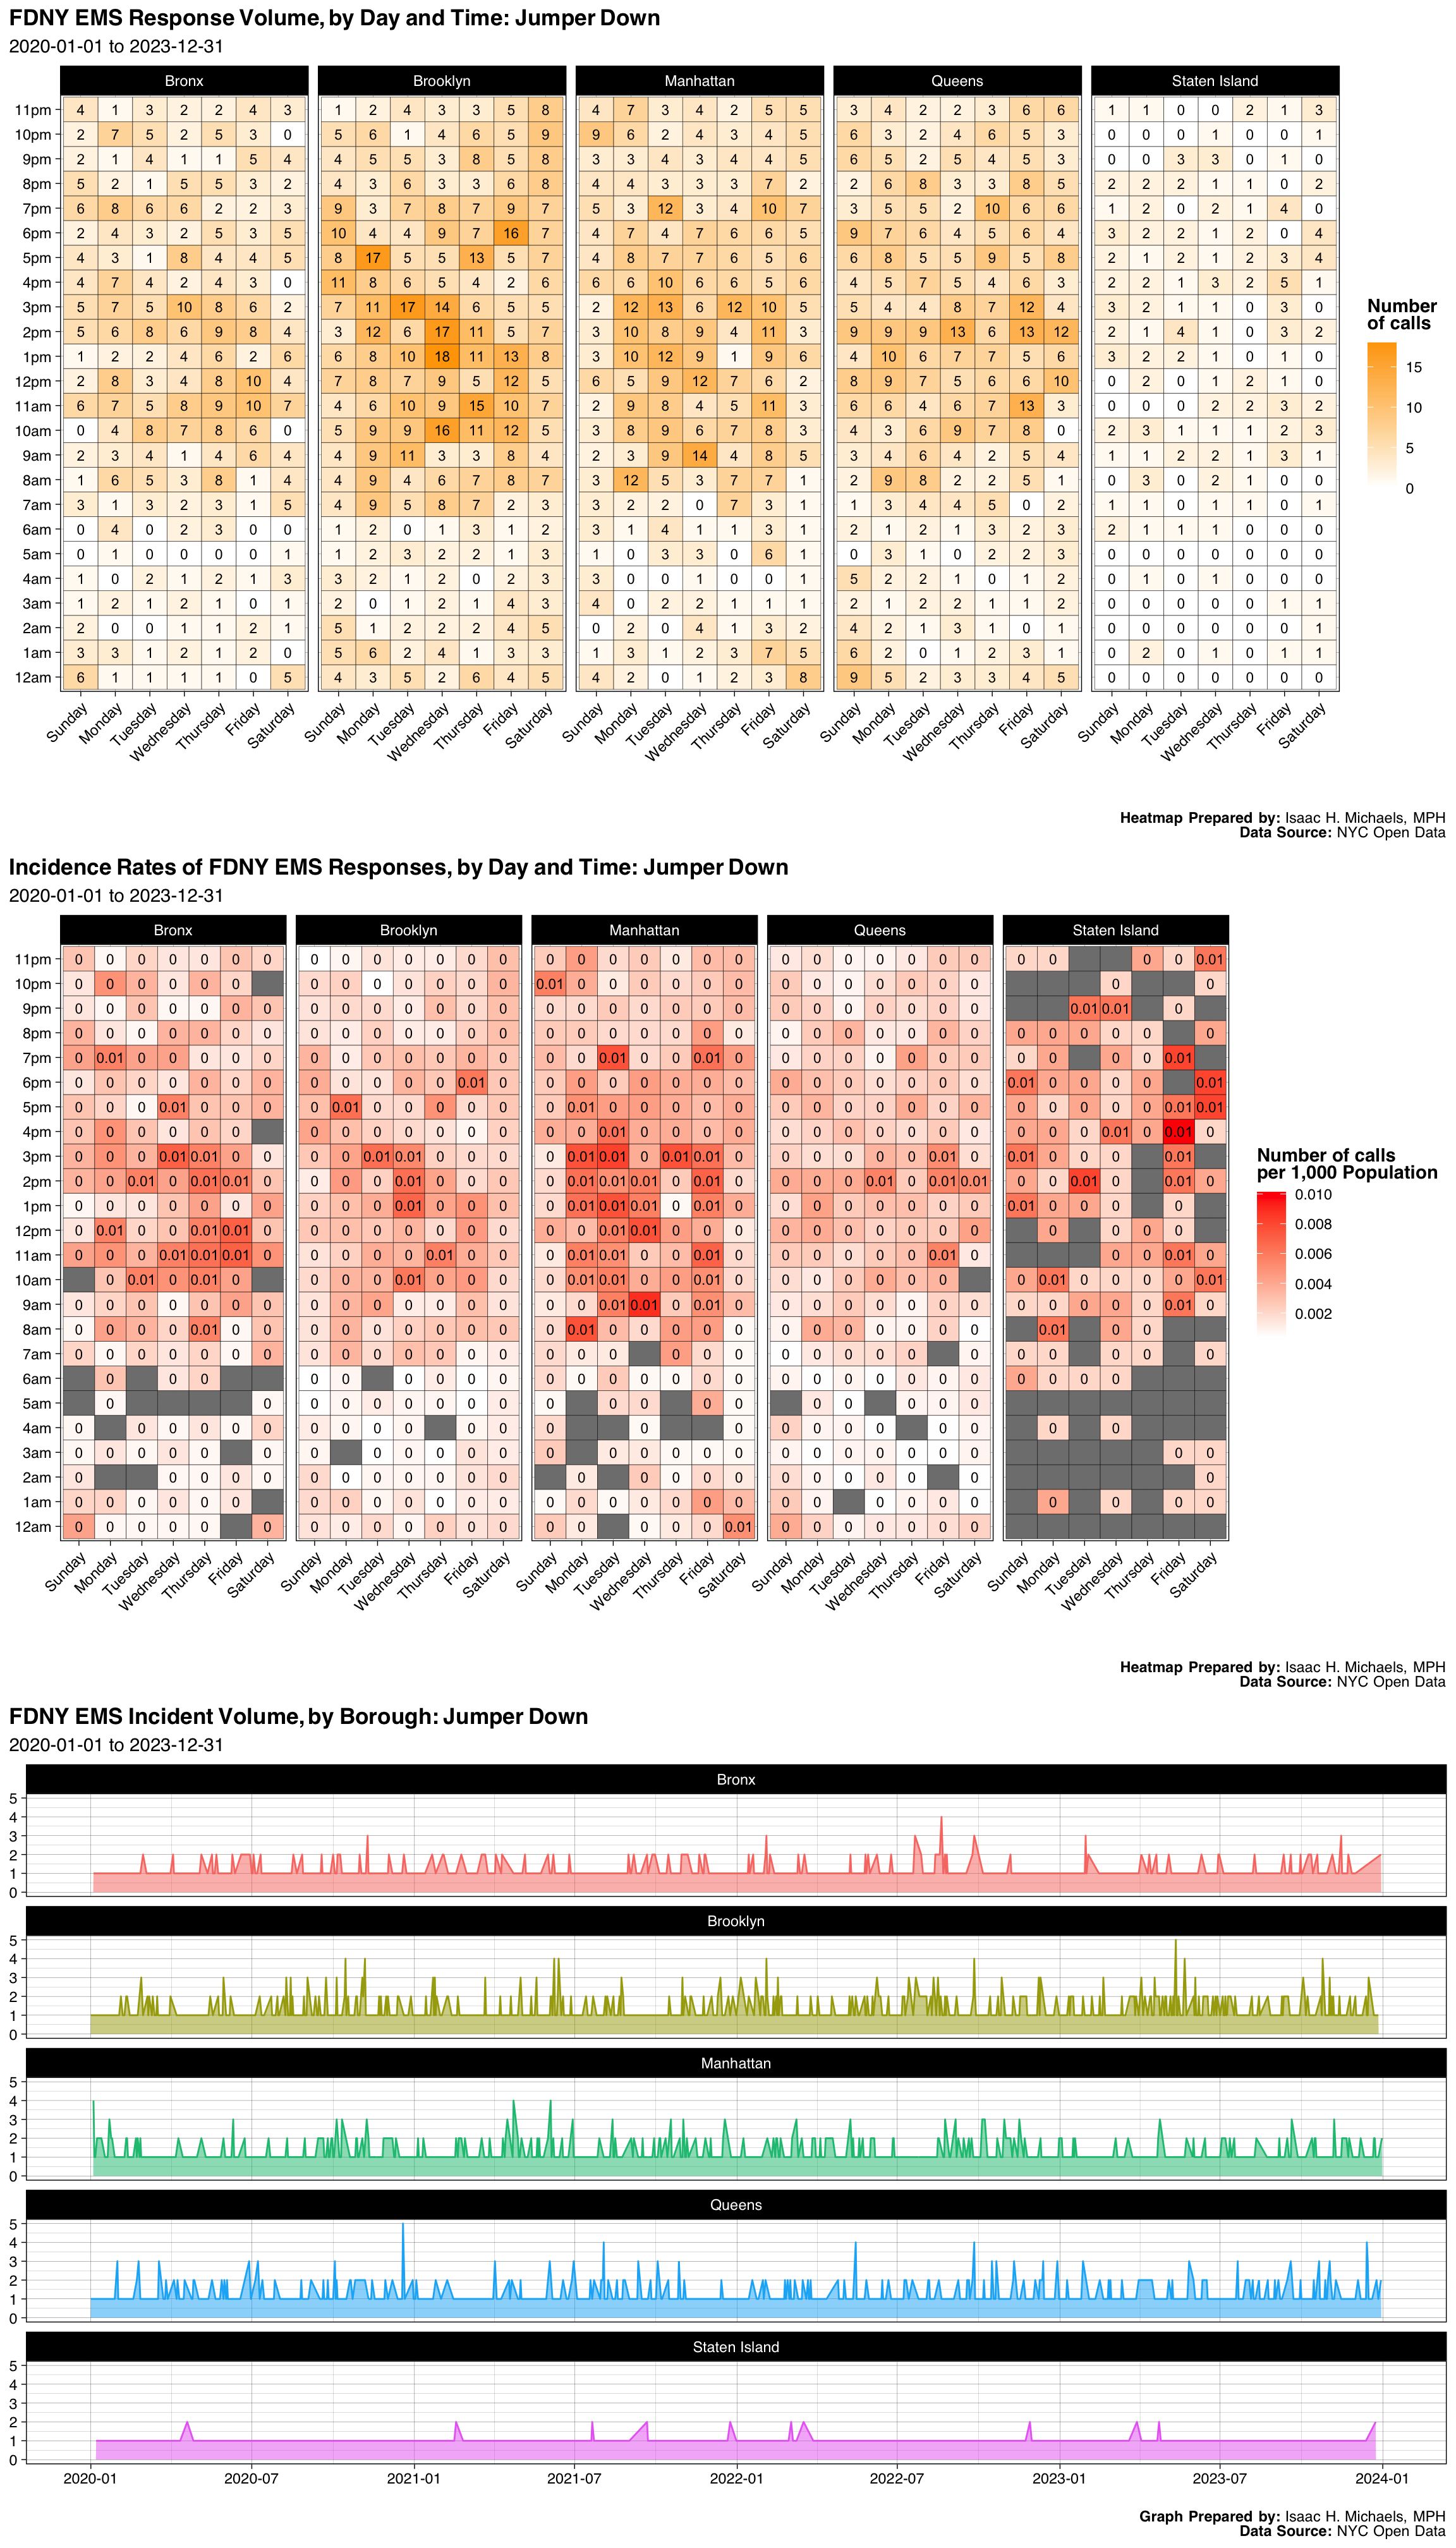
| Borough | Number | Percent |
|---|---|---|
| Bronx | 563 | 0.1735512 |
| Brooklyn | 972 | 0.2996301 |
| Manhattan | 776 | 0.2392109 |
| Queens | 754 | 0.2324291 |
| Staten Island | 179 | 0.0551788 |
| Final Severity Level | Number | Percent |
|---|---|---|
| 1 | 0 | 0% |
| 2 | 3239 | 0.99845869297164 |
| 3 | 2 | 0.00061652281134402 |
| 4 | 3 | 0.00092478421701603 |
| 5 | 0 | 0% |
| 6 | 0 | 0% |
| 7 | 0 | 0% |
| 8 | 0 | 0% |
| Disposition | Number | Percent |
|---|---|---|
| Transporting Patient | 2652 | 0.8175092 |
| Unfounded | 184 | 0.0567201 |
| Refused Medical Aid | 179 | 0.0551788 |
| Patient Gone on Arrival | 72 | 0.0221948 |
| Patient Pronounced Dead | 70 | 0.0215783 |
| Cancelled | 58 | 0.0178792 |
| Condition Corrected | 17 | 0.0052404 |
| Other | 9 | 0.0027744 |
| Treated and Transported | 3 | 0.0009248 |
Graphs, Heatmaps, and Tables Prepared By: Isaac H. Michaels, MPH
Data Source: NYC Open Data
Back to top
Stroke Critical - Fever&Cough
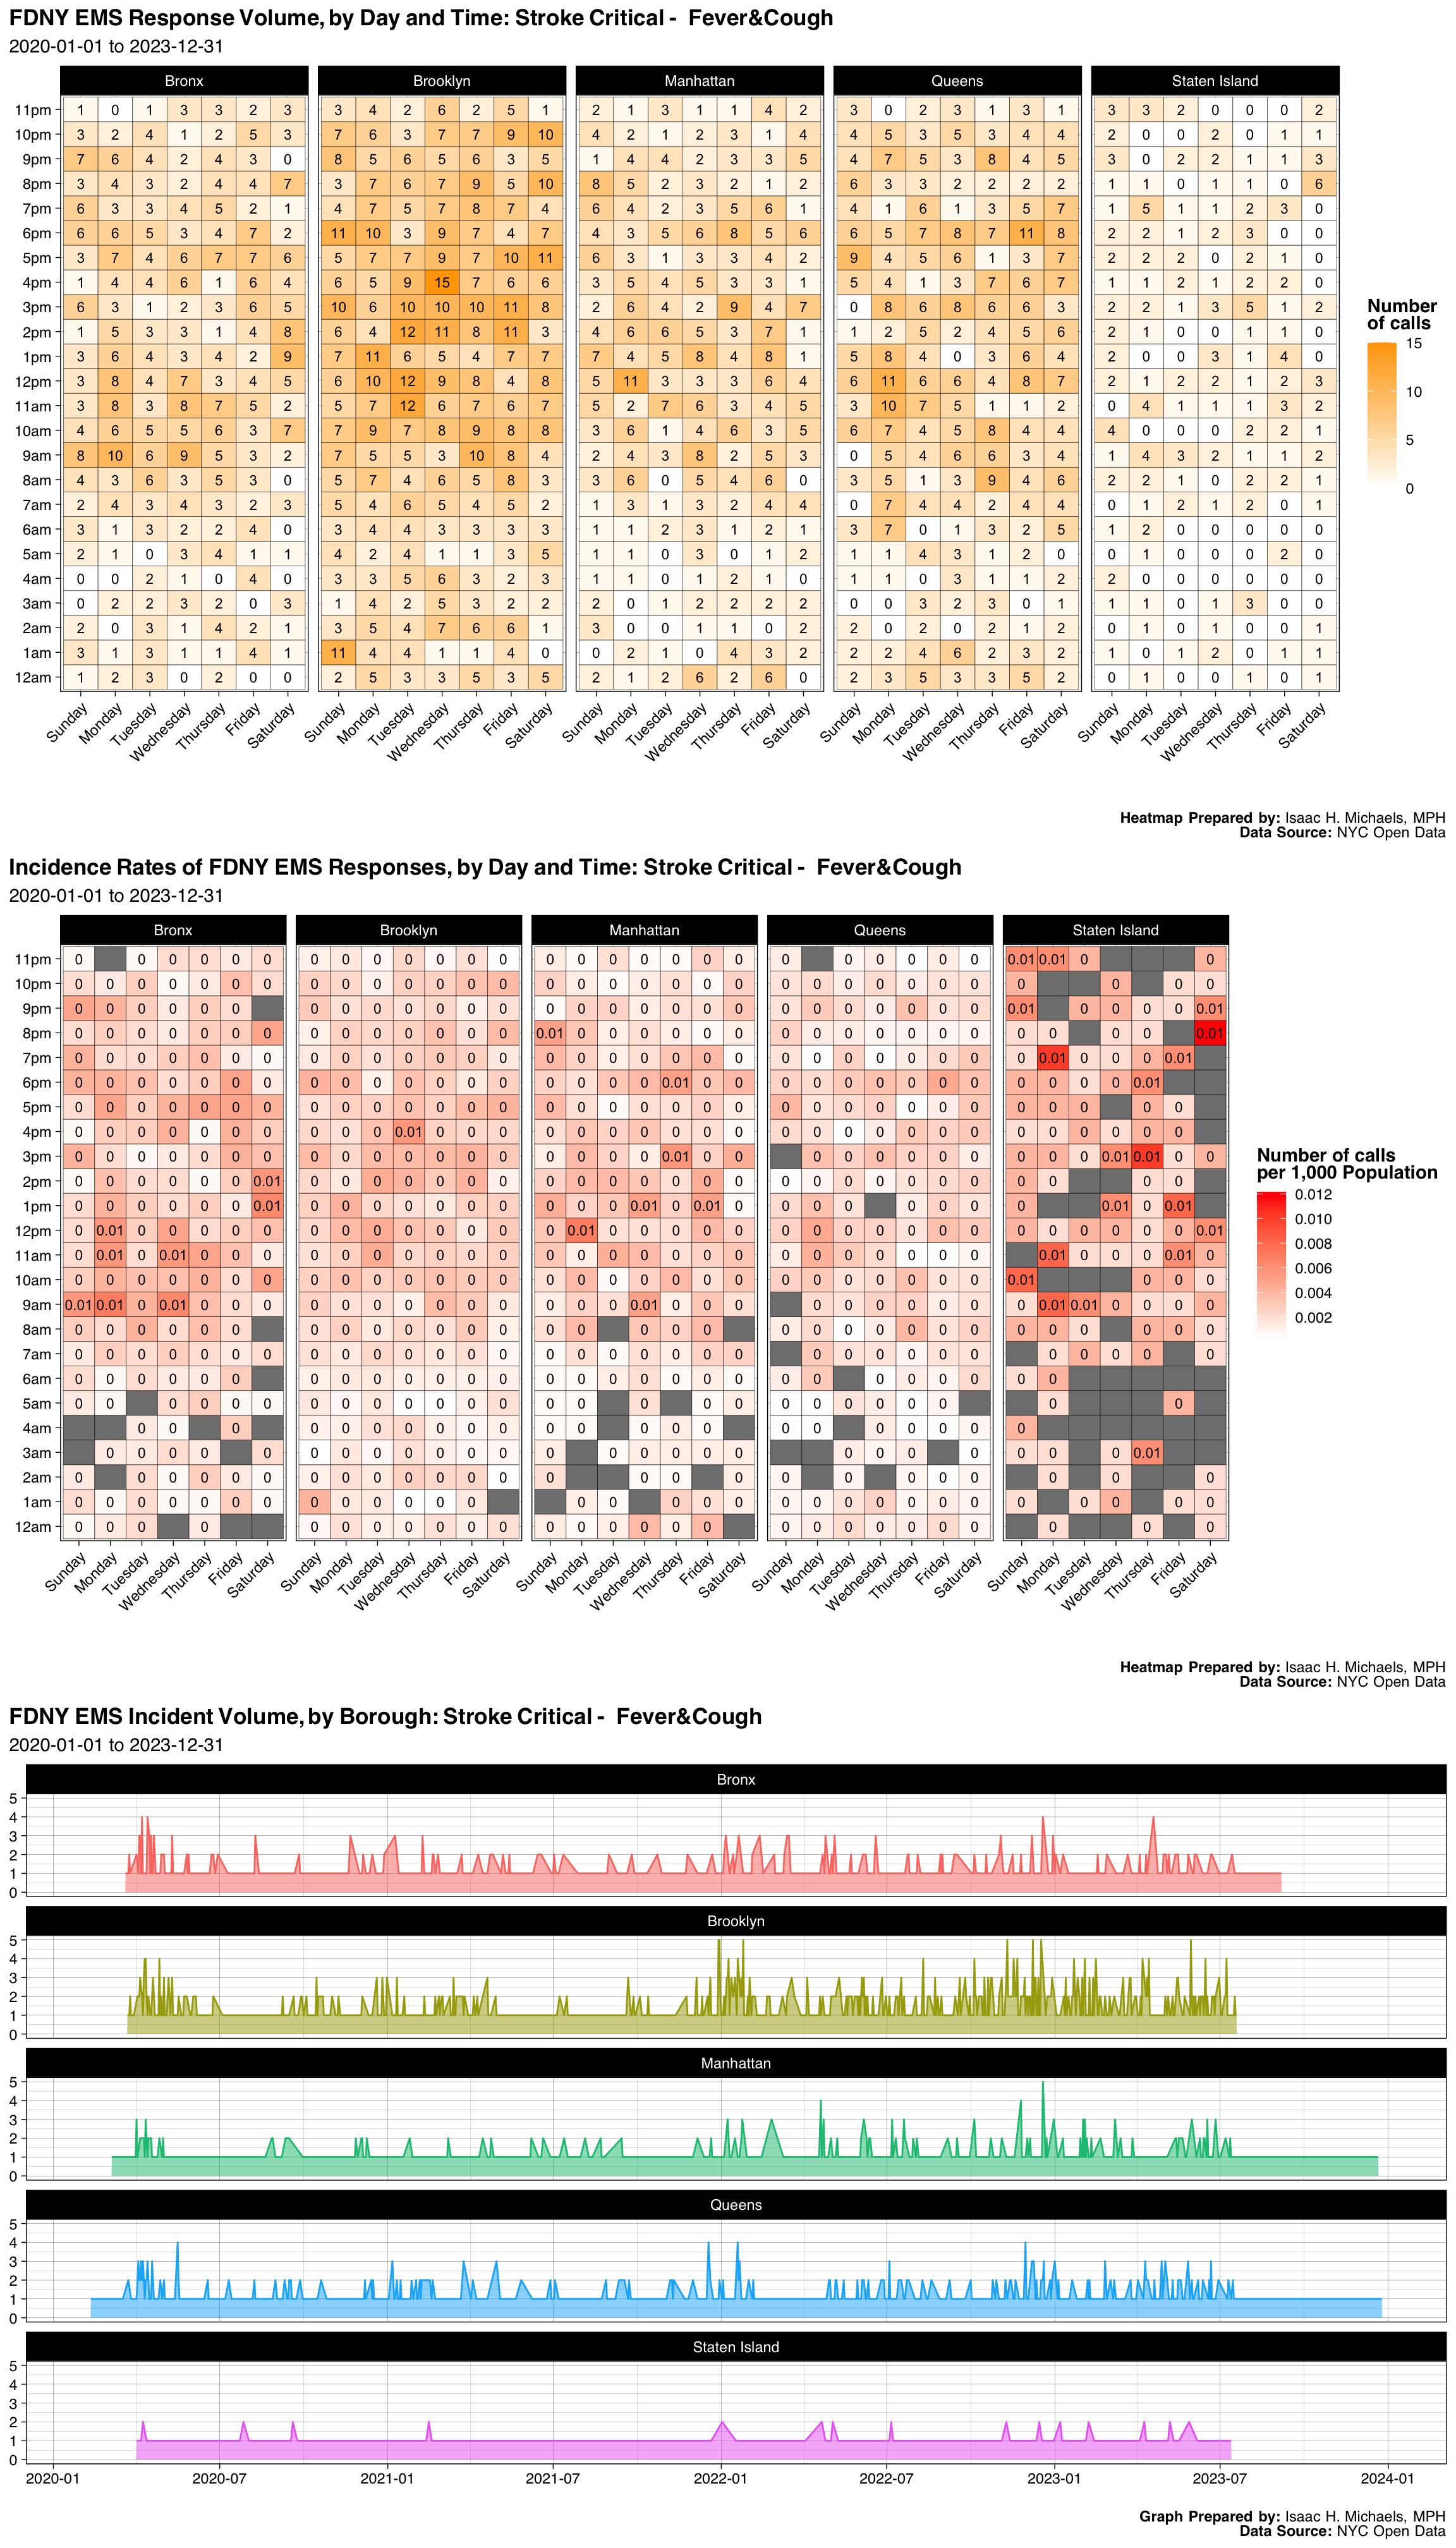
| Borough | Number | Percent |
|---|---|---|
| Bronx | 566 | 0.1949036 |
| Brooklyn | 971 | 0.3343664 |
| Manhattan | 527 | 0.1814738 |
| Queens | 639 | 0.2200413 |
| Staten Island | 201 | 0.0692149 |
| Final Severity Level | Number | Percent |
|---|---|---|
| 1 | 0 | 0% |
| 2 | 2904 | 1 |
| 3 | 0 | 0% |
| 4 | 0 | 0% |
| 5 | 0 | 0% |
| 6 | 0 | 0% |
| 7 | 0 | 0% |
| 8 | 0 | 0% |
| Disposition | Number | Percent |
|---|---|---|
| Transporting Patient | 2434 | 0.8381543 |
| Refused Medical Aid | 387 | 0.1332645 |
| Unfounded | 47 | 0.0161846 |
| Patient Gone on Arrival | 21 | 0.0072314 |
| Cancelled | 9 | 0.0030992 |
| Condition Corrected | 3 | 0.0010331 |
| Other | 3 | 0.0010331 |
Graphs, Heatmaps, and Tables Prepared By: Isaac H. Michaels, MPH
Data Source: NYC Open Data
Back to top
Heat Exhaustion
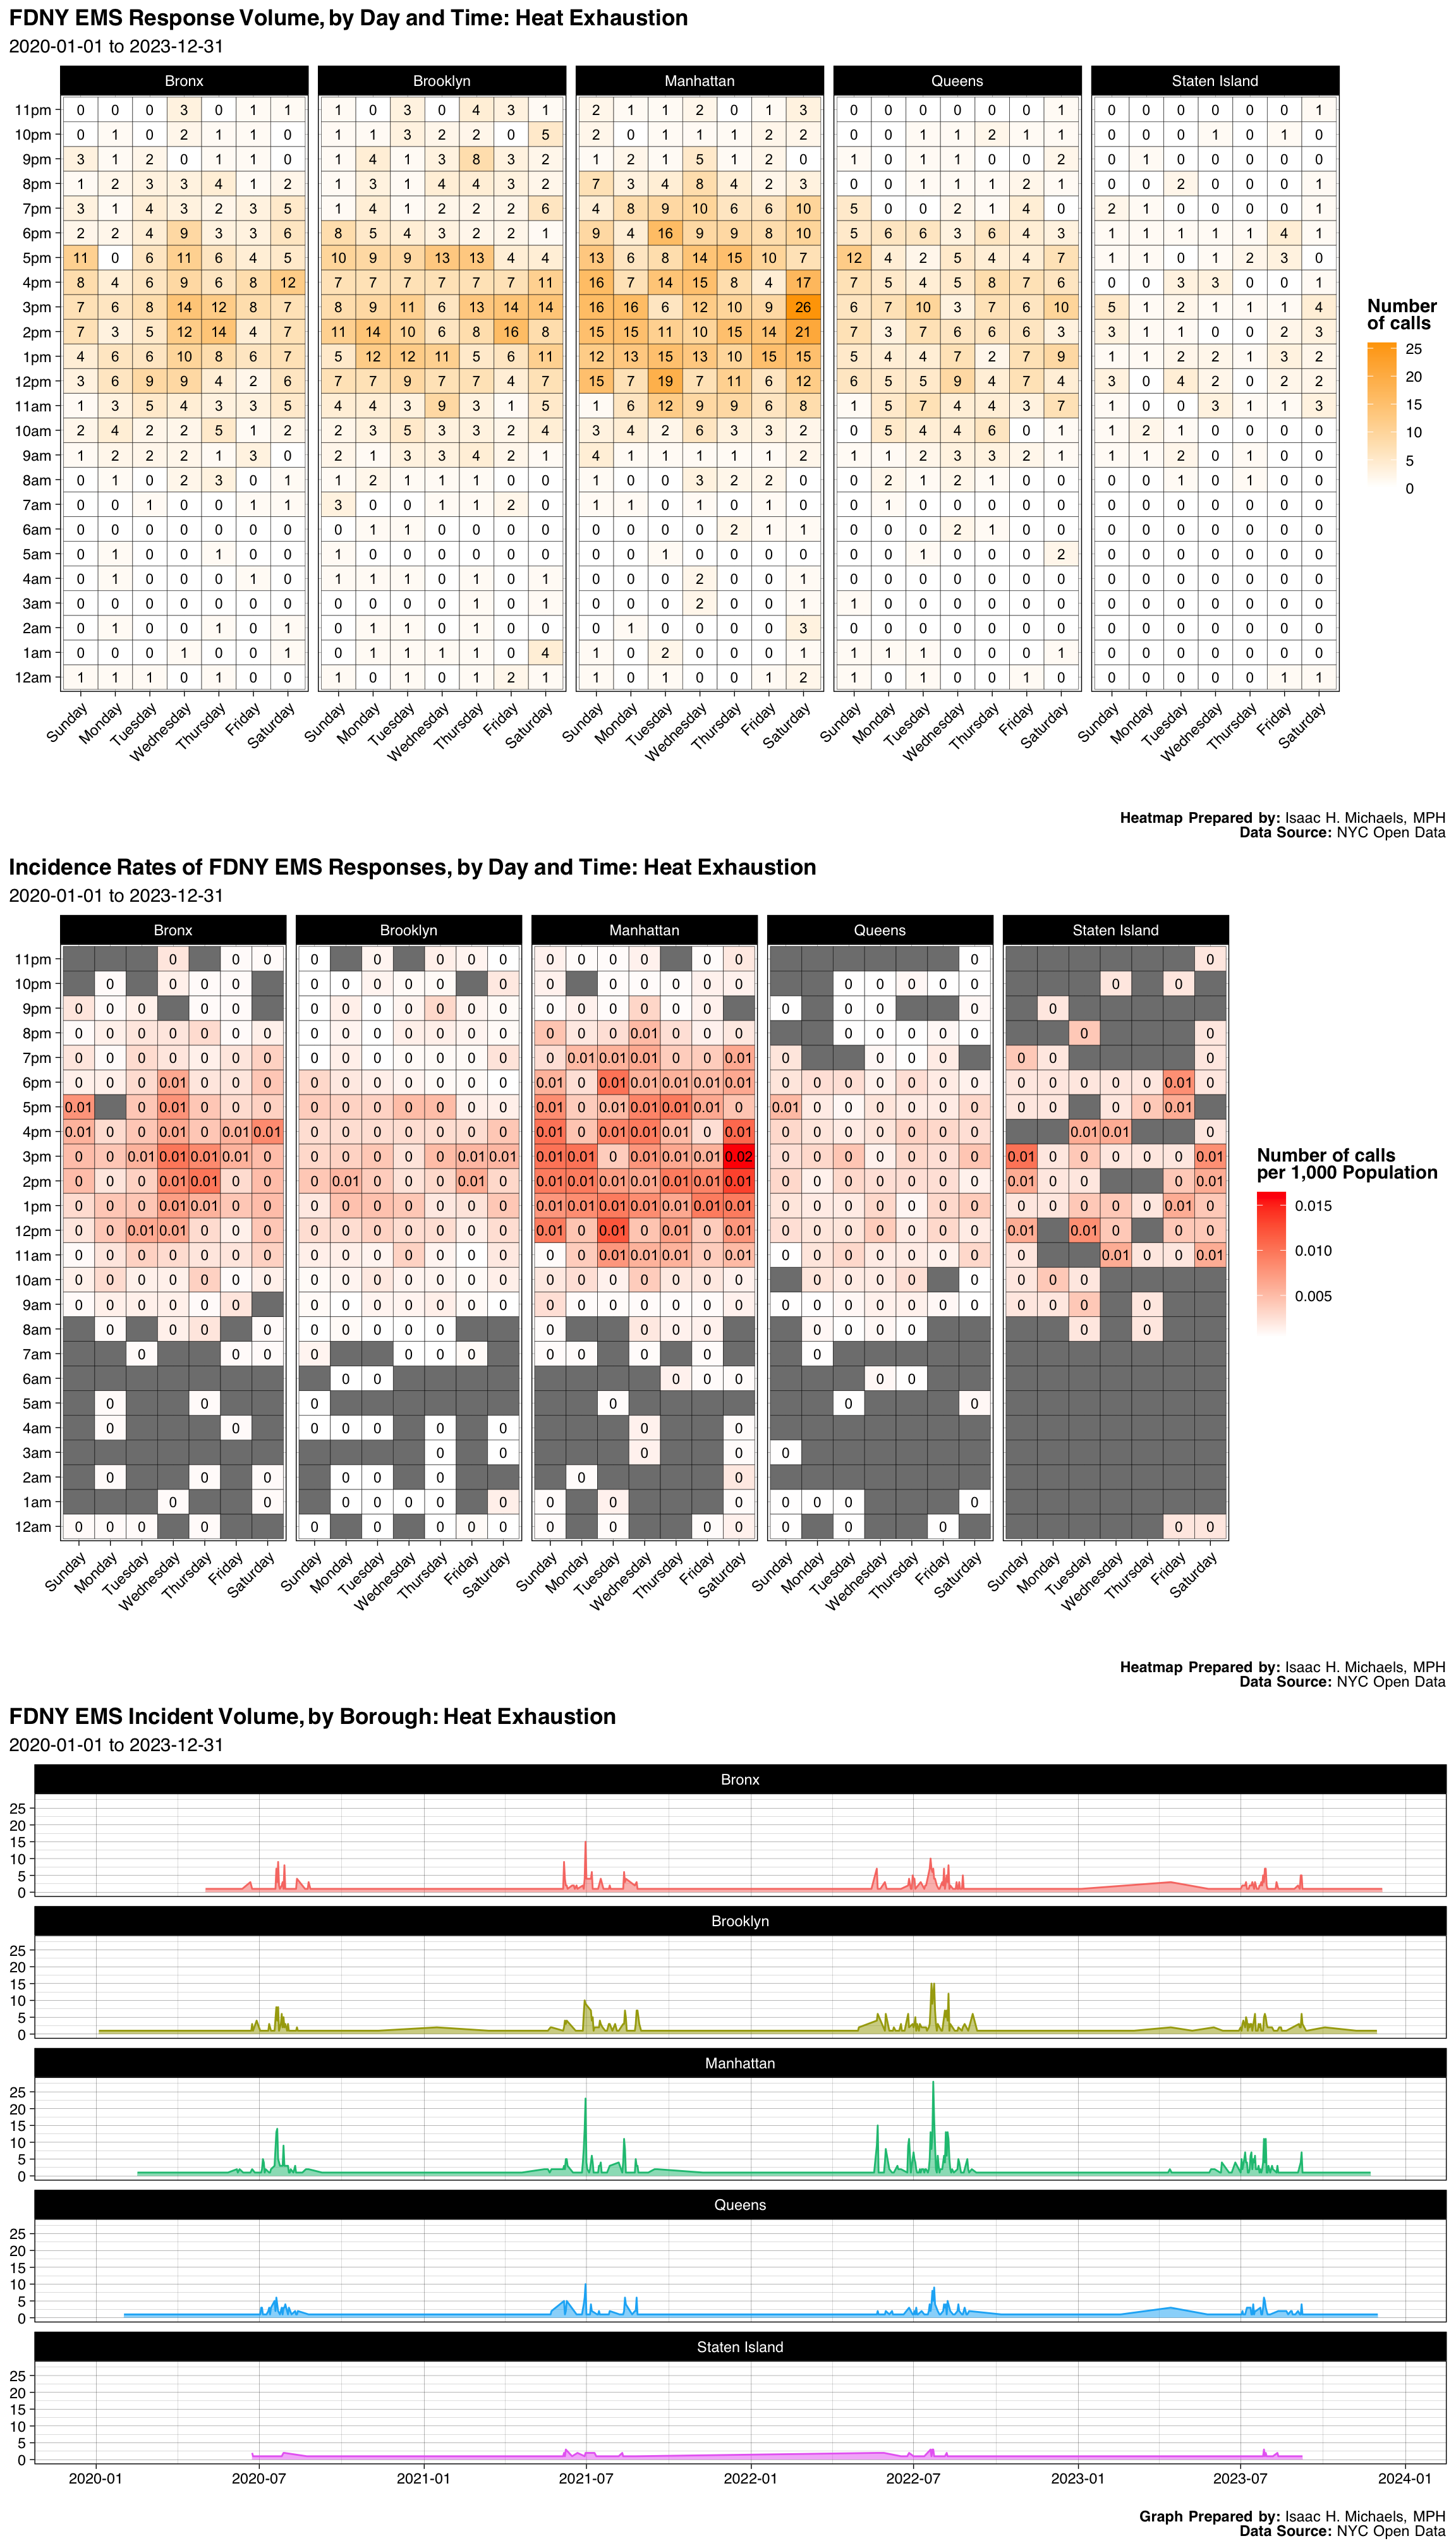
| Borough | Number | Percent |
|---|---|---|
| Bronx | 456 | 0.1926489 |
| Brooklyn | 589 | 0.2488382 |
| Manhattan | 821 | 0.3468526 |
| Queens | 393 | 0.1660330 |
| Staten Island | 108 | 0.0456274 |
| Final Severity Level | Number | Percent |
|---|---|---|
| 1 | 0 | 0% |
| 2 | 2 | 0.000844951415293621 |
| 3 | 5 | 0.00211237853823405 |
| 4 | 2360 | 0.997042670046472 |
| 5 | 0 | 0% |
| 6 | 0 | 0% |
| 7 | 0 | 0% |
| 8 | 0 | 0% |
| Disposition | Number | Percent |
|---|---|---|
| Transporting Patient | 1146 | 0.4841572 |
| Refused Medical Aid | 739 | 0.3122095 |
| Unfounded | 249 | 0.1051965 |
| Patient Gone on Arrival | 150 | 0.0633714 |
| Cancelled | 53 | 0.0223912 |
| Condition Corrected | 19 | 0.0080270 |
| Other | 11 | 0.0046472 |
Graphs, Heatmaps, and Tables Prepared By: Isaac H. Michaels, MPH
Data Source: NYC Open Data
Back to top
Hostage Situation / Barricaded
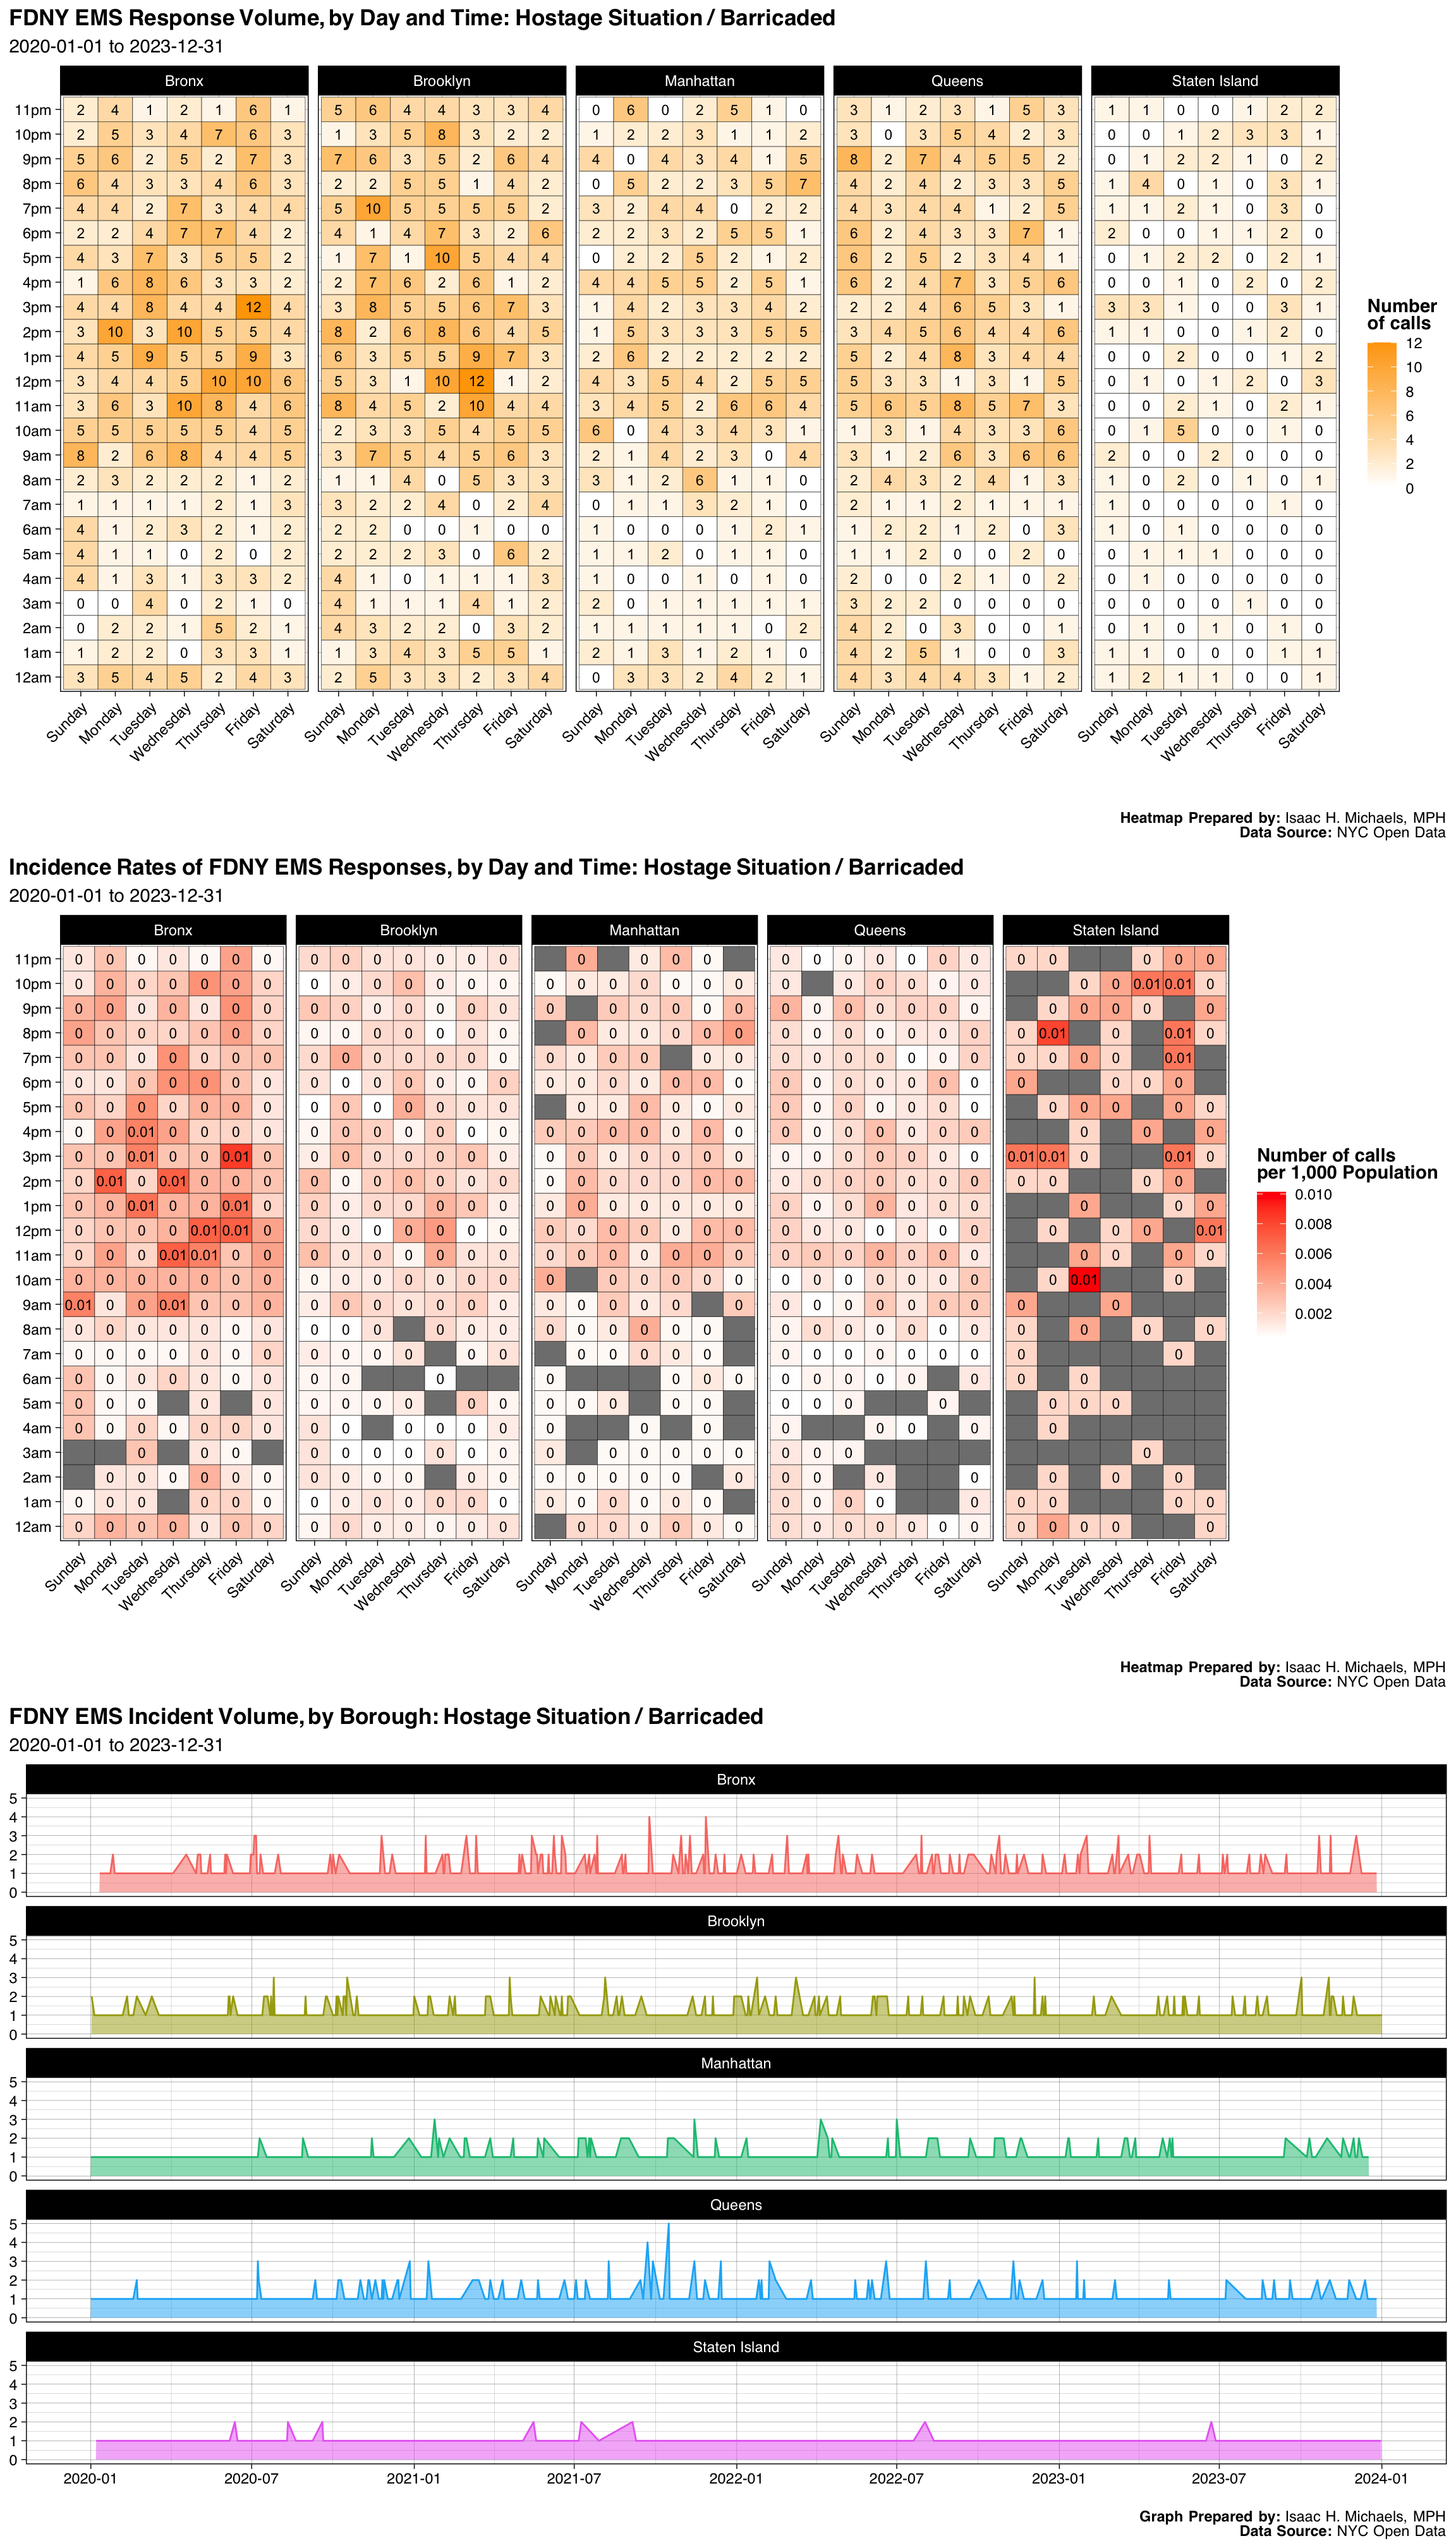
| Borough | Number | Percent |
|---|---|---|
| Bronx | 617 | 0.2750780 |
| Brooklyn | 615 | 0.2741864 |
| Manhattan | 380 | 0.1694160 |
| Queens | 497 | 0.2215782 |
| Staten Island | 134 | 0.0597414 |
| Final Severity Level | Number | Percent |
|---|---|---|
| 1 | 0 | 0% |
| 2 | 2125 | 0.947391885867142 |
| 3 | 114 | 0.050824788230049 |
| 4 | 4 | 0.00178332590280874 |
| 5 | 0 | 0% |
| 6 | 0 | 0% |
| 7 | 0 | 0% |
| 8 | 0 | 0% |
| Disposition | Number | Percent |
|---|---|---|
| Transporting Patient | 1808 | 0.8060633 |
| Condition Corrected | 238 | 0.1061079 |
| Refused Medical Aid | 84 | 0.0374498 |
| Cancelled | 80 | 0.0356665 |
| Unfounded | 22 | 0.0098083 |
| Patient Pronounced Dead | 6 | 0.0026750 |
| Patient Gone on Arrival | 3 | 0.0013375 |
| Treated and Transported | 2 | 0.0008917 |
Graphs, Heatmaps, and Tables Prepared By: Isaac H. Michaels, MPH
Data Source: NYC Open Data
Back to top
Sick - Rash And Fever
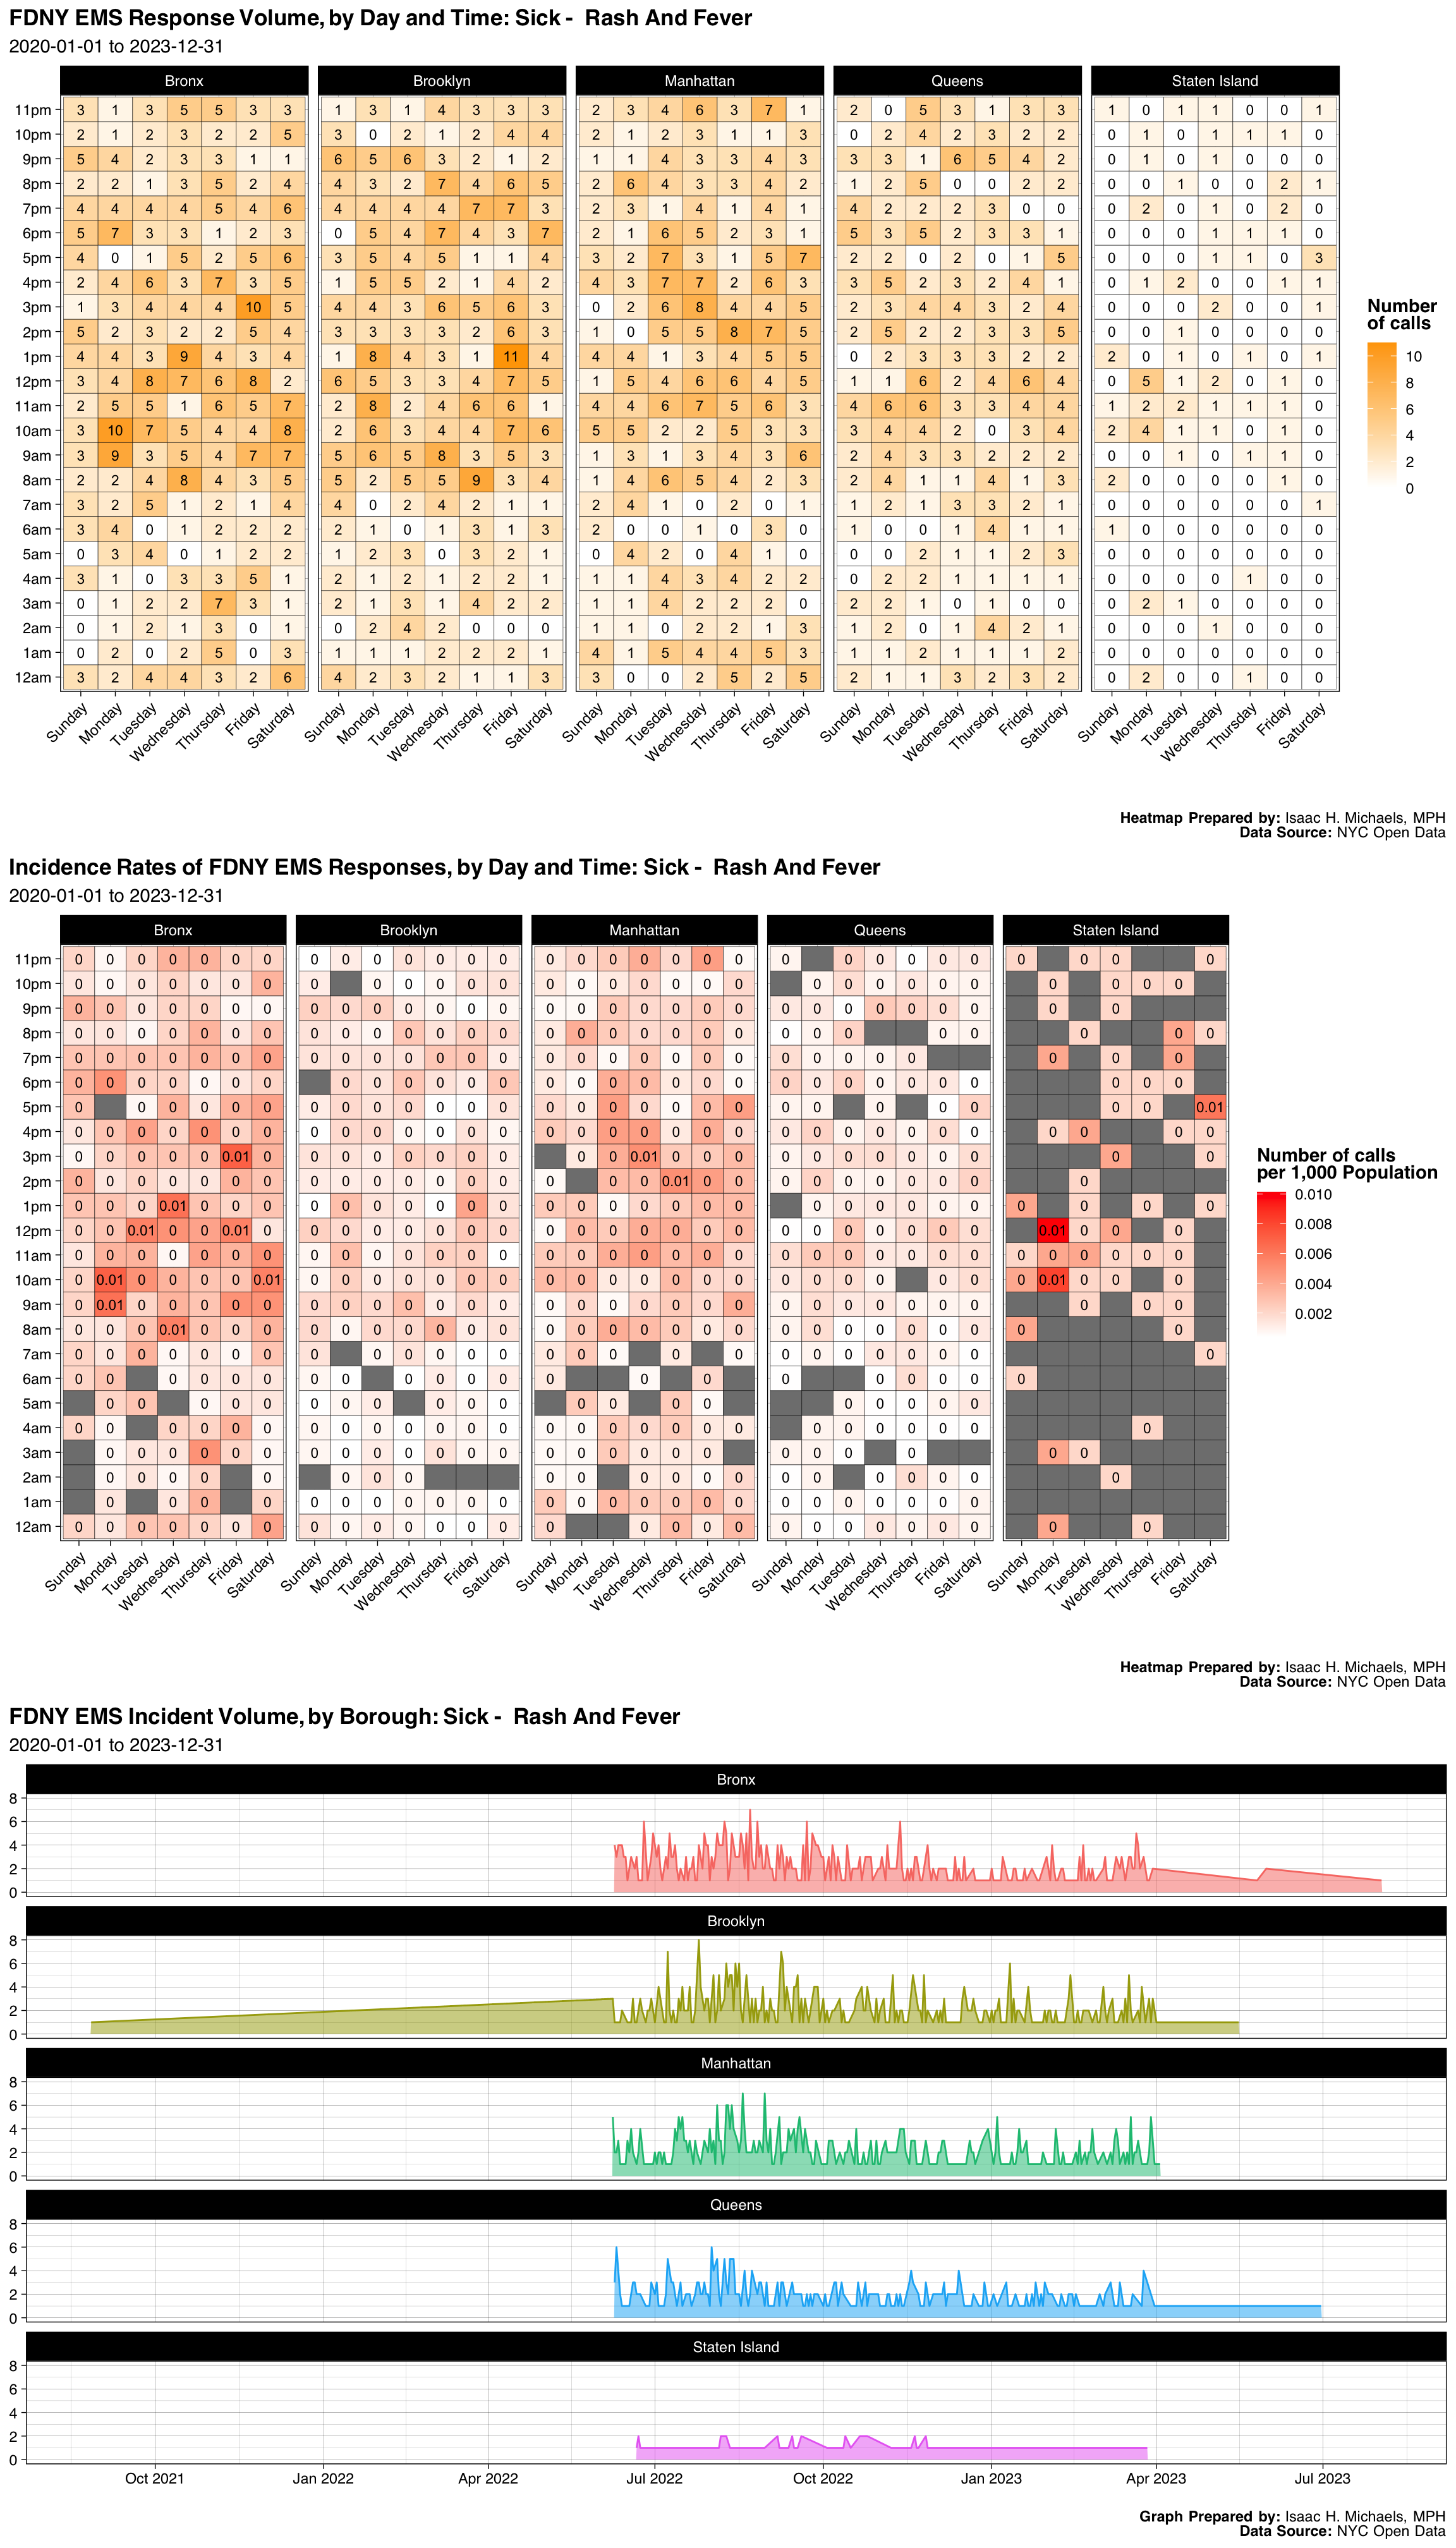
| Borough | Number | Percent |
|---|---|---|
| Bronx | 567 | 0.2724652 |
| Brooklyn | 541 | 0.2599712 |
| Manhattan | 510 | 0.2450745 |
| Queens | 380 | 0.1826045 |
| Staten Island | 83 | 0.0398847 |
| Final Severity Level | Number | Percent |
|---|---|---|
| 1 | 0 | 0% |
| 2 | 0 | 0% |
| 3 | 1 | 0.000480538202787122 |
| 4 | 1 | 0.000480538202787122 |
| 5 | 0 | 0% |
| 6 | 2079 | 0.999038923594426 |
| 7 | 0 | 0% |
| 8 | 0 | 0% |
| Disposition | Number | Percent |
|---|---|---|
| Transporting Patient | 1648 | 0.7919270 |
| Refused Medical Aid | 273 | 0.1311869 |
| Unfounded | 85 | 0.0408457 |
| Patient Gone on Arrival | 39 | 0.0187410 |
| Other | 20 | 0.0096108 |
| Cancelled | 10 | 0.0048054 |
| Condition Corrected | 5 | 0.0024027 |
| Treated and Transported | 1 | 0.0004805 |
Graphs, Heatmaps, and Tables Prepared By: Isaac H. Michaels, MPH
Data Source: NYC Open Data
Back to top
Drowning
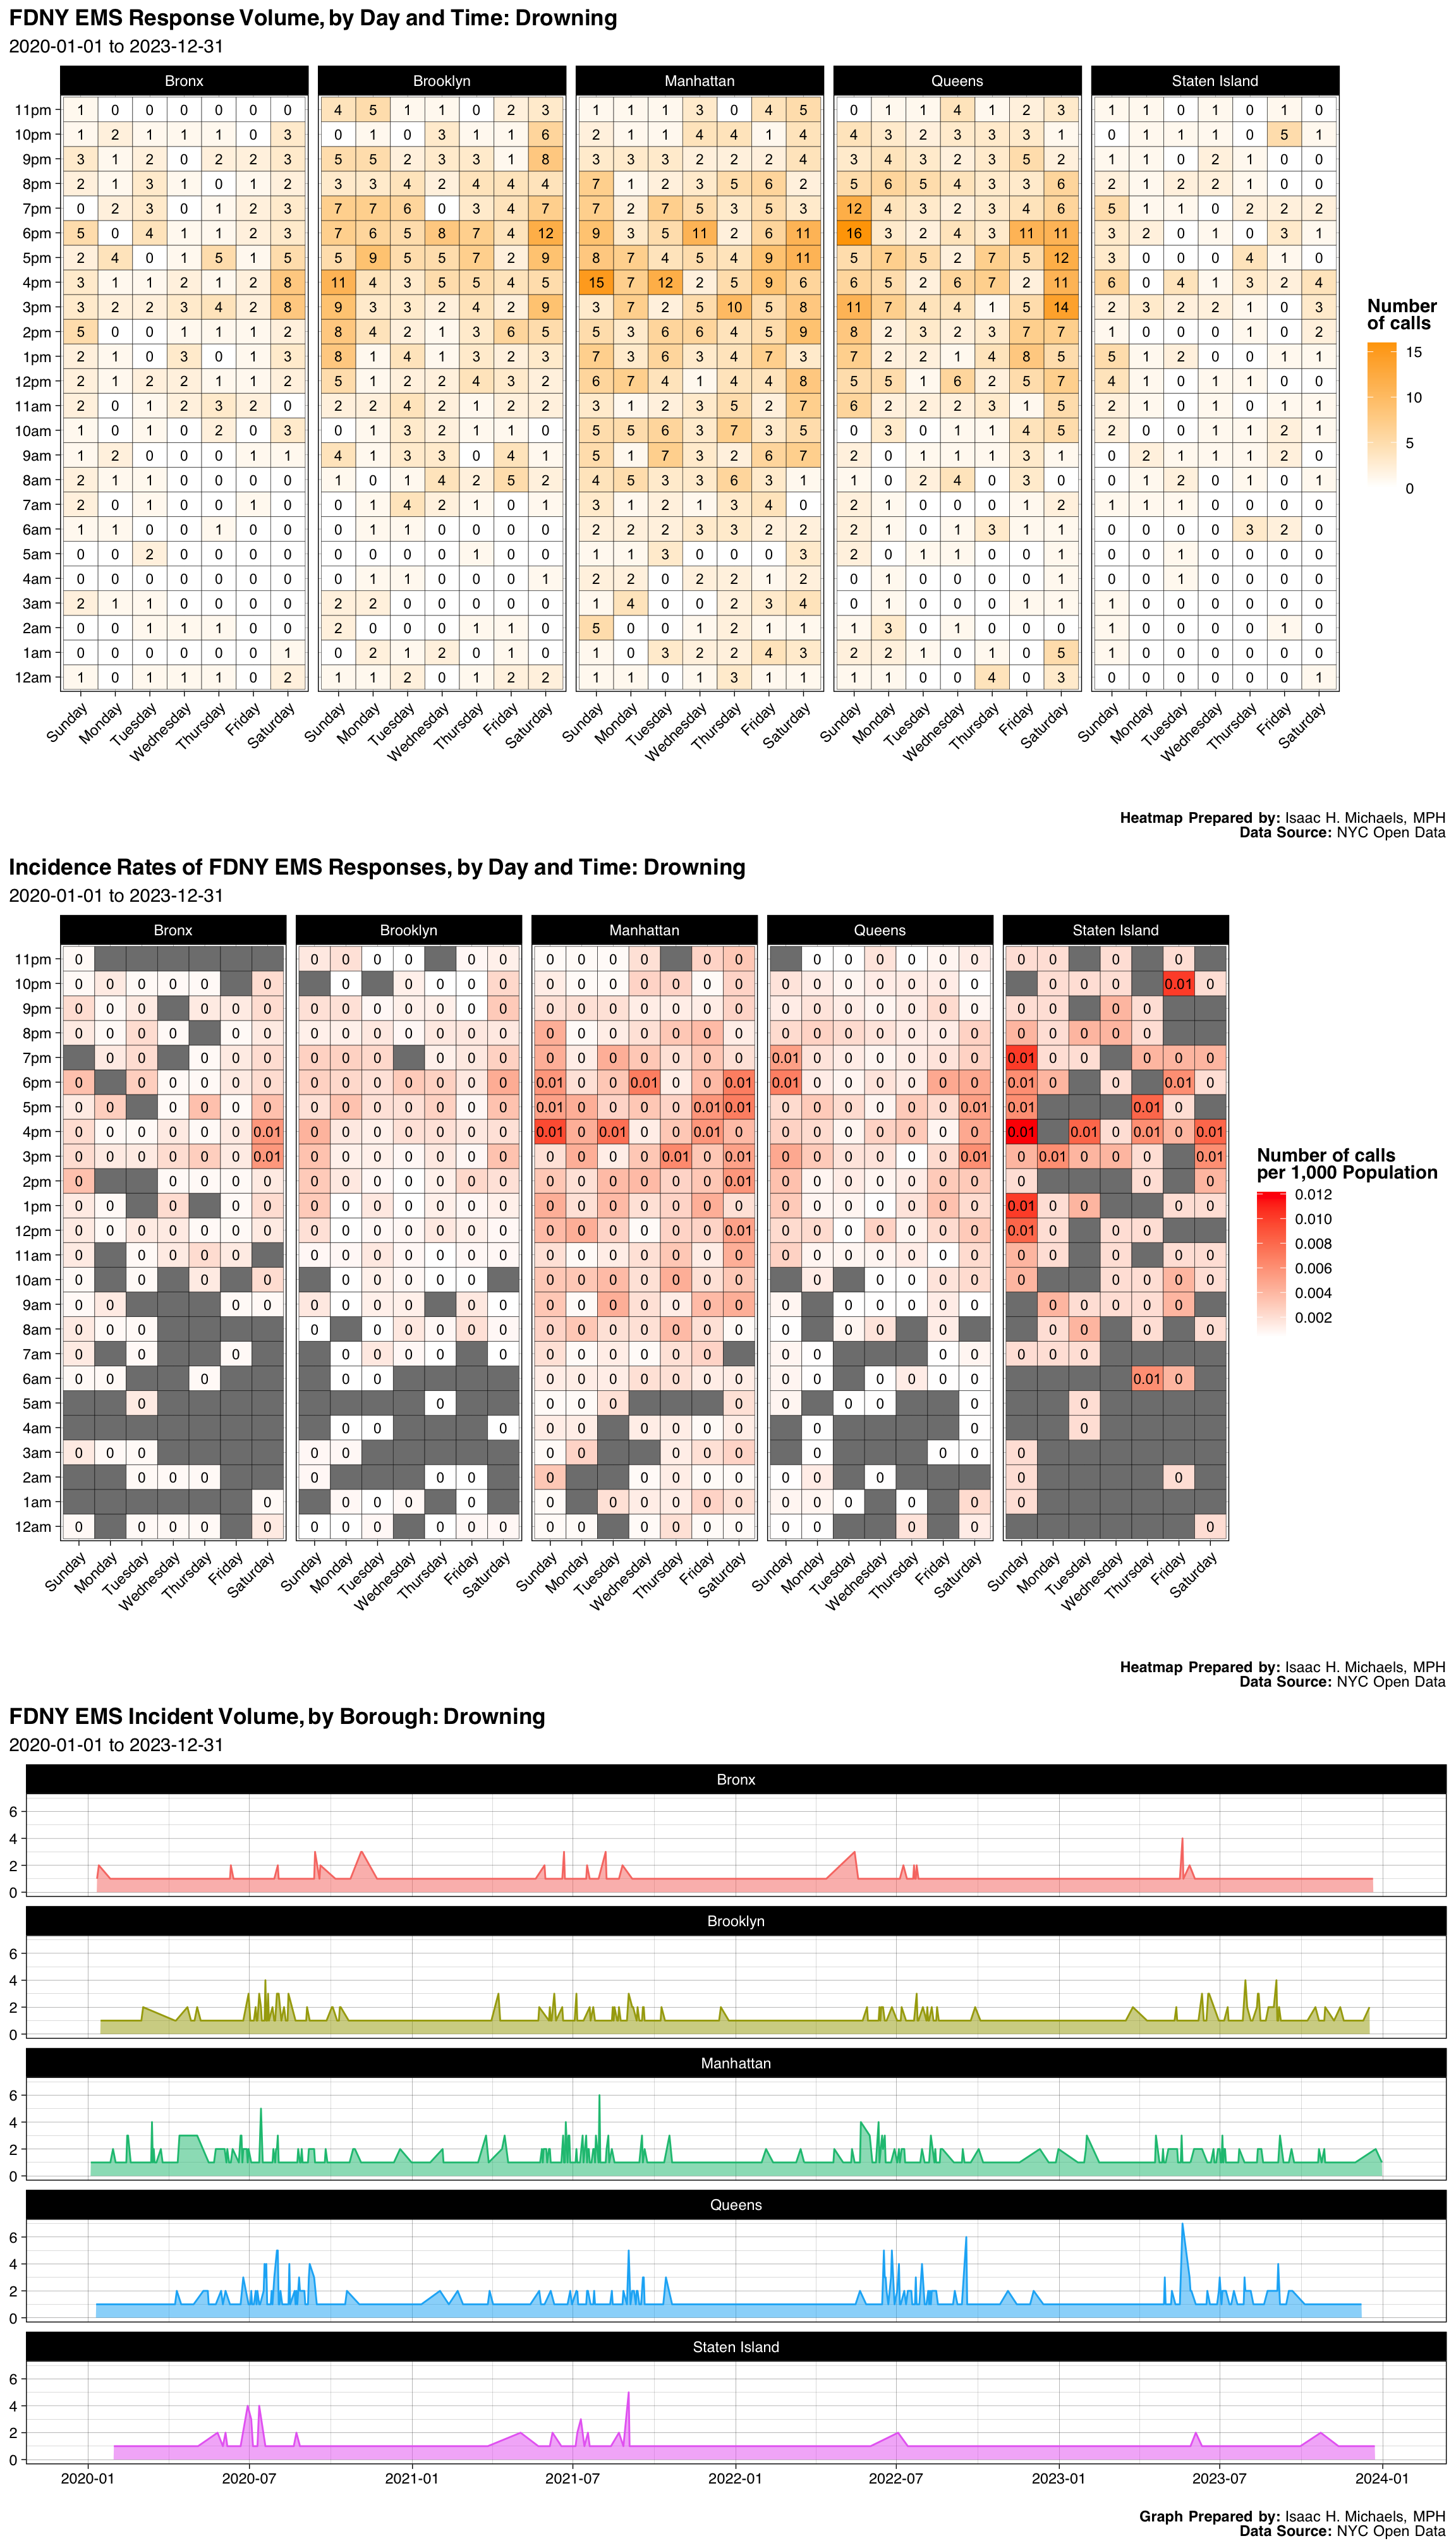
| Borough | Number | Percent |
|---|---|---|
| Bronx | 200 | 0.1056524 |
| Brooklyn | 435 | 0.2297940 |
| Manhattan | 614 | 0.3243529 |
| Queens | 493 | 0.2604332 |
| Staten Island | 151 | 0.0797676 |
| Final Severity Level | Number | Percent |
|---|---|---|
| 1 | 1 | 0.000528262017960909 |
| 2 | 1892 | 0.999471737982039 |
| 3 | 0 | 0% |
| 4 | 0 | 0% |
| 5 | 0 | 0% |
| 6 | 0 | 0% |
| 7 | 0 | 0% |
| 8 | 0 | 0% |
| Disposition | Number | Percent |
|---|---|---|
| Unfounded | 860 | 0.4543053 |
| Transporting Patient | 386 | 0.2039091 |
| Cancelled | 260 | 0.1373481 |
| Patient Pronounced Dead | 105 | 0.0554675 |
| Refused Medical Aid | 105 | 0.0554675 |
| Condition Corrected | 92 | 0.0486001 |
| Patient Gone on Arrival | 58 | 0.0306392 |
| Other | 25 | 0.0132066 |
| Treated and Transported | 2 | 0.0010565 |
Graphs, Heatmaps, and Tables Prepared By: Isaac H. Michaels, MPH
Data Source: NYC Open Data
Back to top
Electrocution
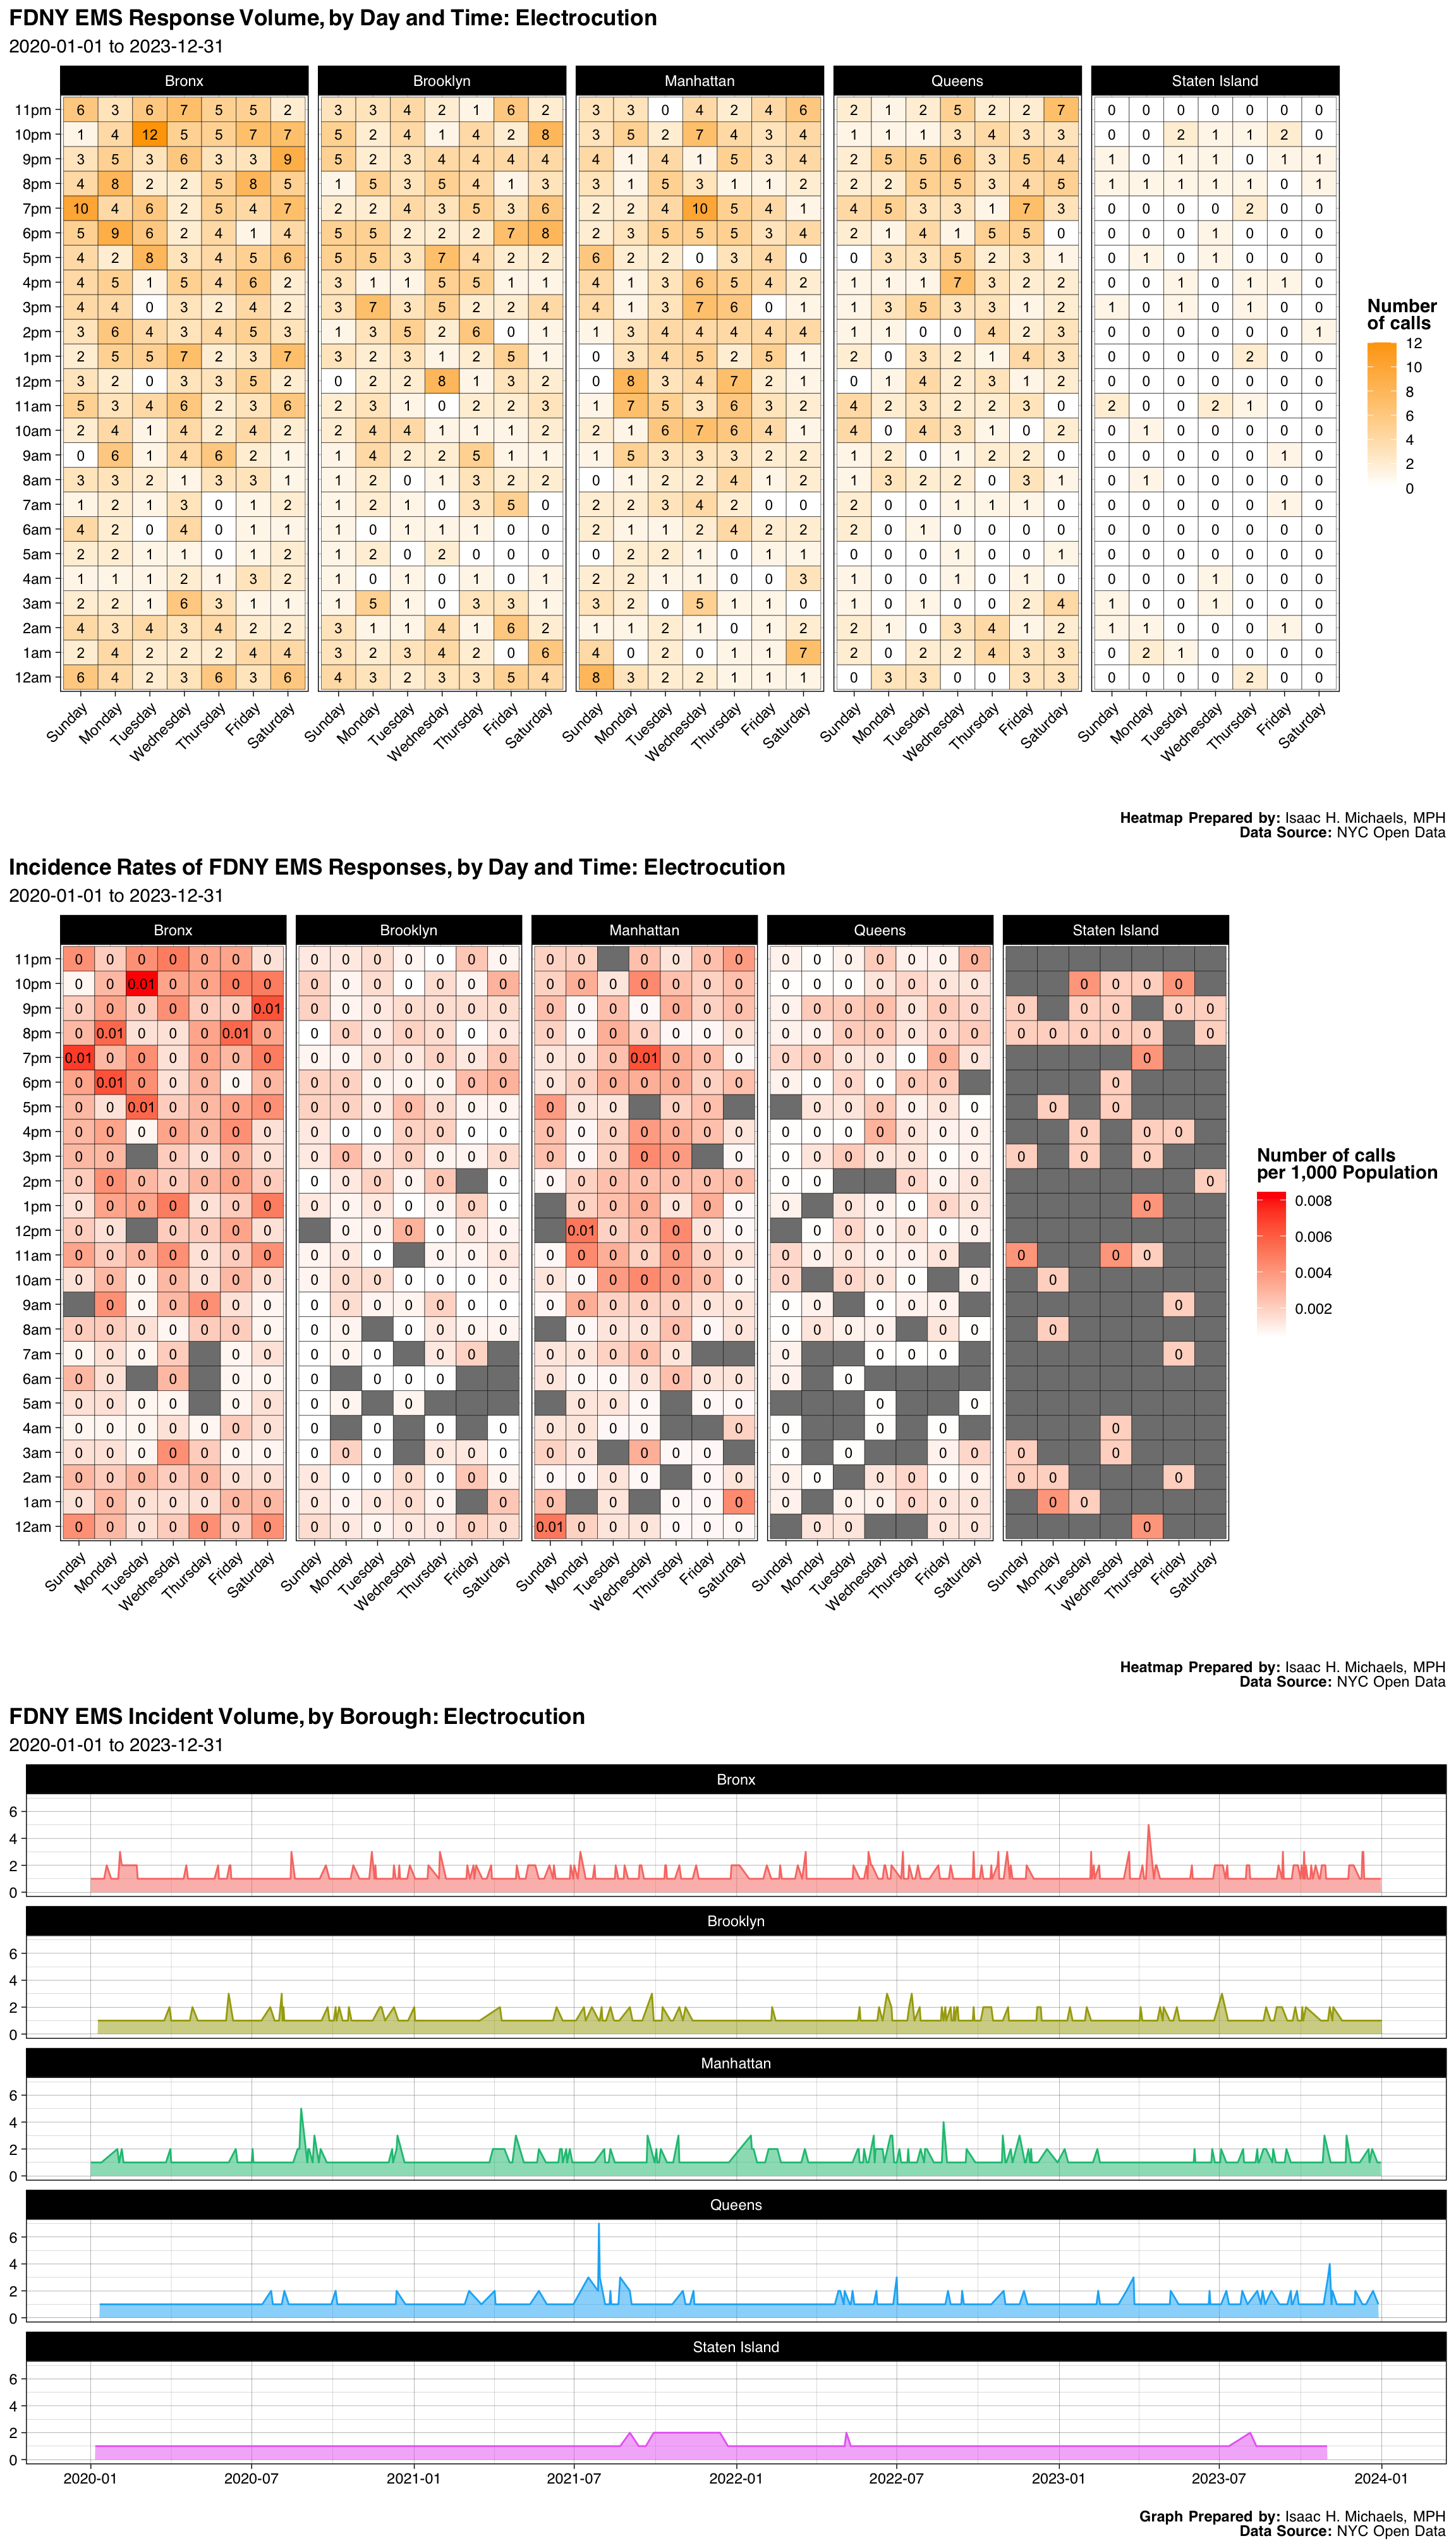
| Borough | Number | Percent |
|---|---|---|
| Bronx | 579 | 0.3116254 |
| Brooklyn | 431 | 0.2319699 |
| Manhattan | 457 | 0.2459634 |
| Queens | 340 | 0.1829925 |
| Staten Island | 51 | 0.0274489 |
| Final Severity Level | Number | Percent |
|---|---|---|
| 1 | 0 | 0% |
| 2 | 1 | 0.000538213132400431 |
| 3 | 1857 | 0.9994617868676 |
| 4 | 0 | 0% |
| 5 | 0 | 0% |
| 6 | 0 | 0% |
| 7 | 0 | 0% |
| 8 | 0 | 0% |
| Disposition | Number | Percent |
|---|---|---|
| Transporting Patient | 1281 | 0.6894510 |
| Refused Medical Aid | 320 | 0.1722282 |
| Unfounded | 116 | 0.0624327 |
| Condition Corrected | 52 | 0.0279871 |
| Patient Gone on Arrival | 49 | 0.0263724 |
| Cancelled | 31 | 0.0166846 |
| Other | 6 | 0.0032293 |
| Treated and Transported | 2 | 0.0010764 |
| Patient Pronounced Dead | 1 | 0.0005382 |
Graphs, Heatmaps, and Tables Prepared By: Isaac H. Michaels, MPH
Data Source: NYC Open Data
Back to top
Seizures - Fever & Cough
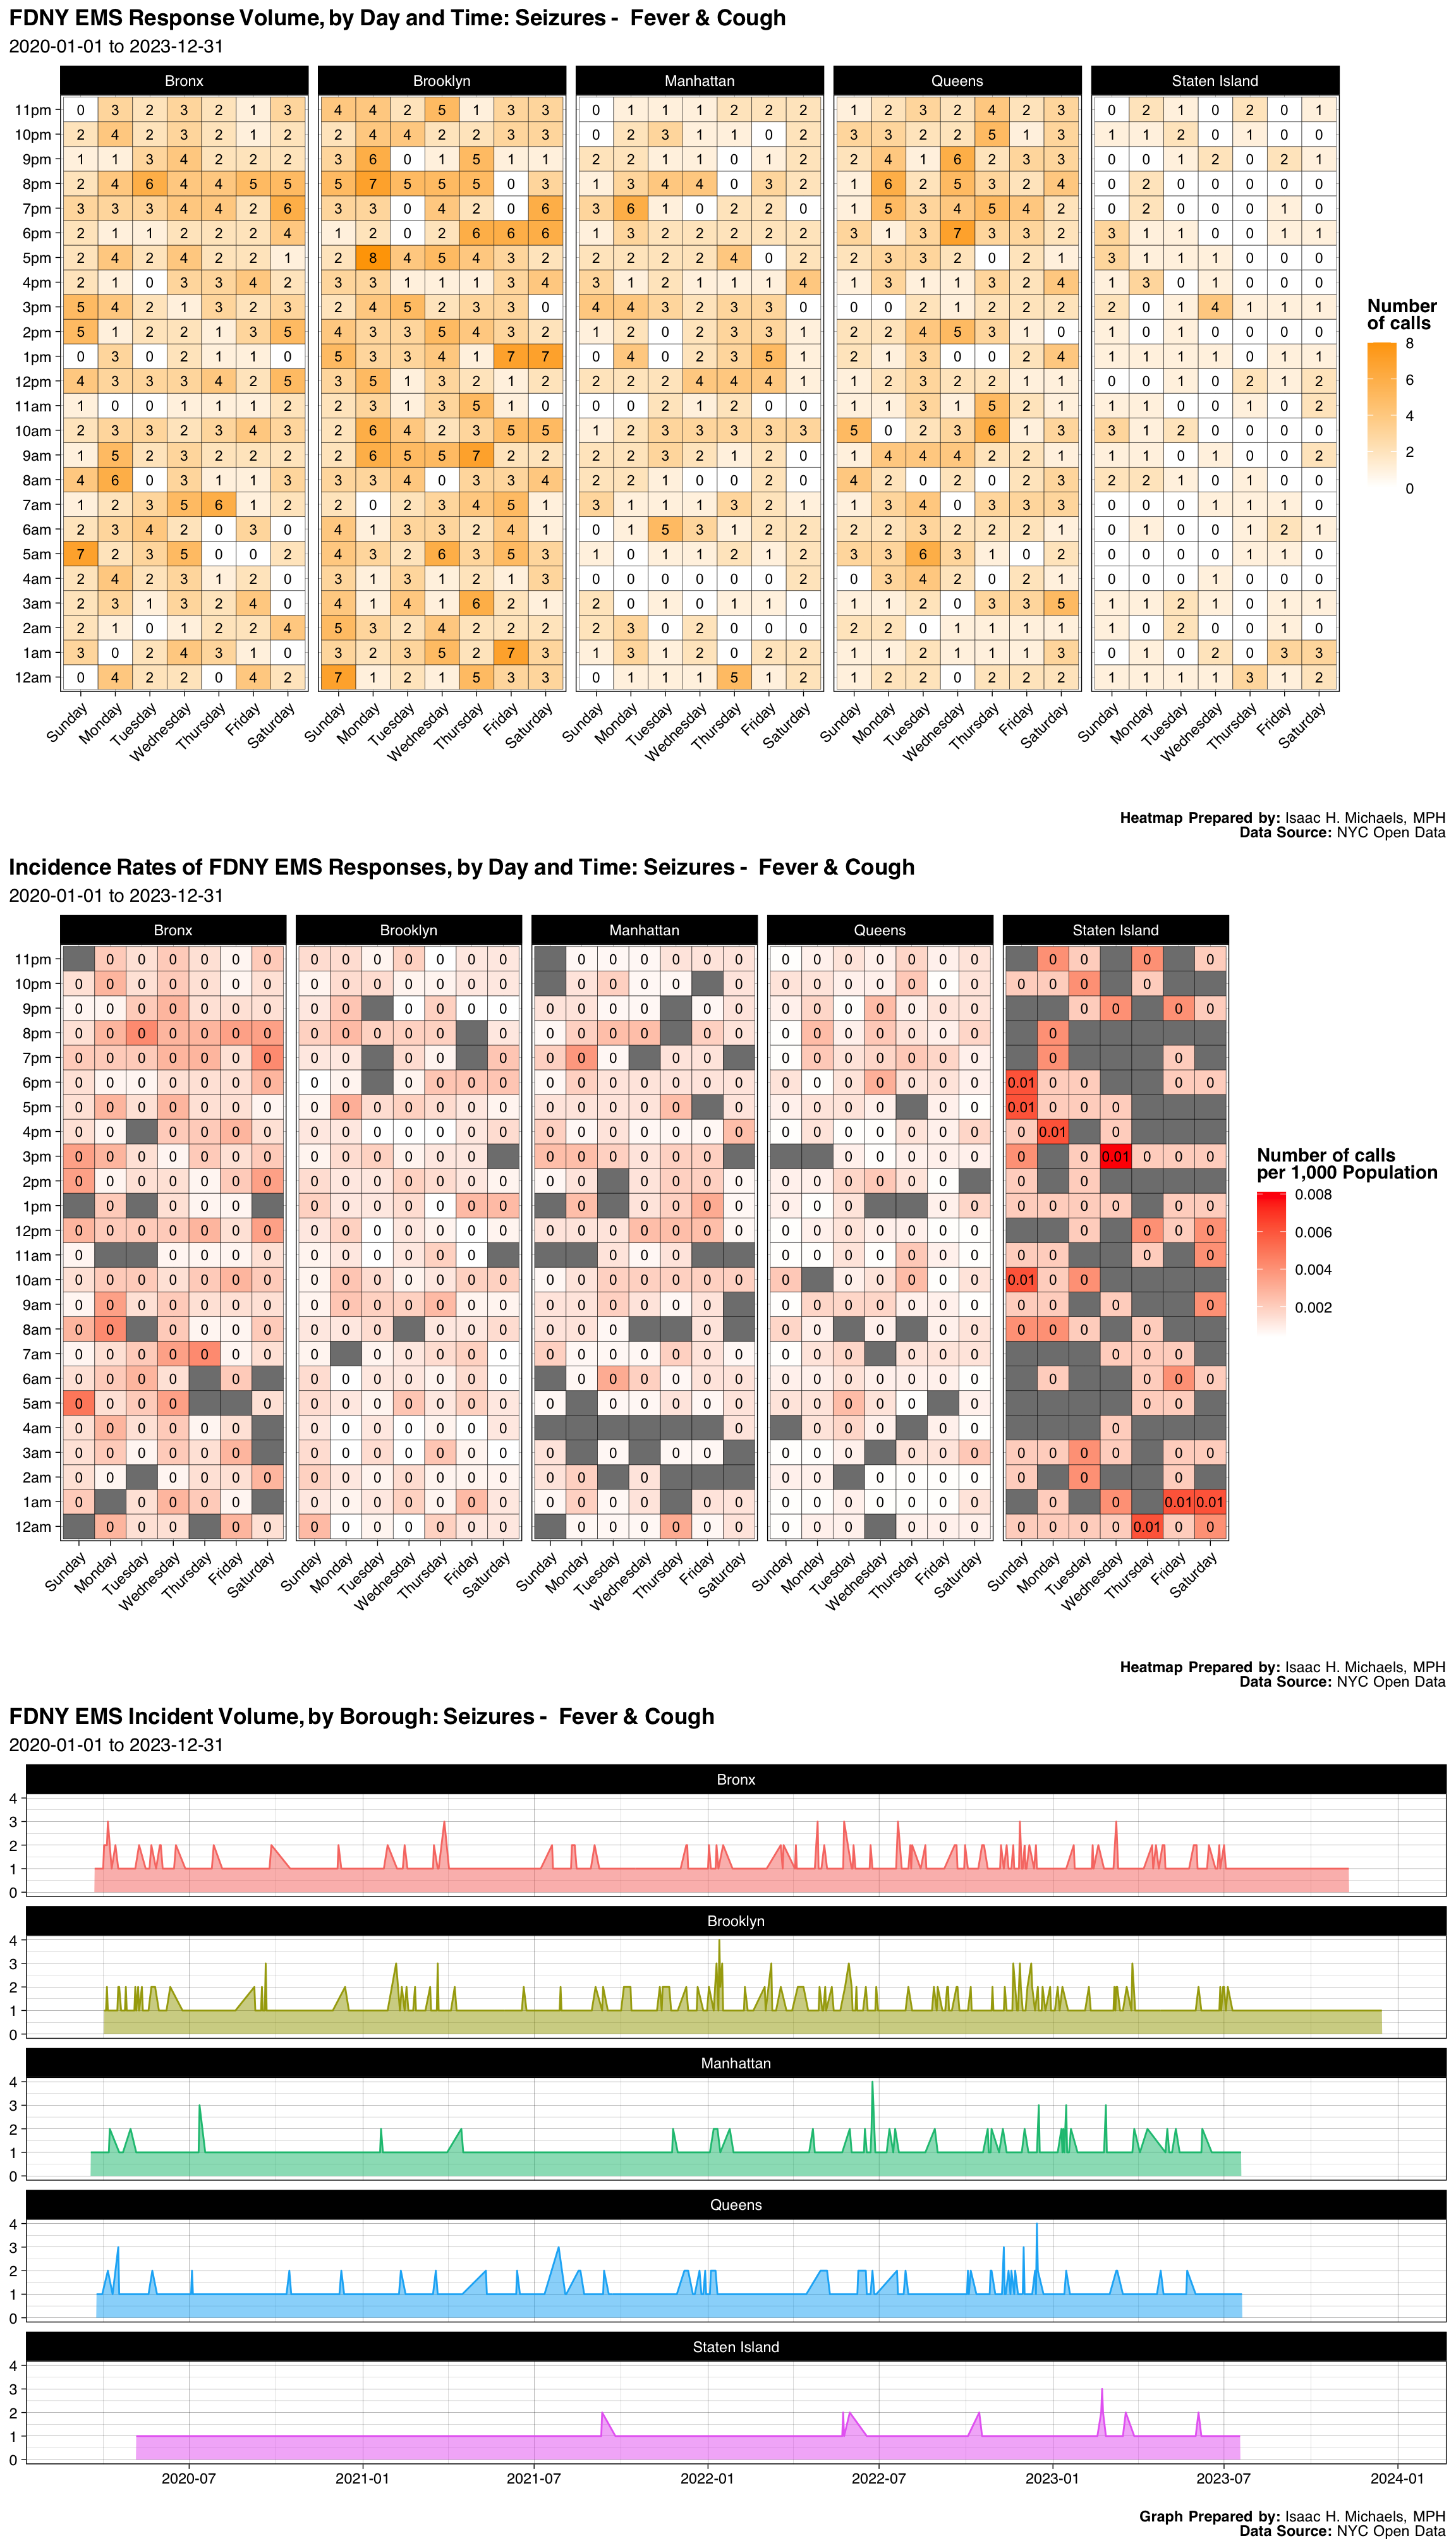
| Borough | Number | Percent |
|---|---|---|
| Bronx | 398 | 0.2353637 |
| Brooklyn | 516 | 0.3051449 |
| Manhattan | 276 | 0.1632170 |
| Queens | 374 | 0.2211709 |
| Staten Island | 127 | 0.0751035 |
| Final Severity Level | Number | Percent |
|---|---|---|
| 1 | 0 | 0% |
| 2 | 0 | 0% |
| 3 | 1690 | 0.999408633944412 |
| 4 | 1 | 0.000591366055588409 |
| 5 | 0 | 0% |
| 6 | 0 | 0% |
| 7 | 0 | 0% |
| 8 | 0 | 0% |
| Disposition | Number | Percent |
|---|---|---|
| Transporting Patient | 1444 | 0.8539326 |
| Refused Medical Aid | 182 | 0.1076286 |
| Unfounded | 28 | 0.0165582 |
| Patient Gone on Arrival | 20 | 0.0118273 |
| Cancelled | 11 | 0.0065050 |
| Condition Corrected | 3 | 0.0017741 |
| Other | 2 | 0.0011827 |
| Treated and Transported | 1 | 0.0005914 |
Graphs, Heatmaps, and Tables Prepared By: Isaac H. Michaels, MPH
Data Source: NYC Open Data
Back to top
Stroke - Fever & Cough
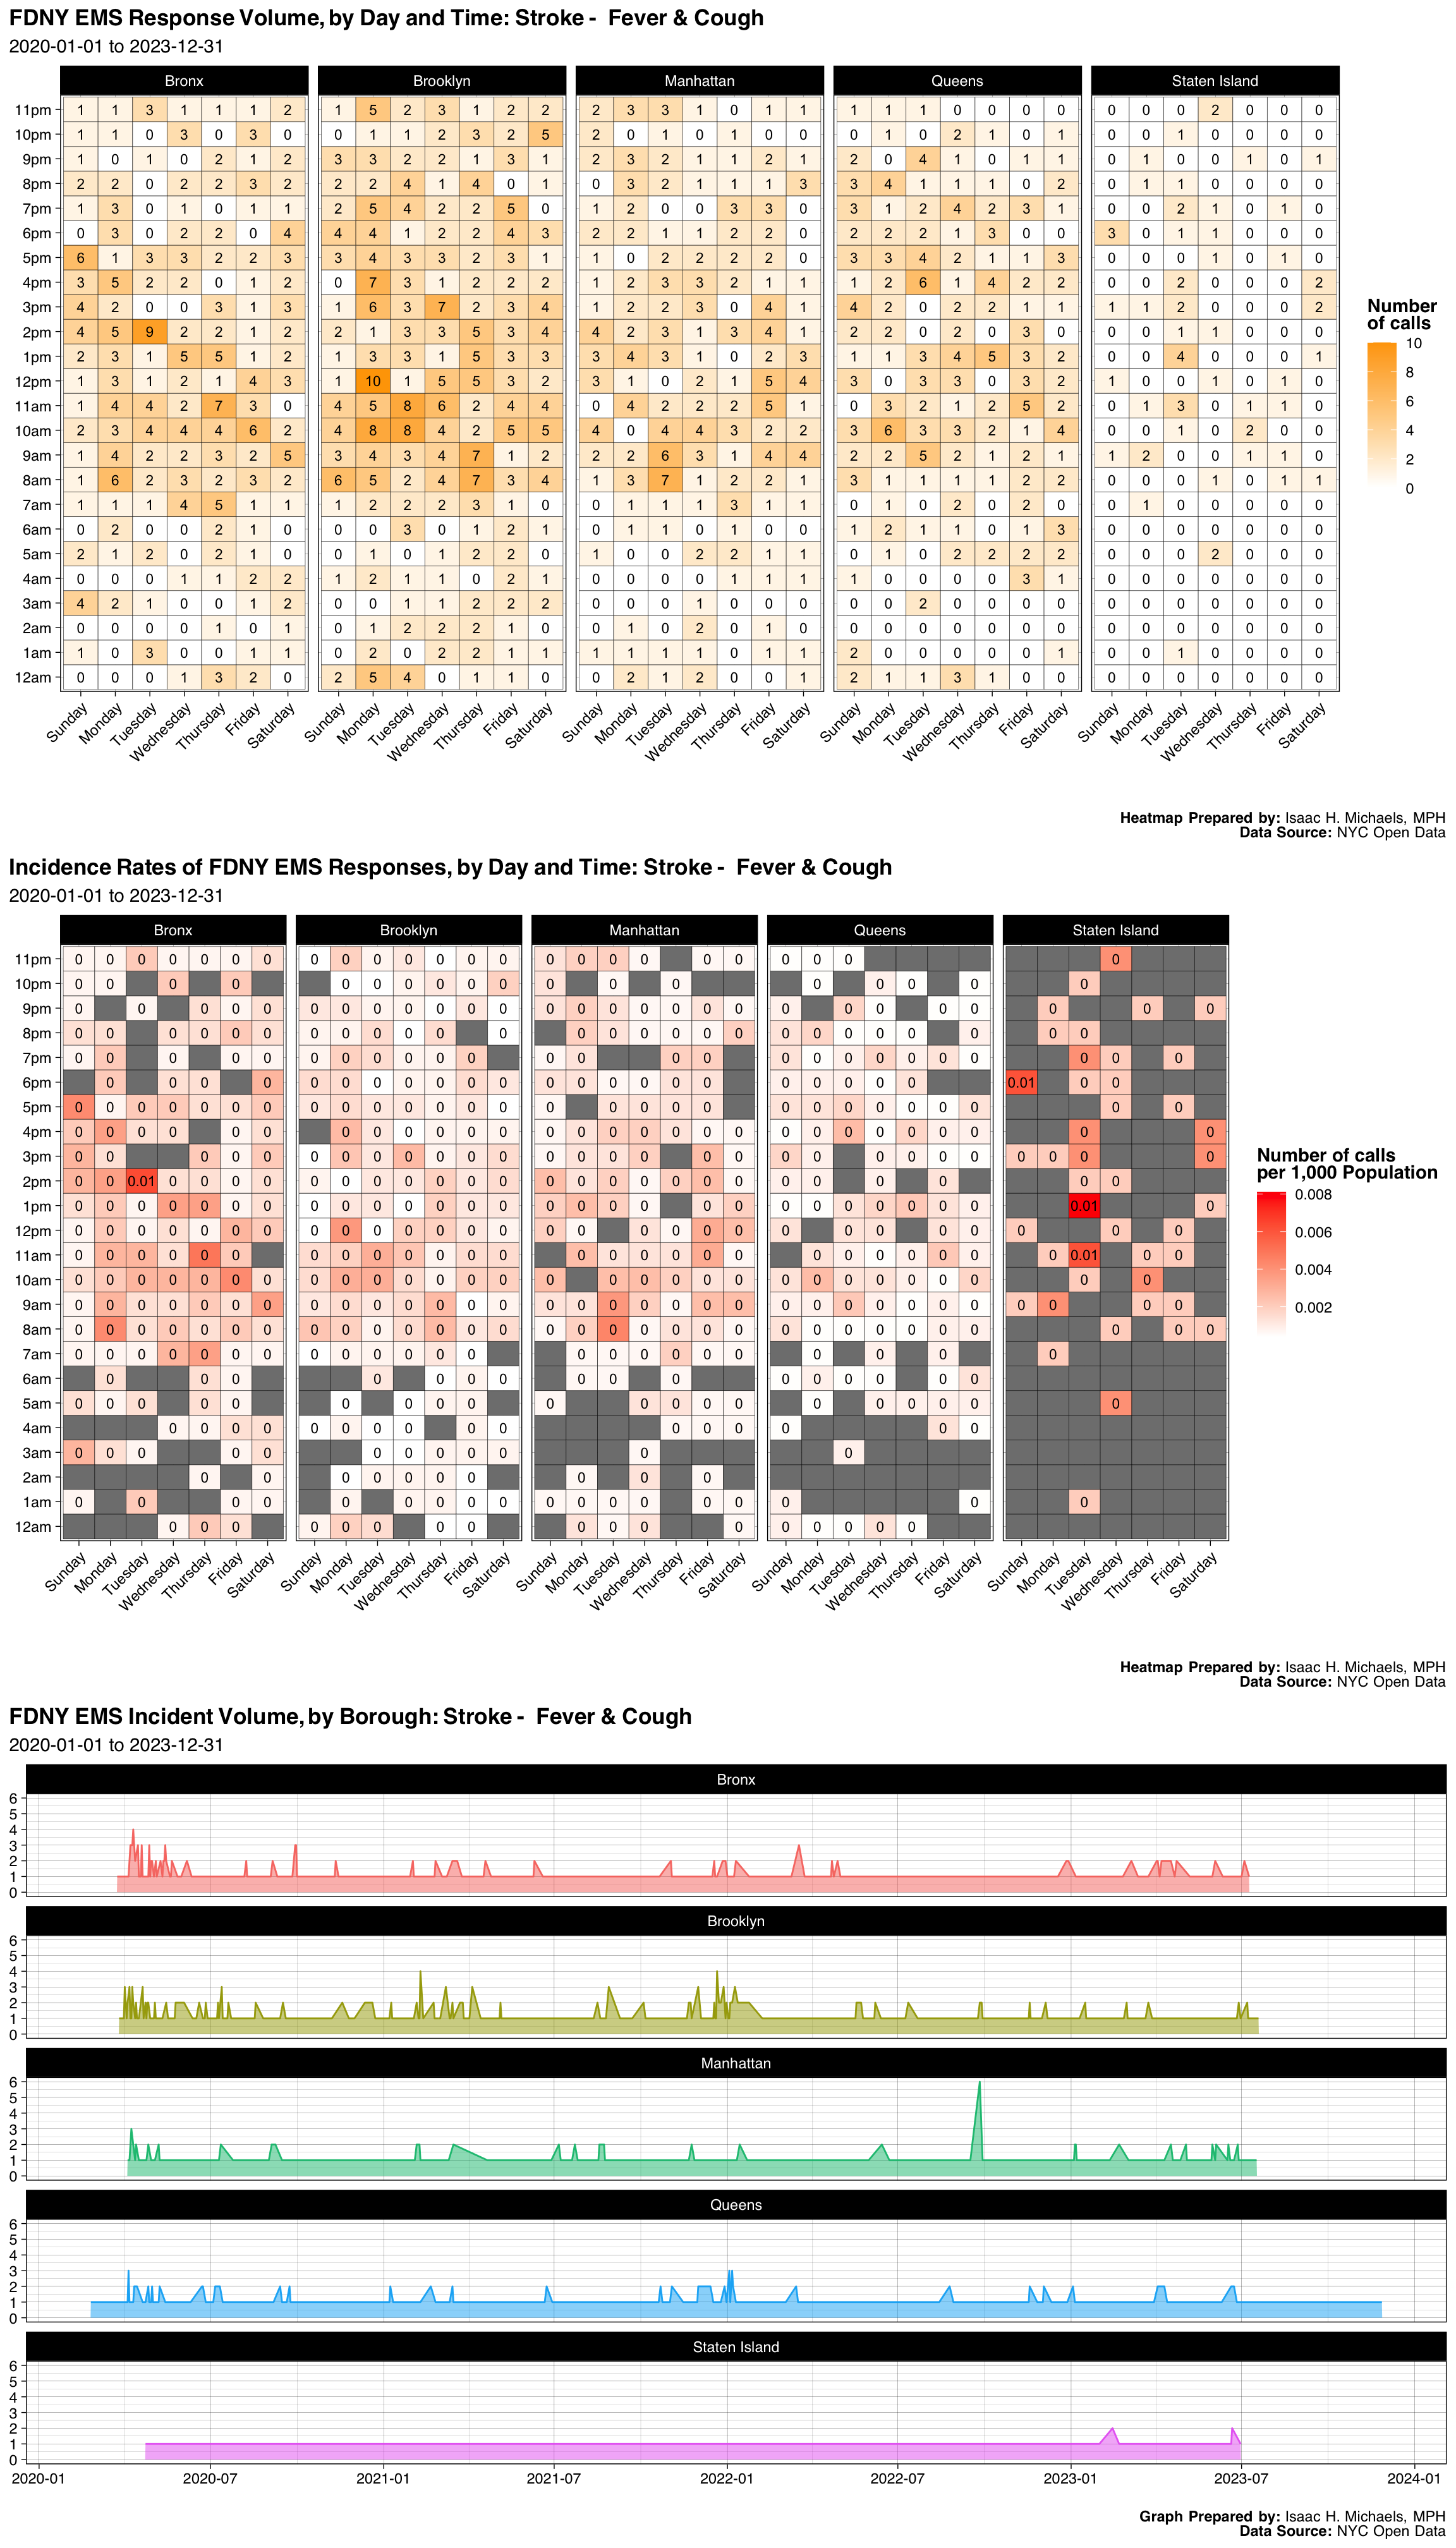
| Borough | Number | Percent |
|---|---|---|
| Bronx | 304 | 0.2362082 |
| Brooklyn | 421 | 0.3271173 |
| Manhattan | 254 | 0.1973582 |
| Queens | 248 | 0.1926962 |
| Staten Island | 60 | 0.0466200 |
| Final Severity Level | Number | Percent |
|---|---|---|
| 1 | 0 | 0% |
| 2 | 0 | 0% |
| 3 | 0 | 0% |
| 4 | 1287 | 1 |
| 5 | 0 | 0% |
| 6 | 0 | 0% |
| 7 | 0 | 0% |
| 8 | 0 | 0% |
| Disposition | Number | Percent |
|---|---|---|
| Transporting Patient | 1086 | 0.8438228 |
| Refused Medical Aid | 166 | 0.1289821 |
| Unfounded | 23 | 0.0178710 |
| Cancelled | 5 | 0.0038850 |
| Patient Gone on Arrival | 3 | 0.0023310 |
| Condition Corrected | 2 | 0.0015540 |
| Treated and Transported | 1 | 0.0007770 |
| Other | 1 | 0.0007770 |
Graphs, Heatmaps, and Tables Prepared By: Isaac H. Michaels, MPH
Data Source: NYC Open Data
Back to top
Baby Out Or Imminent Birth
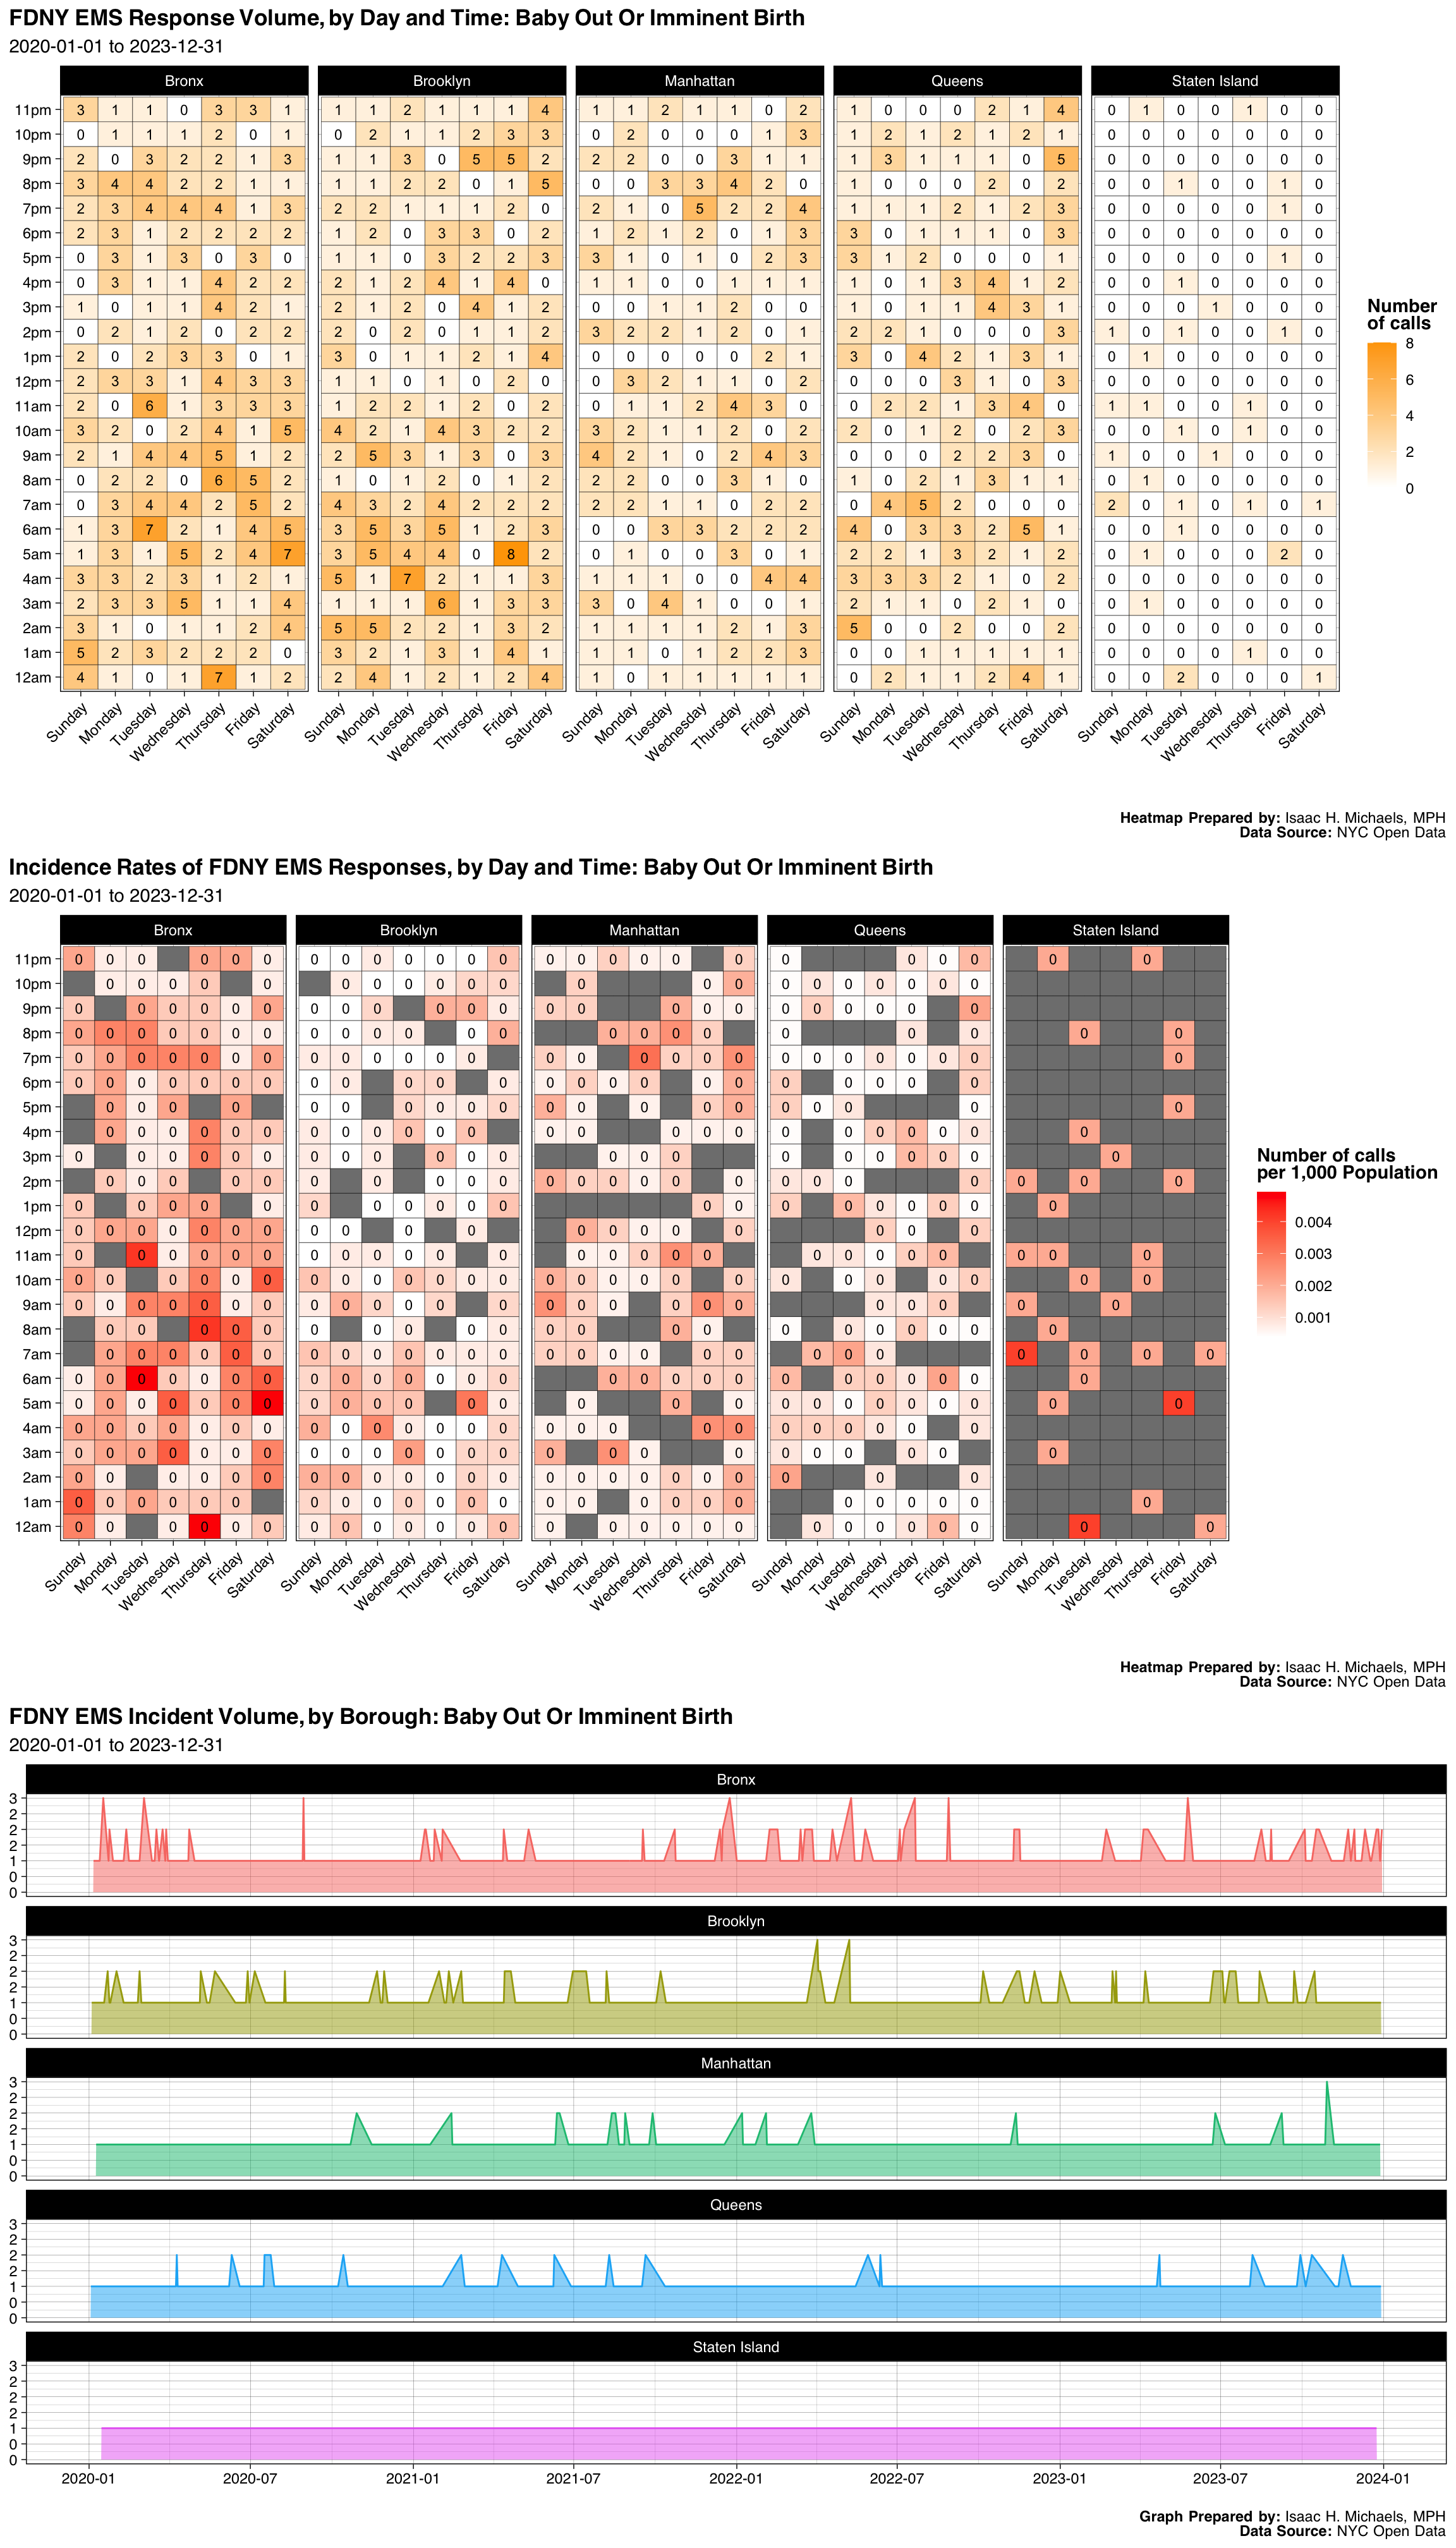
| Borough | Number | Percent |
|---|---|---|
| Bronx | 370 | 0.3065452 |
| Brooklyn | 341 | 0.2825186 |
| Manhattan | 222 | 0.1839271 |
| Queens | 240 | 0.1988401 |
| Staten Island | 34 | 0.0281690 |
| Final Severity Level | Number | Percent |
|---|---|---|
| 1 | 1 | 0.000828500414250207 |
| 2 | 6 | 0.00497100248550124 |
| 3 | 1199 | 0.993371996685998 |
| 4 | 1 | 0.000828500414250207 |
| 5 | 0 | 0% |
| 6 | 0 | 0% |
| 7 | 0 | 0% |
| 8 | 0 | 0% |
| Disposition | Number | Percent |
|---|---|---|
| Transporting Patient | 1103 | 0.9138360 |
| Unfounded | 35 | 0.0289975 |
| Patient Gone on Arrival | 28 | 0.0231980 |
| Refused Medical Aid | 16 | 0.0132560 |
| Cancelled | 14 | 0.0115990 |
| Other | 5 | 0.0041425 |
| Condition Corrected | 3 | 0.0024855 |
| Treated and Transported | 3 | 0.0024855 |
Graphs, Heatmaps, and Tables Prepared By: Isaac H. Michaels, MPH
Data Source: NYC Open Data
Back to top
Child Abuse
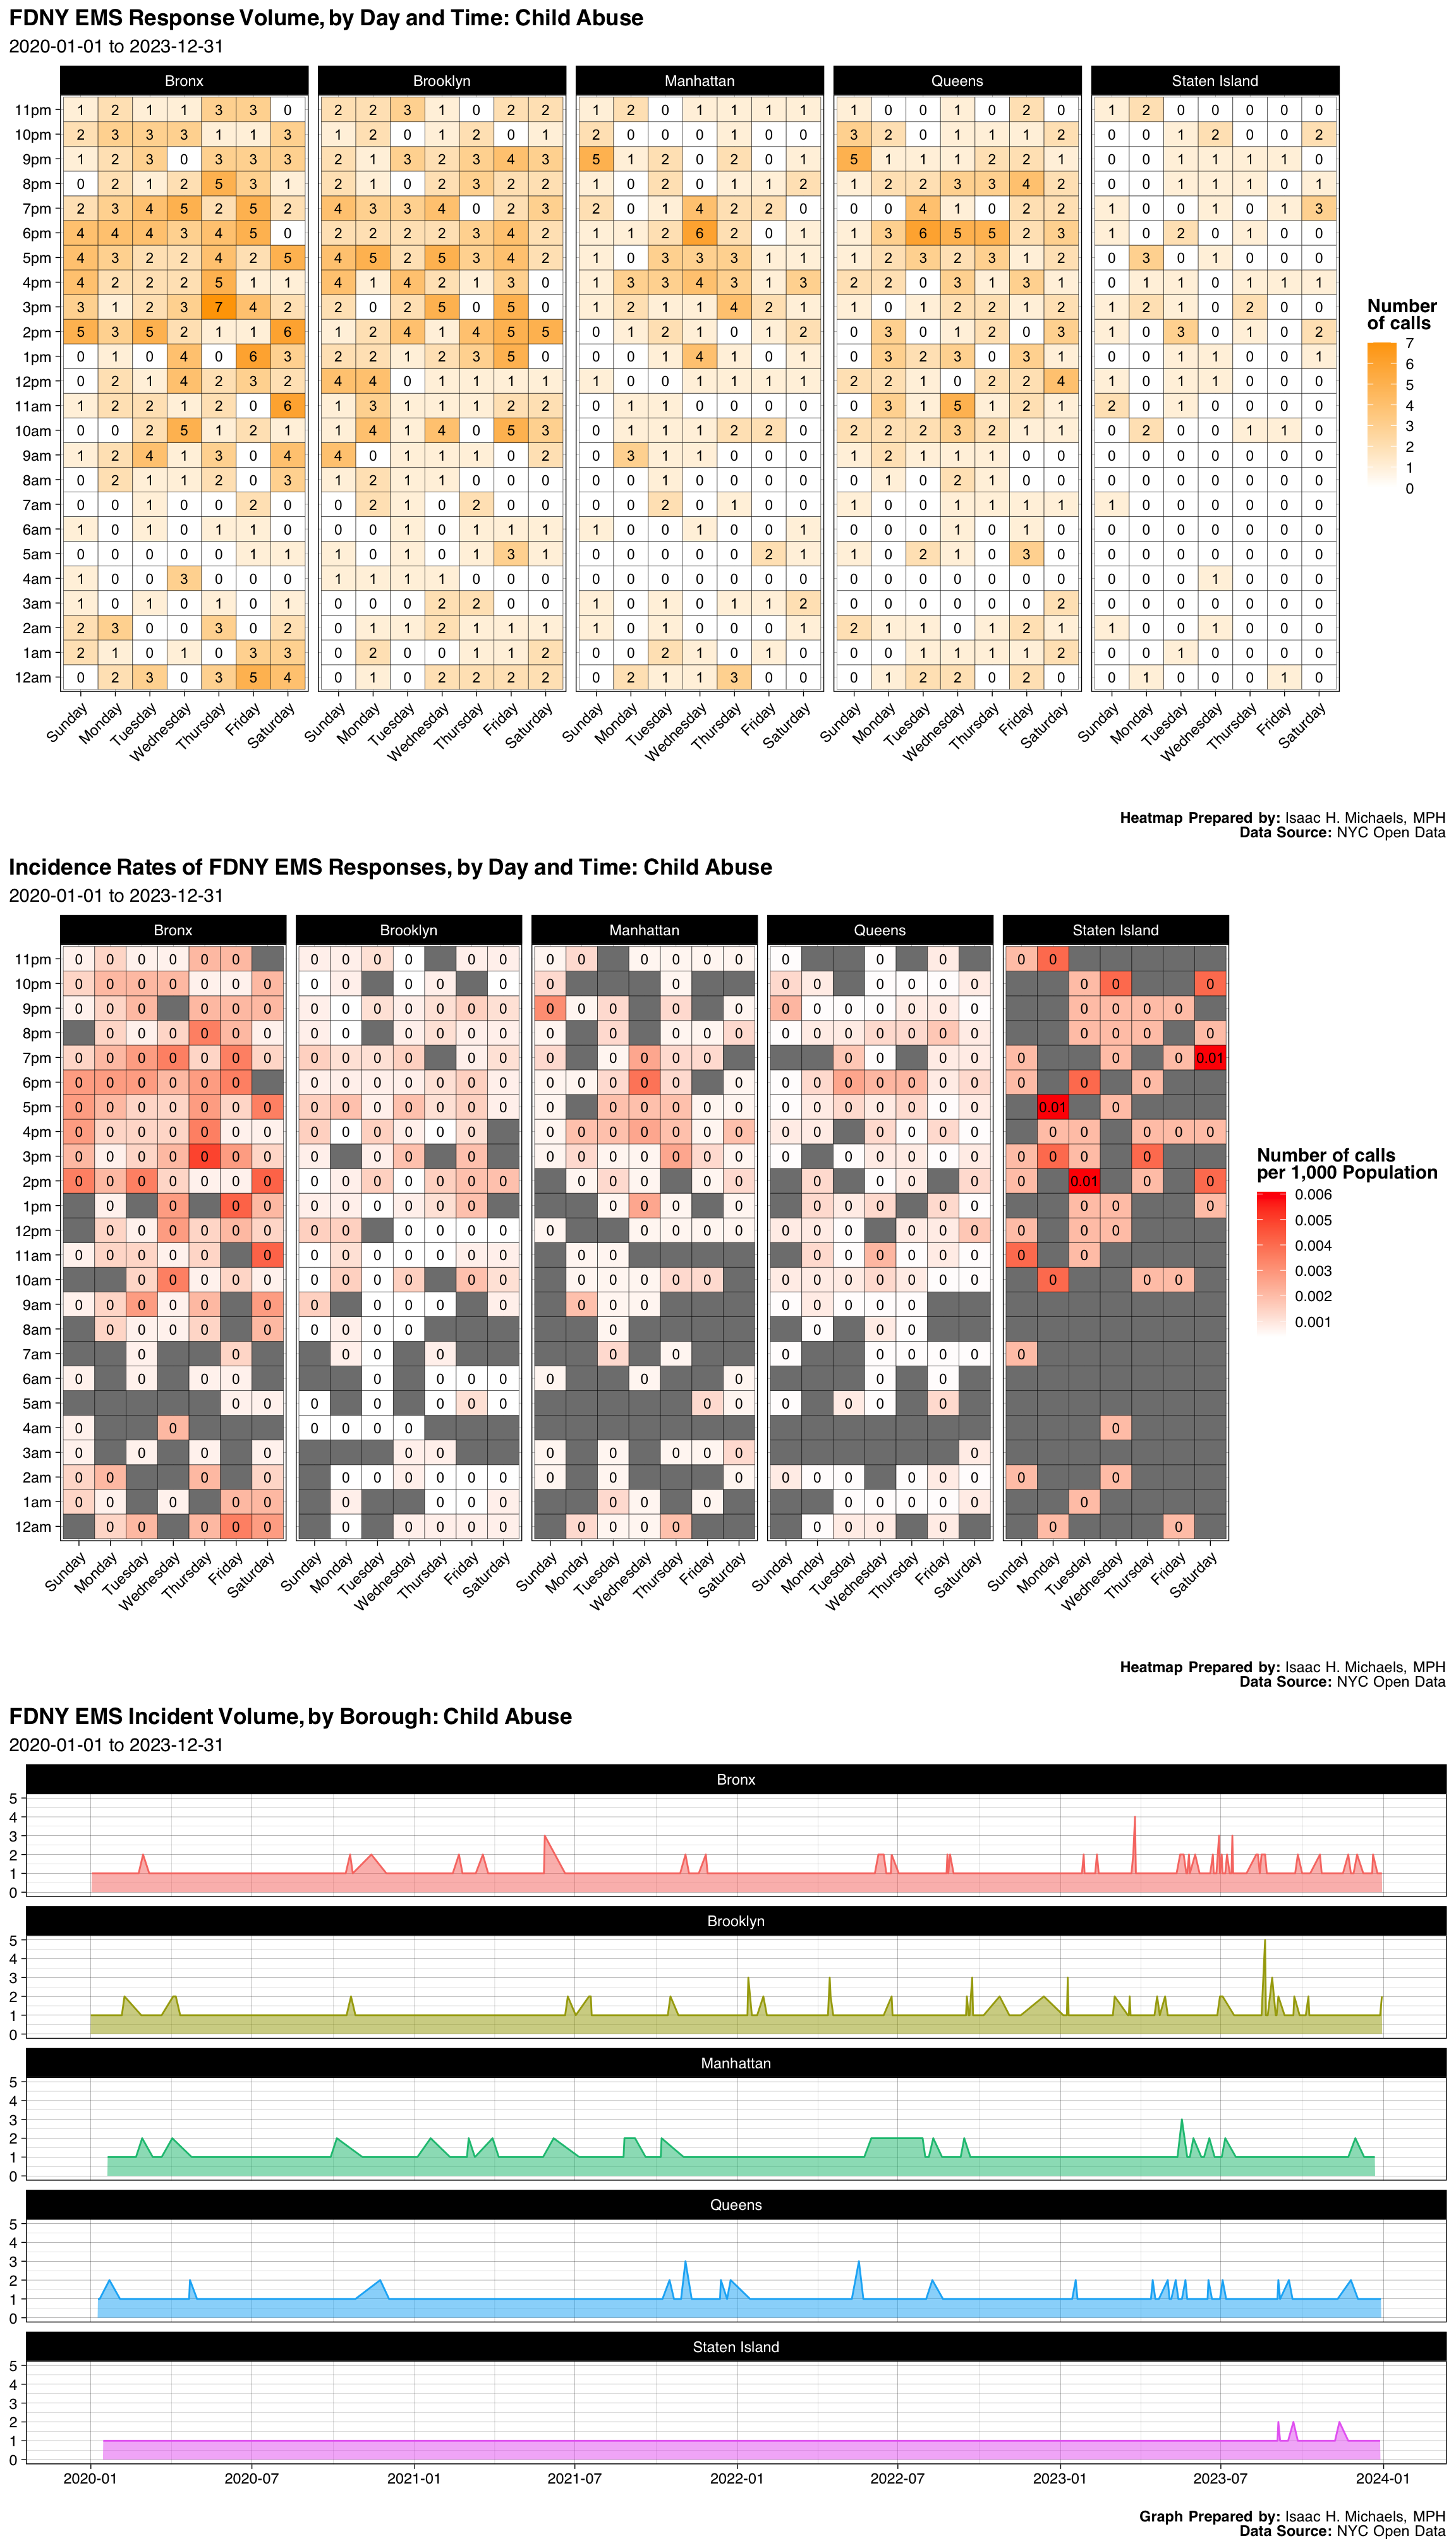
| Borough | Number | Percent |
|---|---|---|
| Bronx | 318 | 0.3057692 |
| Brooklyn | 277 | 0.2663462 |
| Manhattan | 157 | 0.1509615 |
| Queens | 220 | 0.2115385 |
| Staten Island | 68 | 0.0653846 |
| Final Severity Level | Number | Percent |
|---|---|---|
| 1 | 0 | 0% |
| 2 | 0 | 0% |
| 3 | 0 | 0% |
| 4 | 178 | 0.171153846153846 |
| 5 | 3 | 0.00288461538461538 |
| 6 | 859 | 0.825961538461538 |
| 7 | 0 | 0% |
| 8 | 0 | 0% |
| Disposition | Number | Percent |
|---|---|---|
| Transporting Patient | 522 | 0.5019231 |
| Refused Medical Aid | 169 | 0.1625000 |
| Condition Corrected | 128 | 0.1230769 |
| Unfounded | 127 | 0.1221154 |
| Patient Gone on Arrival | 50 | 0.0480769 |
| Cancelled | 33 | 0.0317308 |
| Other | 11 | 0.0105769 |
Graphs, Heatmaps, and Tables Prepared By: Isaac H. Michaels, MPH
Data Source: NYC Open Data
Back to top
Amputation, Fingers Or Toes
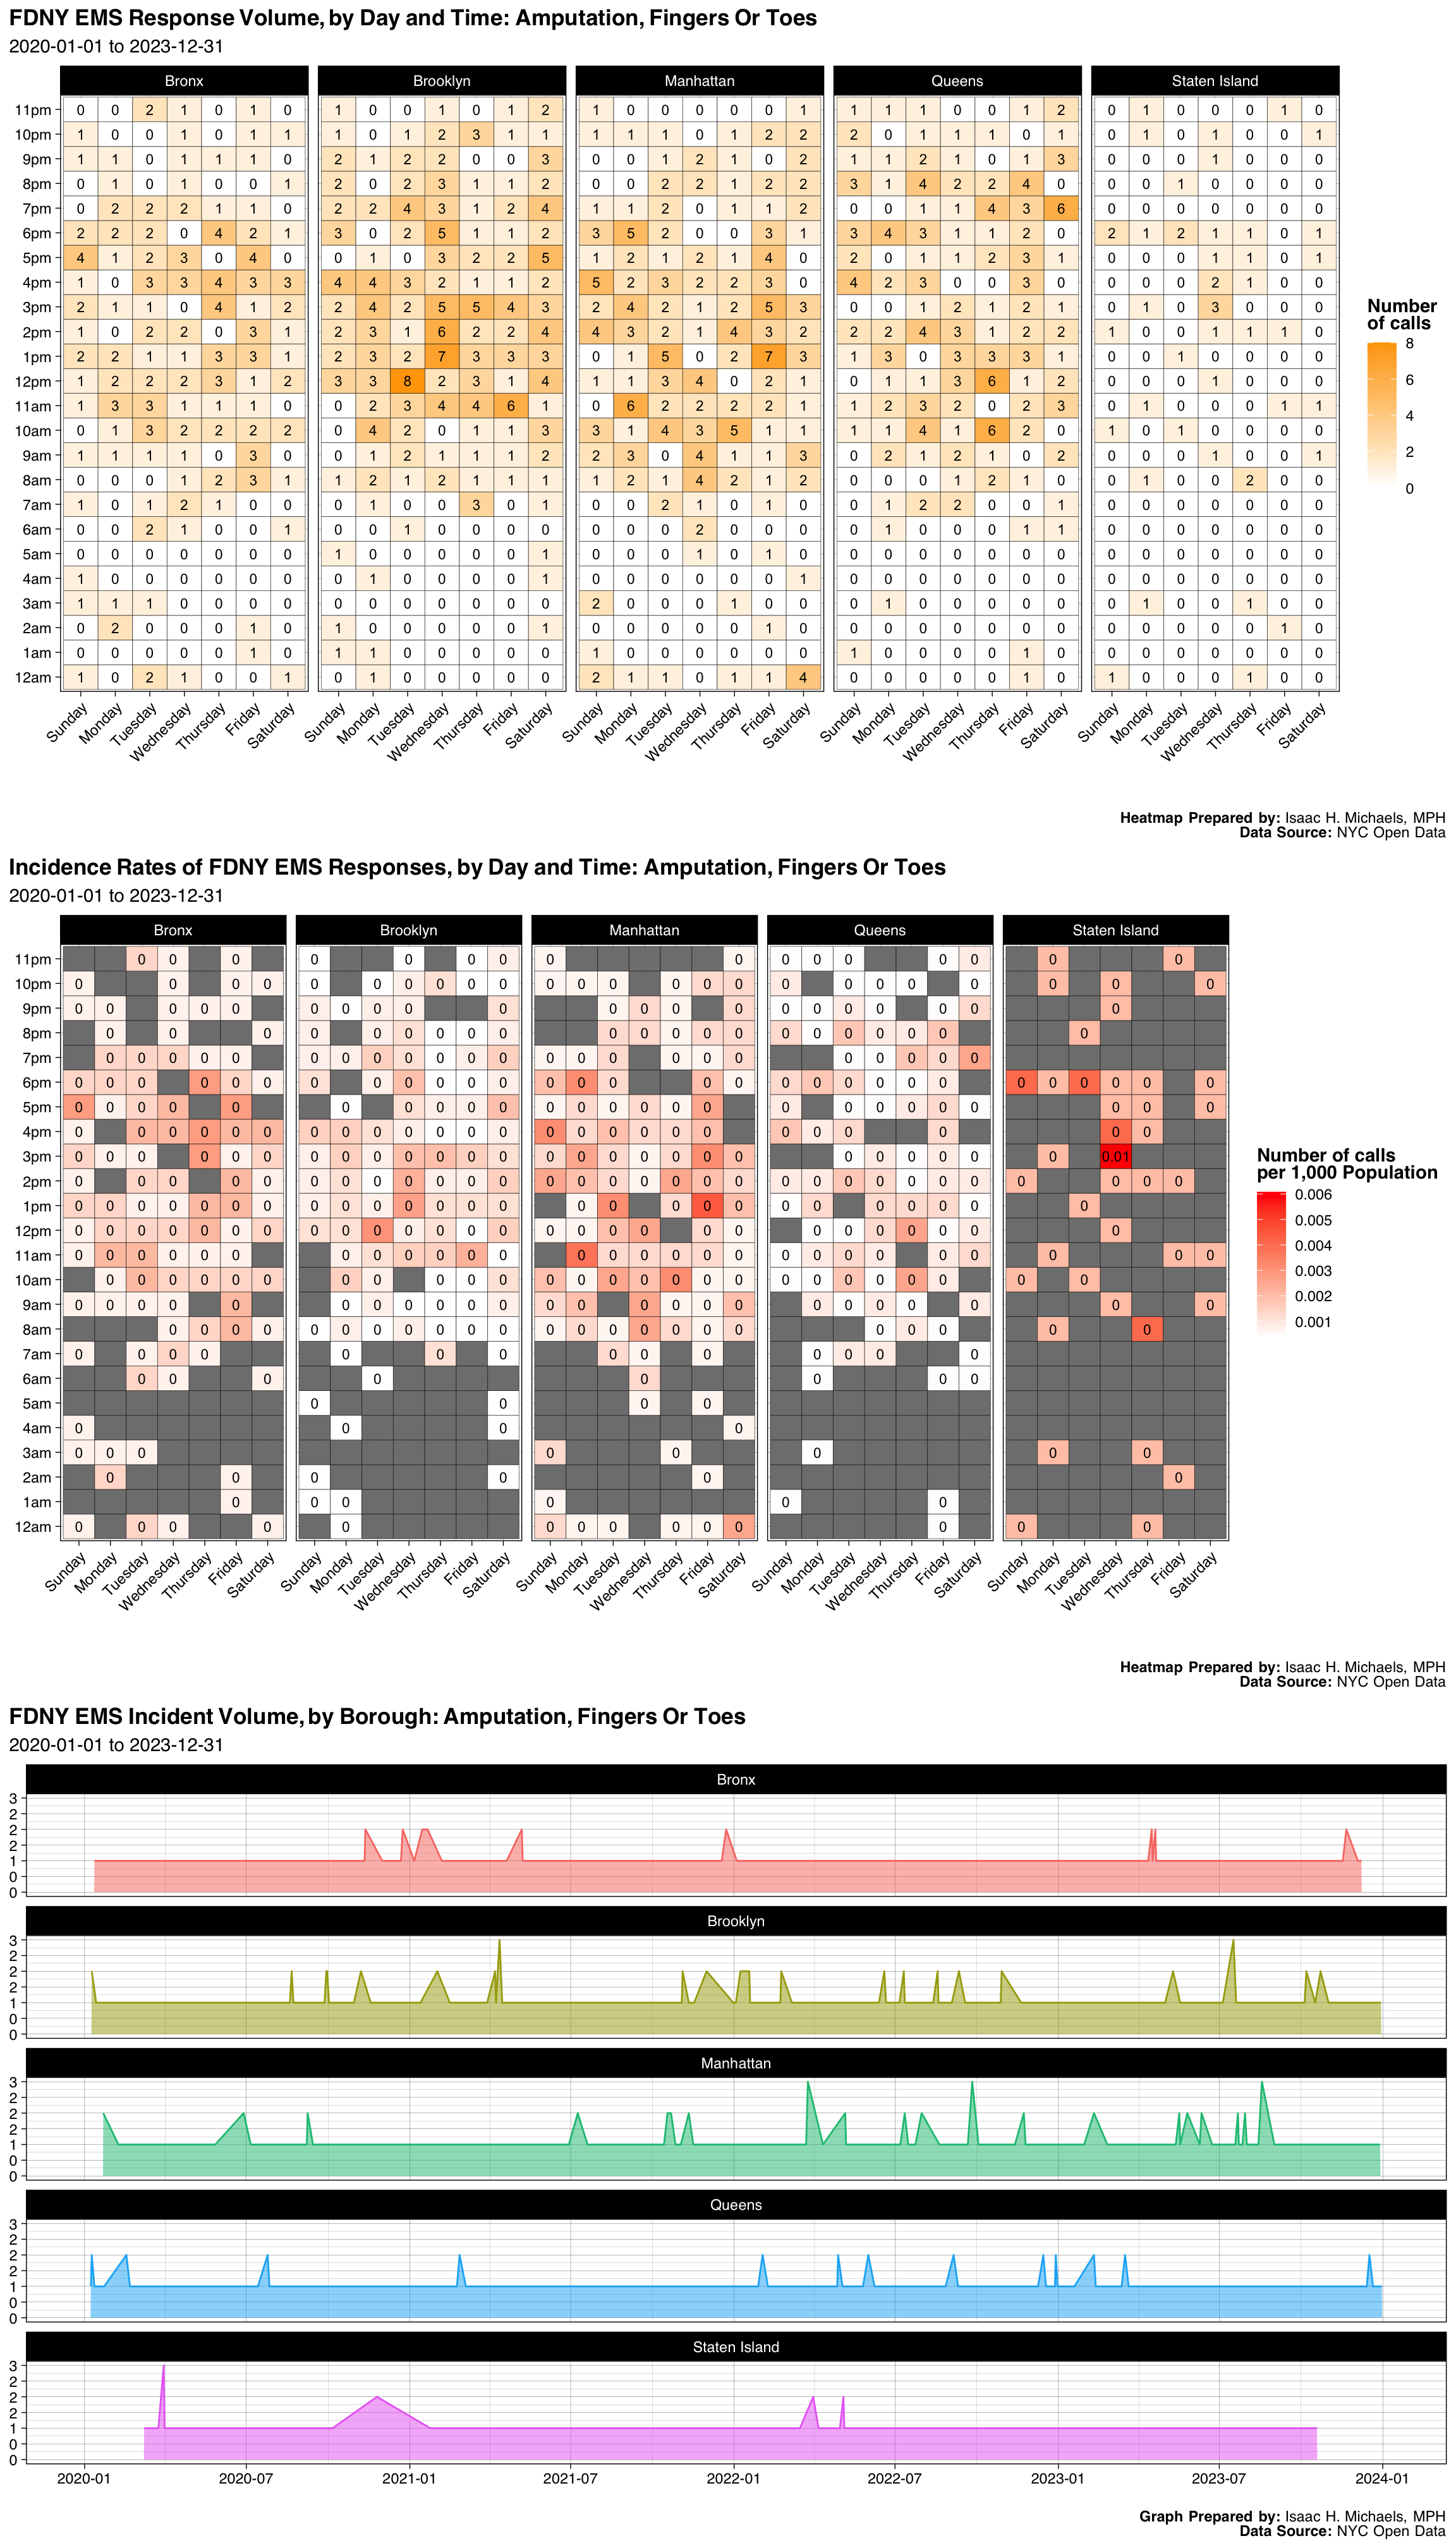
| Borough | Number | Percent |
|---|---|---|
| Bronx | 172 | 0.1934758 |
| Brooklyn | 252 | 0.2834646 |
| Manhattan | 227 | 0.2553431 |
| Queens | 192 | 0.2159730 |
| Staten Island | 46 | 0.0517435 |
| Final Severity Level | Number | Percent |
|---|---|---|
| 1 | 0 | 0% |
| 2 | 1 | 0.00112485939257593 |
| 3 | 1 | 0.00112485939257593 |
| 4 | 57 | 0.0641169853768279 |
| 5 | 830 | 0.93363329583802 |
| 6 | 0 | 0% |
| 7 | 0 | 0% |
| 8 | 0 | 0% |
| Disposition | Number | Percent |
|---|---|---|
| Transporting Patient | 743 | 0.8357705 |
| Patient Gone on Arrival | 50 | 0.0562430 |
| Refused Medical Aid | 41 | 0.0461192 |
| Unfounded | 34 | 0.0382452 |
| Cancelled | 13 | 0.0146232 |
| Other | 7 | 0.0078740 |
| Condition Corrected | 1 | 0.0011249 |
Graphs, Heatmaps, and Tables Prepared By: Isaac H. Michaels, MPH
Data Source: NYC Open Data
Back to top
Reaction To Med - Fever&Cough
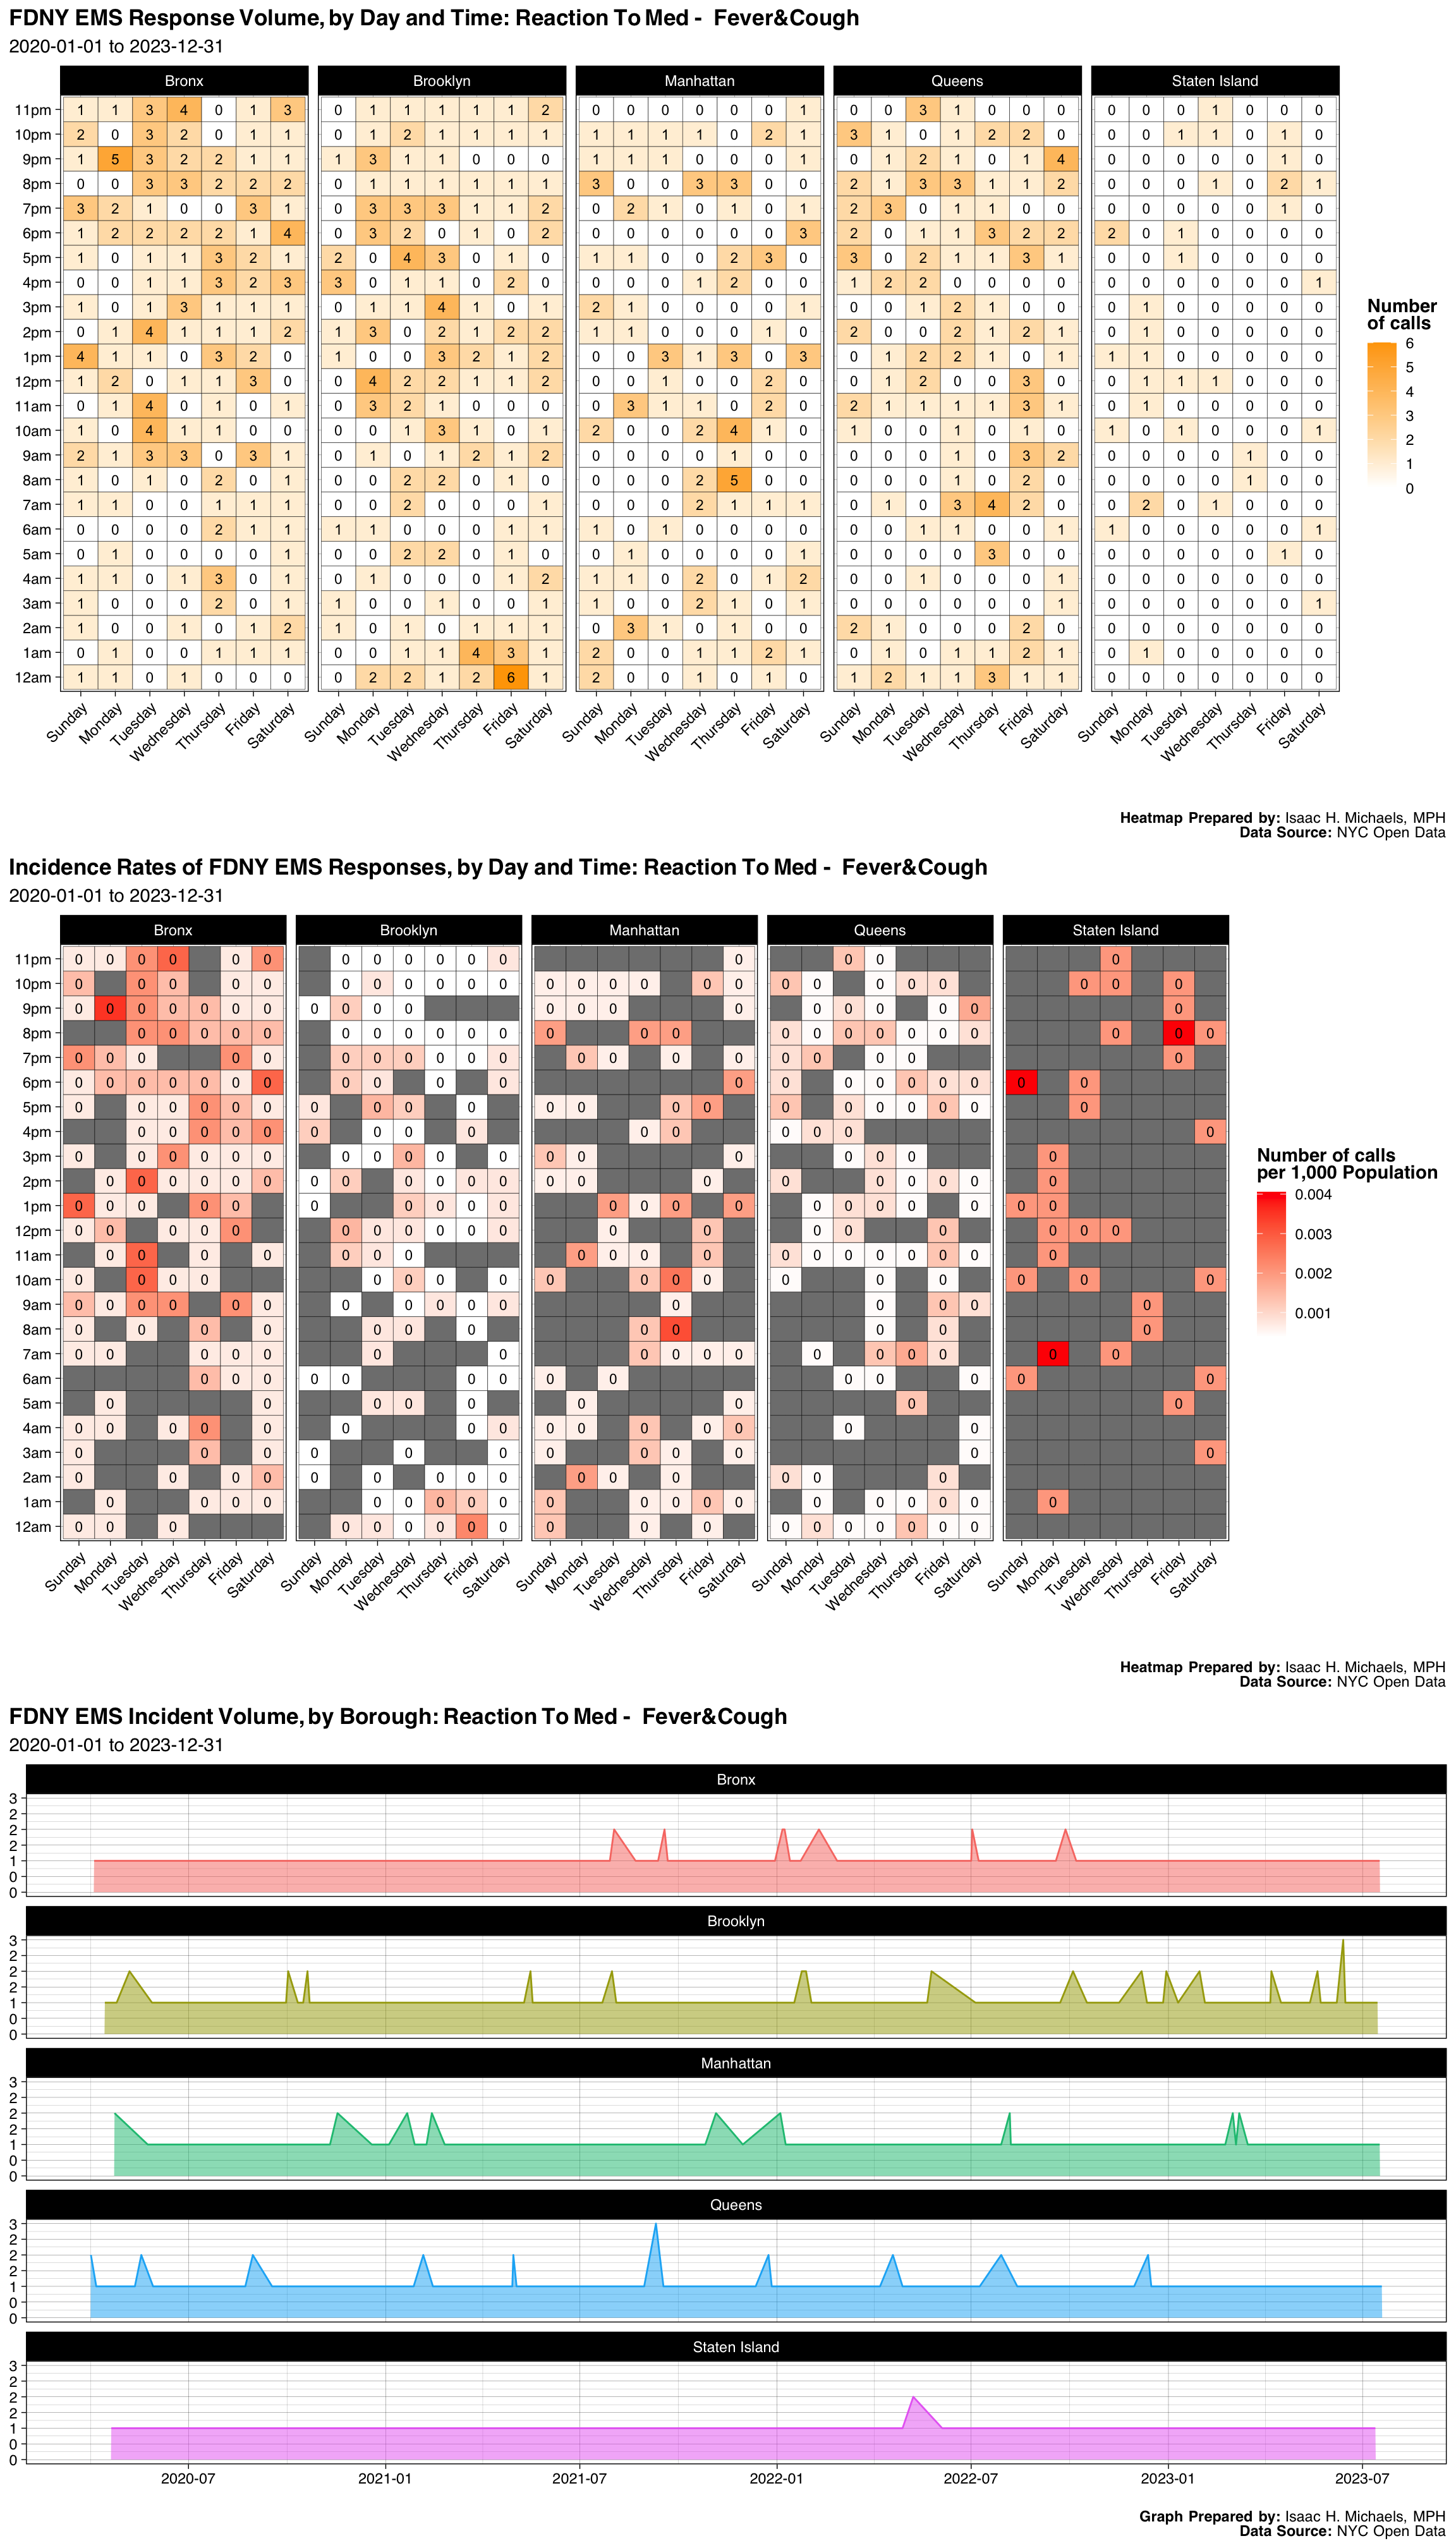
| Borough | Number | Percent |
|---|---|---|
| Bronx | 195 | 0.2855051 |
| Brooklyn | 176 | 0.2576867 |
| Manhattan | 120 | 0.1756955 |
| Queens | 156 | 0.2284041 |
| Staten Island | 36 | 0.0527086 |
| Final Severity Level | Number | Percent |
|---|---|---|
| 1 | 0 | 0% |
| 2 | 0 | 0% |
| 3 | 0 | 0% |
| 4 | 91 | 0.133235724743777 |
| 5 | 592 | 0.866764275256223 |
| 6 | 0 | 0% |
| 7 | 0 | 0% |
| 8 | 0 | 0% |
| Disposition | Number | Percent |
|---|---|---|
| Transporting Patient | 502 | 0.7349927 |
| Refused Medical Aid | 157 | 0.2298682 |
| Unfounded | 10 | 0.0146413 |
| Patient Gone on Arrival | 8 | 0.0117130 |
| Cancelled | 2 | 0.0029283 |
| Other | 2 | 0.0029283 |
| Condition Corrected | 1 | 0.0014641 |
| Treated and Transported | 1 | 0.0014641 |
Graphs, Heatmaps, and Tables Prepared By: Isaac H. Michaels, MPH
Data Source: NYC Open Data
Back to top
Choking Fever&Cough
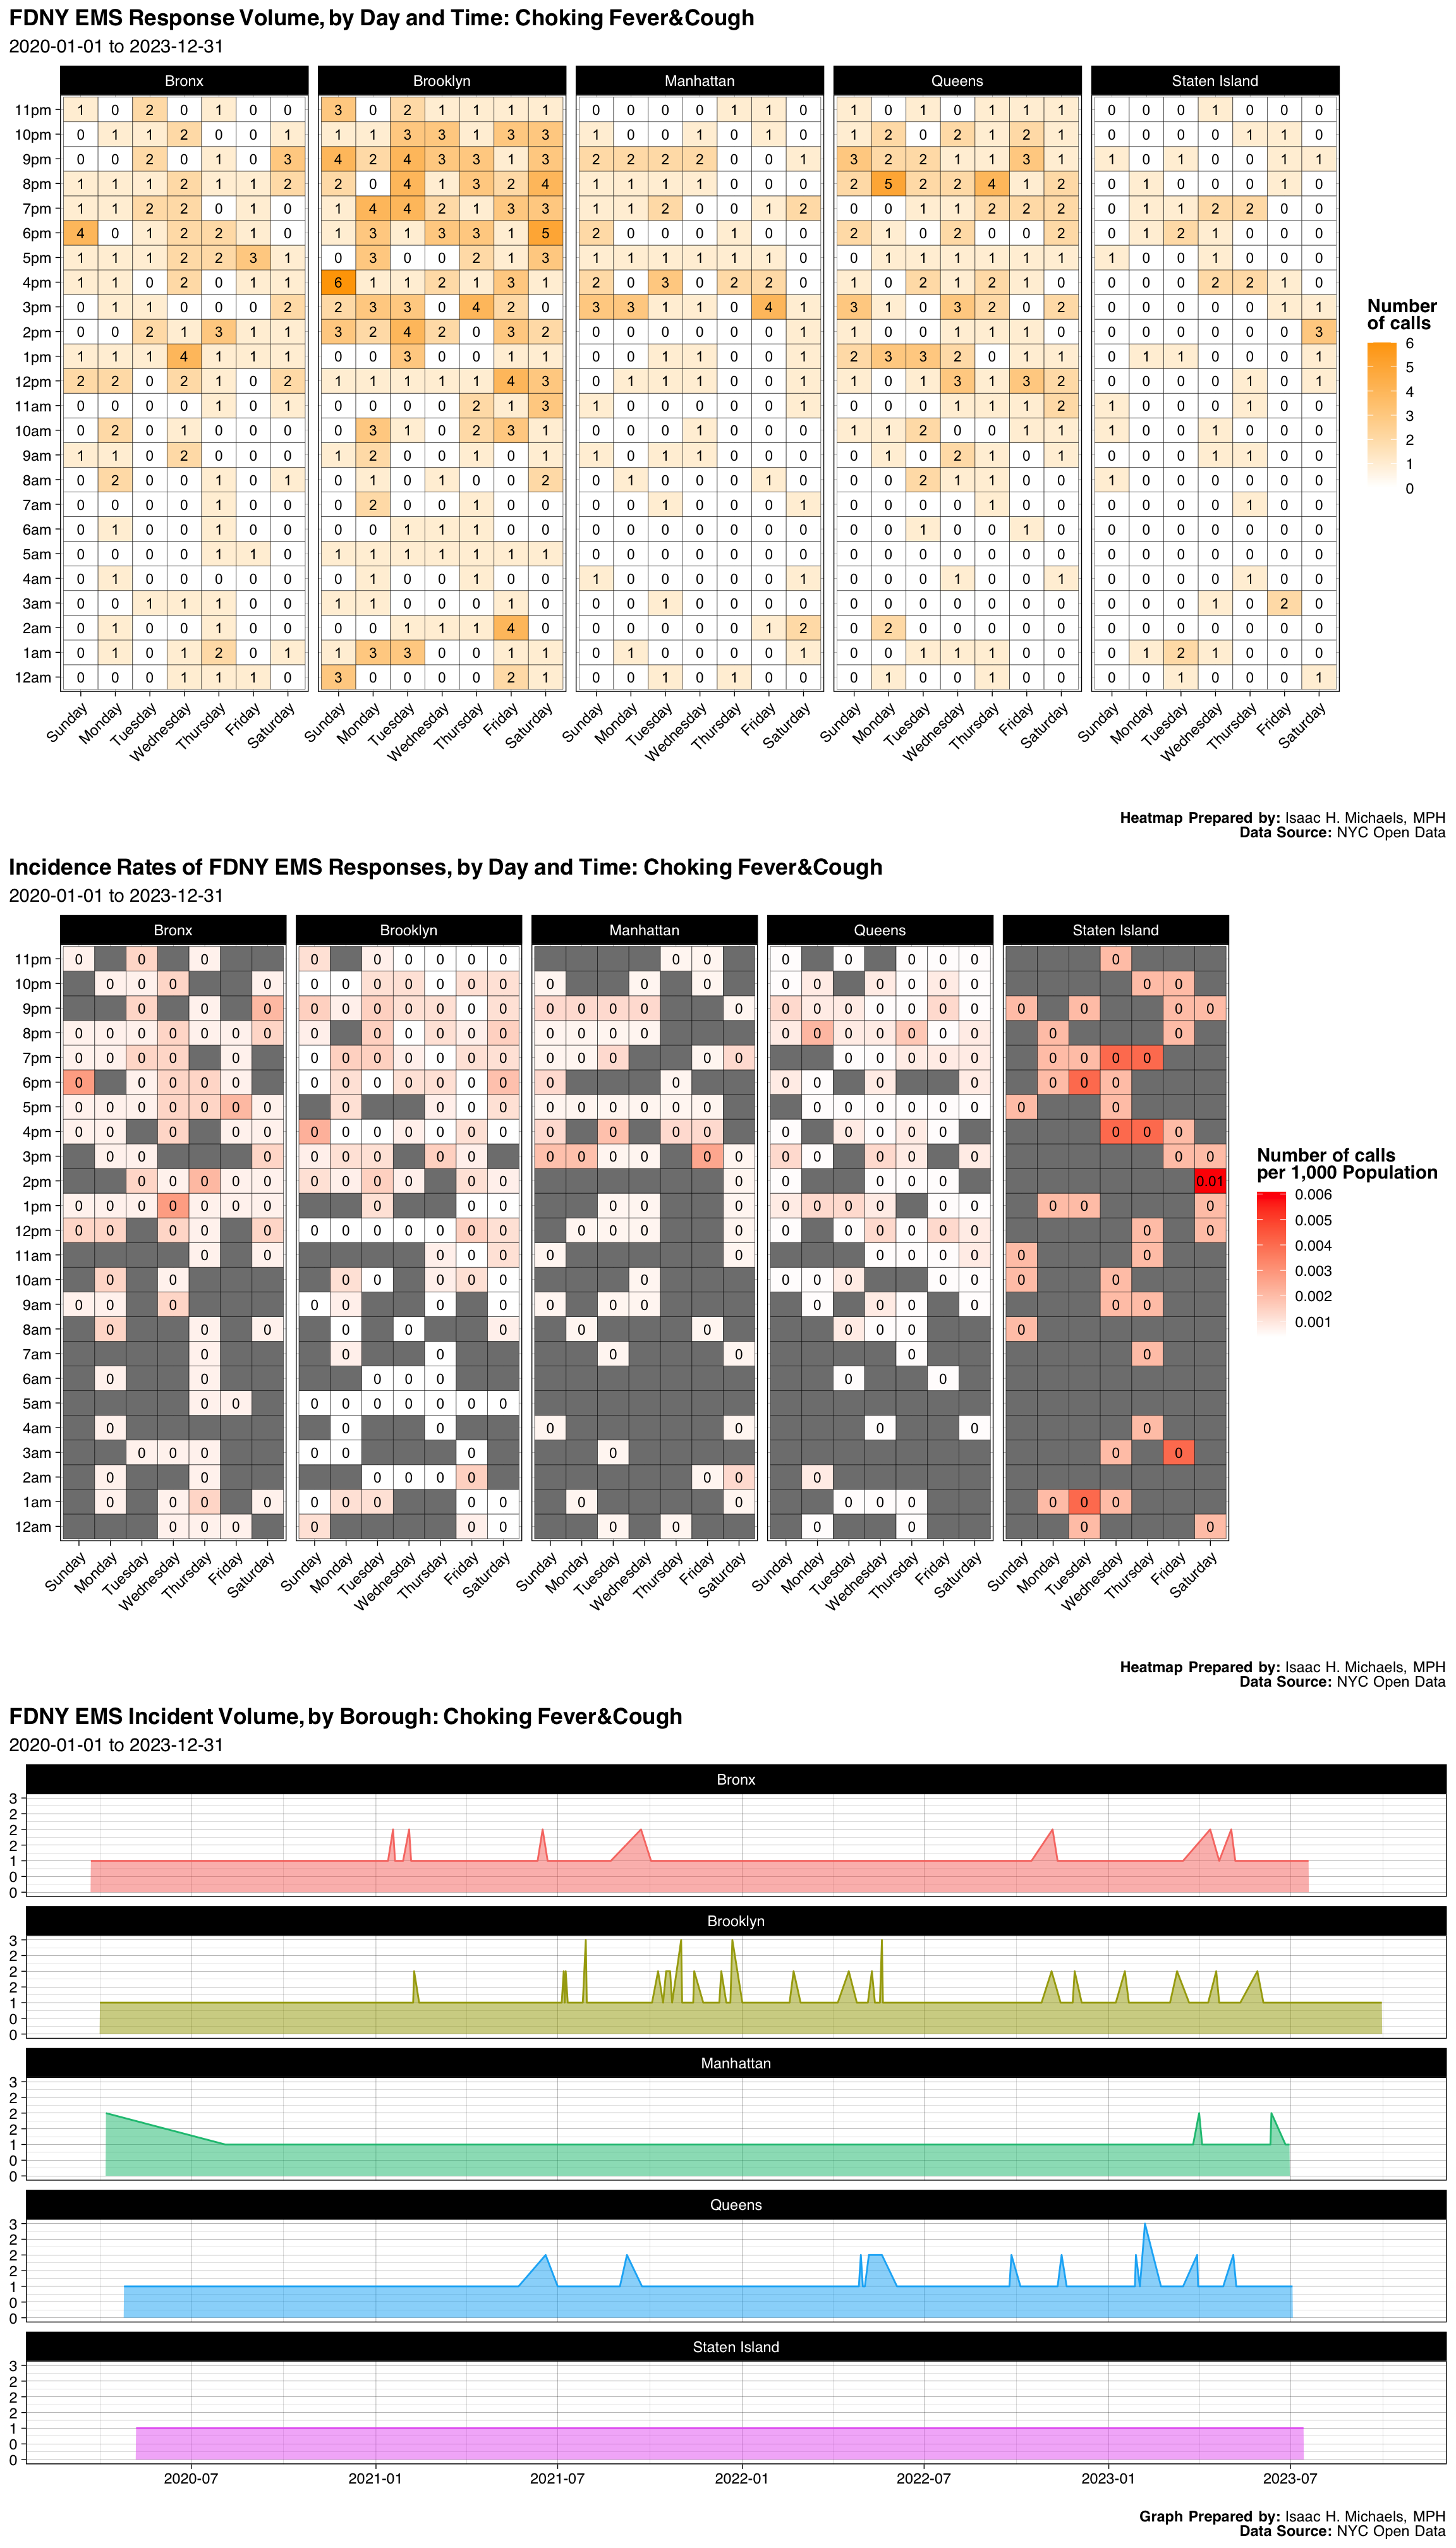
| Borough | Number | Percent |
|---|---|---|
| Bronx | 121 | 0.1911532 |
| Brooklyn | 231 | 0.3649289 |
| Manhattan | 84 | 0.1327014 |
| Queens | 143 | 0.2259084 |
| Staten Island | 54 | 0.0853081 |
| Final Severity Level | Number | Percent |
|---|---|---|
| 1 | 633 | 1 |
| 2 | 0 | 0% |
| 3 | 0 | 0% |
| 4 | 0 | 0% |
| 5 | 0 | 0% |
| 6 | 0 | 0% |
| 7 | 0 | 0% |
| 8 | 0 | 0% |
| Disposition | Number | Percent |
|---|---|---|
| Transporting Patient | 457 | 0.7219589 |
| Refused Medical Aid | 151 | 0.2385466 |
| Cancelled | 8 | 0.0126382 |
| Patient Gone on Arrival | 8 | 0.0126382 |
| Unfounded | 7 | 0.0110585 |
| Condition Corrected | 1 | 0.0015798 |
| Patient Pronounced Dead | 1 | 0.0015798 |
Graphs, Heatmaps, and Tables Prepared By: Isaac H. Michaels, MPH
Data Source: NYC Open Data
Back to top
Two Alarm Fire
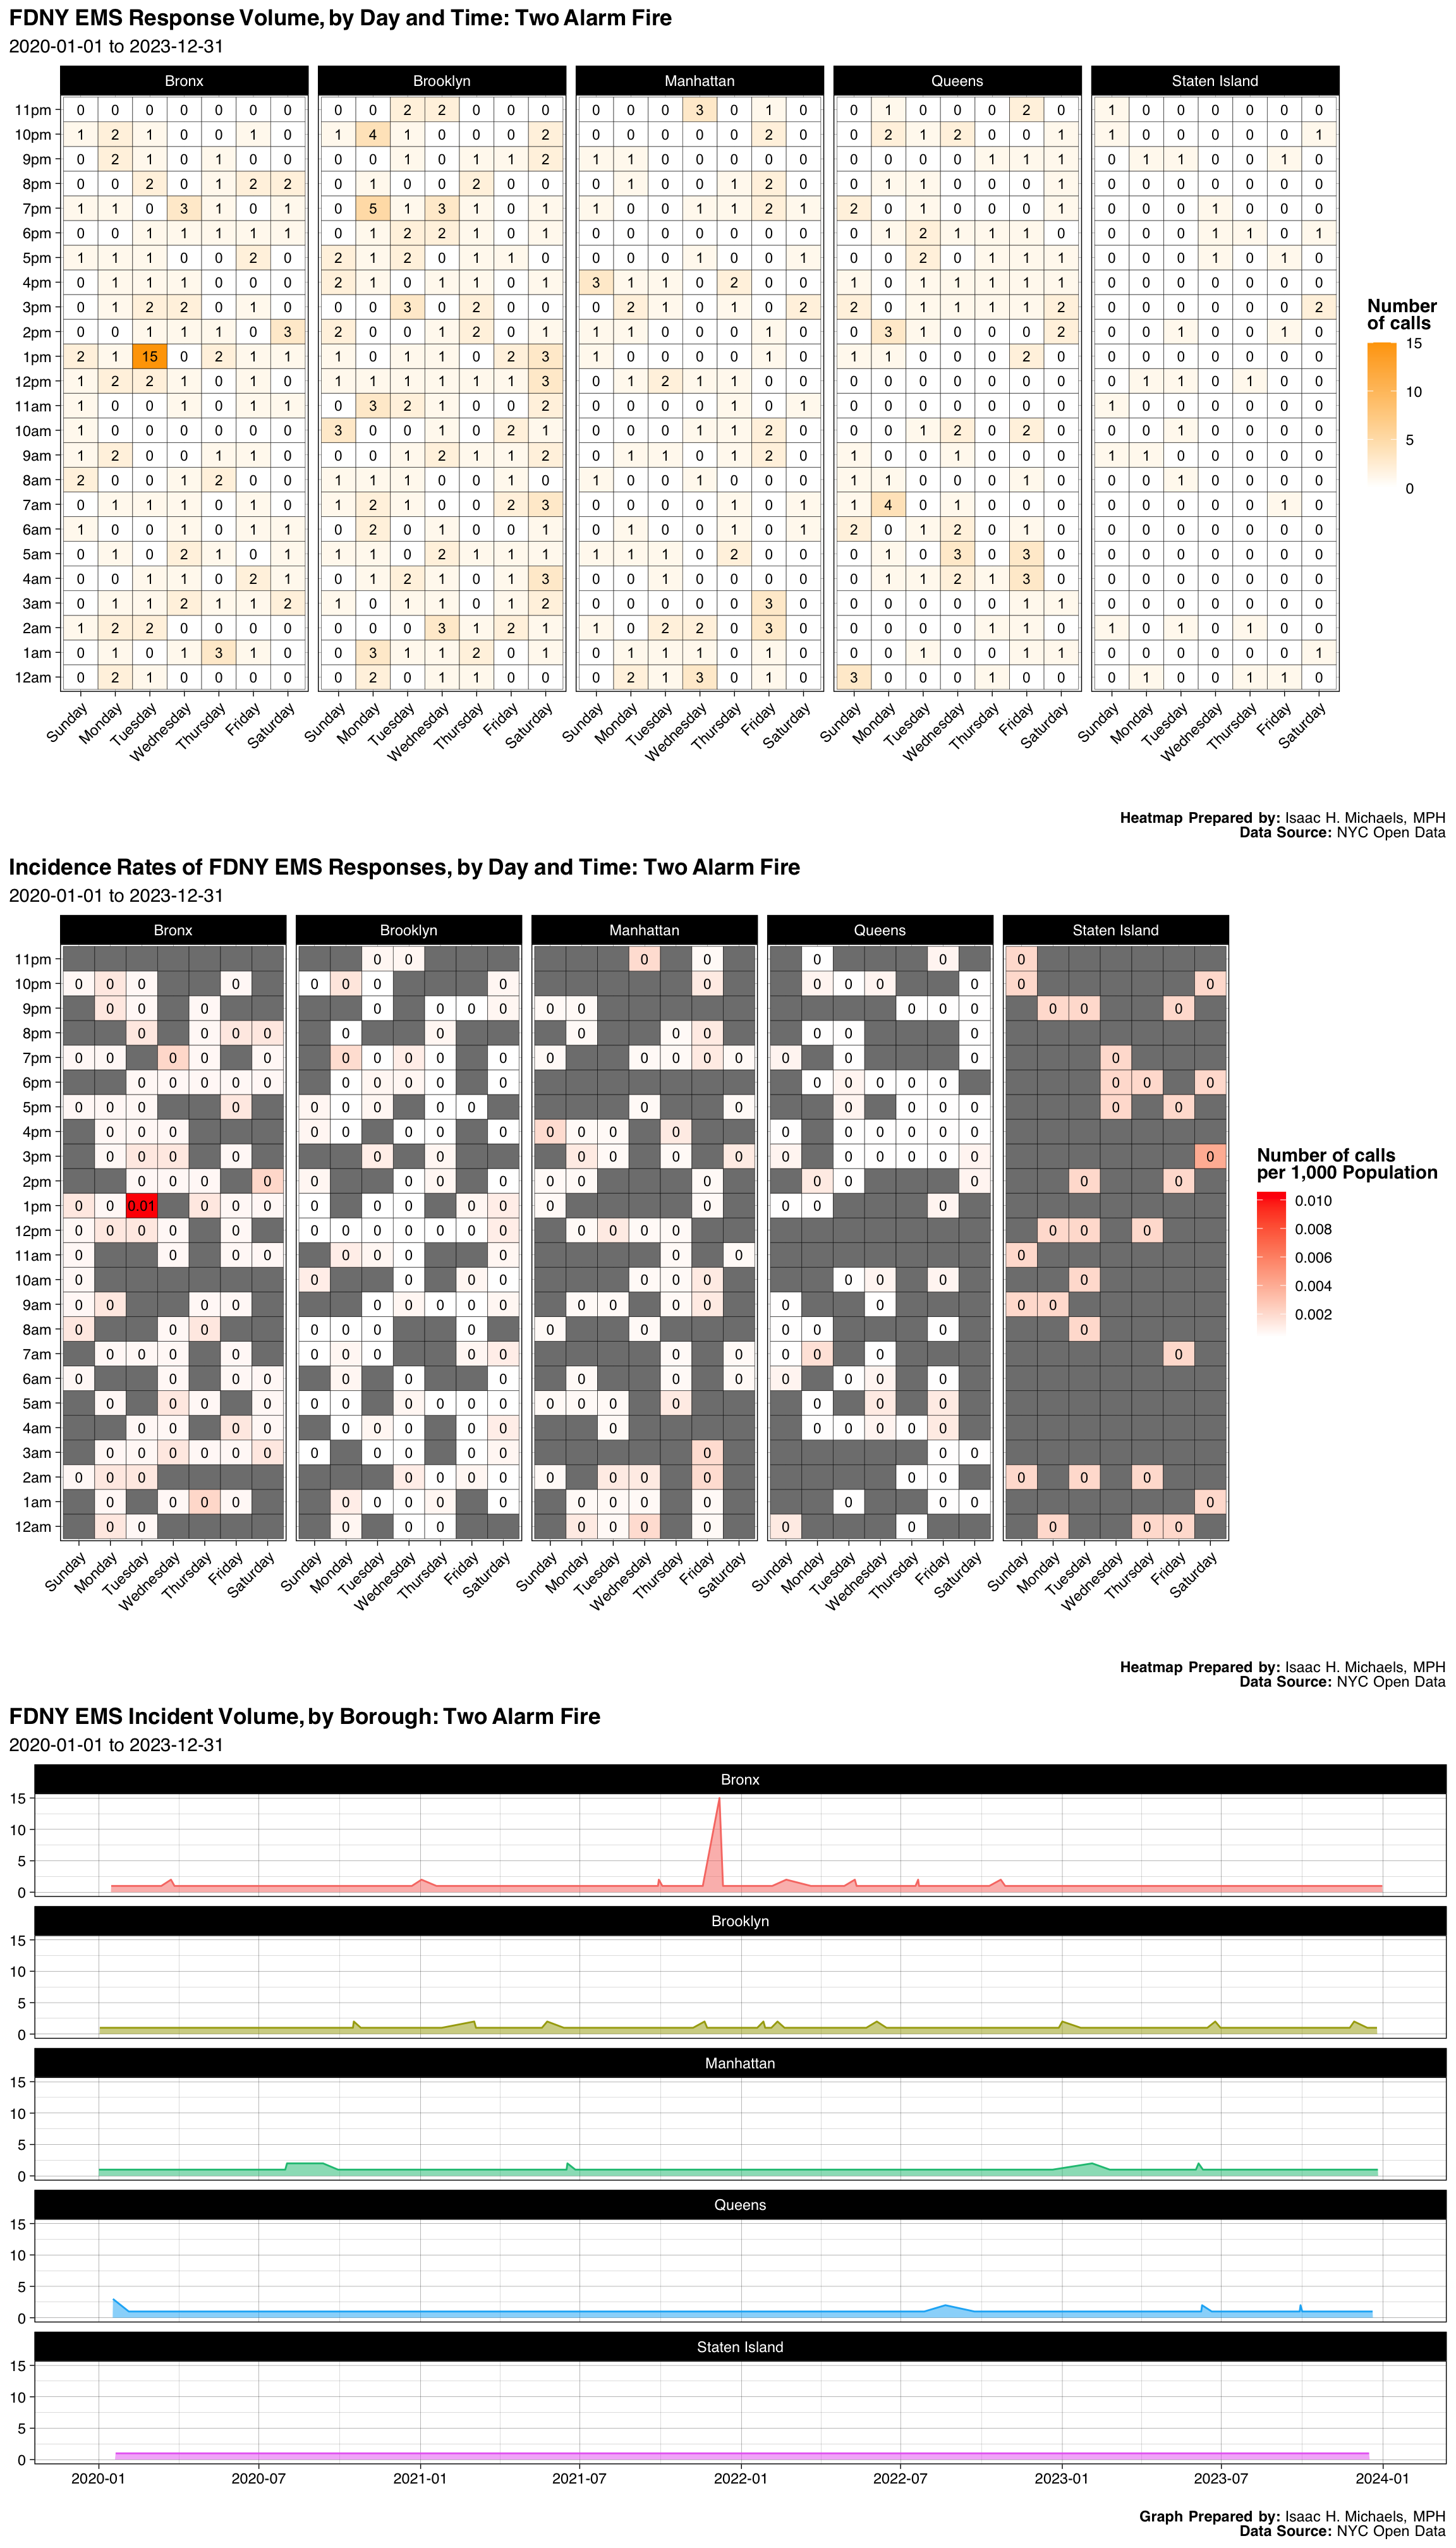
| Borough | Number | Percent |
|---|---|---|
| Bronx | 132 | 0.2573099 |
| Brooklyn | 158 | 0.3079922 |
| Manhattan | 89 | 0.1734893 |
| Queens | 102 | 0.1988304 |
| Staten Island | 32 | 0.0623782 |
| Final Severity Level | Number | Percent |
|---|---|---|
| 1 | 0 | 0% |
| 2 | 513 | 1 |
| 3 | 0 | 0% |
| 4 | 0 | 0% |
| 5 | 0 | 0% |
| 6 | 0 | 0% |
| 7 | 0 | 0% |
| 8 | 0 | 0% |
| Disposition | Number | Percent |
|---|---|---|
| Transporting Patient | 348 | 0.6783626 |
| Cancelled | 134 | 0.2612086 |
| Condition Corrected | 16 | 0.0311891 |
| Refused Medical Aid | 12 | 0.0233918 |
| Patient Gone on Arrival | 1 | 0.0019493 |
| Unfounded | 1 | 0.0019493 |
| Other | 1 | 0.0019493 |
Graphs, Heatmaps, and Tables Prepared By: Isaac H. Michaels, MPH
Data Source: NYC Open Data
Back to top
Ground Transport Incident
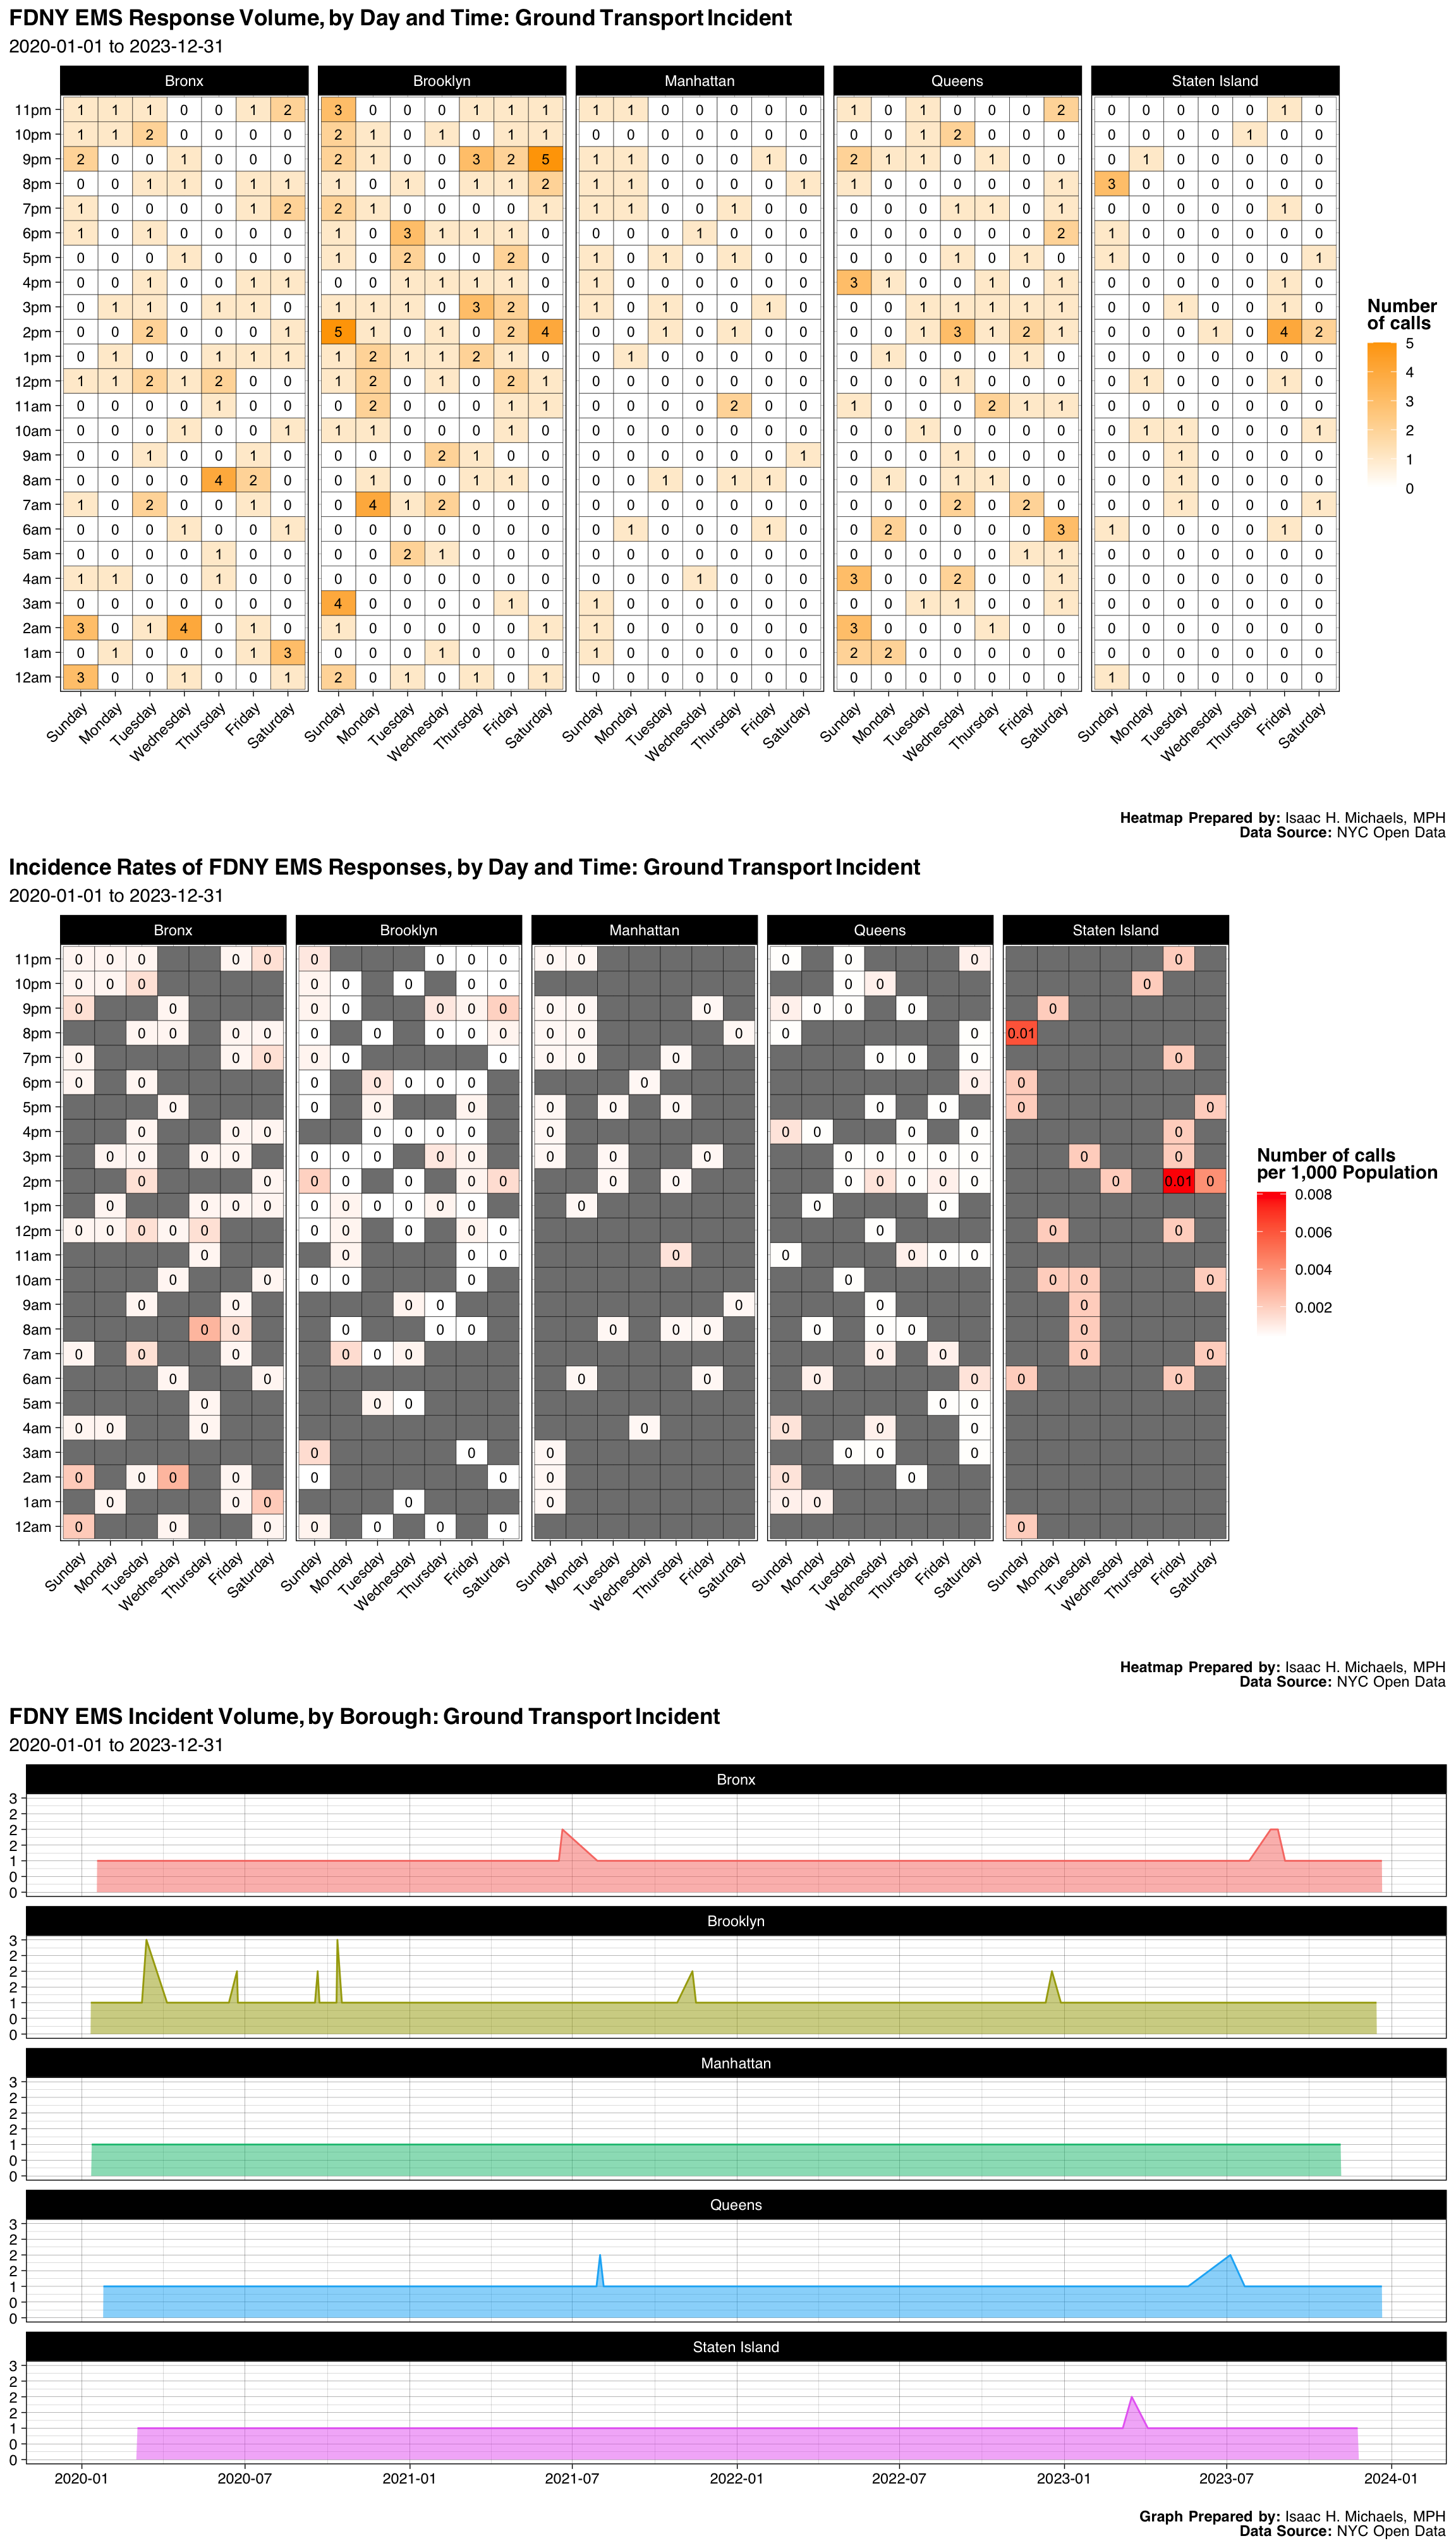
| Borough | Number | Percent |
|---|---|---|
| Bronx | 85 | 0.2394366 |
| Brooklyn | 123 | 0.3464789 |
| Manhattan | 34 | 0.0957746 |
| Queens | 81 | 0.2281690 |
| Staten Island | 32 | 0.0901408 |
| Final Severity Level | Number | Percent |
|---|---|---|
| 1 | 0 | 0% |
| 2 | 353 | 0.994366197183099 |
| 3 | 2 | 0.00563380281690141 |
| 4 | 0 | 0% |
| 5 | 0 | 0% |
| 6 | 0 | 0% |
| 7 | 0 | 0% |
| 8 | 0 | 0% |
| Disposition | Number | Percent |
|---|---|---|
| Transporting Patient | 337 | 0.9492958 |
| Refused Medical Aid | 8 | 0.0225352 |
| Condition Corrected | 5 | 0.0140845 |
| Cancelled | 4 | 0.0112676 |
| Triaged at Scene No Transport | 1 | 0.0028169 |
Graphs, Heatmaps, and Tables Prepared By: Isaac H. Michaels, MPH
Data Source: NYC Open Data
Back to top
Sick Ped<5 Yrs-Rash & Fever
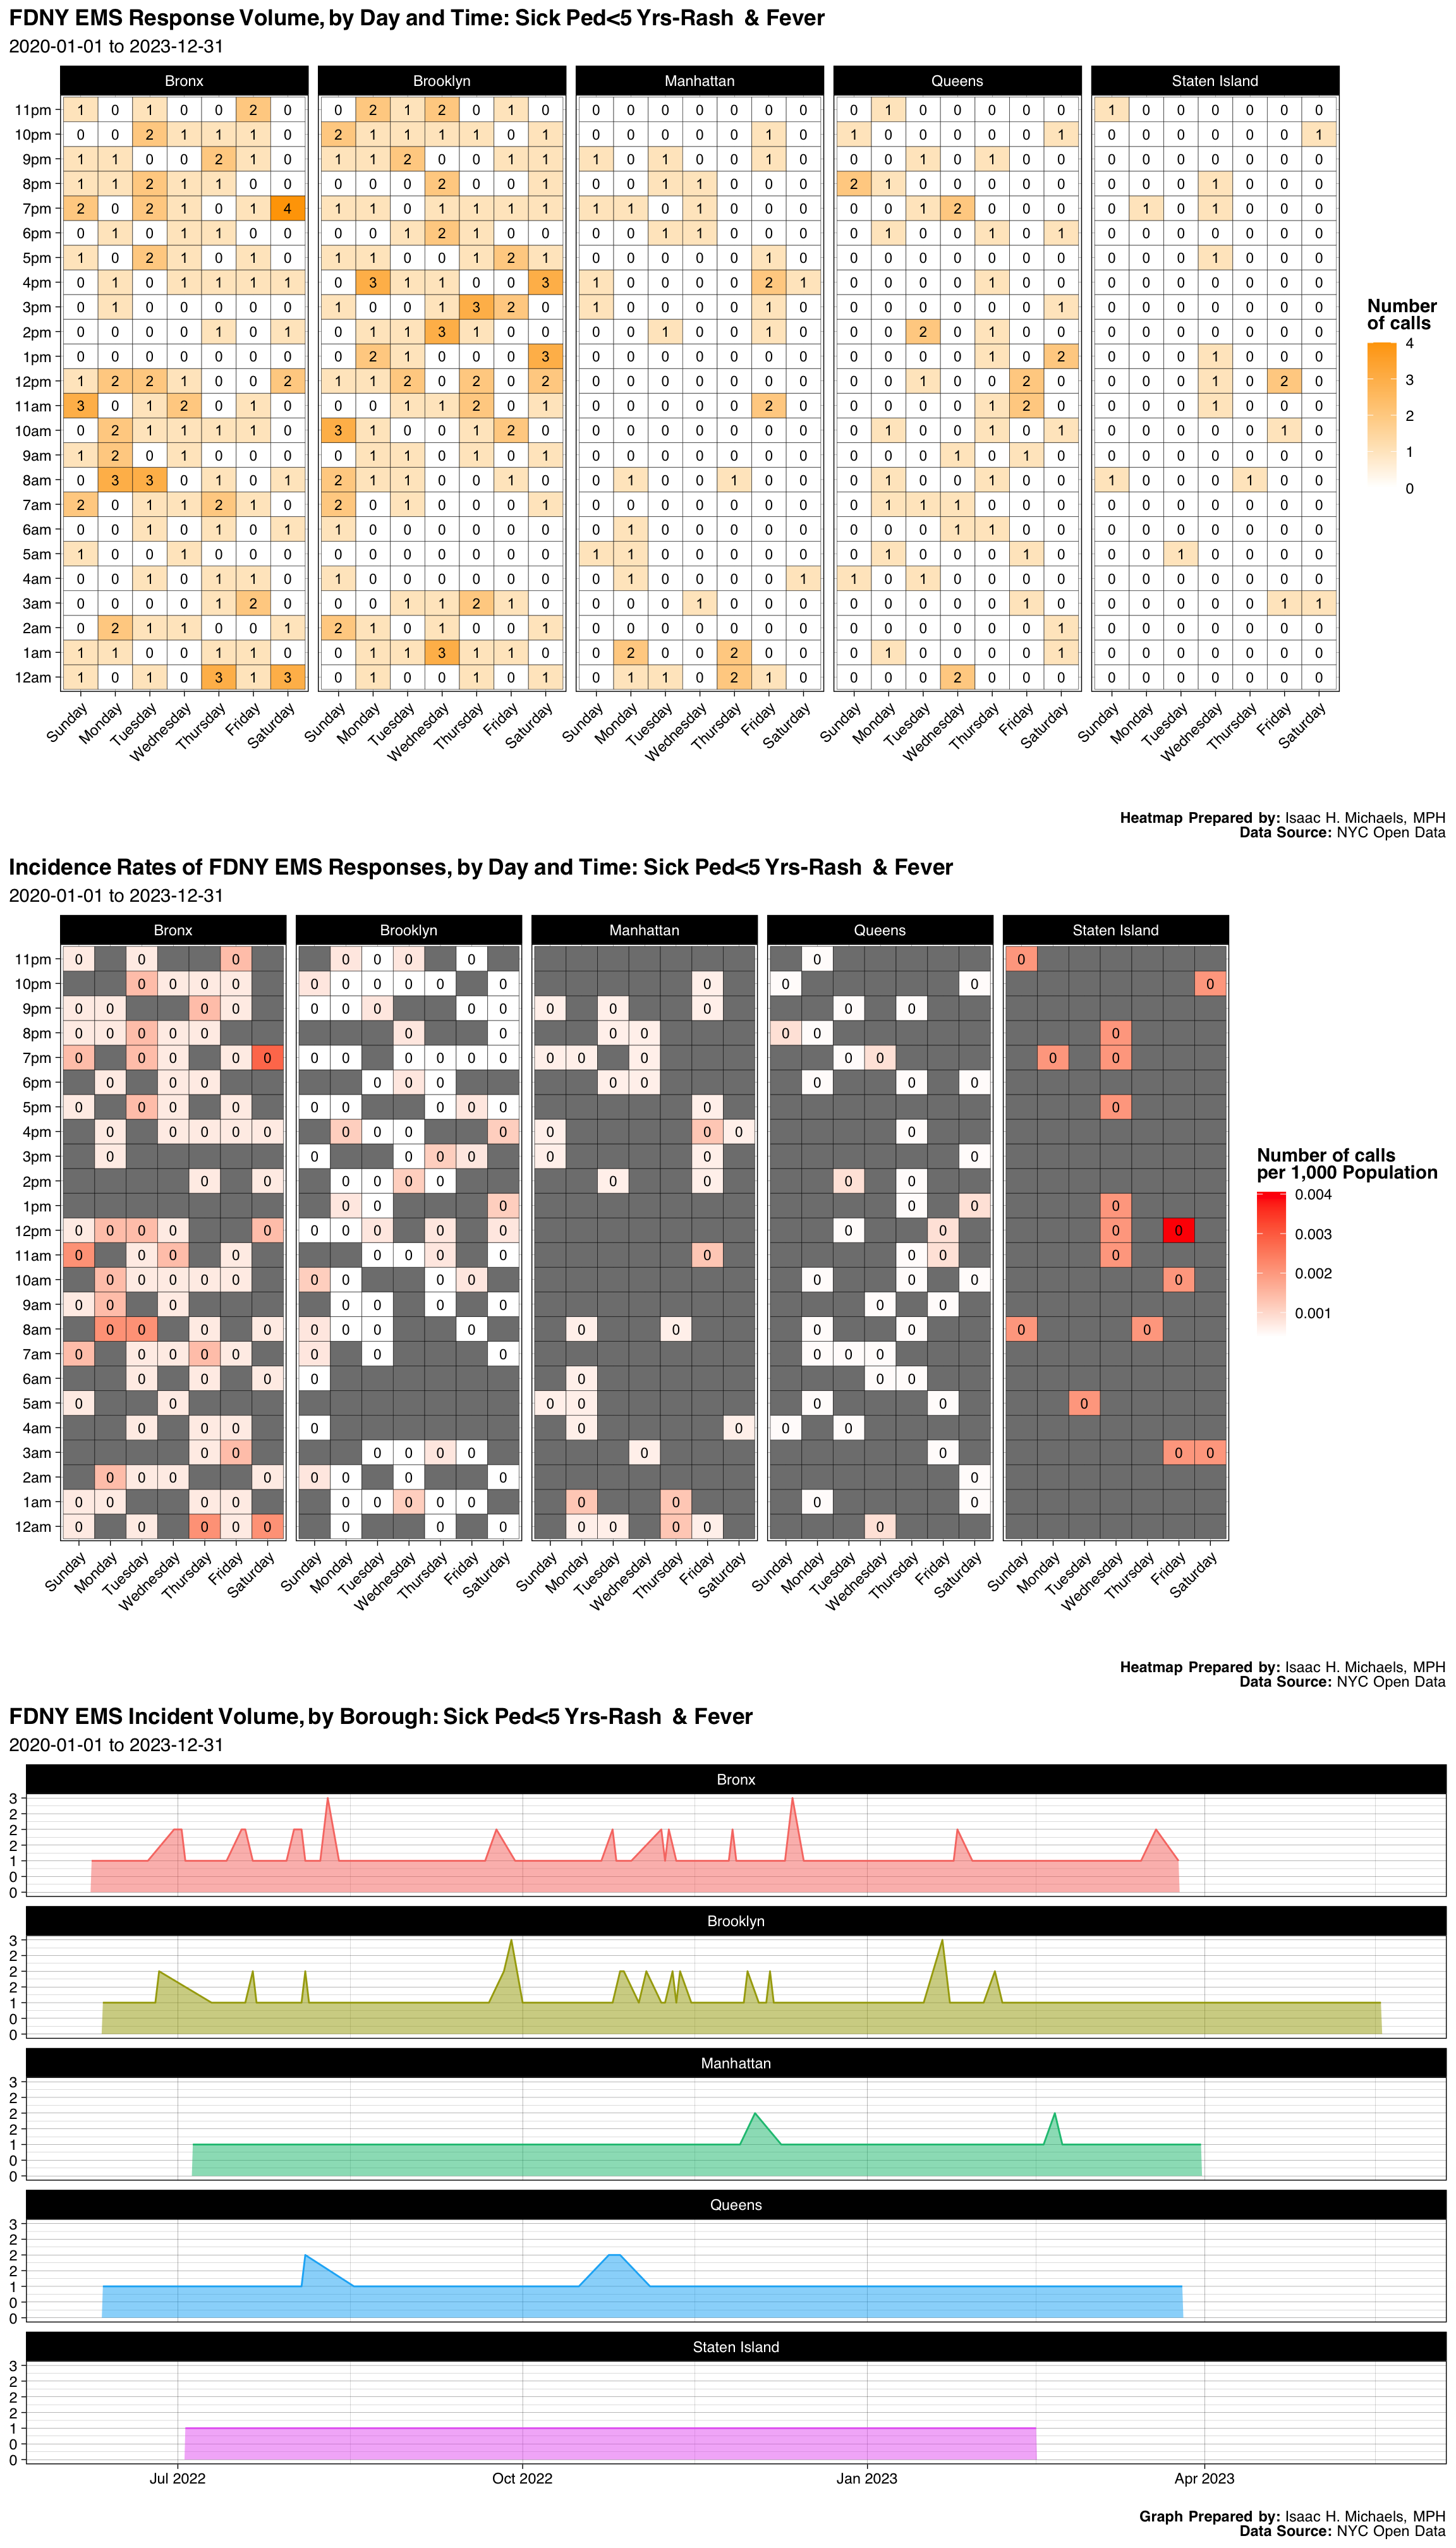
| Borough | Number | Percent |
|---|---|---|
| Bronx | 115 | 0.3372434 |
| Brooklyn | 120 | 0.3519062 |
| Manhattan | 39 | 0.1143695 |
| Queens | 50 | 0.1466276 |
| Staten Island | 17 | 0.0498534 |
| Final Severity Level | Number | Percent |
|---|---|---|
| 1 | 0 | 0% |
| 2 | 0 | 0% |
| 3 | 0 | 0% |
| 4 | 341 | 1 |
| 5 | 0 | 0% |
| 6 | 0 | 0% |
| 7 | 0 | 0% |
| 8 | 0 | 0% |
| Disposition | Number | Percent |
|---|---|---|
| Transporting Patient | 318 | 0.9325513 |
| Refused Medical Aid | 16 | 0.0469208 |
| Patient Gone on Arrival | 3 | 0.0087977 |
| Unfounded | 3 | 0.0087977 |
| Cancelled | 1 | 0.0029326 |
Graphs, Heatmaps, and Tables Prepared By: Isaac H. Michaels, MPH
Data Source: NYC Open Data
Back to top
Difficult Breather Rf
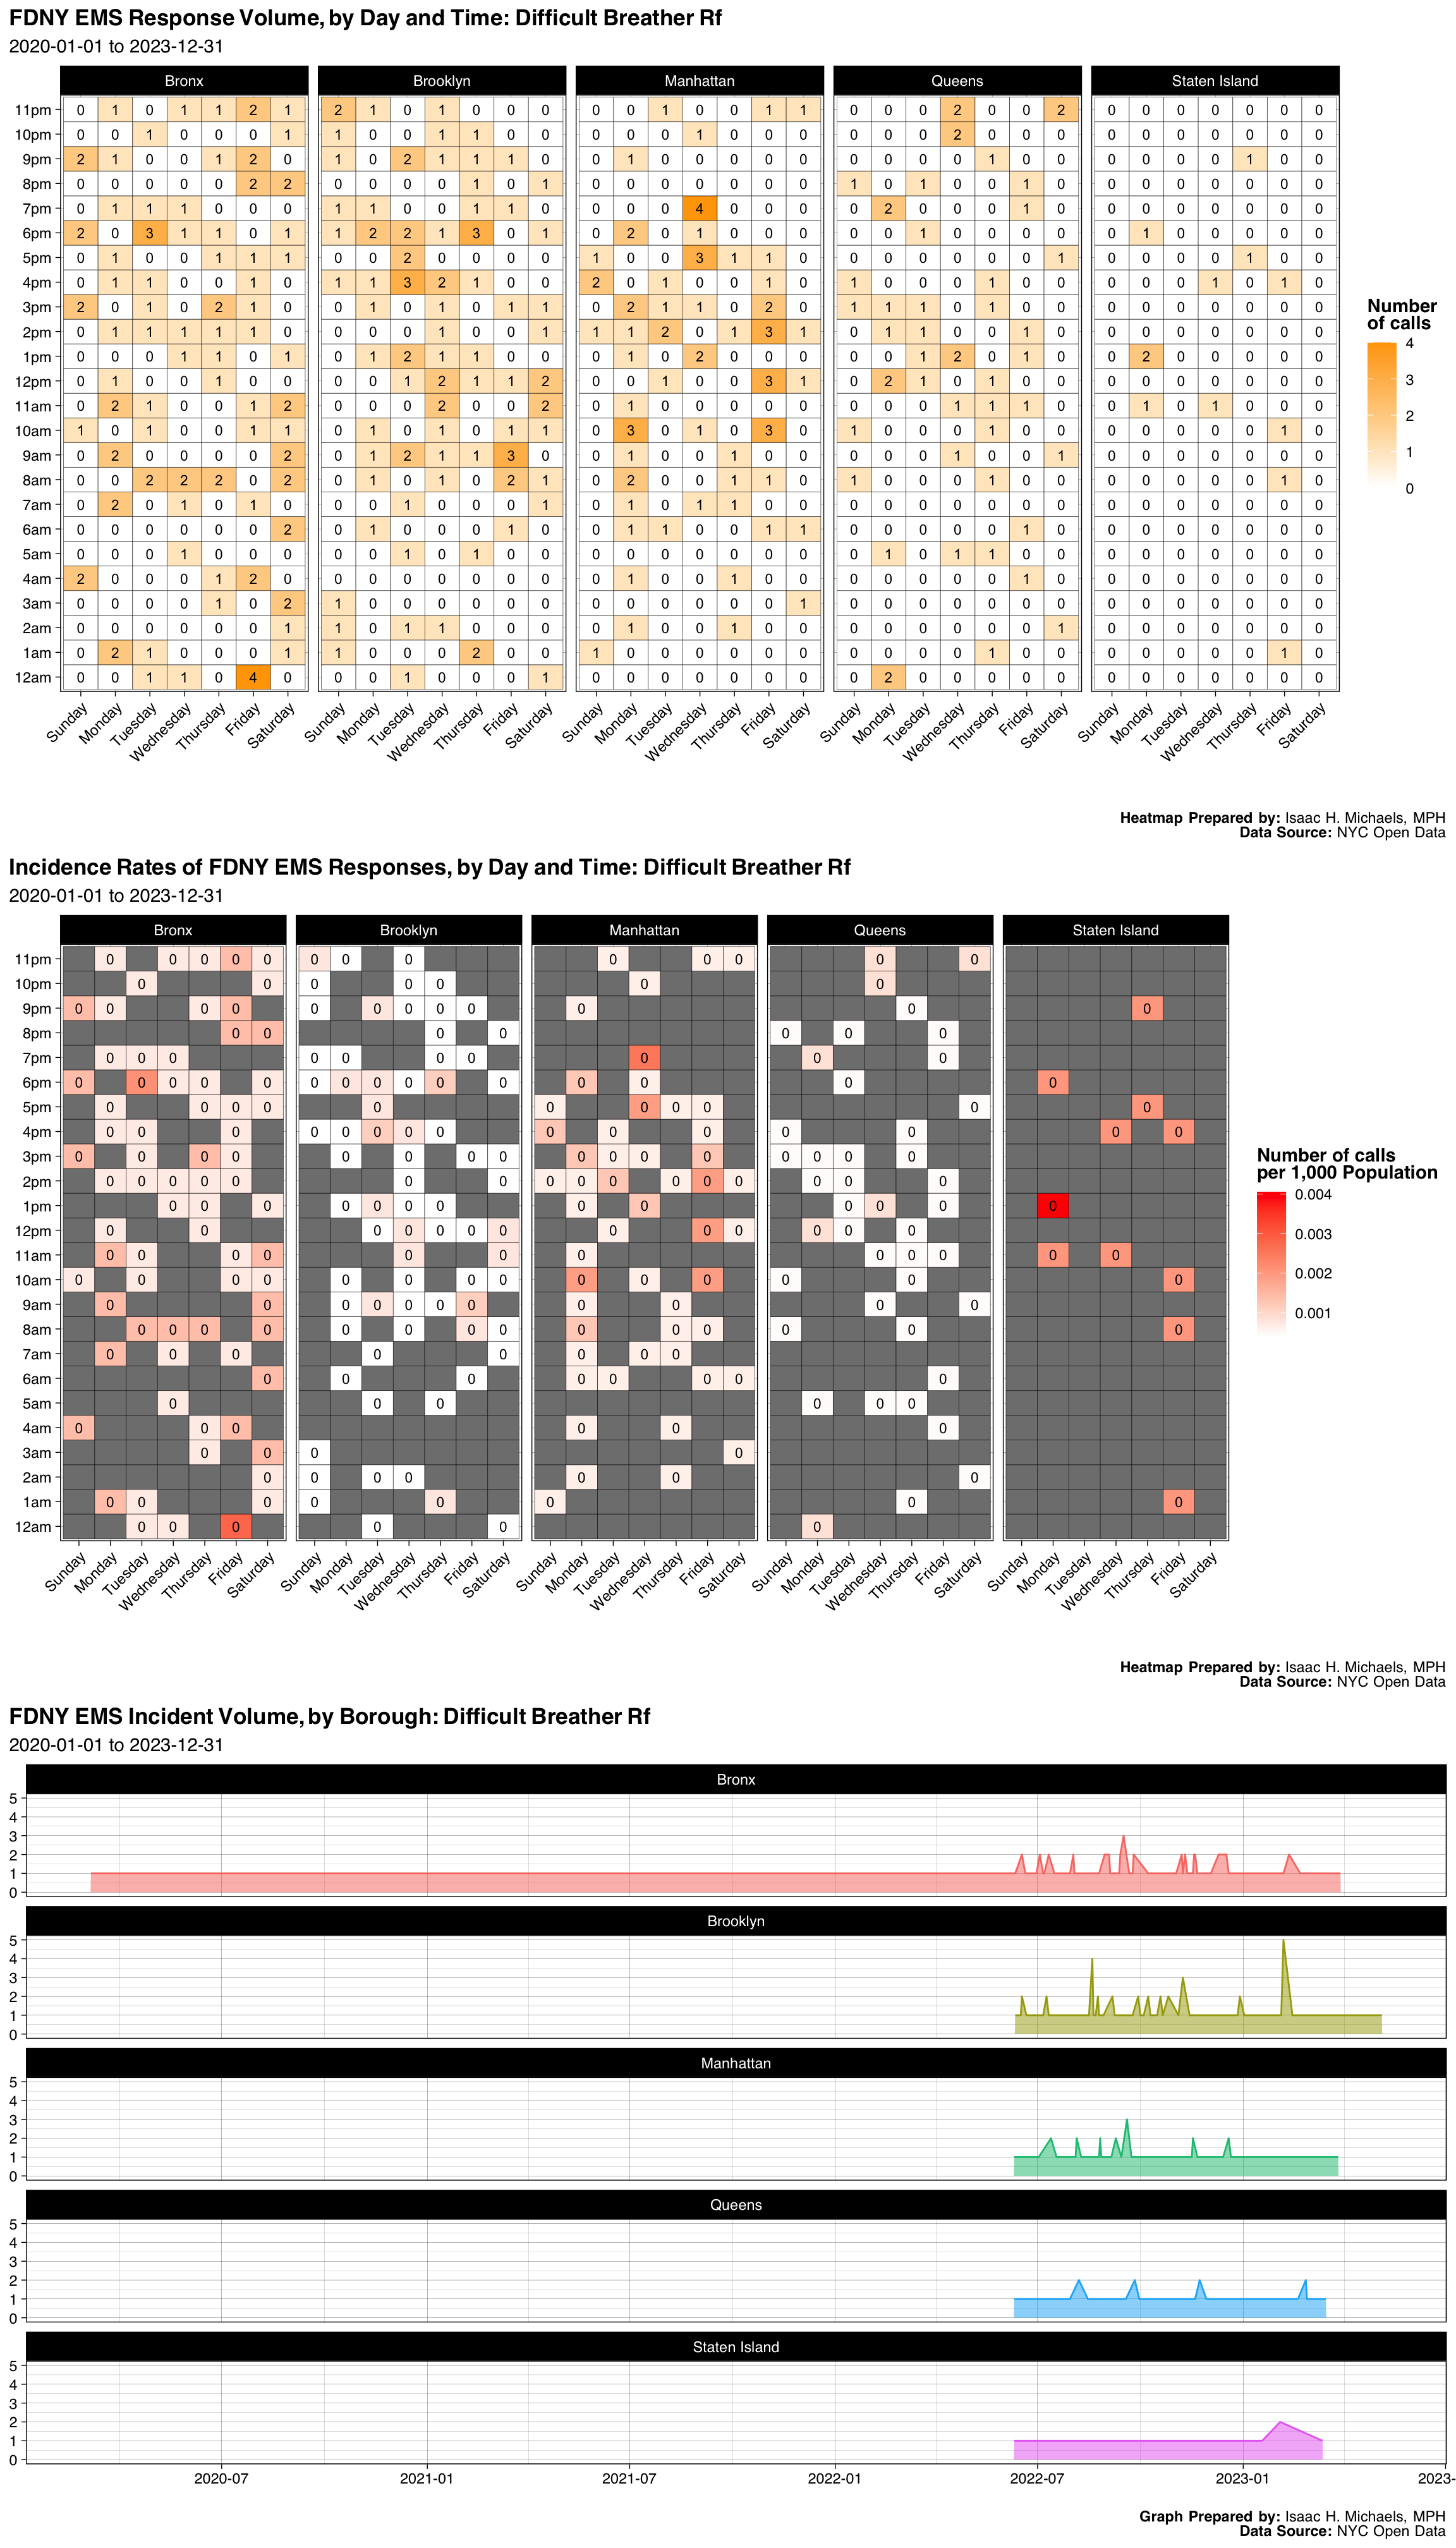
| Borough | Number | Percent |
|---|---|---|
| Bronx | 100 | 0.3058104 |
| Brooklyn | 93 | 0.2844037 |
| Manhattan | 72 | 0.2201835 |
| Queens | 50 | 0.1529052 |
| Staten Island | 12 | 0.0366972 |
| Final Severity Level | Number | Percent |
|---|---|---|
| 1 | 0 | 0% |
| 2 | 327 | 1 |
| 3 | 0 | 0% |
| 4 | 0 | 0% |
| 5 | 0 | 0% |
| 6 | 0 | 0% |
| 7 | 0 | 0% |
| 8 | 0 | 0% |
| Disposition | Number | Percent |
|---|---|---|
| Transporting Patient | 275 | 0.8409786 |
| Refused Medical Aid | 40 | 0.1223242 |
| Unfounded | 5 | 0.0152905 |
| Patient Gone on Arrival | 3 | 0.0091743 |
| Cancelled | 2 | 0.0061162 |
| Condition Corrected | 2 | 0.0061162 |
Graphs, Heatmaps, and Tables Prepared By: Isaac H. Michaels, MPH
Data Source: NYC Open Data
Back to top
Special Event
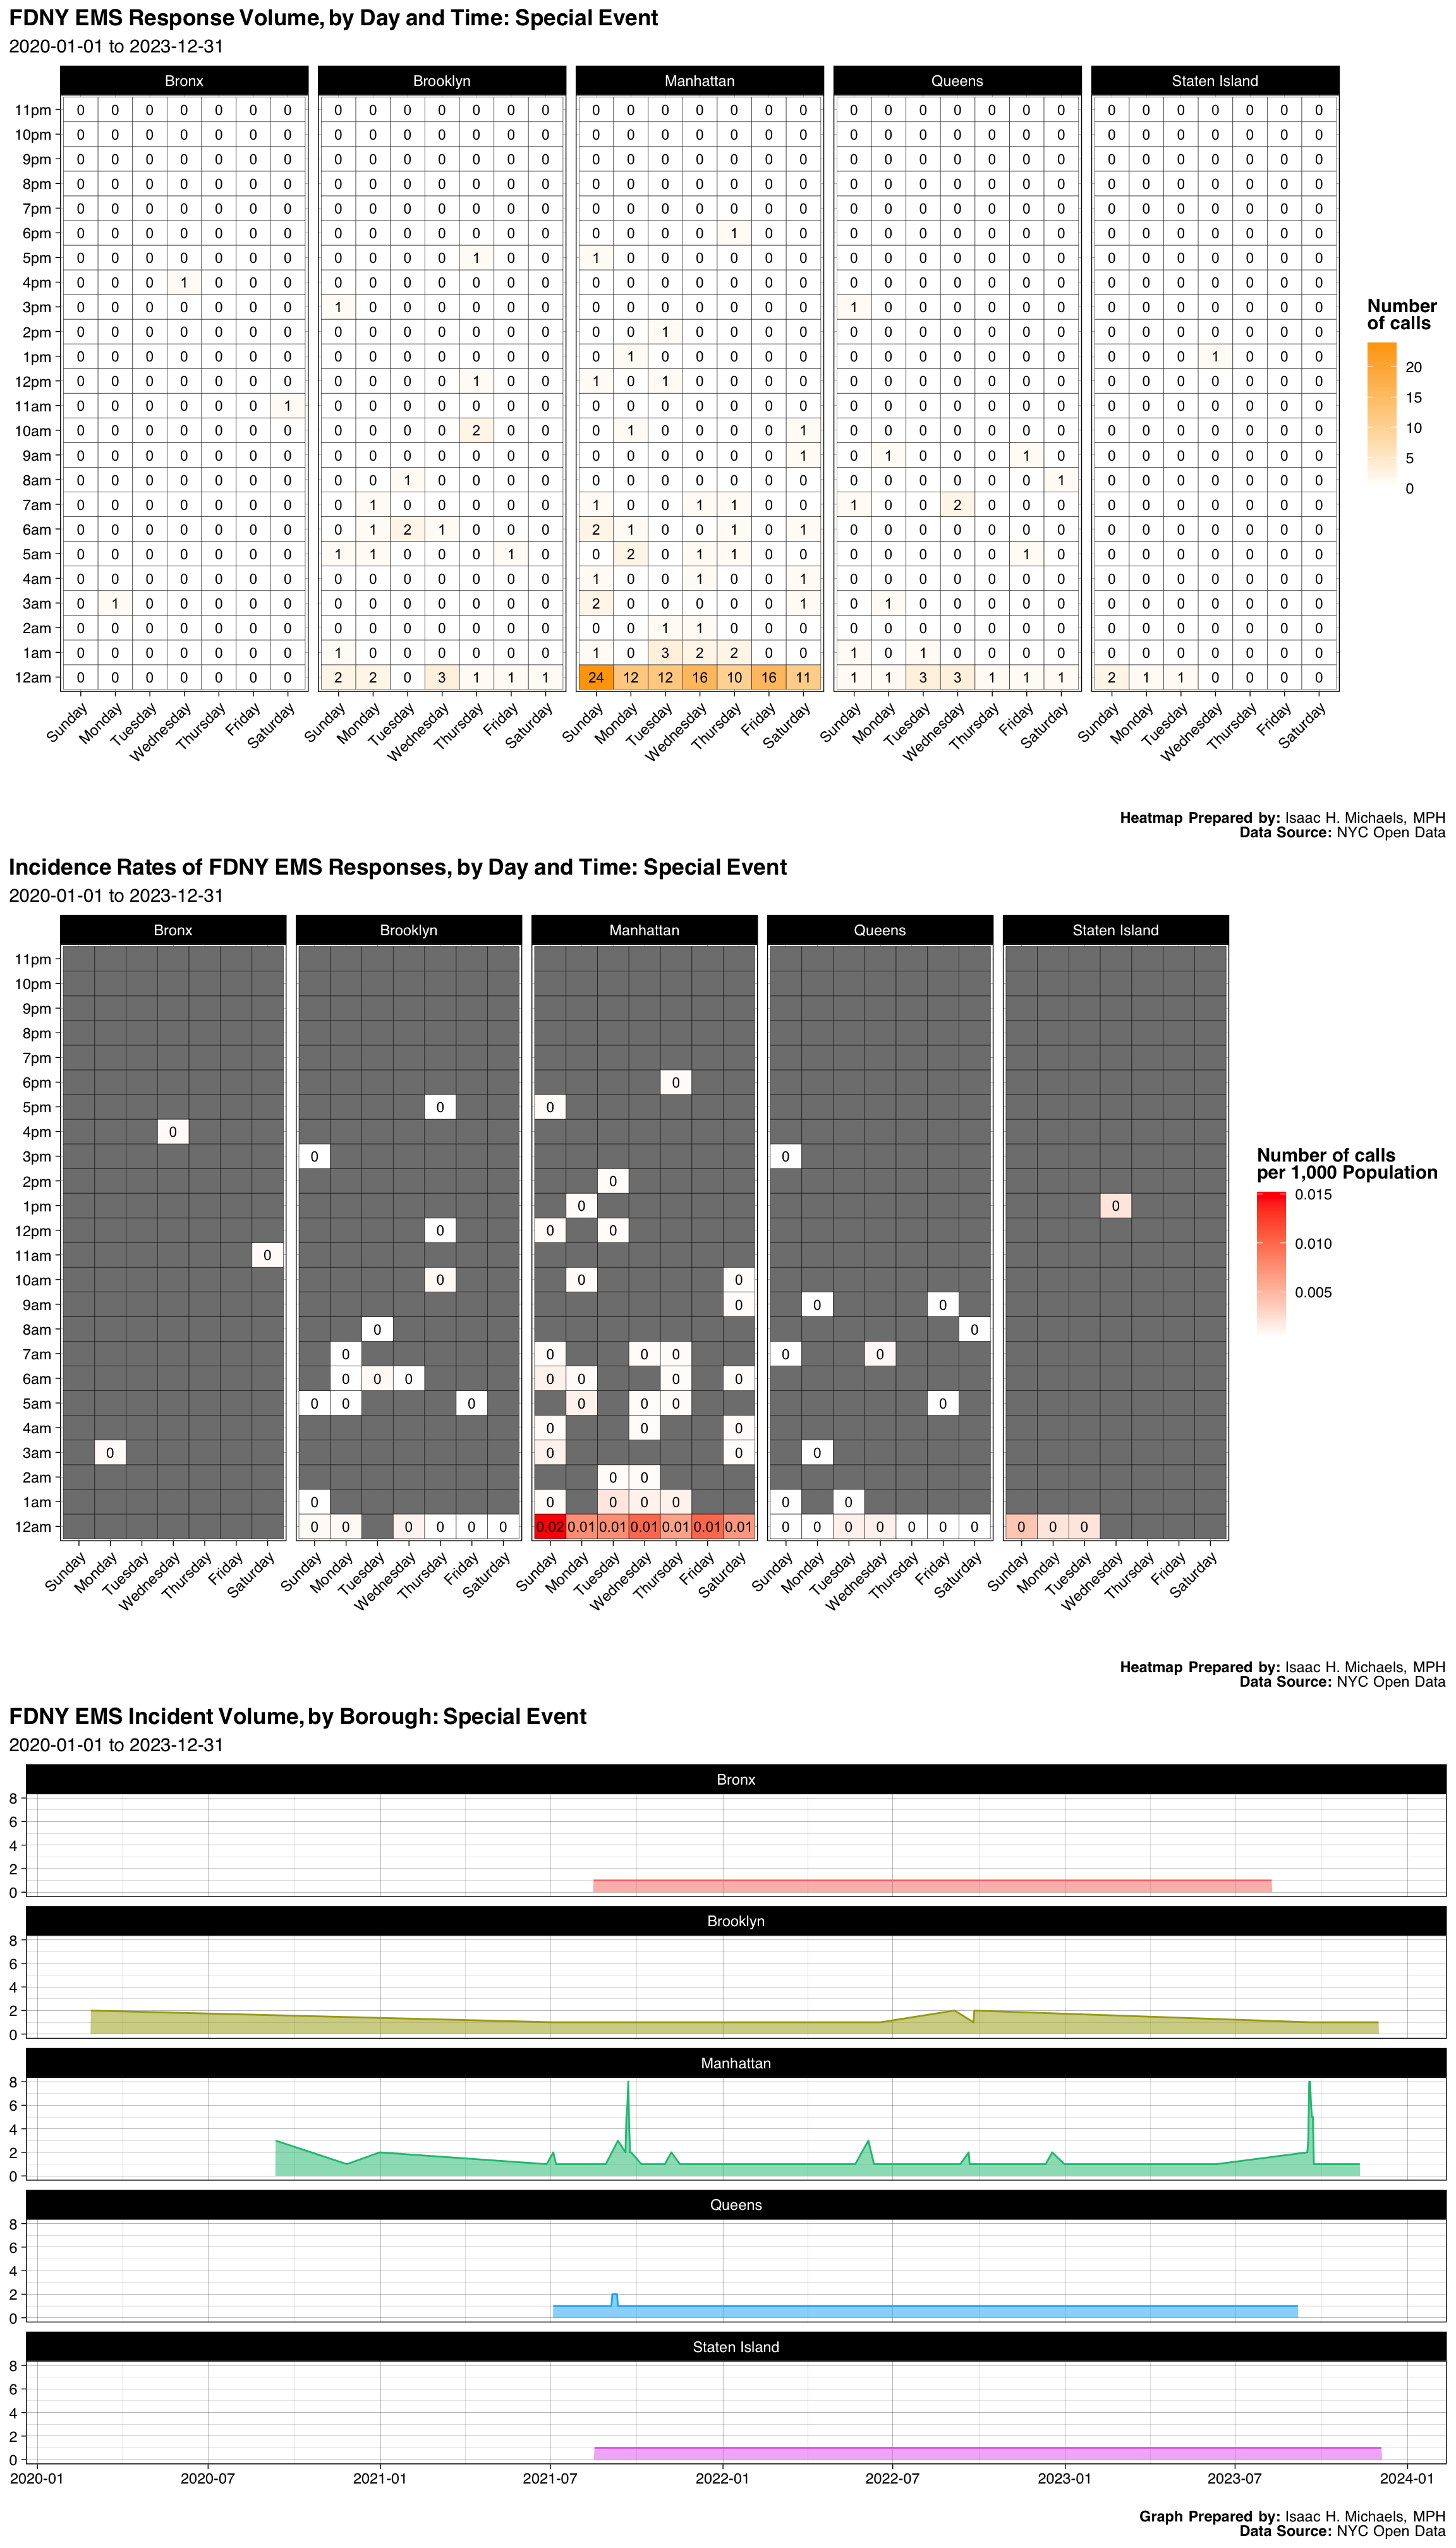
| Borough | Number | Percent |
|---|---|---|
| Bronx | 3 | 0.0154639 |
| Brooklyn | 25 | 0.1288660 |
| Manhattan | 138 | 0.7113402 |
| Queens | 22 | 0.1134021 |
| Staten Island | 5 | 0.0257732 |
| Unknown | 1 | 0.0051546 |
| Final Severity Level | Number | Percent |
|---|---|---|
| 1 | 0 | 0% |
| 2 | 1 | 0.00515463917525773 |
| 3 | 1 | 0.00515463917525773 |
| 4 | 0 | 0% |
| 5 | 0 | 0% |
| 6 | 0 | 0% |
| 7 | 0 | 0% |
| 8 | 192 | 0.989690721649485 |
| Disposition | Number | Percent |
|---|---|---|
| Condition Corrected | 110 | 0.5670103 |
| Cancelled | 46 | 0.2371134 |
| Other | 20 | 0.1030928 |
| Transporting Patient | 8 | 0.0412371 |
| Unfounded | 6 | 0.0309278 |
| Refused Medical Aid | 2 | 0.0103093 |
| Treated and Transported | 2 | 0.0103093 |
Graphs, Heatmaps, and Tables Prepared By: Isaac H. Michaels, MPH
Data Source: NYC Open Data
Back to top
Amputation, Arm, Hand,Leg,Foot
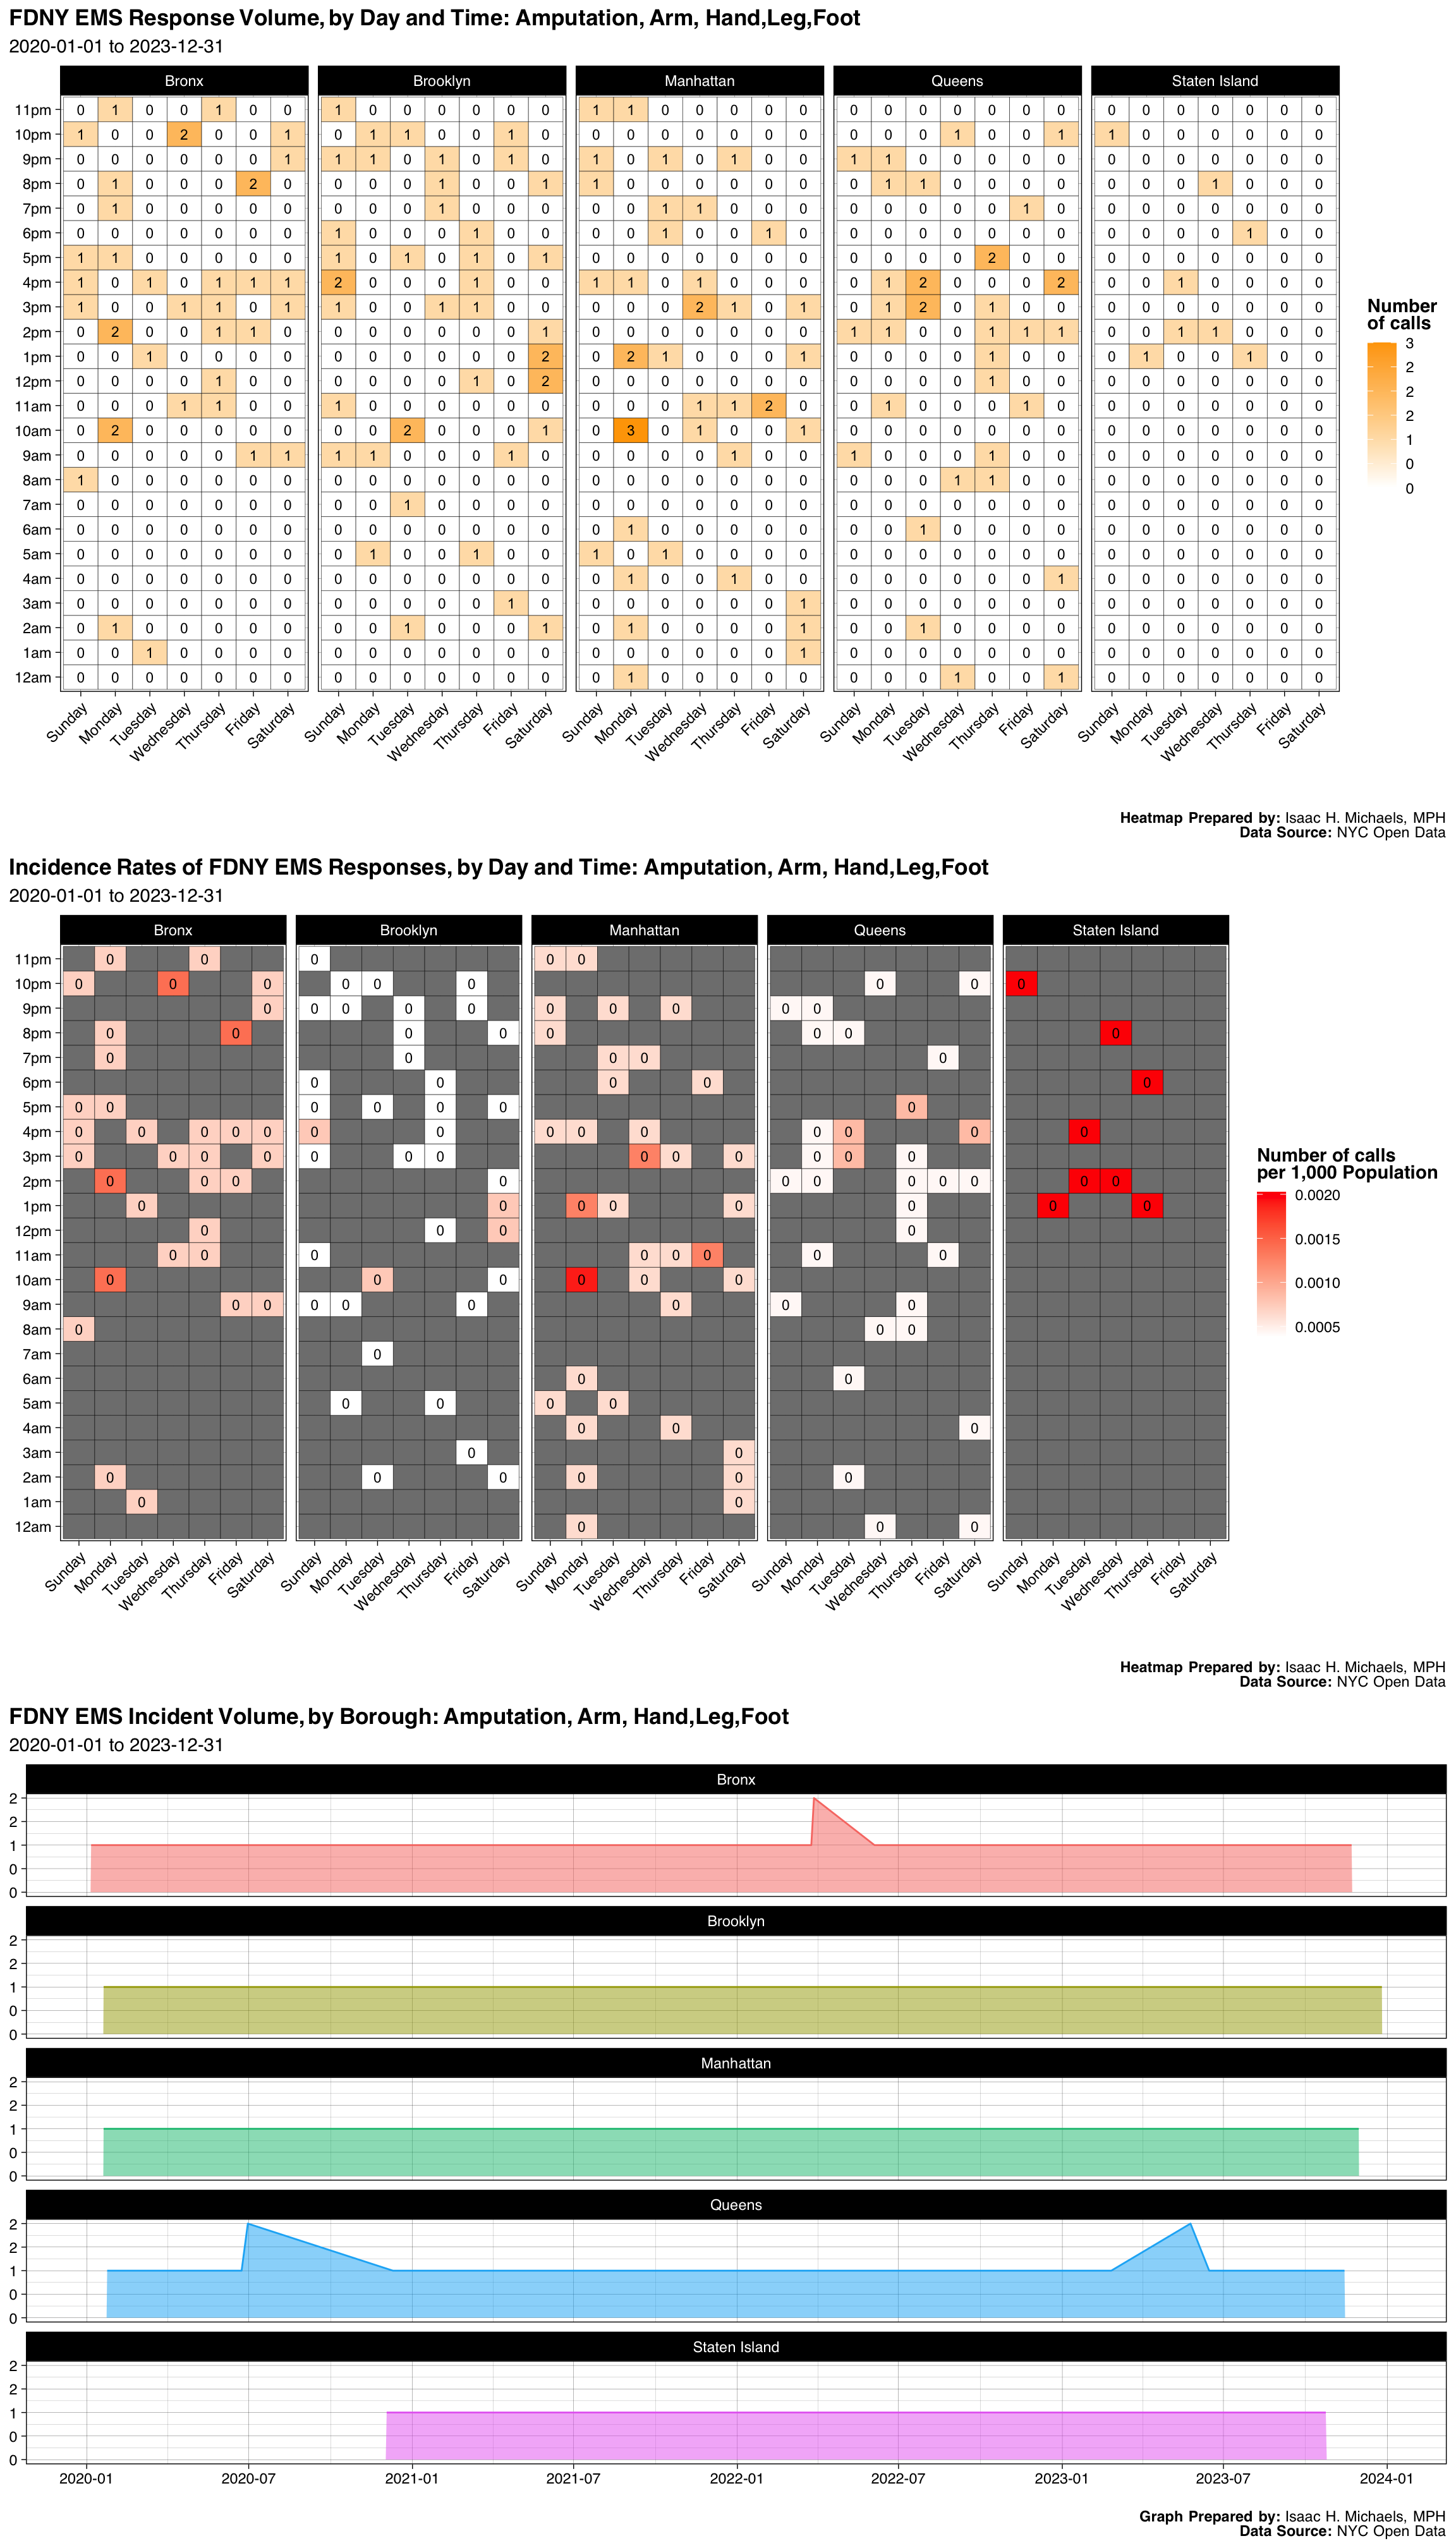
| Borough | Number | Percent |
|---|---|---|
| Bronx | 37 | 0.2256098 |
| Brooklyn | 42 | 0.2560976 |
| Manhattan | 41 | 0.2500000 |
| Queens | 36 | 0.2195122 |
| Staten Island | 8 | 0.0487805 |
| Final Severity Level | Number | Percent |
|---|---|---|
| 1 | 0 | 0% |
| 2 | 0 | 0% |
| 3 | 162 | 0.98780487804878 |
| 4 | 2 | 0.0121951219512195 |
| 5 | 0 | 0% |
| 6 | 0 | 0% |
| 7 | 0 | 0% |
| 8 | 0 | 0% |
| Disposition | Number | Percent |
|---|---|---|
| Transporting Patient | 119 | 0.7256098 |
| Unfounded | 33 | 0.2012195 |
| Refused Medical Aid | 5 | 0.0304878 |
| Cancelled | 3 | 0.0182927 |
| Patient Gone on Arrival | 3 | 0.0182927 |
| Condition Corrected | 1 | 0.0060976 |
Graphs, Heatmaps, and Tables Prepared By: Isaac H. Michaels, MPH
Data Source: NYC Open Data
Back to top
Active Shooter
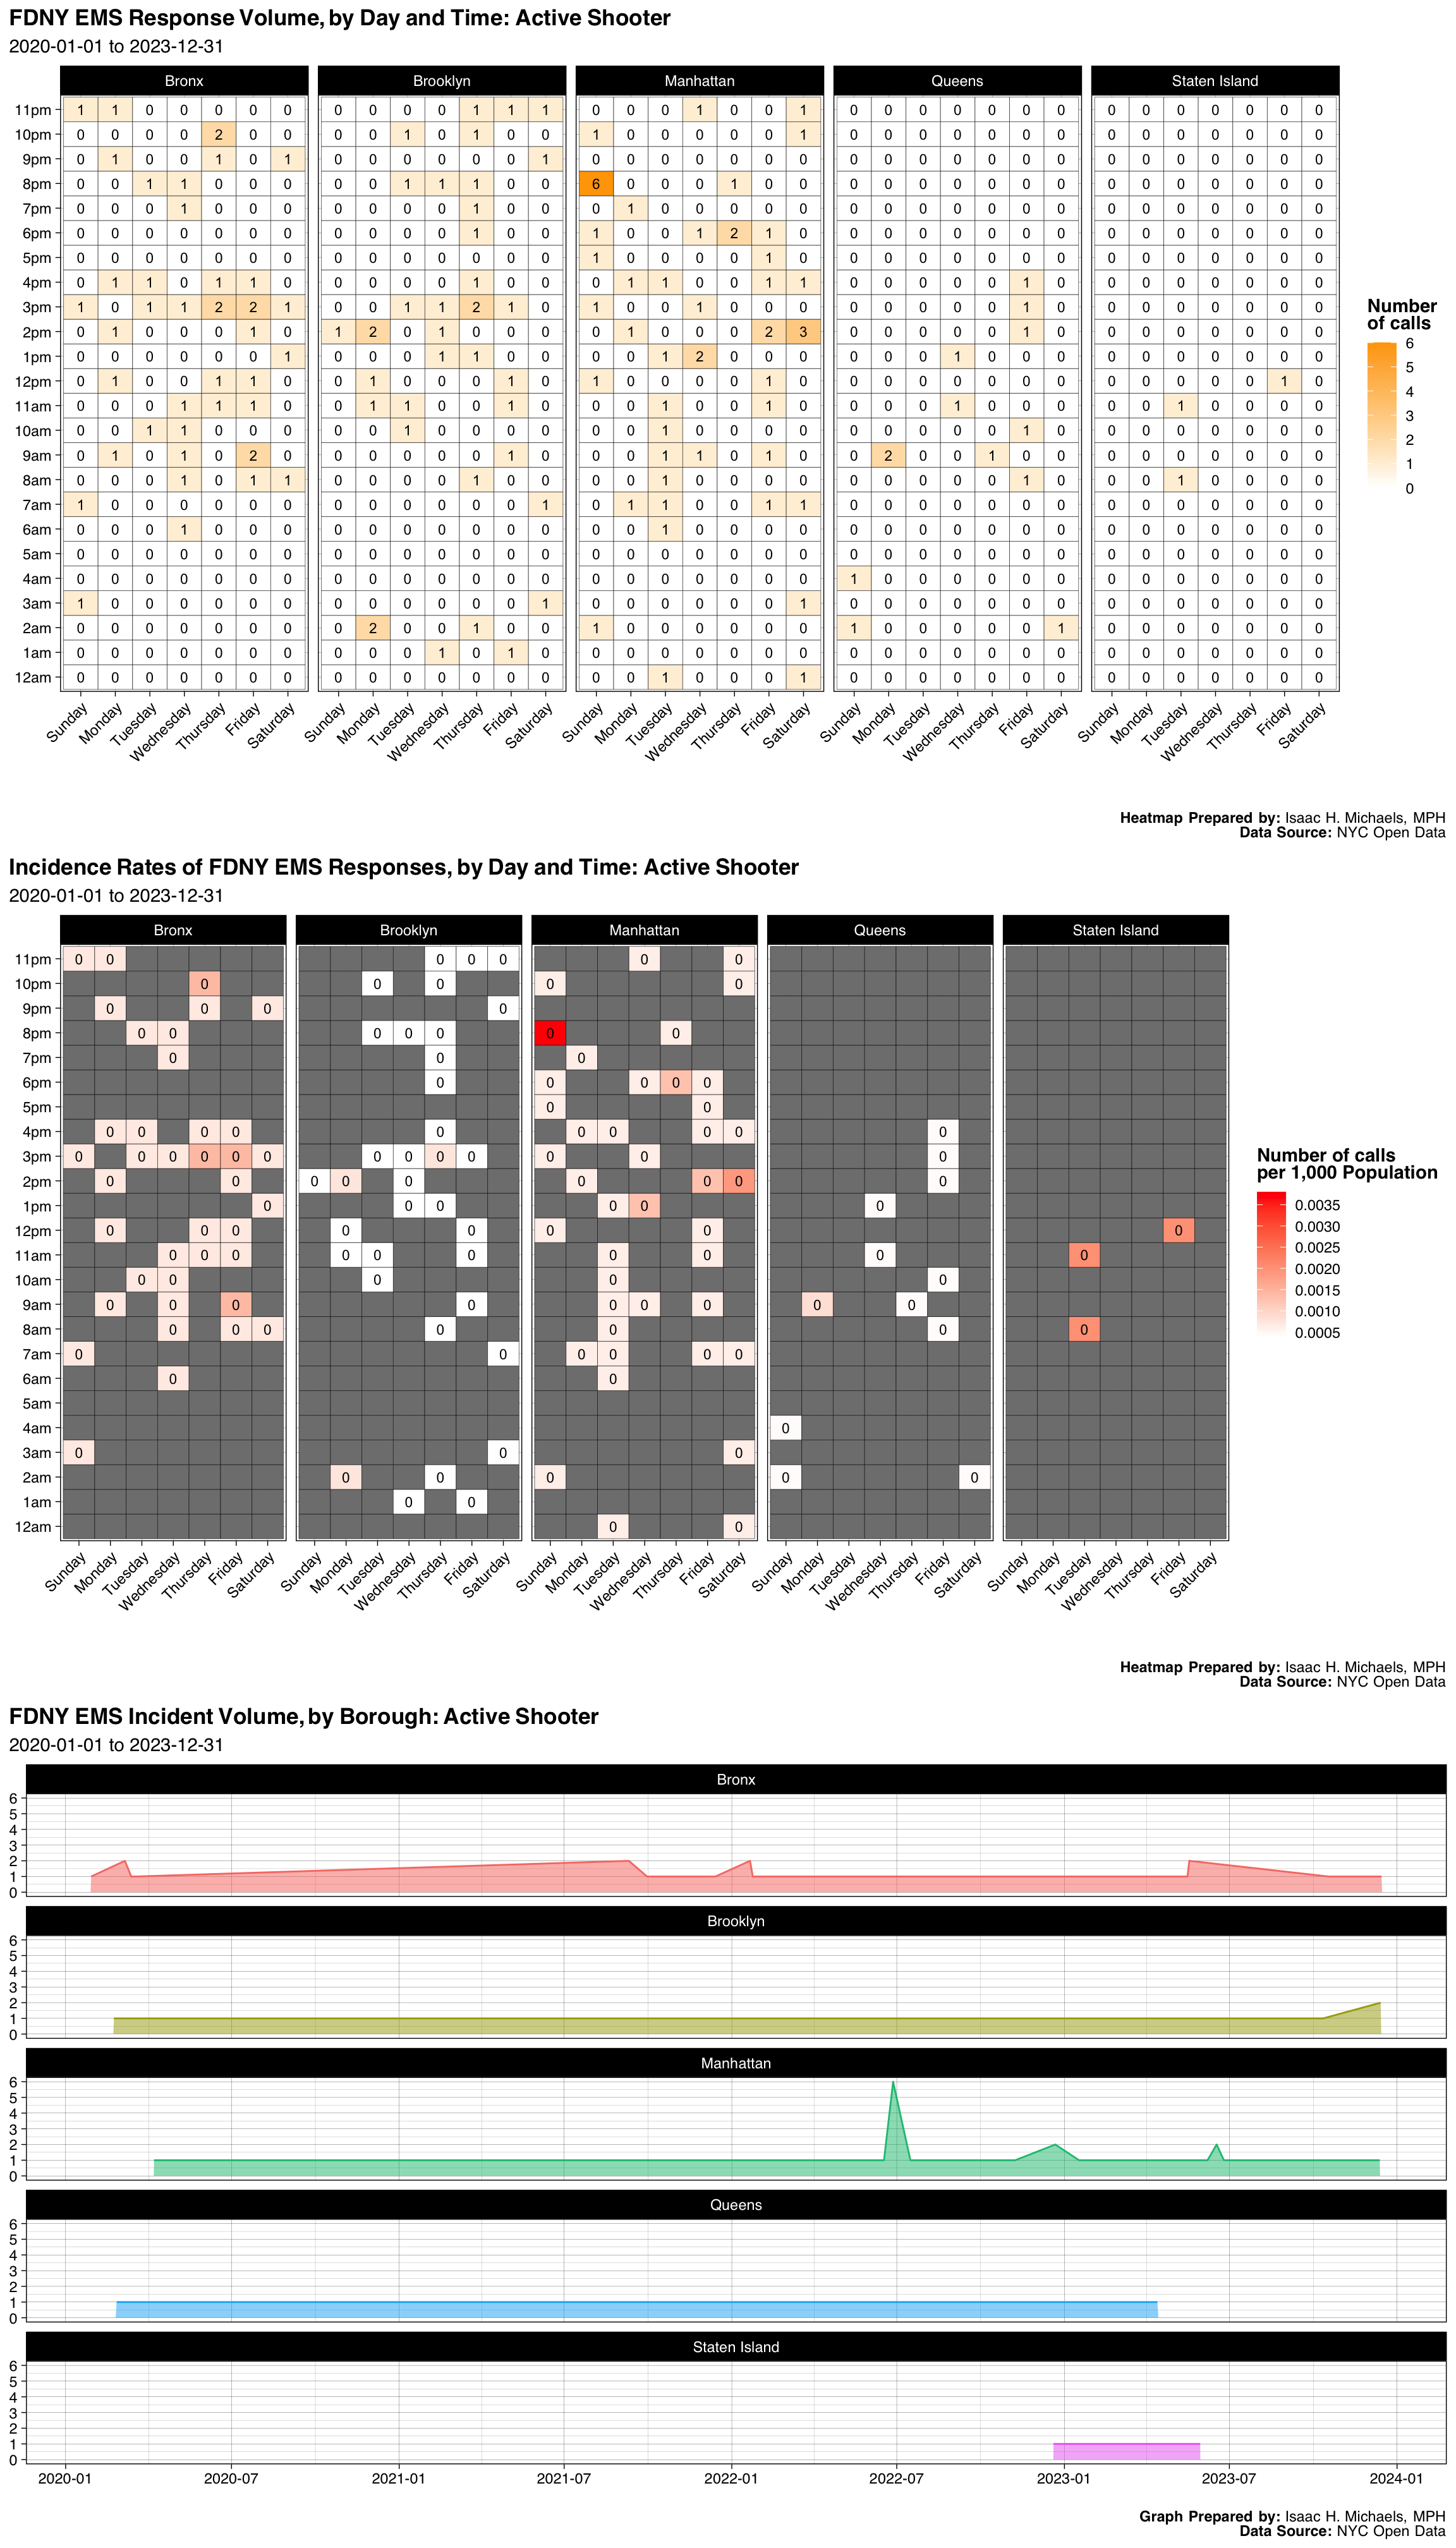
| Borough | Number | Percent |
|---|---|---|
| Bronx | 43 | 0.2885906 |
| Brooklyn | 38 | 0.2550336 |
| Manhattan | 52 | 0.3489933 |
| Queens | 13 | 0.0872483 |
| Staten Island | 3 | 0.0201342 |
| Final Severity Level | Number | Percent |
|---|---|---|
| 1 | 0 | 0% |
| 2 | 149 | 1 |
| 3 | 0 | 0% |
| 4 | 0 | 0% |
| 5 | 0 | 0% |
| 6 | 0 | 0% |
| 7 | 0 | 0% |
| 8 | 0 | 0% |
| Disposition | Number | Percent |
|---|---|---|
| Unfounded | 69 | 0.4630872 |
| Cancelled | 47 | 0.3154362 |
| Condition Corrected | 17 | 0.1140940 |
| Other | 11 | 0.0738255 |
| Transporting Patient | 4 | 0.0268456 |
| Refused Medical Aid | 1 | 0.0067114 |
Graphs, Heatmaps, and Tables Prepared By: Isaac H. Michaels, MPH
Data Source: NYC Open Data
Back to top
Three Alarm Fire
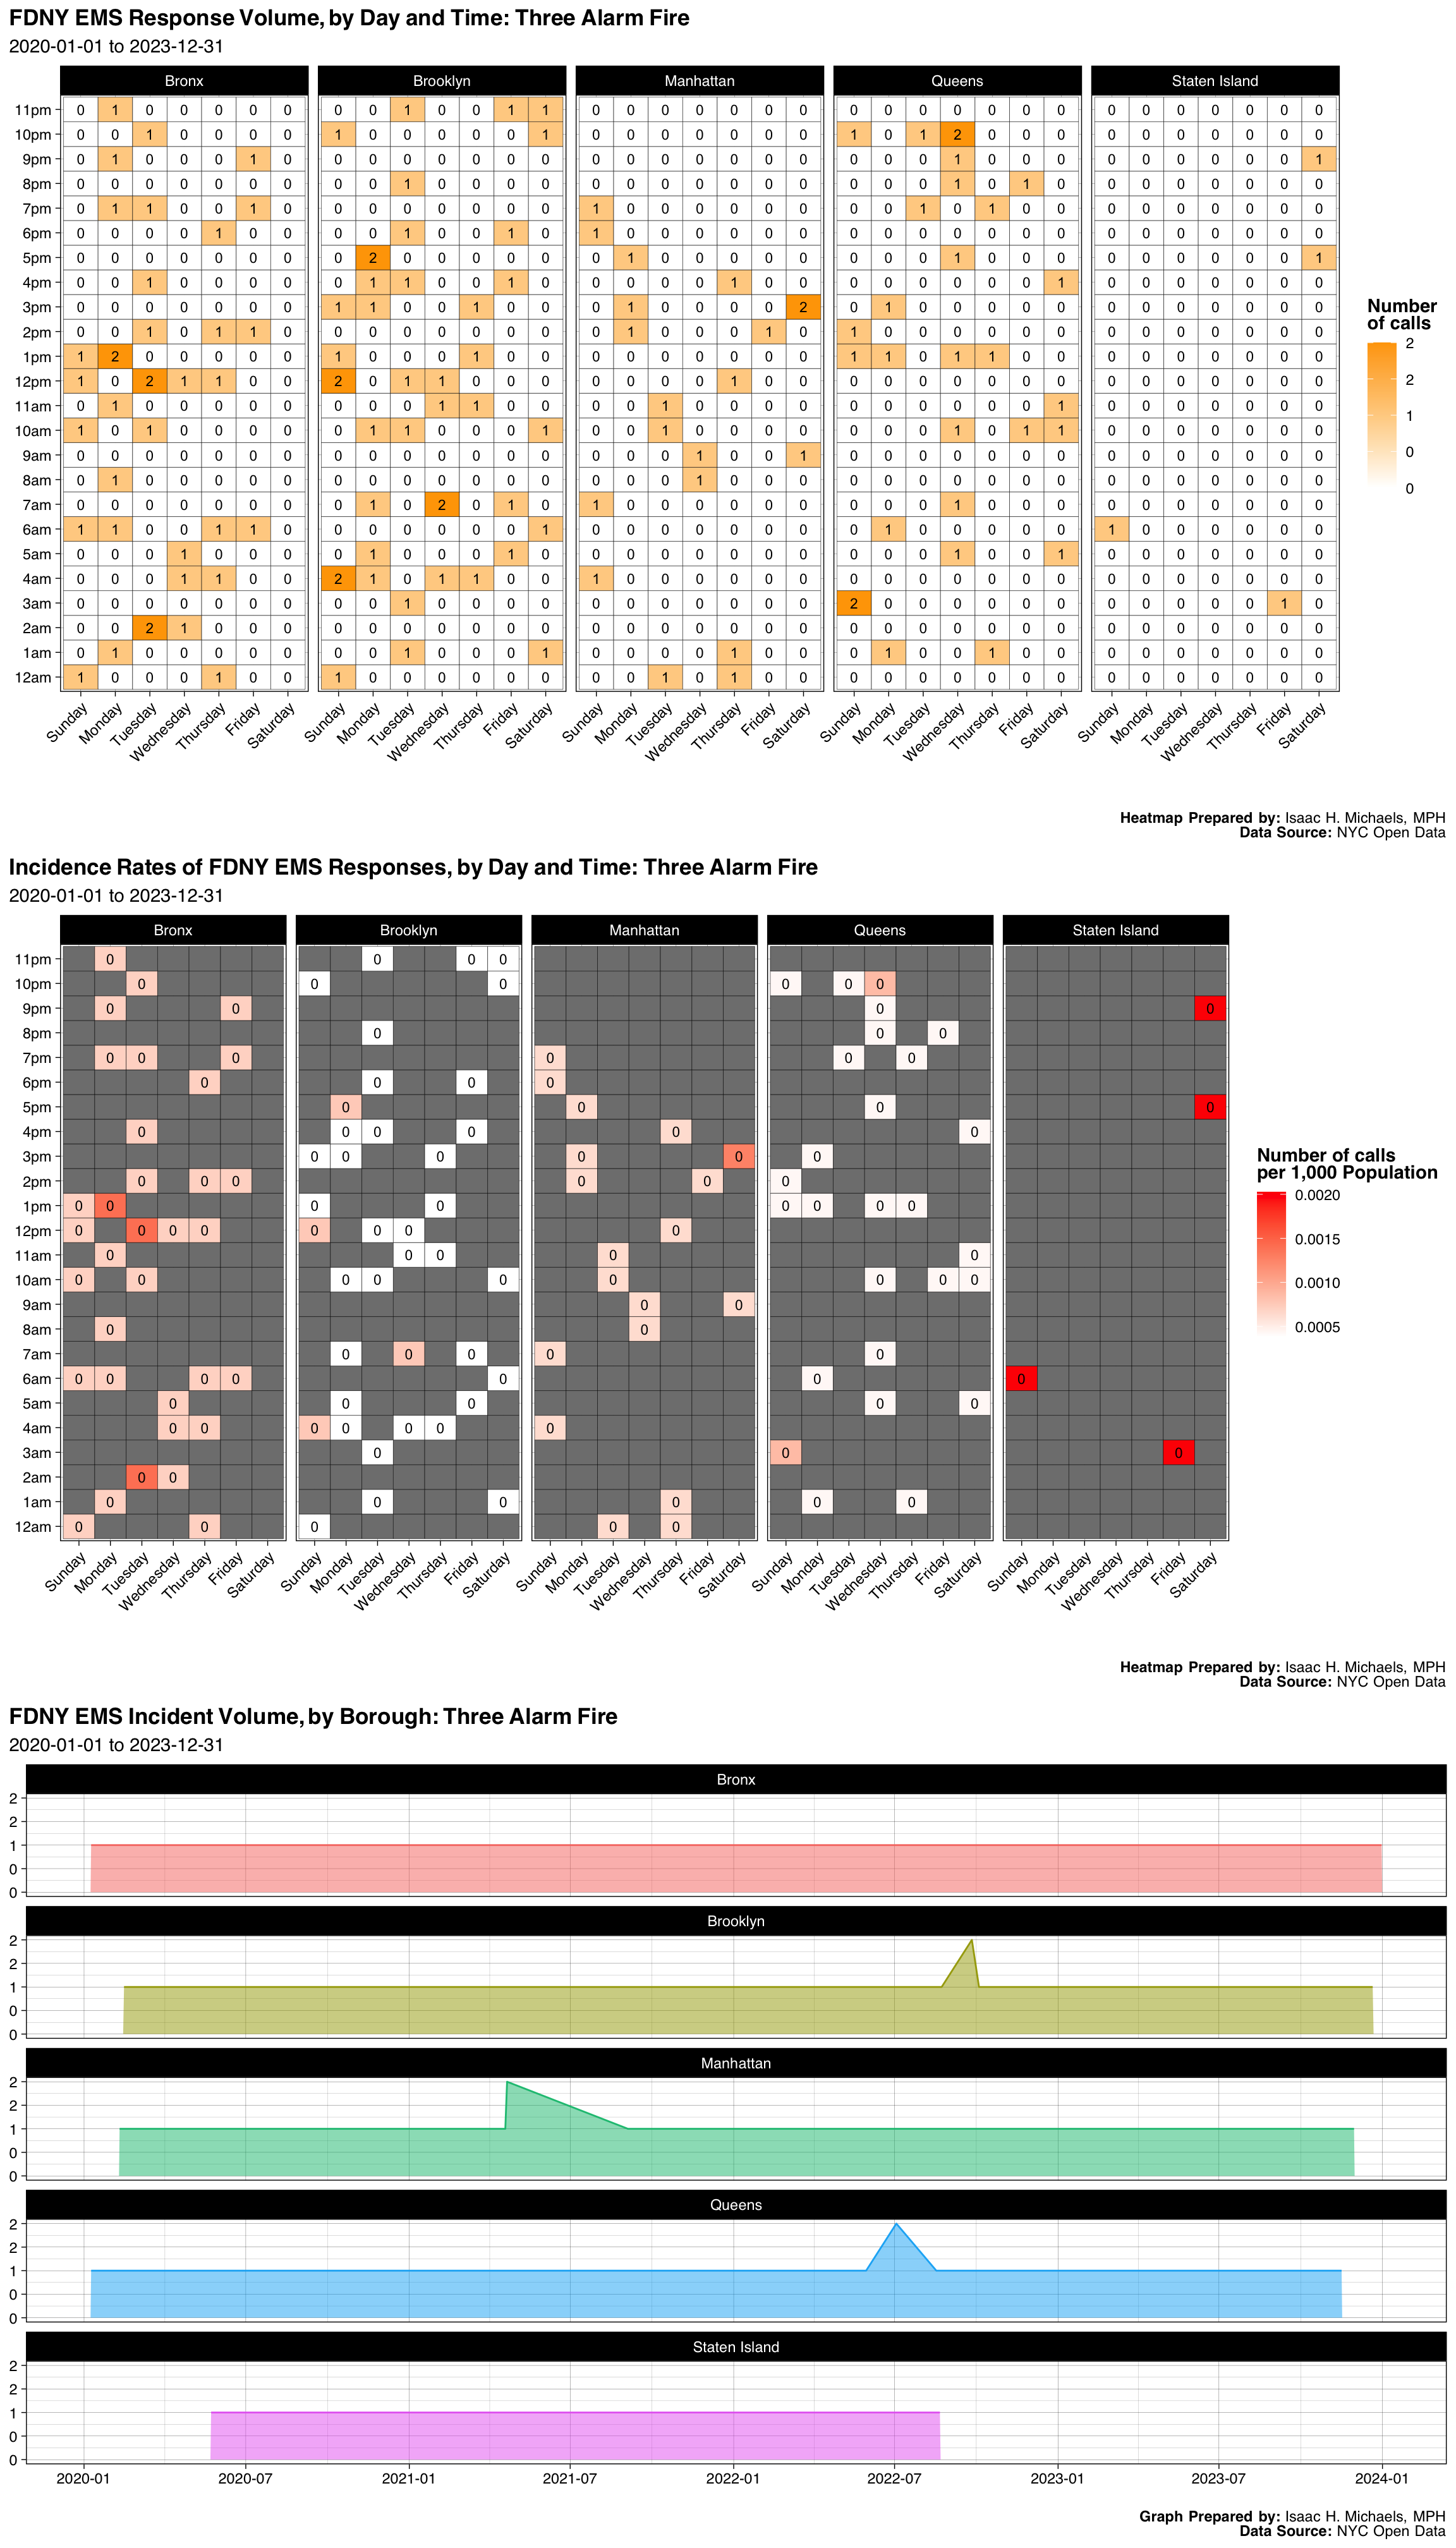
| Borough | Number | Percent |
|---|---|---|
| Bronx | 37 | 0.2781955 |
| Brooklyn | 43 | 0.3233083 |
| Manhattan | 20 | 0.1503759 |
| Queens | 29 | 0.2180451 |
| Staten Island | 4 | 0.0300752 |
| Final Severity Level | Number | Percent |
|---|---|---|
| 1 | 0 | 0% |
| 2 | 133 | 1 |
| 3 | 0 | 0% |
| 4 | 0 | 0% |
| 5 | 0 | 0% |
| 6 | 0 | 0% |
| 7 | 0 | 0% |
| 8 | 0 | 0% |
| Disposition | Number | Percent |
|---|---|---|
| Transporting Patient | 115 | 0.8646617 |
| Cancelled | 16 | 0.1203008 |
| Condition Corrected | 1 | 0.0075188 |
| Refused Medical Aid | 1 | 0.0075188 |
Graphs, Heatmaps, and Tables Prepared By: Isaac H. Michaels, MPH
Data Source: NYC Open Data
Back to top
All Other Mci’s
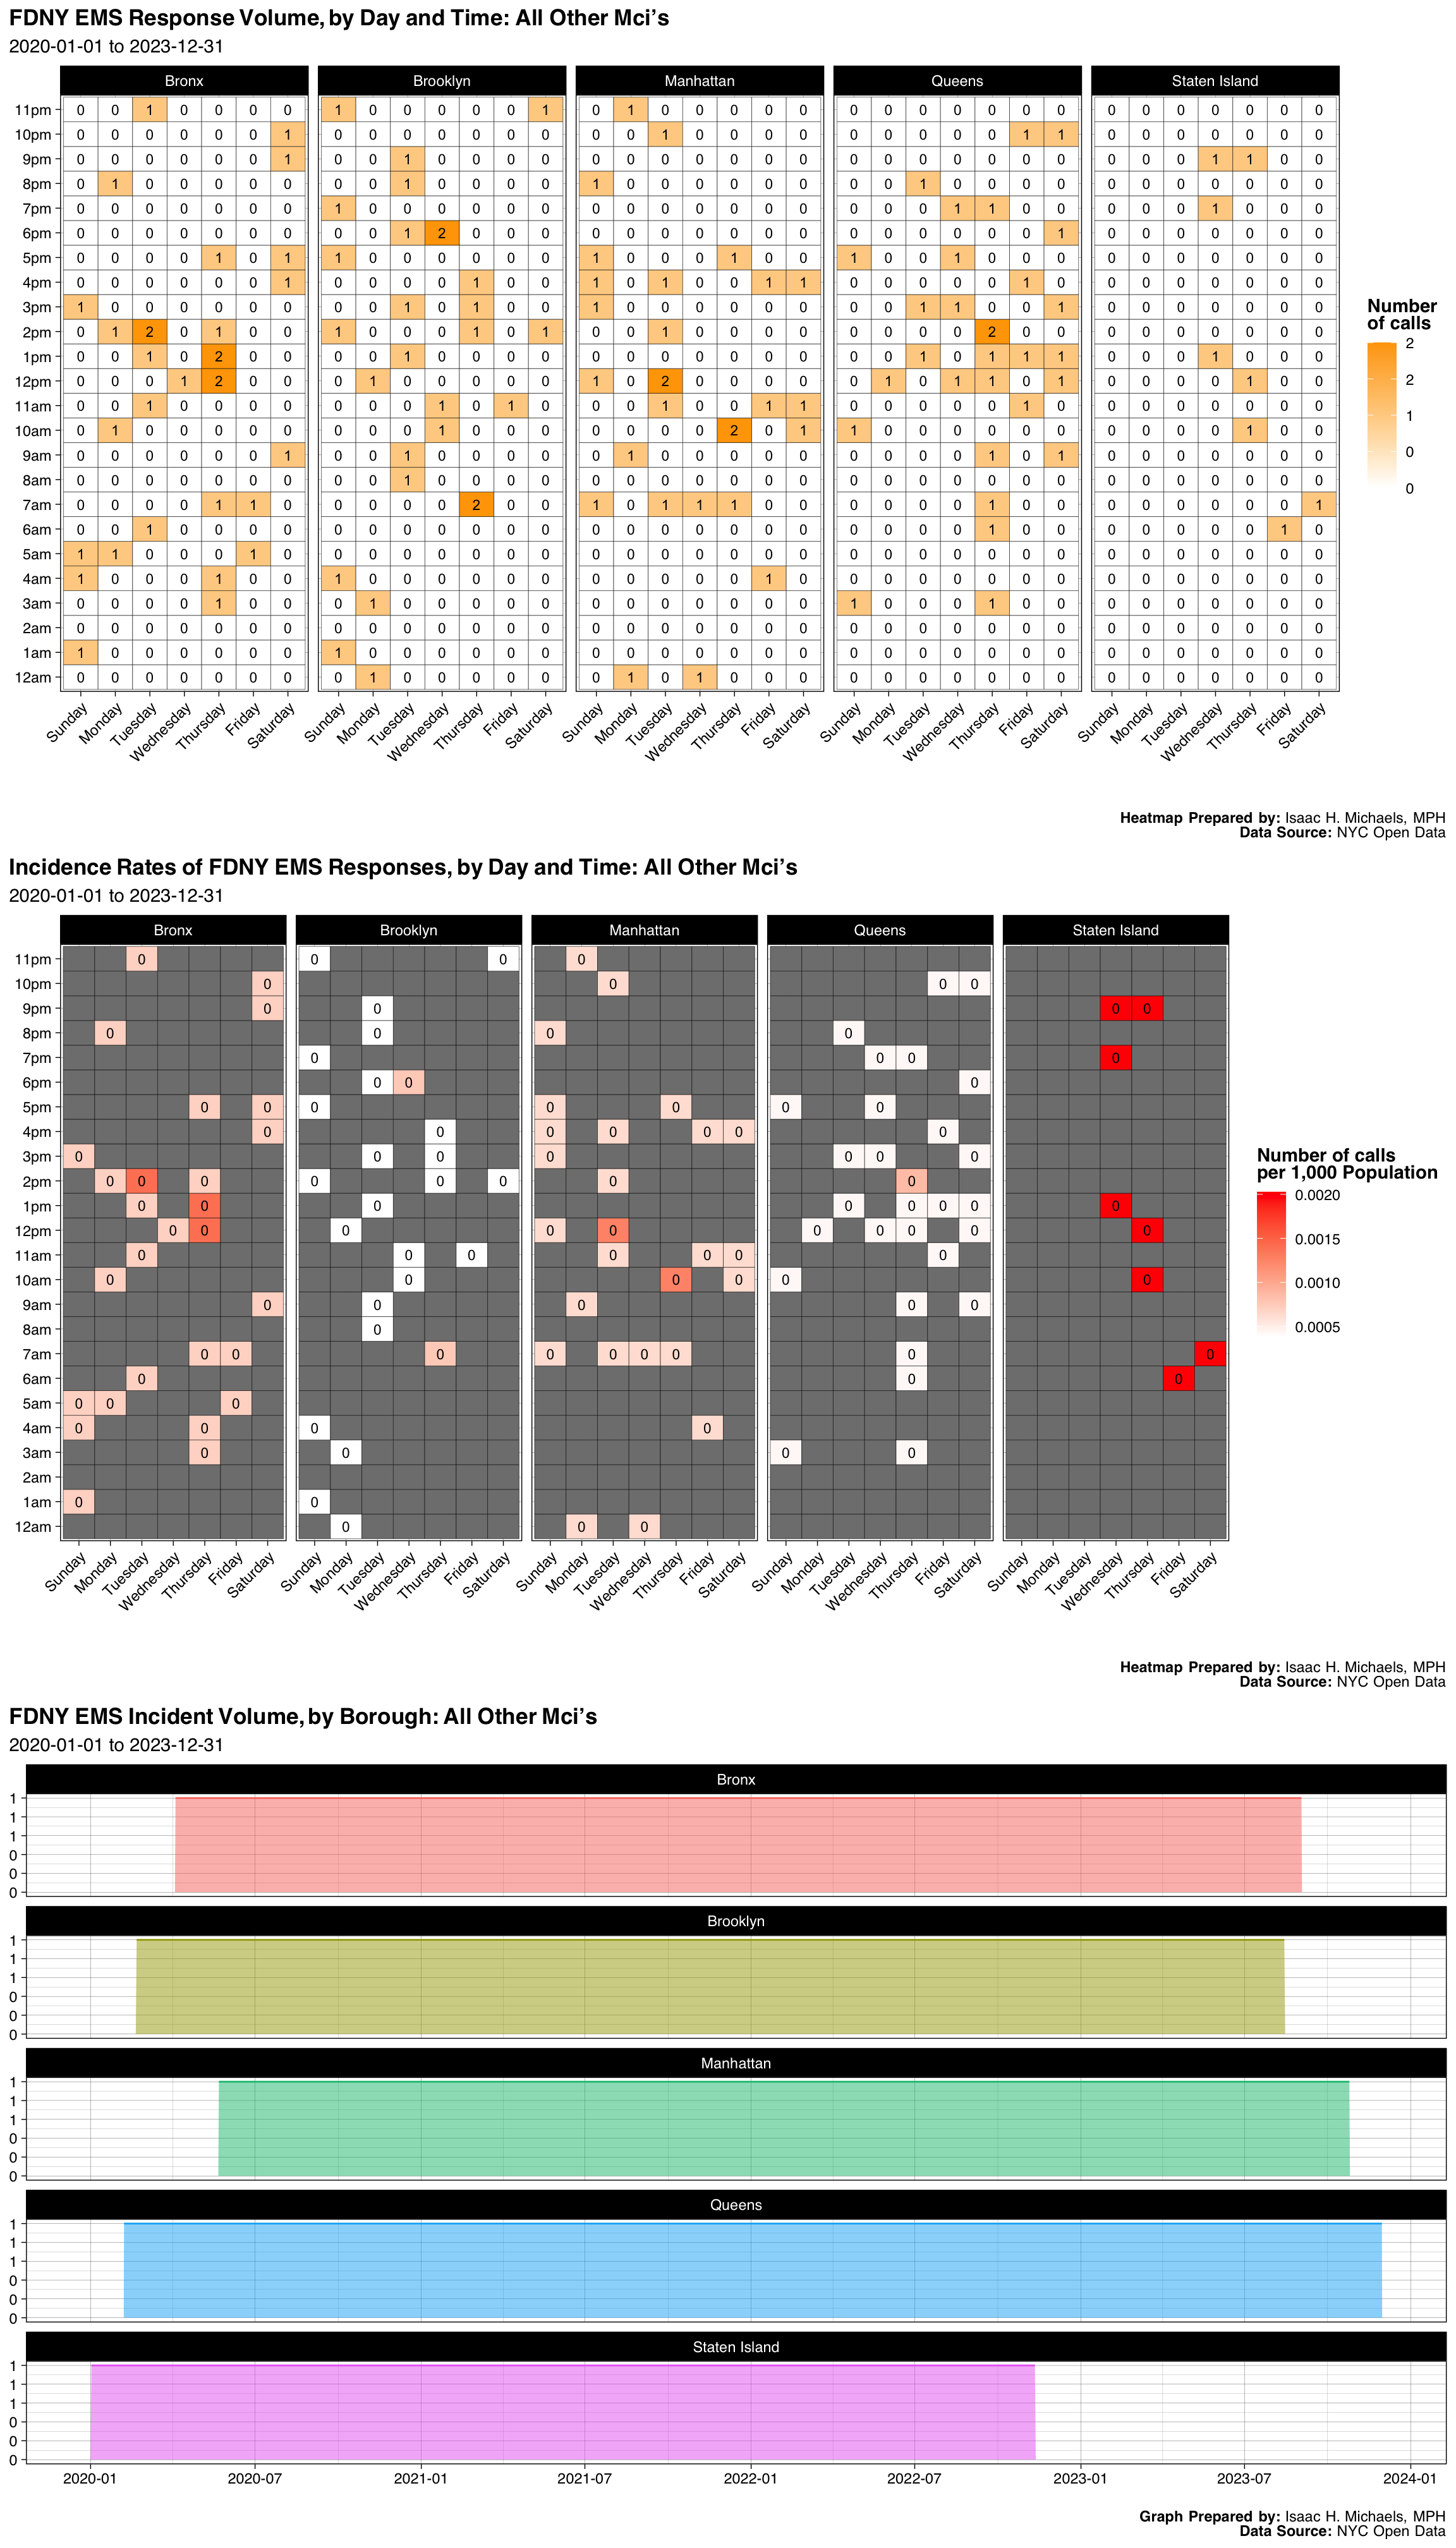
| Borough | Number | Percent |
|---|---|---|
| Bronx | 31 | 0.248 |
| Brooklyn | 28 | 0.224 |
| Manhattan | 28 | 0.224 |
| Queens | 30 | 0.240 |
| Staten Island | 8 | 0.064 |
| Final Severity Level | Number | Percent |
|---|---|---|
| 1 | 0 | 0% |
| 2 | 120 | 0.96 |
| 3 | 4 | 0.032 |
| 4 | 1 | 0.008 |
| 5 | 0 | 0% |
| 6 | 0 | 0% |
| 7 | 0 | 0% |
| 8 | 0 | 0% |
| Disposition | Number | Percent |
|---|---|---|
| Transporting Patient | 89 | 0.712 |
| Cancelled | 20 | 0.160 |
| Condition Corrected | 10 | 0.080 |
| Refused Medical Aid | 3 | 0.024 |
| Patient Gone on Arrival | 1 | 0.008 |
| Patient Pronounced Dead | 1 | 0.008 |
| Unfounded | 1 | 0.008 |
Graphs, Heatmaps, and Tables Prepared By: Isaac H. Michaels, MPH
Data Source: NYC Open Data
Back to top
Hazardous Materials Incident
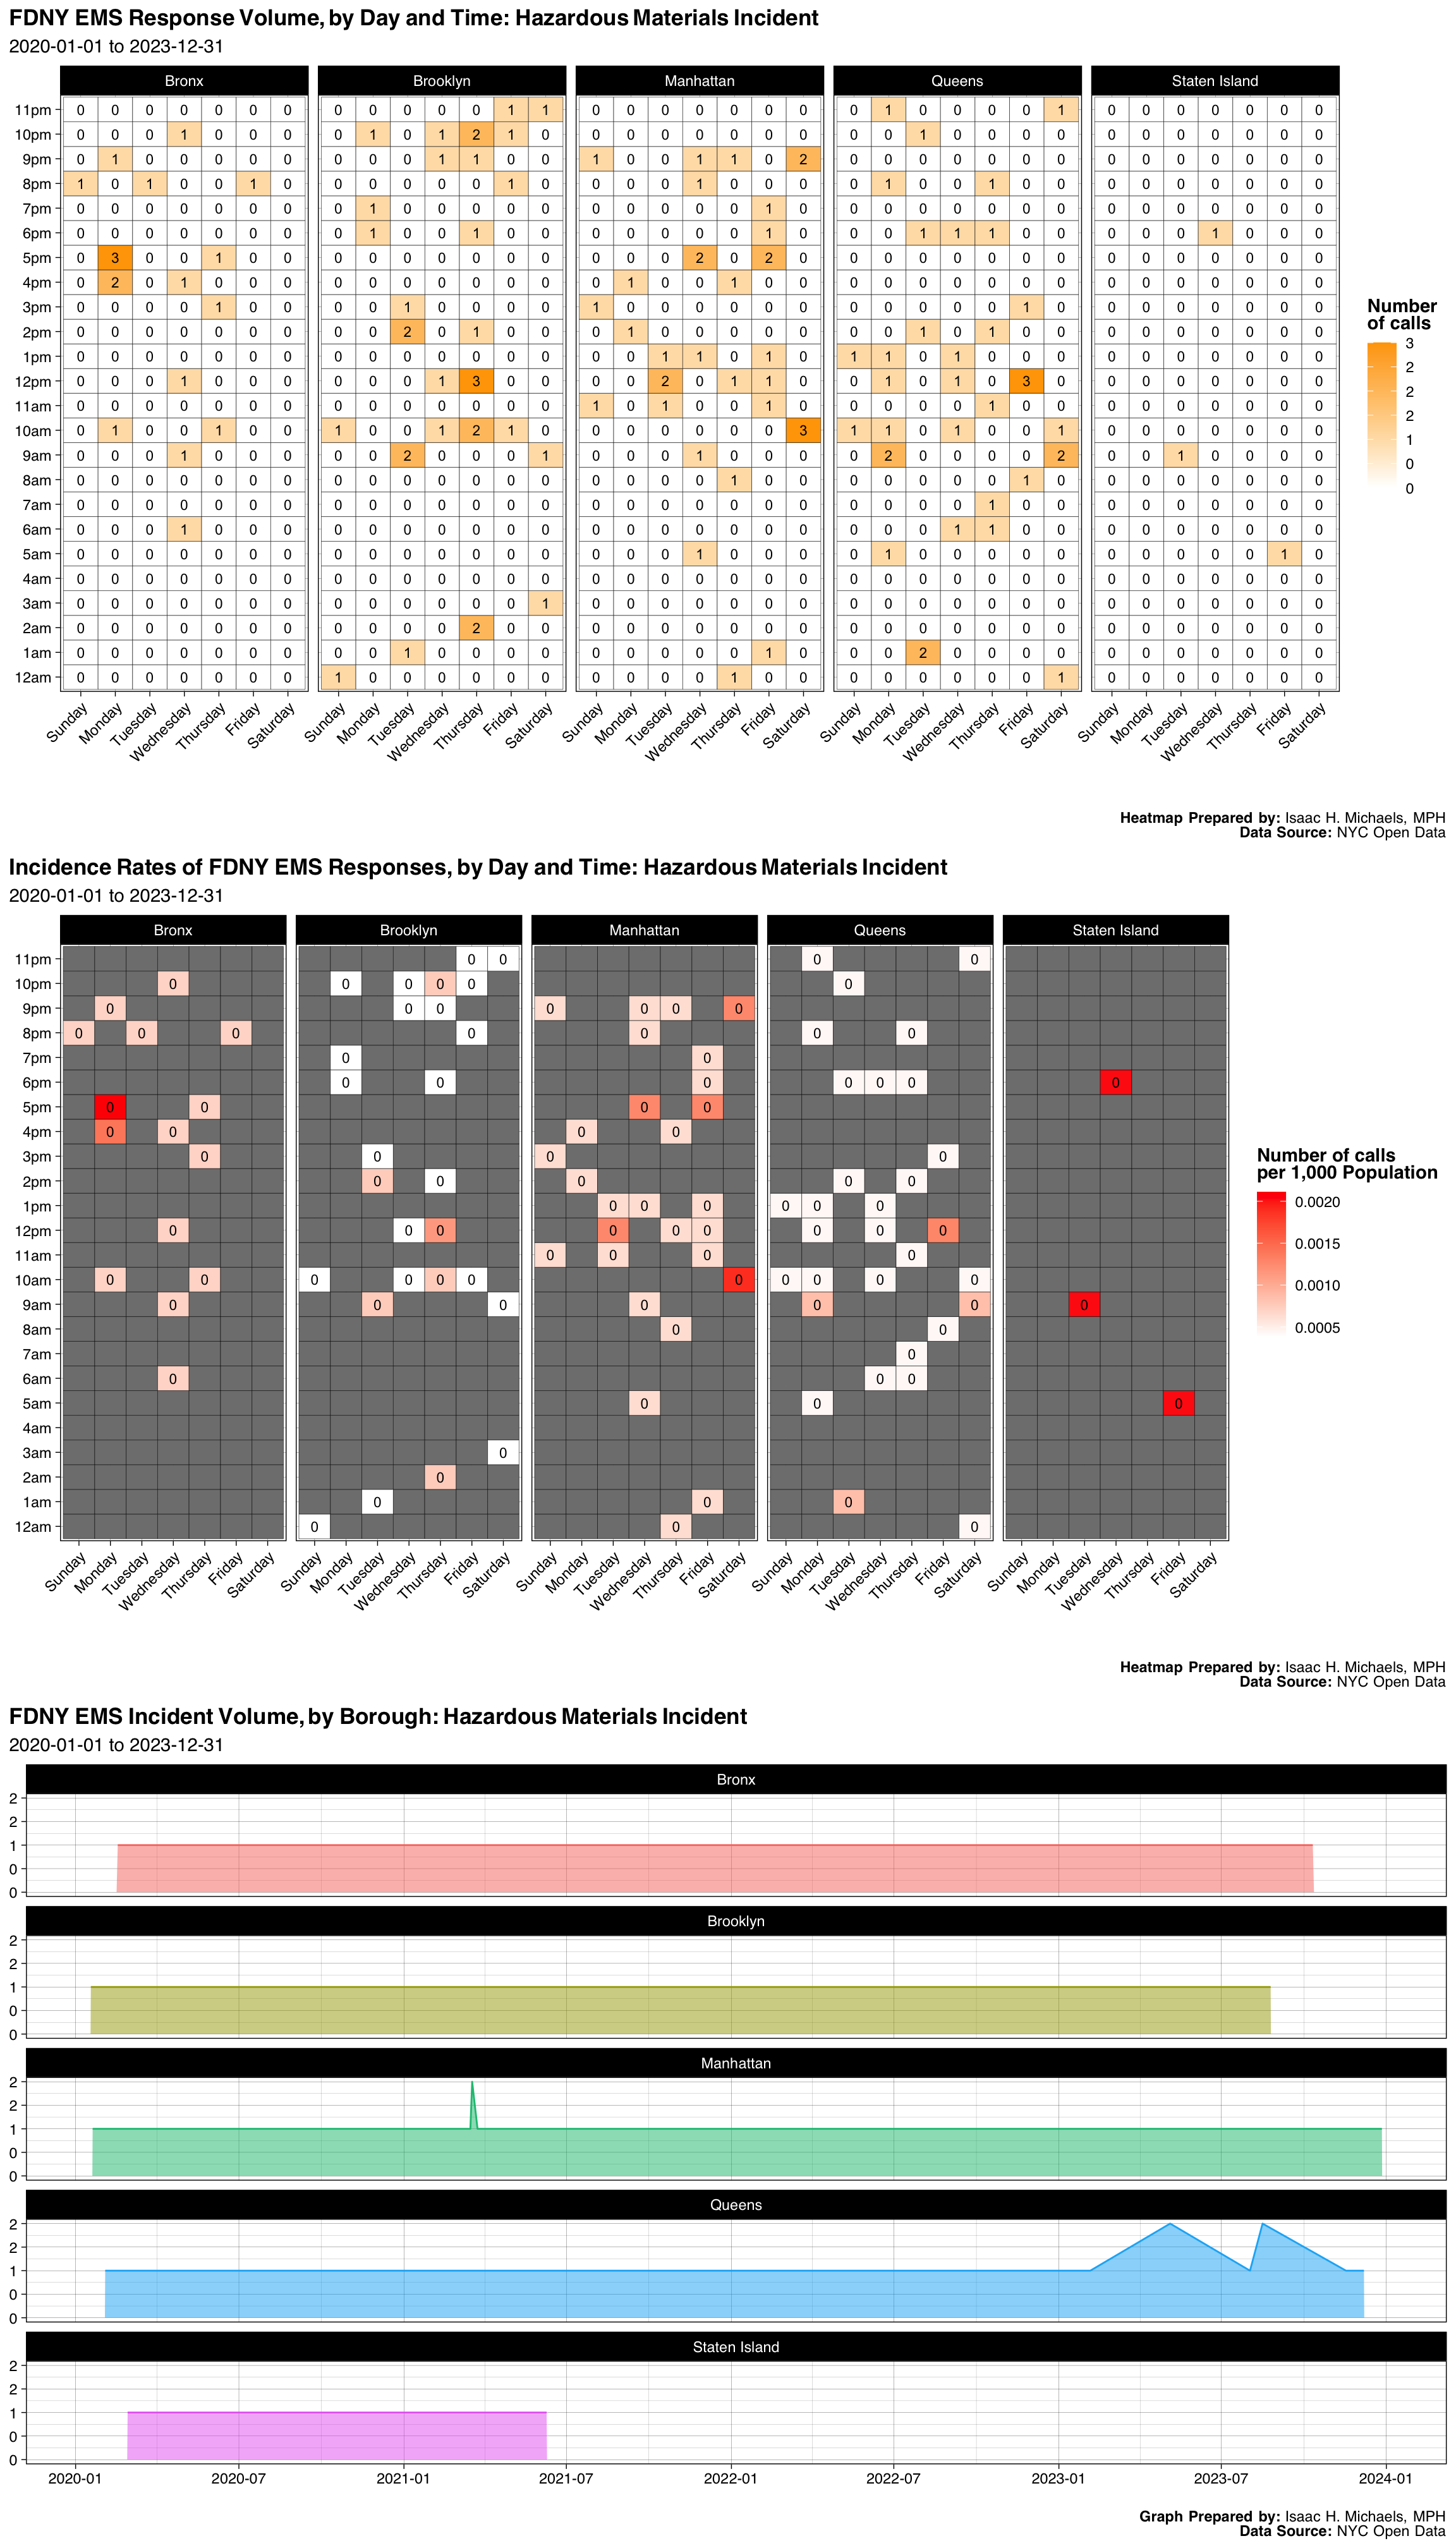
| Borough | Number | Percent |
|---|---|---|
| Bronx | 18 | 0.144 |
| Brooklyn | 34 | 0.272 |
| Manhattan | 34 | 0.272 |
| Queens | 36 | 0.288 |
| Staten Island | 3 | 0.024 |
| Final Severity Level | Number | Percent |
|---|---|---|
| 1 | 0 | 0% |
| 2 | 124 | 0.992 |
| 3 | 0 | 0% |
| 4 | 1 | 0.008 |
| 5 | 0 | 0% |
| 6 | 0 | 0% |
| 7 | 0 | 0% |
| 8 | 0 | 0% |
| Disposition | Number | Percent |
|---|---|---|
| Transporting Patient | 74 | 0.592 |
| Cancelled | 28 | 0.224 |
| Refused Medical Aid | 15 | 0.120 |
| Condition Corrected | 6 | 0.048 |
| Patient Pronounced Dead | 1 | 0.008 |
| Unfounded | 1 | 0.008 |
Graphs, Heatmaps, and Tables Prepared By: Isaac H. Michaels, MPH
Data Source: NYC Open Data
Back to top
Unconscious Patient-Rash&Fever
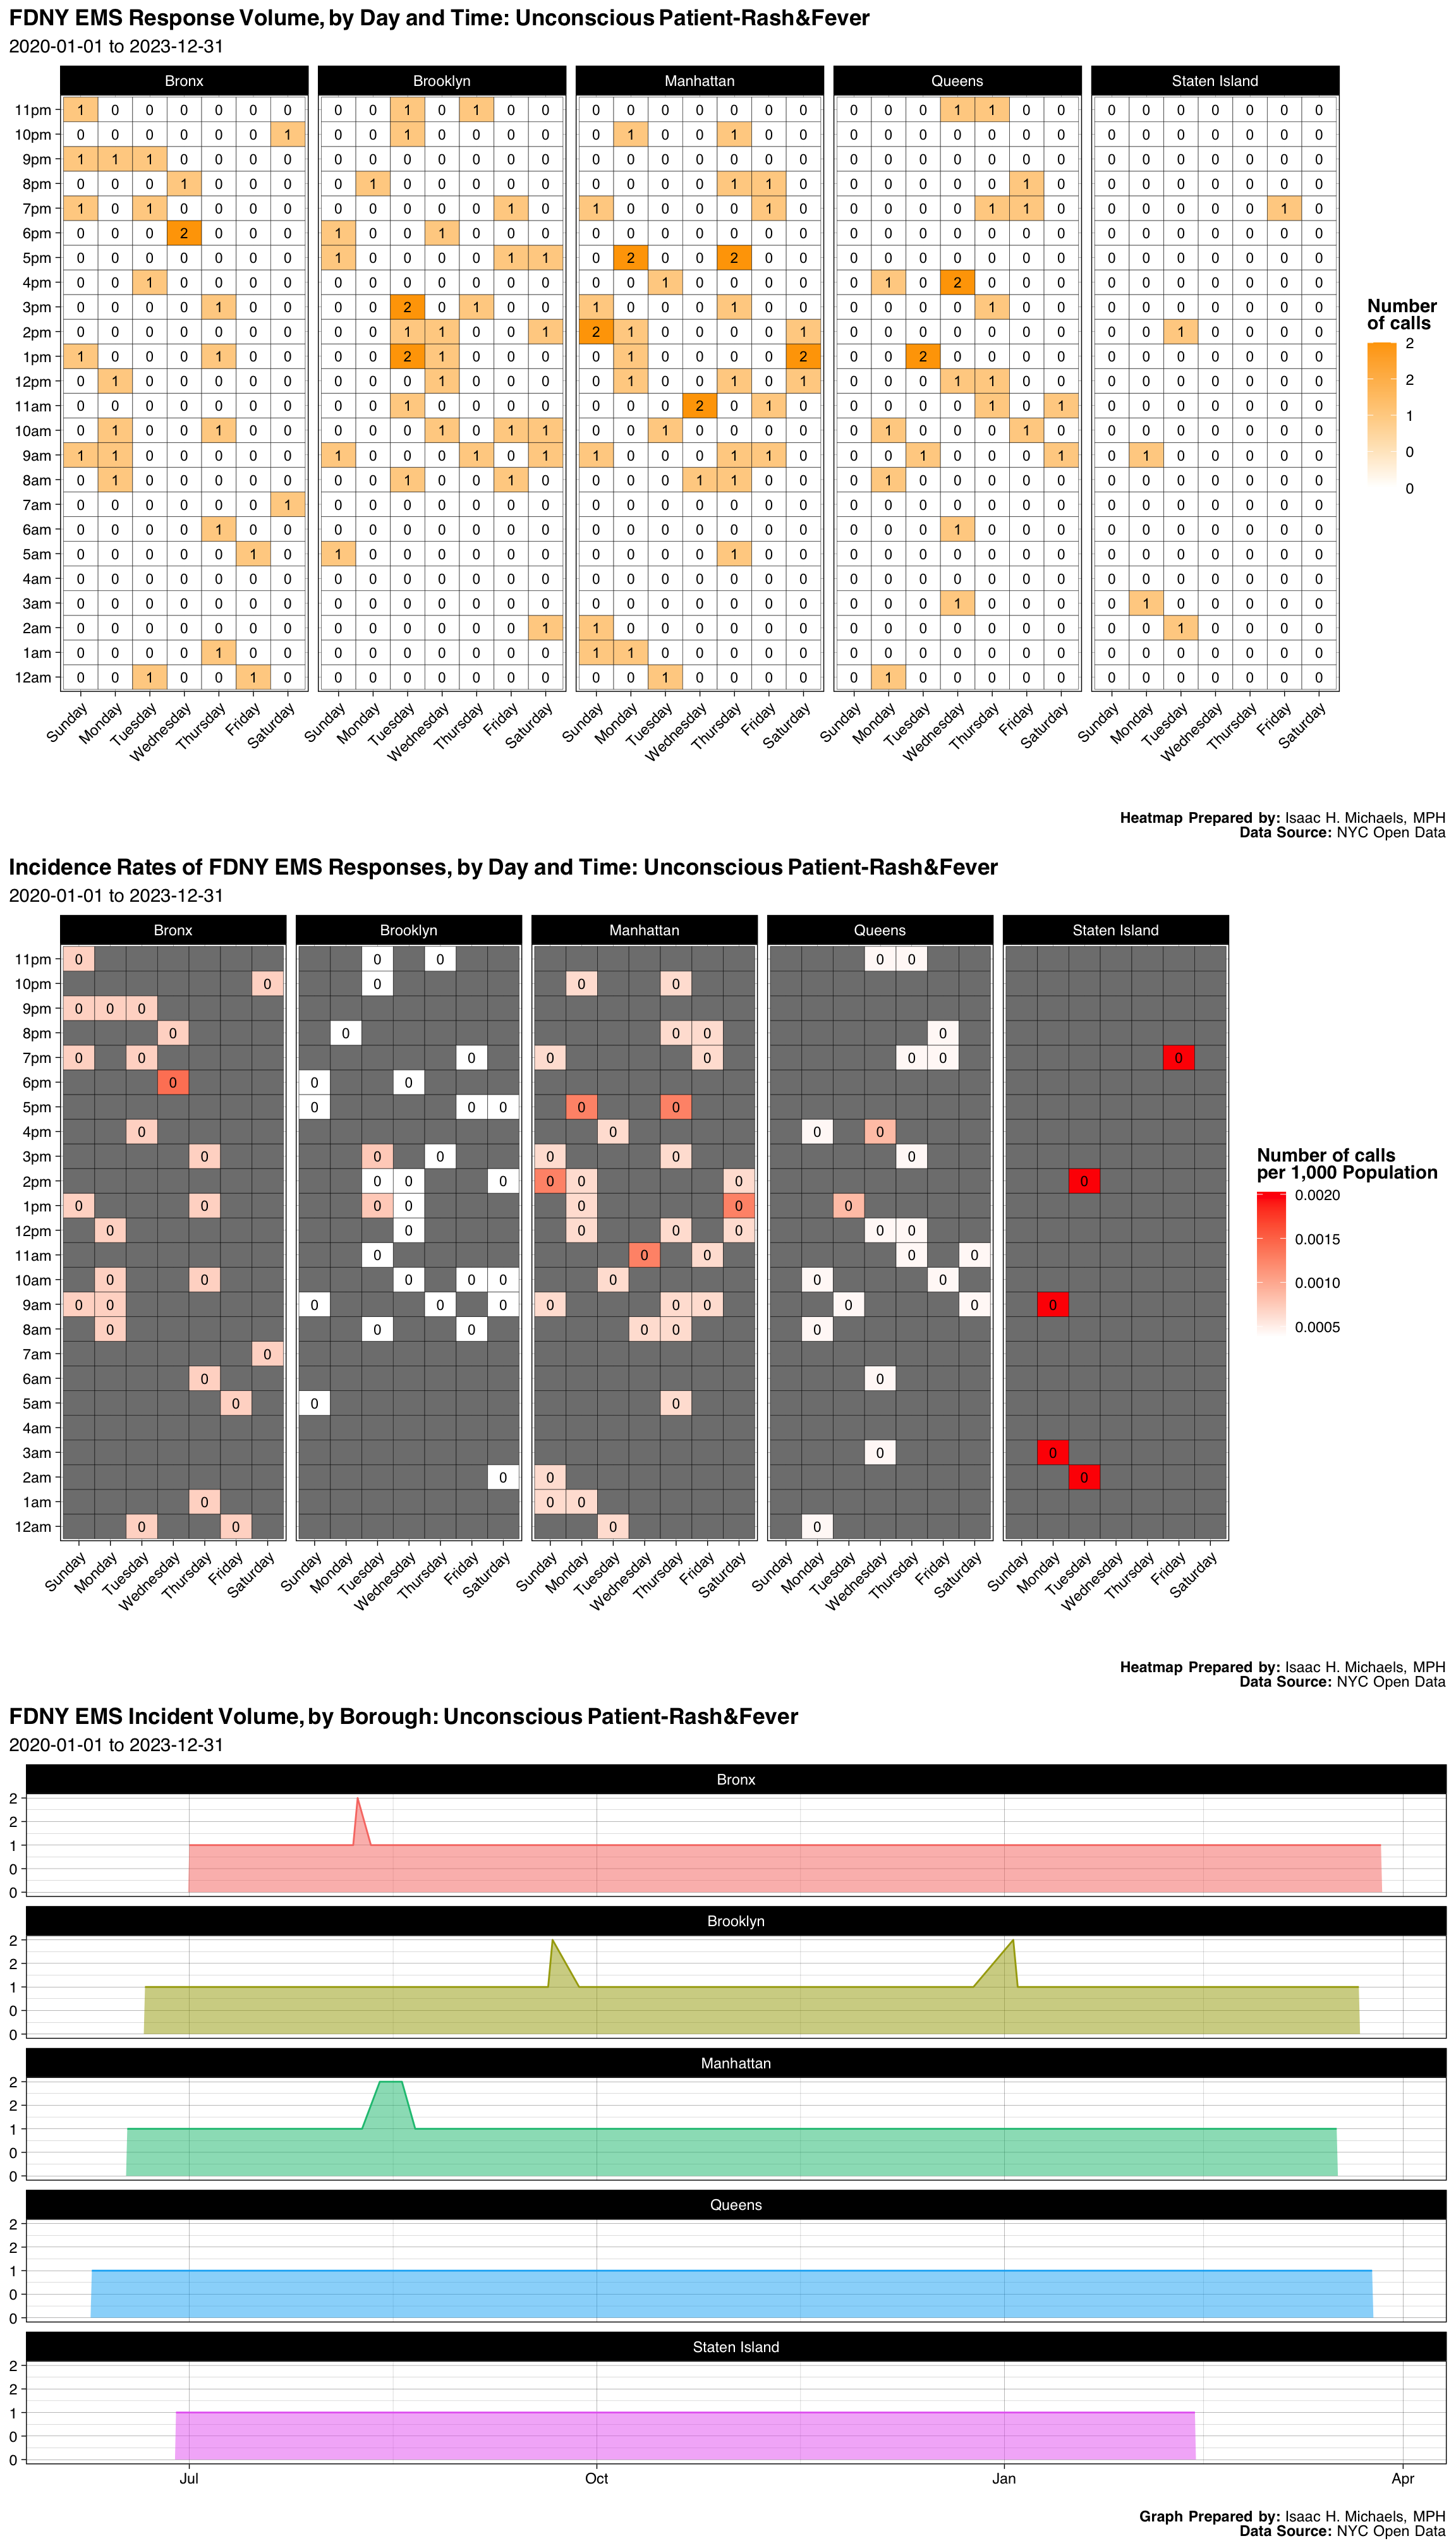
| Borough | Number | Percent |
|---|---|---|
| Bronx | 26 | 0.2131148 |
| Brooklyn | 31 | 0.2540984 |
| Manhattan | 37 | 0.3032787 |
| Queens | 23 | 0.1885246 |
| Staten Island | 5 | 0.0409836 |
| Final Severity Level | Number | Percent |
|---|---|---|
| 1 | 0 | 0% |
| 2 | 122 | 1 |
| 3 | 0 | 0% |
| 4 | 0 | 0% |
| 5 | 0 | 0% |
| 6 | 0 | 0% |
| 7 | 0 | 0% |
| 8 | 0 | 0% |
| Disposition | Number | Percent |
|---|---|---|
| Transporting Patient | 86 | 0.7049180 |
| Refused Medical Aid | 12 | 0.0983607 |
| Unfounded | 12 | 0.0983607 |
| Patient Gone on Arrival | 7 | 0.0573770 |
| Condition Corrected | 2 | 0.0163934 |
| Patient Pronounced Dead | 2 | 0.0163934 |
| Cancelled | 1 | 0.0081967 |
Graphs, Heatmaps, and Tables Prepared By: Isaac H. Michaels, MPH
Data Source: NYC Open Data
Back to top
Report Of Explosives
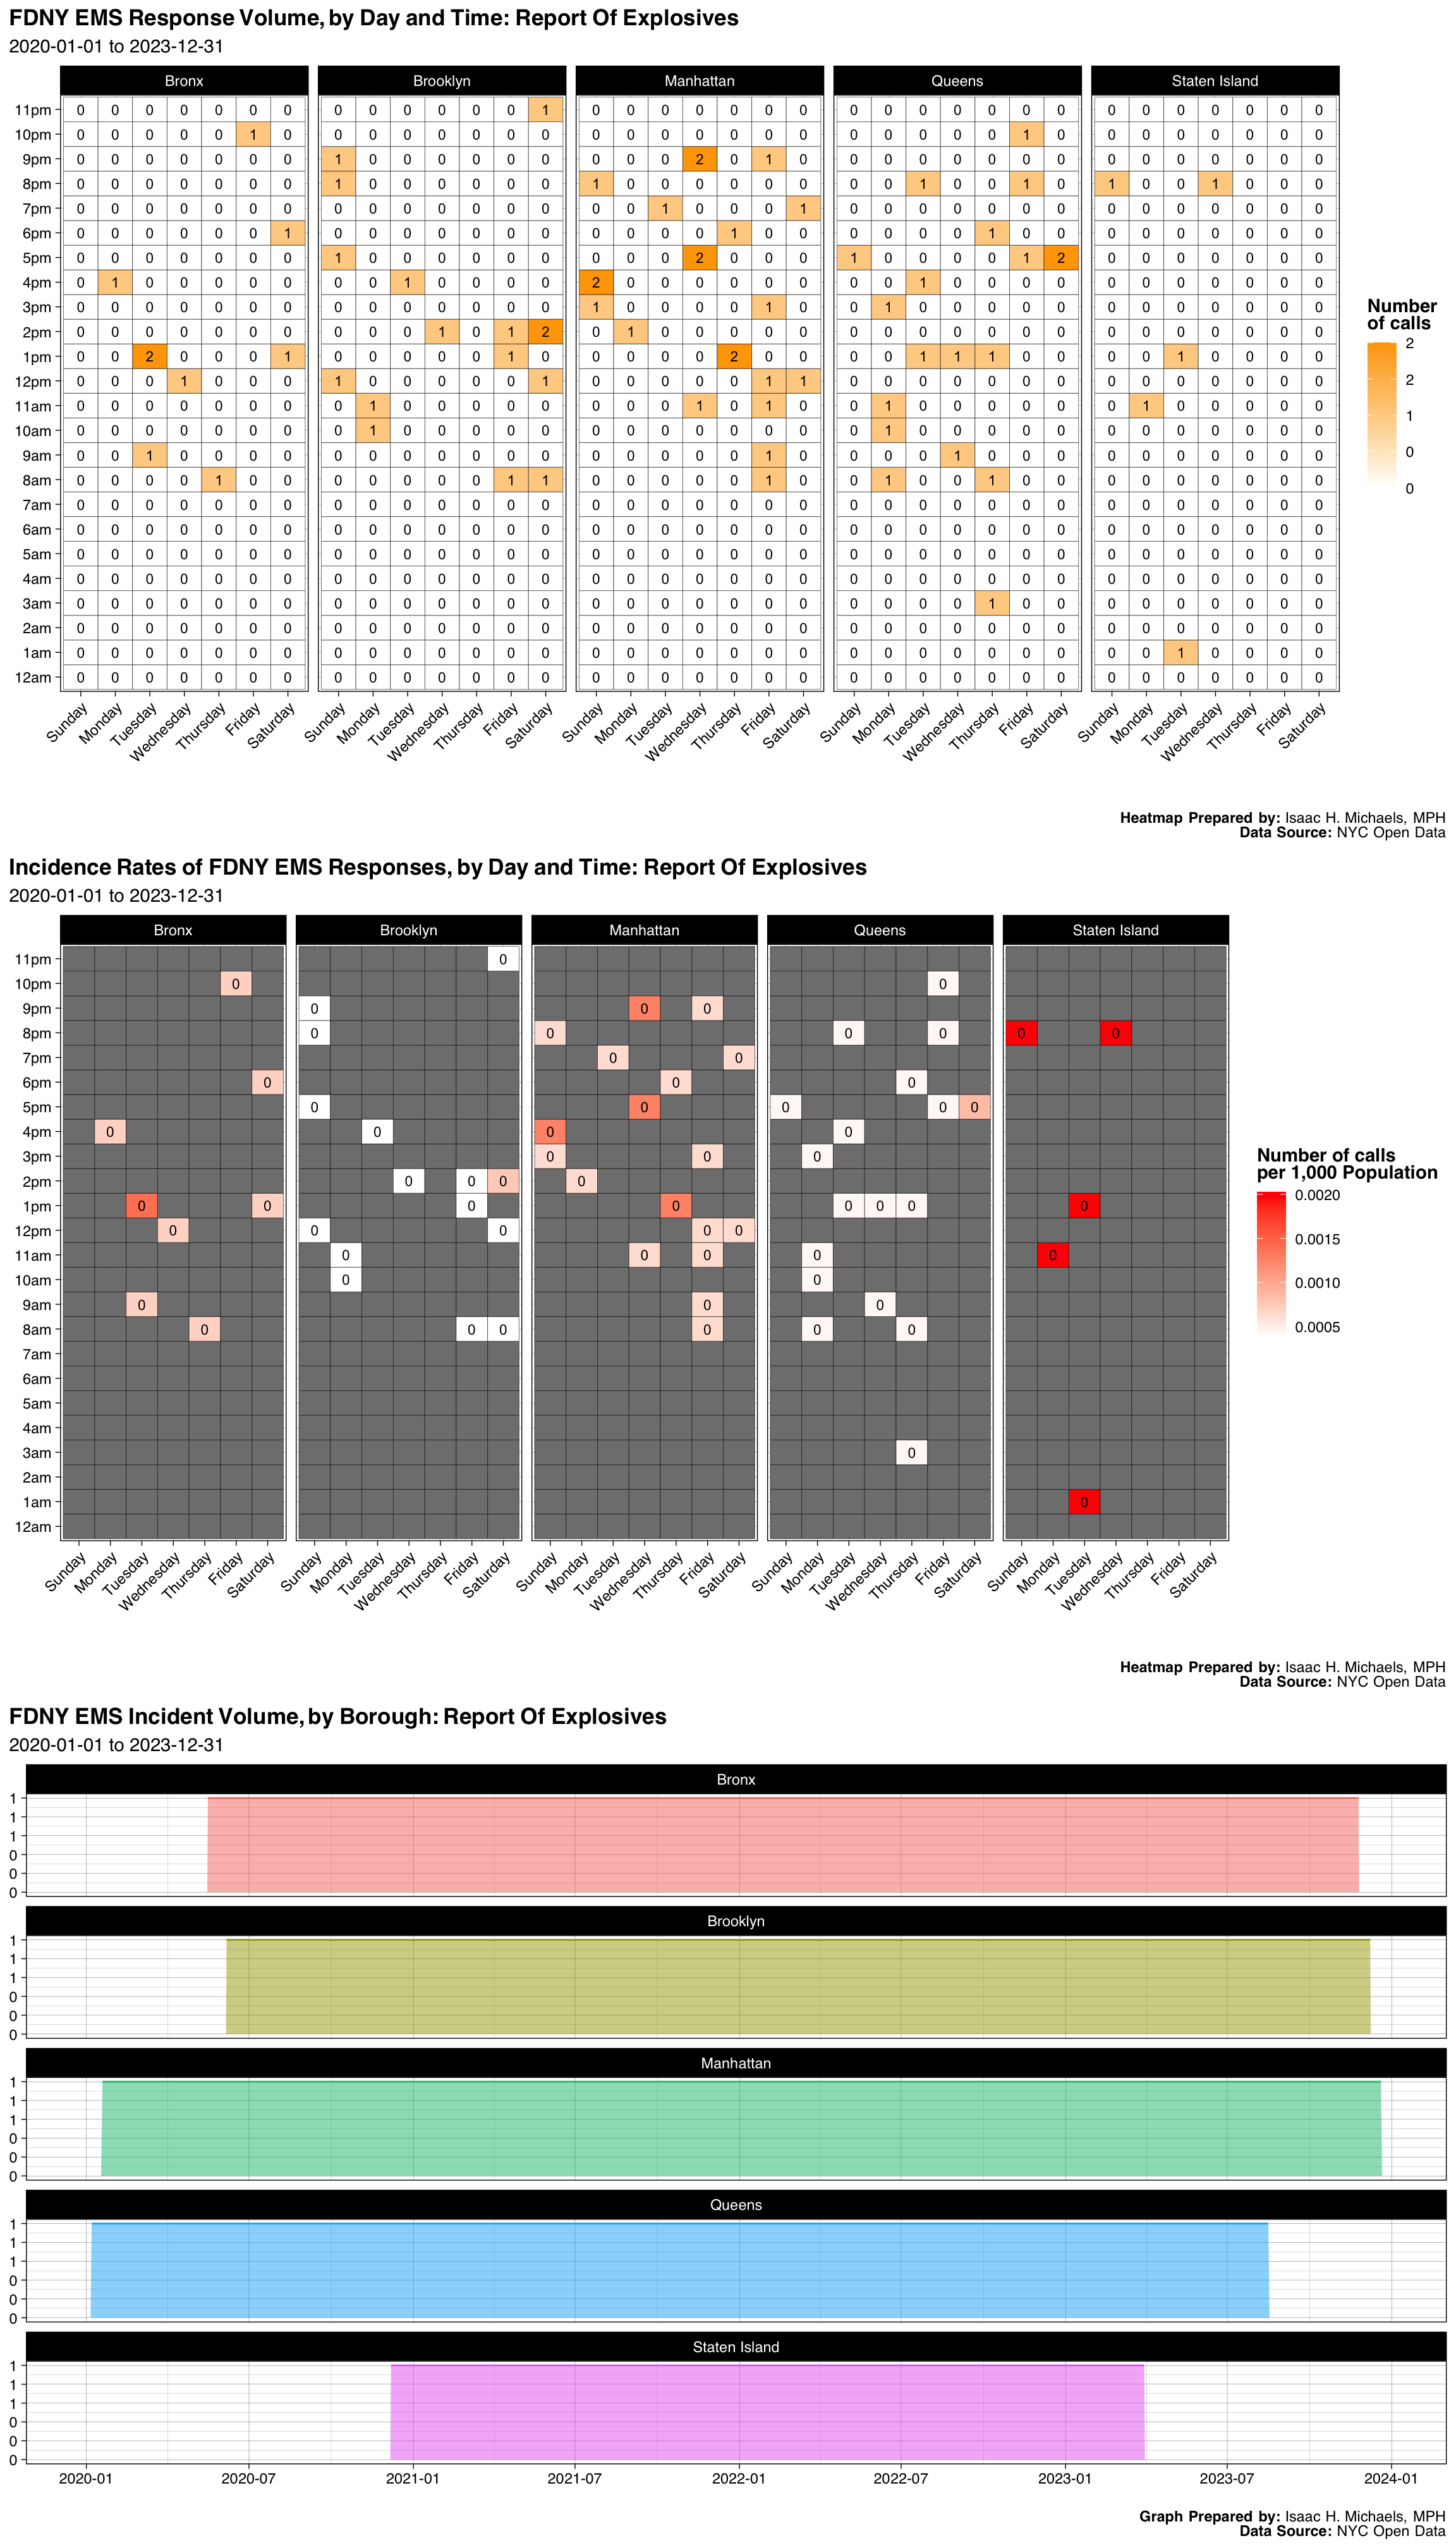
| Borough | Number | Percent |
|---|---|---|
| Bronx | 9 | 0.1267606 |
| Brooklyn | 16 | 0.2253521 |
| Manhattan | 22 | 0.3098592 |
| Queens | 19 | 0.2676056 |
| Staten Island | 5 | 0.0704225 |
| Final Severity Level | Number | Percent |
|---|---|---|
| 1 | 0 | 0% |
| 2 | 71 | 1 |
| 3 | 0 | 0% |
| 4 | 0 | 0% |
| 5 | 0 | 0% |
| 6 | 0 | 0% |
| 7 | 0 | 0% |
| 8 | 0 | 0% |
| Disposition | Number | Percent |
|---|---|---|
| Condition Corrected | 36 | 0.5070423 |
| Cancelled | 32 | 0.4507042 |
| Refused Medical Aid | 1 | 0.0140845 |
| Transporting Patient | 1 | 0.0140845 |
| Unfounded | 1 | 0.0140845 |
Graphs, Heatmaps, and Tables Prepared By: Isaac H. Michaels, MPH
Data Source: NYC Open Data
Back to top
Stat Transfer Request
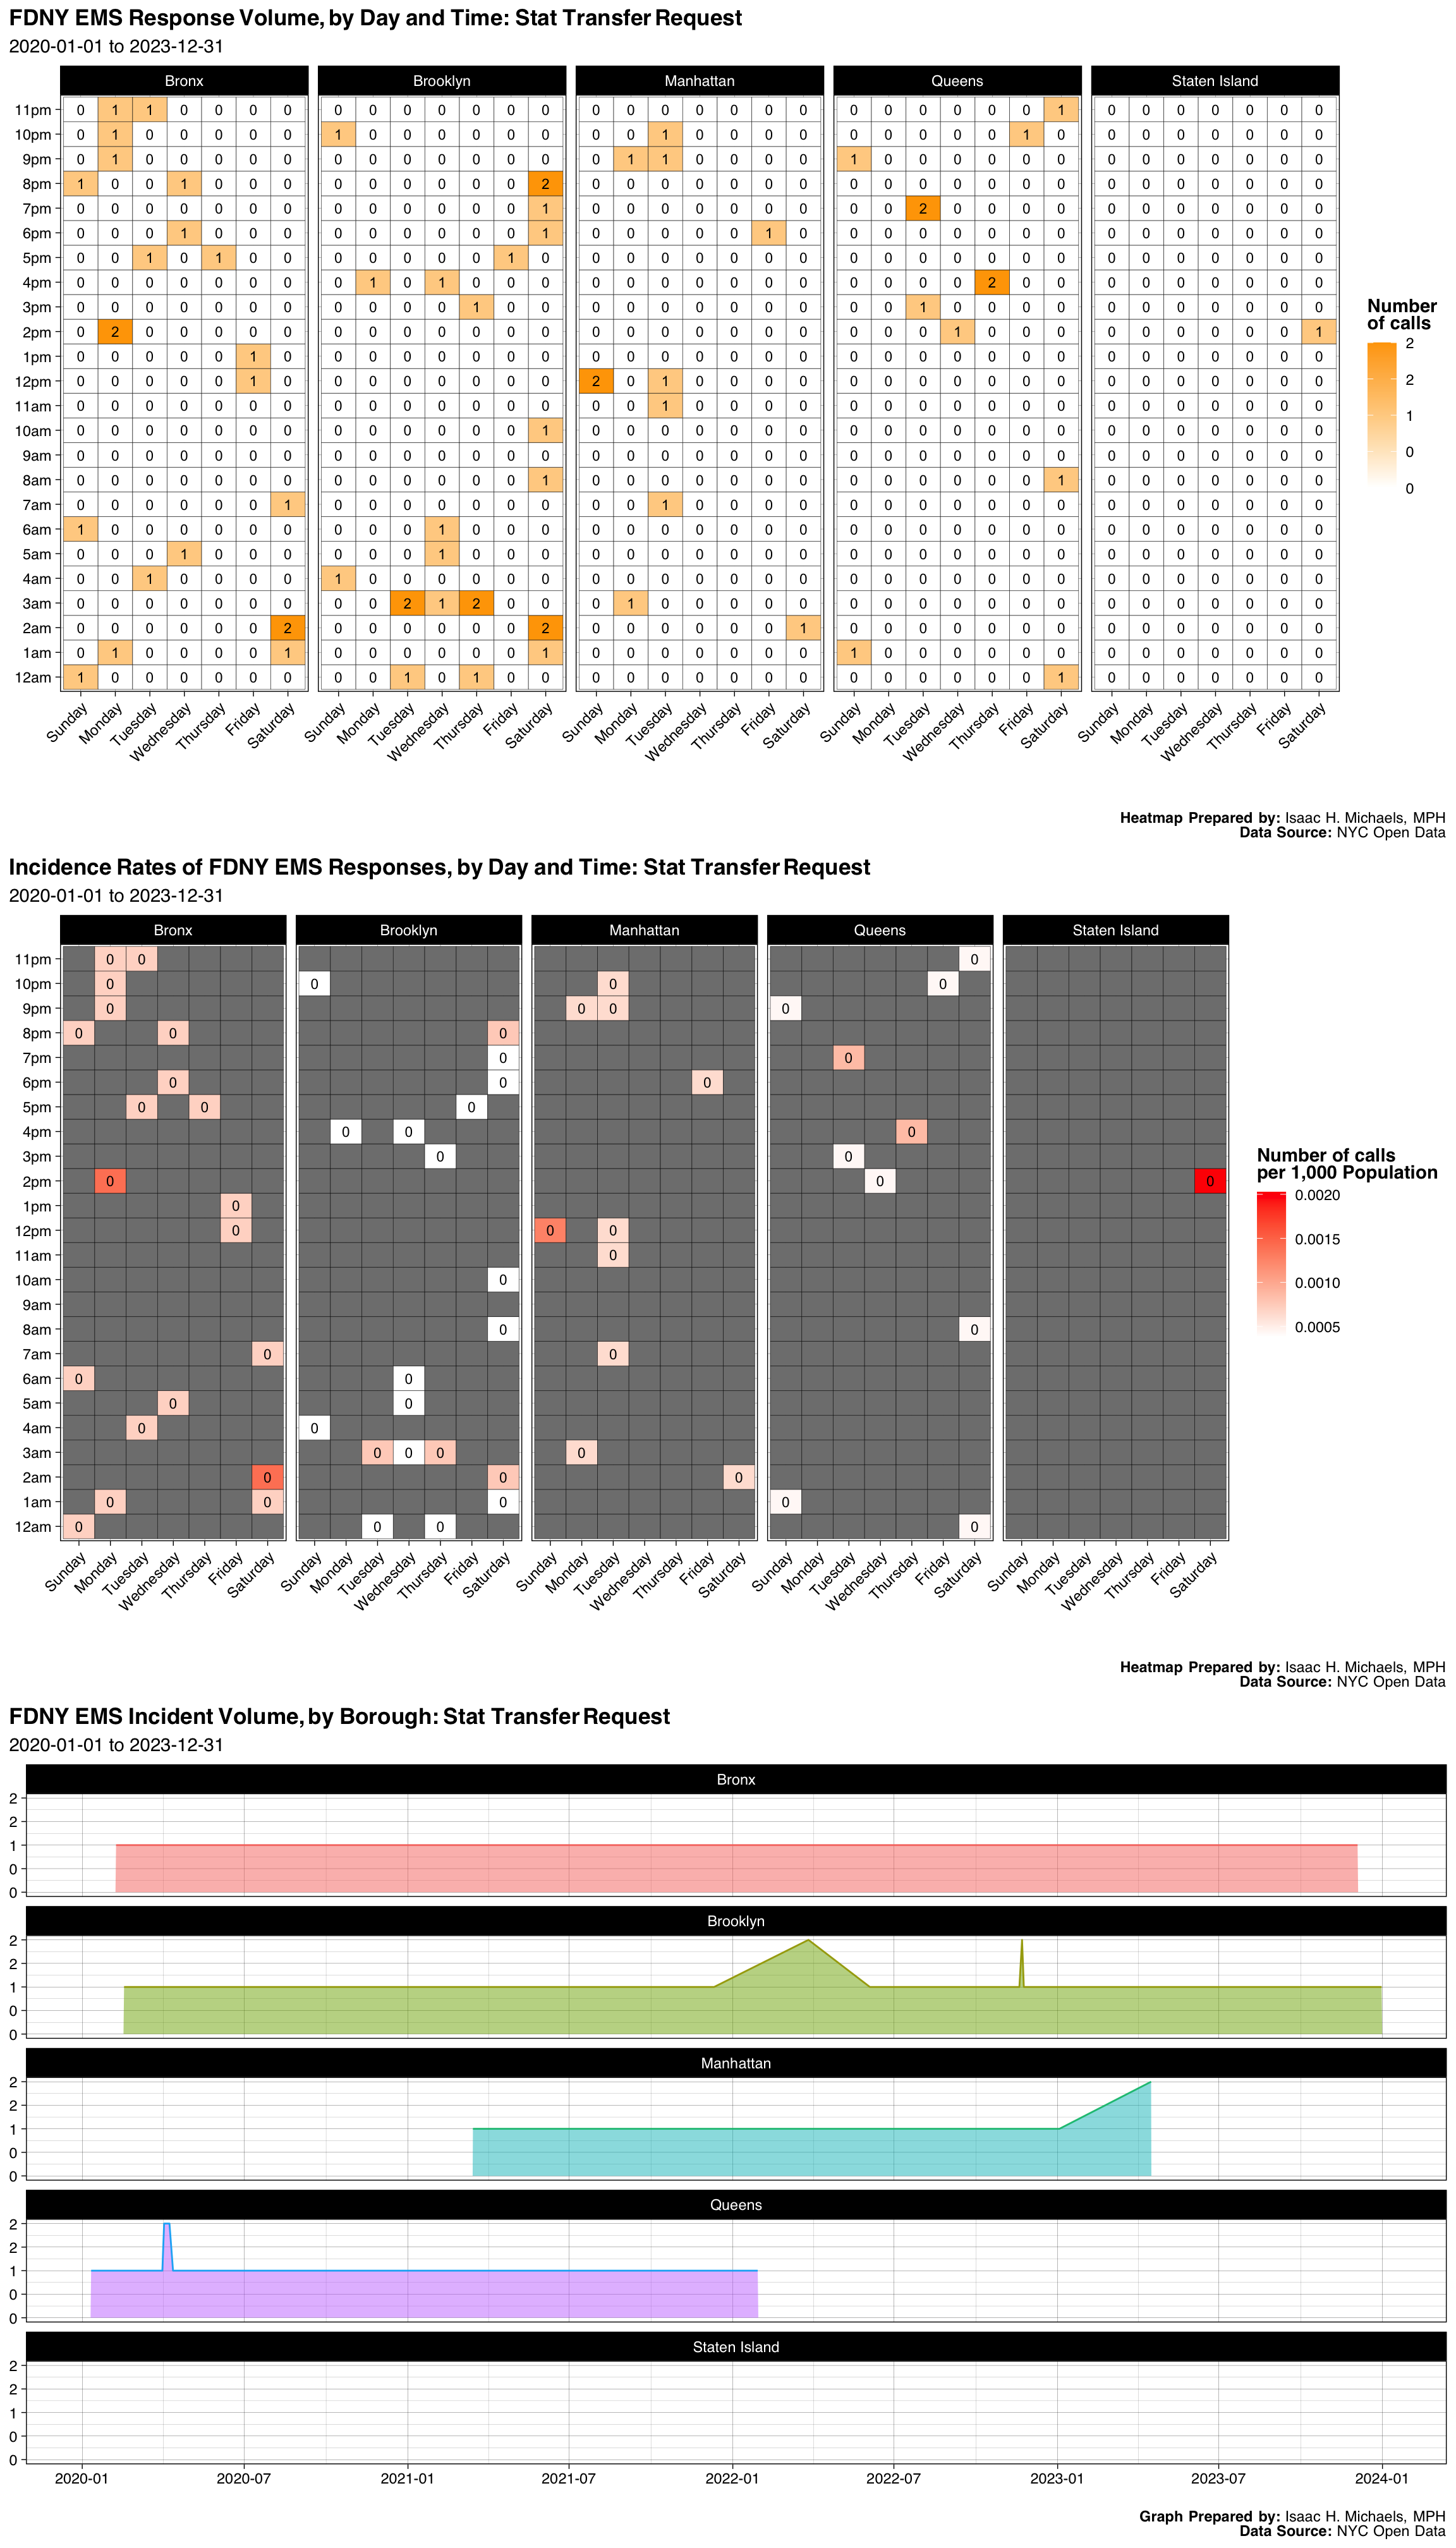
| Borough | Number | Percent |
|---|---|---|
| Bronx | 22 | 0.3142857 |
| Brooklyn | 24 | 0.3428571 |
| Manhattan | 11 | 0.1571429 |
| Queens | 12 | 0.1714286 |
| Staten Island | 1 | 0.0142857 |
| Final Severity Level | Number | Percent |
|---|---|---|
| 1 | 0 | 0% |
| 2 | 0 | 0% |
| 3 | 2 | 0.0285714285714286 |
| 4 | 3 | 0.0428571428571429 |
| 5 | 0 | 0% |
| 6 | 0 | 0% |
| 7 | 0 | 0% |
| 8 | 65 | 0.928571428571429 |
| Disposition | Number | Percent |
|---|---|---|
| Transporting Patient | 45 | 0.6428571 |
| Cancelled | 11 | 0.1571429 |
| Other | 9 | 0.1285714 |
| Condition Corrected | 2 | 0.0285714 |
| Patient Gone on Arrival | 1 | 0.0142857 |
| Refused Medical Aid | 1 | 0.0142857 |
| Unfounded | 1 | 0.0142857 |
Graphs, Heatmaps, and Tables Prepared By: Isaac H. Michaels, MPH
Data Source: NYC Open Data
Back to top
Construction/Demolition Incid
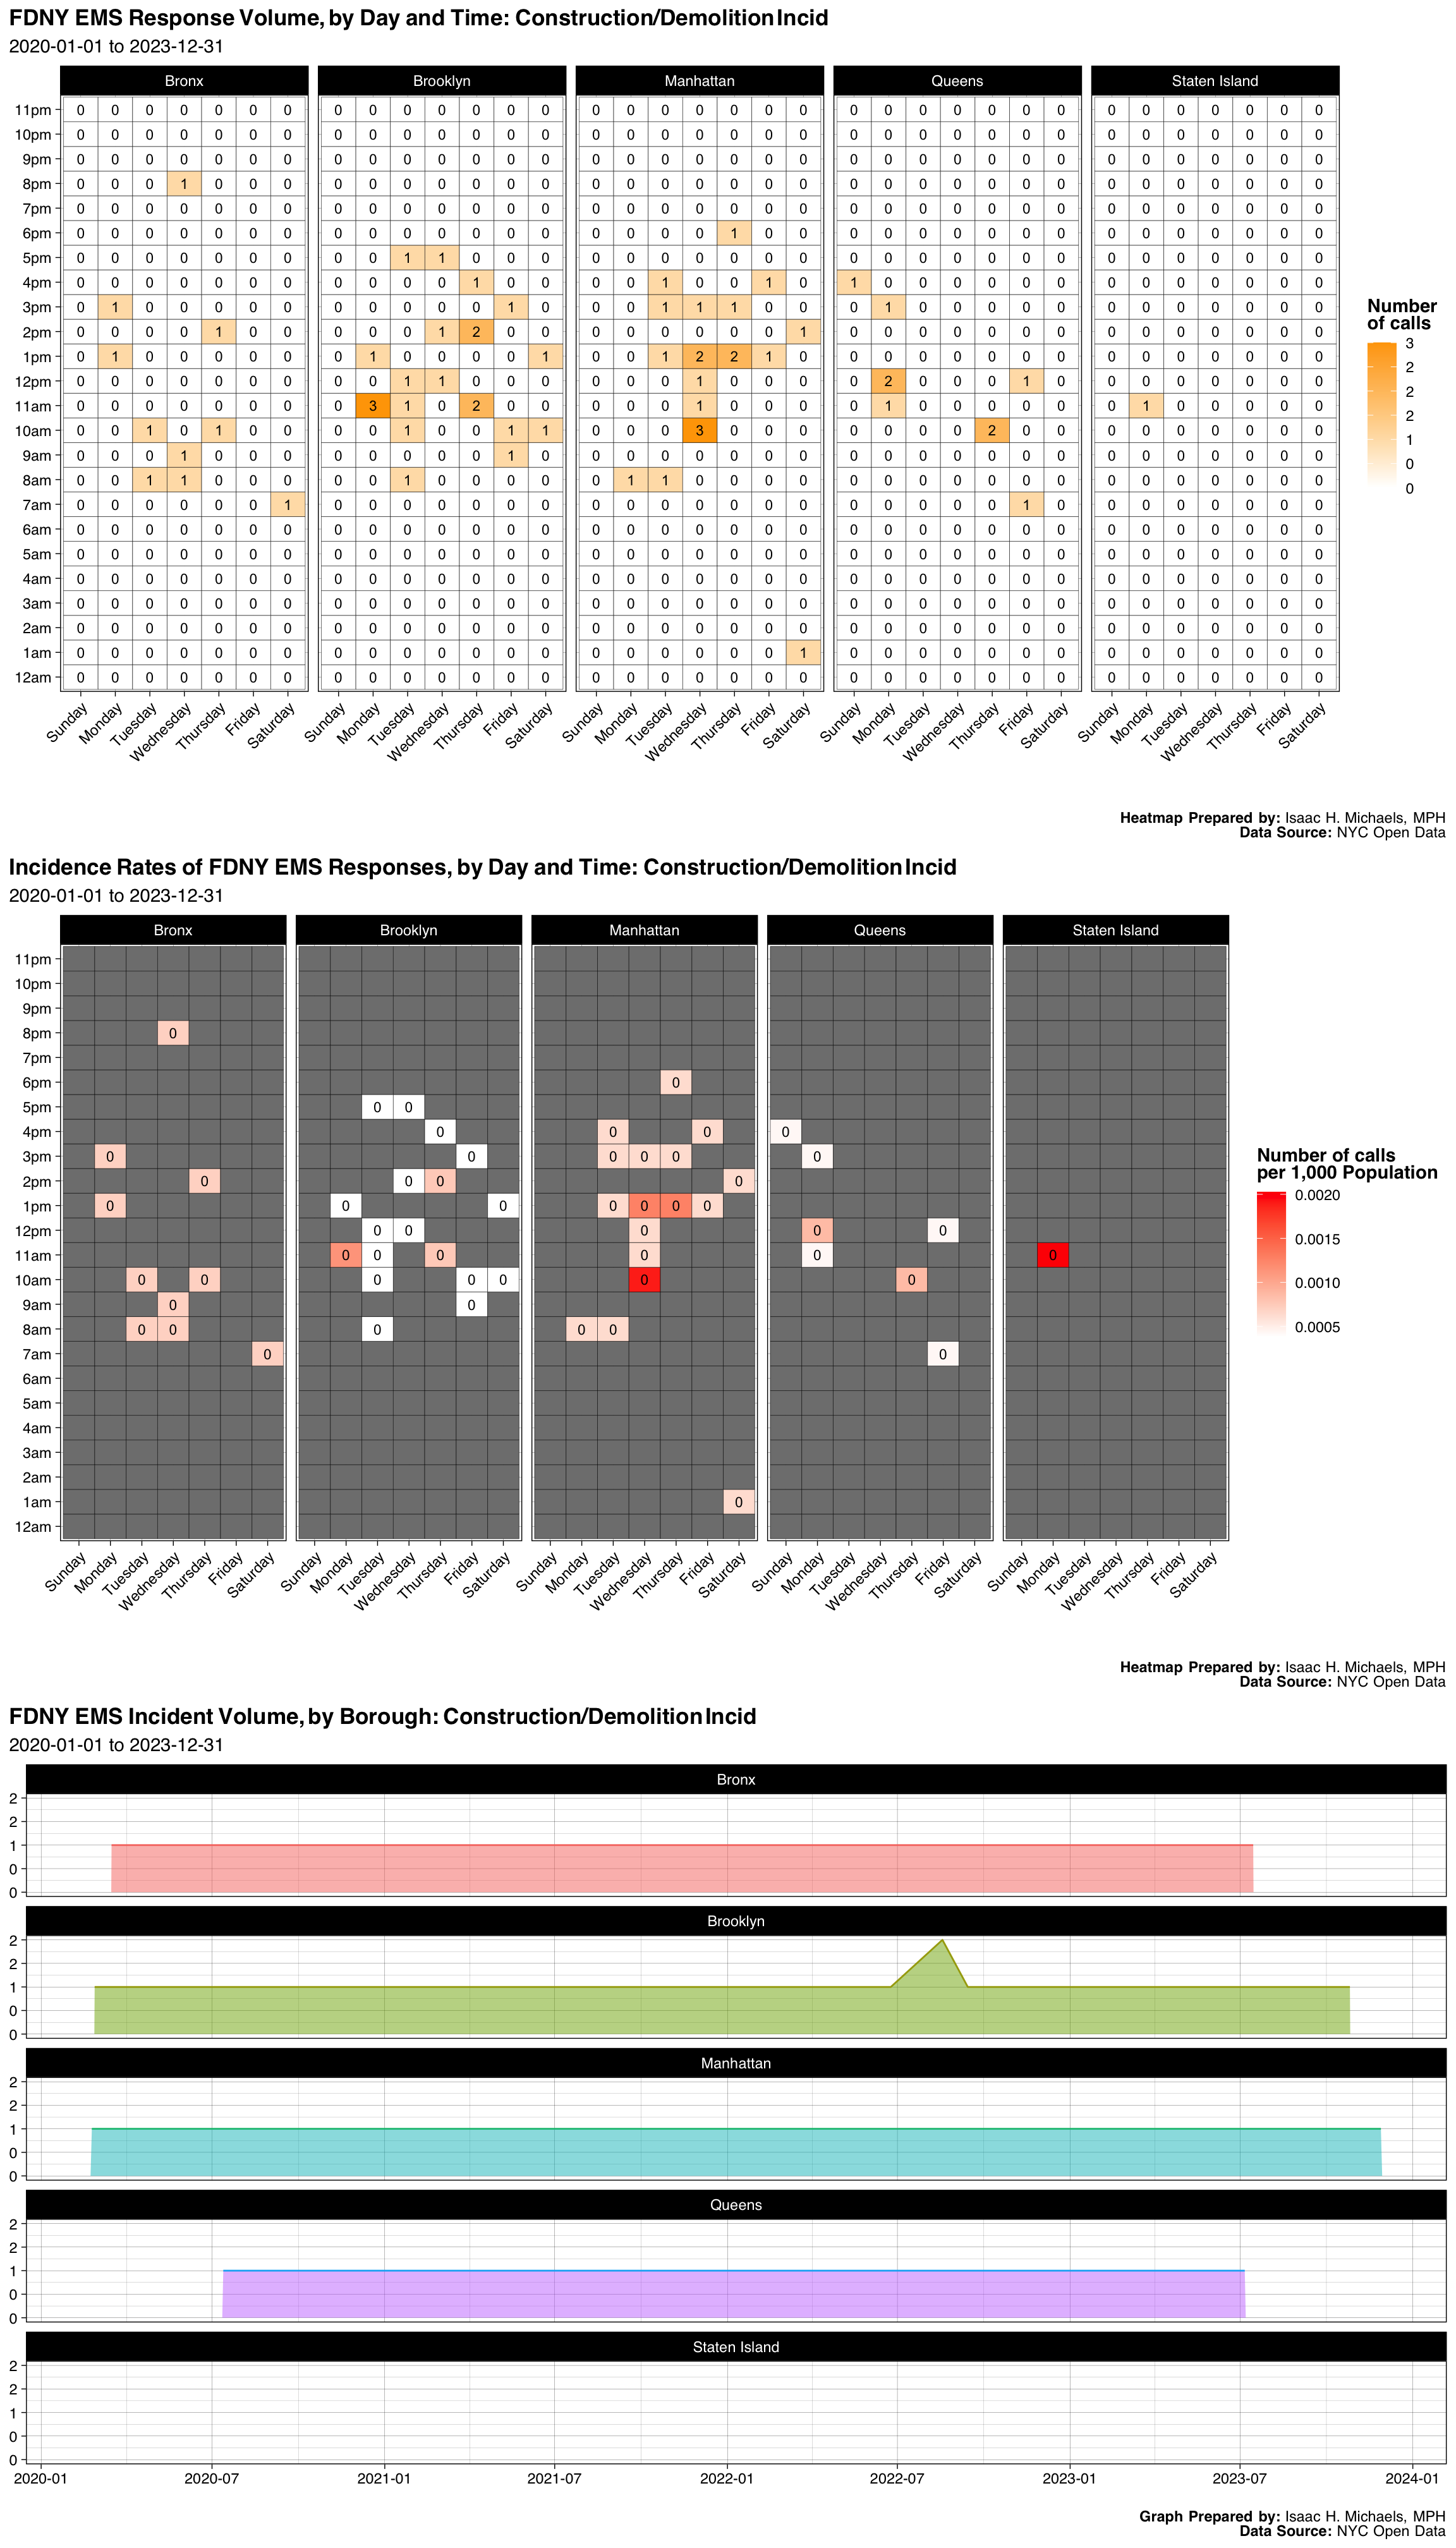
| Borough | Number | Percent |
|---|---|---|
| Bronx | 10 | 0.1587302 |
| Brooklyn | 22 | 0.3492063 |
| Manhattan | 21 | 0.3333333 |
| Queens | 9 | 0.1428571 |
| Staten Island | 1 | 0.0158730 |
| Final Severity Level | Number | Percent |
|---|---|---|
| 1 | 0 | 0% |
| 2 | 63 | 1 |
| 3 | 0 | 0% |
| 4 | 0 | 0% |
| 5 | 0 | 0% |
| 6 | 0 | 0% |
| 7 | 0 | 0% |
| 8 | 0 | 0% |
| Disposition | Number | Percent |
|---|---|---|
| Transporting Patient | 57 | 0.9047619 |
| Cancelled | 6 | 0.0952381 |
Graphs, Heatmaps, and Tables Prepared By: Isaac H. Michaels, MPH
Data Source: NYC Open Data
Back to top
Medevac, T/C Authority Only
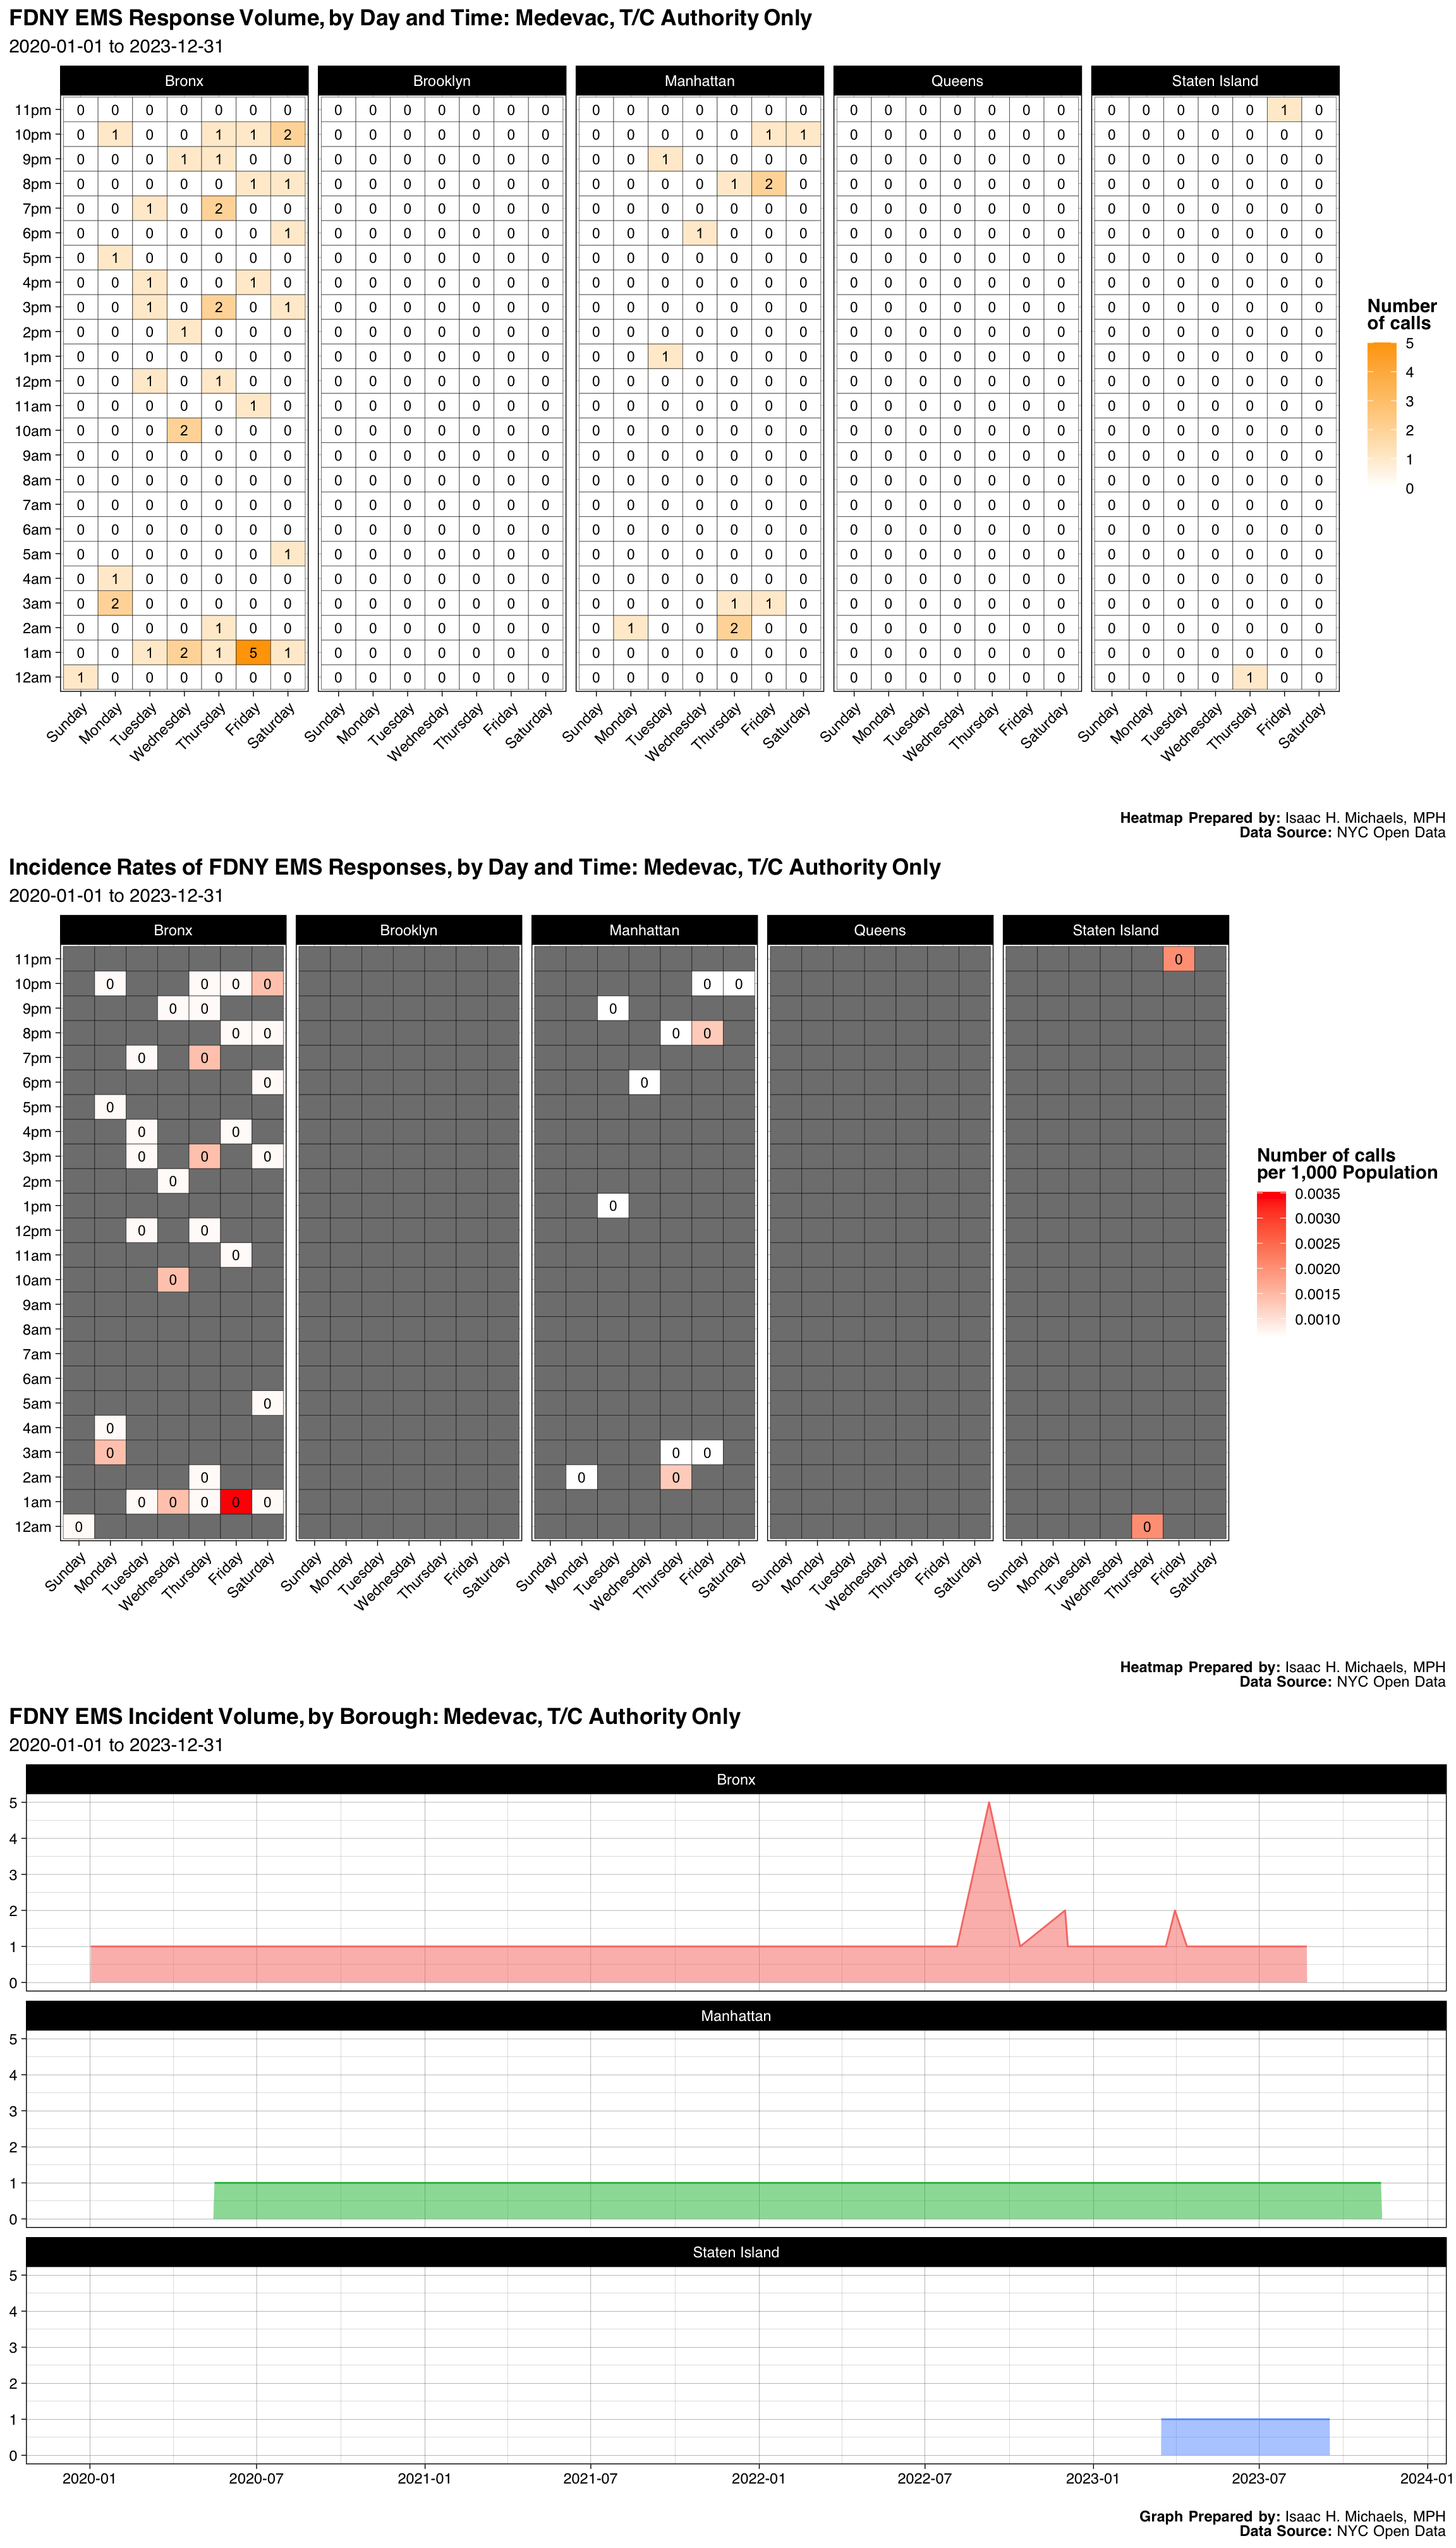
| Borough | Number | Percent |
|---|---|---|
| Bronx | 42 | 0.7368421 |
| Manhattan | 13 | 0.2280702 |
| Staten Island | 2 | 0.0350877 |
| Final Severity Level | Number | Percent |
|---|---|---|
| 1 | 0 | 0% |
| 2 | 56 | 0.982456140350877 |
| 3 | 0 | 0% |
| 4 | 1 | 0.0175438596491228 |
| 5 | 0 | 0% |
| 6 | 0 | 0% |
| 7 | 0 | 0% |
| 8 | 0 | 0% |
| Disposition | Number | Percent |
|---|---|---|
| Transporting Patient | 34 | 0.5964912 |
| Other | 11 | 0.1929825 |
| Condition Corrected | 6 | 0.1052632 |
| Cancelled | 5 | 0.0877193 |
| Unfounded | 1 | 0.0175439 |
Graphs, Heatmaps, and Tables Prepared By: Isaac H. Michaels, MPH
Data Source: NYC Open Data
Back to top
Death Confirm By Medical Auth
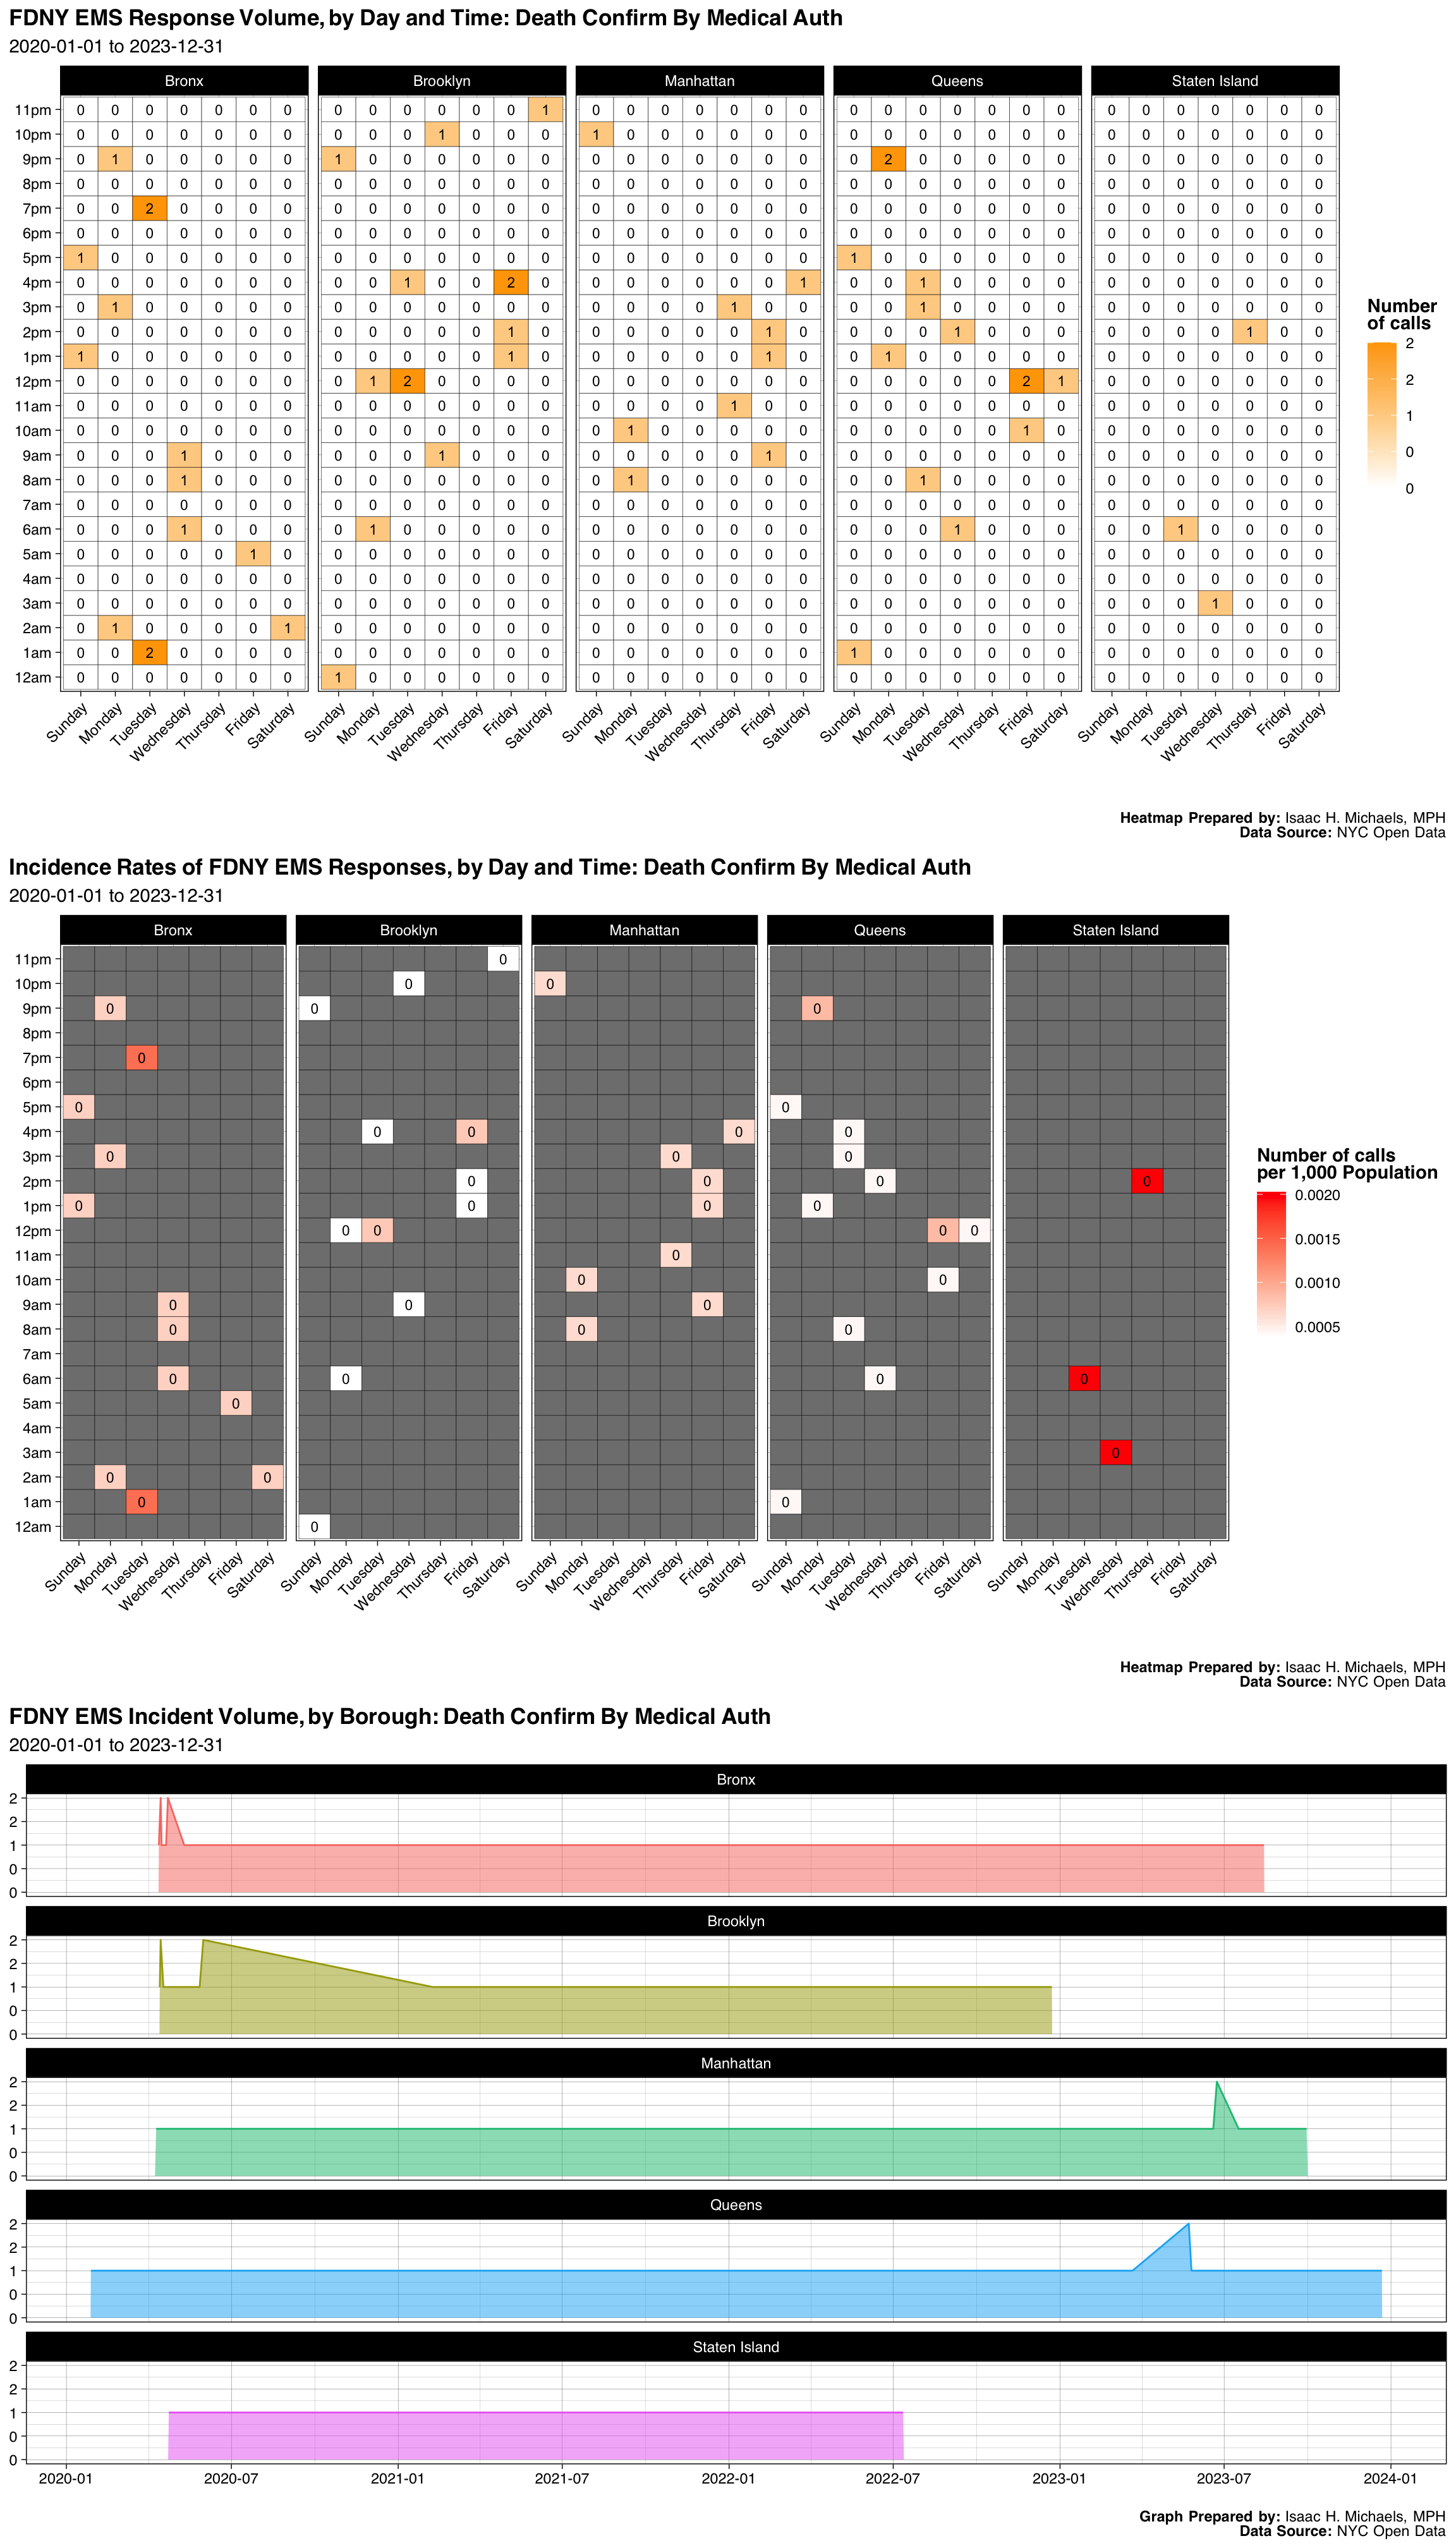
| Borough | Number | Percent |
|---|---|---|
| Bronx | 14 | 0.2592593 |
| Brooklyn | 14 | 0.2592593 |
| Manhattan | 9 | 0.1666667 |
| Queens | 14 | 0.2592593 |
| Staten Island | 3 | 0.0555556 |
| Final Severity Level | Number | Percent |
|---|---|---|
| 1 | 0 | 0% |
| 2 | 0 | 0% |
| 3 | 0 | 0% |
| 4 | 0 | 0% |
| 5 | 0 | 0% |
| 6 | 0 | 0% |
| 7 | 54 | 1 |
| 8 | 0 | 0% |
| Disposition | Number | Percent |
|---|---|---|
| Patient Pronounced Dead | 32 | 0.5925926 |
| Transporting Patient | 16 | 0.2962963 |
| Cancelled | 2 | 0.0370370 |
| Condition Corrected | 2 | 0.0370370 |
| Unfounded | 1 | 0.0185185 |
| Other | 1 | 0.0185185 |
Graphs, Heatmaps, and Tables Prepared By: Isaac H. Michaels, MPH
Data Source: NYC Open Data
Back to top
Venom (Snake Bites)
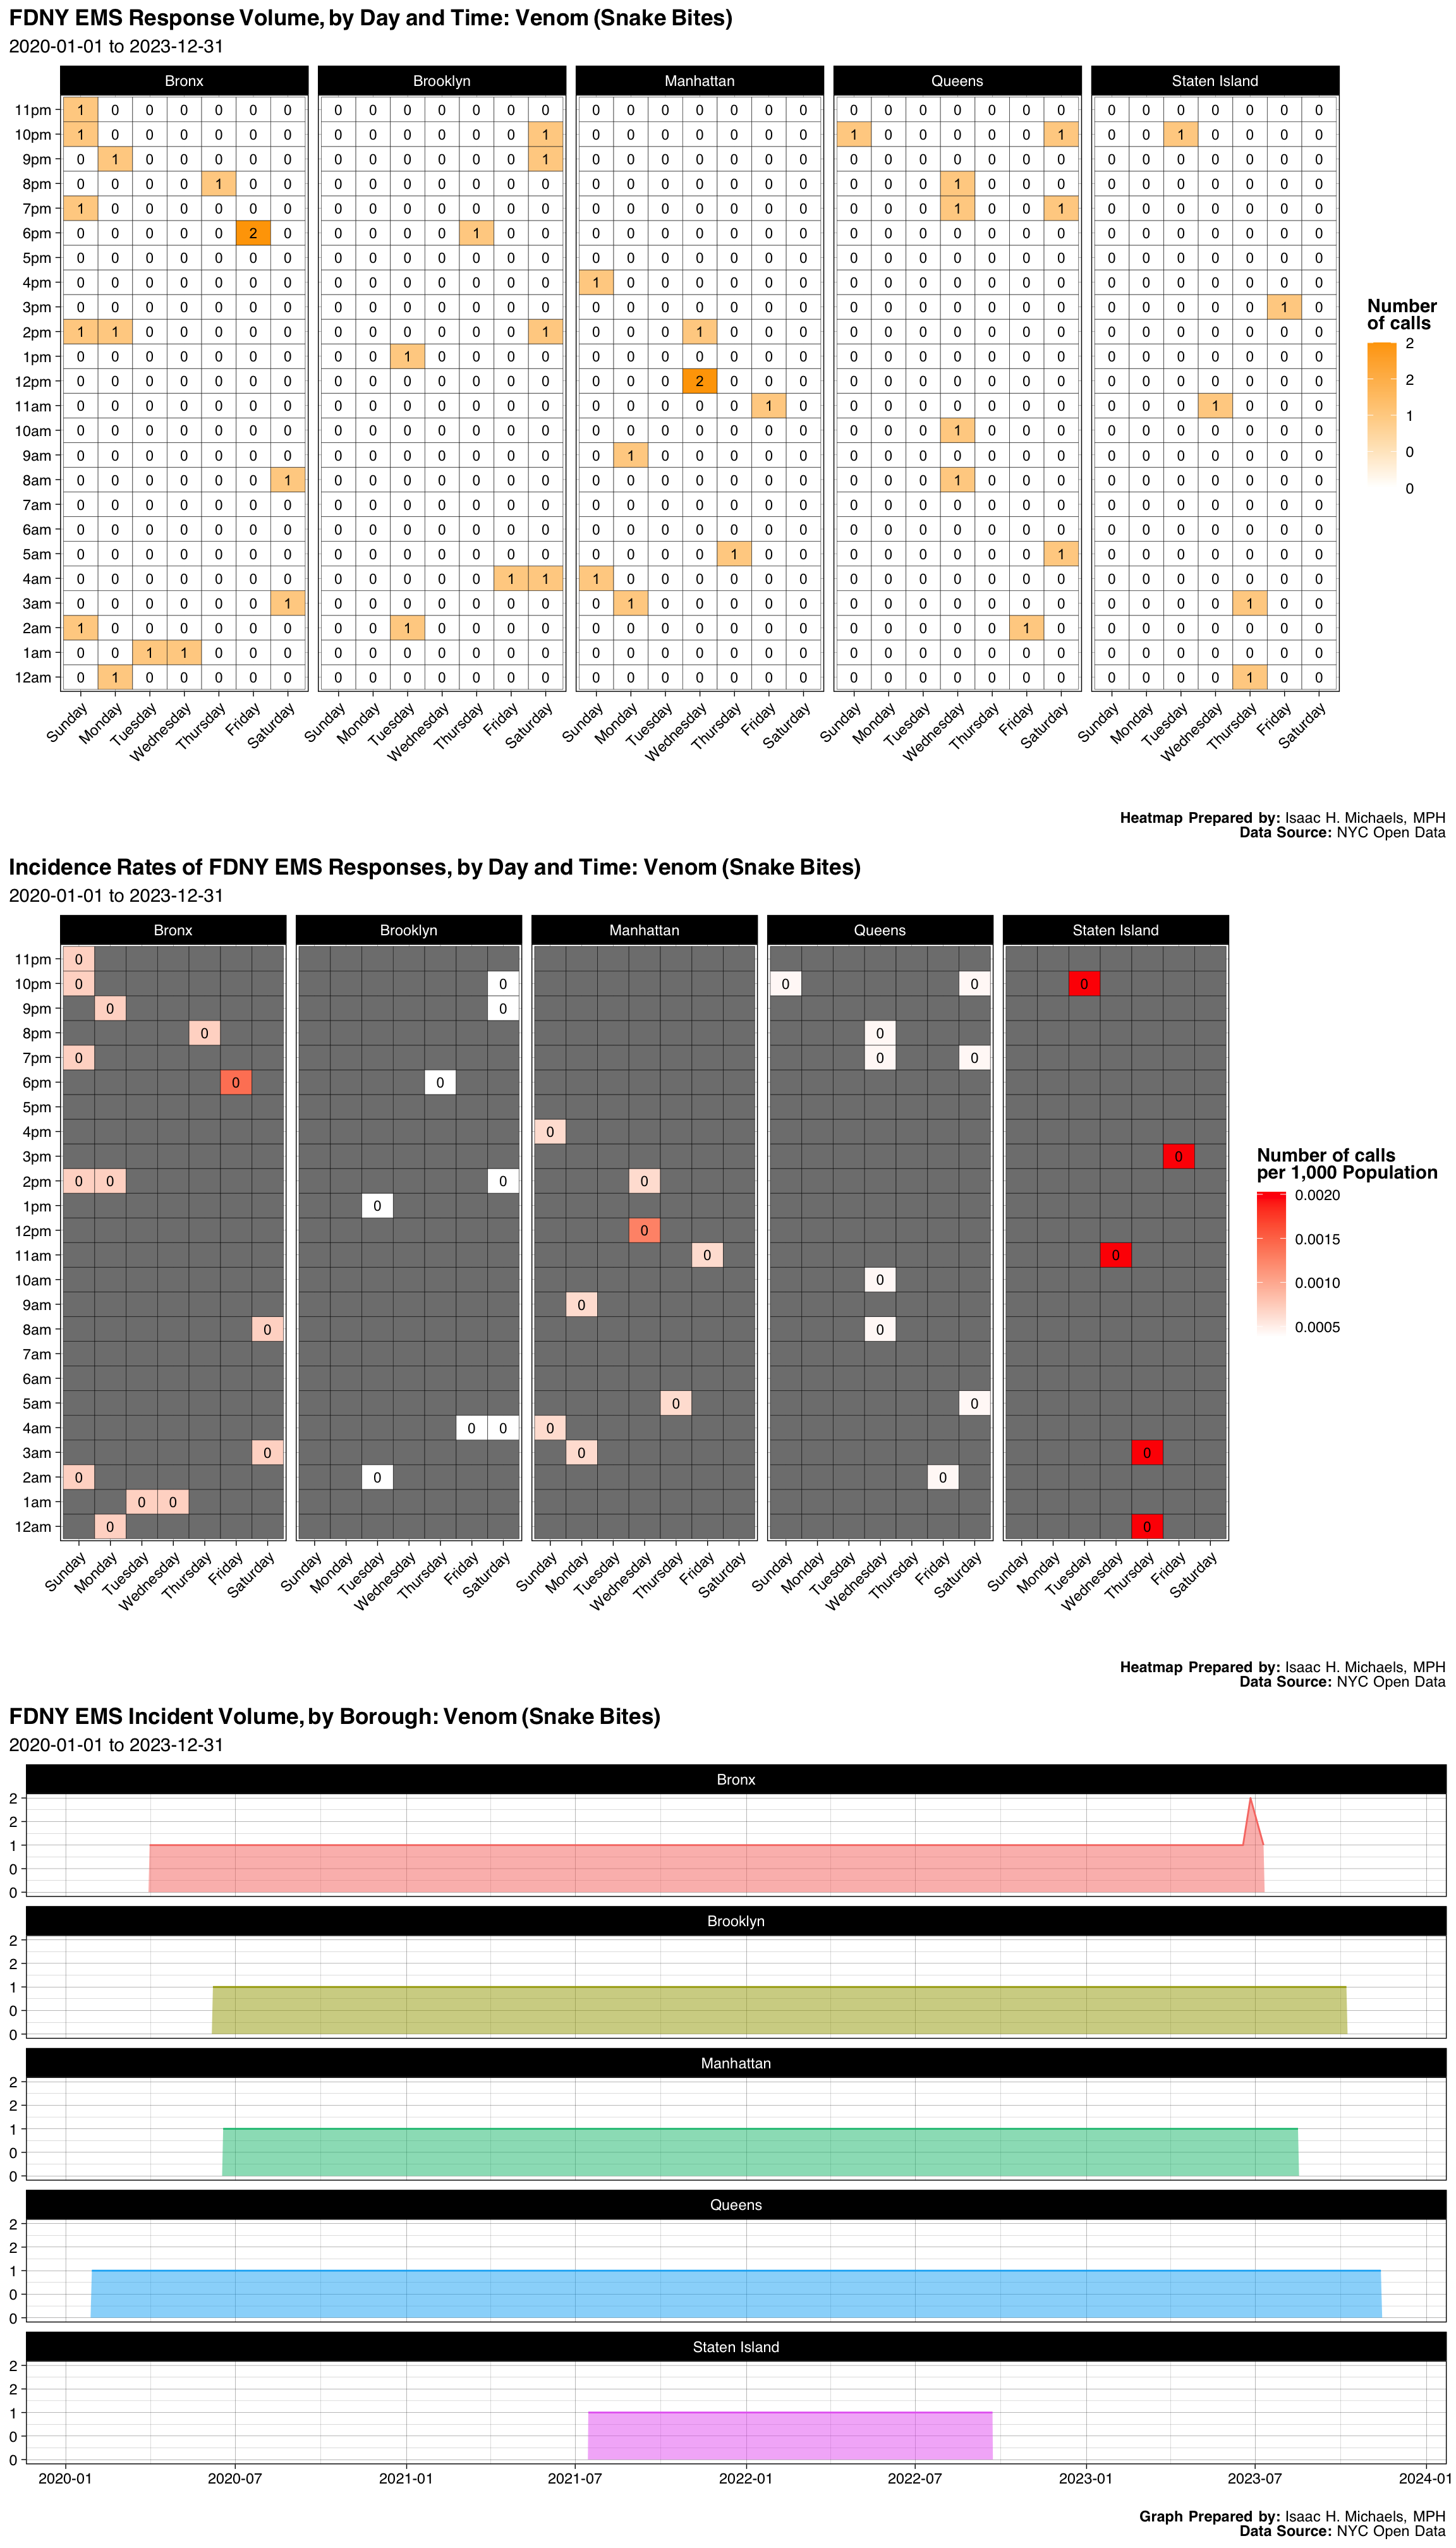
| Borough | Number | Percent |
|---|---|---|
| Bronx | 15 | 0.3260870 |
| Brooklyn | 8 | 0.1739130 |
| Manhattan | 9 | 0.1956522 |
| Queens | 9 | 0.1956522 |
| Staten Island | 5 | 0.1086957 |
| Final Severity Level | Number | Percent |
|---|---|---|
| 1 | 0 | 0% |
| 2 | 46 | 1 |
| 3 | 0 | 0% |
| 4 | 0 | 0% |
| 5 | 0 | 0% |
| 6 | 0 | 0% |
| 7 | 0 | 0% |
| 8 | 0 | 0% |
| Disposition | Number | Percent |
|---|---|---|
| Transporting Patient | 26 | 0.5652174 |
| Refused Medical Aid | 8 | 0.1739130 |
| Unfounded | 6 | 0.1304348 |
| Cancelled | 2 | 0.0434783 |
| Patient Gone on Arrival | 2 | 0.0434783 |
| Condition Corrected | 1 | 0.0217391 |
| Other | 1 | 0.0217391 |
Graphs, Heatmaps, and Tables Prepared By: Isaac H. Michaels, MPH
Data Source: NYC Open Data
Back to top
Four Alarm Fire
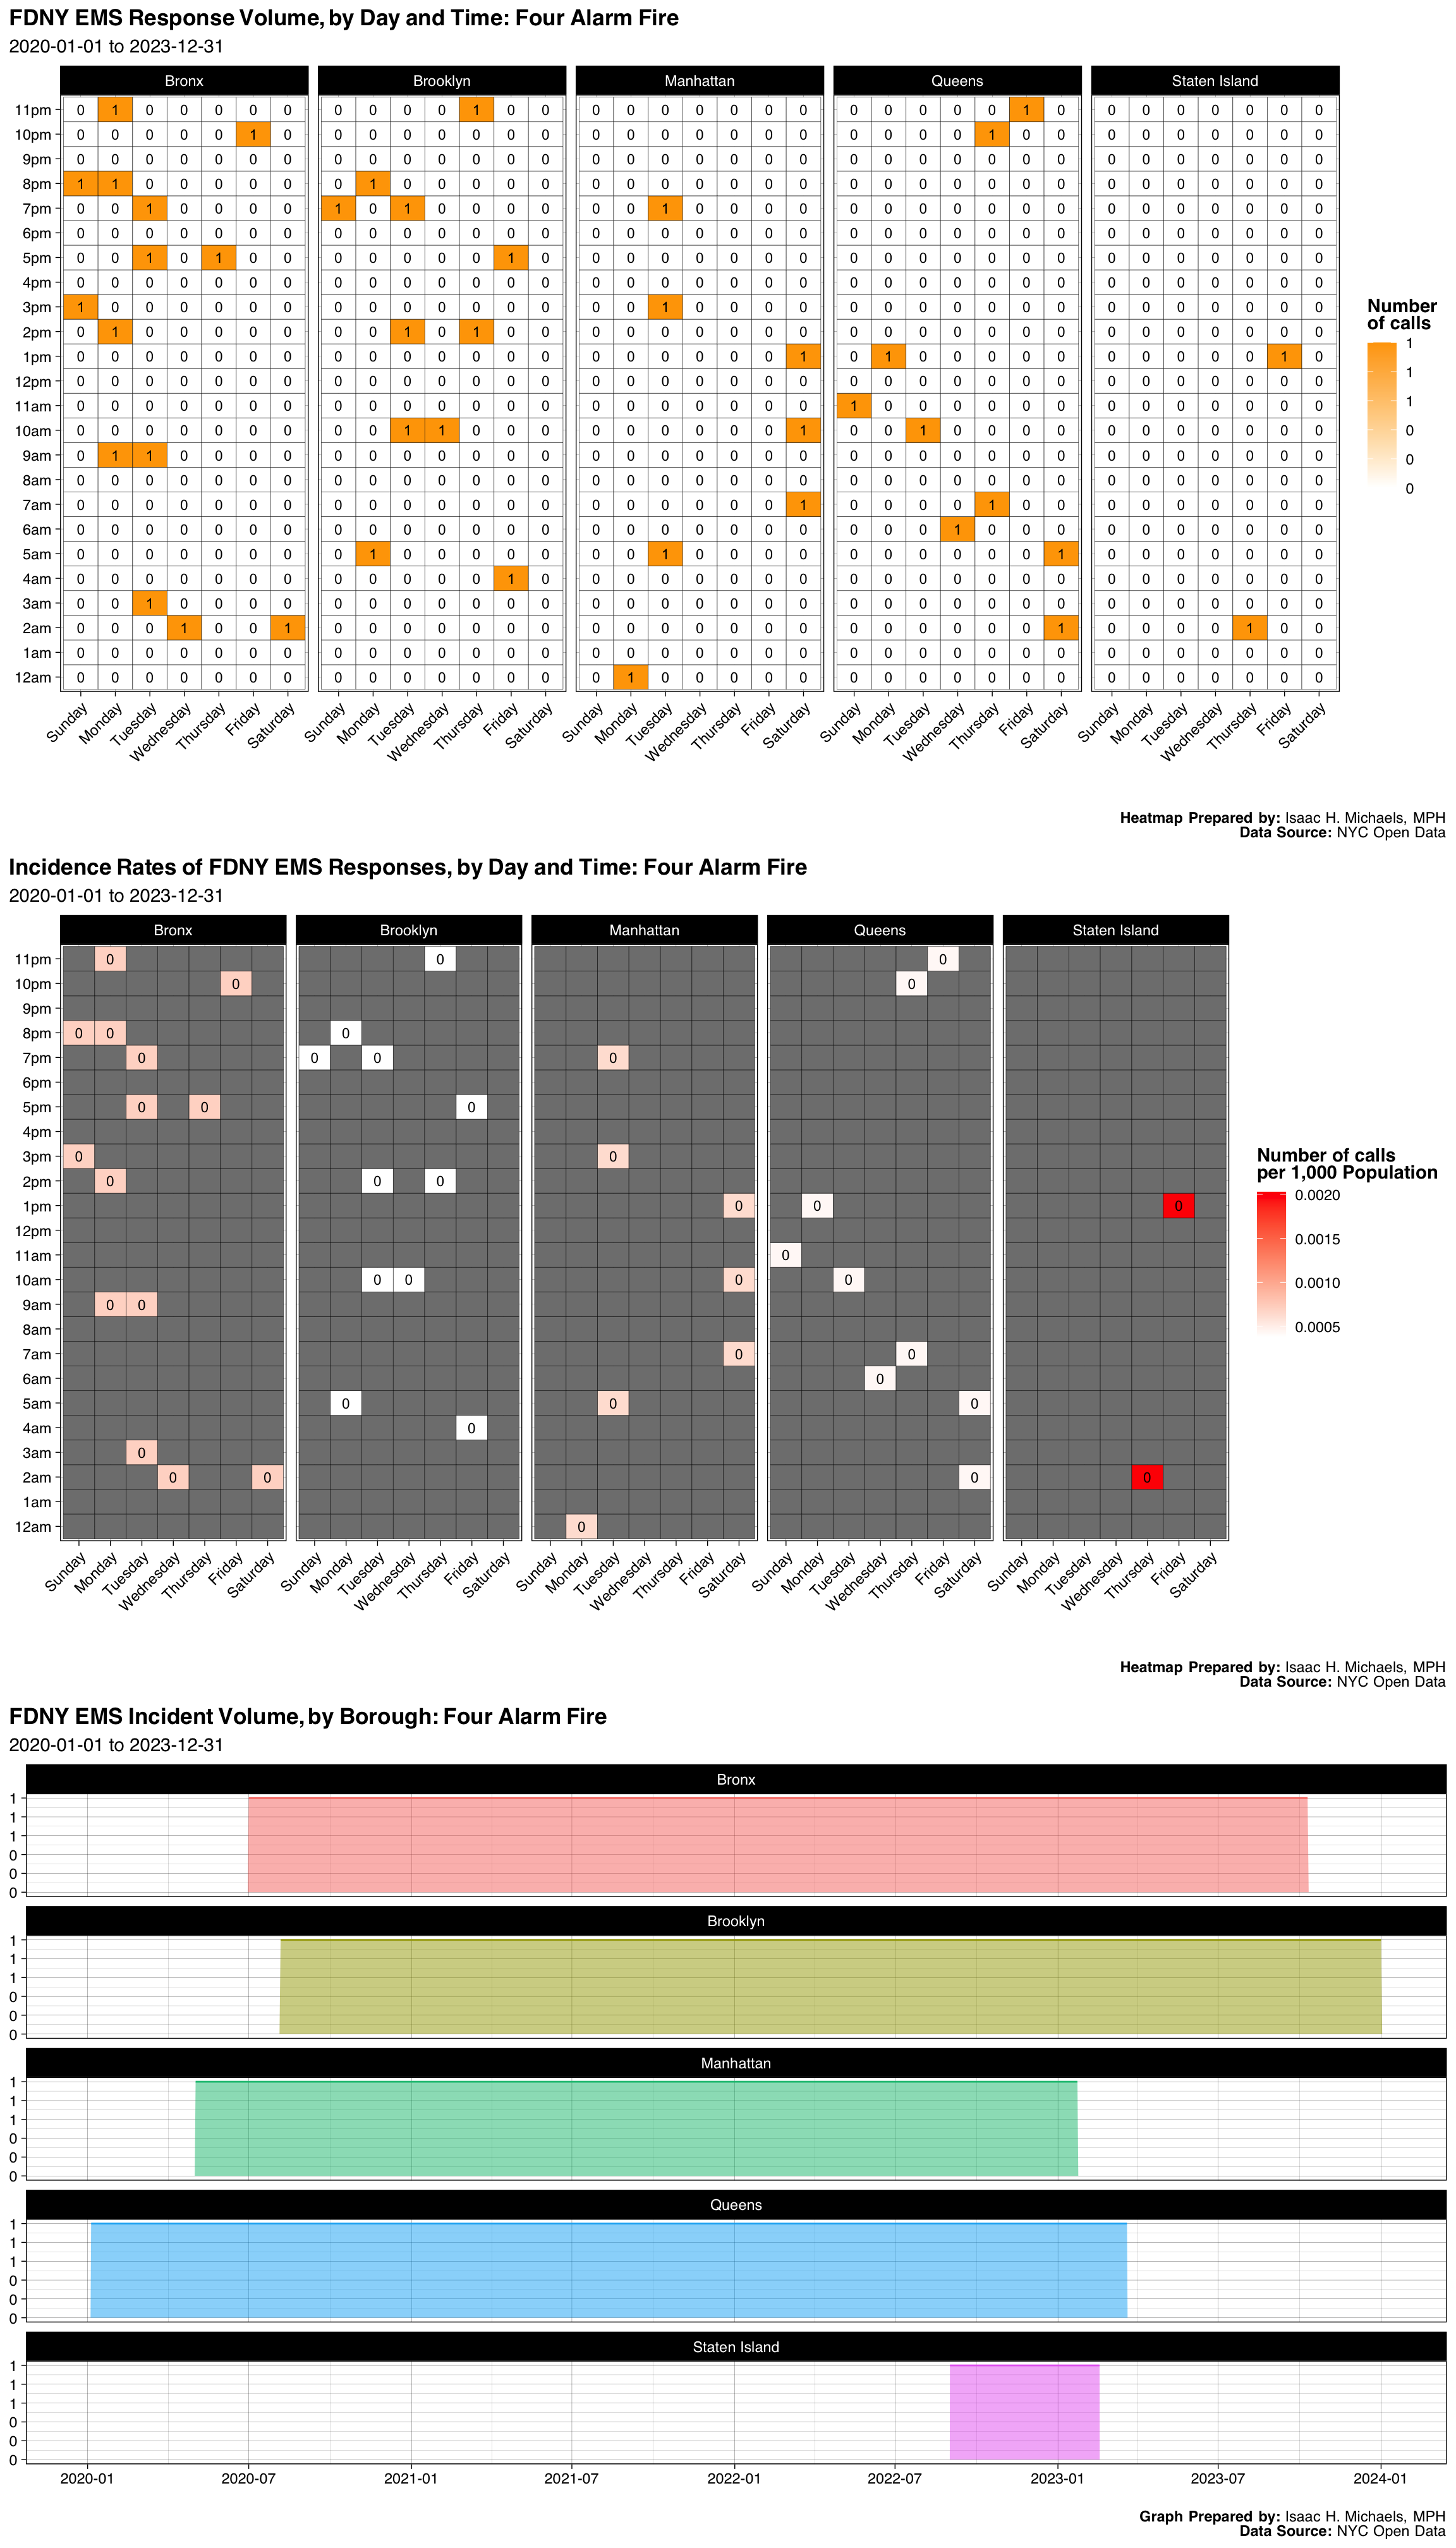
| Borough | Number | Percent |
|---|---|---|
| Bronx | 14 | 0.3255814 |
| Brooklyn | 11 | 0.2558140 |
| Manhattan | 7 | 0.1627907 |
| Queens | 9 | 0.2093023 |
| Staten Island | 2 | 0.0465116 |
| Final Severity Level | Number | Percent |
|---|---|---|
| 1 | 0 | 0% |
| 2 | 43 | 1 |
| 3 | 0 | 0% |
| 4 | 0 | 0% |
| 5 | 0 | 0% |
| 6 | 0 | 0% |
| 7 | 0 | 0% |
| 8 | 0 | 0% |
| Disposition | Number | Percent |
|---|---|---|
| Transporting Patient | 39 | 0.9069767 |
| Cancelled | 4 | 0.0930233 |
Graphs, Heatmaps, and Tables Prepared By: Isaac H. Michaels, MPH
Data Source: NYC Open Data
Back to top
Structural Collaspe [Specify]
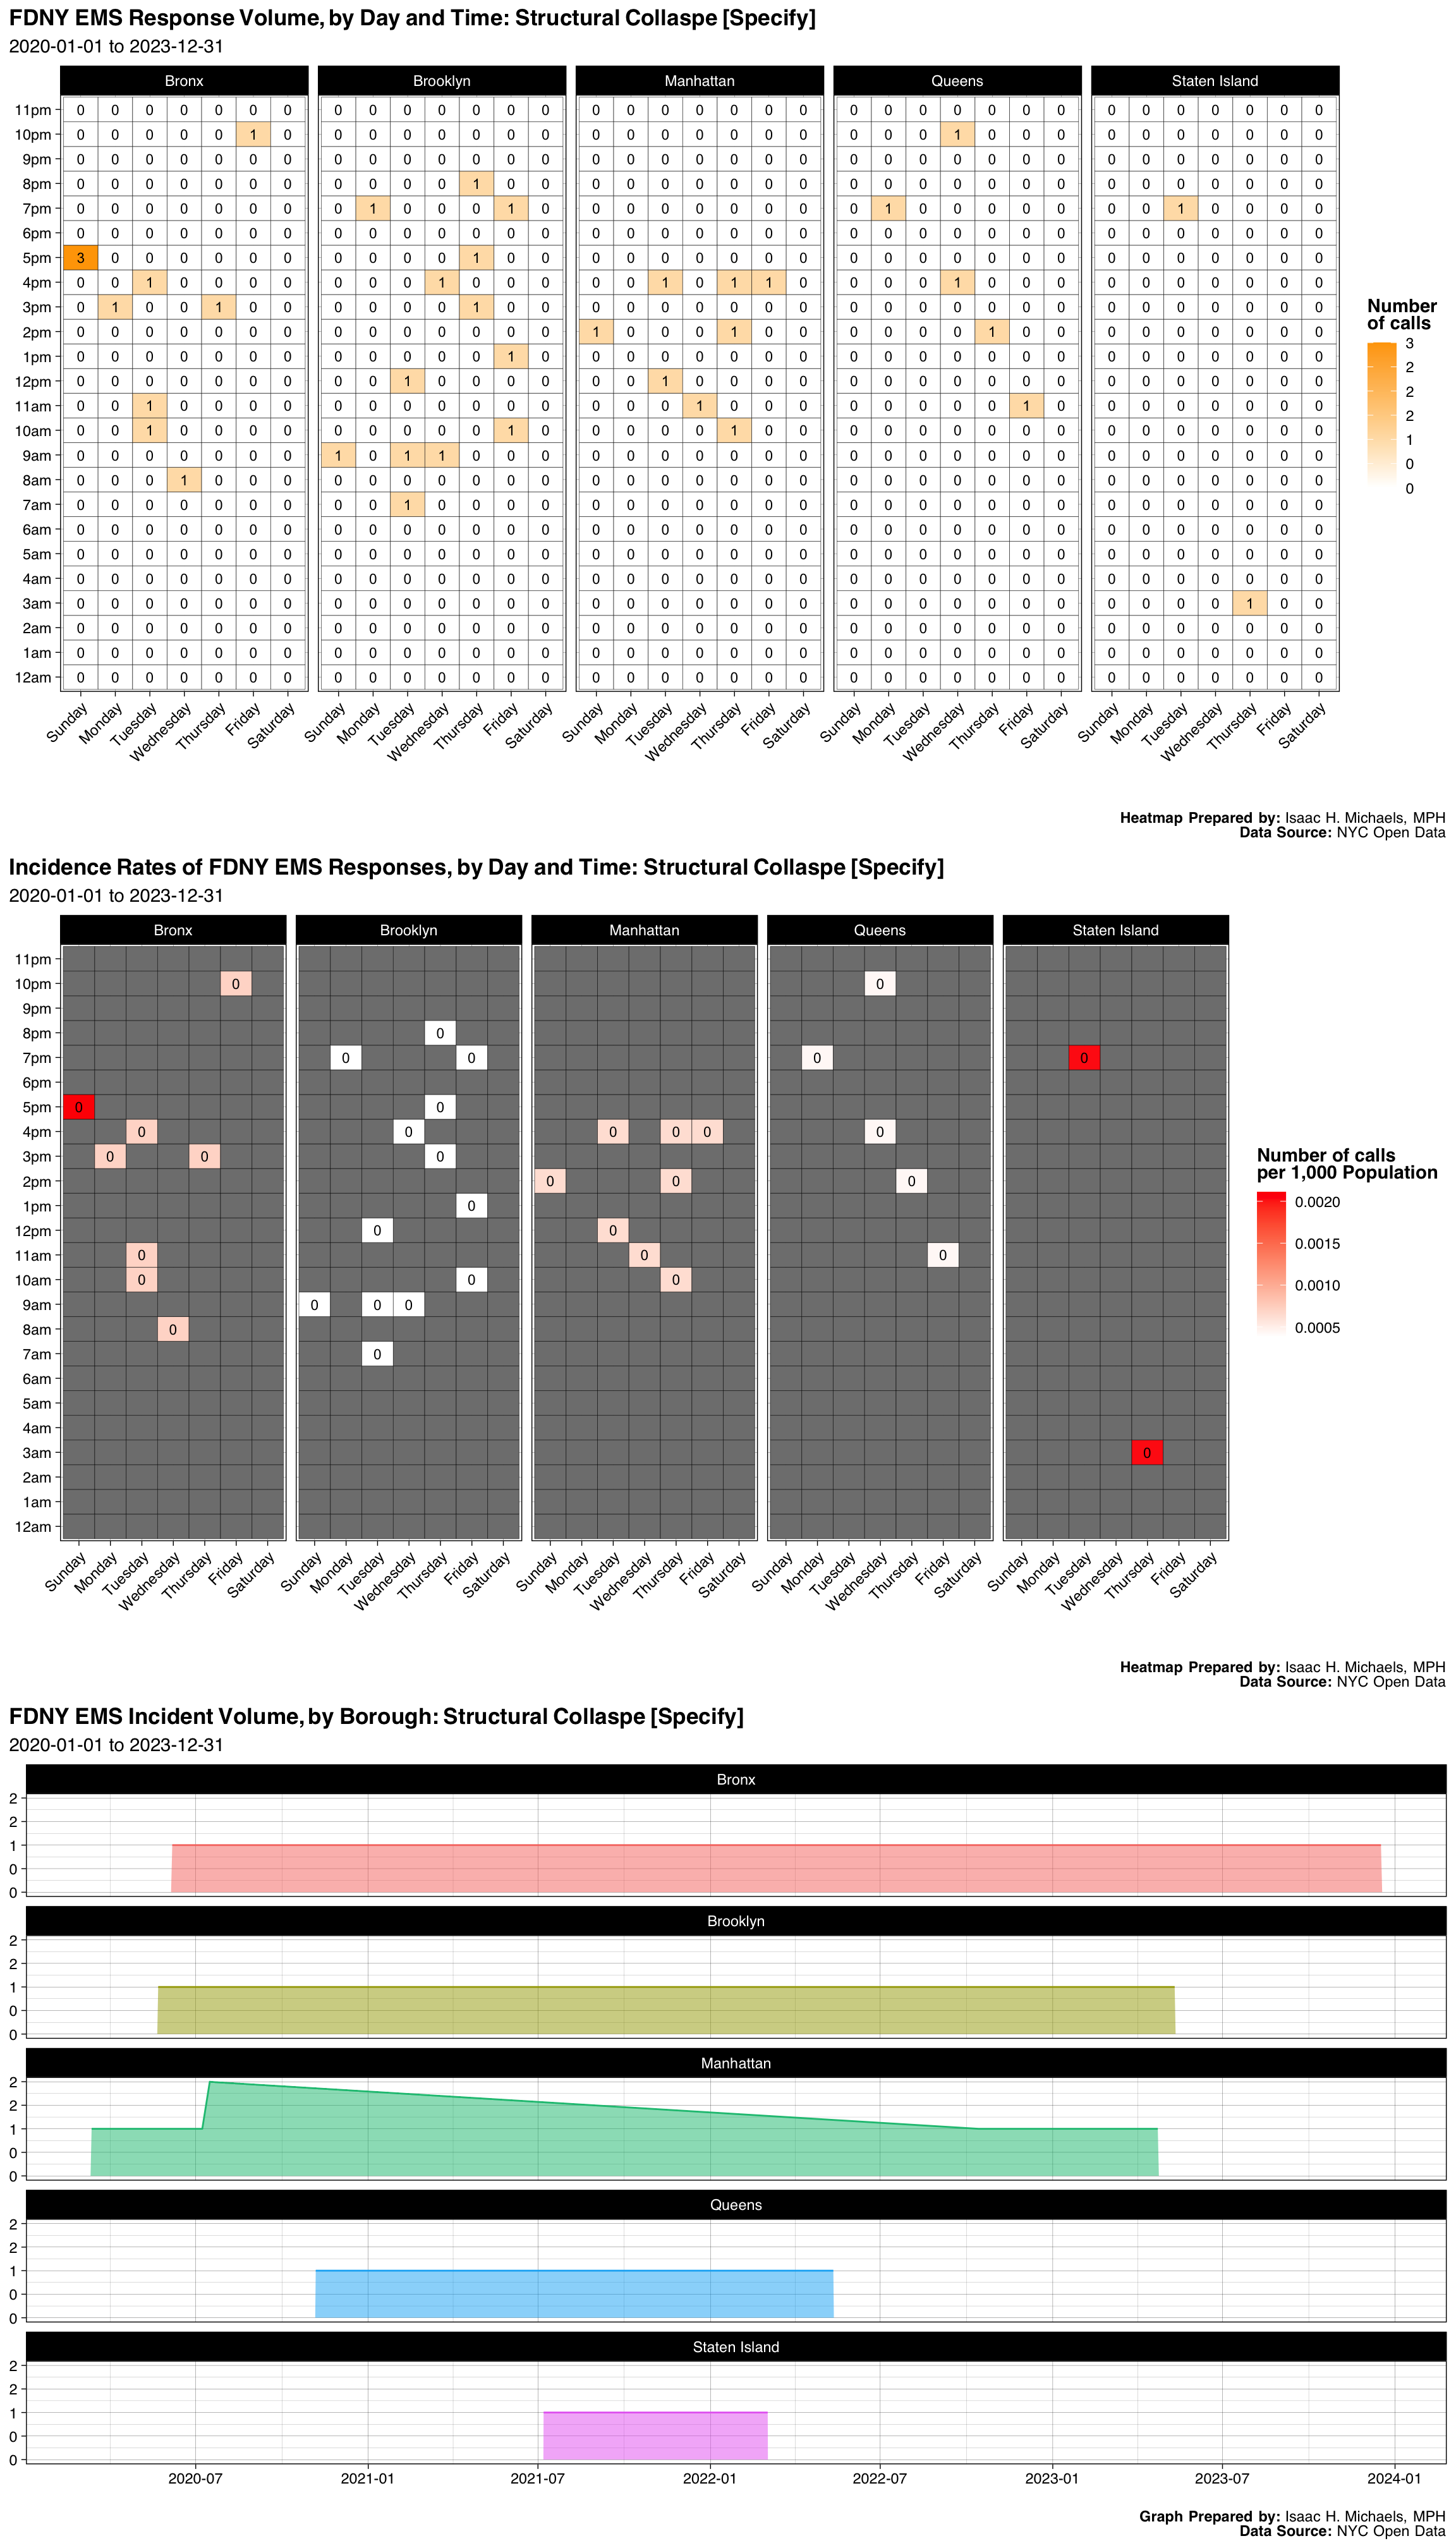
| Borough | Number | Percent |
|---|---|---|
| Bronx | 10 | 0.2631579 |
| Brooklyn | 13 | 0.3421053 |
| Manhattan | 8 | 0.2105263 |
| Queens | 5 | 0.1315789 |
| Staten Island | 2 | 0.0526316 |
| Final Severity Level | Number | Percent |
|---|---|---|
| 1 | 0 | 0% |
| 2 | 38 | 1 |
| 3 | 0 | 0% |
| 4 | 0 | 0% |
| 5 | 0 | 0% |
| 6 | 0 | 0% |
| 7 | 0 | 0% |
| 8 | 0 | 0% |
| Disposition | Number | Percent |
|---|---|---|
| Cancelled | 19 | 0.5000000 |
| Transporting Patient | 16 | 0.4210526 |
| Condition Corrected | 3 | 0.0789474 |
Graphs, Heatmaps, and Tables Prepared By: Isaac H. Michaels, MPH
Data Source: NYC Open Data
Back to top
Mci25
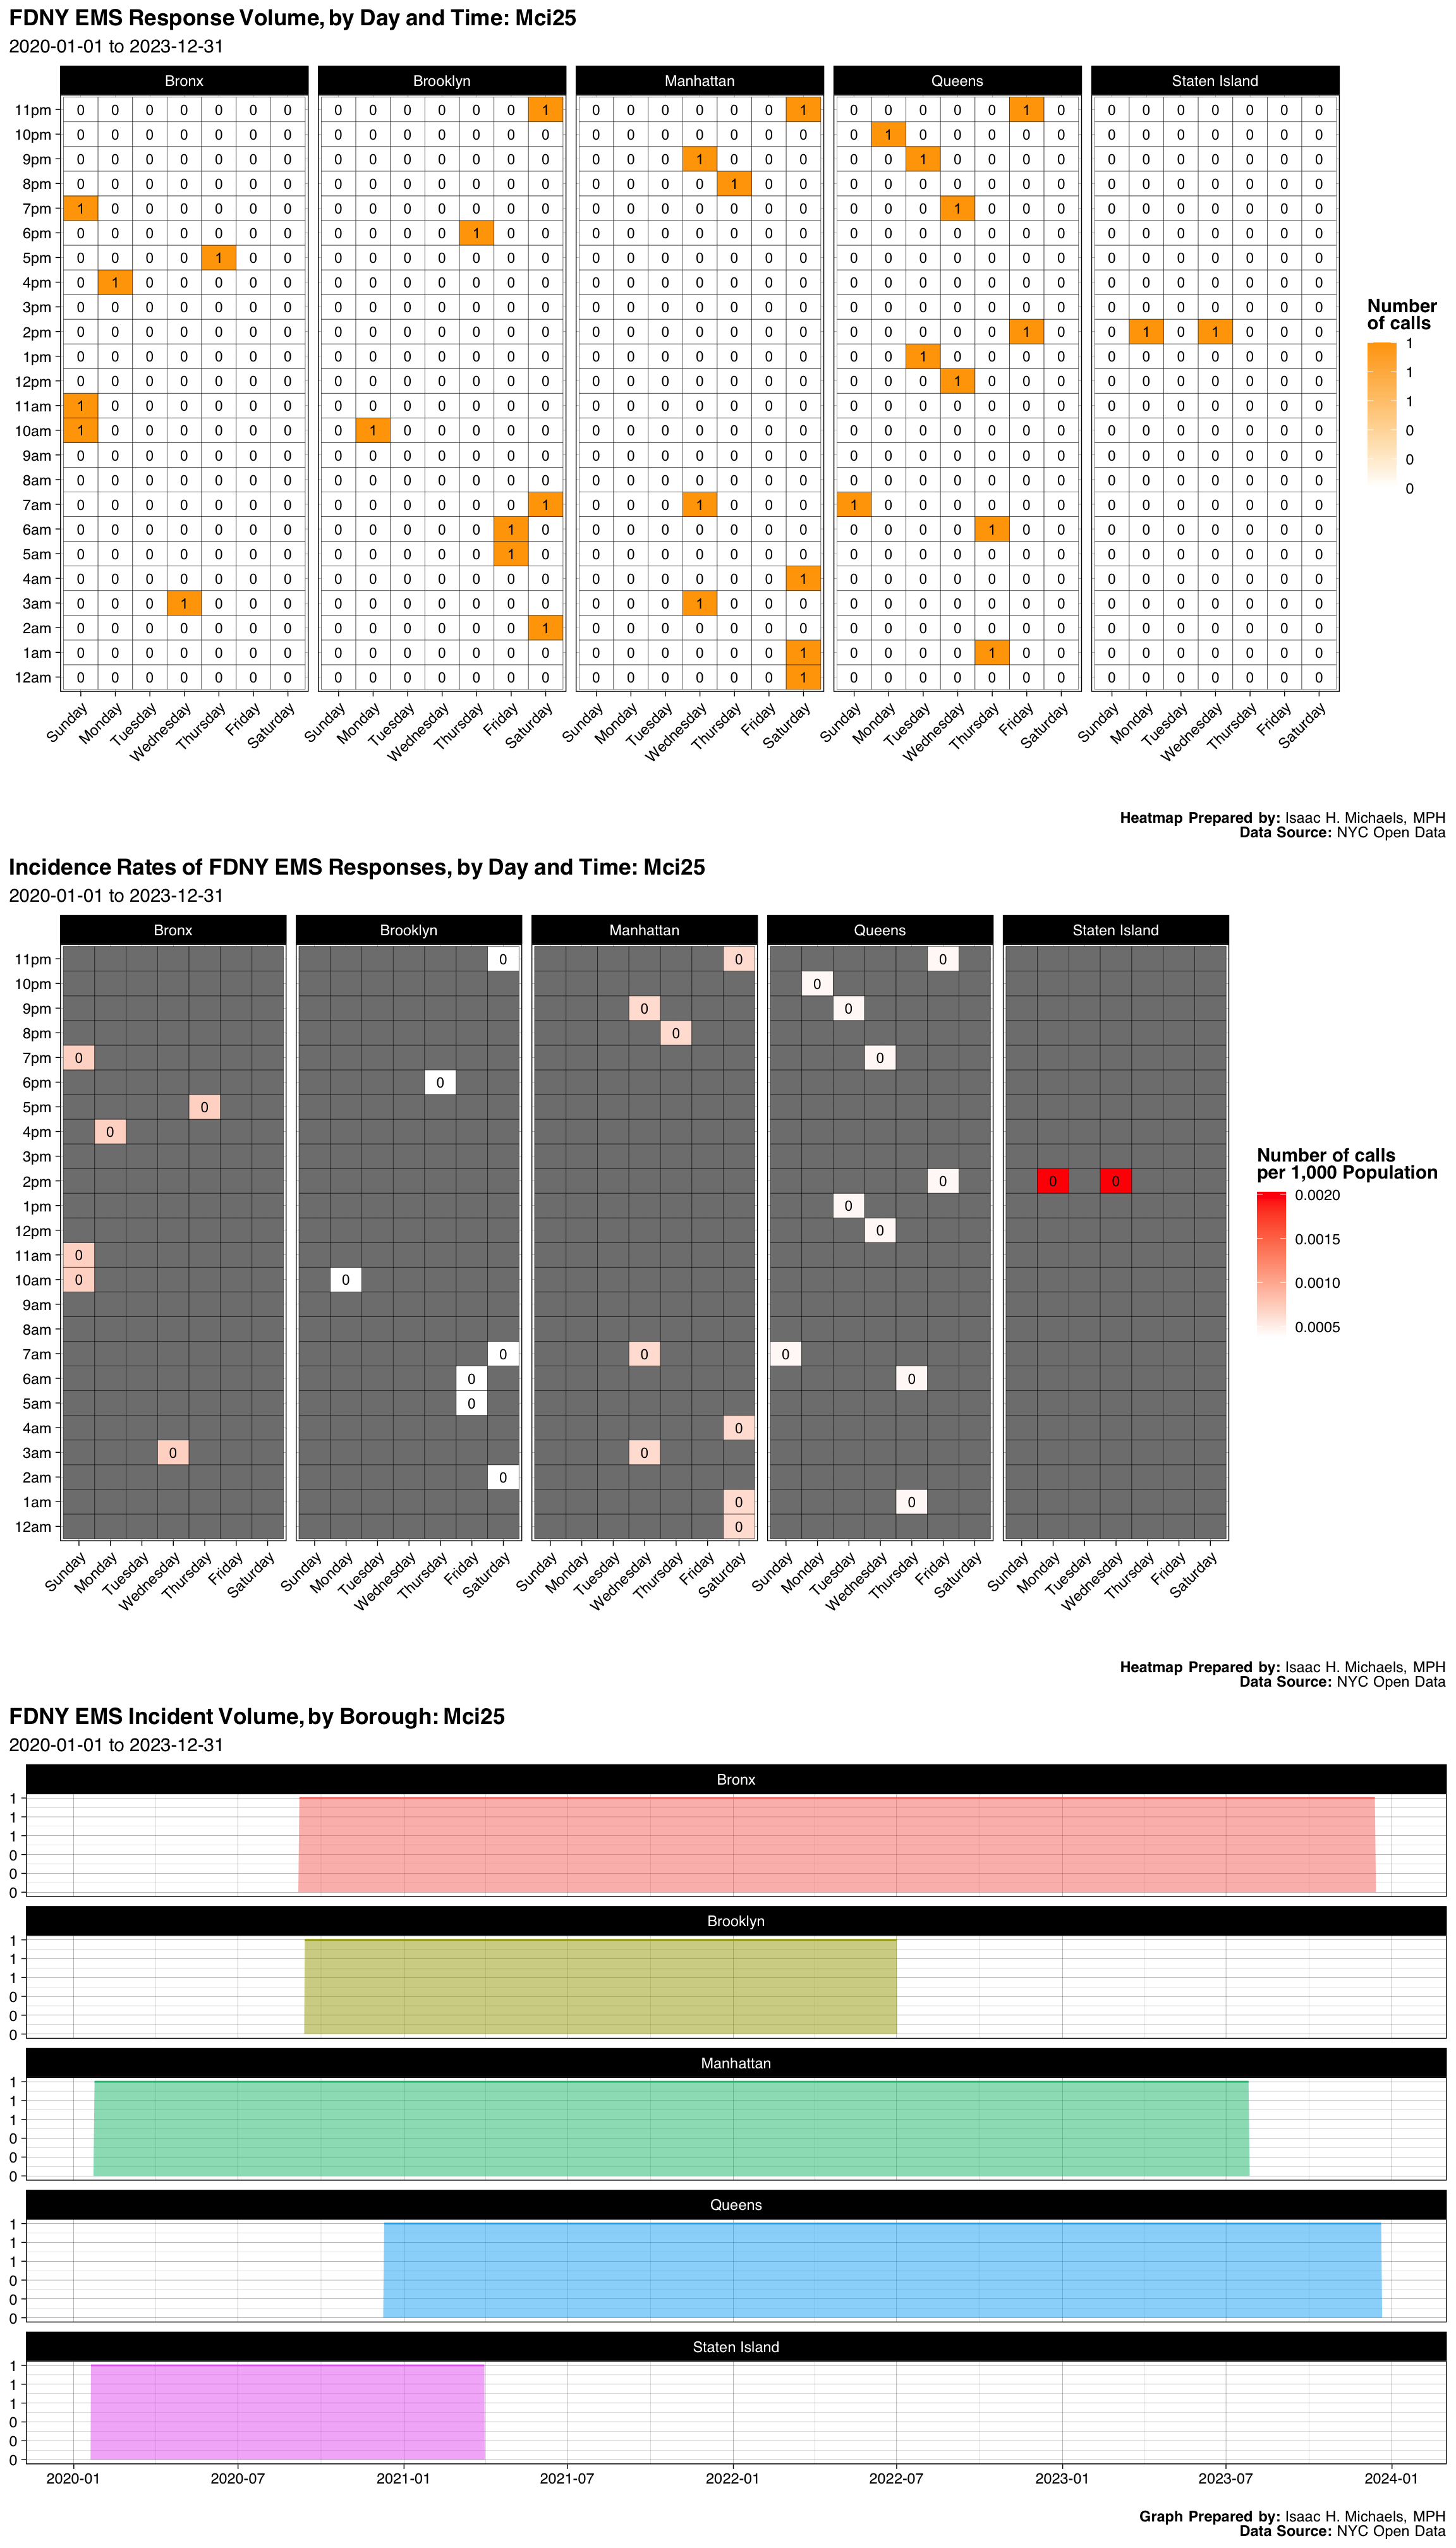
| Borough | Number | Percent |
|---|---|---|
| Bronx | 6 | 0.1818182 |
| Brooklyn | 7 | 0.2121212 |
| Manhattan | 8 | 0.2424242 |
| Queens | 10 | 0.3030303 |
| Staten Island | 2 | 0.0606061 |
| Final Severity Level | Number | Percent |
|---|---|---|
| 1 | 0 | 0% |
| 2 | 33 | 1 |
| 3 | 0 | 0% |
| 4 | 0 | 0% |
| 5 | 0 | 0% |
| 6 | 0 | 0% |
| 7 | 0 | 0% |
| 8 | 0 | 0% |
| Disposition | Number | Percent |
|---|---|---|
| Transporting Patient | 31 | 0.9393939 |
| Cancelled | 2 | 0.0606061 |
Graphs, Heatmaps, and Tables Prepared By: Isaac H. Michaels, MPH
Data Source: NYC Open Data
Back to top
Mci35
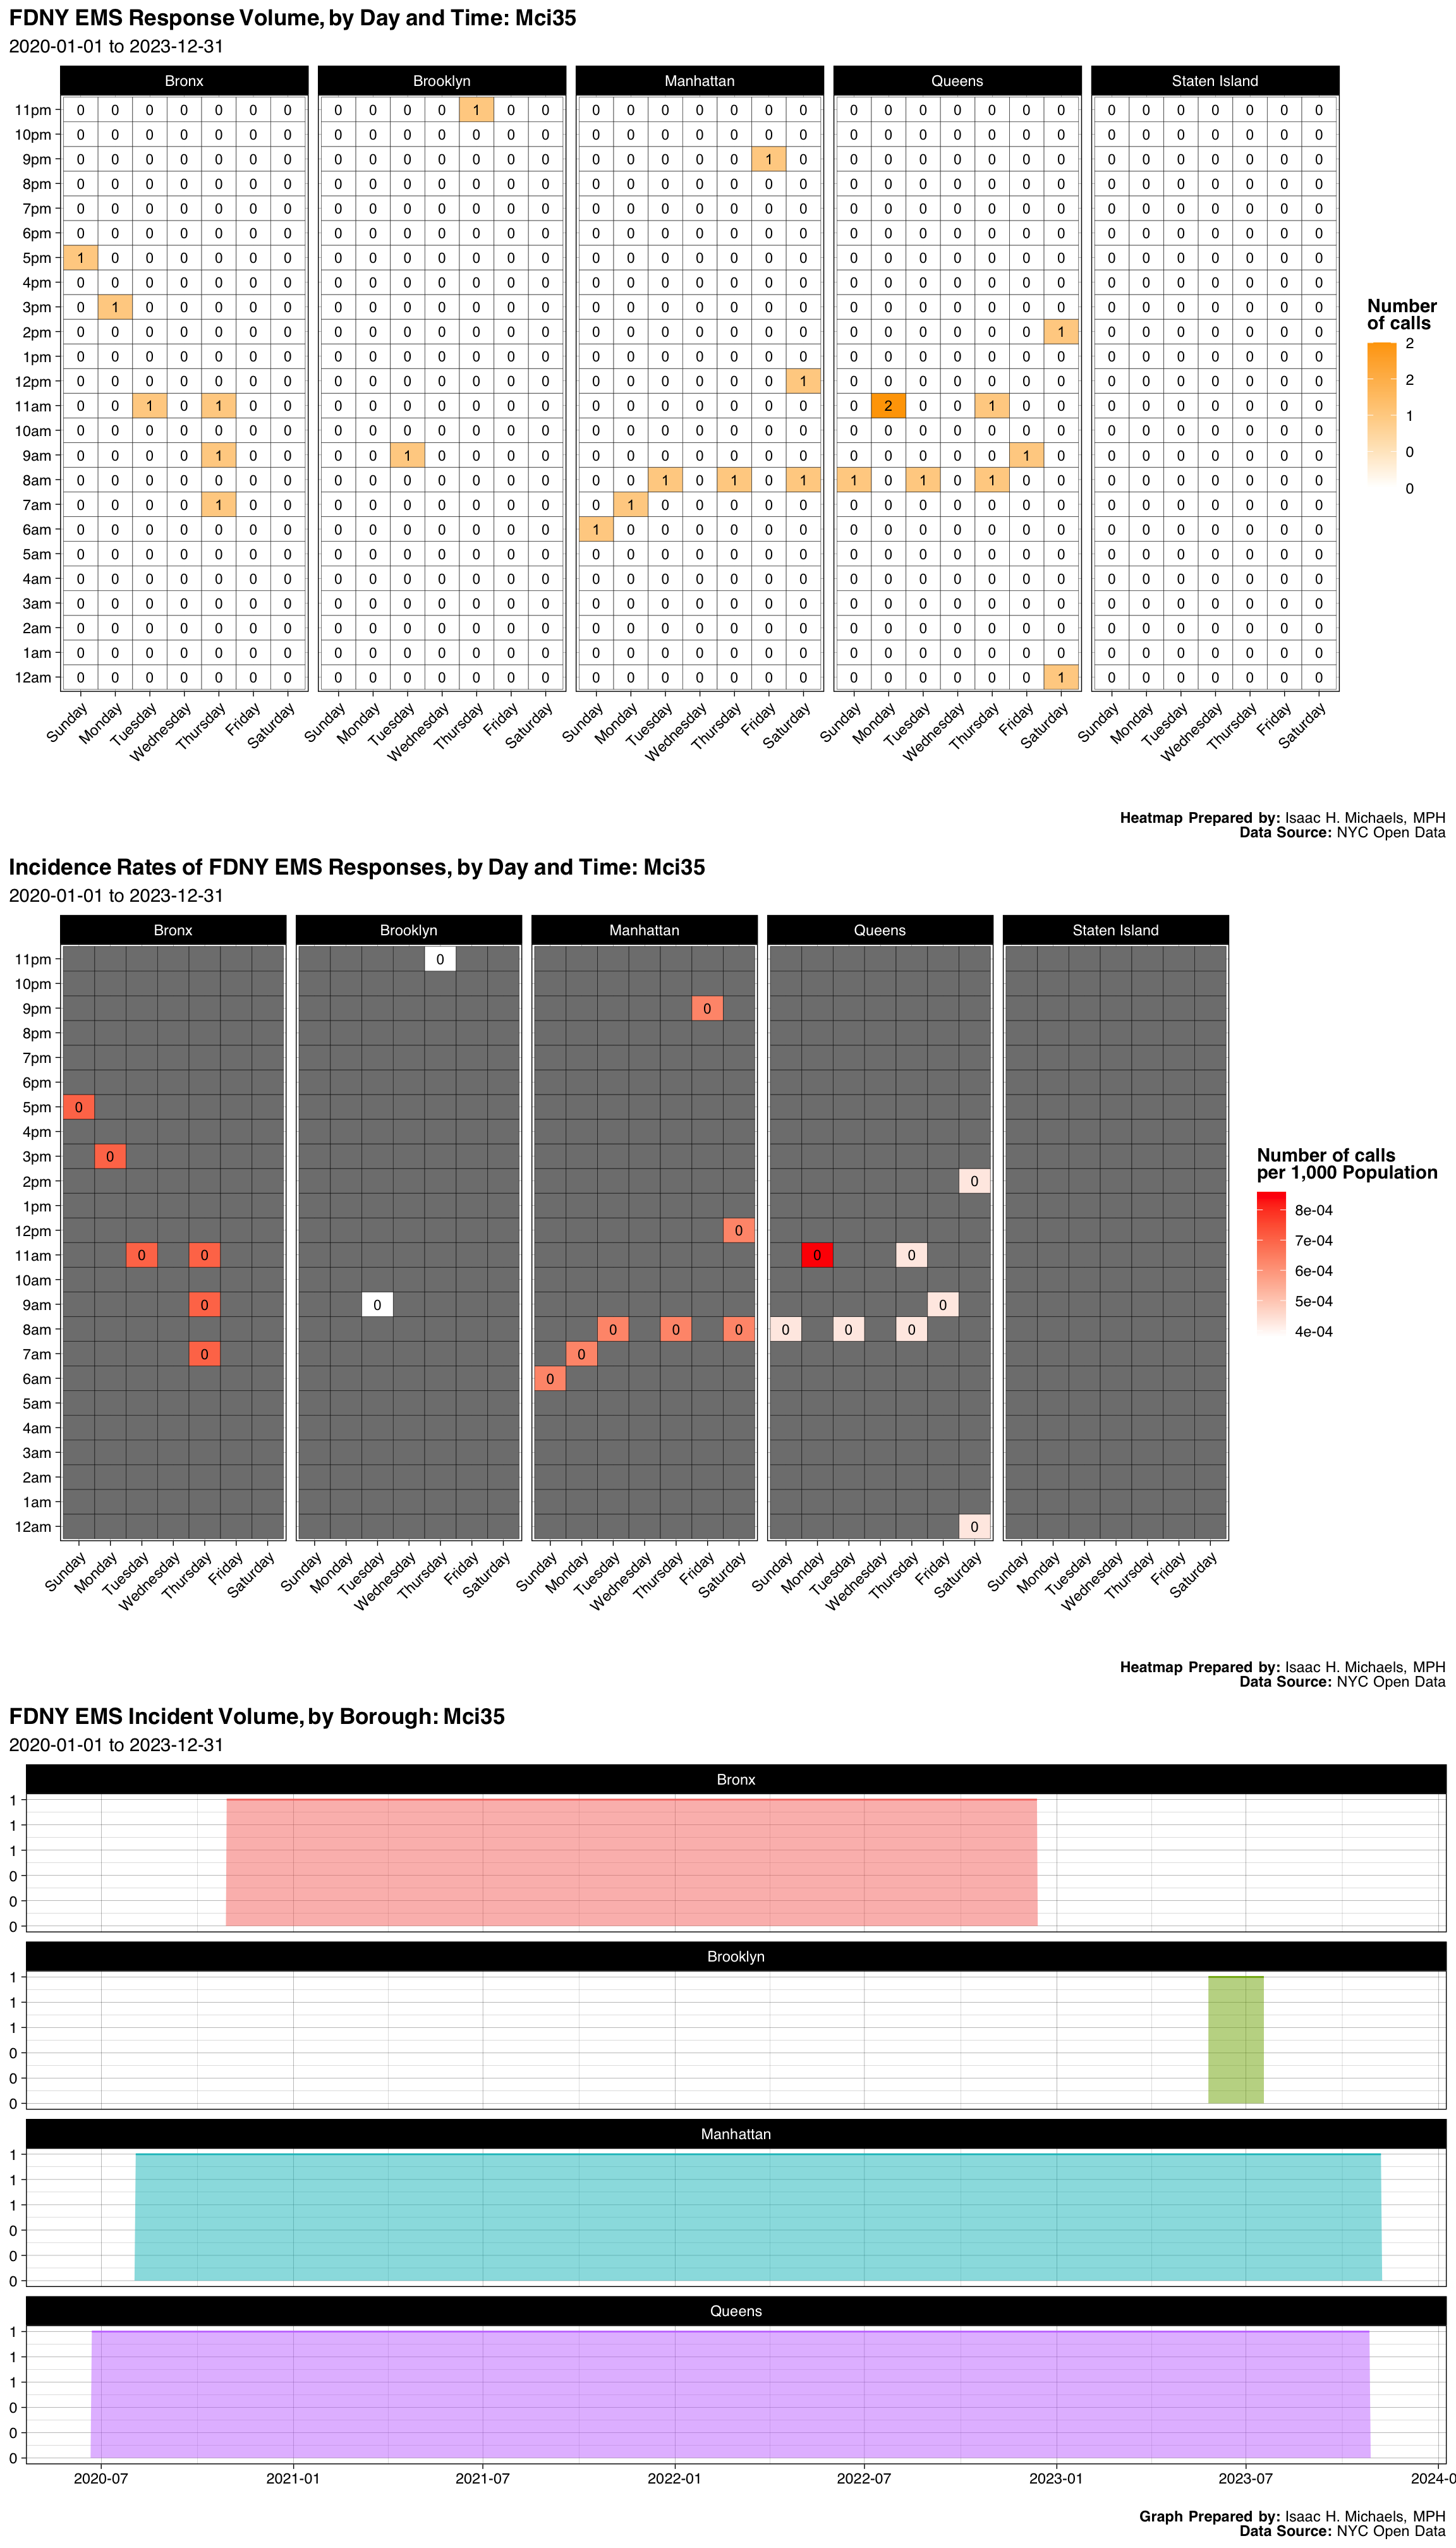
| Borough | Number | Percent |
|---|---|---|
| Bronx | 6 | 0.2500000 |
| Brooklyn | 2 | 0.0833333 |
| Manhattan | 7 | 0.2916667 |
| Queens | 9 | 0.3750000 |
| Final Severity Level | Number | Percent |
|---|---|---|
| 1 | 0 | 0% |
| 2 | 24 | 1 |
| 3 | 0 | 0% |
| 4 | 0 | 0% |
| 5 | 0 | 0% |
| 6 | 0 | 0% |
| 7 | 0 | 0% |
| 8 | 0 | 0% |
| Disposition | Number | Percent |
|---|---|---|
| Transporting Patient | 20 | 0.8333333 |
| Cancelled | 3 | 0.1250000 |
| Condition Corrected | 1 | 0.0416667 |
Graphs, Heatmaps, and Tables Prepared By: Isaac H. Michaels, MPH
Data Source: NYC Open Data
Back to top
Mci42
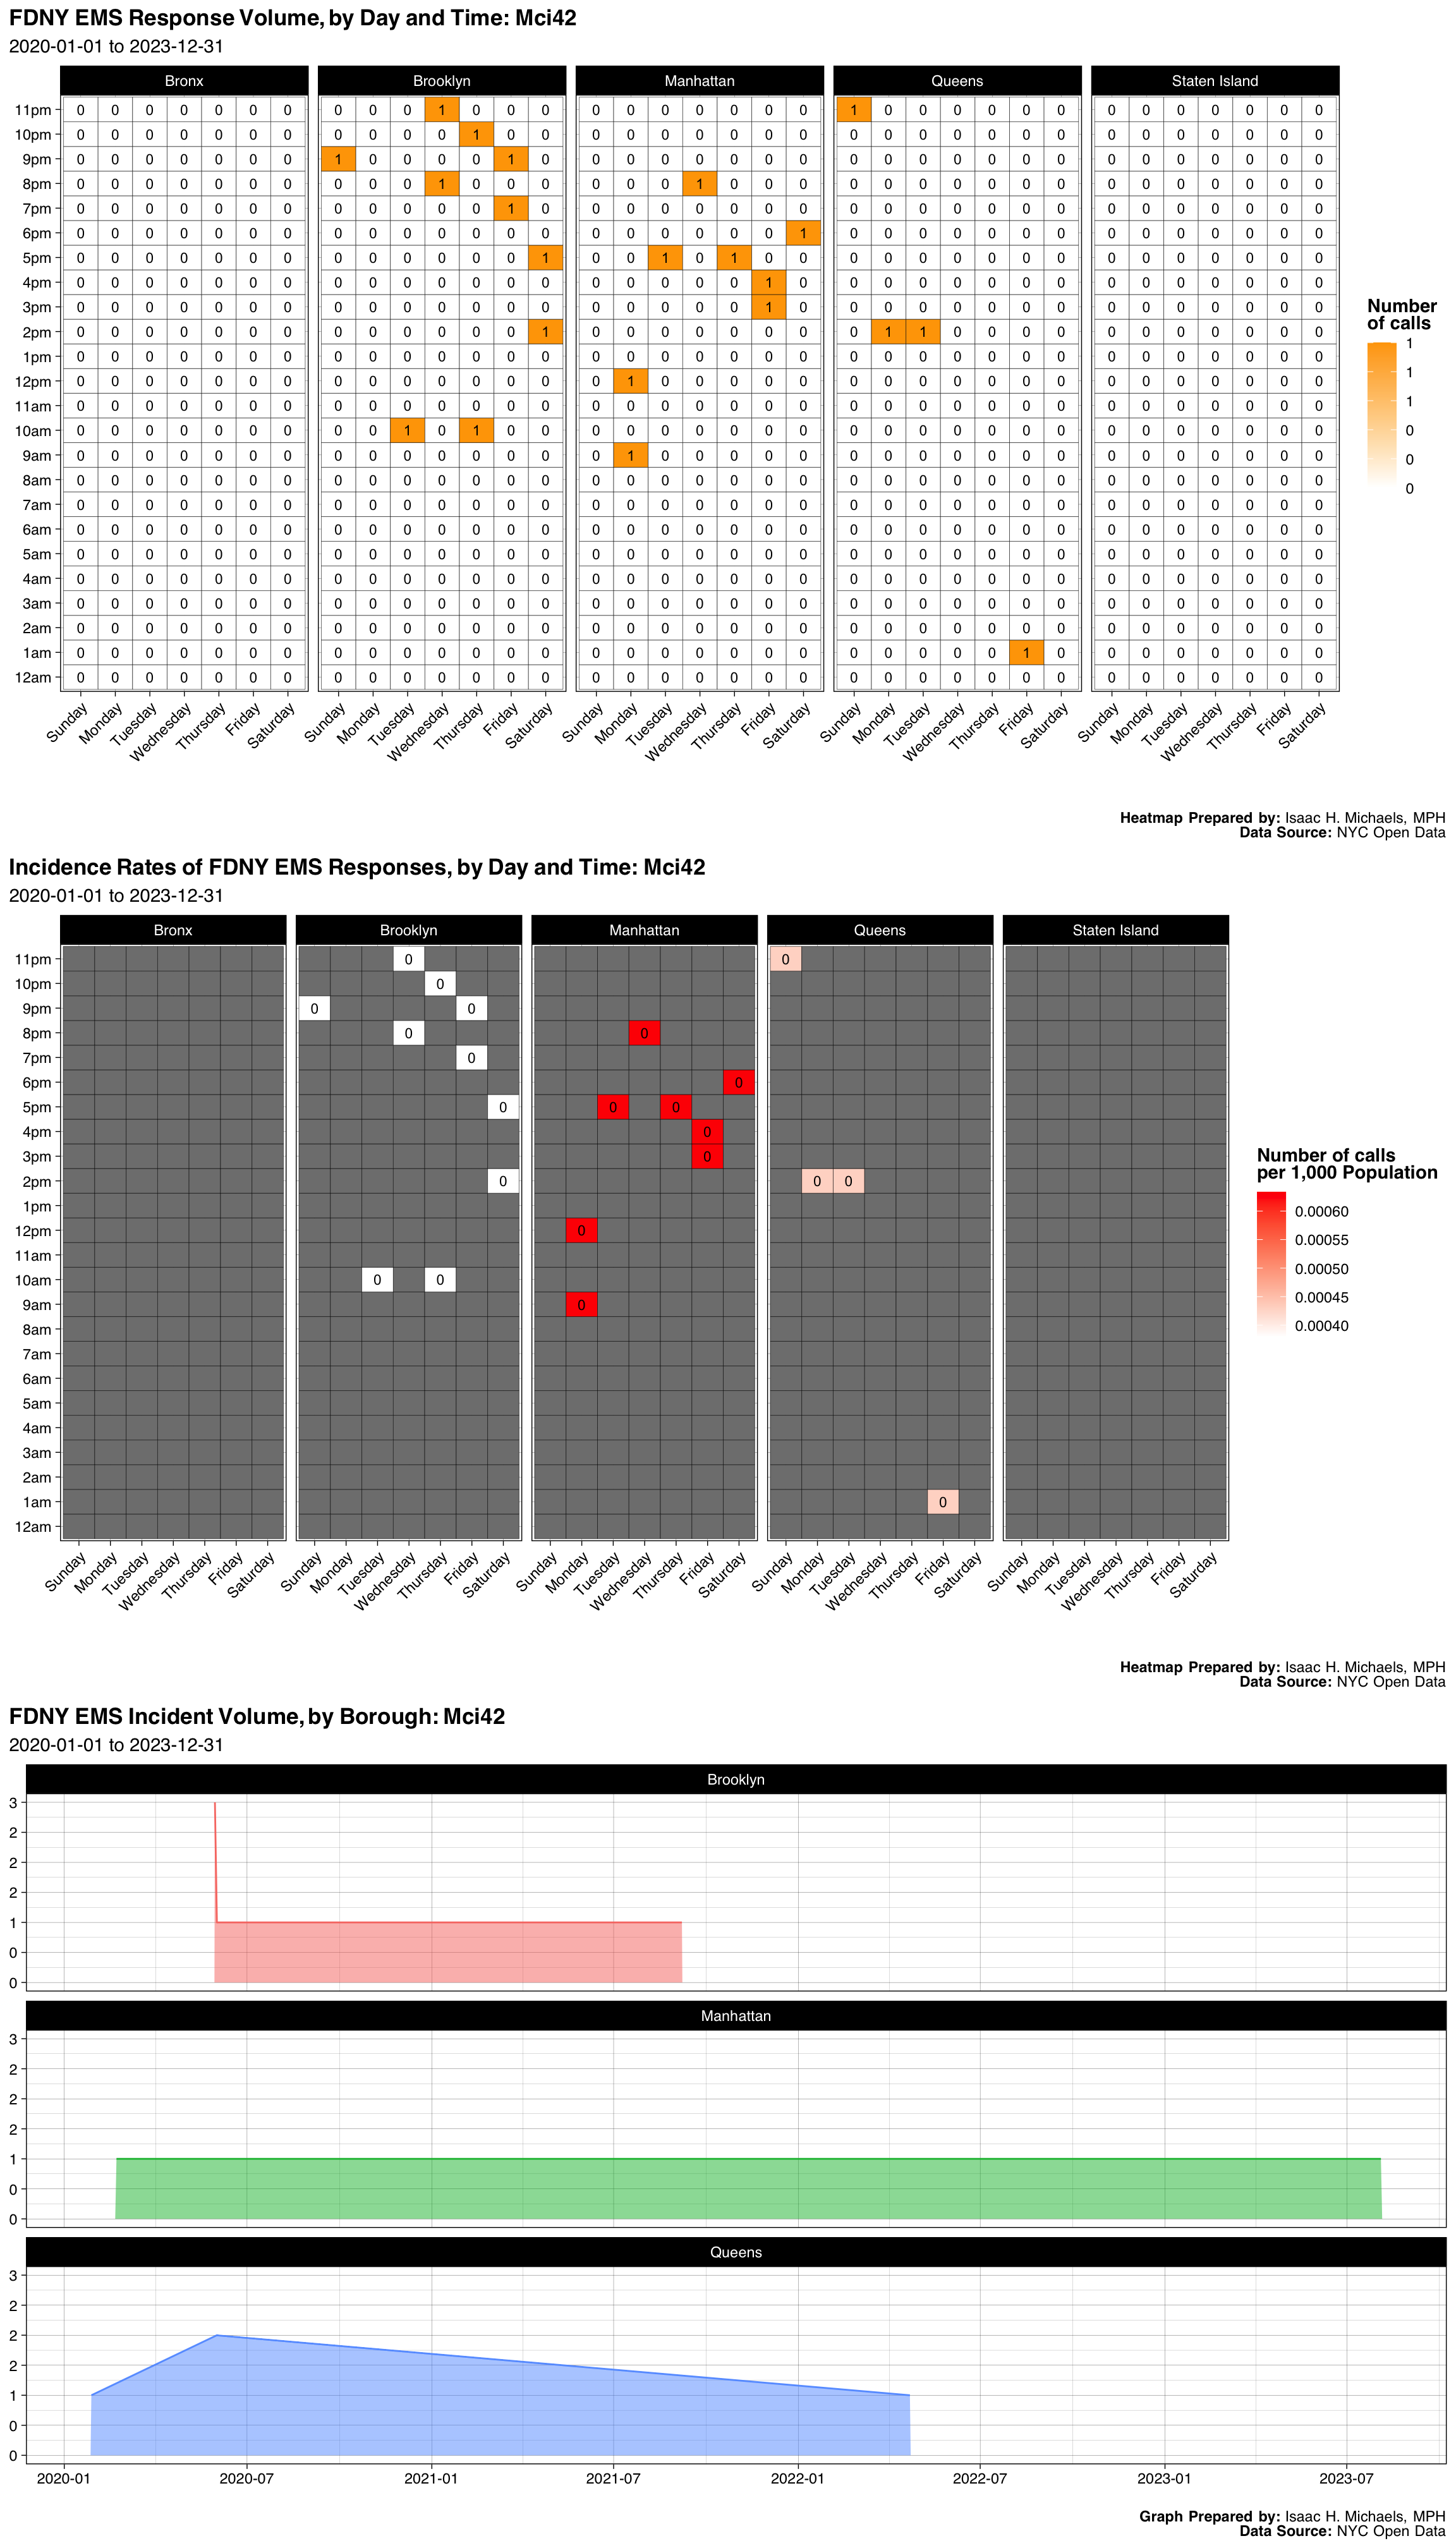
| Borough | Number | Percent |
|---|---|---|
| Brooklyn | 10 | 0.4545455 |
| Manhattan | 8 | 0.3636364 |
| Queens | 4 | 0.1818182 |
| Final Severity Level | Number | Percent |
|---|---|---|
| 1 | 0 | 0% |
| 2 | 22 | 1 |
| 3 | 0 | 0% |
| 4 | 0 | 0% |
| 5 | 0 | 0% |
| 6 | 0 | 0% |
| 7 | 0 | 0% |
| 8 | 0 | 0% |
| Disposition | Number | Percent |
|---|---|---|
| Transporting Patient | 12 | 0.5454545 |
| Cancelled | 8 | 0.3636364 |
| Condition Corrected | 2 | 0.0909091 |
Graphs, Heatmaps, and Tables Prepared By: Isaac H. Michaels, MPH
Data Source: NYC Open Data
Back to top
Sick Patient Fever
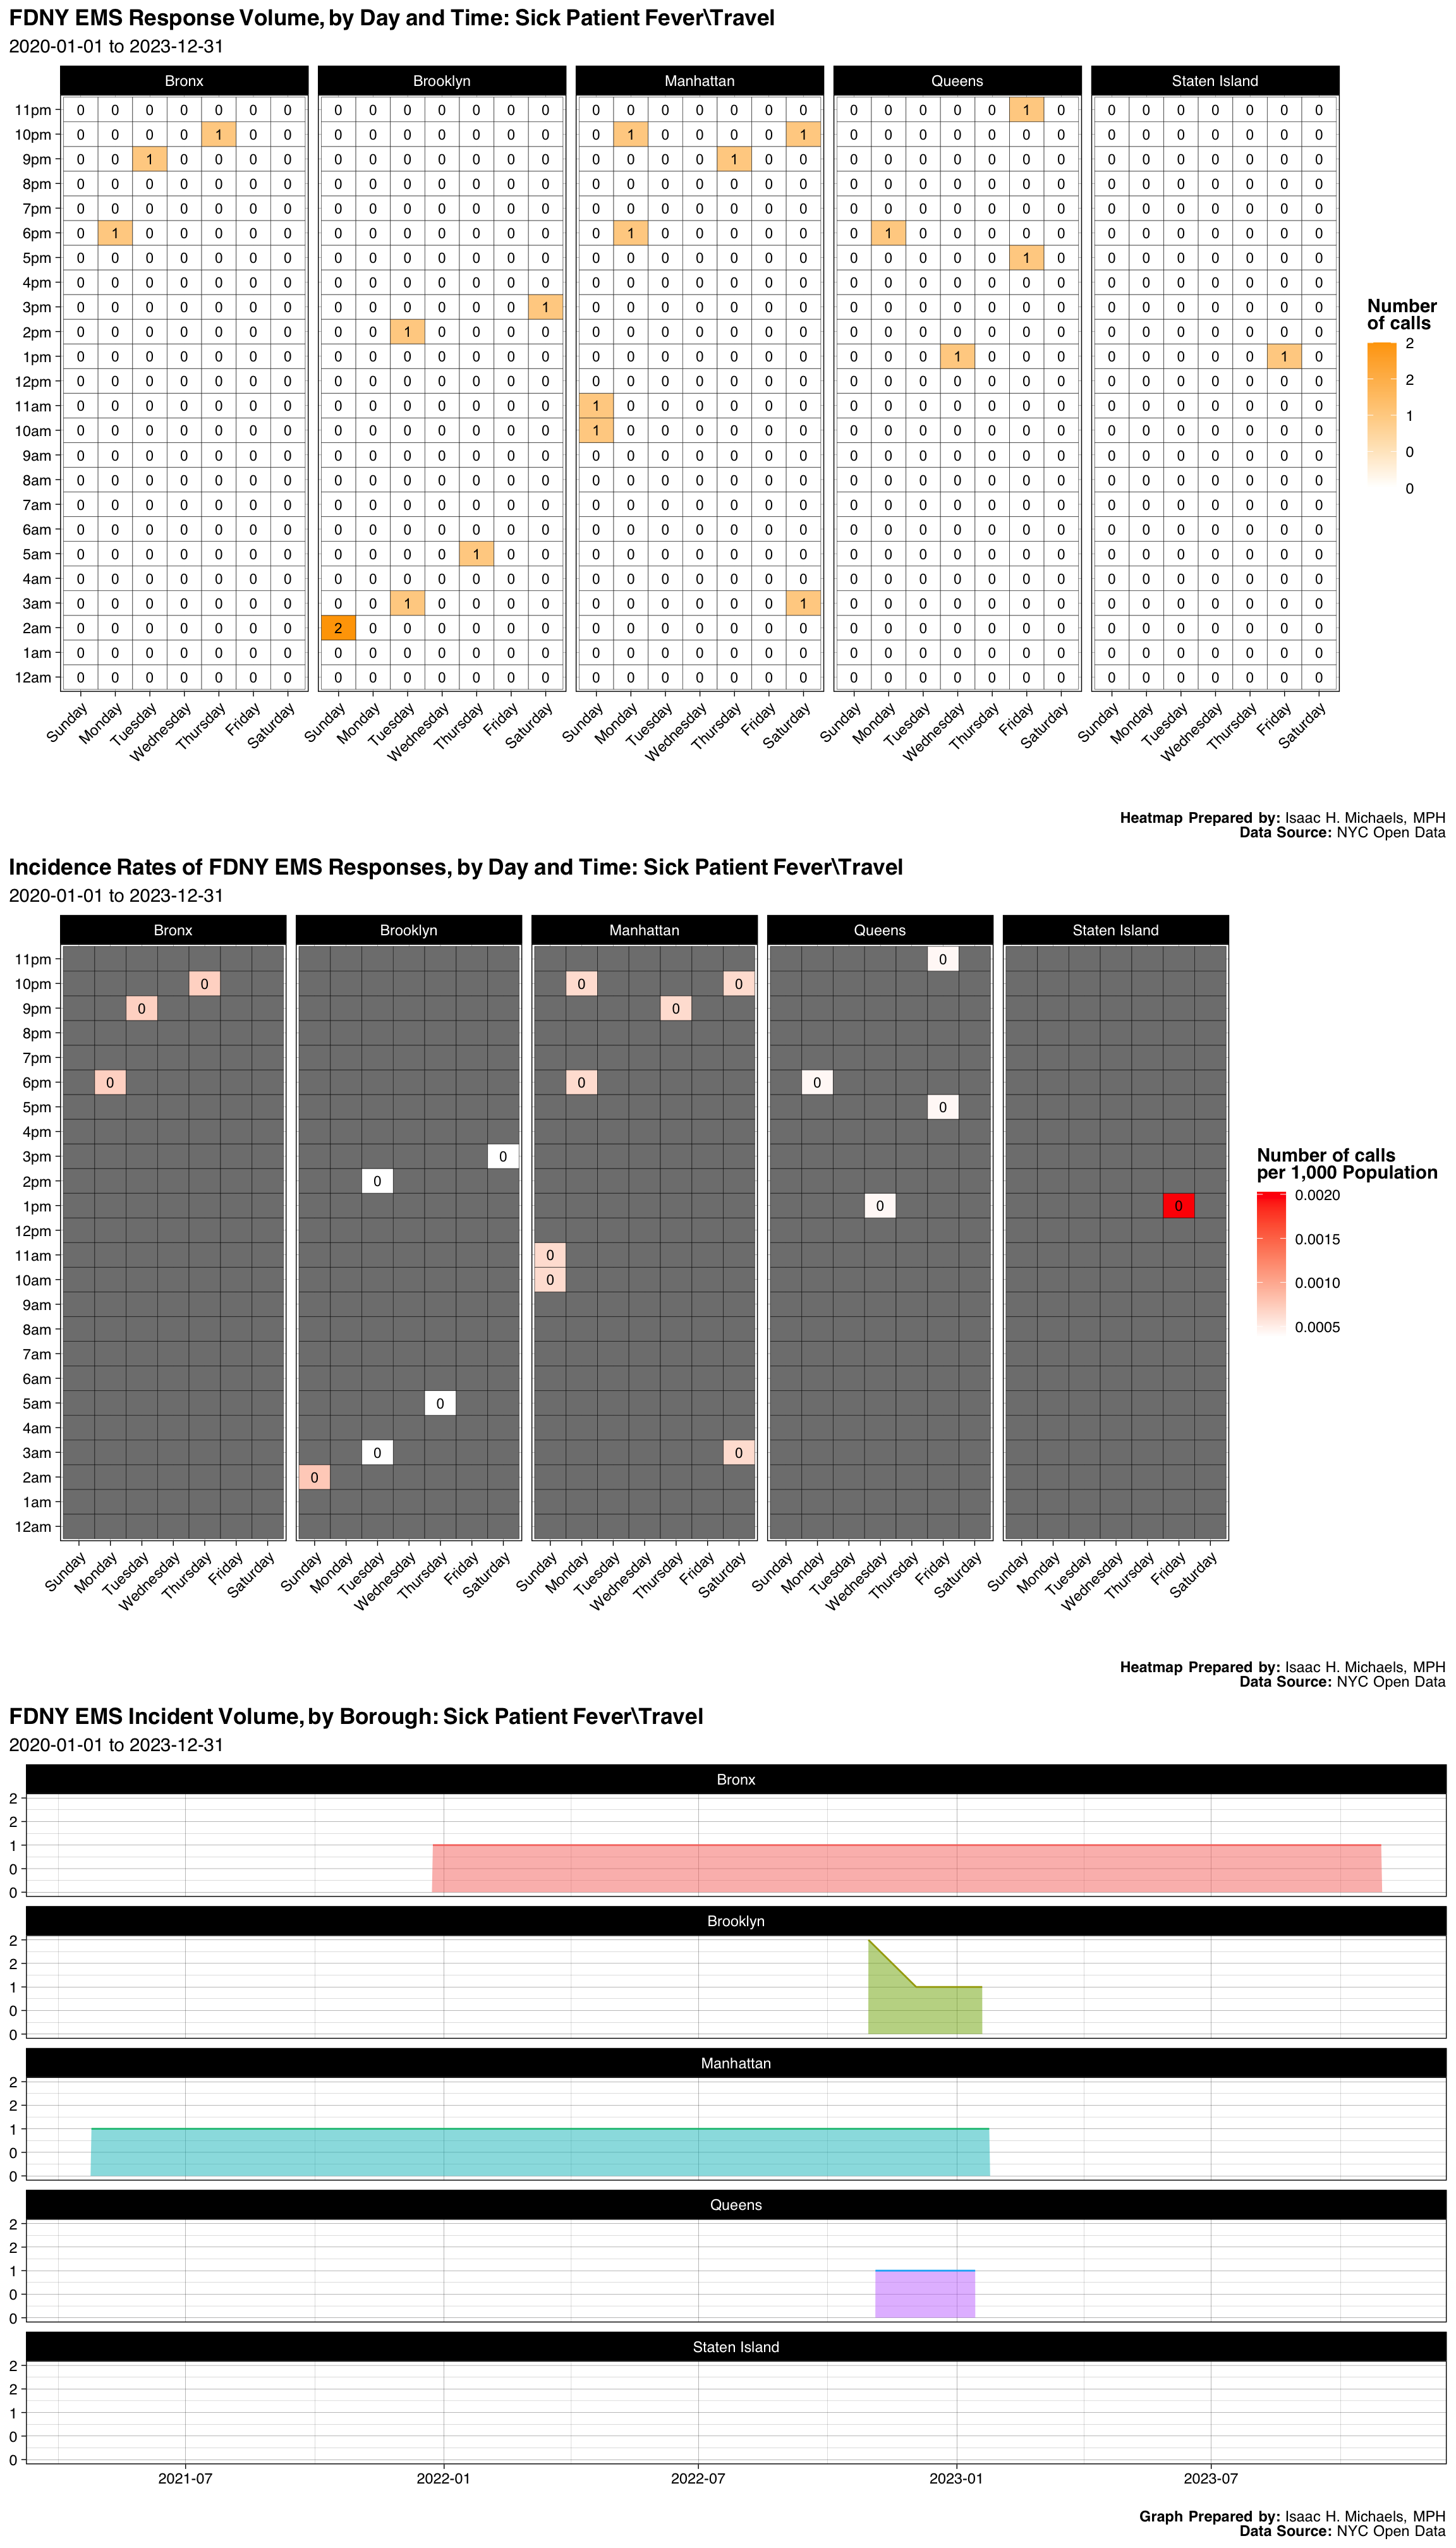
| Borough | Number | Percent |
|---|---|---|
| Bronx | 3 | 0.1428571 |
| Brooklyn | 6 | 0.2857143 |
| Manhattan | 7 | 0.3333333 |
| Queens | 4 | 0.1904762 |
| Staten Island | 1 | 0.0476190 |
| Final Severity Level | Number | Percent |
|---|---|---|
| 1 | 0 | 0% |
| 2 | 0 | 0% |
| 3 | 20 | 0.952380952380952 |
| 4 | 0 | 0% |
| 5 | 0 | 0% |
| 6 | 1 | 0.0476190476190476 |
| 7 | 0 | 0% |
| 8 | 0 | 0% |
| Disposition | Number | Percent |
|---|---|---|
| Transporting Patient | 13 | 0.6190476 |
| Unfounded | 3 | 0.1428571 |
| Patient Gone on Arrival | 2 | 0.0952381 |
| Refused Medical Aid | 2 | 0.0952381 |
| Cancelled | 1 | 0.0476190 |
Graphs, Heatmaps, and Tables Prepared By: Isaac H. Michaels, MPH
Data Source: NYC Open Data
Back to top
Marine / Harbor Incident
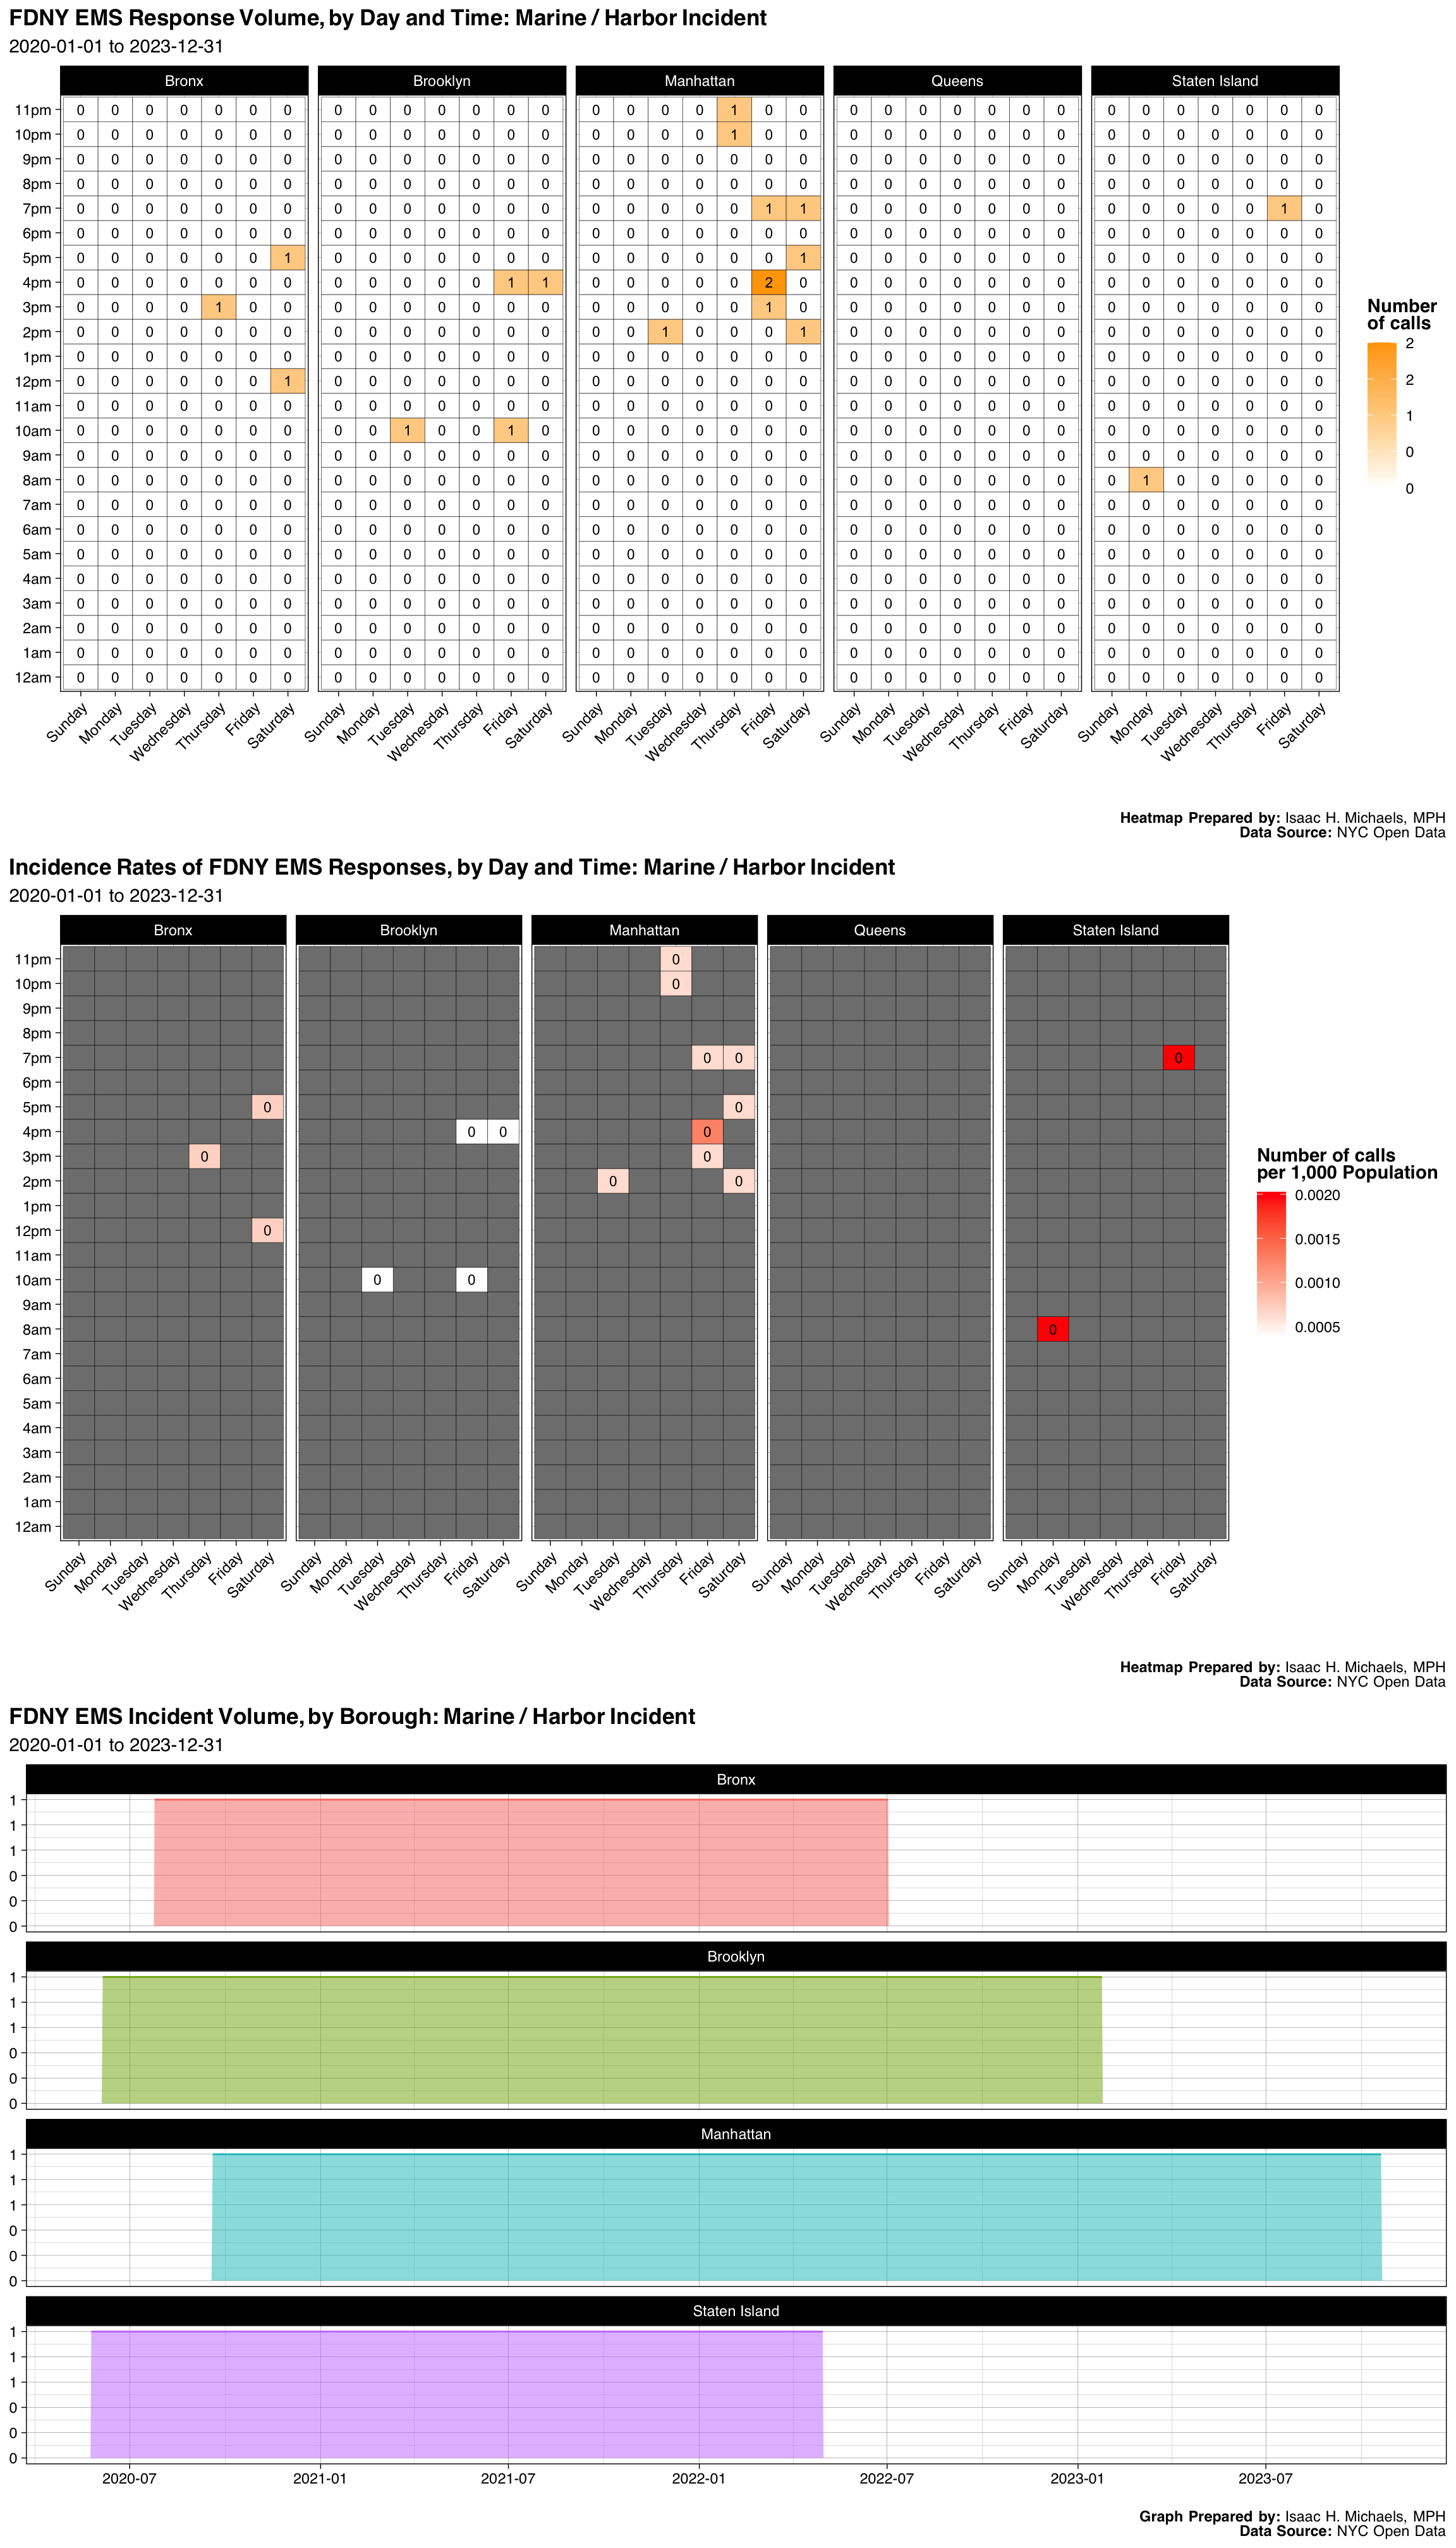
| Borough | Number | Percent |
|---|---|---|
| Bronx | 3 | 0.1578947 |
| Brooklyn | 4 | 0.2105263 |
| Manhattan | 10 | 0.5263158 |
| Staten Island | 2 | 0.1052632 |
| Final Severity Level | Number | Percent |
|---|---|---|
| 1 | 0 | 0% |
| 2 | 19 | 1 |
| 3 | 0 | 0% |
| 4 | 0 | 0% |
| 5 | 0 | 0% |
| 6 | 0 | 0% |
| 7 | 0 | 0% |
| 8 | 0 | 0% |
| Disposition | Number | Percent |
|---|---|---|
| Transporting Patient | 11 | 0.5789474 |
| Cancelled | 6 | 0.3157895 |
| Condition Corrected | 2 | 0.1052632 |
Graphs, Heatmaps, and Tables Prepared By: Isaac H. Michaels, MPH
Data Source: NYC Open Data
Back to top
Cardiac Patient Fever/Travel Condition
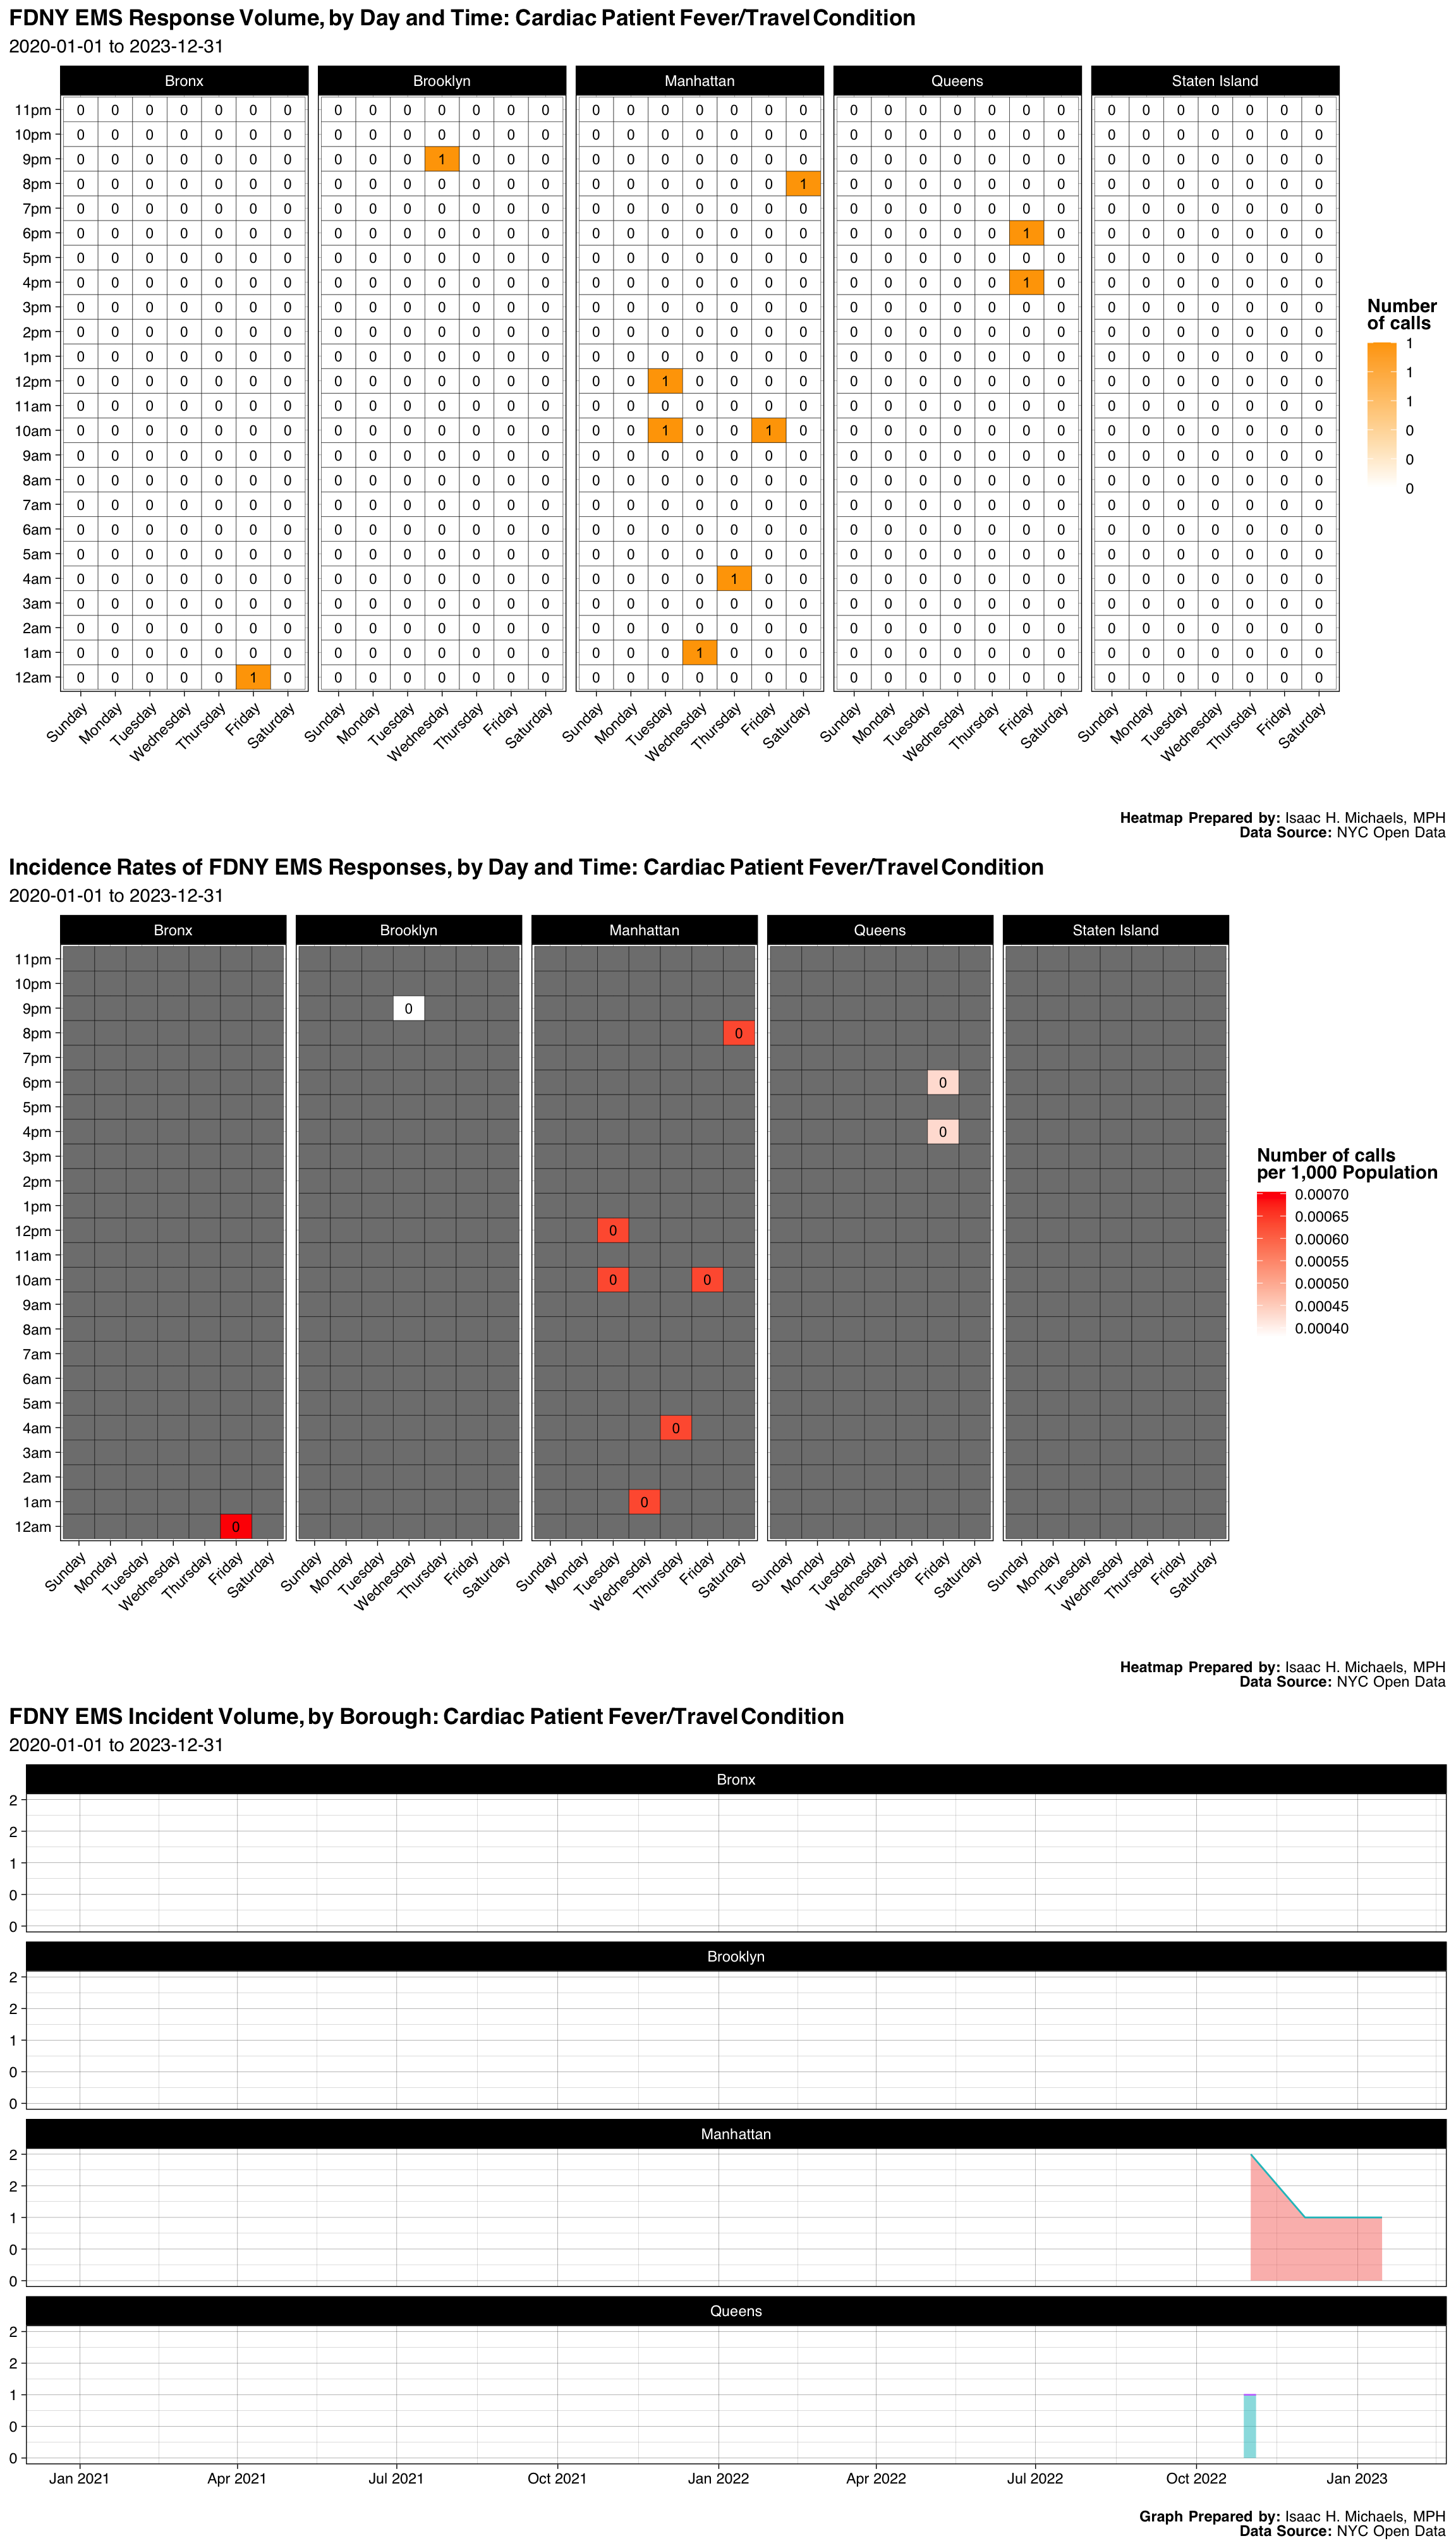
| Borough | Number | Percent |
|---|---|---|
| Bronx | 1 | 0.1 |
| Brooklyn | 1 | 0.1 |
| Manhattan | 6 | 0.6 |
| Queens | 2 | 0.2 |
| Final Severity Level | Number | Percent |
|---|---|---|
| 1 | 0 | 0% |
| 2 | 0 | 0% |
| 3 | 10 | 1 |
| 4 | 0 | 0% |
| 5 | 0 | 0% |
| 6 | 0 | 0% |
| 7 | 0 | 0% |
| 8 | 0 | 0% |
| Disposition | Number | Percent |
|---|---|---|
| Transporting Patient | 7 | 0.7 |
| Refused Medical Aid | 3 | 0.3 |
Graphs, Heatmaps, and Tables Prepared By: Isaac H. Michaels, MPH
Data Source: NYC Open Data
Back to top
Difficult Breathing Fever/Travel
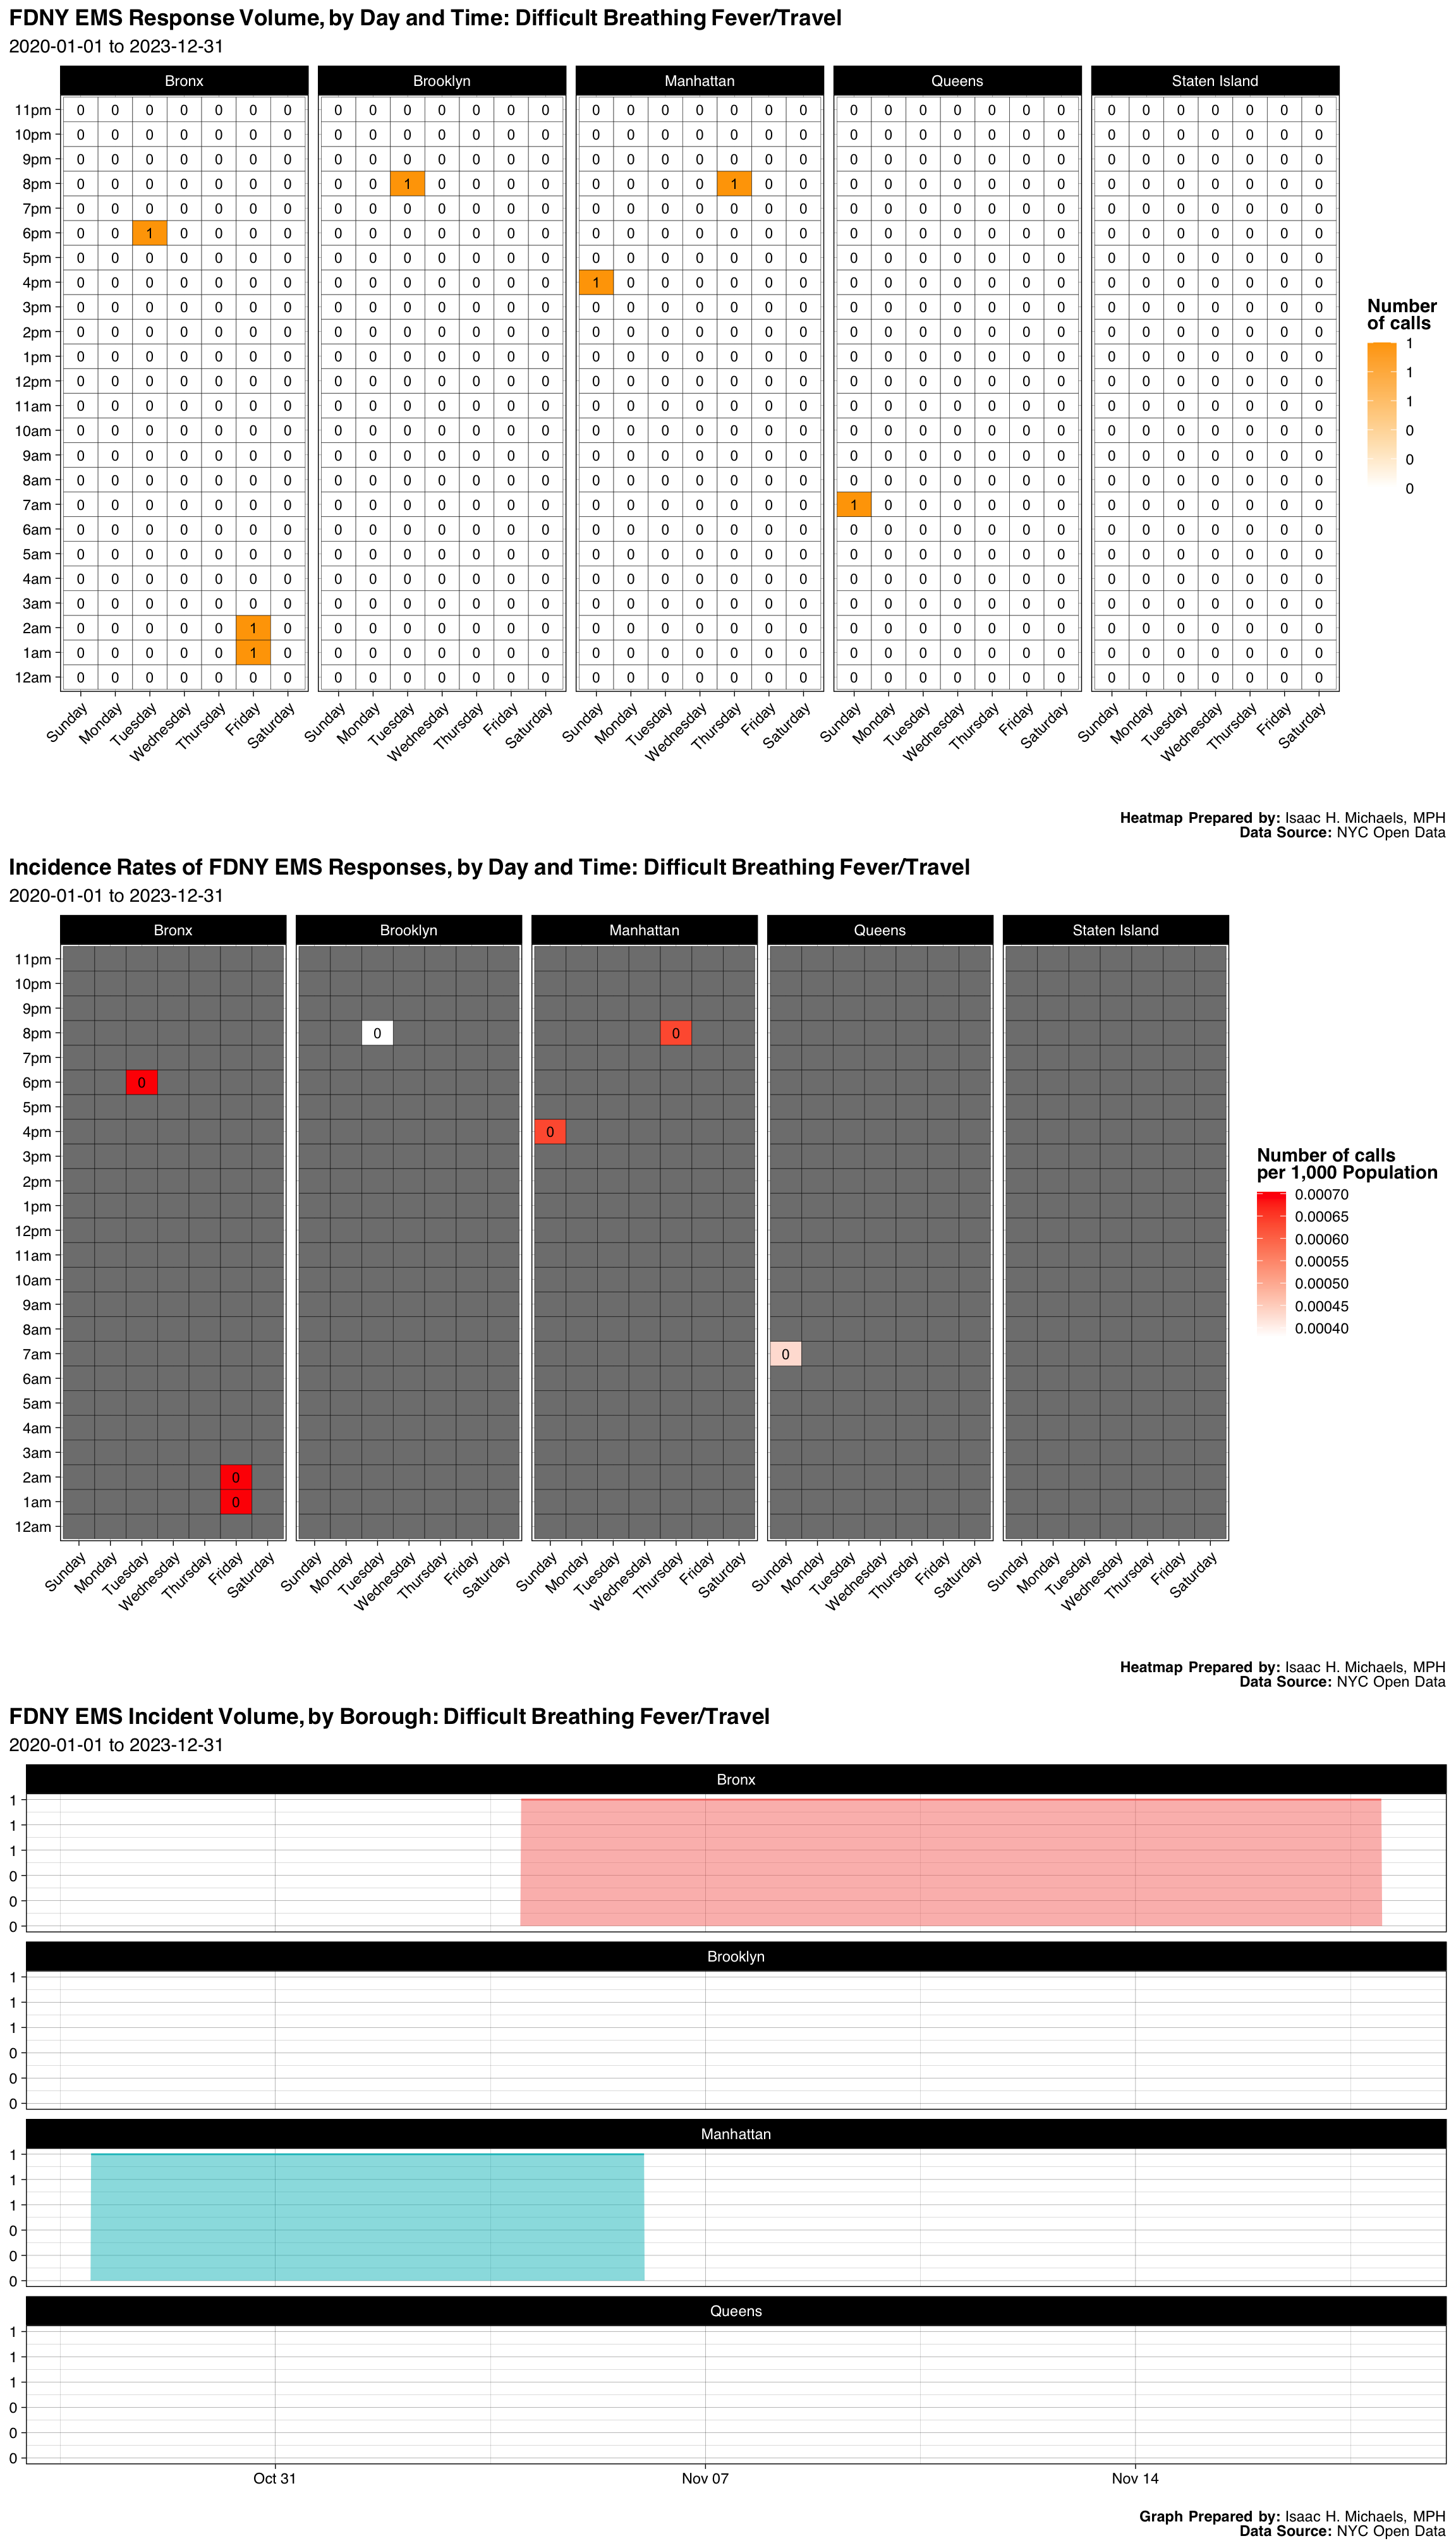
| Borough | Number | Percent |
|---|---|---|
| Bronx | 3 | 0.4285714 |
| Brooklyn | 1 | 0.1428571 |
| Manhattan | 2 | 0.2857143 |
| Queens | 1 | 0.1428571 |
| Final Severity Level | Number | Percent |
|---|---|---|
| 1 | 0 | 0% |
| 2 | 7 | 1 |
| 3 | 0 | 0% |
| 4 | 0 | 0% |
| 5 | 0 | 0% |
| 6 | 0 | 0% |
| 7 | 0 | 0% |
| 8 | 0 | 0% |
| Disposition | Number | Percent |
|---|---|---|
| Transporting Patient | 6 | 0.8571429 |
| Patient Gone on Arrival | 1 | 0.1428571 |
Graphs, Heatmaps, and Tables Prepared By: Isaac H. Michaels, MPH
Data Source: NYC Open Data
Back to top
Internal Bleeding Fever/Travel
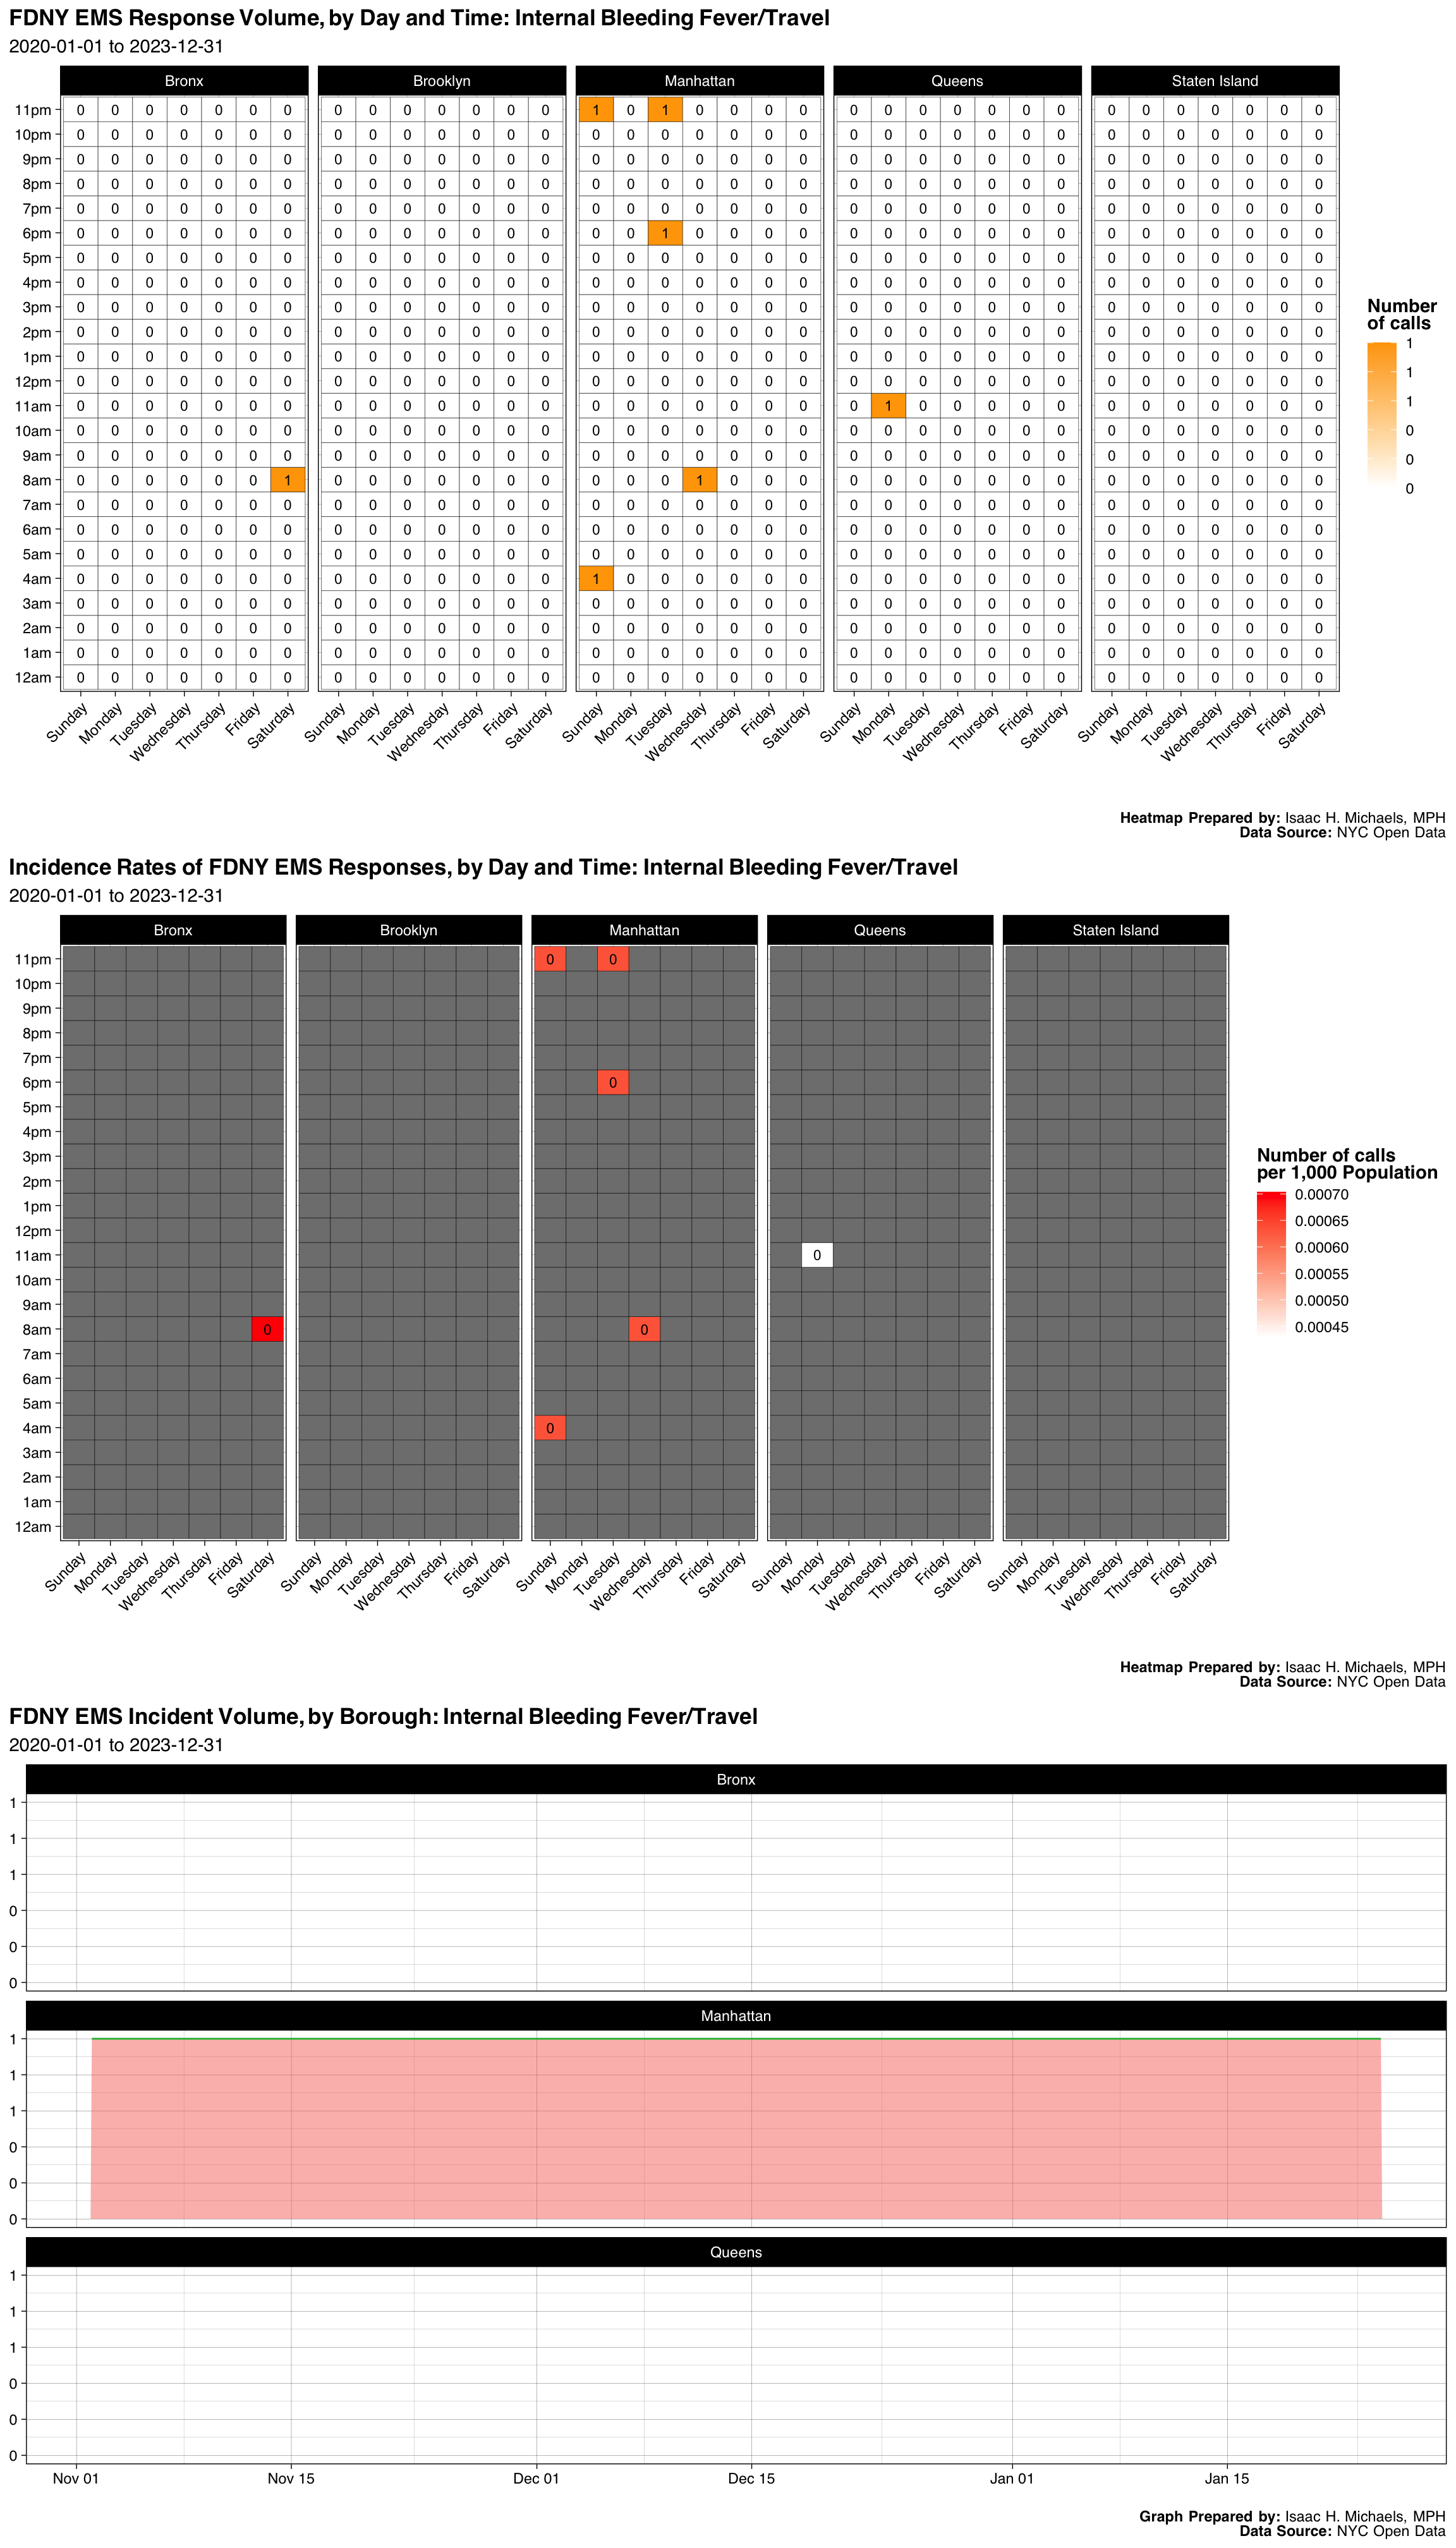
| Borough | Number | Percent |
|---|---|---|
| Bronx | 1 | 0.1428571 |
| Manhattan | 5 | 0.7142857 |
| Queens | 1 | 0.1428571 |
| Final Severity Level | Number | Percent |
|---|---|---|
| 1 | 0 | 0% |
| 2 | 0 | 0% |
| 3 | 7 | 1 |
| 4 | 0 | 0% |
| 5 | 0 | 0% |
| 6 | 0 | 0% |
| 7 | 0 | 0% |
| 8 | 0 | 0% |
| Disposition | Number | Percent |
|---|---|---|
| Transporting Patient | 7 | 1 |
Graphs, Heatmaps, and Tables Prepared By: Isaac H. Michaels, MPH
Data Source: NYC Open Data
Back to top
Power Failure / Blackout
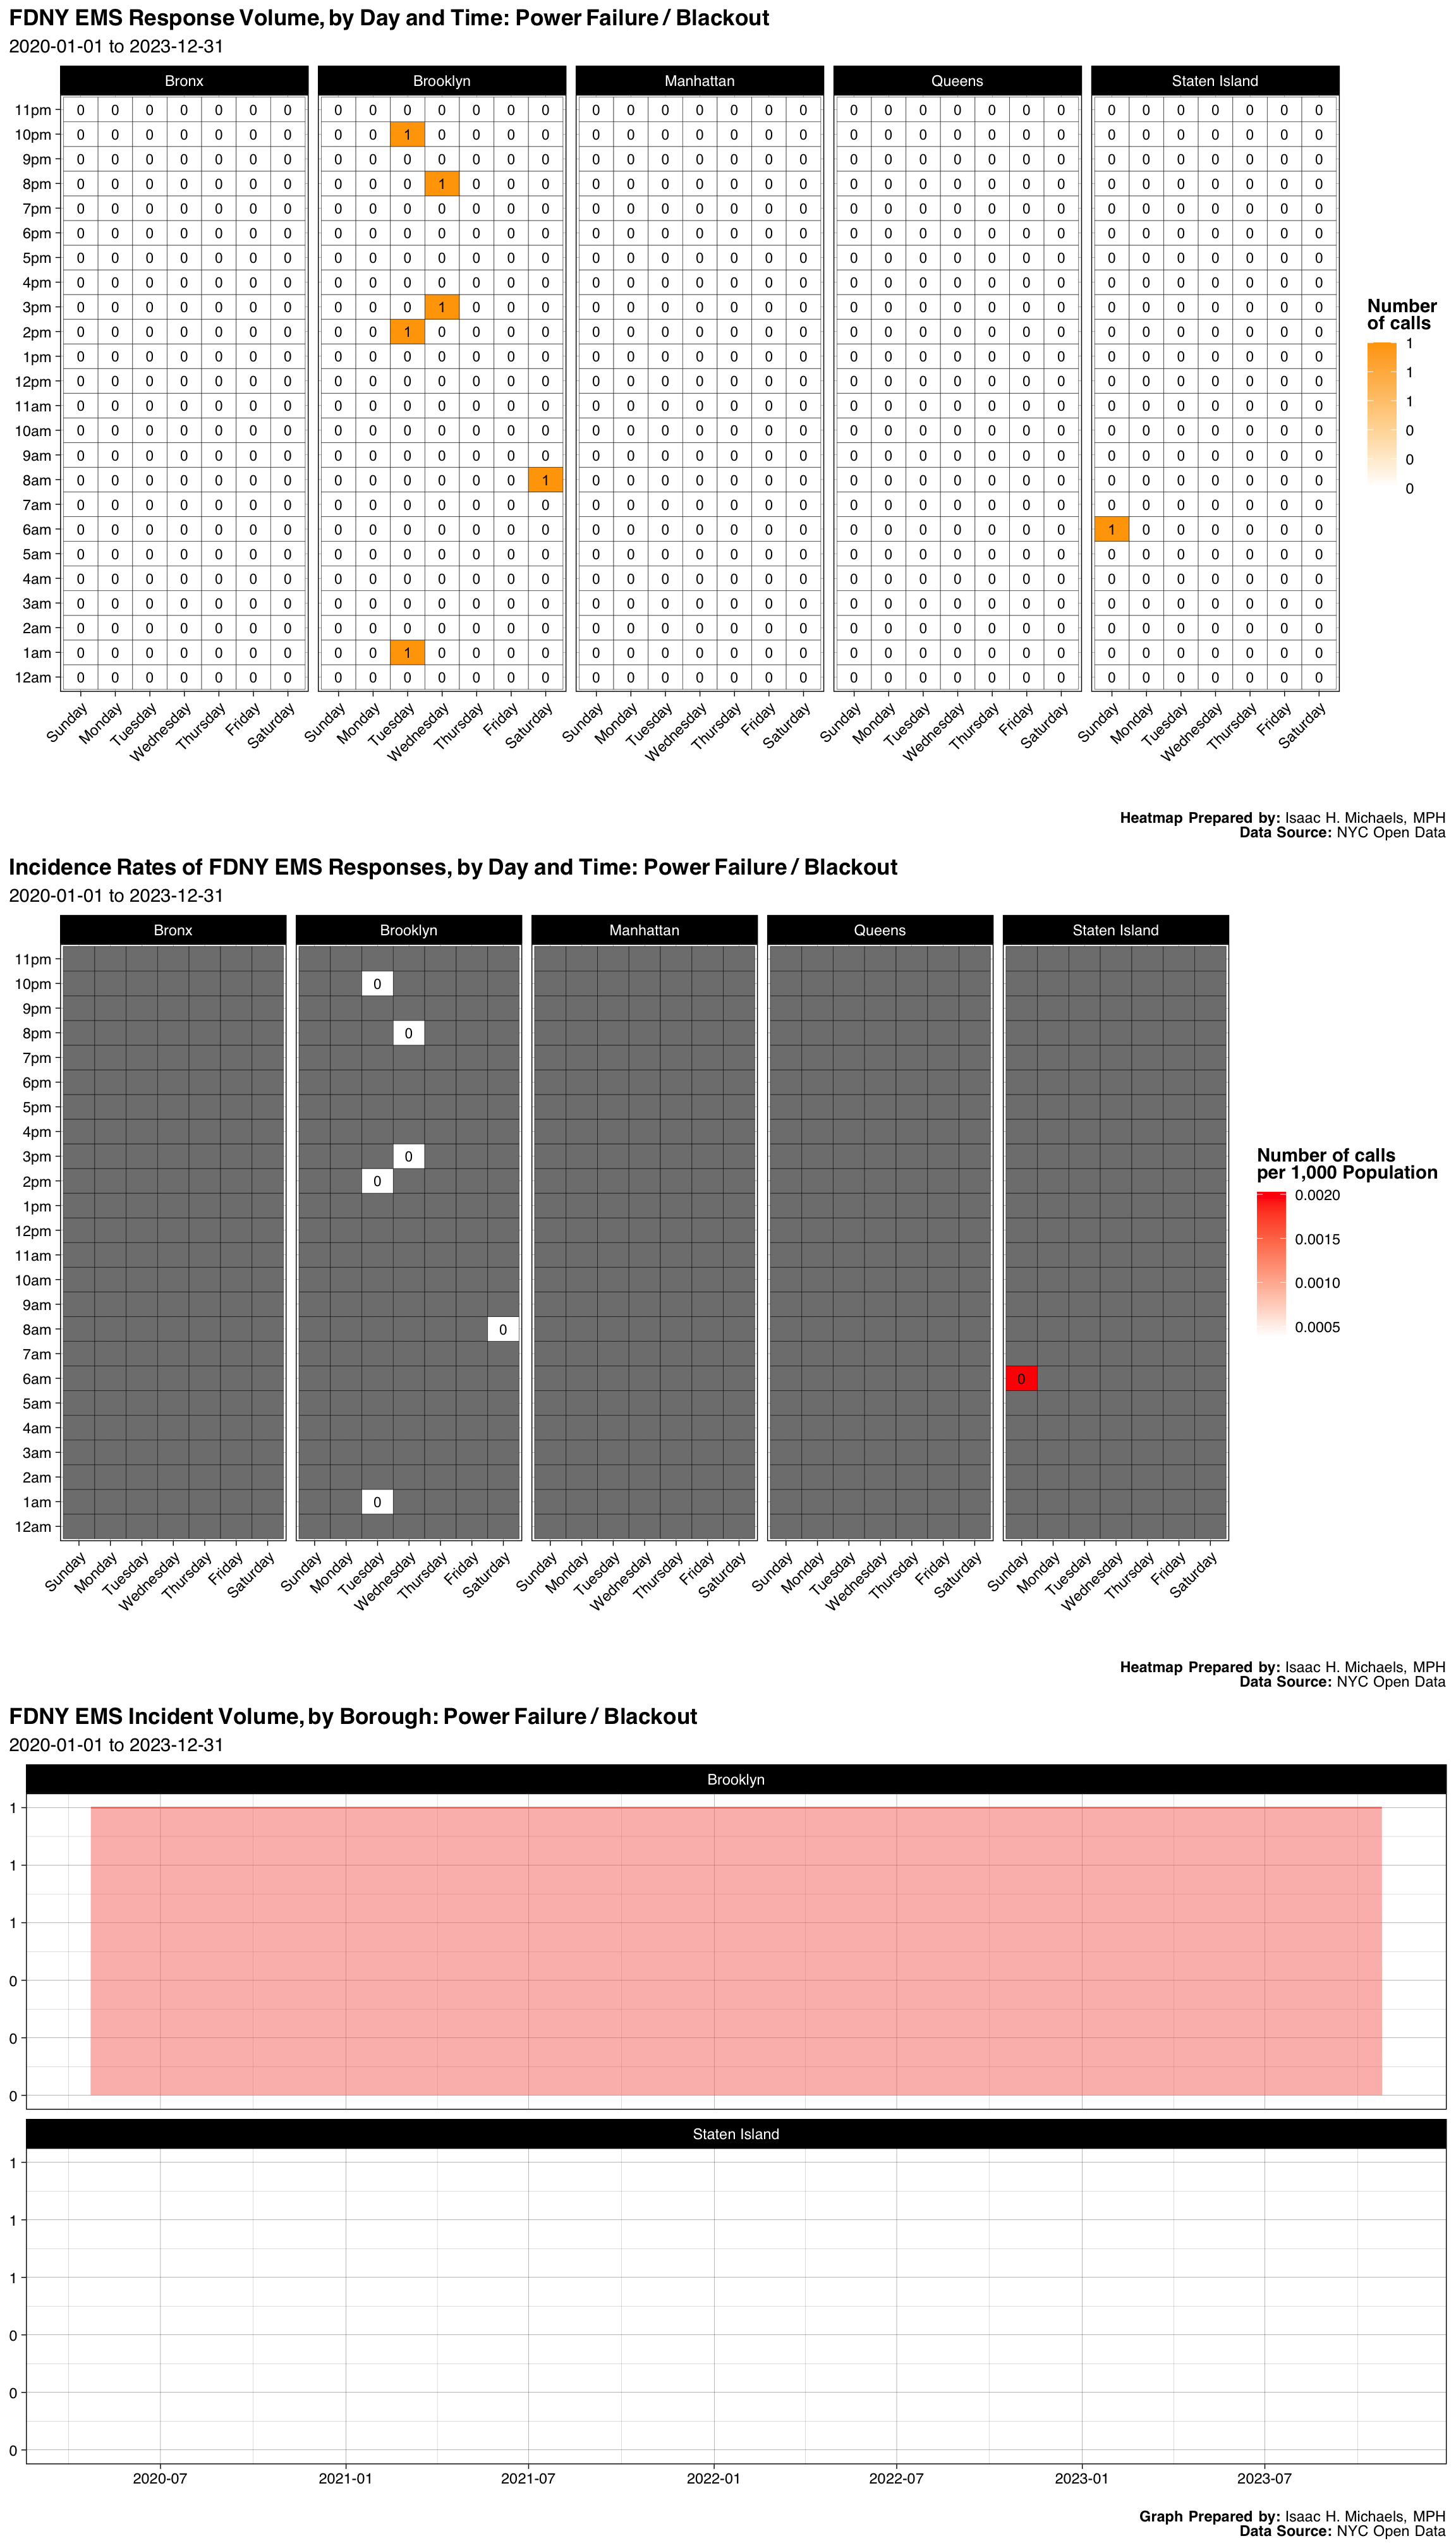
| Borough | Number | Percent |
|---|---|---|
| Brooklyn | 6 | 0.8571429 |
| Staten Island | 1 | 0.1428571 |
| Final Severity Level | Number | Percent |
|---|---|---|
| 1 | 0 | 0% |
| 2 | 7 | 1 |
| 3 | 0 | 0% |
| 4 | 0 | 0% |
| 5 | 0 | 0% |
| 6 | 0 | 0% |
| 7 | 0 | 0% |
| 8 | 0 | 0% |
| Disposition | Number | Percent |
|---|---|---|
| Cancelled | 5 | 0.7142857 |
| Refused Medical Aid | 1 | 0.1428571 |
| Transporting Patient | 1 | 0.1428571 |
Graphs, Heatmaps, and Tables Prepared By: Isaac H. Michaels, MPH
Data Source: NYC Open Data
Back to top
Abdominal Pain Fever
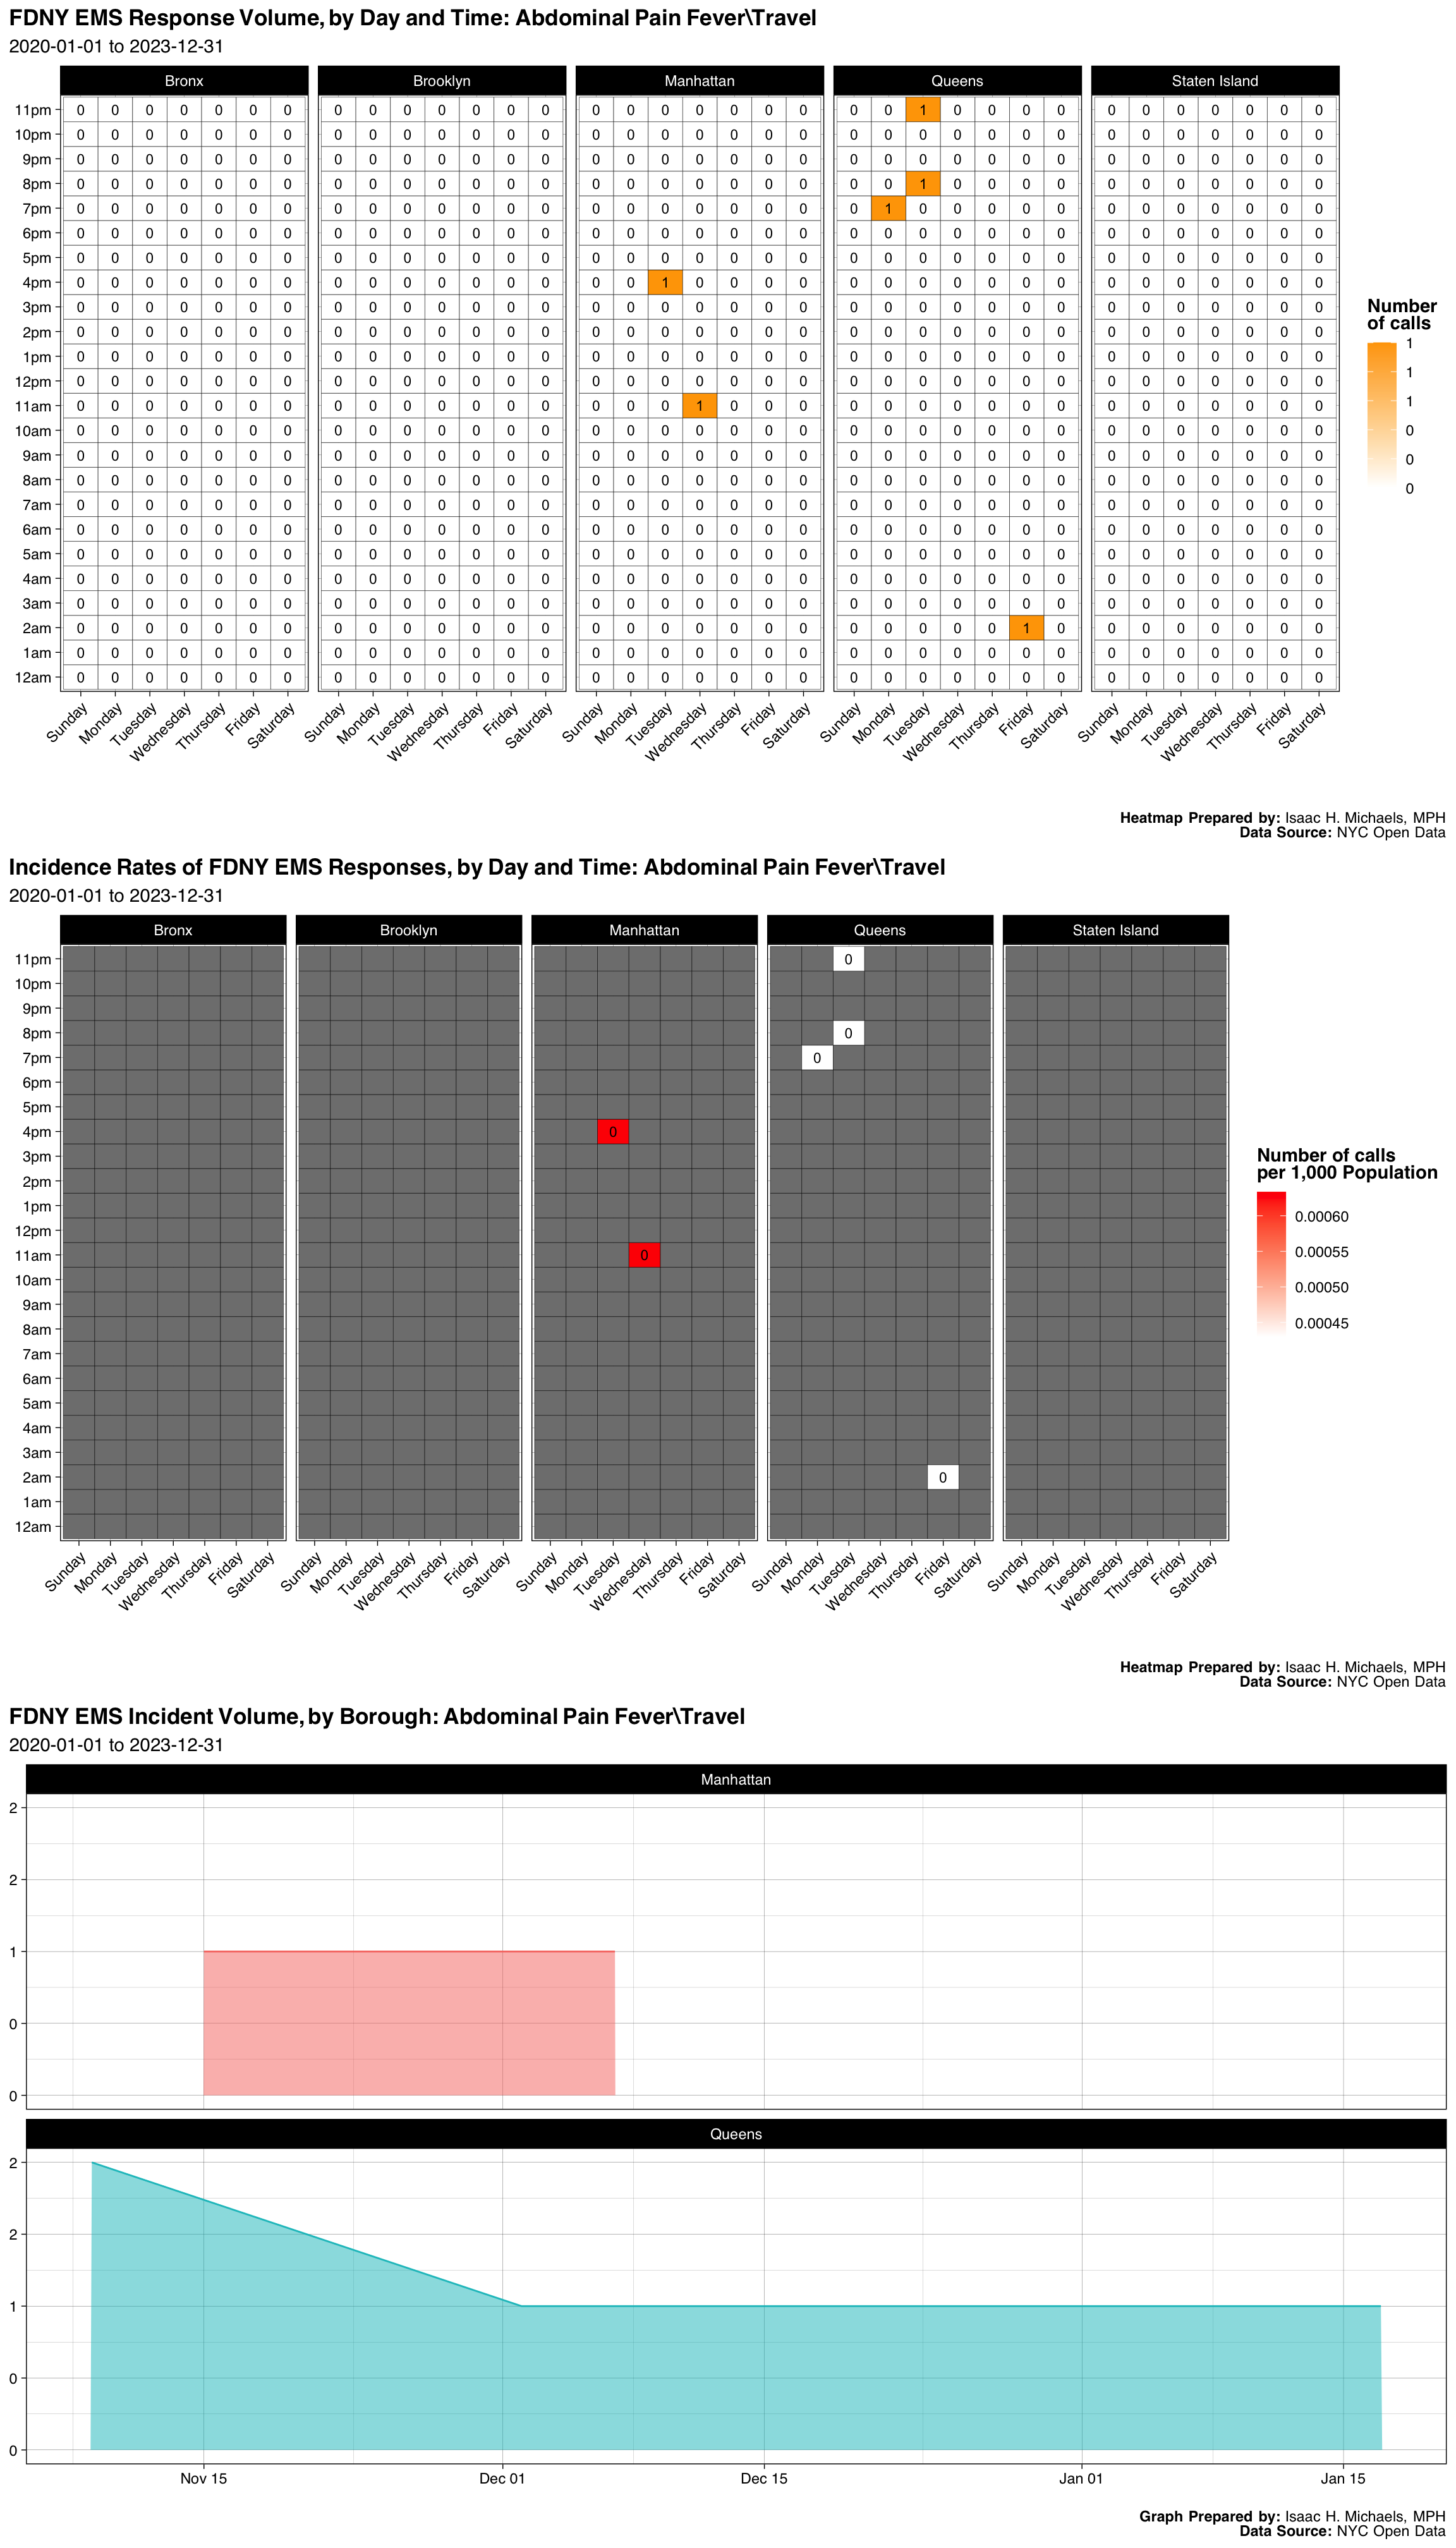
| Borough | Number | Percent |
|---|---|---|
| Manhattan | 2 | 0.3333333 |
| Queens | 4 | 0.6666667 |
| Final Severity Level | Number | Percent |
|---|---|---|
| 1 | 0 | 0% |
| 2 | 0 | 0% |
| 3 | 5 | 0.833333333333333 |
| 4 | 0 | 0% |
| 5 | 1 | 0.166666666666667 |
| 6 | 0 | 0% |
| 7 | 0 | 0% |
| 8 | 0 | 0% |
| Disposition | Number | Percent |
|---|---|---|
| Transporting Patient | 6 | 1 |
Graphs, Heatmaps, and Tables Prepared By: Isaac H. Michaels, MPH
Data Source: NYC Open Data
Back to top
Altered Mental Status Fever/Travel
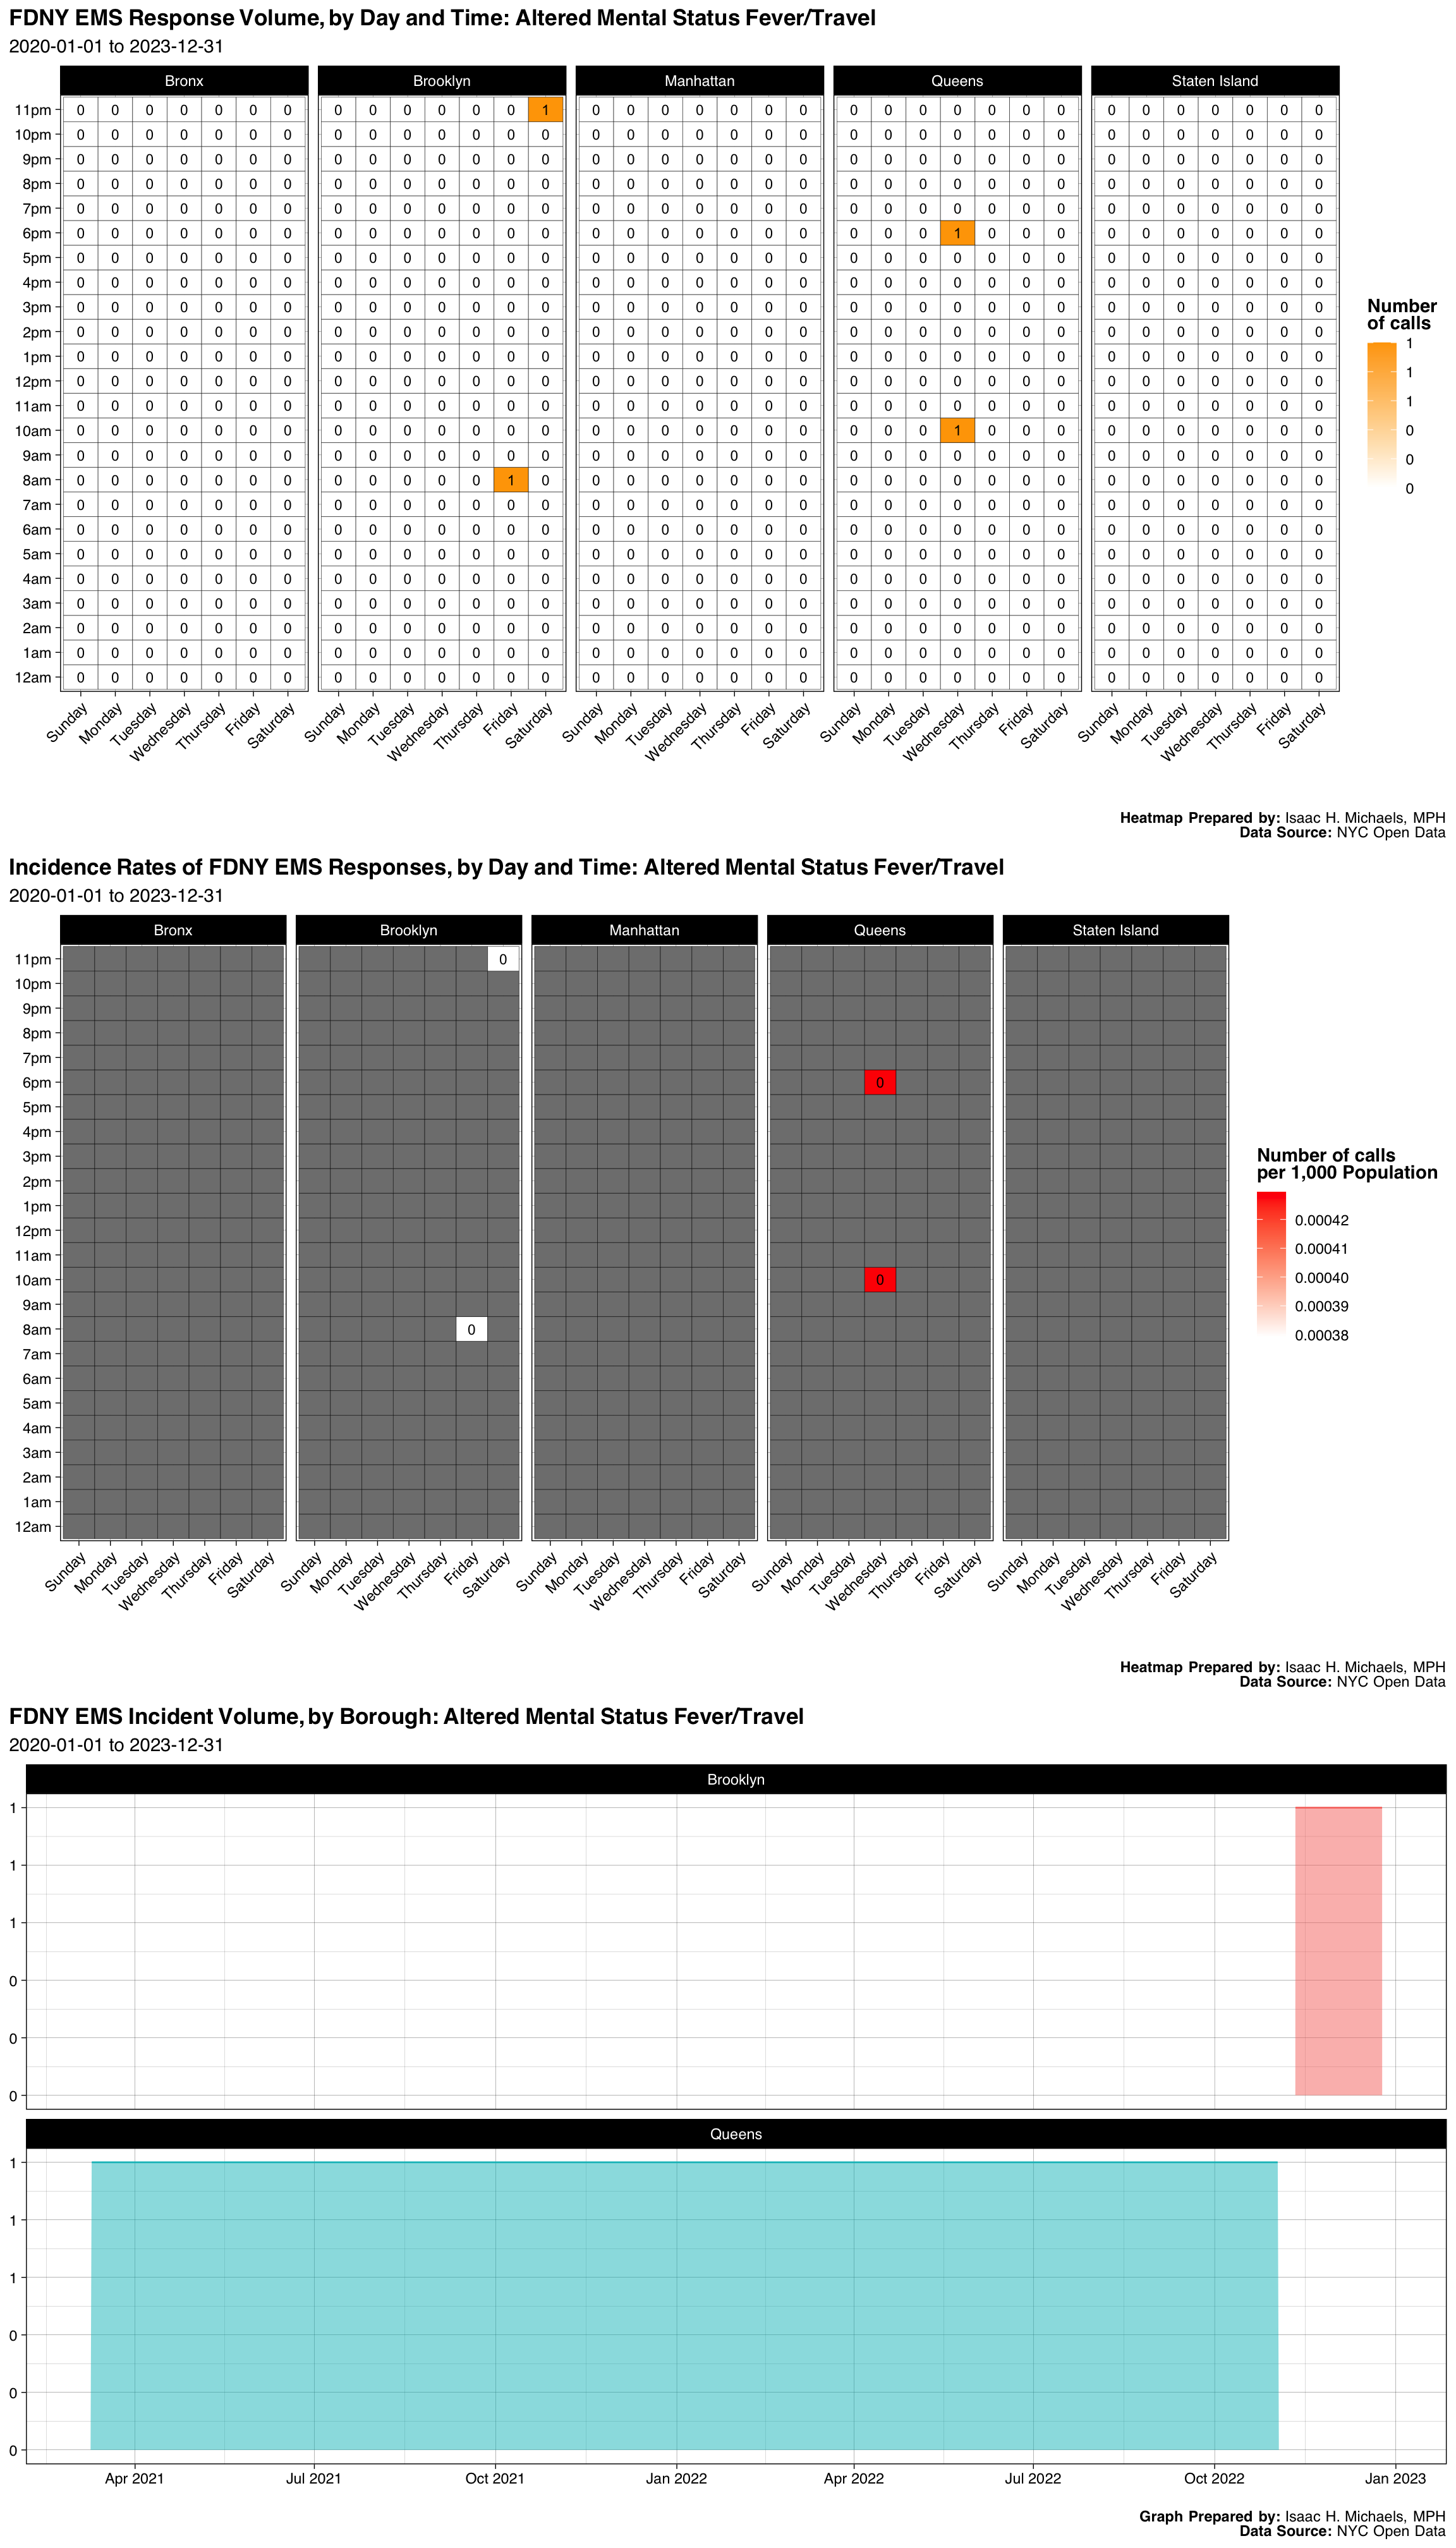
| Borough | Number | Percent |
|---|---|---|
| Brooklyn | 2 | 0.5 |
| Queens | 2 | 0.5 |
| Final Severity Level | Number | Percent |
|---|---|---|
| 1 | 0 | 0% |
| 2 | 0 | 0% |
| 3 | 4 | 1 |
| 4 | 0 | 0% |
| 5 | 0 | 0% |
| 6 | 0 | 0% |
| 7 | 0 | 0% |
| 8 | 0 | 0% |
| Disposition | Number | Percent |
|---|---|---|
| Transporting Patient | 4 | 1 |
Graphs, Heatmaps, and Tables Prepared By: Isaac H. Michaels, MPH
Data Source: NYC Open Data
Back to top
Rapid Transit/Rail Incident
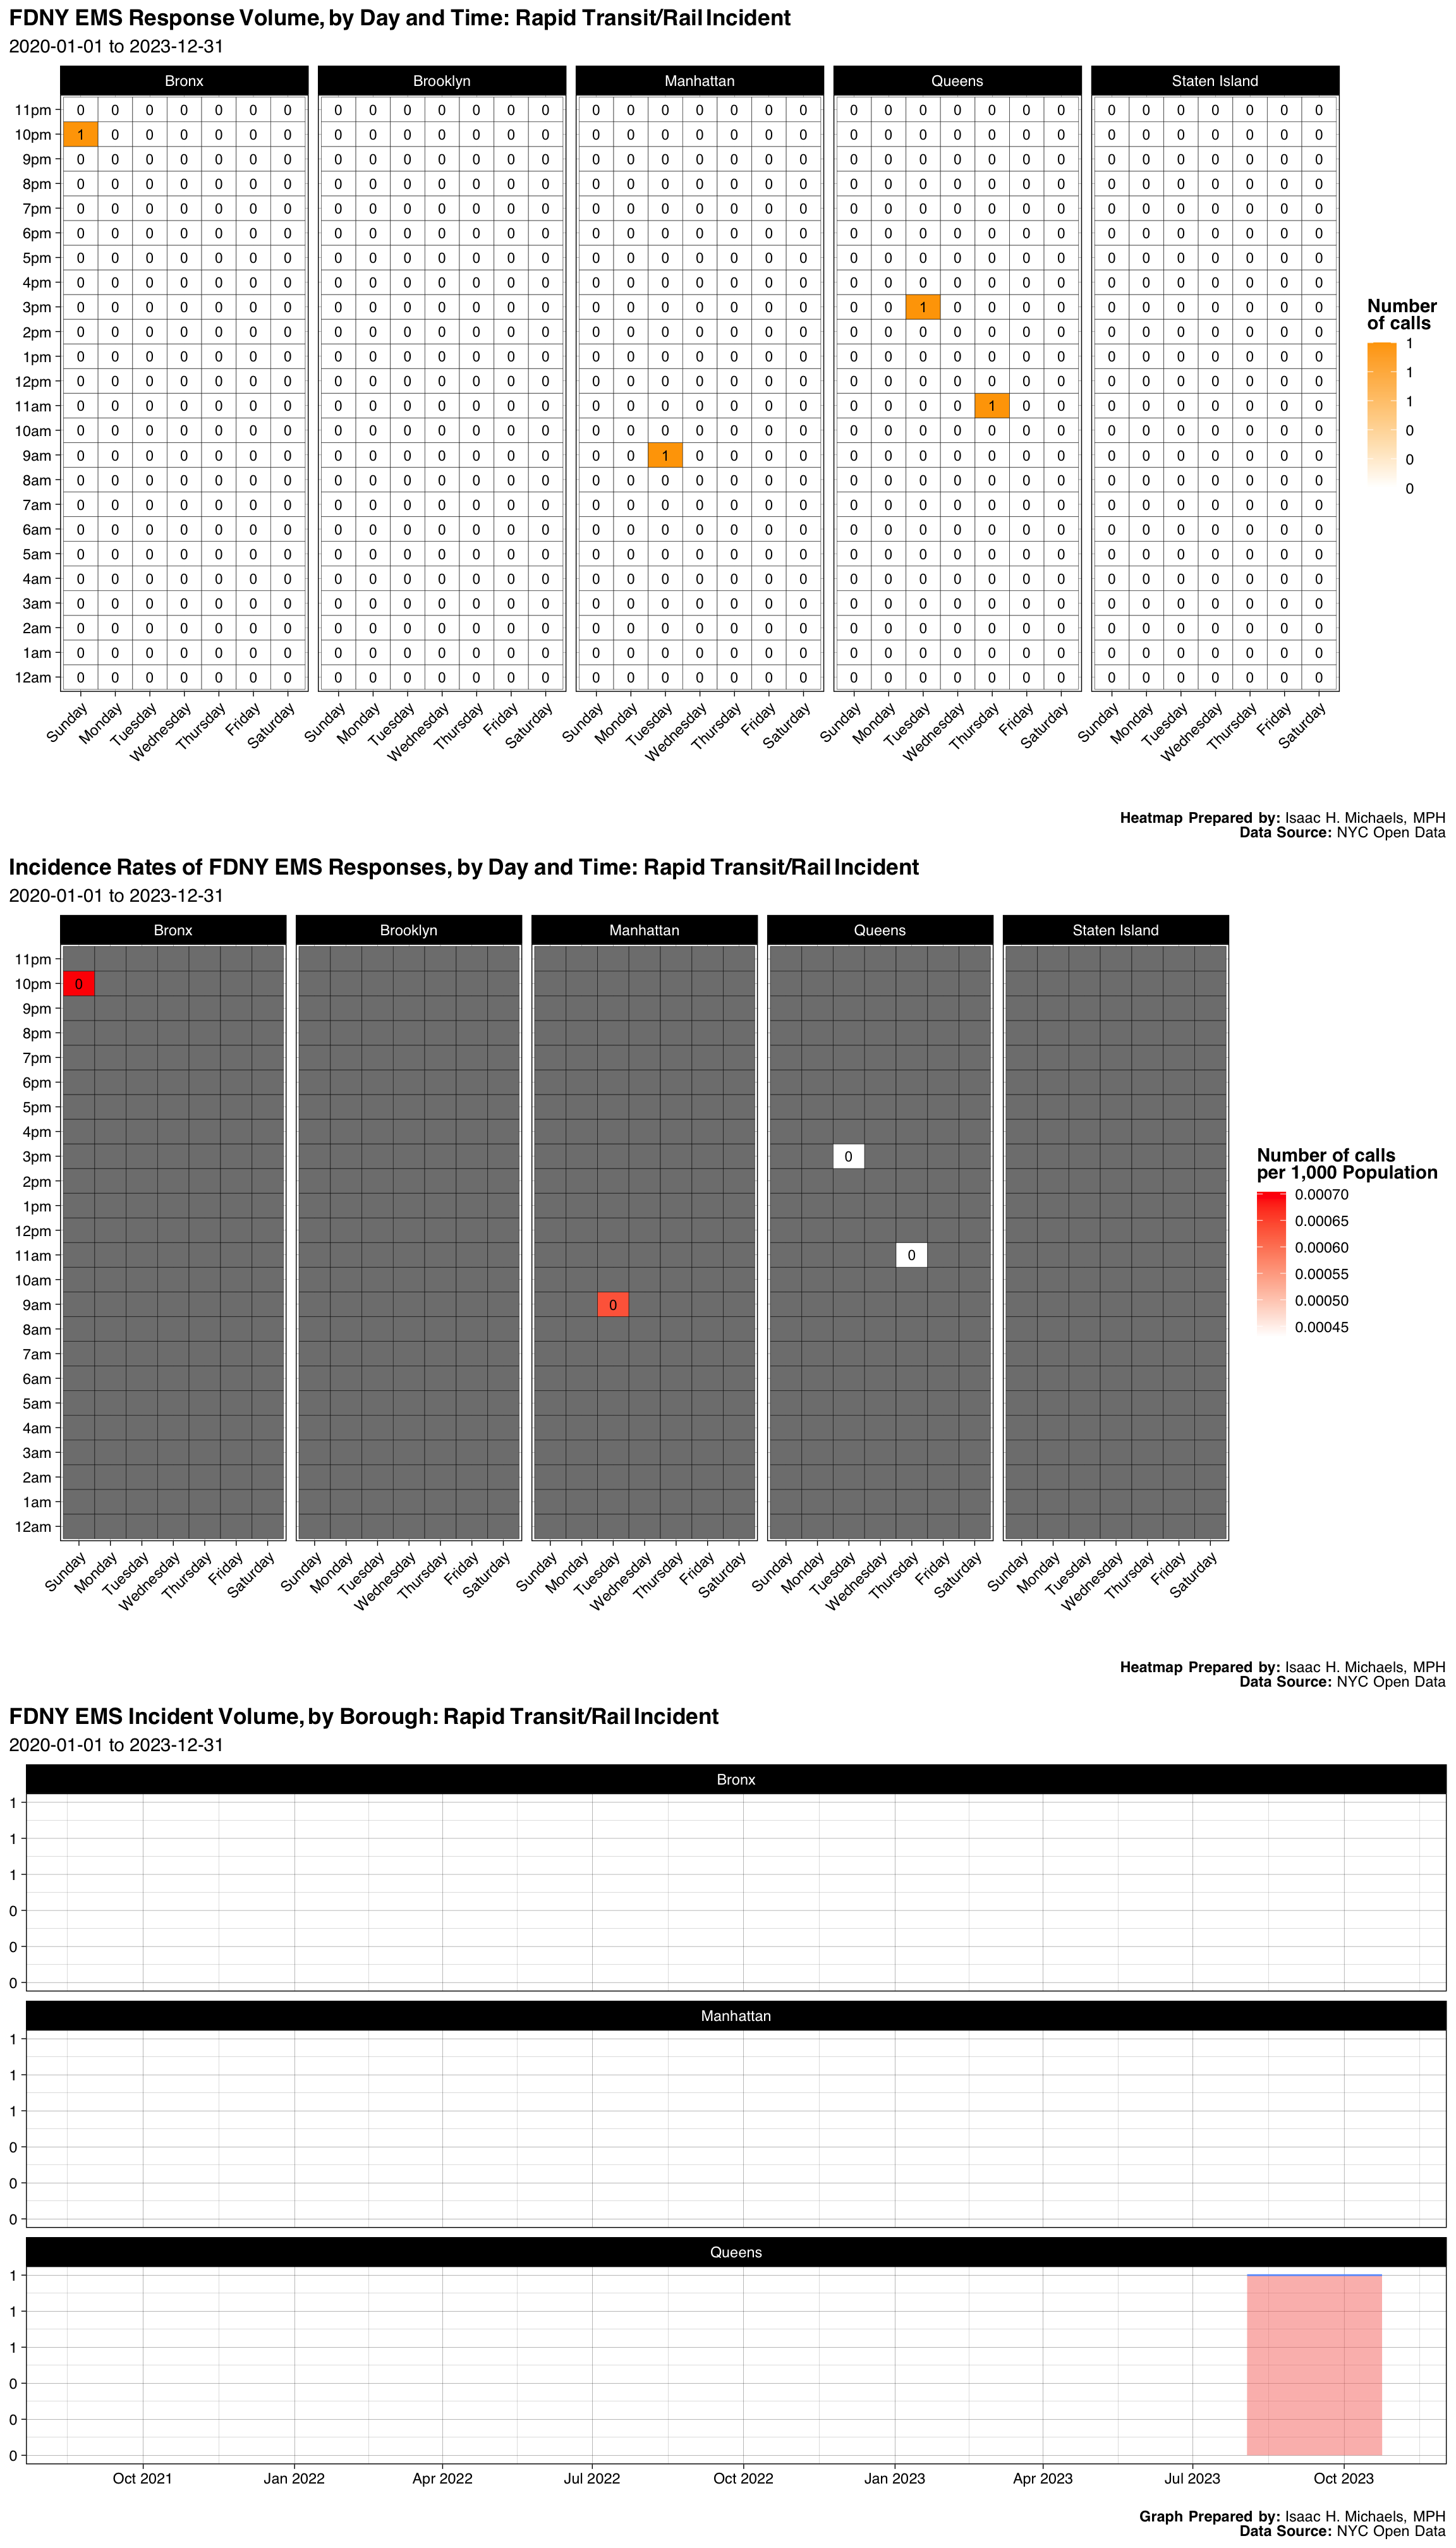
| Borough | Number | Percent |
|---|---|---|
| Bronx | 1 | 0.25 |
| Manhattan | 1 | 0.25 |
| Queens | 2 | 0.50 |
| Final Severity Level | Number | Percent |
|---|---|---|
| 1 | 0 | 0% |
| 2 | 4 | 1 |
| 3 | 0 | 0% |
| 4 | 0 | 0% |
| 5 | 0 | 0% |
| 6 | 0 | 0% |
| 7 | 0 | 0% |
| 8 | 0 | 0% |
| Disposition | Number | Percent |
|---|---|---|
| Cancelled | 2 | 0.50 |
| Refused Medical Aid | 1 | 0.25 |
| Transporting Patient | 1 | 0.25 |
Graphs, Heatmaps, and Tables Prepared By: Isaac H. Michaels, MPH
Data Source: NYC Open Data
Back to top
Active Shooter
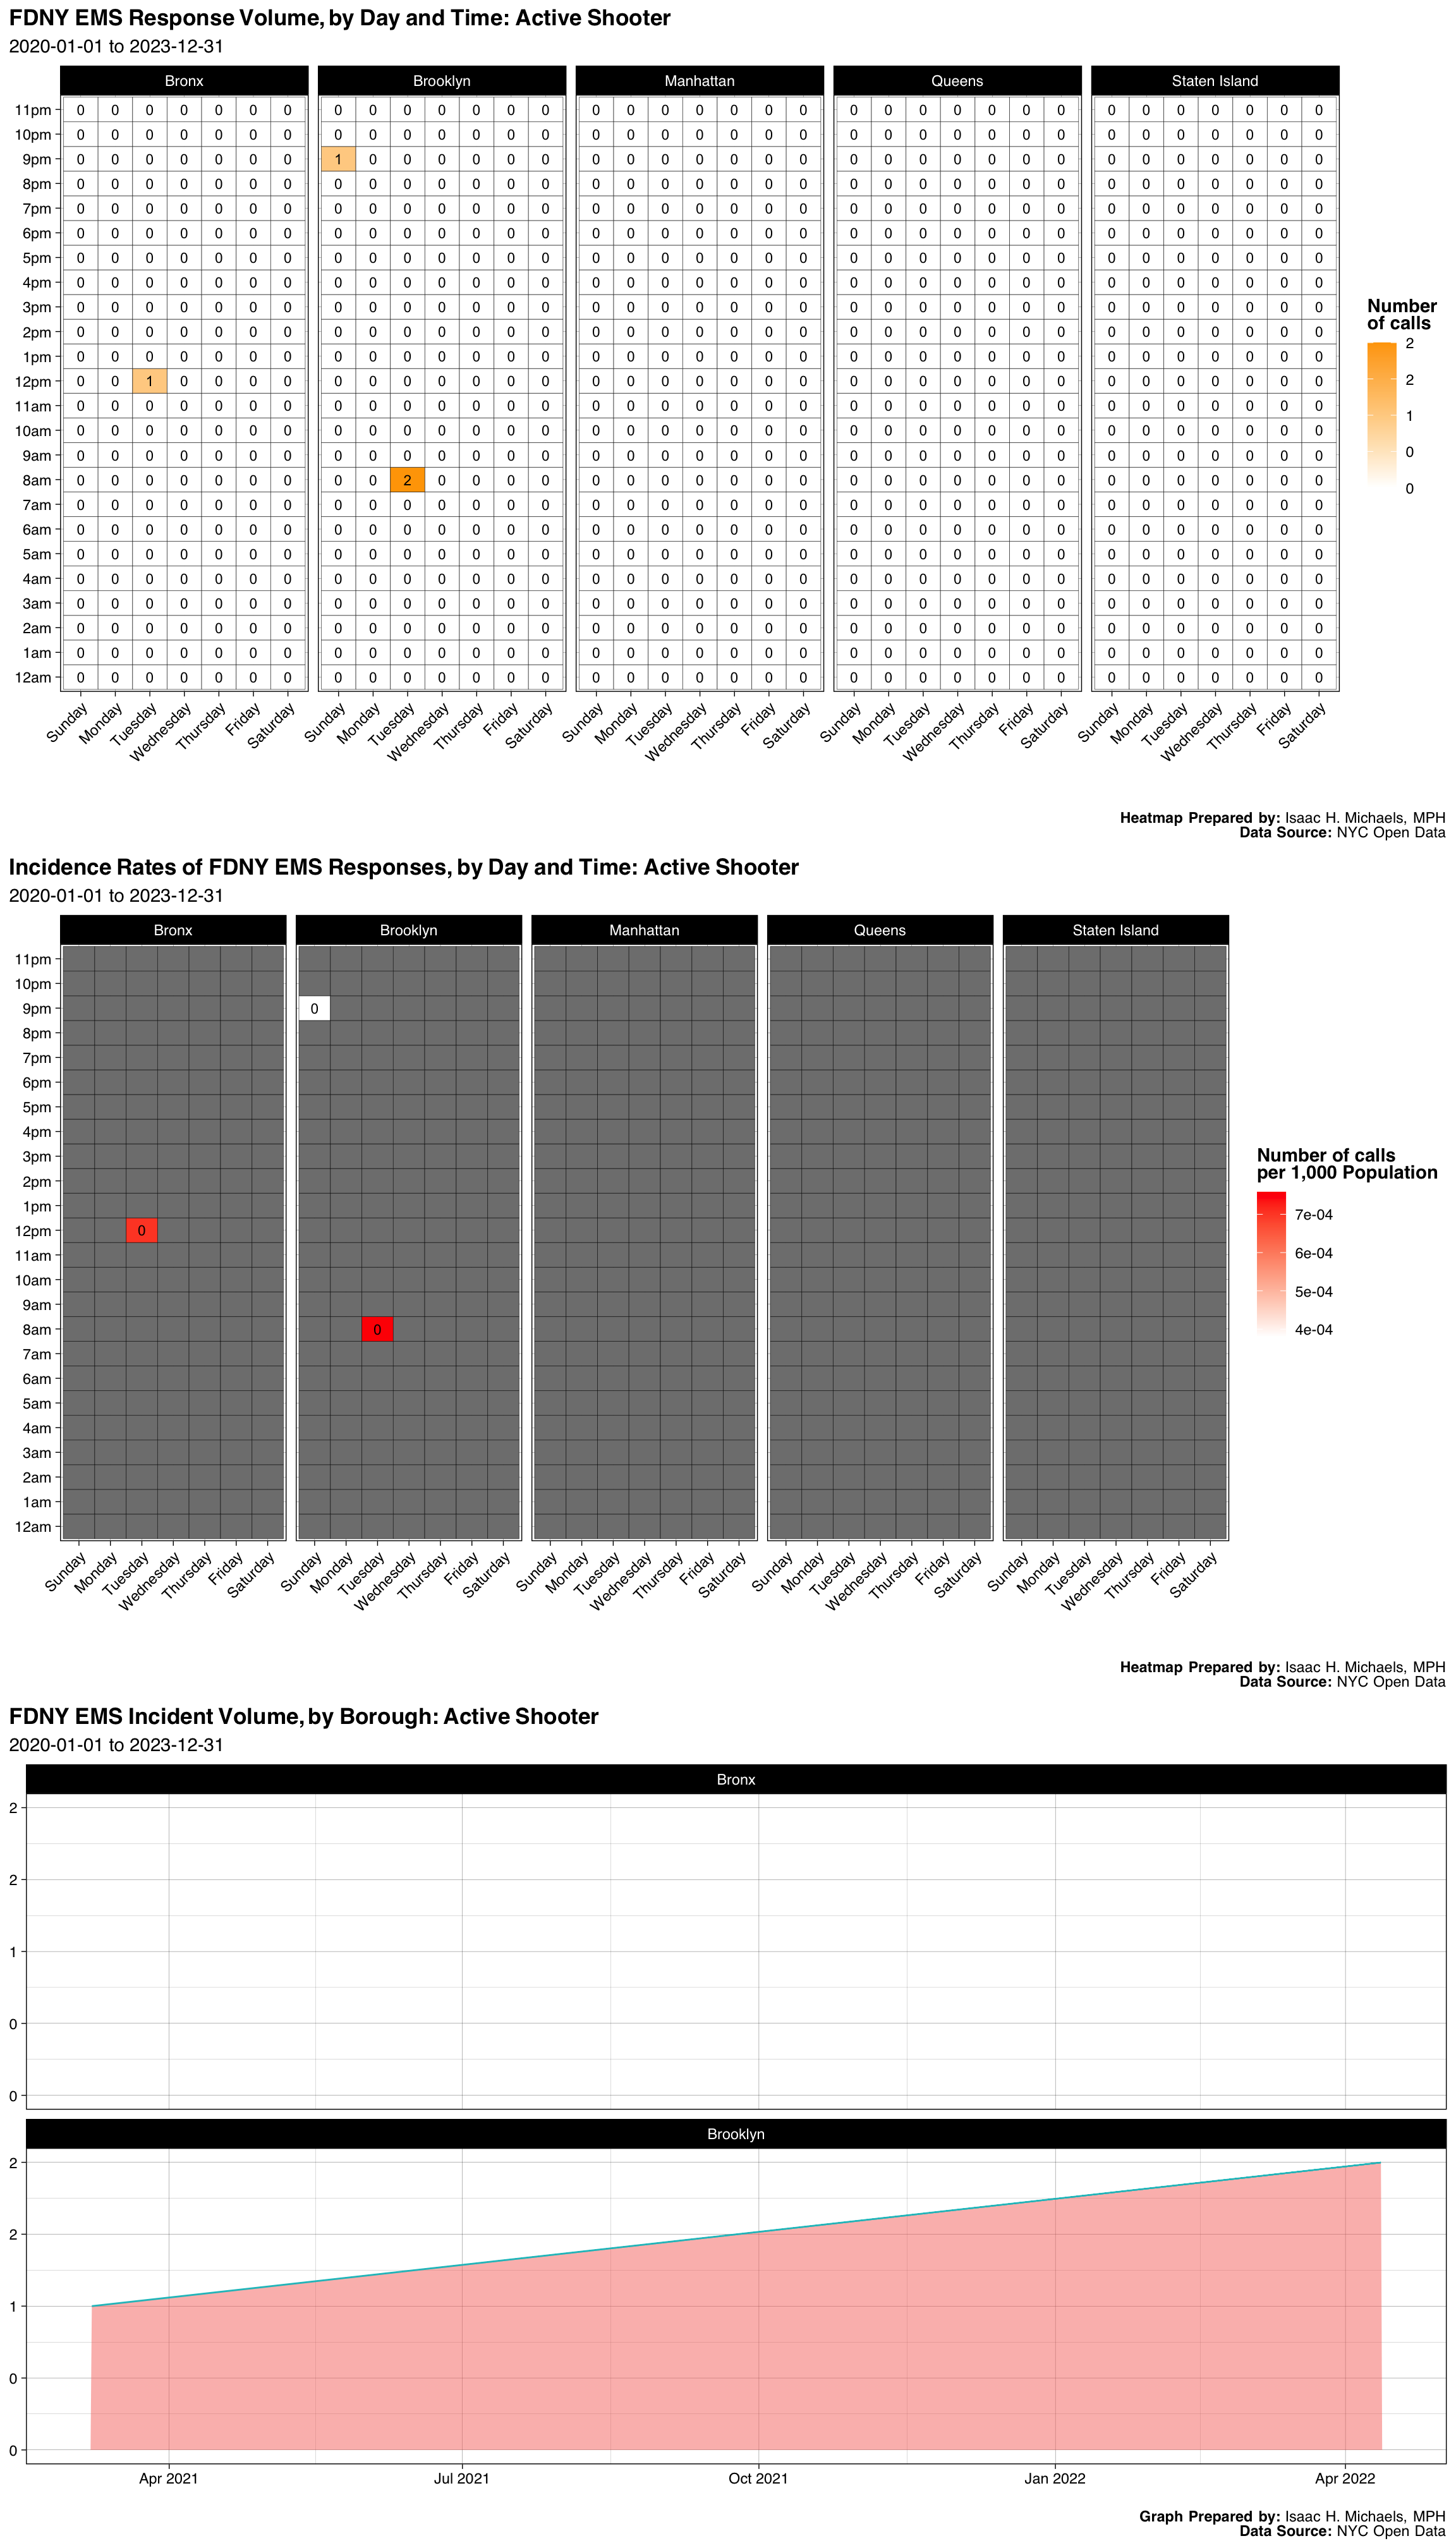
| Borough | Number | Percent |
|---|---|---|
| Bronx | 1 | 0.25 |
| Brooklyn | 3 | 0.75 |
| Final Severity Level | Number | Percent |
|---|---|---|
| 1 | 0 | 0% |
| 2 | 4 | 1 |
| 3 | 0 | 0% |
| 4 | 0 | 0% |
| 5 | 0 | 0% |
| 6 | 0 | 0% |
| 7 | 0 | 0% |
| 8 | 0 | 0% |
| Disposition | Number | Percent |
|---|---|---|
| Transporting Patient | 3 | 0.75 |
| Condition Corrected | 1 | 0.25 |
Graphs, Heatmaps, and Tables Prepared By: Isaac H. Michaels, MPH
Data Source: NYC Open Data
Back to top
Cardiac Arrest Patient Fever/Travel
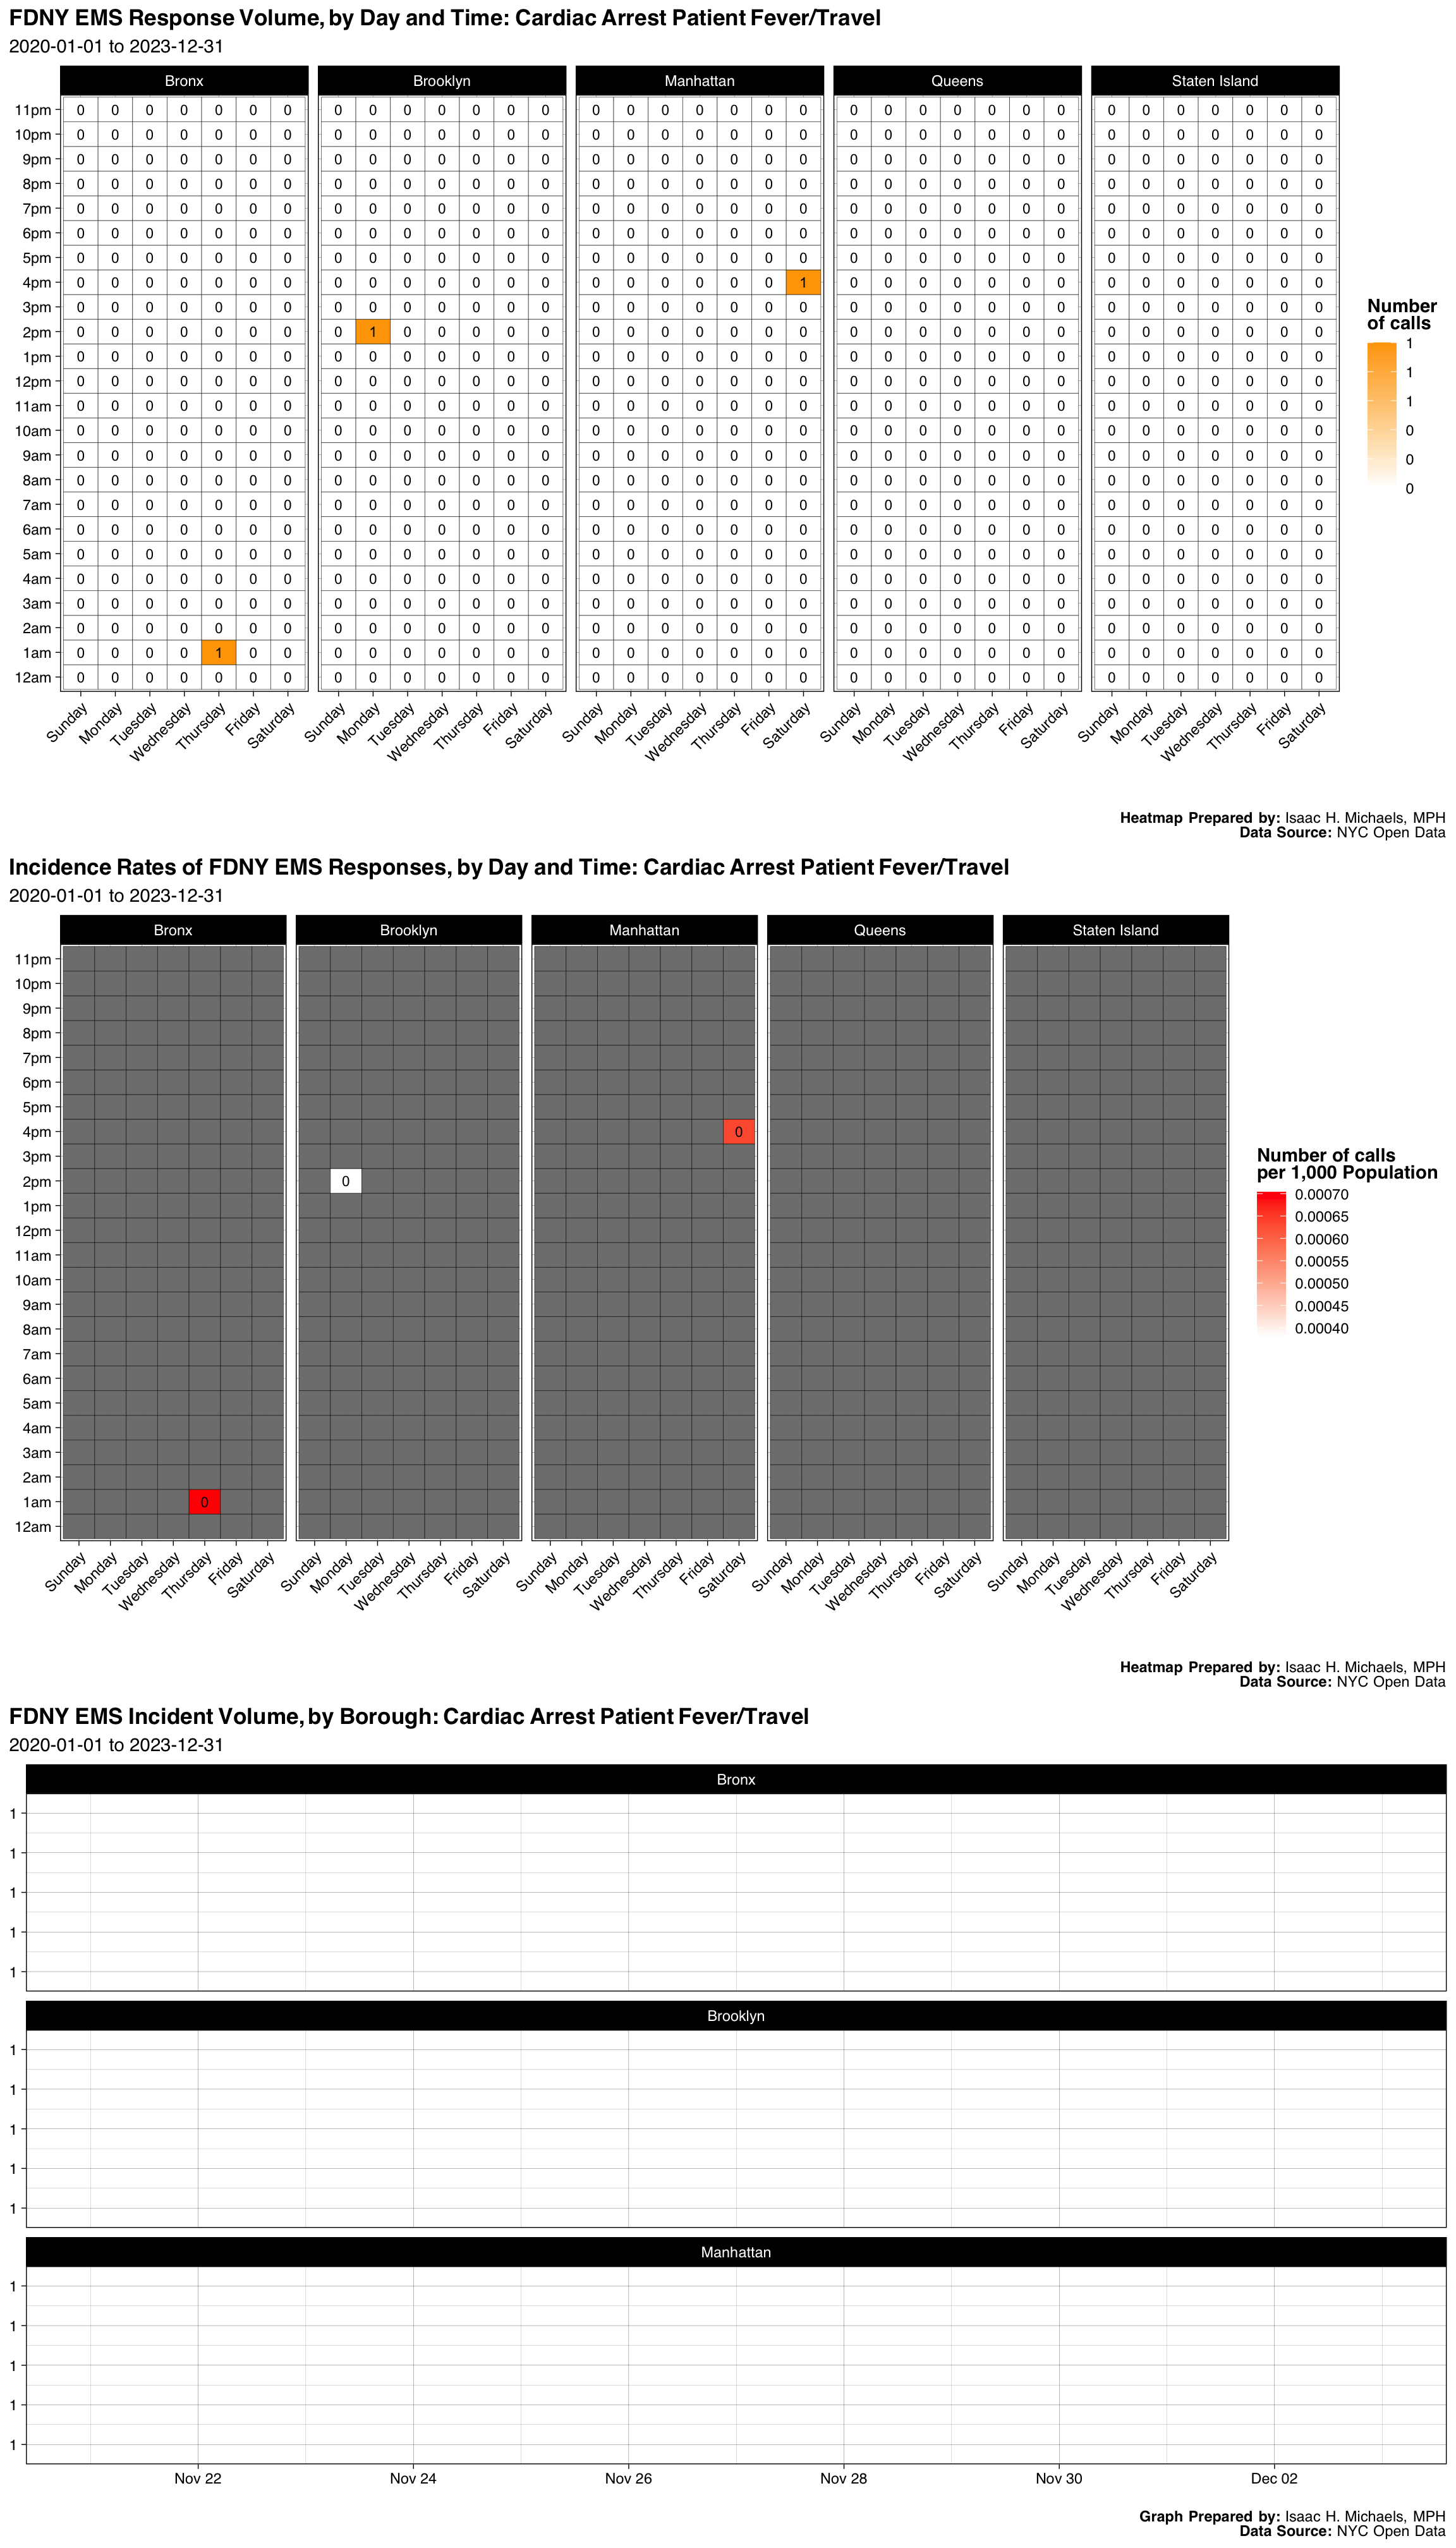
| Borough | Number | Percent |
|---|---|---|
| Bronx | 1 | 0.3333333 |
| Brooklyn | 1 | 0.3333333 |
| Manhattan | 1 | 0.3333333 |
| Final Severity Level | Number | Percent |
|---|---|---|
| 1 | 3 | 1 |
| 2 | 0 | 0% |
| 3 | 0 | 0% |
| 4 | 0 | 0% |
| 5 | 0 | 0% |
| 6 | 0 | 0% |
| 7 | 0 | 0% |
| 8 | 0 | 0% |
| Disposition | Number | Percent |
|---|---|---|
| Patient Pronounced Dead | 2 | 0.6666667 |
| Transporting Patient | 1 | 0.3333333 |
Graphs, Heatmaps, and Tables Prepared By: Isaac H. Michaels, MPH
Data Source: NYC Open Data
Back to top
Criminal Detection Facil Incid
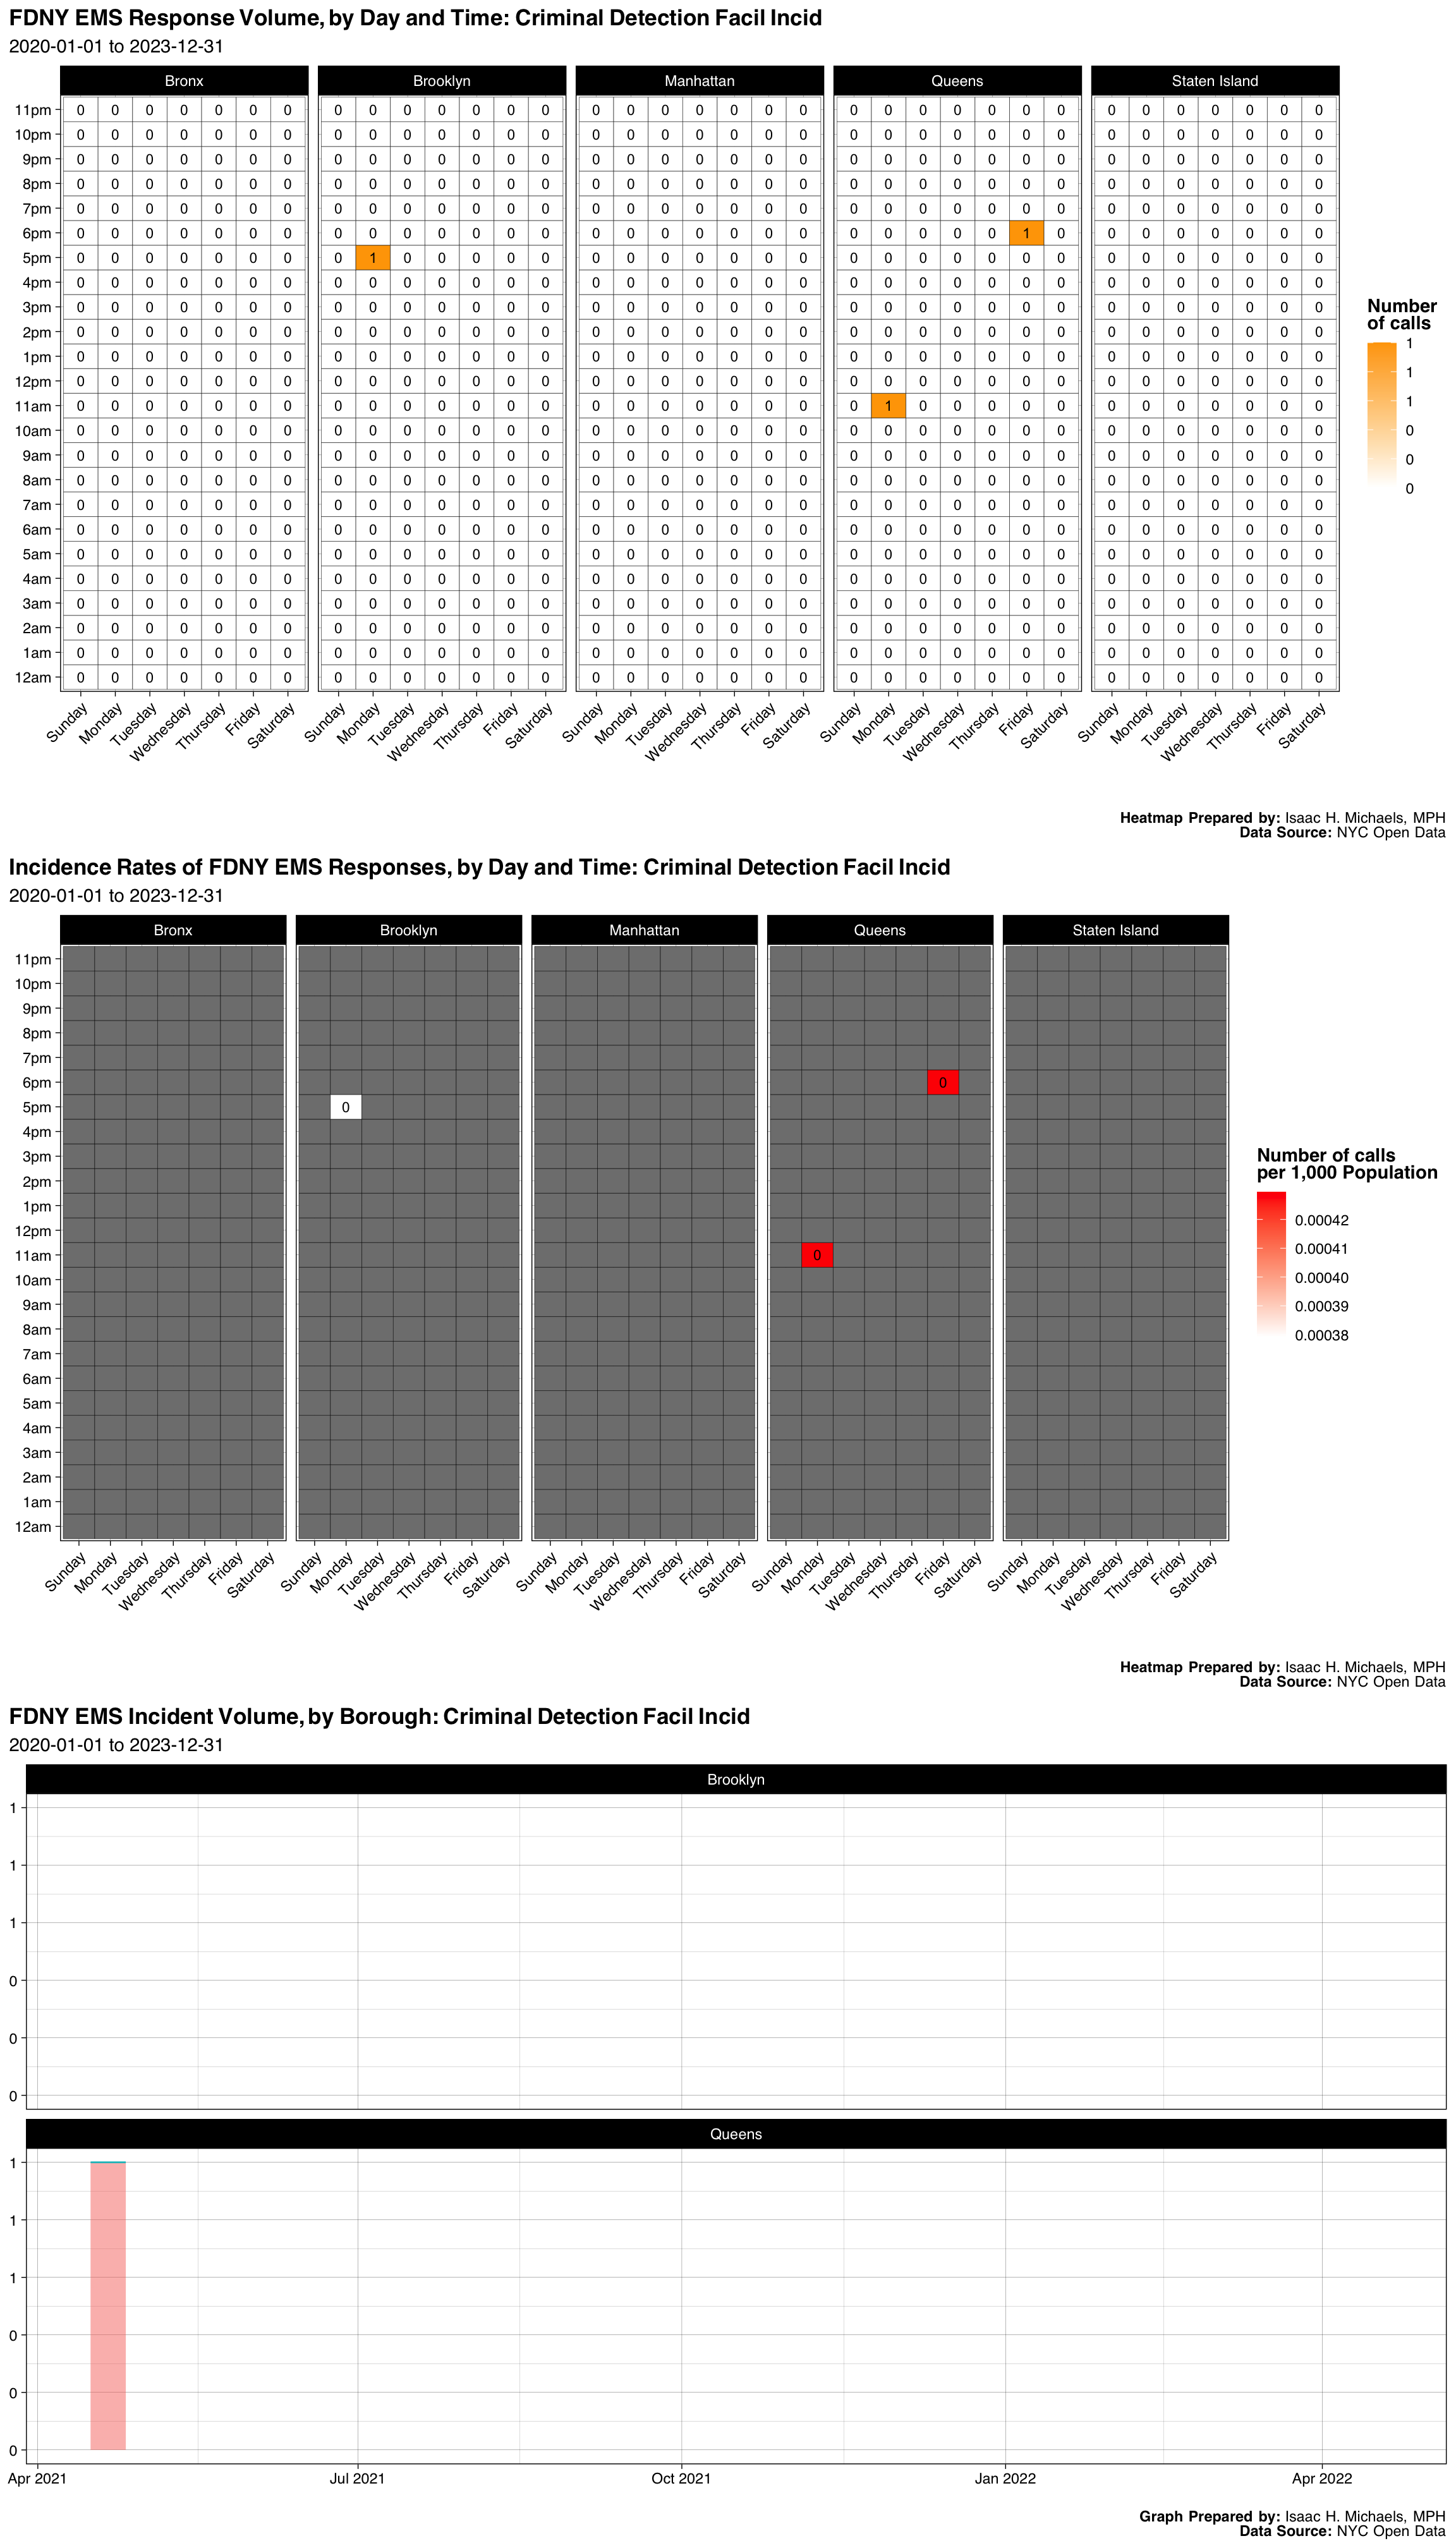
| Borough | Number | Percent |
|---|---|---|
| Brooklyn | 1 | 0.3333333 |
| Queens | 2 | 0.6666667 |
| Final Severity Level | Number | Percent |
|---|---|---|
| 1 | 0 | 0% |
| 2 | 3 | 1 |
| 3 | 0 | 0% |
| 4 | 0 | 0% |
| 5 | 0 | 0% |
| 6 | 0 | 0% |
| 7 | 0 | 0% |
| 8 | 0 | 0% |
| Disposition | Number | Percent |
|---|---|---|
| Transporting Patient | 3 | 1 |
Graphs, Heatmaps, and Tables Prepared By: Isaac H. Michaels, MPH
Data Source: NYC Open Data
Back to top
Pediatric Fiver
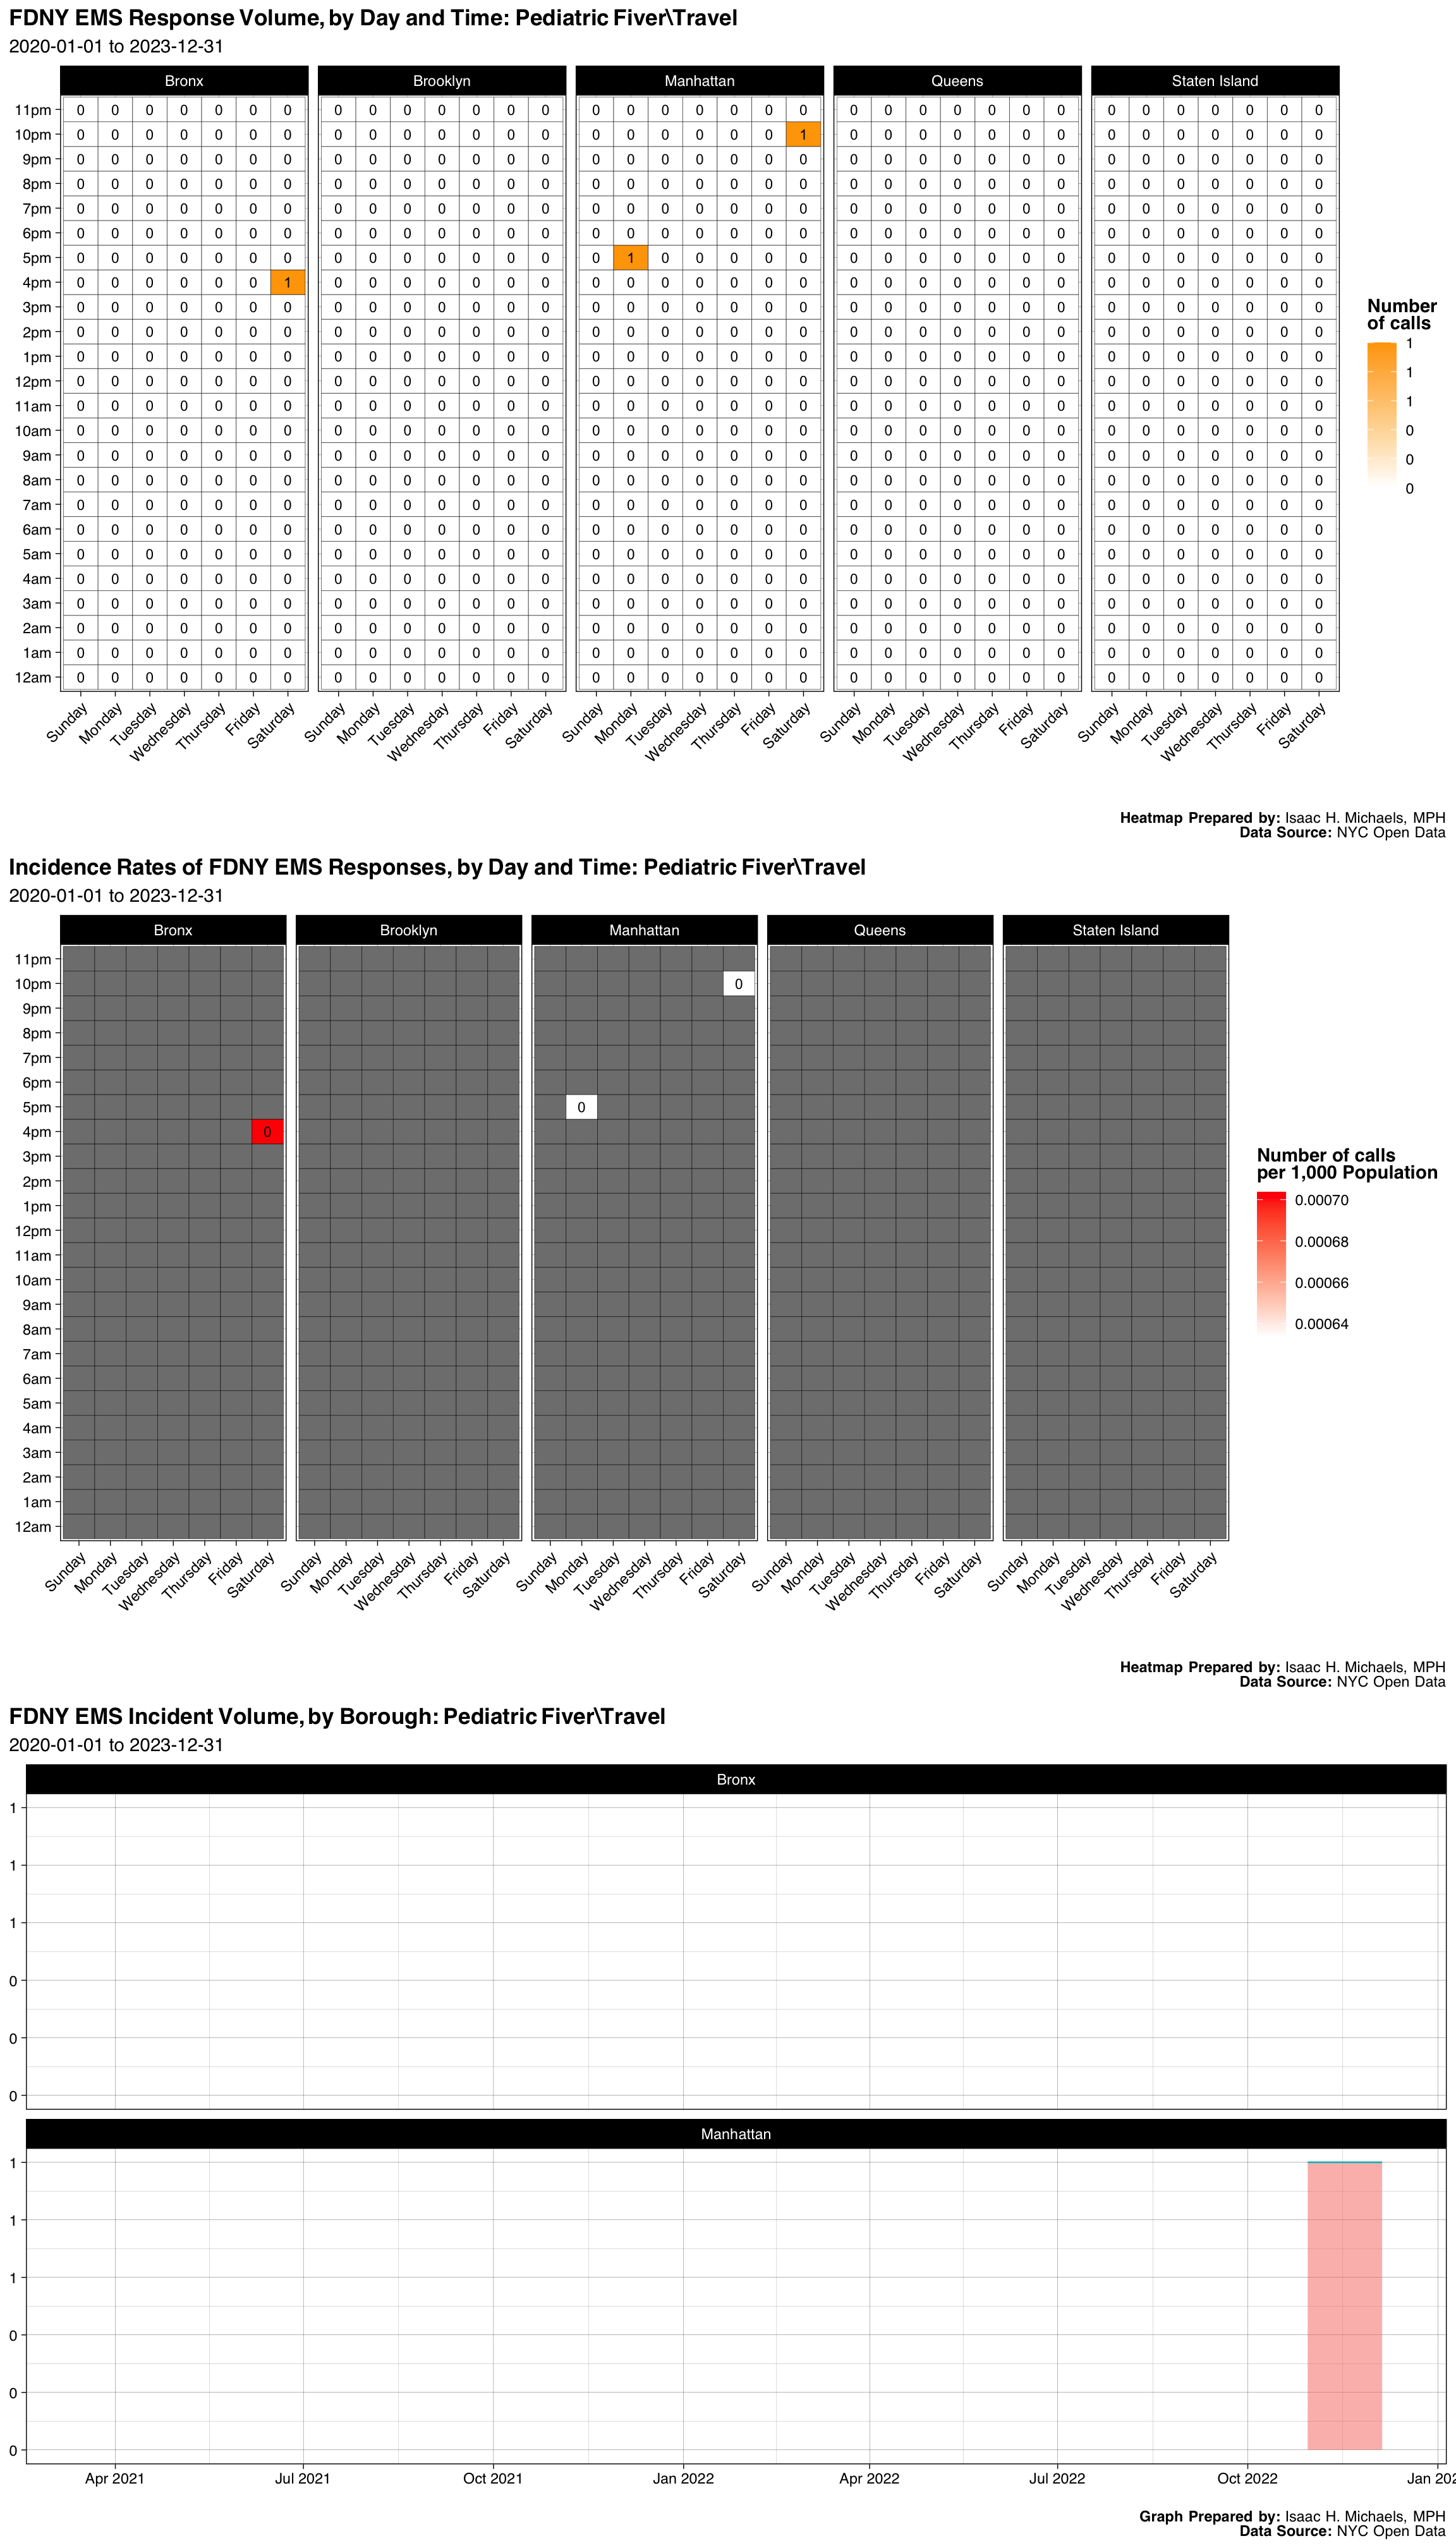
| Borough | Number | Percent |
|---|---|---|
| Bronx | 1 | 0.3333333 |
| Manhattan | 2 | 0.6666667 |
| Final Severity Level | Number | Percent |
|---|---|---|
| 1 | 0 | 0% |
| 2 | 0 | 0% |
| 3 | 3 | 1 |
| 4 | 0 | 0% |
| 5 | 0 | 0% |
| 6 | 0 | 0% |
| 7 | 0 | 0% |
| 8 | 0 | 0% |
| Disposition | Number | Percent |
|---|---|---|
| Transporting Patient | 3 | 1 |
Graphs, Heatmaps, and Tables Prepared By: Isaac H. Michaels, MPH
Data Source: NYC Open Data
Back to top
Unconscious Fever/Travel Patient
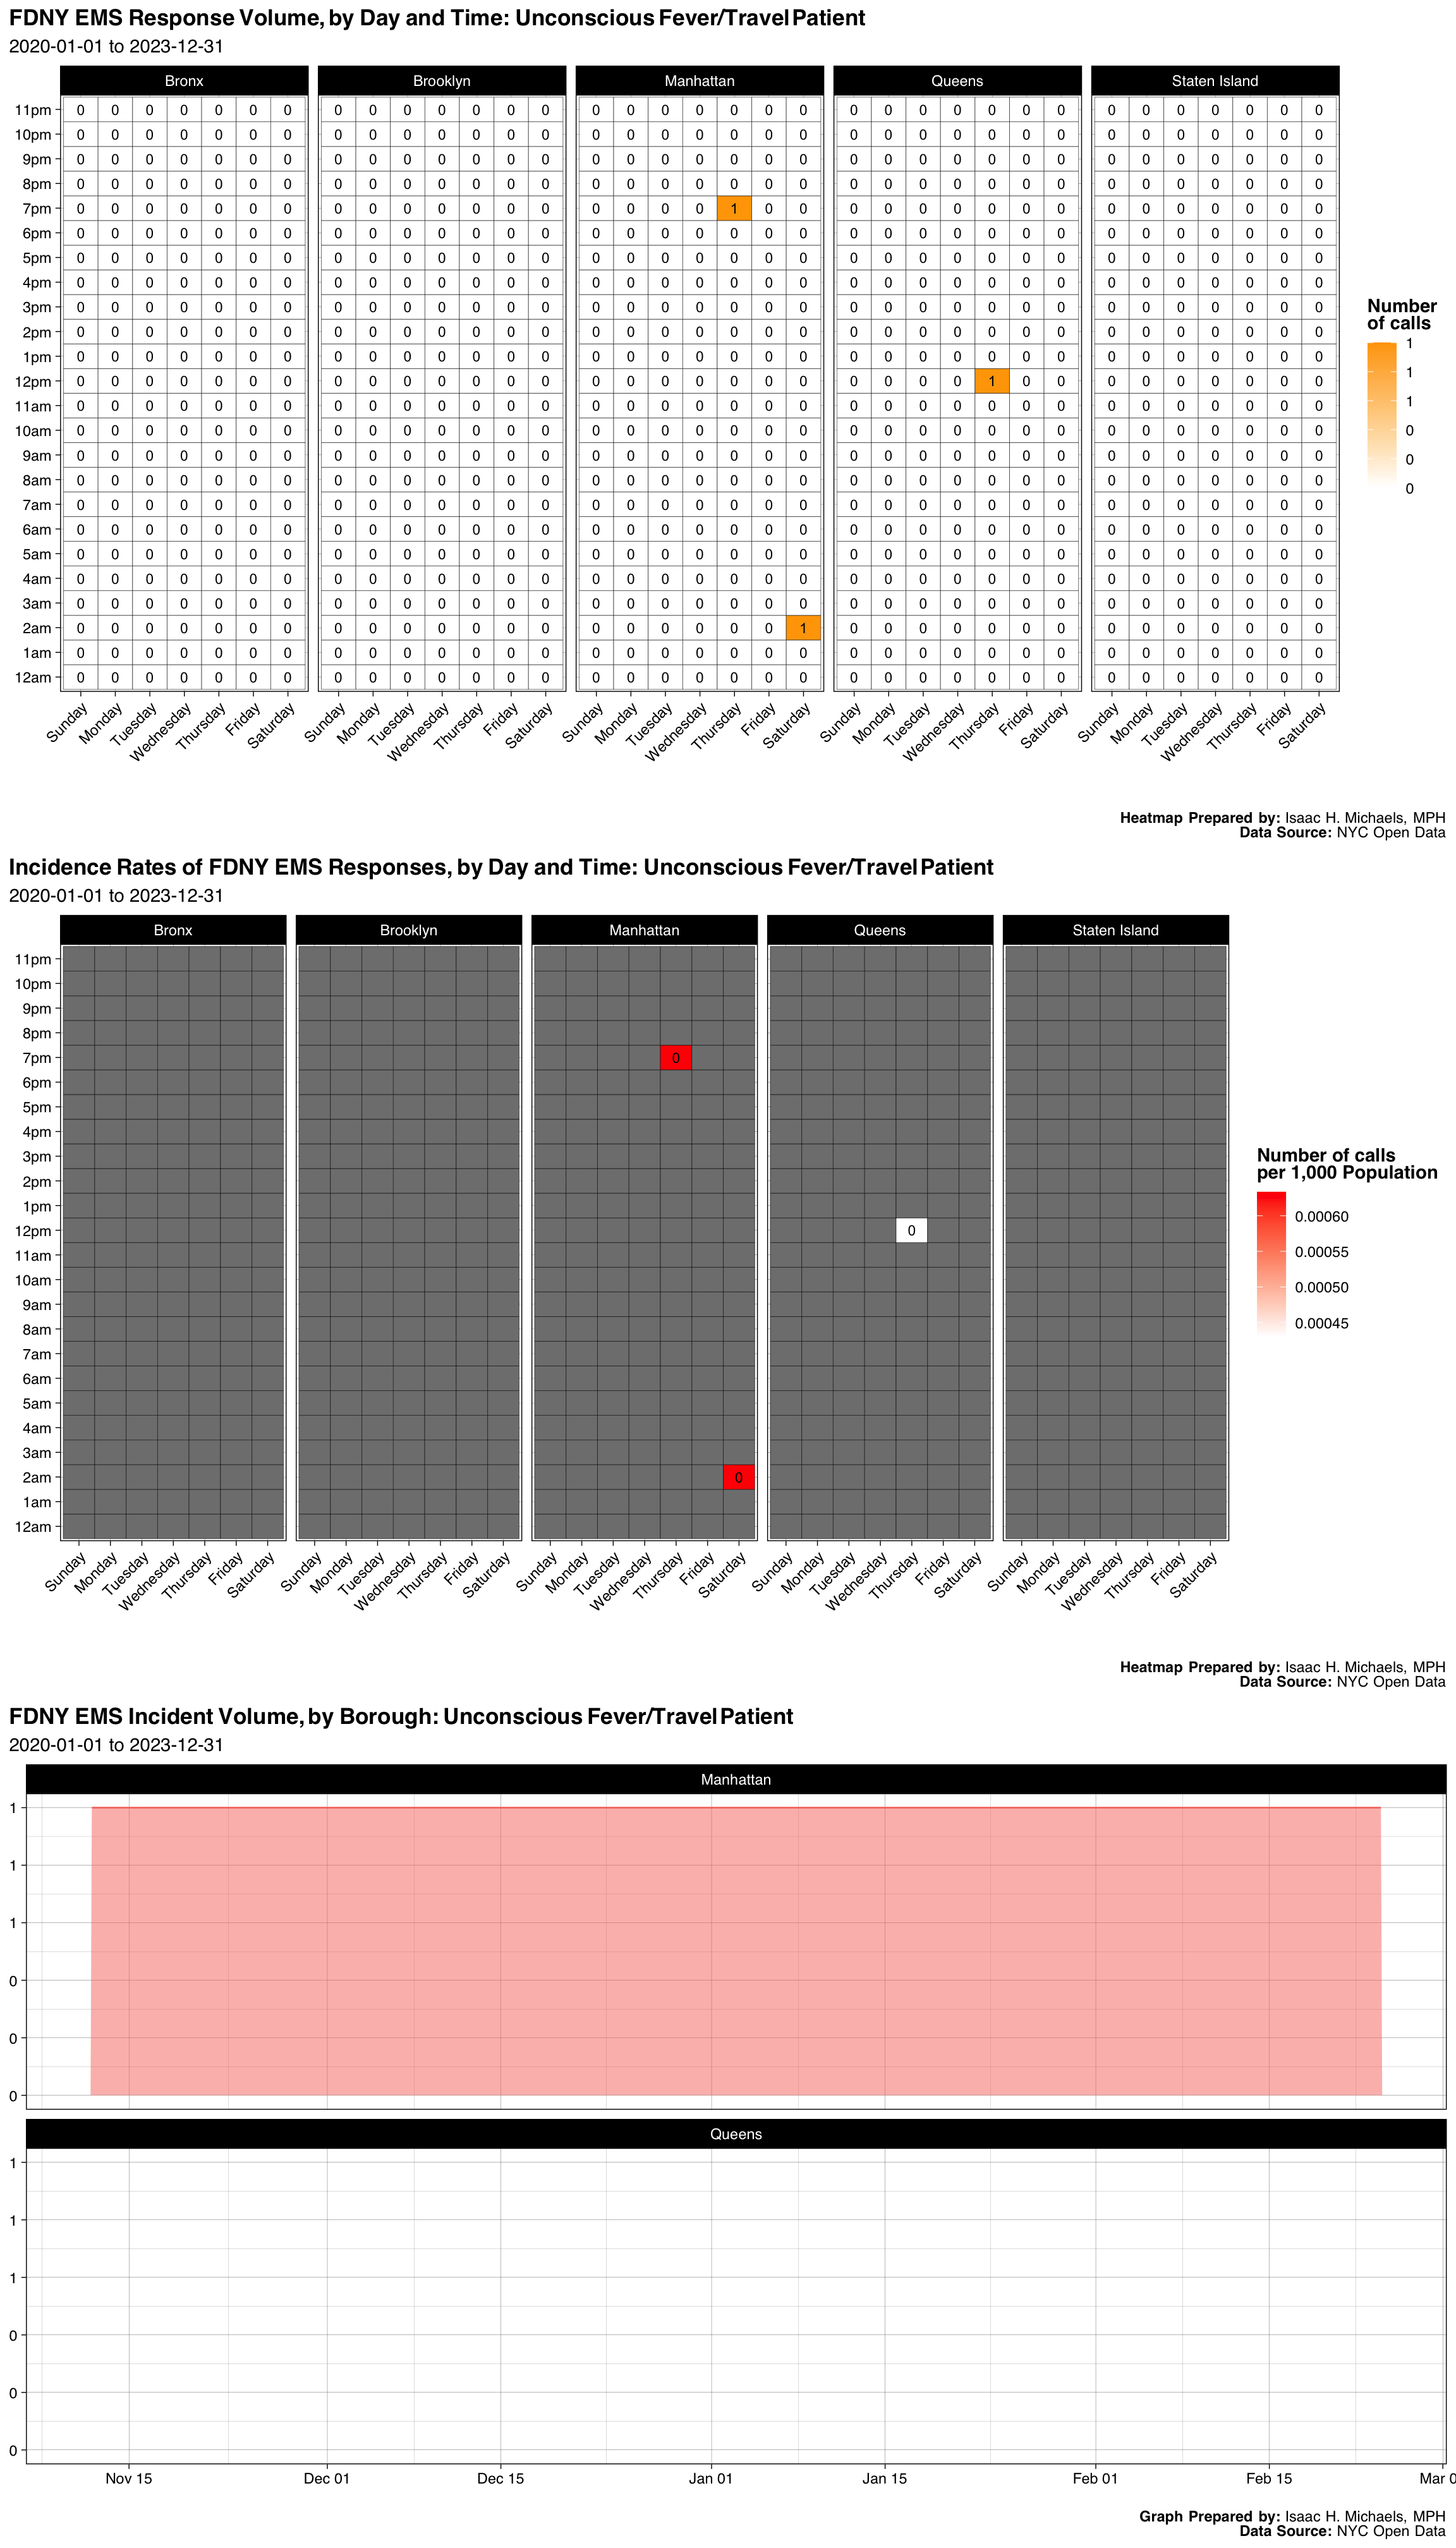
| Borough | Number | Percent |
|---|---|---|
| Manhattan | 2 | 0.6666667 |
| Queens | 1 | 0.3333333 |
| Final Severity Level | Number | Percent |
|---|---|---|
| 1 | 0 | 0% |
| 2 | 3 | 1 |
| 3 | 0 | 0% |
| 4 | 0 | 0% |
| 5 | 0 | 0% |
| 6 | 0 | 0% |
| 7 | 0 | 0% |
| 8 | 0 | 0% |
| Disposition | Number | Percent |
|---|---|---|
| Refused Medical Aid | 2 | 0.6666667 |
| Transporting Patient | 1 | 0.3333333 |
Graphs, Heatmaps, and Tables Prepared By: Isaac H. Michaels, MPH
Data Source: NYC Open Data
Back to top
Anaphylactic Fever/Travel
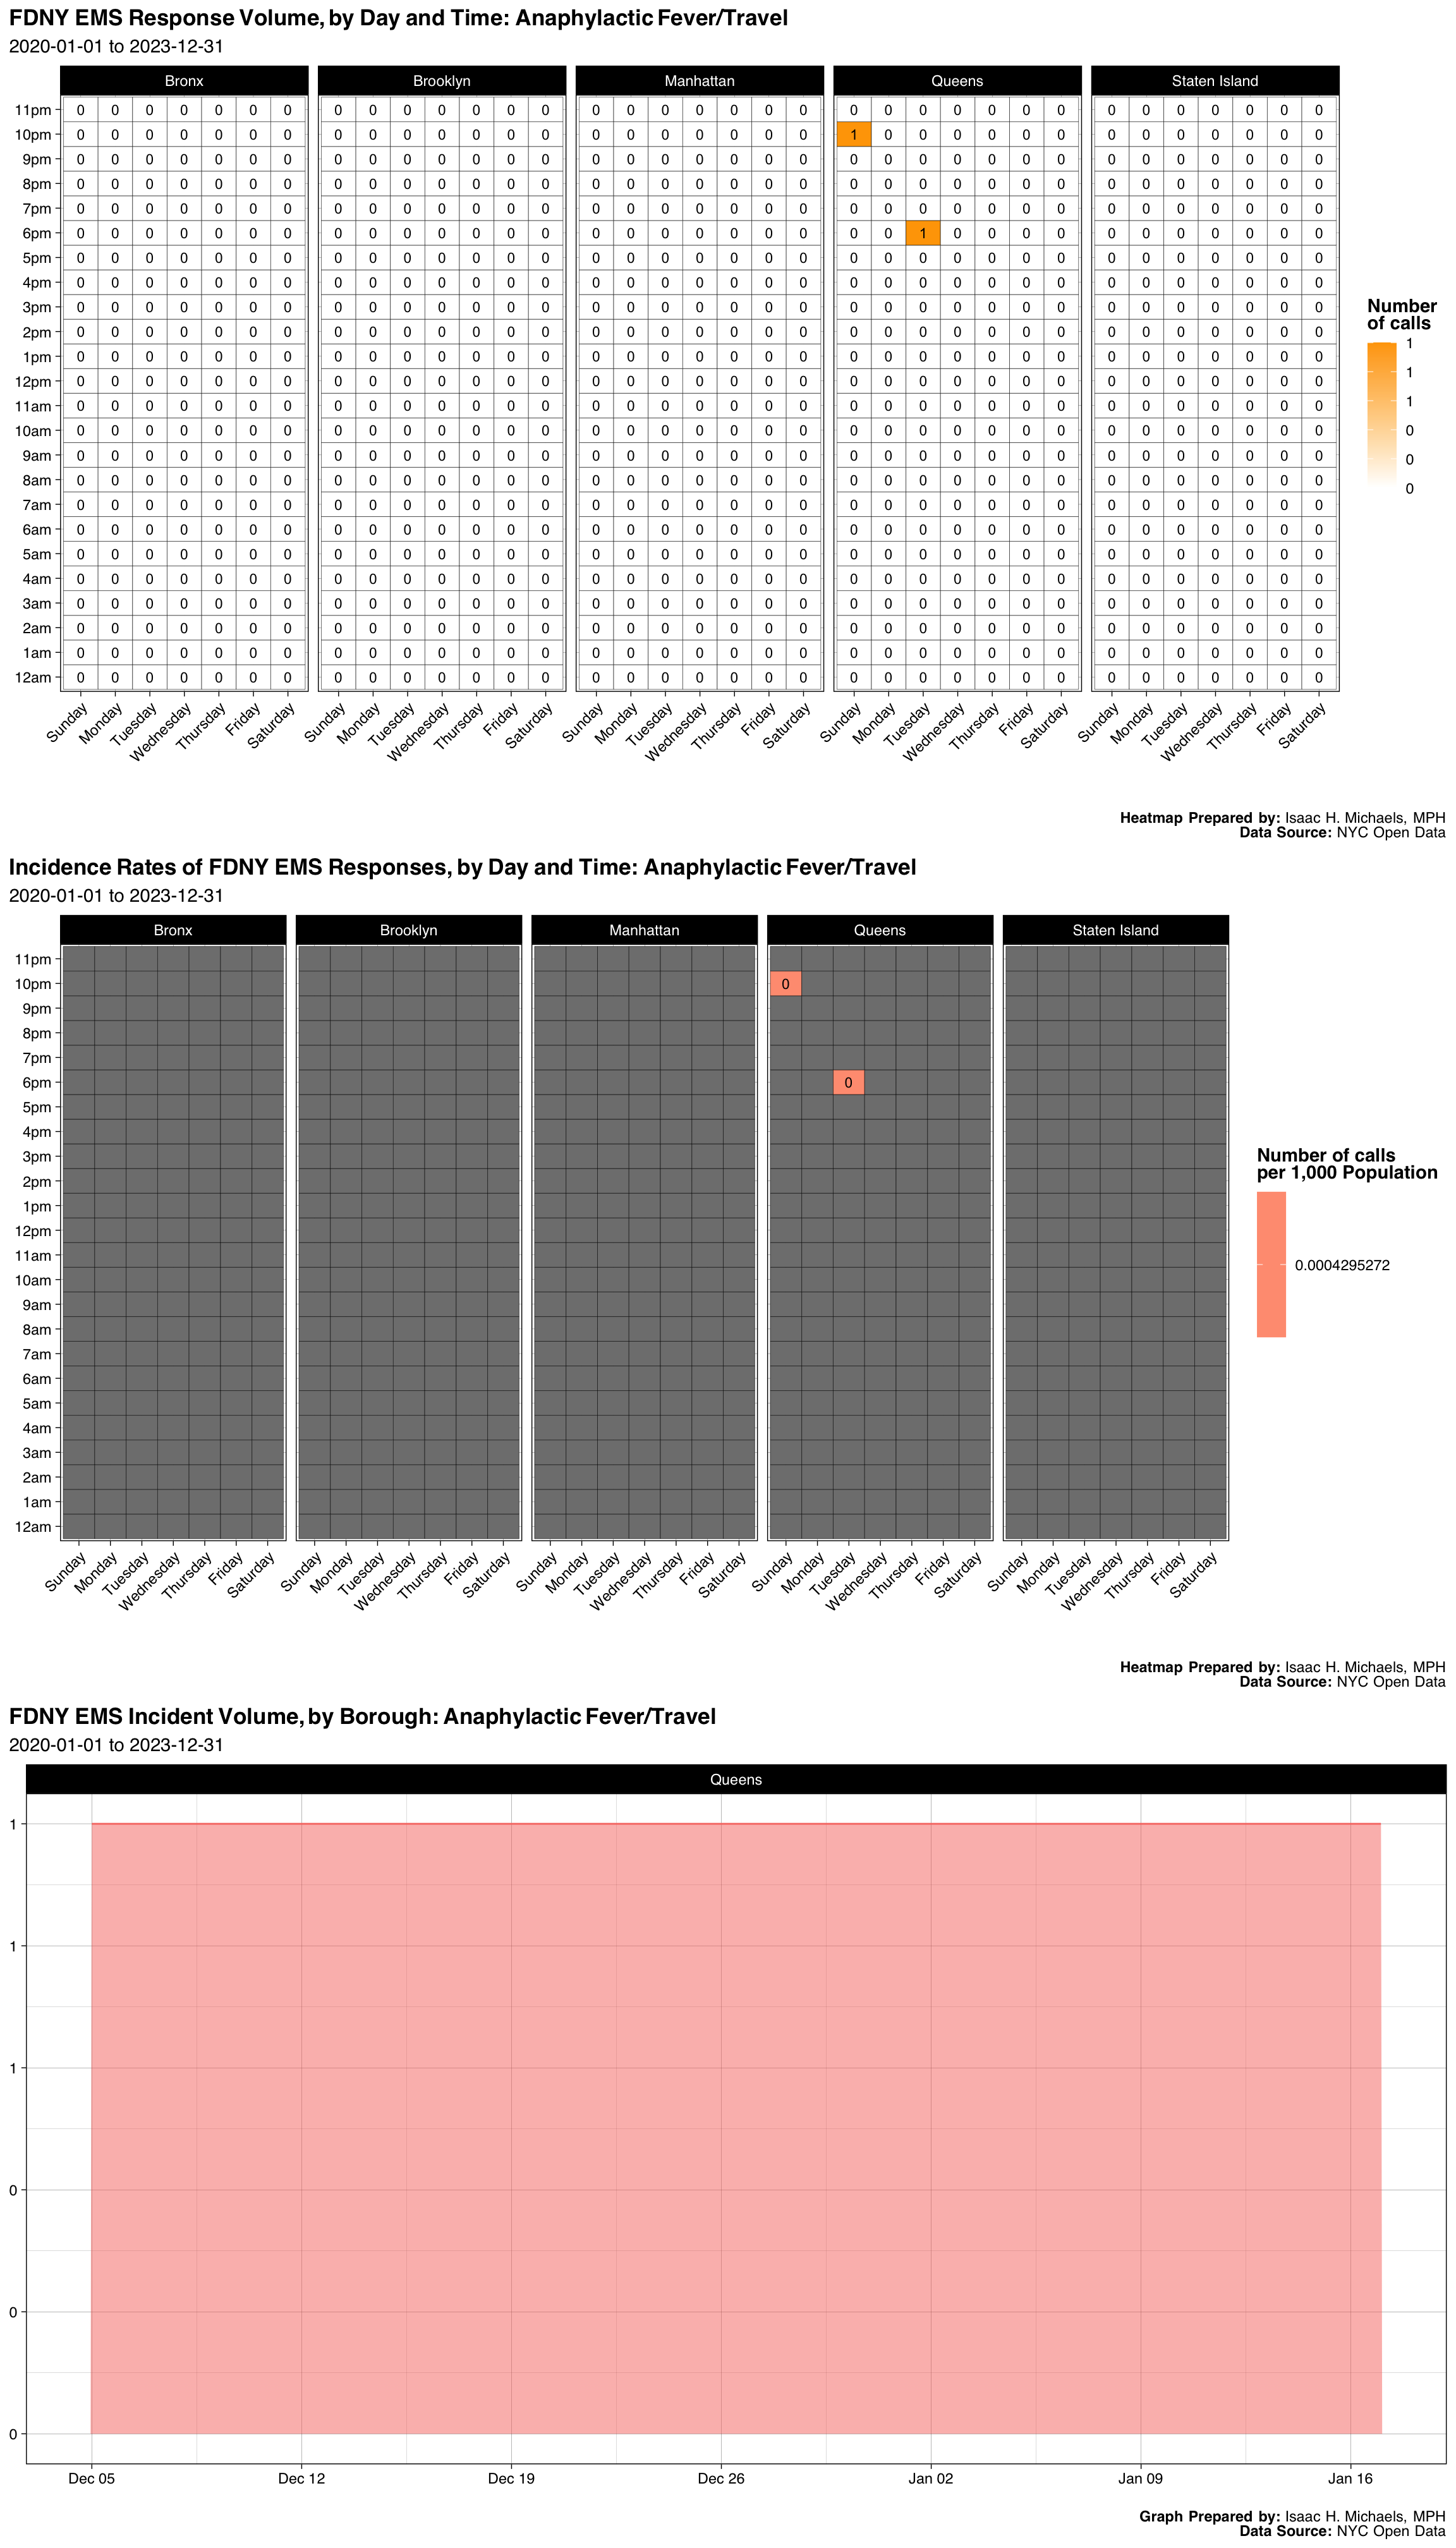
| Borough | Number | Percent |
|---|---|---|
| Queens | 2 | 1 |
| Final Severity Level | Number | Percent |
|---|---|---|
| 1 | 0 | 0% |
| 2 | 2 | 1 |
| 3 | 0 | 0% |
| 4 | 0 | 0% |
| 5 | 0 | 0% |
| 6 | 0 | 0% |
| 7 | 0 | 0% |
| 8 | 0 | 0% |
| Disposition | Number | Percent |
|---|---|---|
| Cancelled | 1 | 0.5 |
| Refused Medical Aid | 1 | 0.5 |
Graphs, Heatmaps, and Tables Prepared By: Isaac H. Michaels, MPH
Data Source: NYC Open Data
Back to top
Asthma Patient Fever/Travel
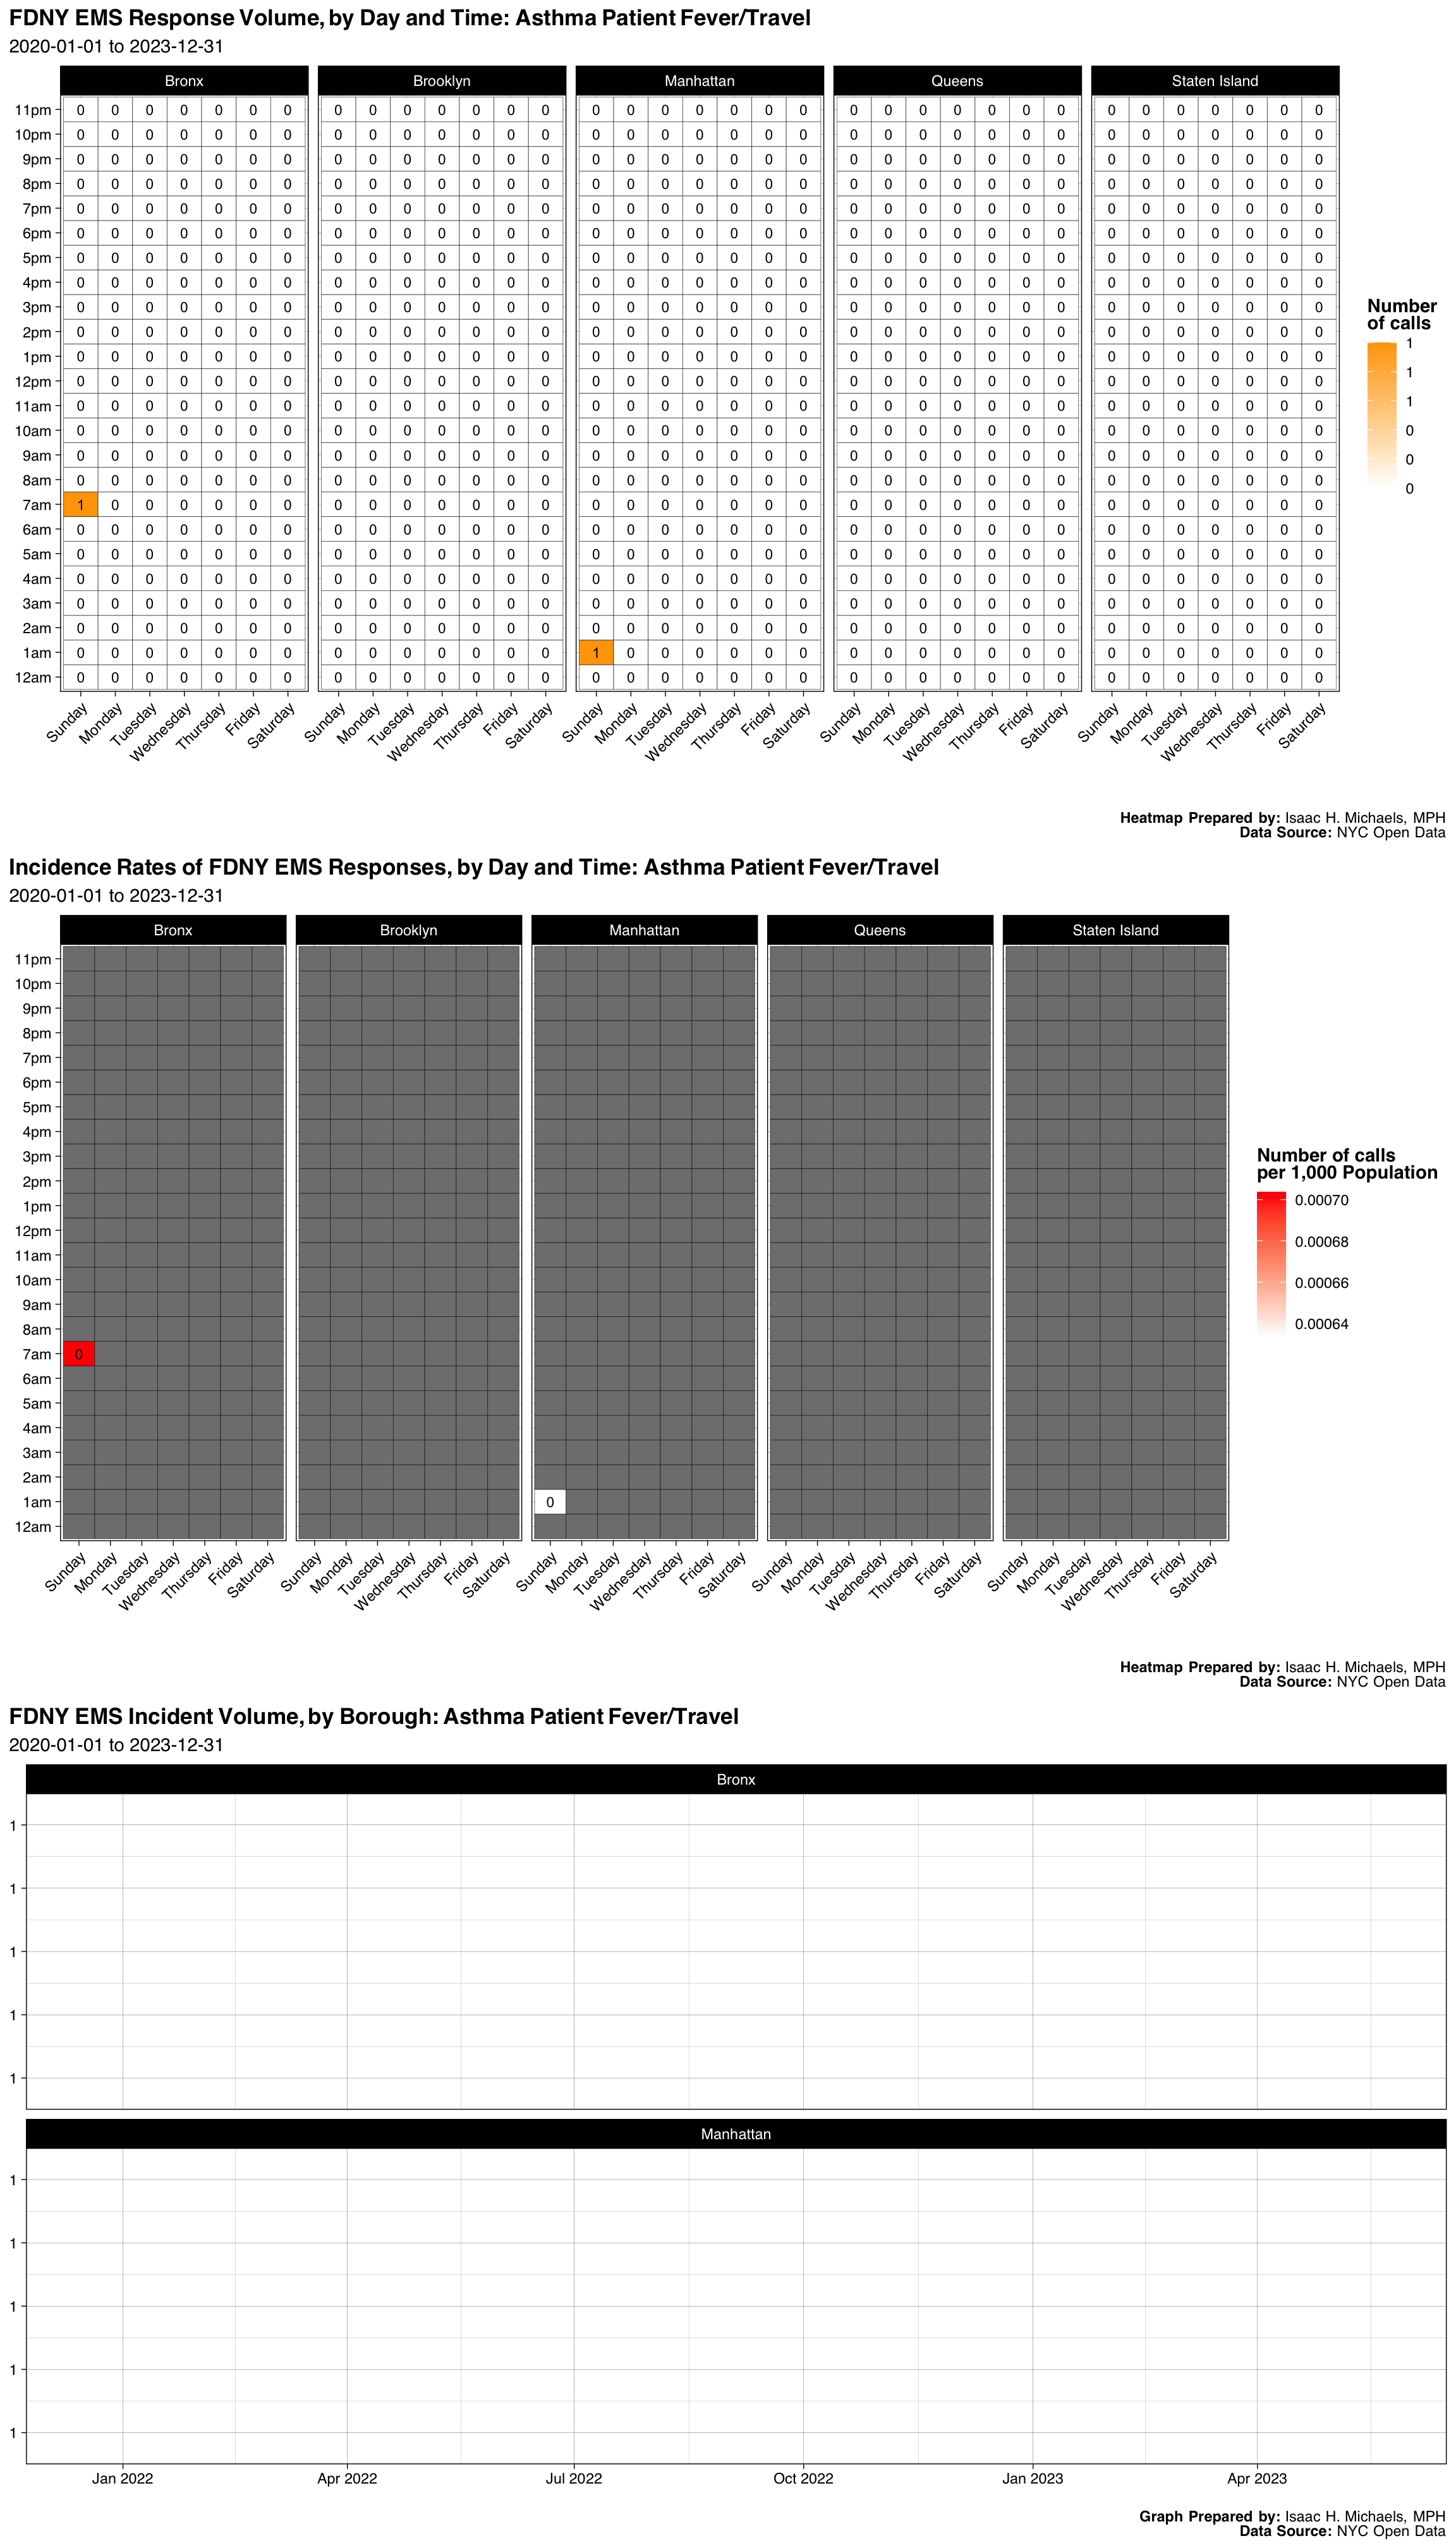
| Borough | Number | Percent |
|---|---|---|
| Bronx | 1 | 0.5 |
| Manhattan | 1 | 0.5 |
| Final Severity Level | Number | Percent |
|---|---|---|
| 1 | 0 | 0% |
| 2 | 2 | 1 |
| 3 | 0 | 0% |
| 4 | 0 | 0% |
| 5 | 0 | 0% |
| 6 | 0 | 0% |
| 7 | 0 | 0% |
| 8 | 0 | 0% |
| Disposition | Number | Percent |
|---|---|---|
| Transporting Patient | 2 | 1 |
Graphs, Heatmaps, and Tables Prepared By: Isaac H. Michaels, MPH
Data Source: NYC Open Data
Back to top
Mci40
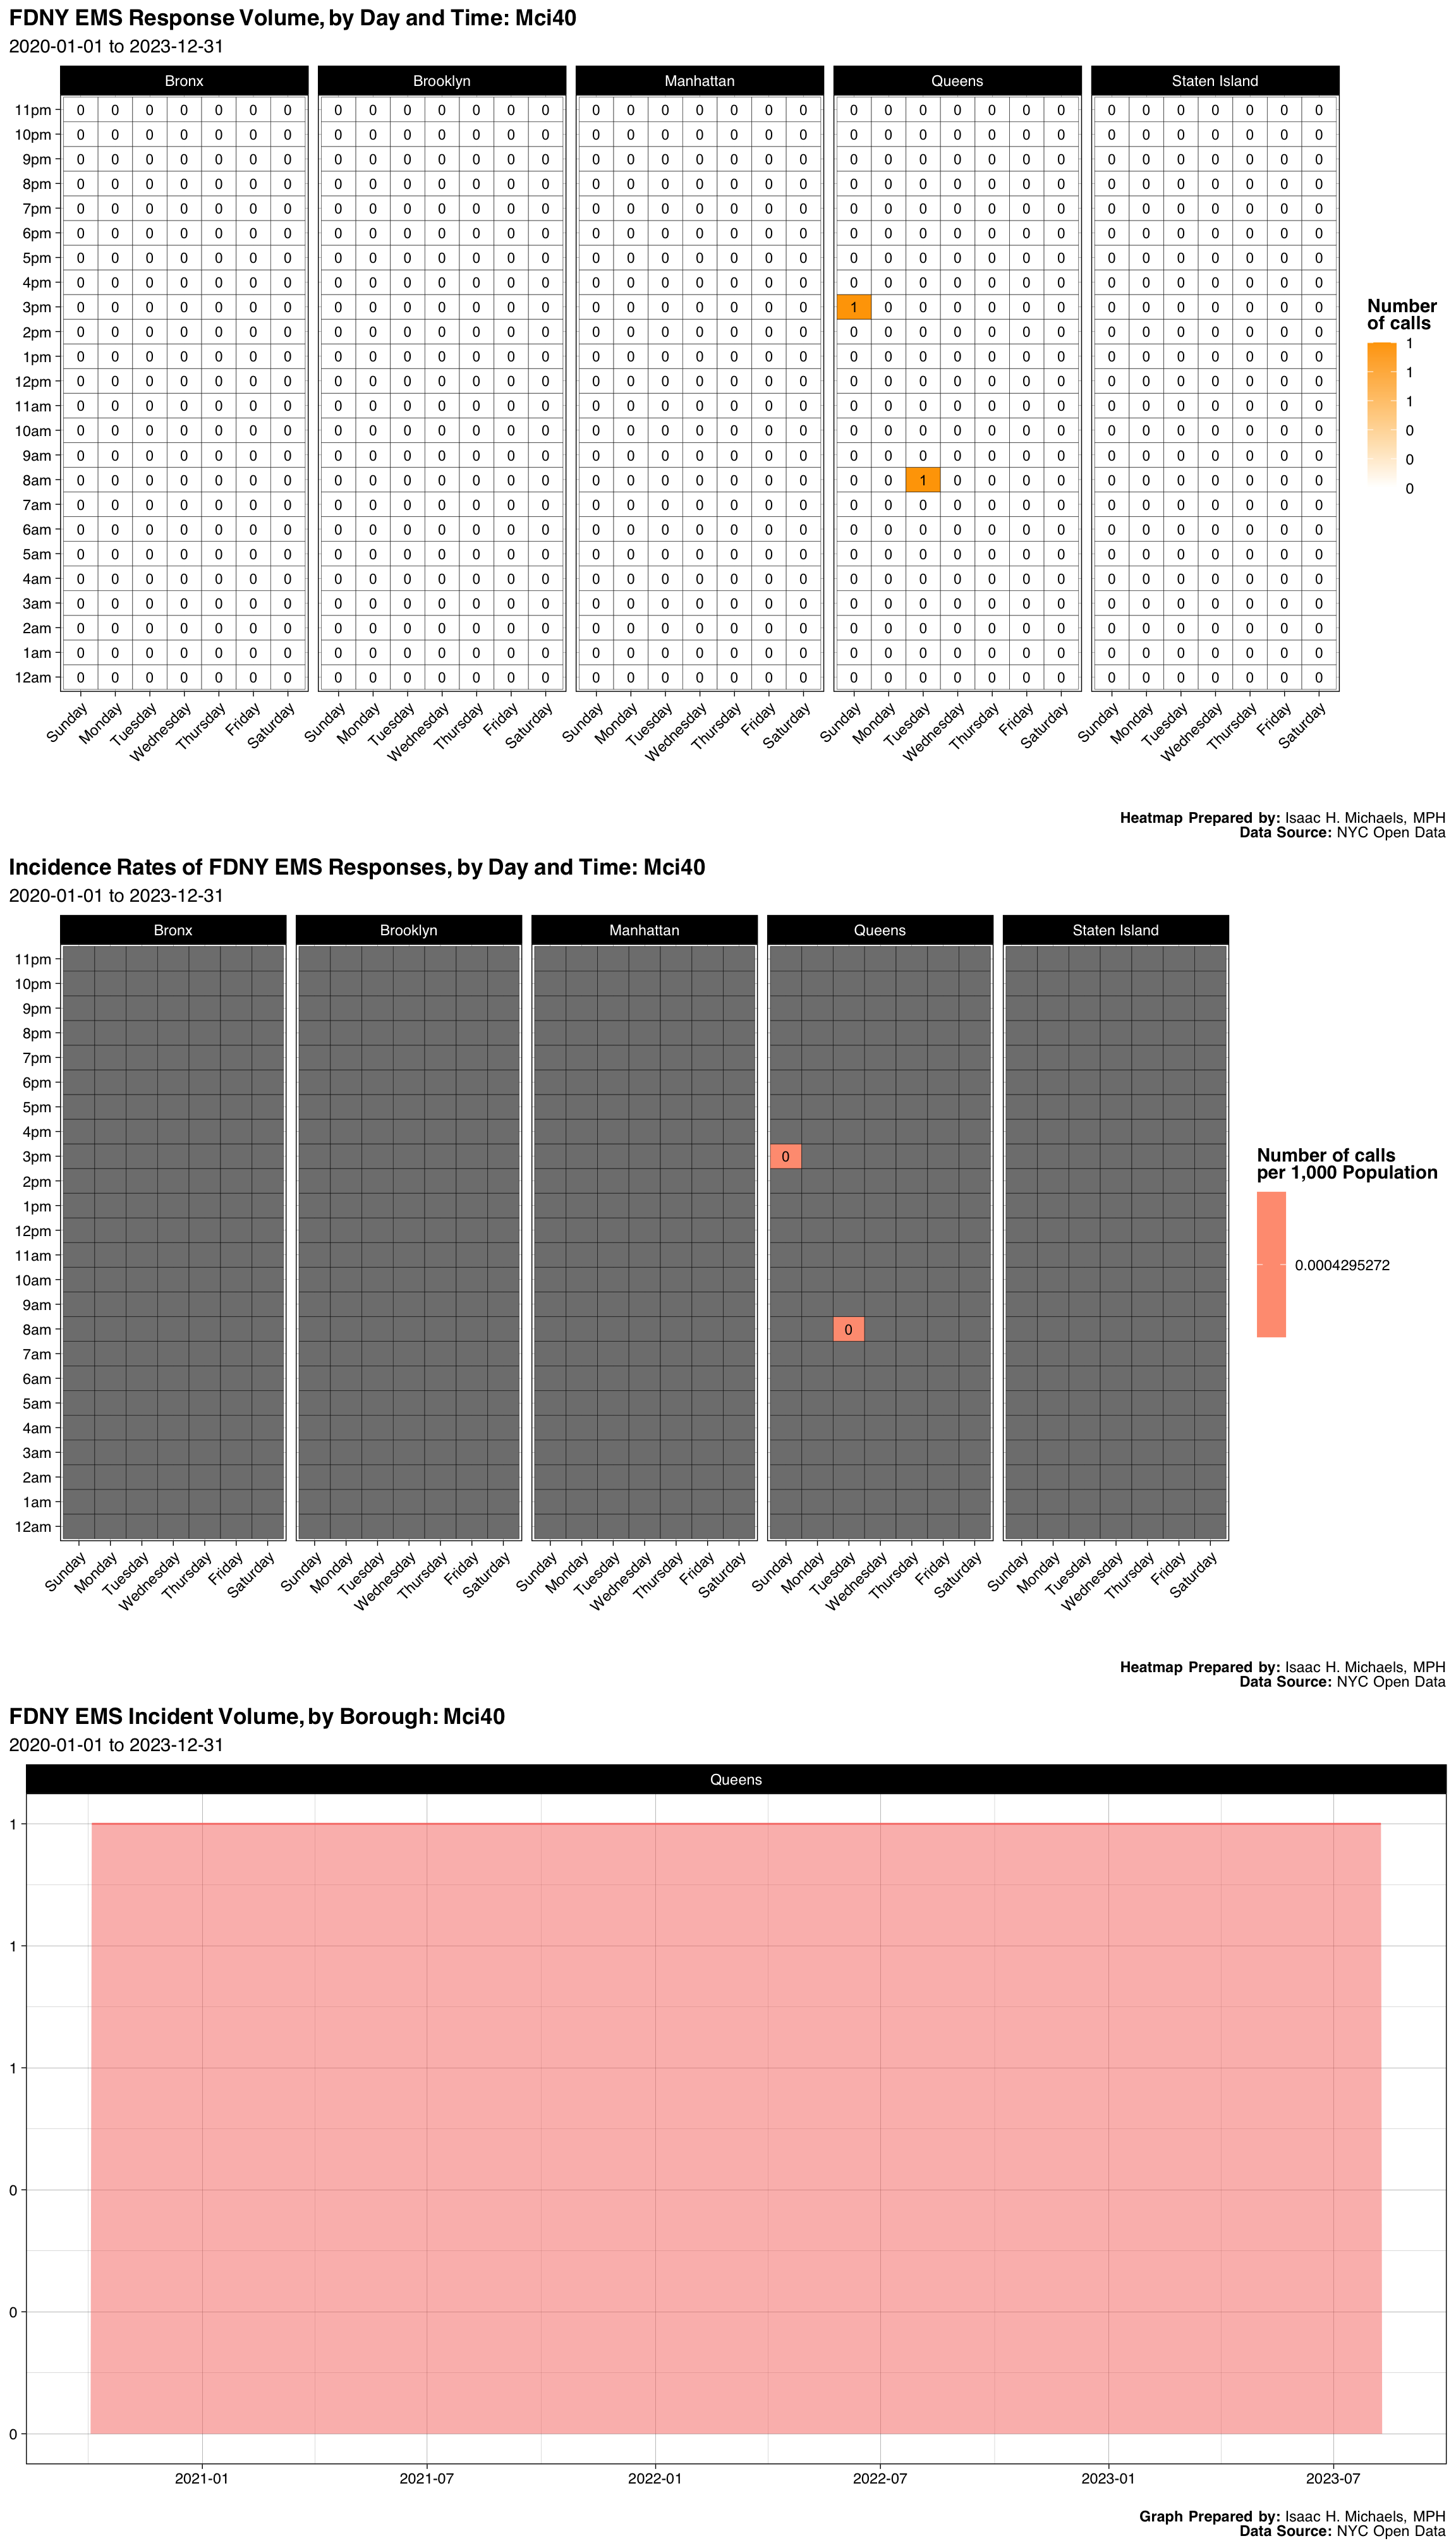
| Borough | Number | Percent |
|---|---|---|
| Queens | 2 | 1 |
| Final Severity Level | Number | Percent |
|---|---|---|
| 1 | 0 | 0% |
| 2 | 2 | 1 |
| 3 | 0 | 0% |
| 4 | 0 | 0% |
| 5 | 0 | 0% |
| 6 | 0 | 0% |
| 7 | 0 | 0% |
| 8 | 0 | 0% |
| Disposition | Number | Percent |
|---|---|---|
| Cancelled | 1 | 0.5 |
| Transporting Patient | 1 | 0.5 |
Graphs, Heatmaps, and Tables Prepared By: Isaac H. Michaels, MPH
Data Source: NYC Open Data
Back to top
Mci57
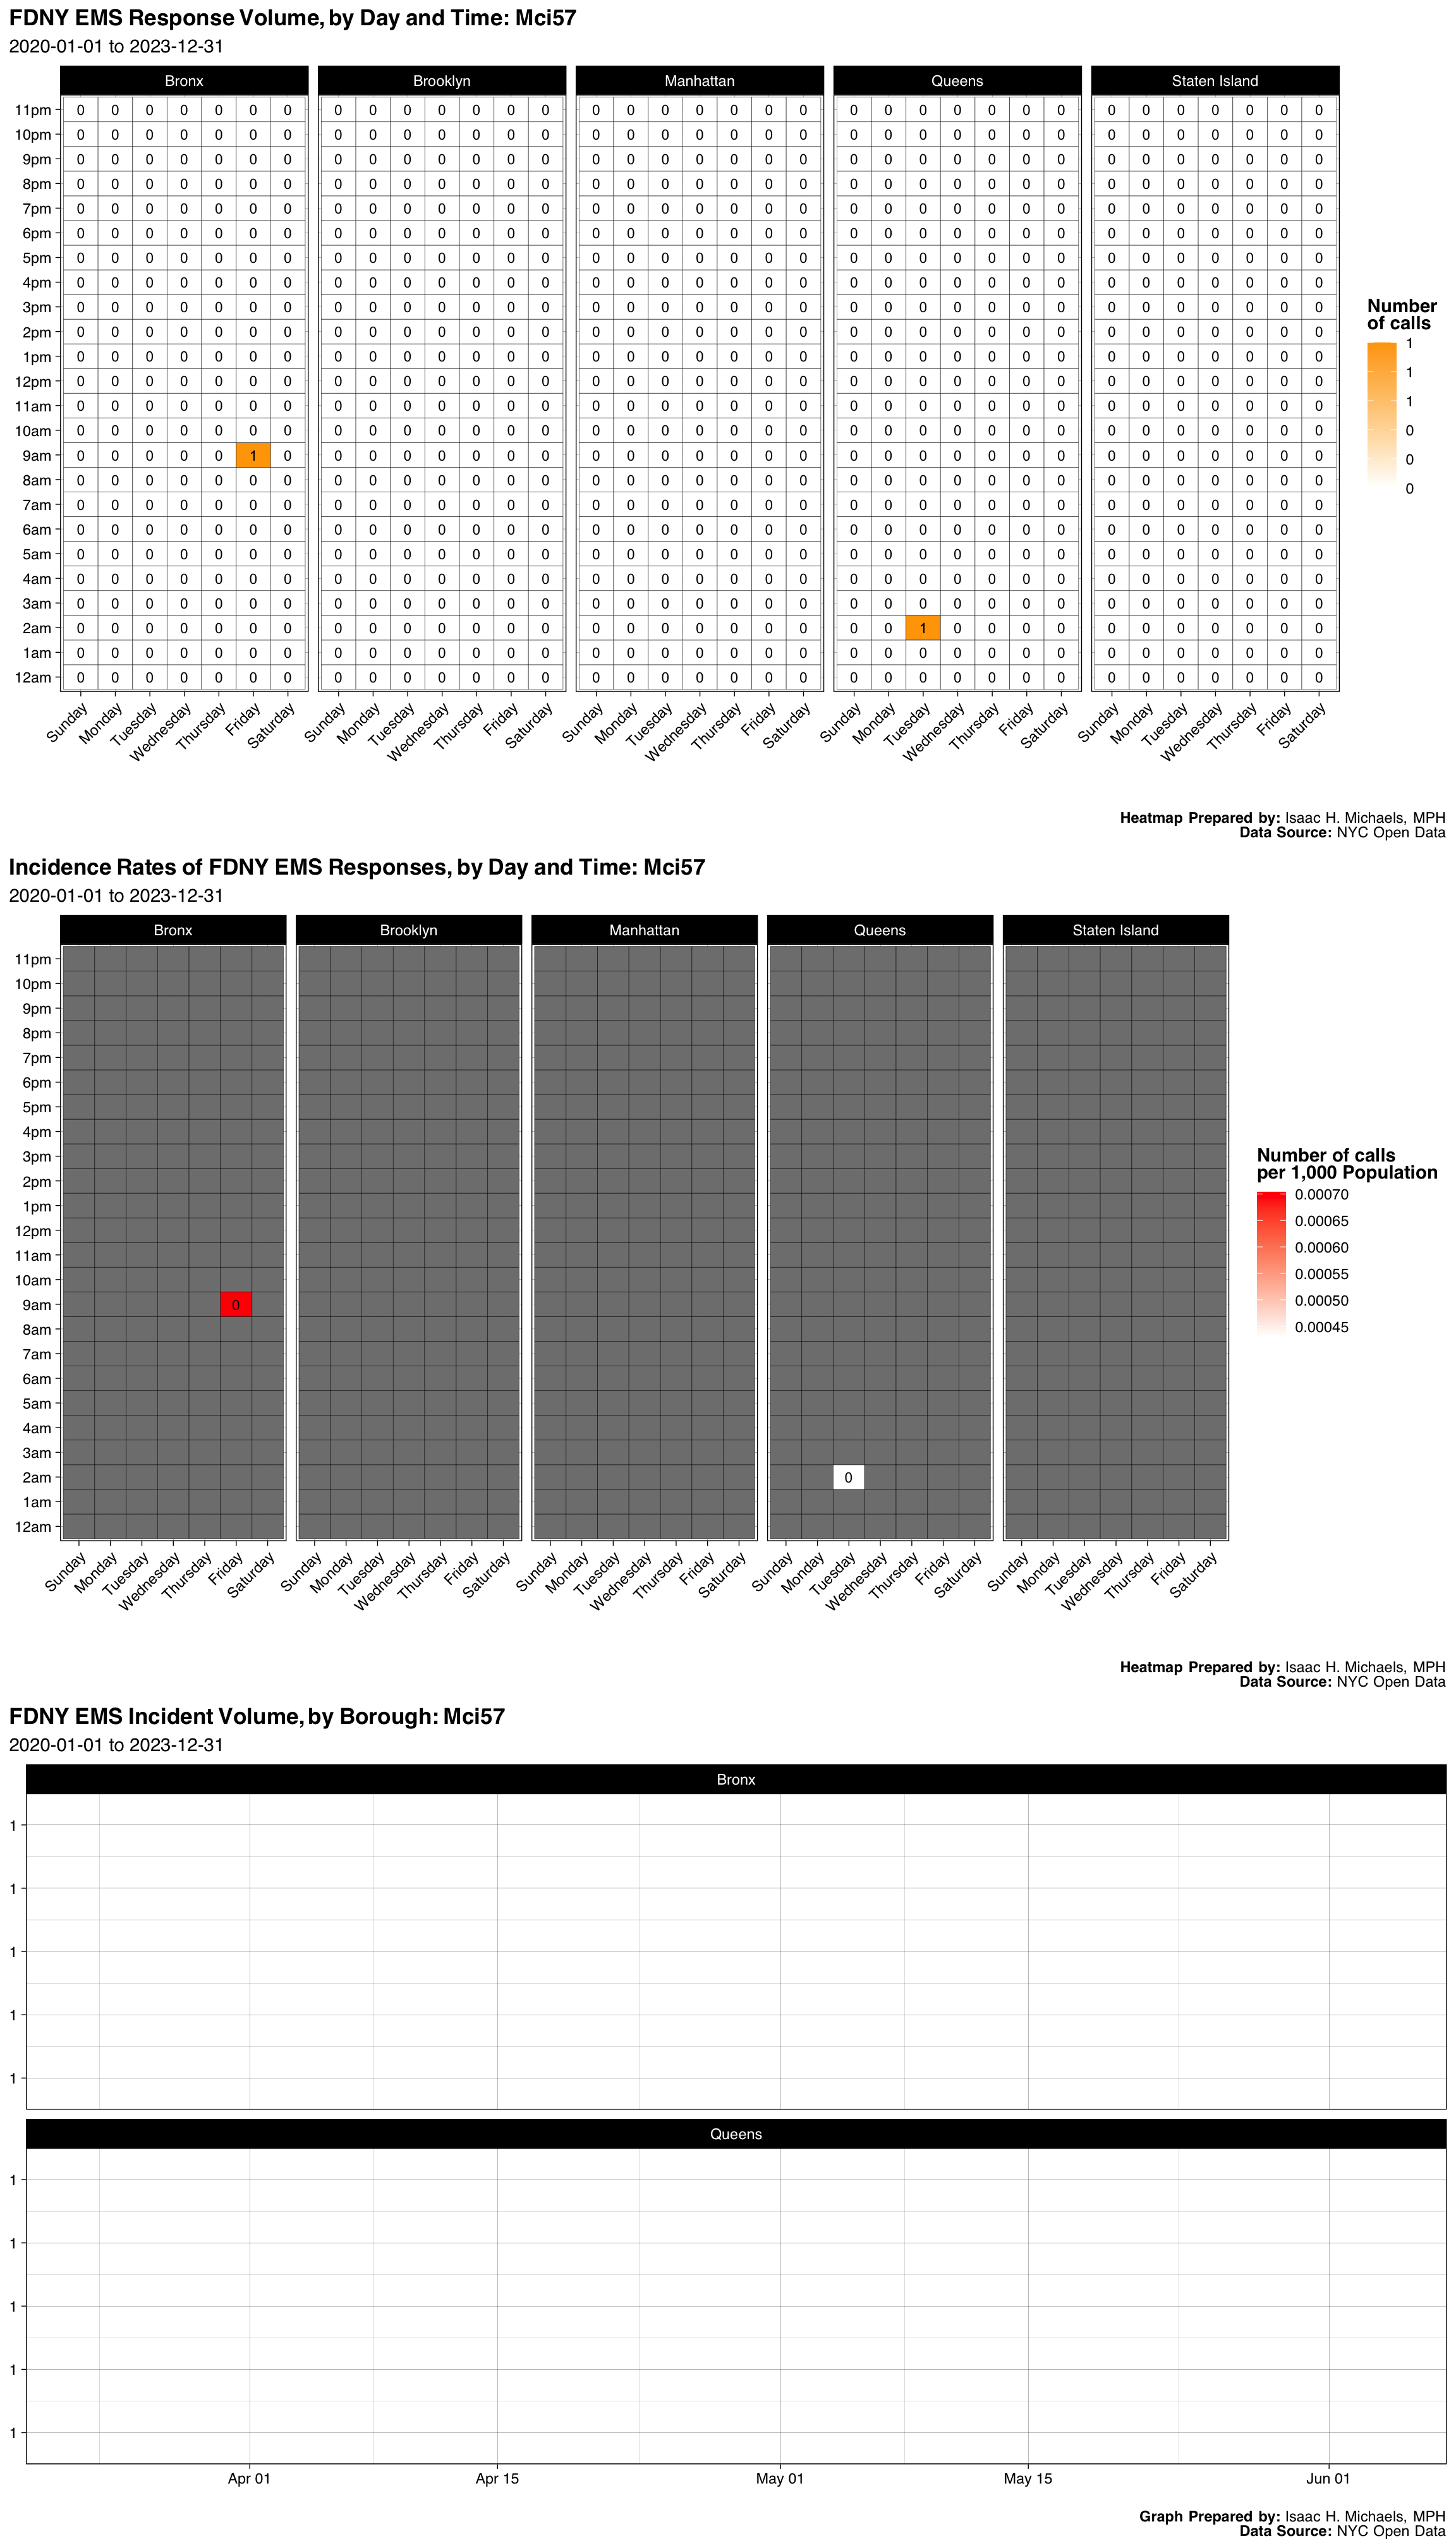
| Borough | Number | Percent |
|---|---|---|
| Bronx | 1 | 0.5 |
| Queens | 1 | 0.5 |
| Final Severity Level | Number | Percent |
|---|---|---|
| 1 | 0 | 0% |
| 2 | 2 | 1 |
| 3 | 0 | 0% |
| 4 | 0 | 0% |
| 5 | 0 | 0% |
| 6 | 0 | 0% |
| 7 | 0 | 0% |
| 8 | 0 | 0% |
| Disposition | Number | Percent |
|---|---|---|
| Condition Corrected | 2 | 1 |
Graphs, Heatmaps, and Tables Prepared By: Isaac H. Michaels, MPH
Data Source: NYC Open Data
Back to top
Respiratory Distress Fever/Travel

| Borough | Number | Percent |
|---|---|---|
| Brooklyn | 1 | 0.5 |
| Queens | 1 | 0.5 |
| Final Severity Level | Number | Percent |
|---|---|---|
| 1 | 0 | 0% |
| 2 | 0 | 0% |
| 3 | 2 | 1 |
| 4 | 0 | 0% |
| 5 | 0 | 0% |
| 6 | 0 | 0% |
| 7 | 0 | 0% |
| 8 | 0 | 0% |
| Disposition | Number | Percent |
|---|---|---|
| Refused Medical Aid | 1 | 0.5 |
| Transporting Patient | 1 | 0.5 |
Graphs, Heatmaps, and Tables Prepared By: Isaac H. Michaels, MPH
Data Source: NYC Open Data
Back to top
Stroke Critical Fever

| Borough | Number | Percent |
|---|---|---|
| Brooklyn | 1 | 1 |
| Final Severity Level | Number | Percent |
|---|---|---|
| 1 | 0 | 0% |
| 2 | 1 | 1 |
| 3 | 0 | 0% |
| 4 | 0 | 0% |
| 5 | 0 | 0% |
| 6 | 0 | 0% |
| 7 | 0 | 0% |
| 8 | 0 | 0% |
| Disposition | Number | Percent |
|---|---|---|
| Transporting Patient | 1 | 1 |
Graphs, Heatmaps, and Tables Prepared By: Isaac H. Michaels, MPH
Data Source: NYC Open Data
Back to top
Seizure Patient Fever/Travel
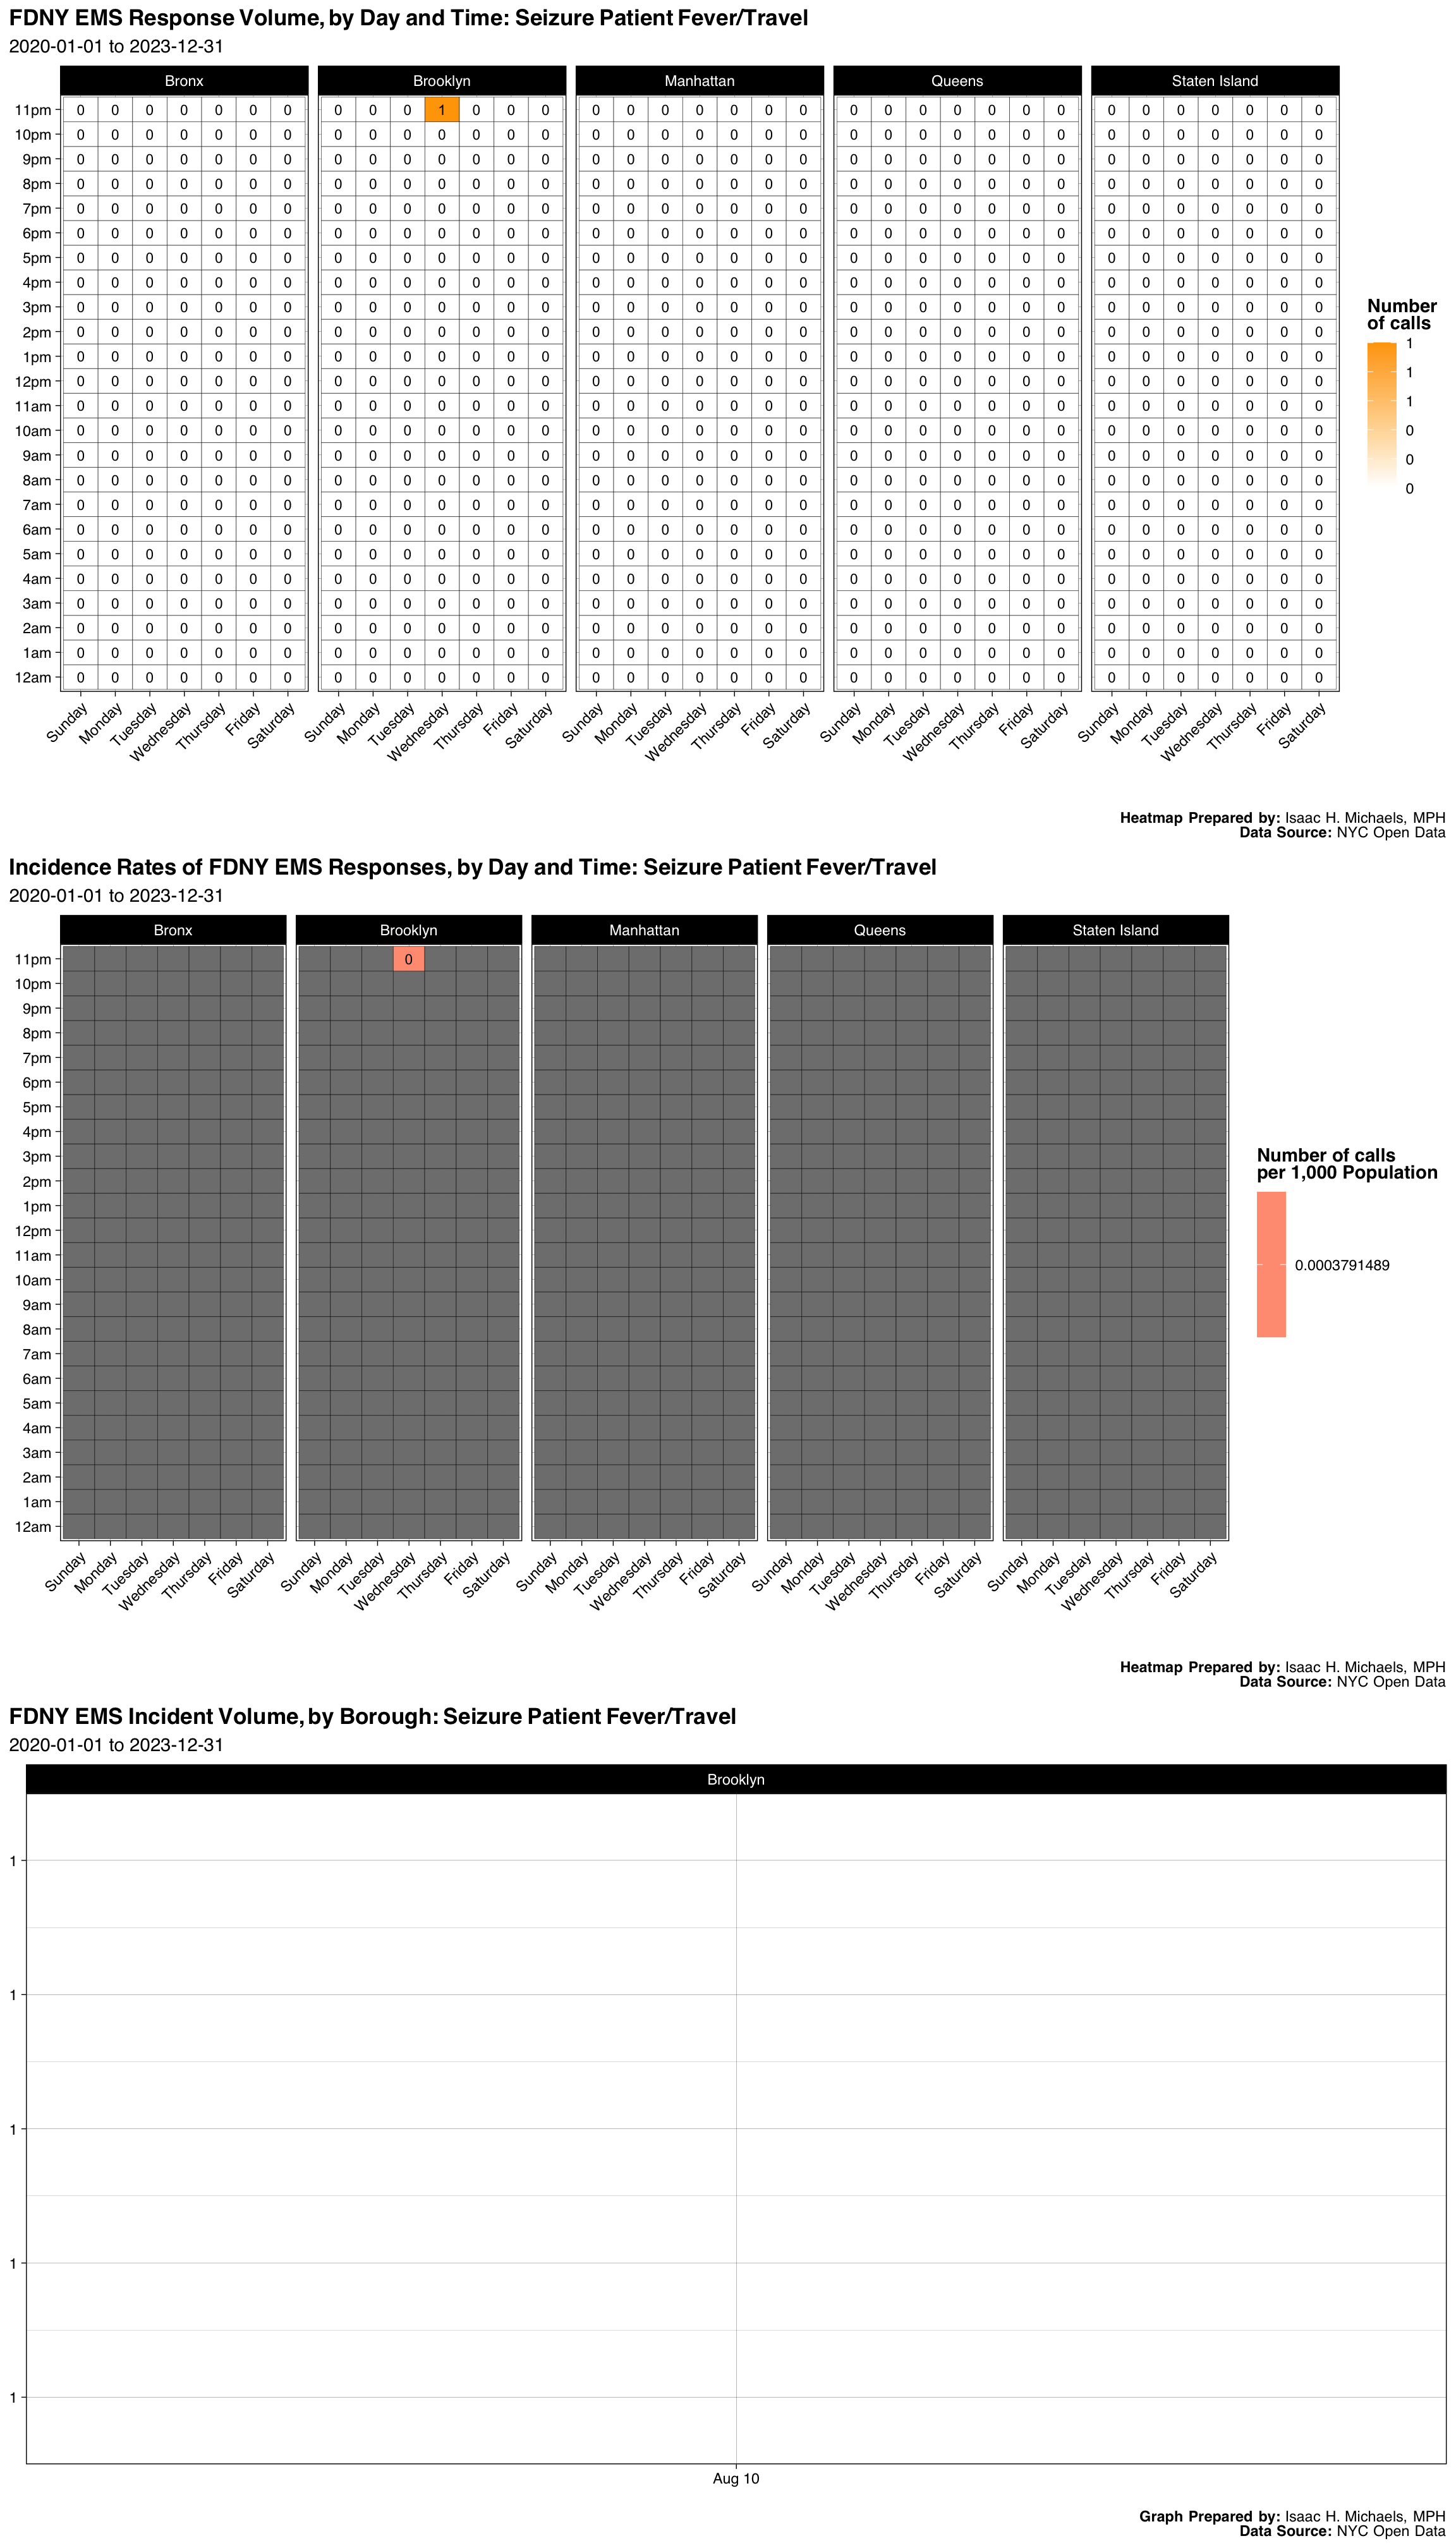
| Borough | Number | Percent |
|---|---|---|
| Brooklyn | 1 | 1 |
| Final Severity Level | Number | Percent |
|---|---|---|
| 1 | 0 | 0% |
| 2 | 0 | 0% |
| 3 | 1 | 1 |
| 4 | 0 | 0% |
| 5 | 0 | 0% |
| 6 | 0 | 0% |
| 7 | 0 | 0% |
| 8 | 0 | 0% |
| Disposition | Number | Percent |
|---|---|---|
| Transporting Patient | 1 | 1 |
Graphs, Heatmaps, and Tables Prepared By: Isaac H. Michaels, MPH
Data Source: NYC Open Data
Back to top
Status Epilepticus Fever/Travel
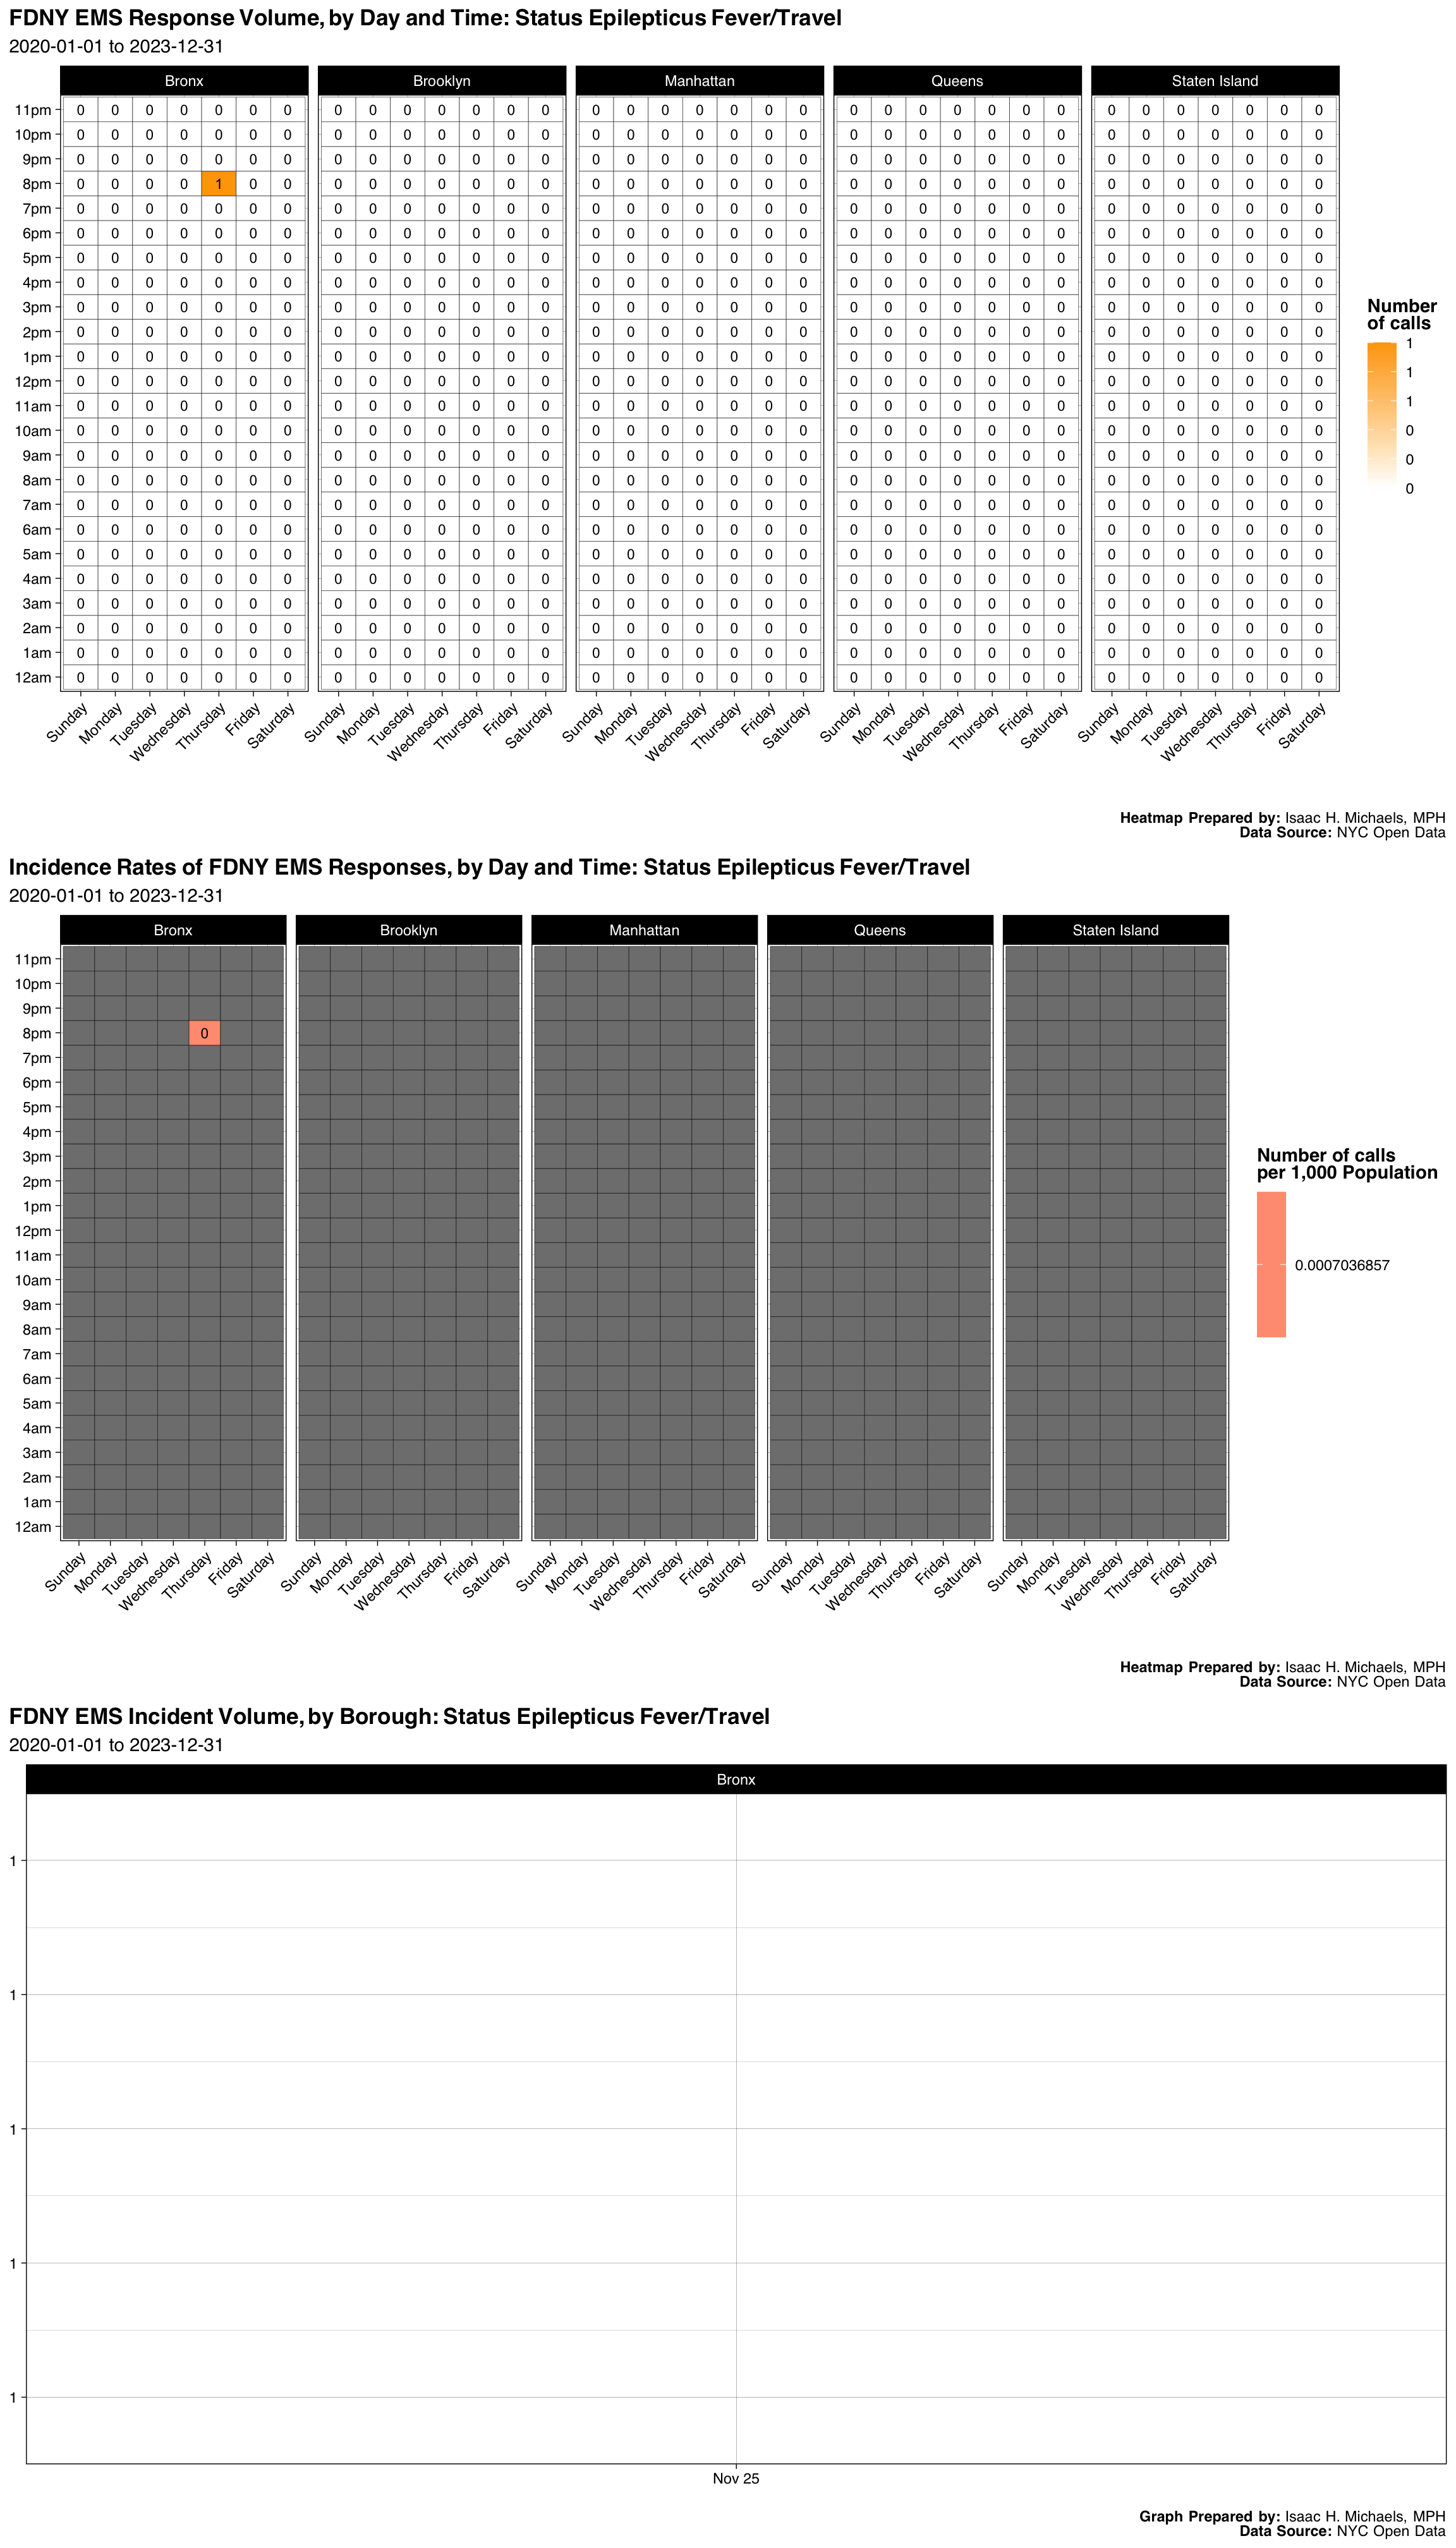
| Borough | Number | Percent |
|---|---|---|
| Bronx | 1 | 1 |
| Final Severity Level | Number | Percent |
|---|---|---|
| 1 | 0 | 0% |
| 2 | 1 | 1 |
| 3 | 0 | 0% |
| 4 | 0 | 0% |
| 5 | 0 | 0% |
| 6 | 0 | 0% |
| 7 | 0 | 0% |
| 8 | 0 | 0% |
| Disposition | Number | Percent |
|---|---|---|
| Transporting Patient | 1 | 1 |
Graphs, Heatmaps, and Tables Prepared By: Isaac H. Michaels, MPH
Data Source: NYC Open Data
Back to top