Graph Prepared By: Isaac H. Michaels, MPH
Data Source: CDC WONDER
Graph Prepared By: Isaac H. Michaels, MPH
Data Source: CDC WONDER

A concise analysis of daily counts of people and families in New York City's Department of Homeless Services (DHS) shelter system. This page summarizes trends, weekly patterns, and recent changes using daily shelter census data and highlights implications for public health practice.
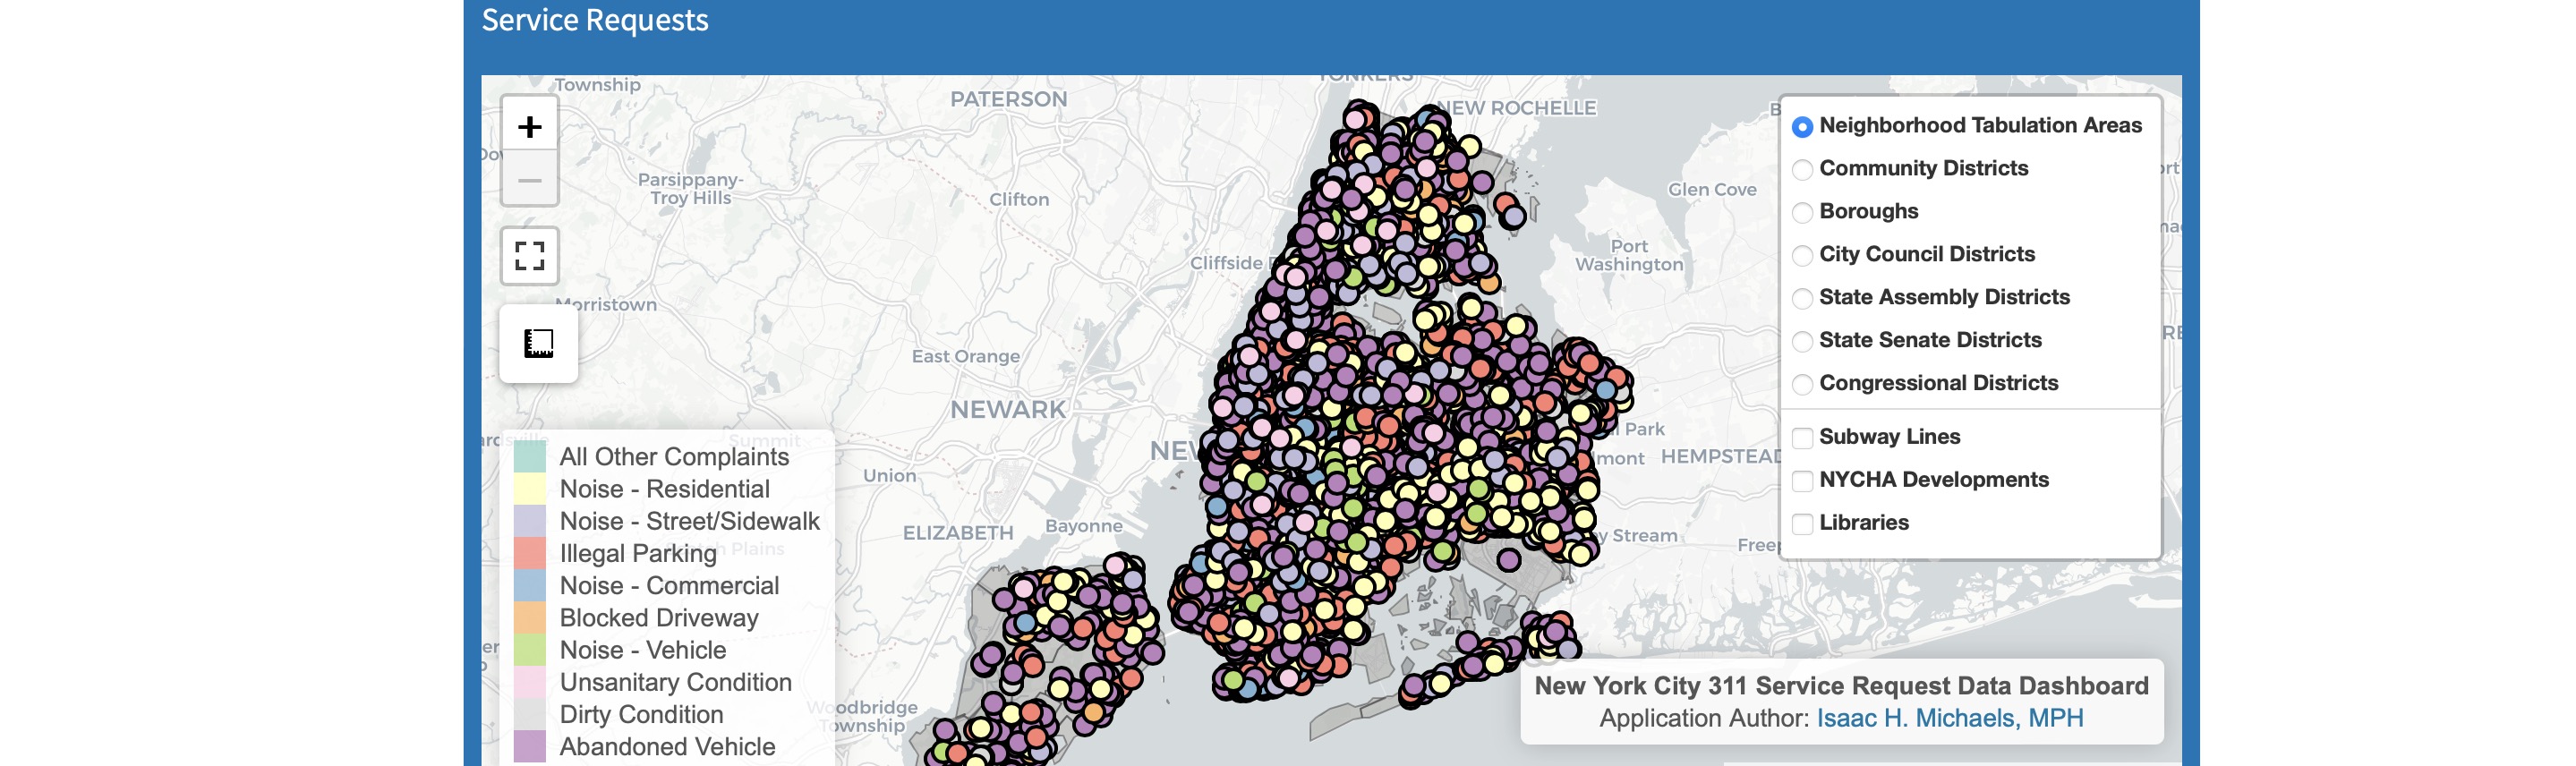
Explore the New York City 311 Service Request Data Dashboard, an interactive GIS tool that visualizes social determinants of health using 311 service requests across NYC. Developed by Isaac H. Michaels, DrPH, the dashboard provides spatial analysis of complaint types, dynamic frequency updates, and …
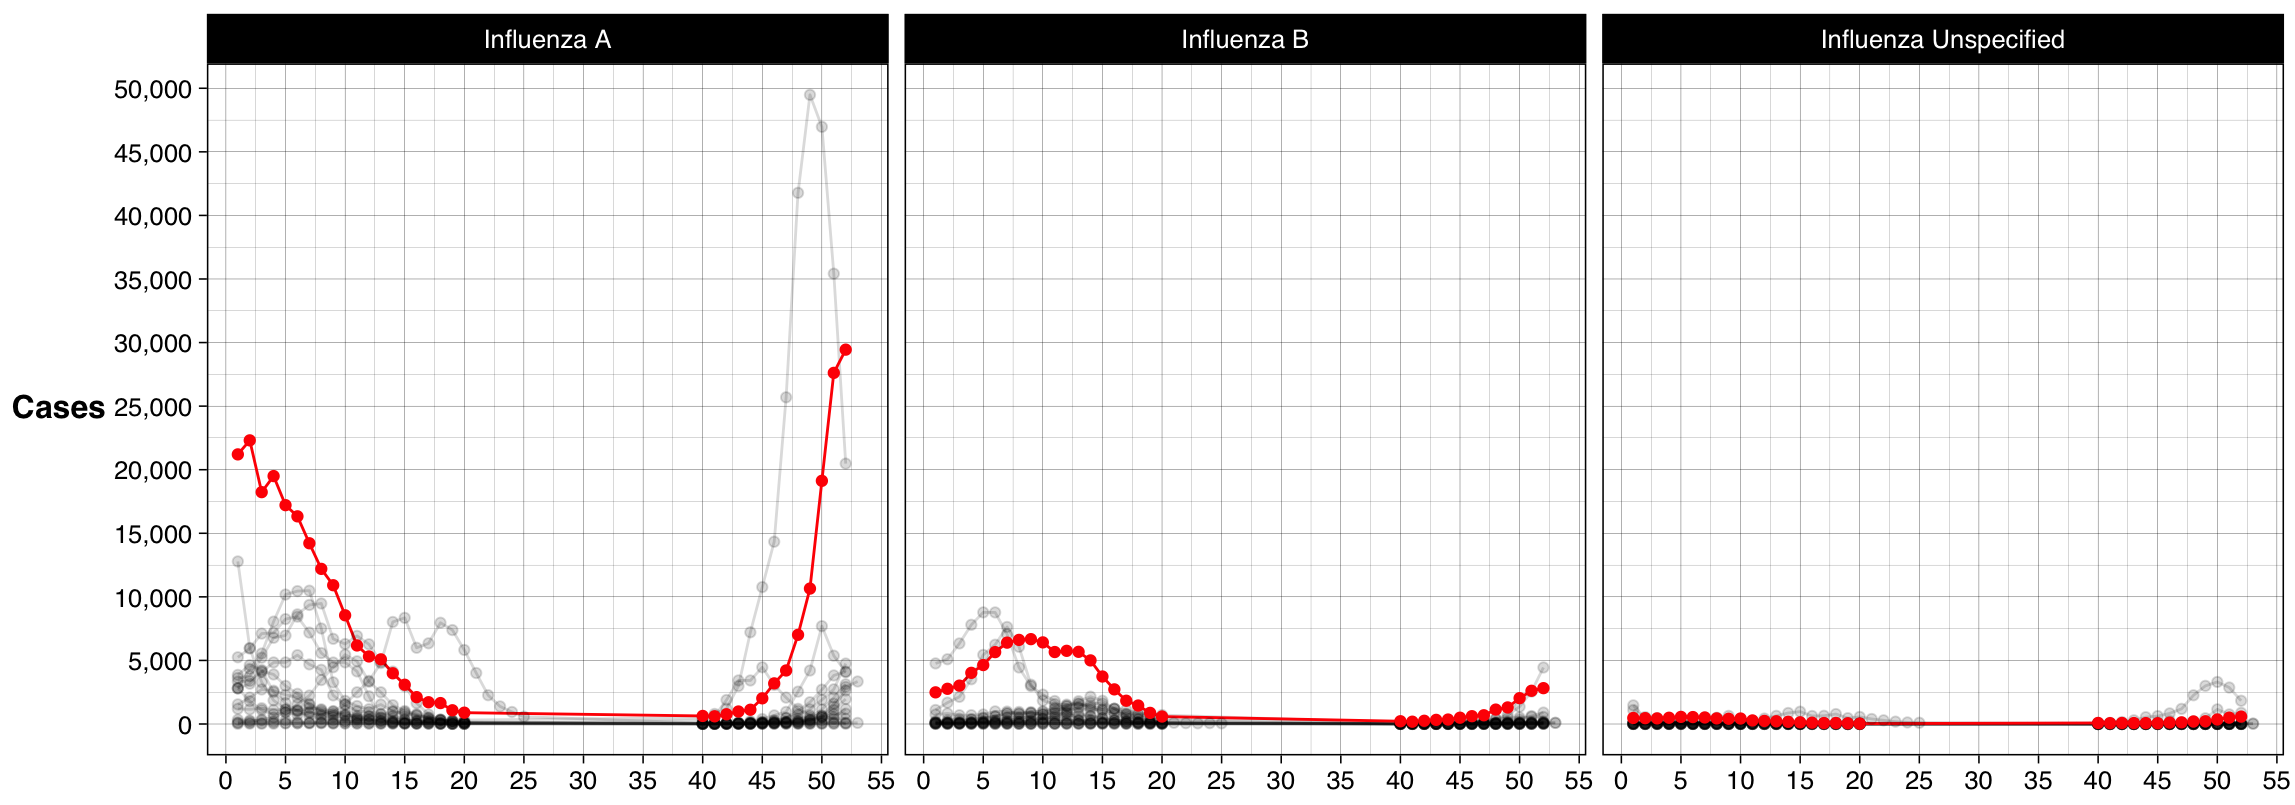
Explore the New York Flu Watch, a comprehensive real-time tracker for influenza data across New York State and New York City. Updated routinely, this tool offers detailed insights into laboratory-confirmed cases, emergency department visits, hospitalizations, and flu vaccination coverage. Developed …