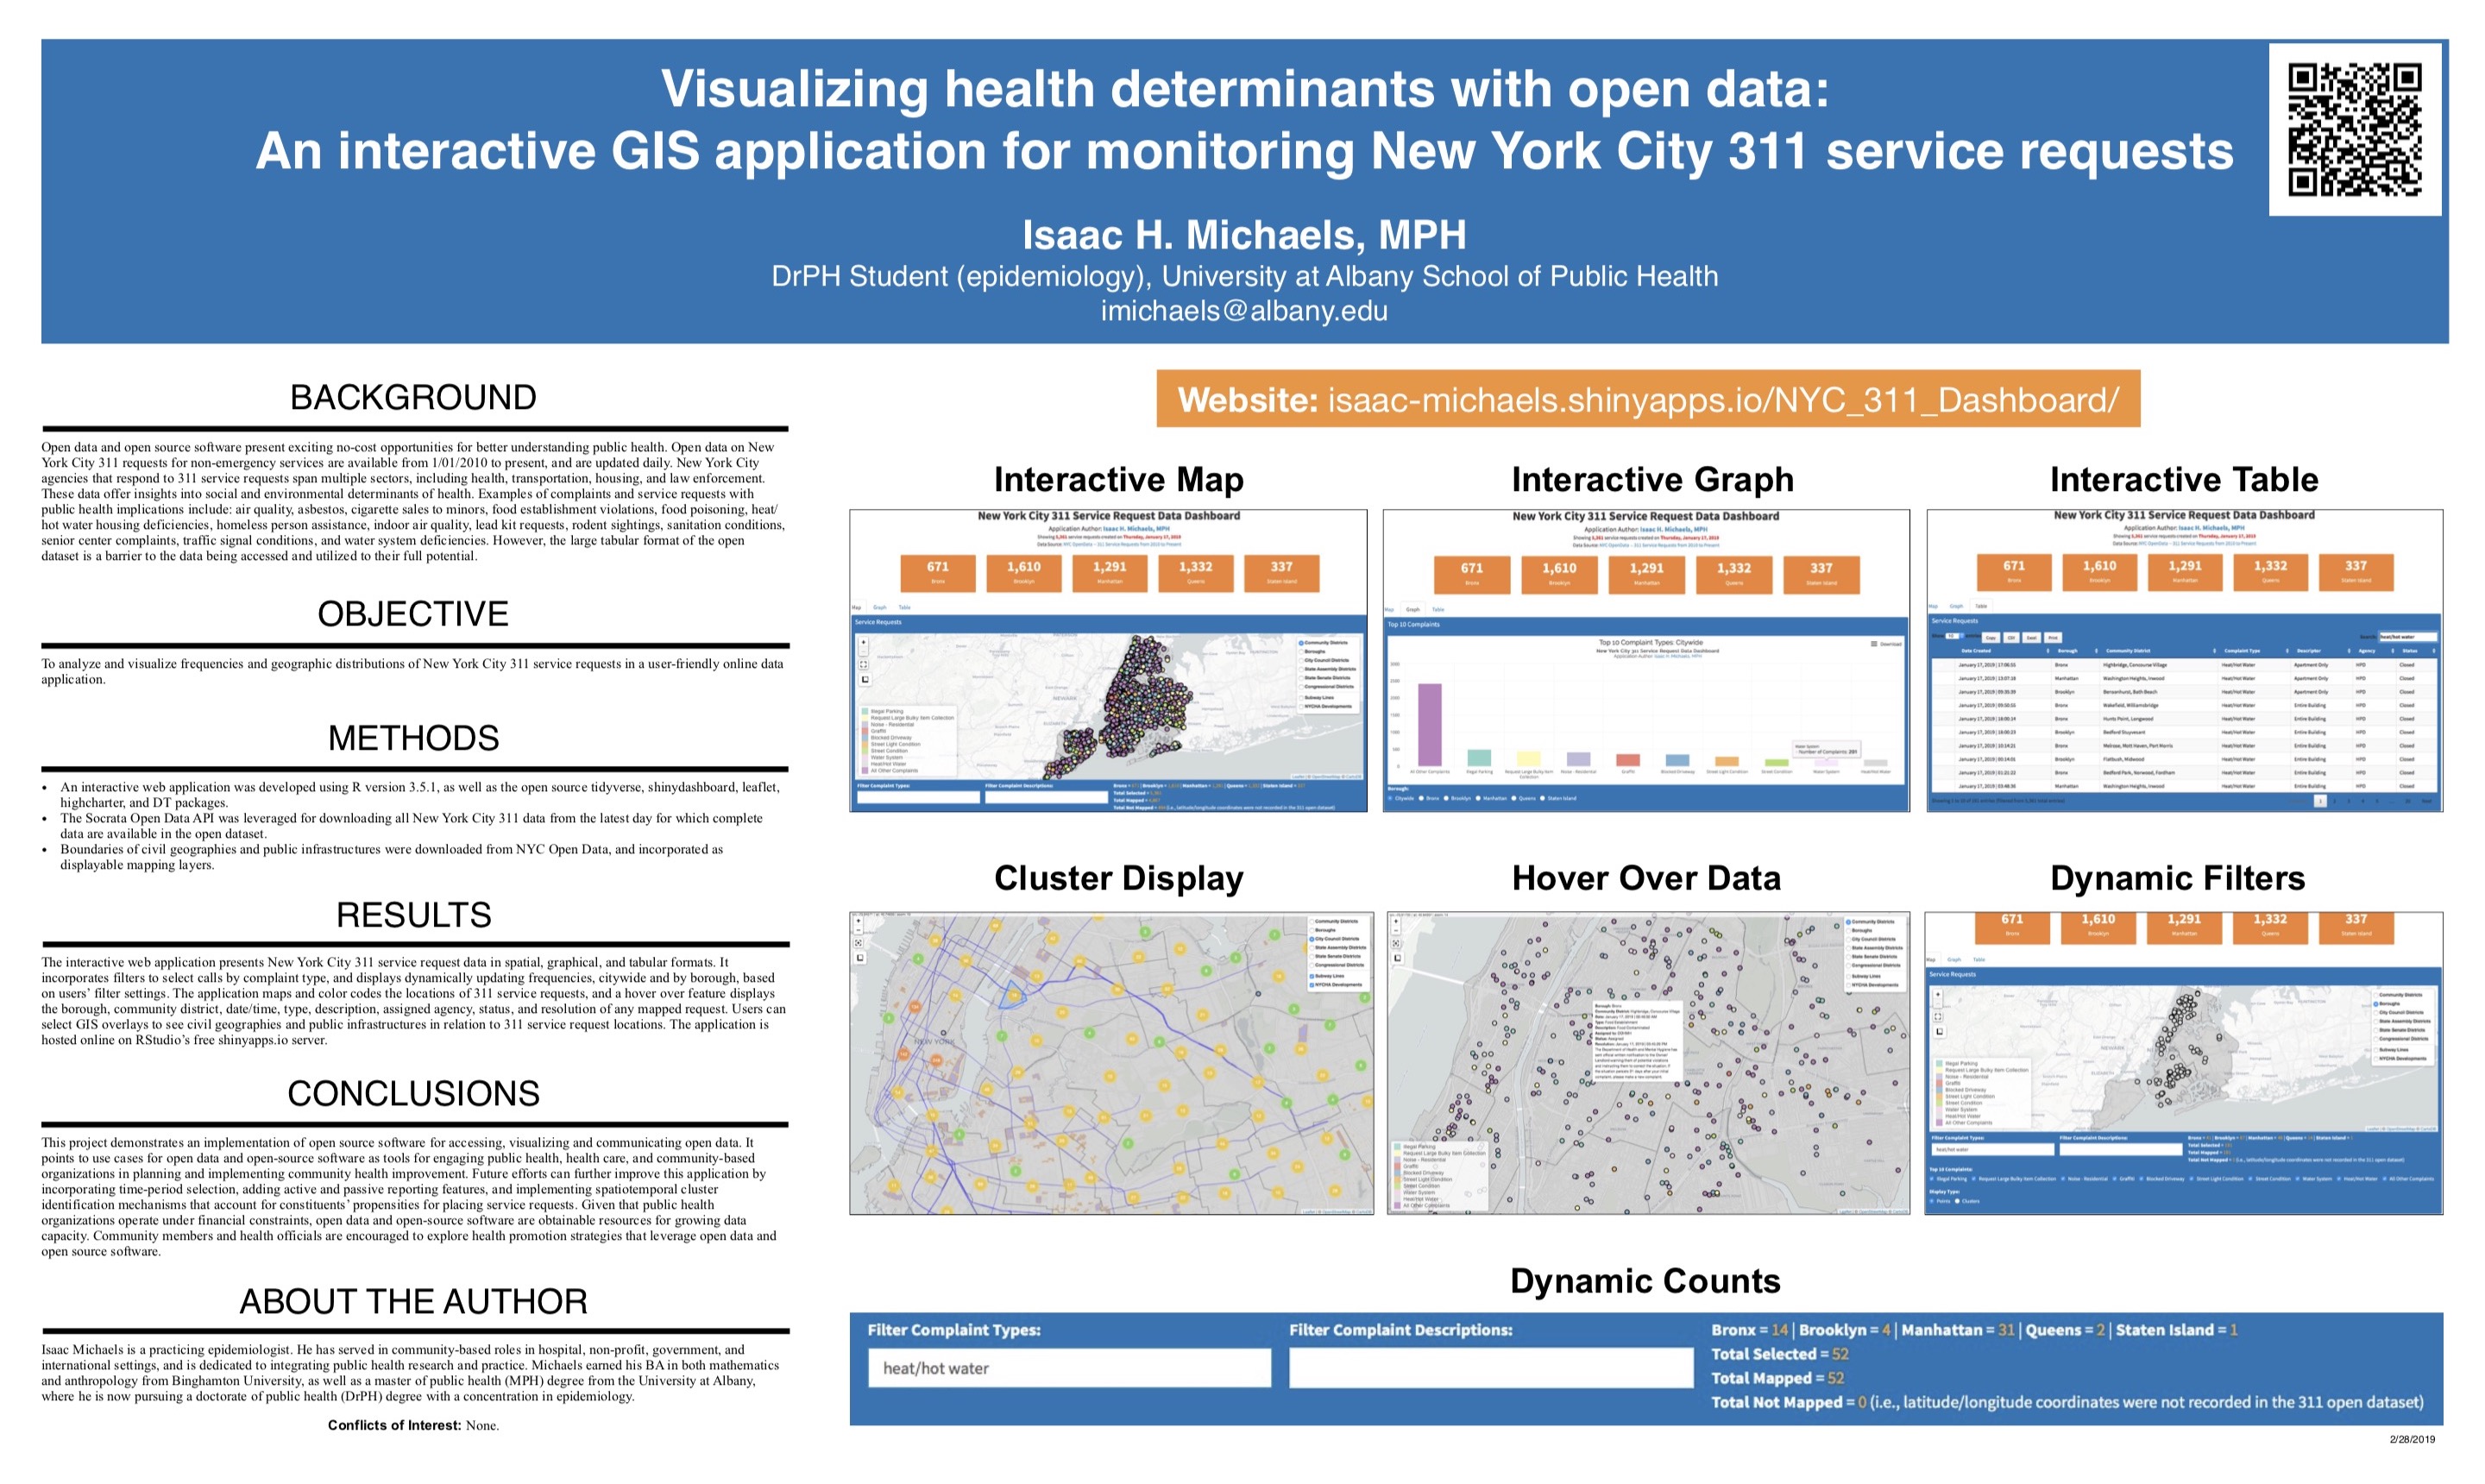
Albany, NY - A new interactive web application that visualizes health determinants using open data has been developed by Isaac H. Michaels, MPH and presented at the 2019 New York State Population Health Summit. The application, developed using open source software and tools, allows users to analyze and visualize frequencies and geographic distributions of New York City 311 service requests, which offer insights into the social and environmental determinants of health.
The web application, hosted on RStudio’s shinyapps.io server, presents data in spatial, graphical, and tabular formats and includes filters to select calls by complaint type. It also displays dynamically updating frequencies citywide and by borough, maps and color codes the locations of 311 service requests, and allows users to select GIS overlays to see civil geographies and public infrastructures in relation to 311 service request locations.
“This project demonstrates the power of open source software and open data as tools for engaging public health, health care, and community-based organizations in planning and implementing community health improvement,” said Michaels. “Given that public health organizations often operate under financial constraints, open data and open-source software are valuable resources for growing data capacity and should be leveraged to promote health and well-being in our communities.”
Future efforts to improve the application include the incorporation of time-period selection, the addition of active and passive reporting features, and the implementation of spatiotemporal cluster identification mechanisms.
Isaac Michaels is a practicing epidemiologist with a BA in mathematics and anthropology from Binghamton University and an MPH from the University at Albany. He has served in community-based roles in hospital, non-profit, government, and international settings and is dedicated to integrating public health research and practice.
The following poster (pdf) was presented by Isaac H. Michaels, MPH at the 2019 New York State Population Health Summit at the Empire State Plaza in Albany, New York.


