Published: March 25, 2020
Updated: September 16, 2025 at 08:56PM
Welcome
Welcome to this web page, which presents analyses of data on COVID-19 in the United States. I believe that data are an essential component of any public health response. The data on this page are obtained from the data.cdc.gov open-data platform and are updated daily.
Data Overview
This web page contains several analyses of data on COVID-19 in the United States. The analyses include trend graphs of cumulative COVID-19 deaths overall and by state/jurisdiction, trend graph of excess deaths, trend graphs of COVID-19 vaccination by dose, bar graph of COVID-19 vaccination by dose and state, trend graph of COVID-19 variant proportions, and a tree graph of the latest cross-section of variant proportions.
How to Use These Data
These data can be used to track the COVID-19 pandemic in the United States, monitor trends in COVID-19 cases and deaths, and evaluate the impact of vaccination efforts. Users can also compare trends in different states and jurisdictions, track the emergence of COVID-19 variants, and identify areas where public health interventions may be needed.
Why are These Data Important?
These data are important because they provide essential information to public health professionals, policymakers, and the general public about the impact of COVID-19 on the health of the population. The data can be used to guide public health interventions, allocate resources, and track the progress of the pandemic.
What do These Data Show?
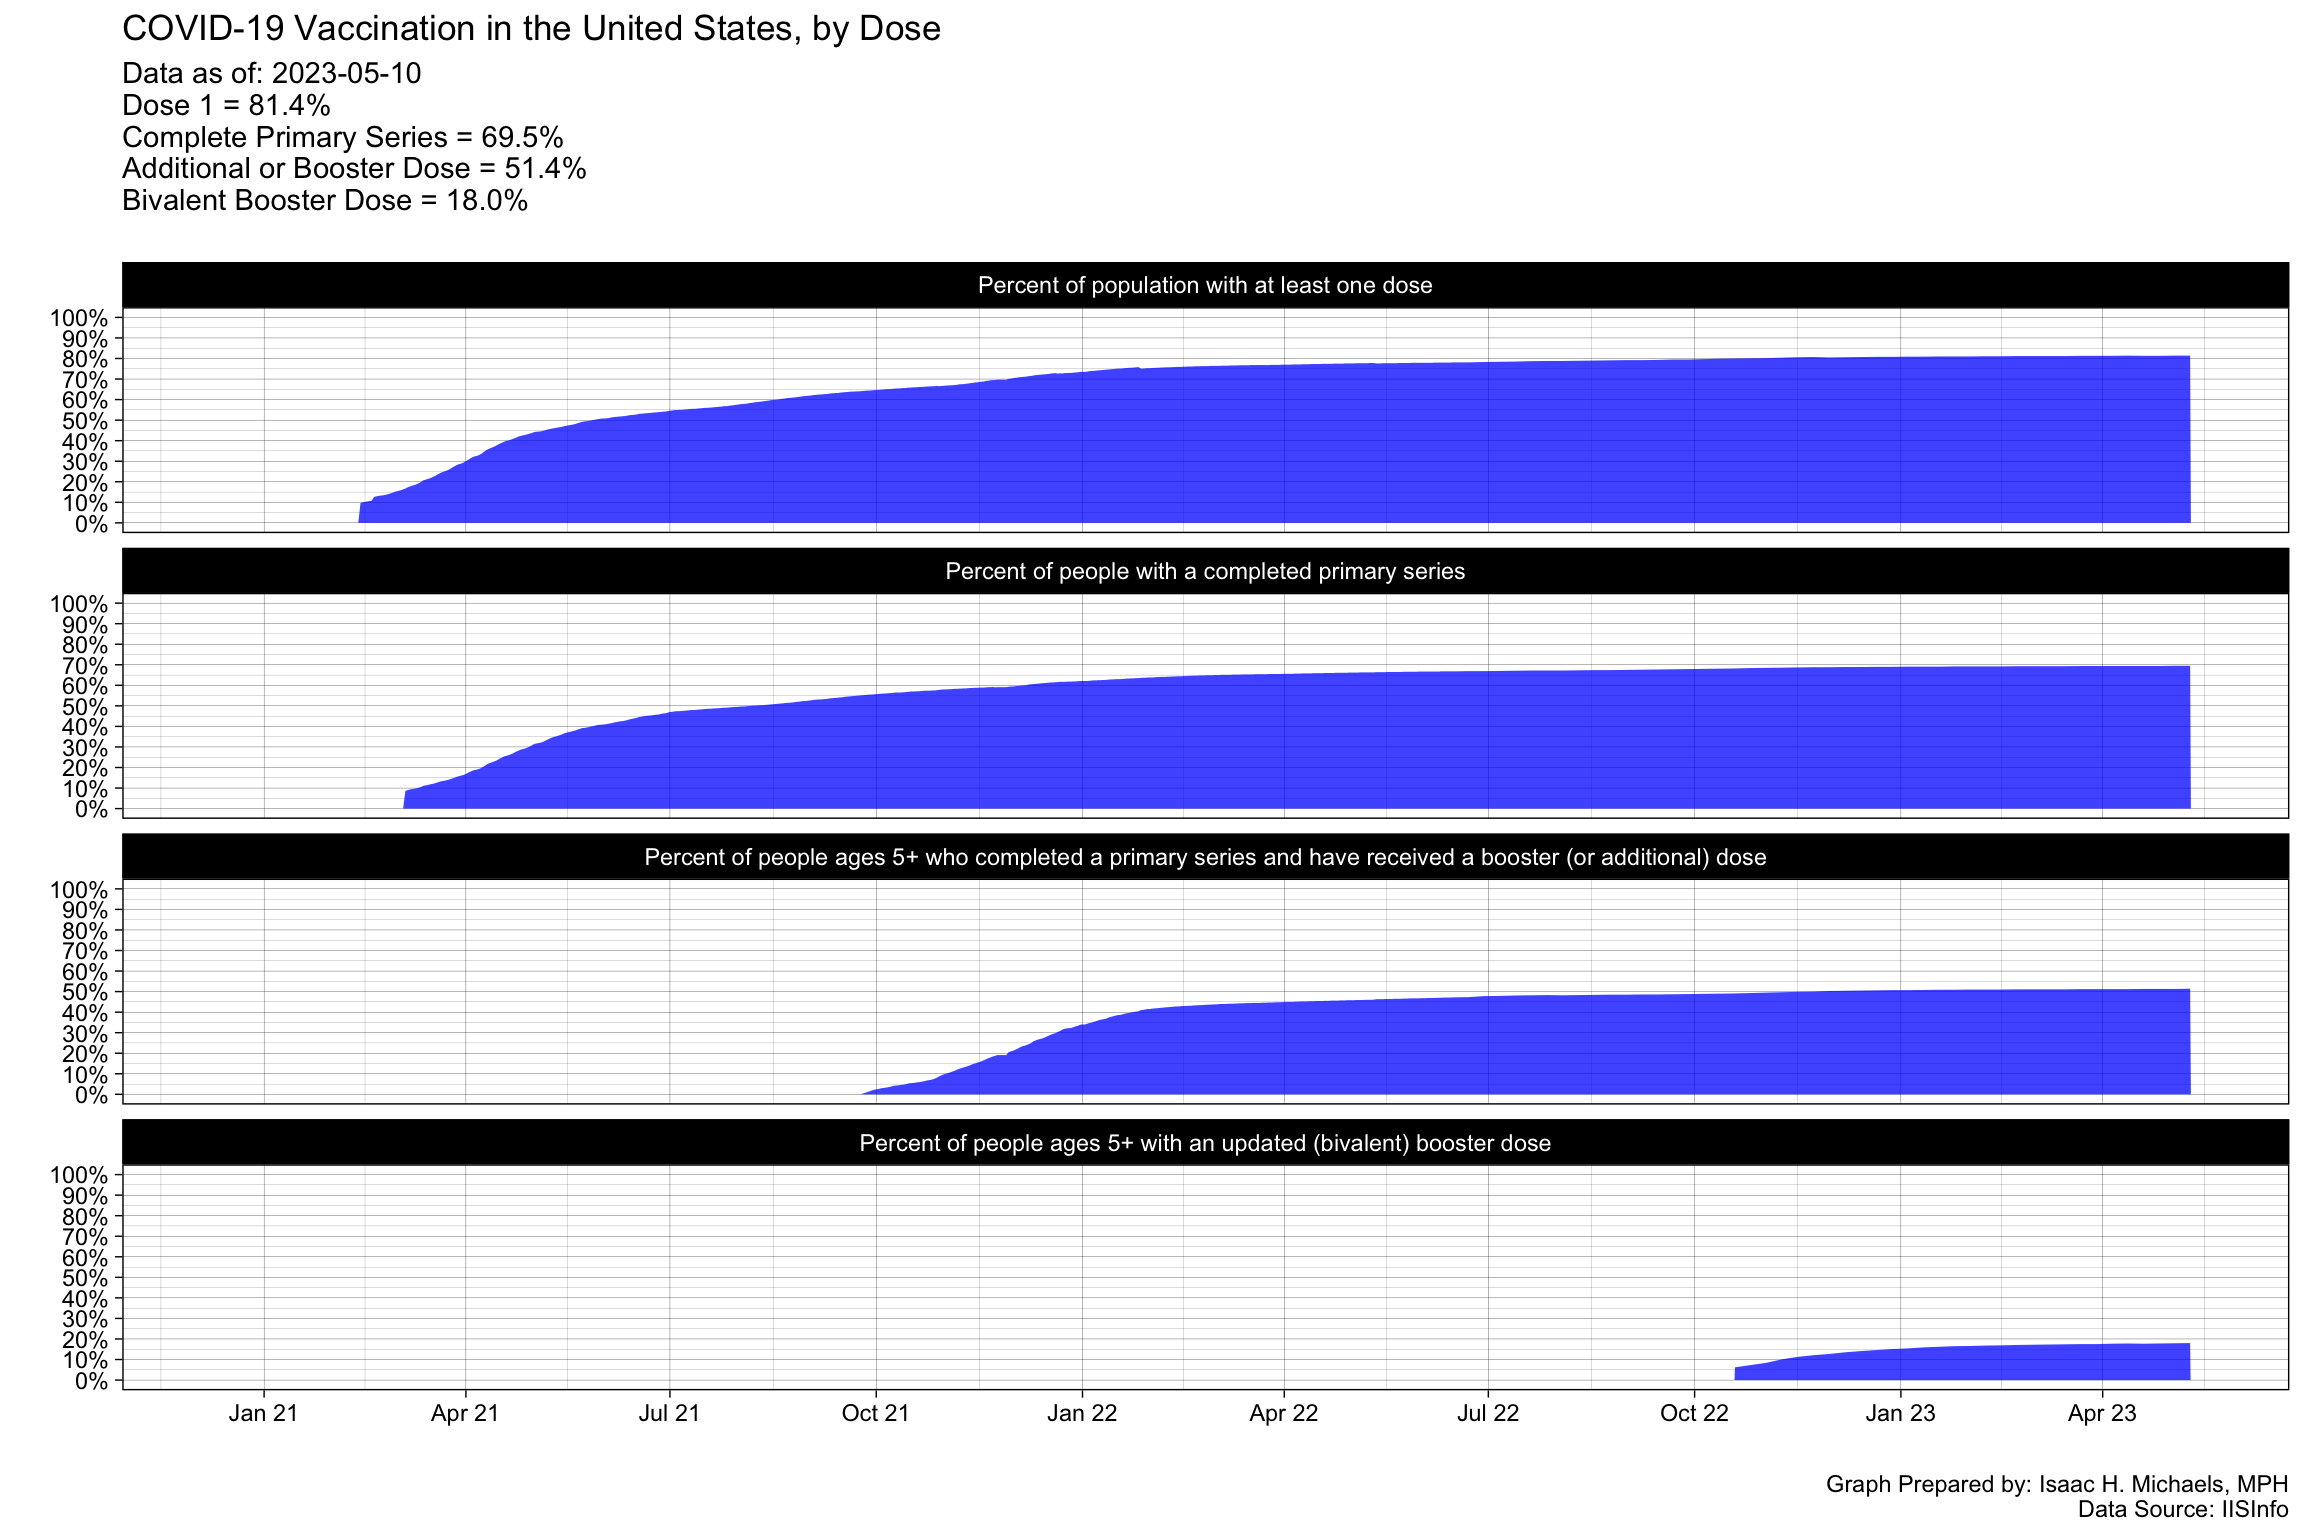
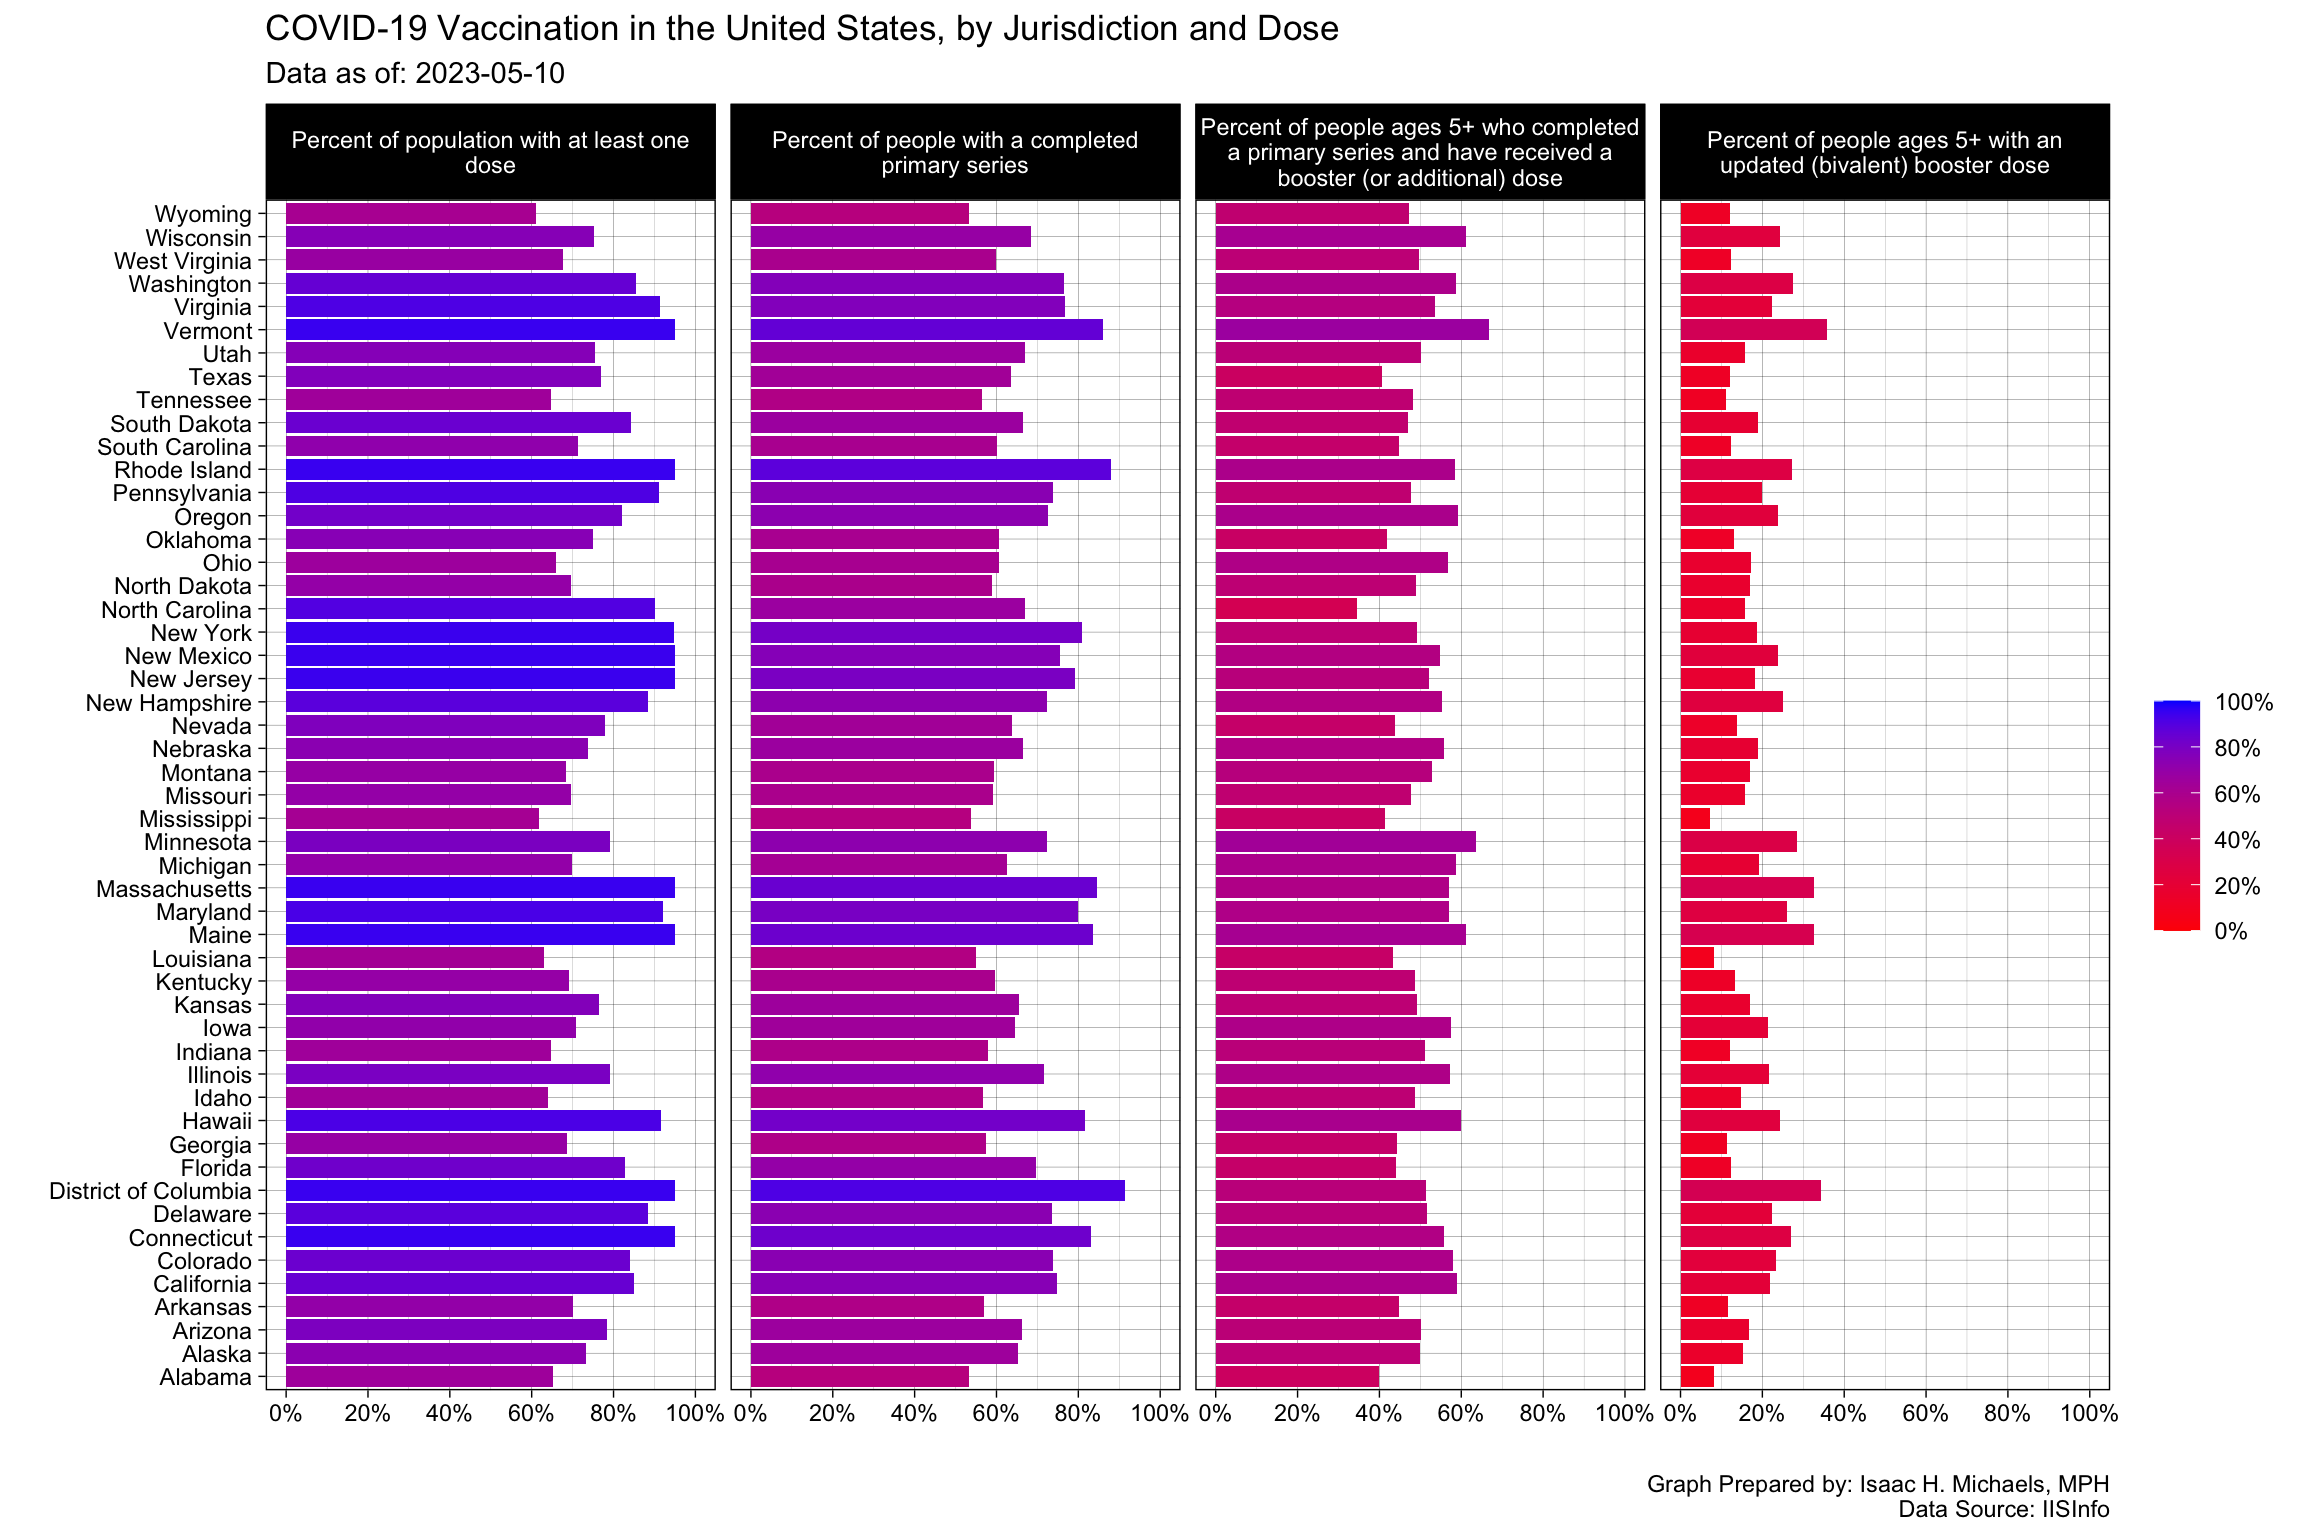
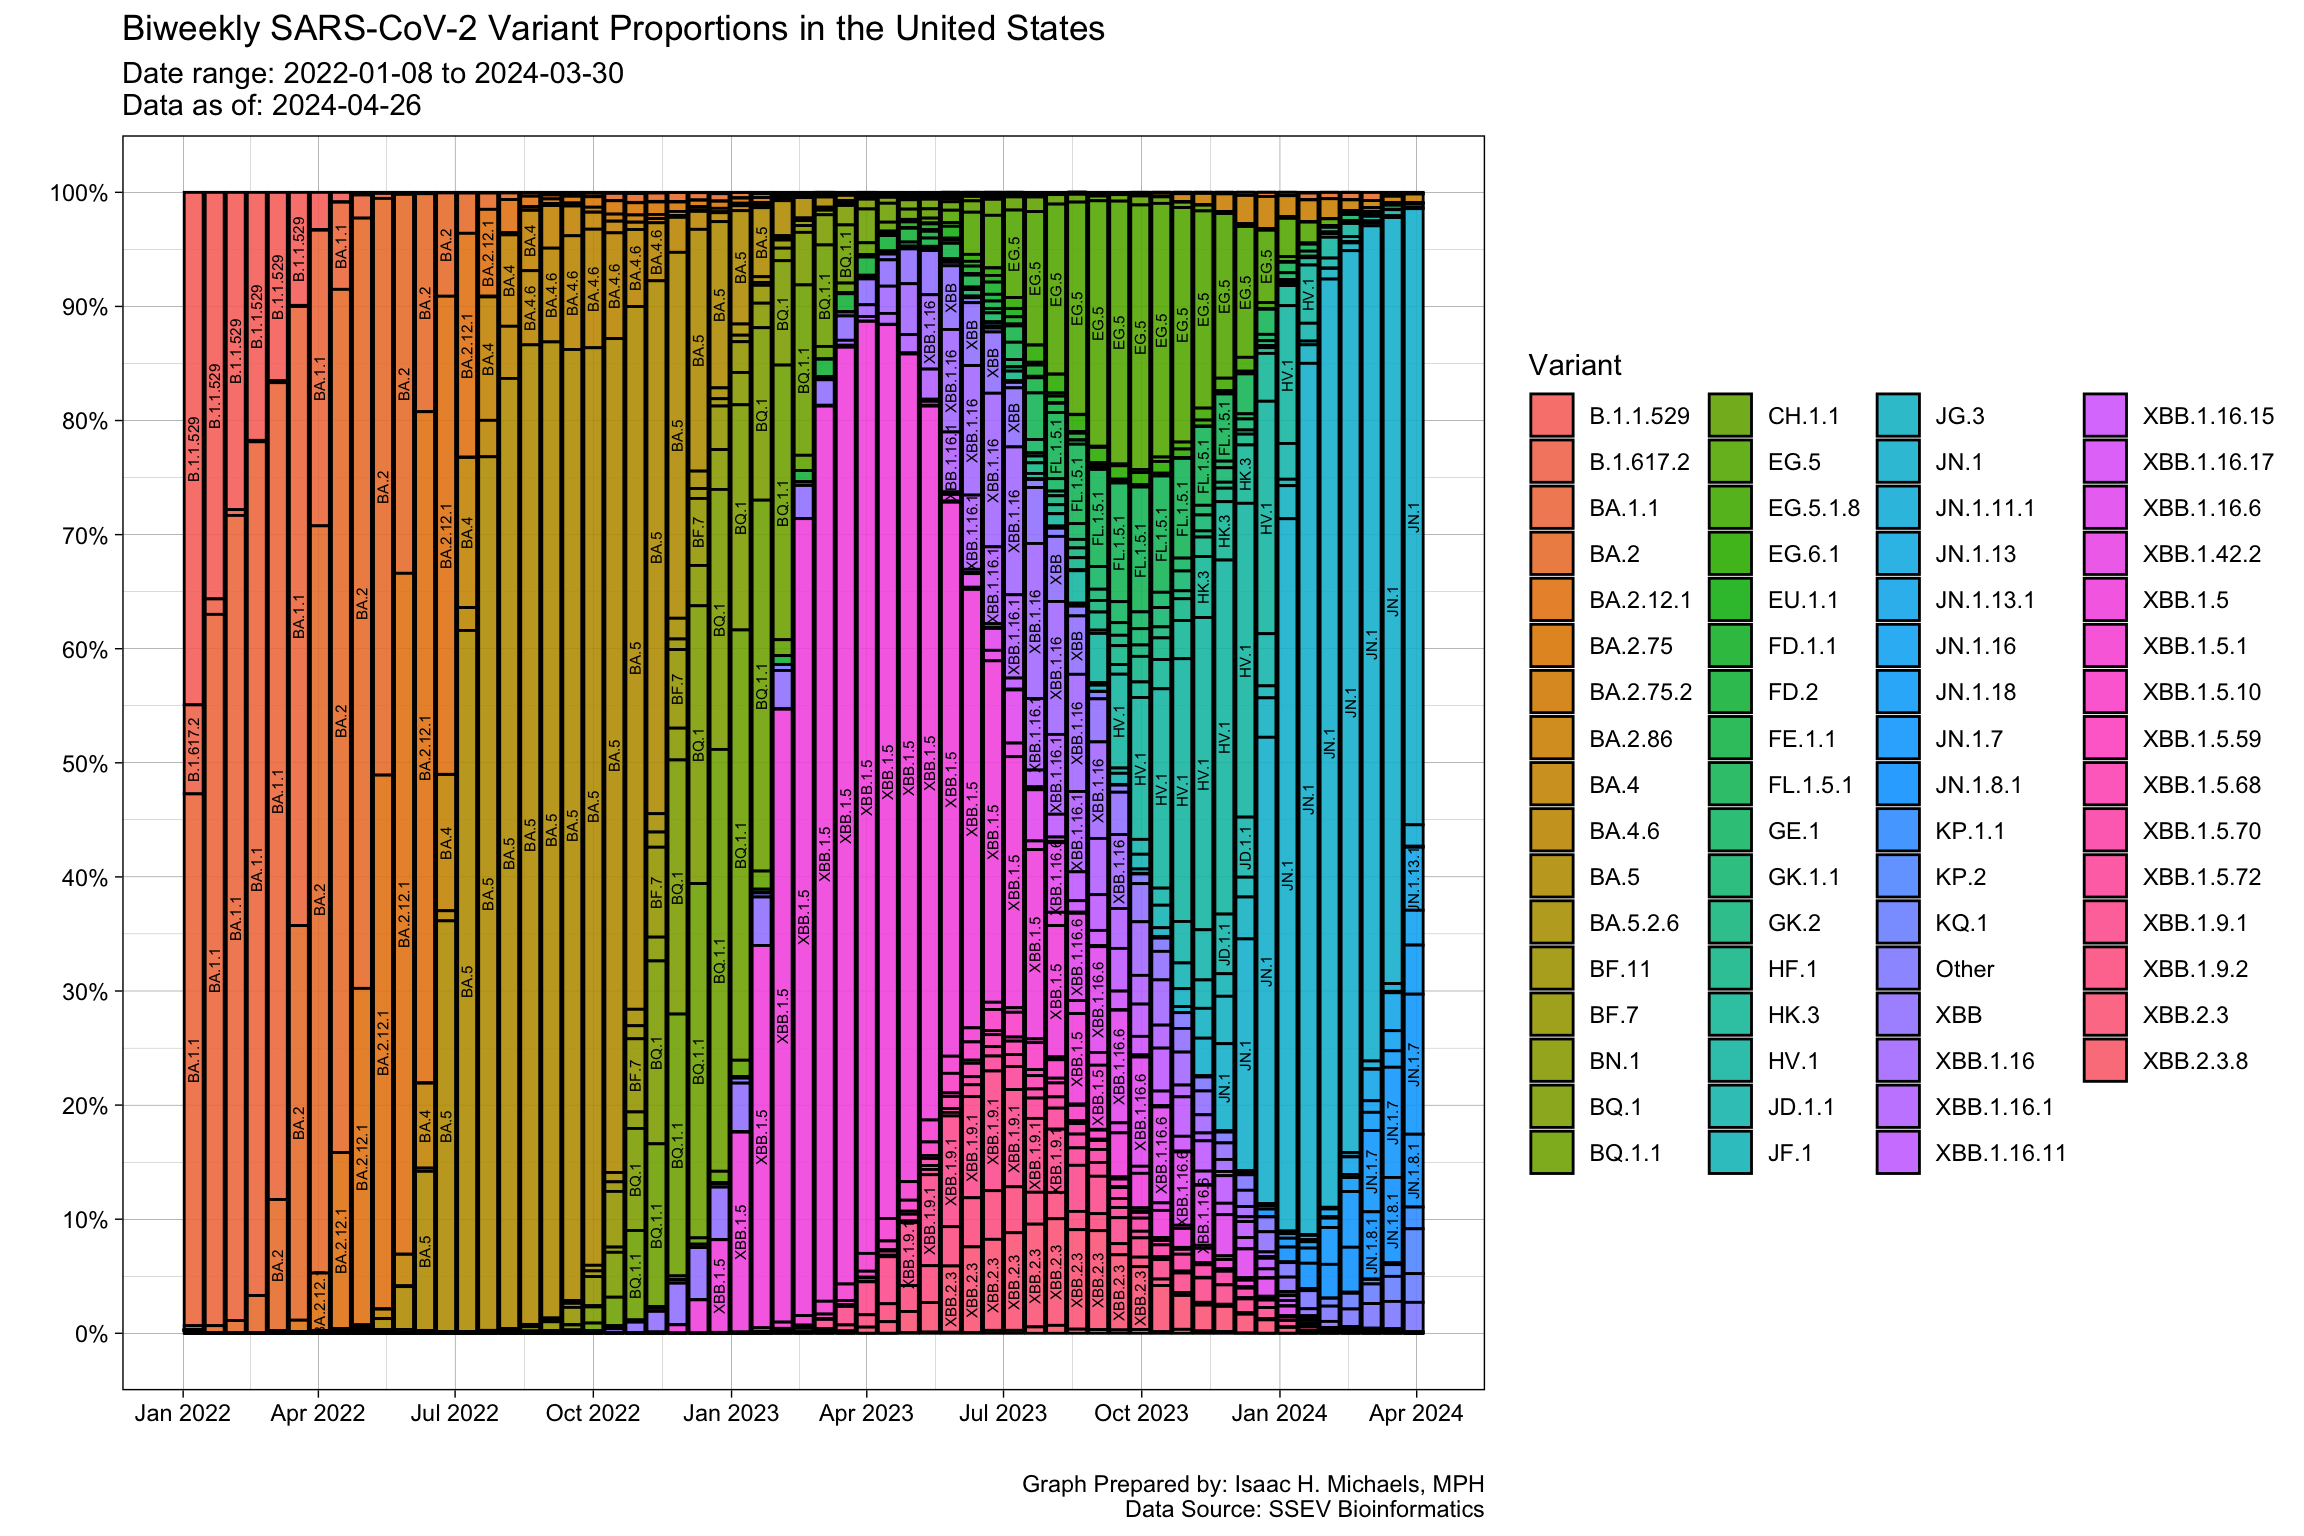
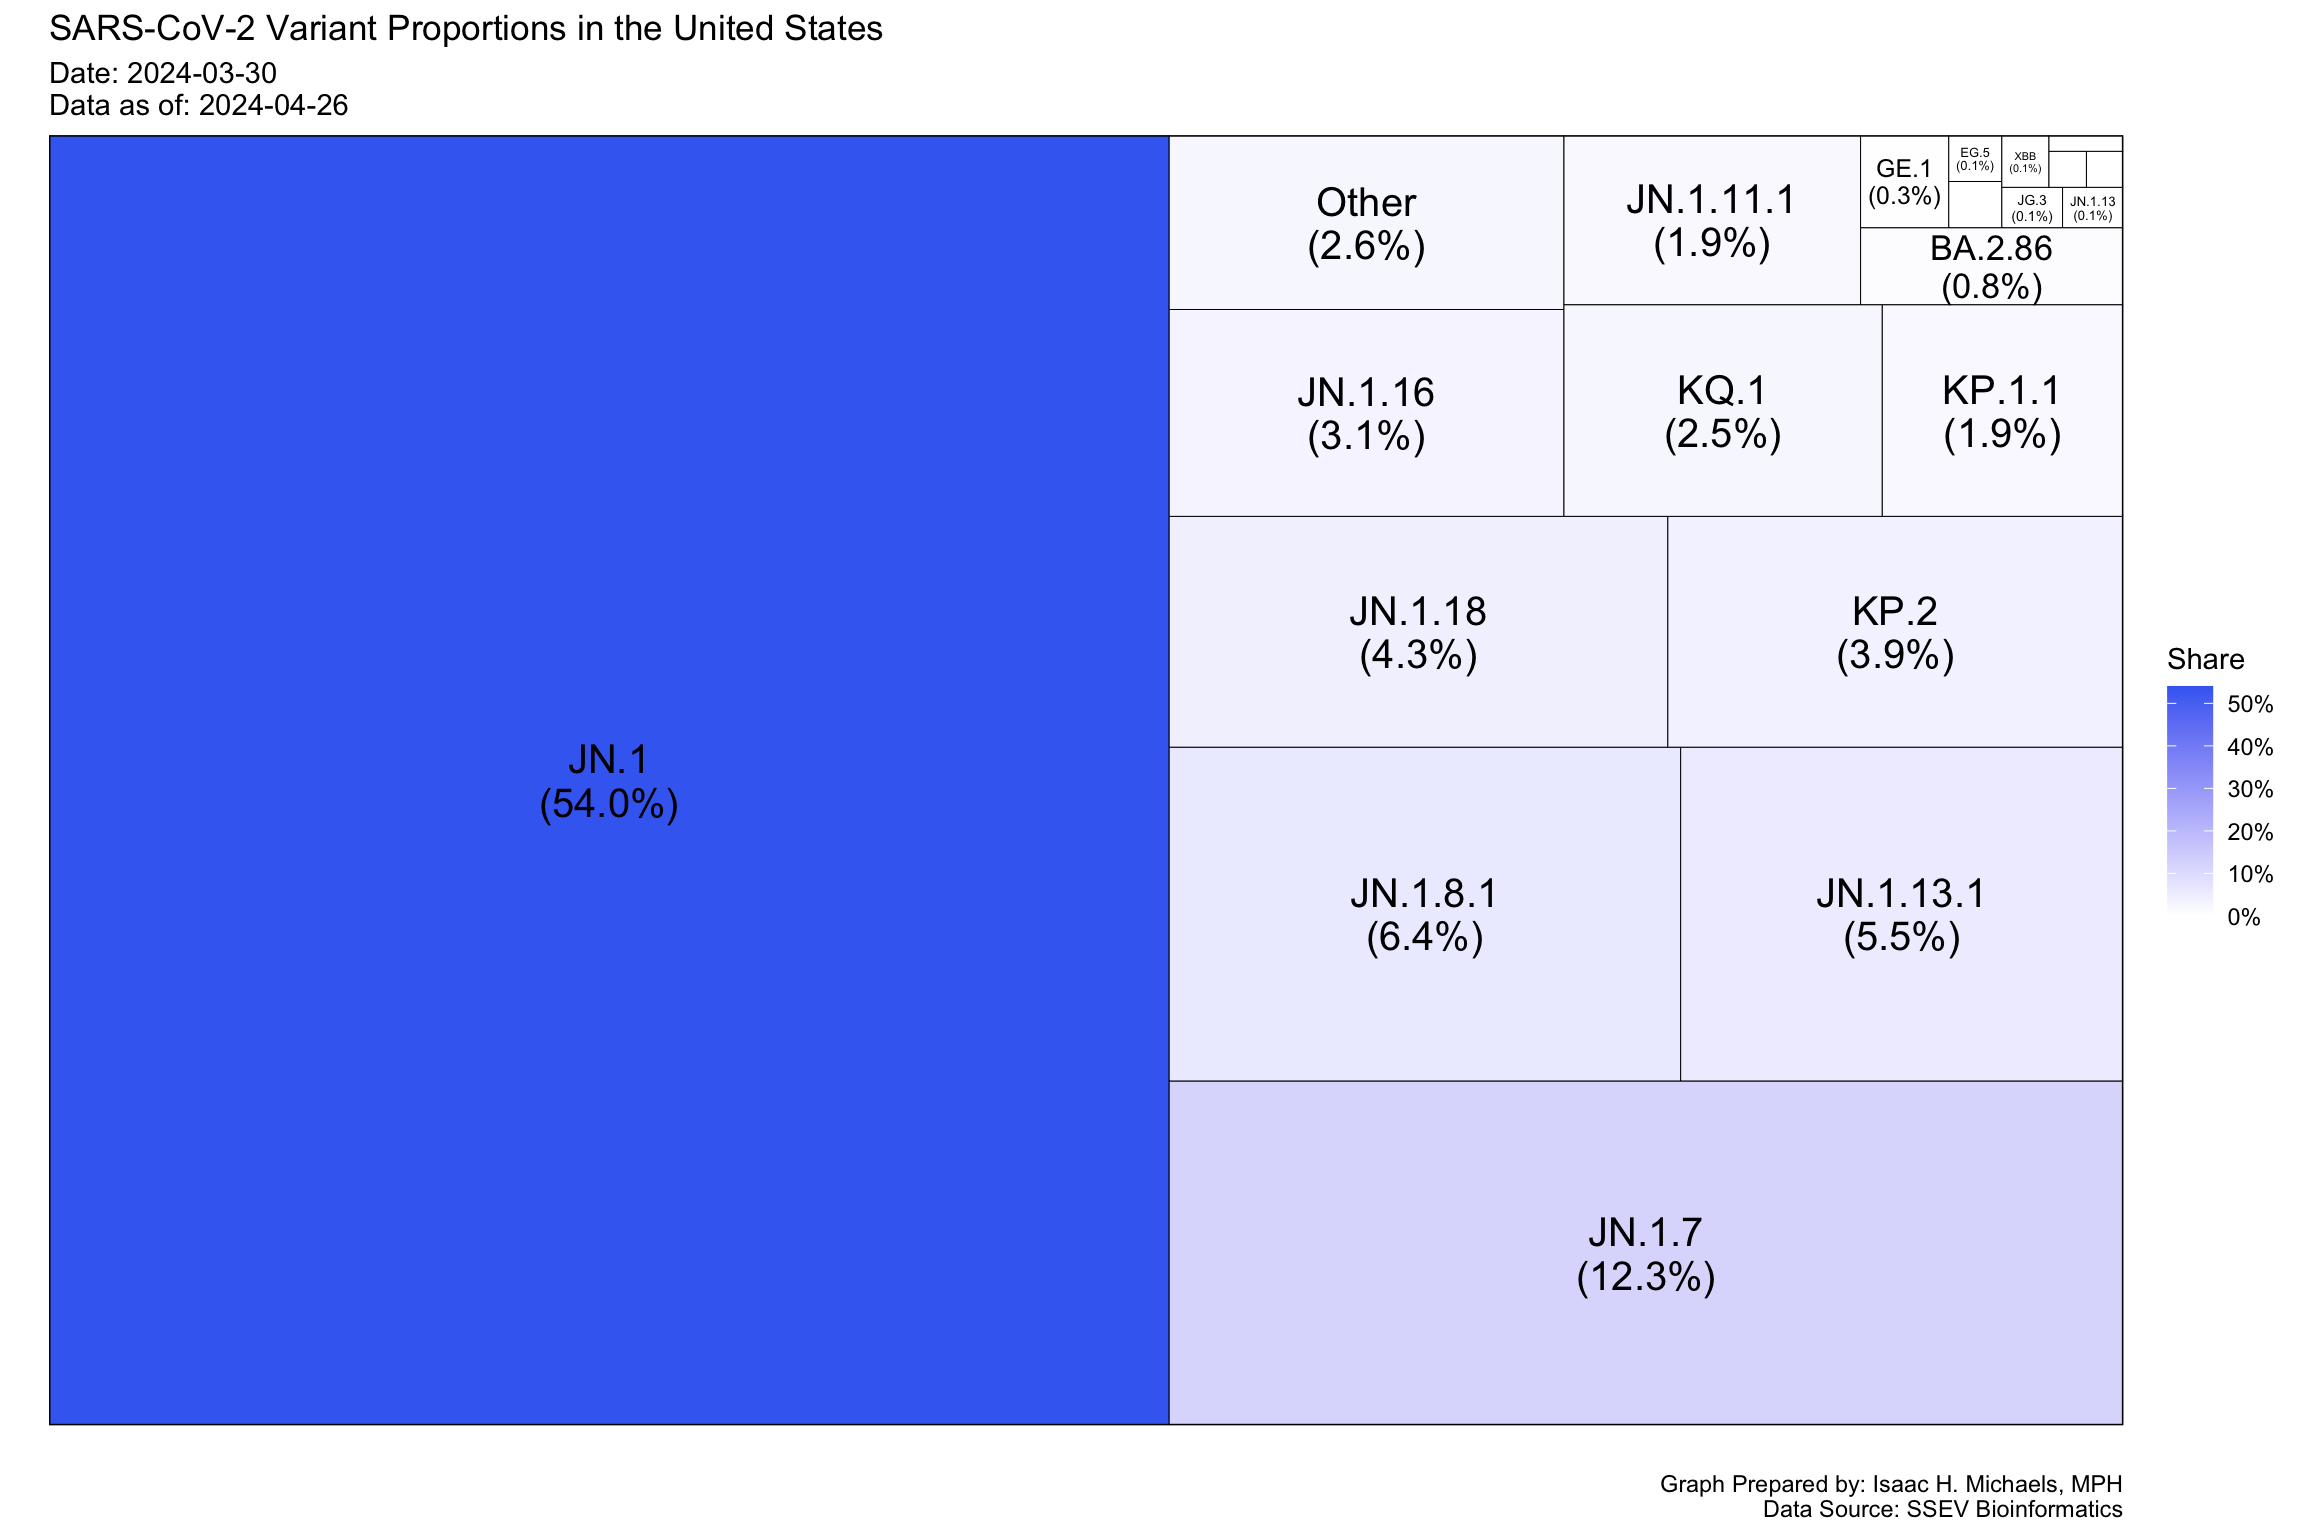
The trend graphs of cumulative COVID-19 deaths overall and by state/jurisdiction show the total number of deaths due to COVID-19 over time. The trend graph of excess deaths shows the number of deaths above what is expected based on historical trends. The trend graphs of COVID-19 vaccination by dose and the bar graph of COVID-19 vaccination by dose and state show the percentages of populations that have received one or more doses of the COVID-19 vaccine. The trend graph of COVID-19 variant proportions and the tree graph of the latest cross-section of variant proportions show the proportion of different COVID-19 variants in the United States.
What do These Data not Show?
These data do not capture the full extent of the pandemic because of delays in reporting and variations in testing and surveillance practices across states and jurisdictions.
Implications for Public Health Practice
These data have important implications for public health practice. The data can be used to monitor the impact of vaccination efforts and identify areas where additional resources and interventions may be needed. Public health professionals can also use the data to track trends in COVID-19 cases and deaths and identify areas where public health measures, such as testing, contact tracing, and vaccination campaigns, can be improved. Overall, these data provide critical information to support the ongoing public health response to the COVID-19 pandemic in the United States.
COVID-19 Deaths
Overall
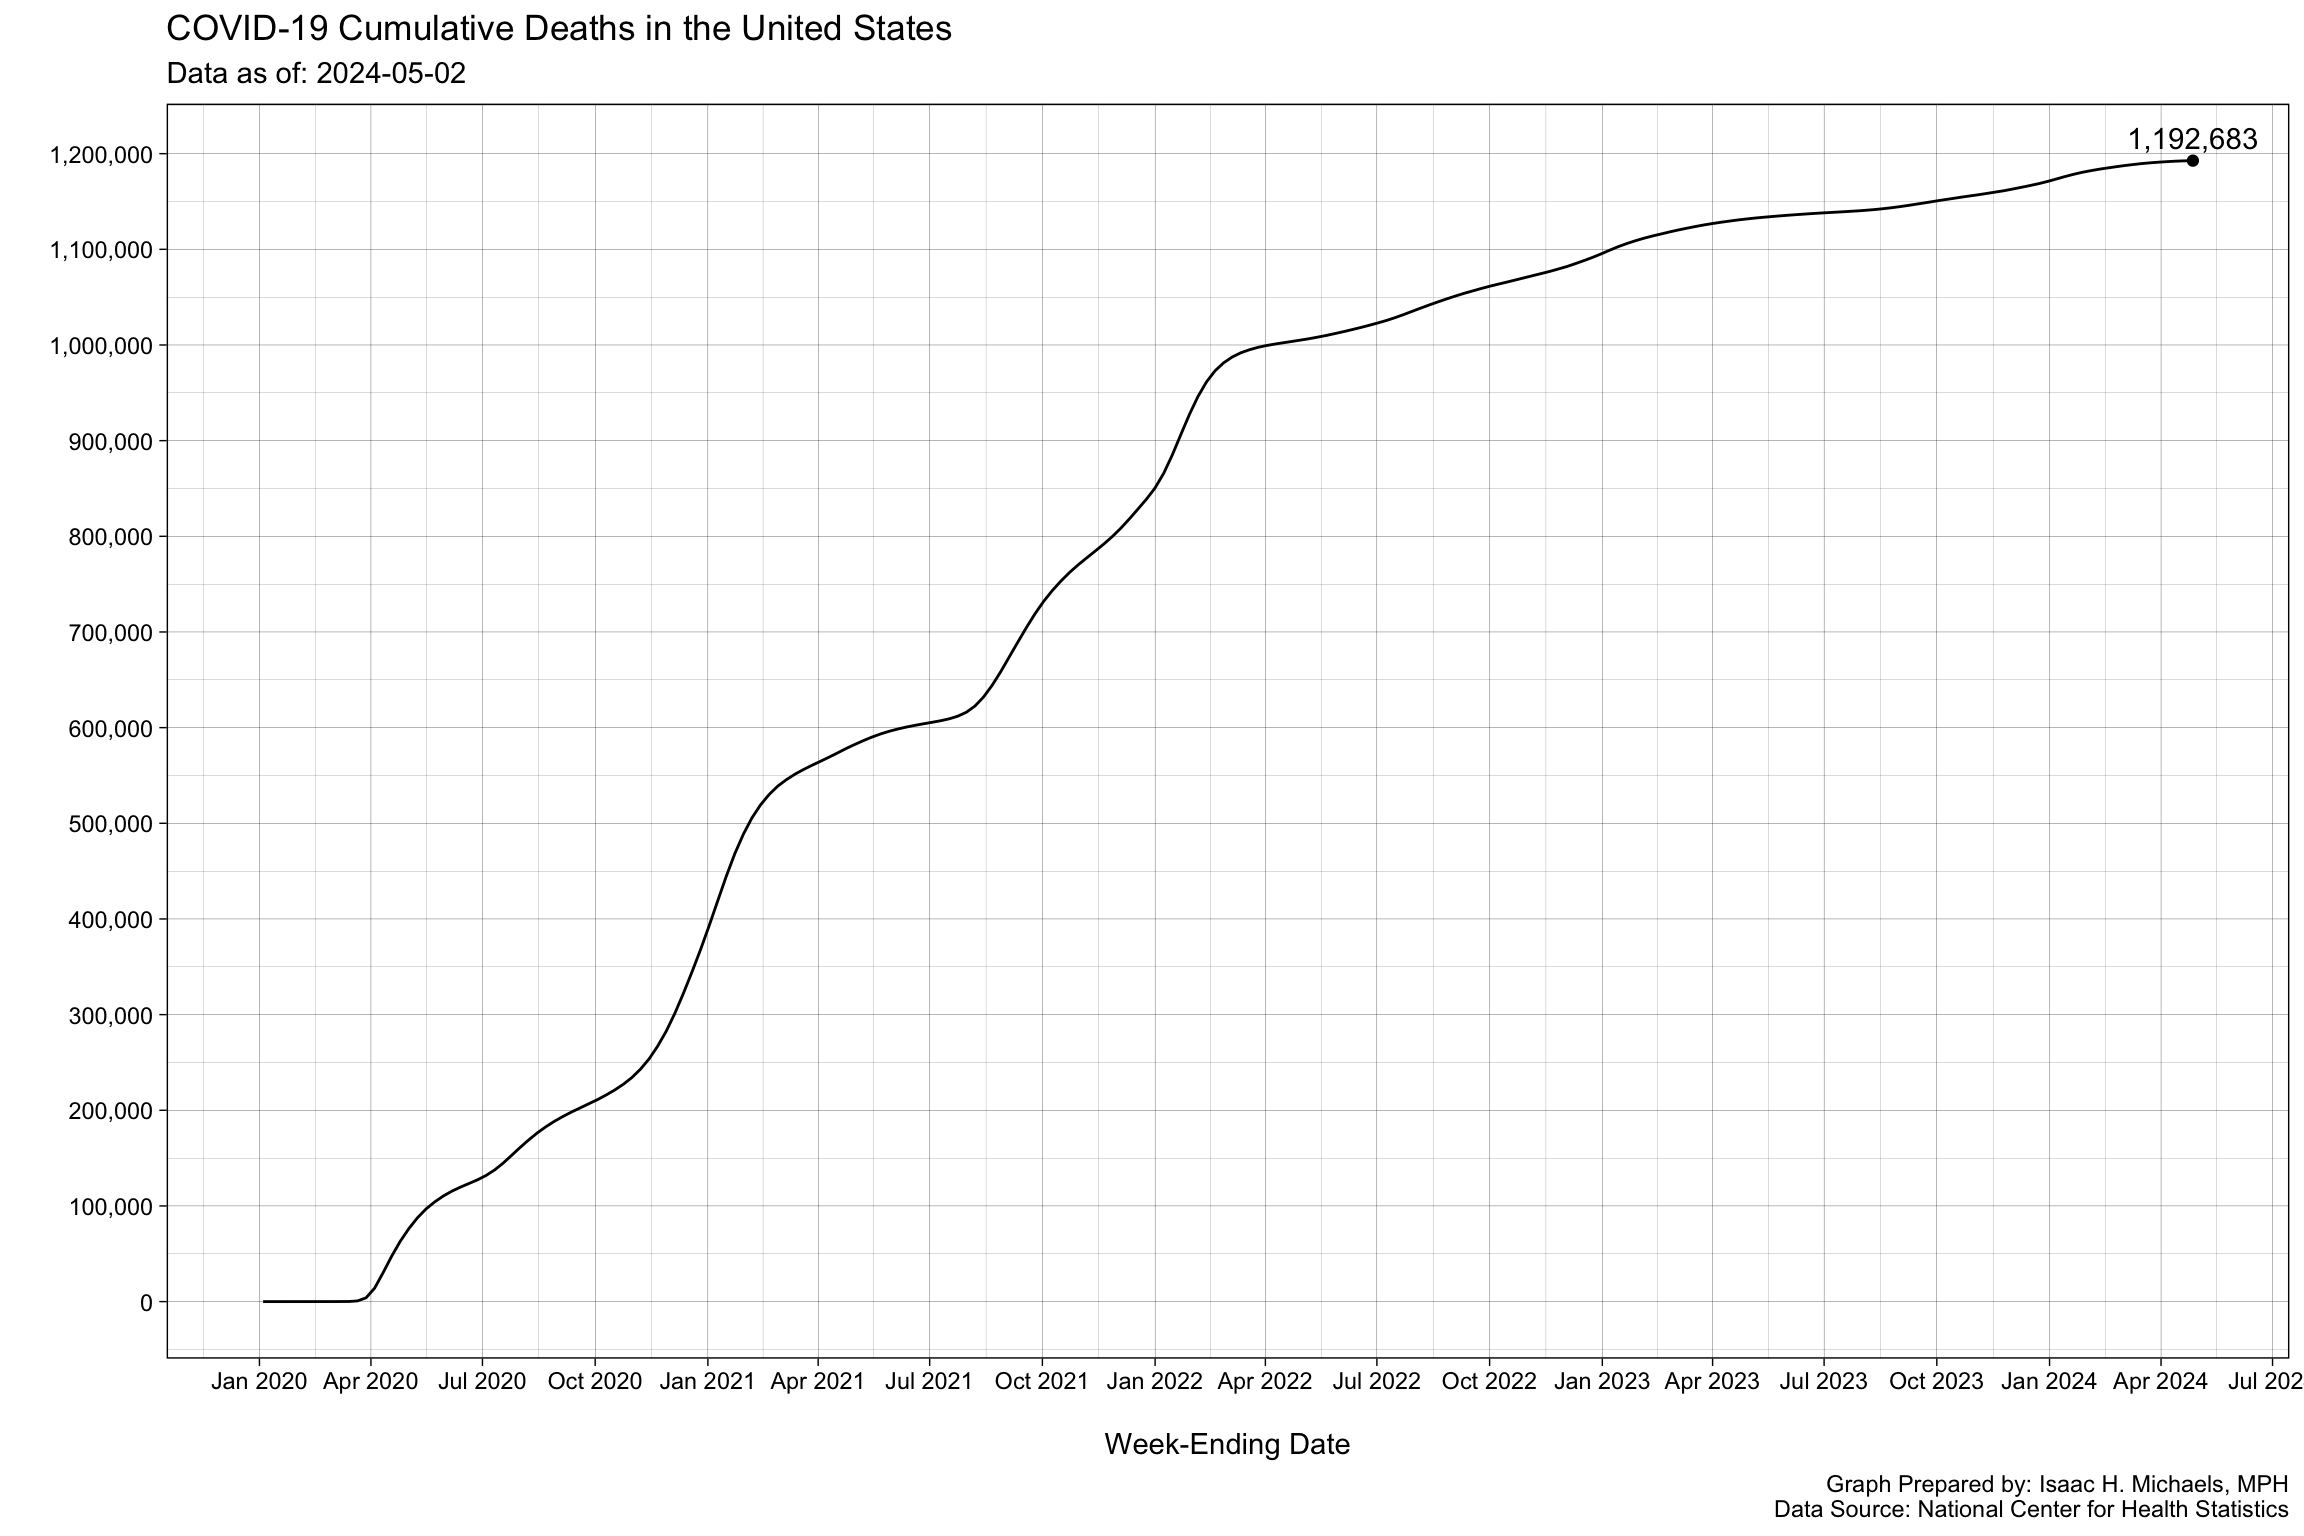
Graph Prepared by: Isaac H. Michaels, DrPH
Data Source: National Center for Health Statistics
By Jurisdiction
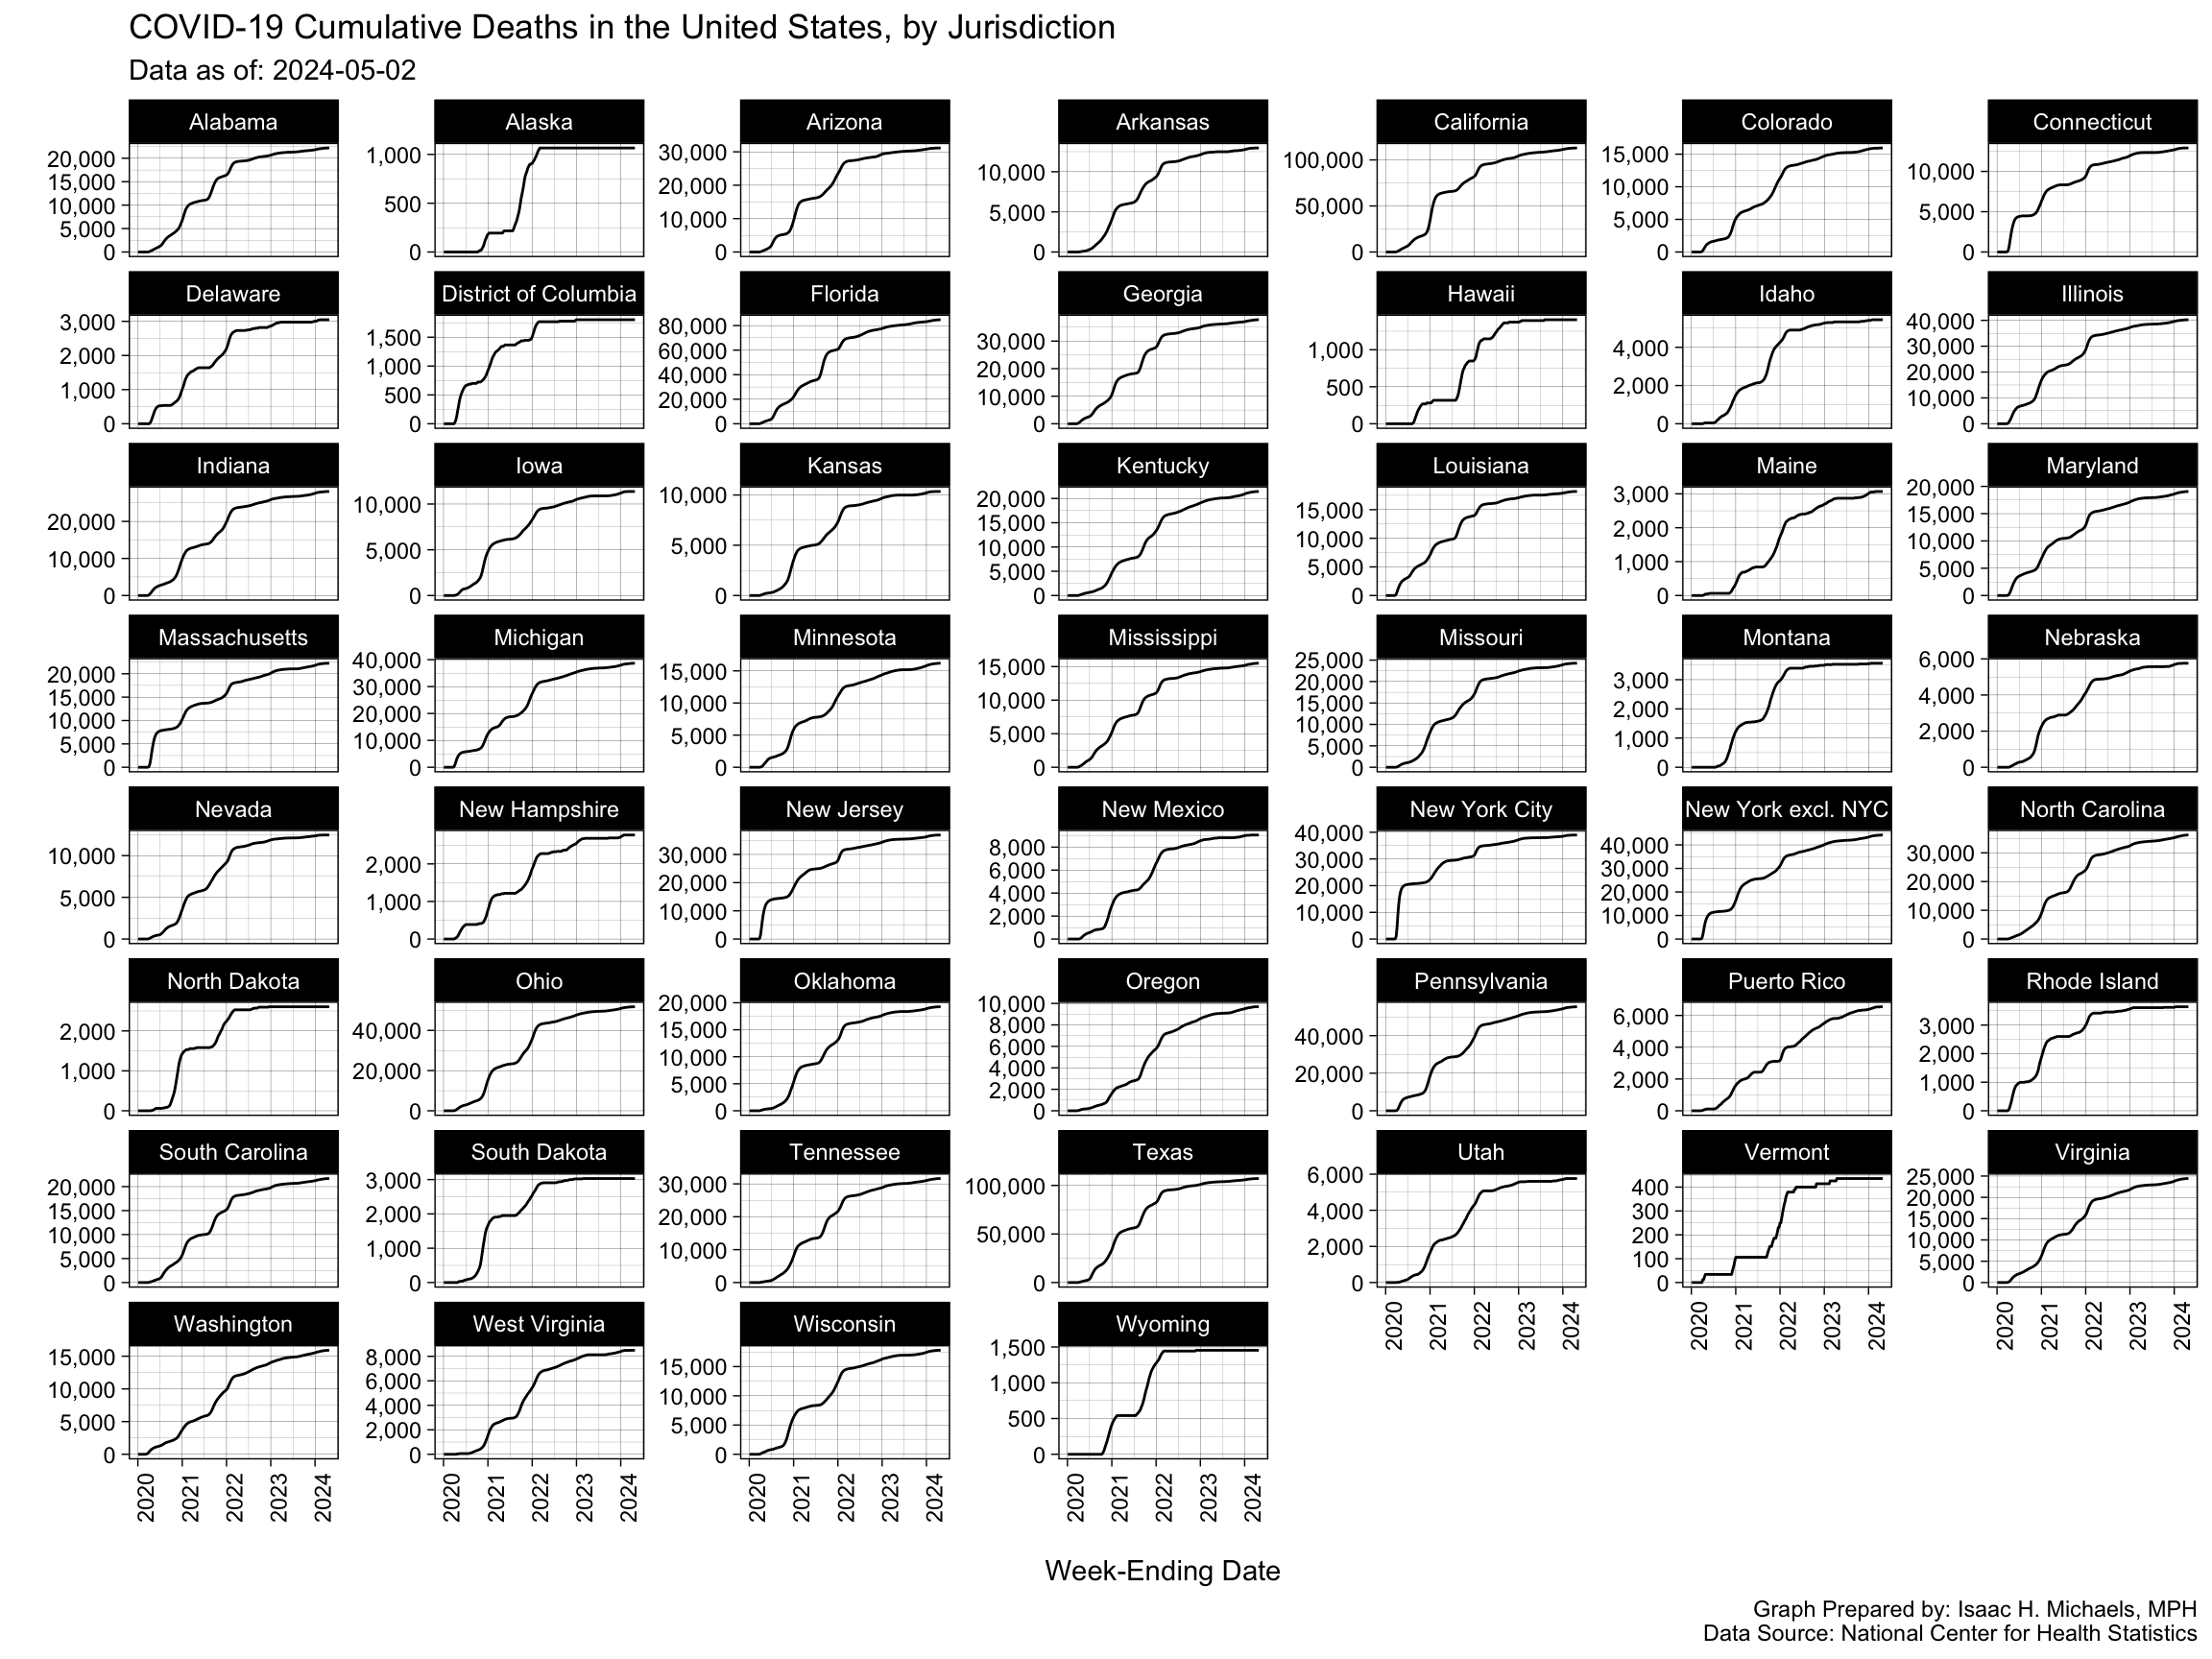
Graph Prepared by: Isaac H. Michaels, DrPH
Data Source: National Center for Health Statistics
Excess Deaths
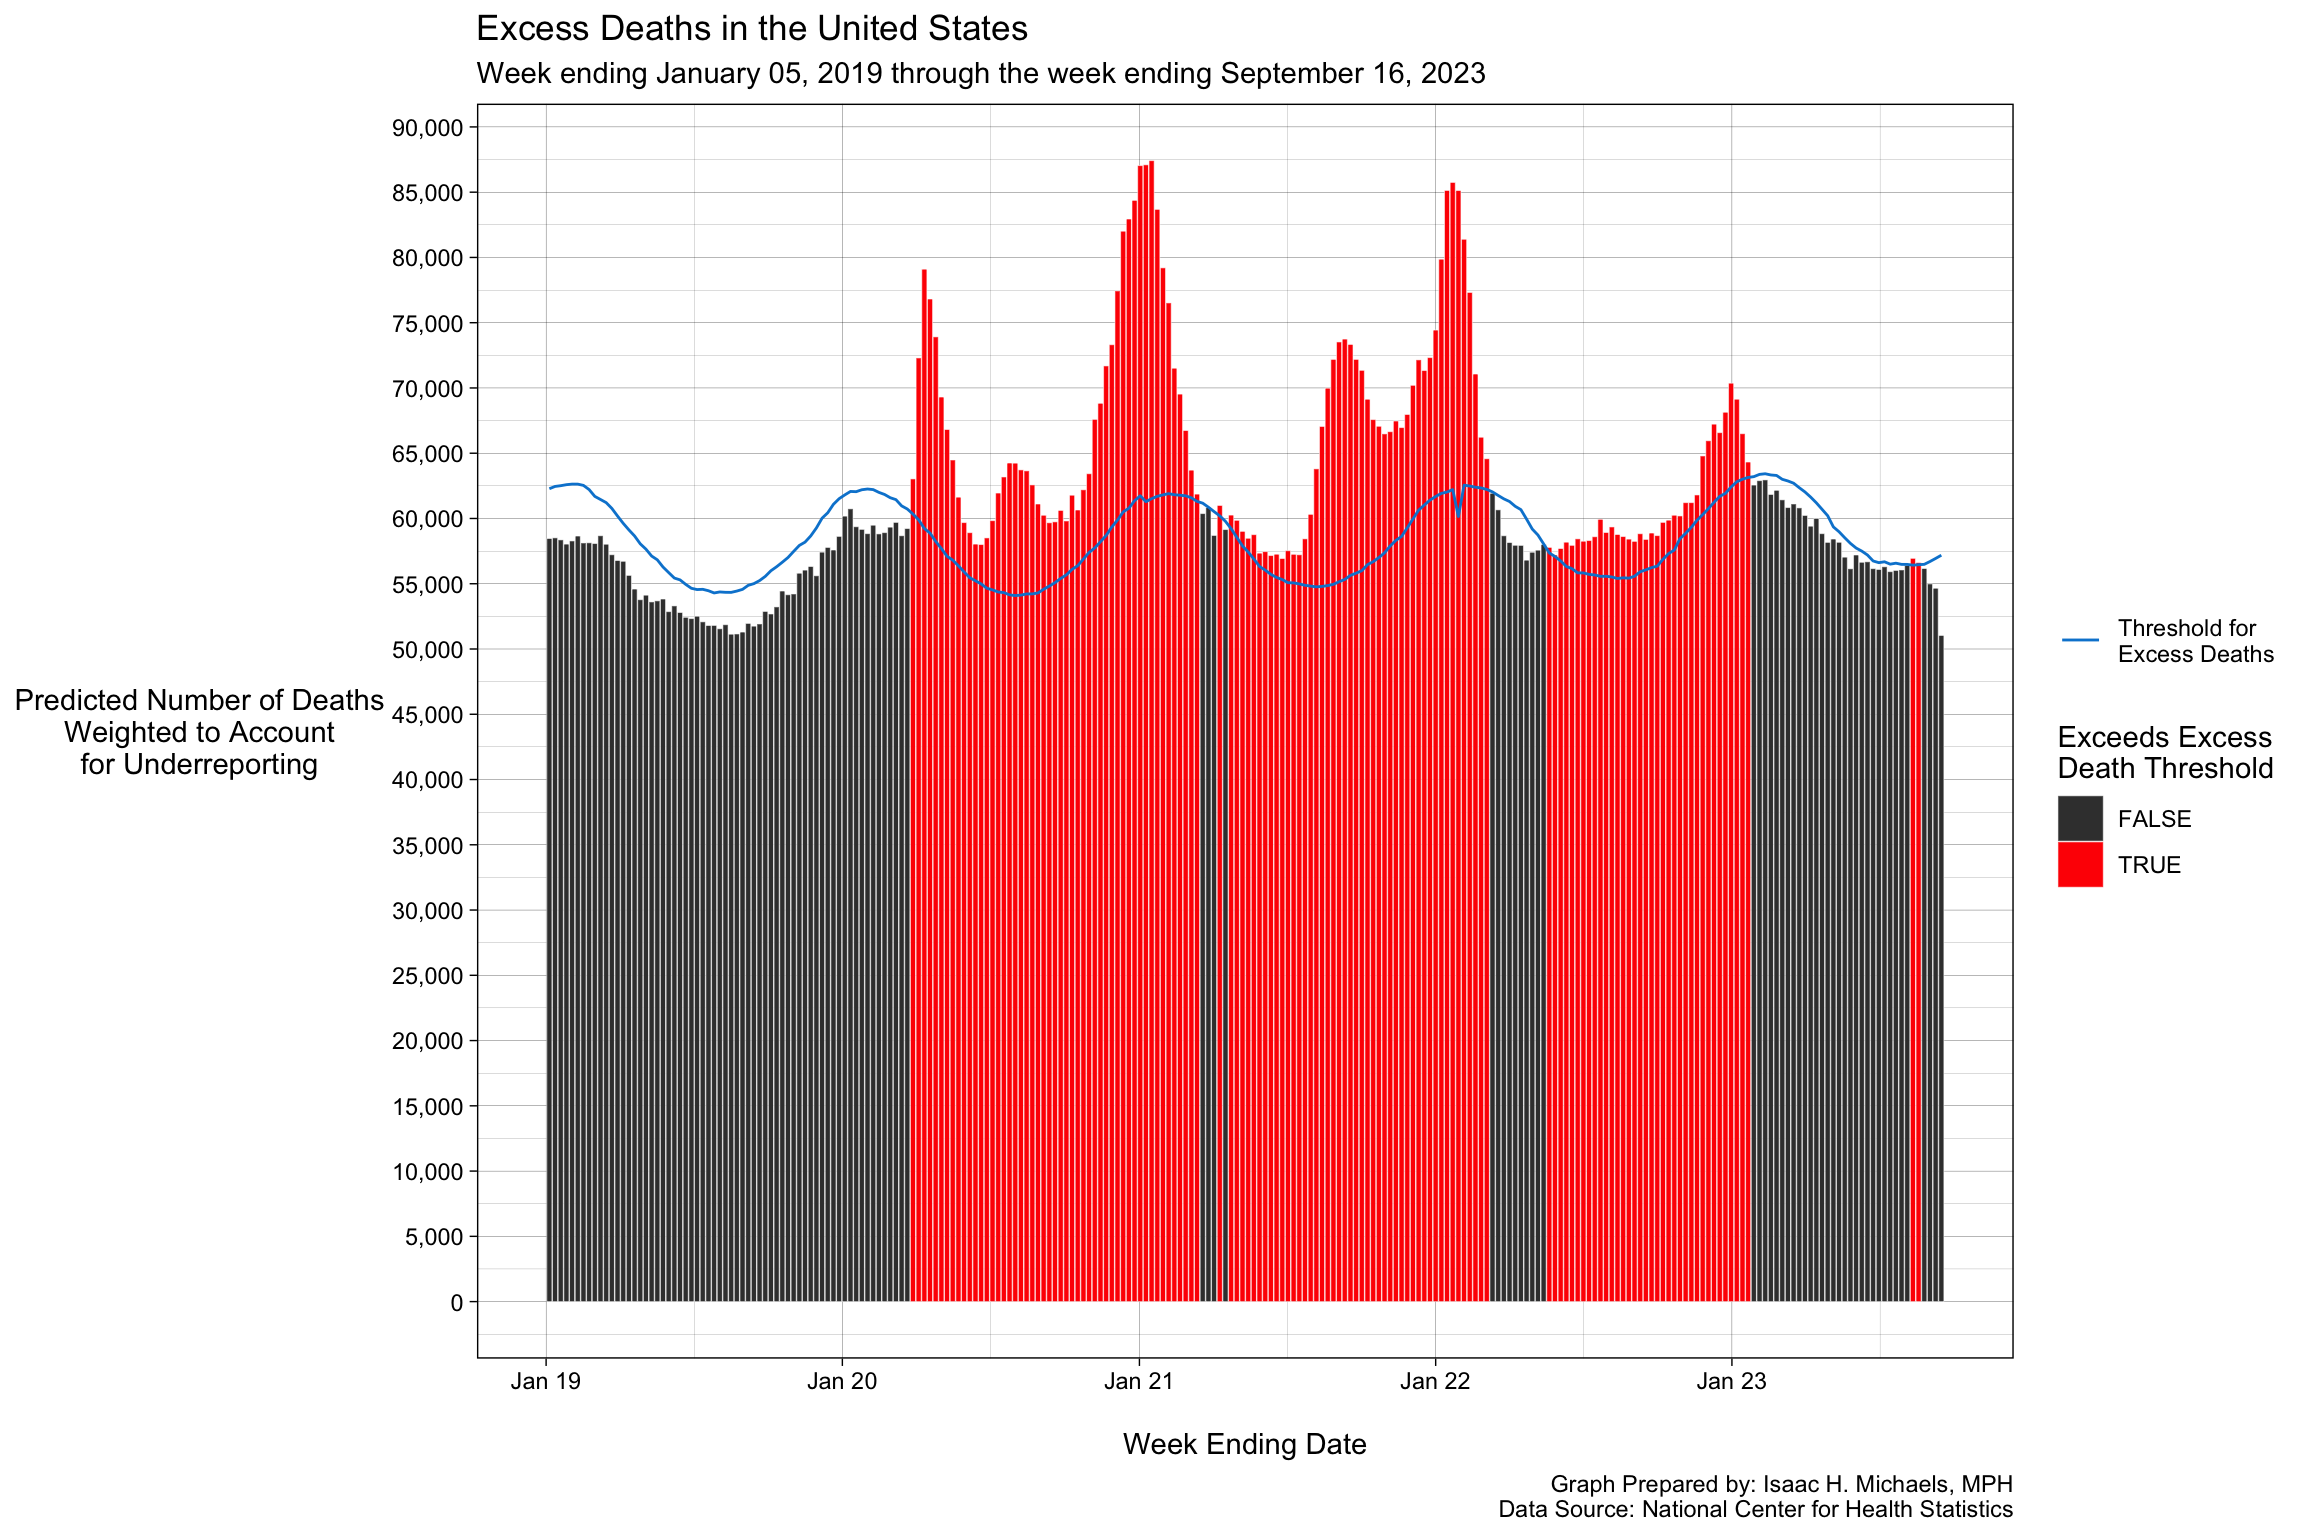
Graph Prepared by: Isaac H. Michaels, DrPH
Data Source: National Center for Health Statistics