Published: December 30, 2023
Updated: February 15, 2024 at 01:52PM
Welcome
Welcome to my personal data science website, where I focus on epidemiology and public health. On this page, I present data analyses on birth defect prevalence in New York State. The data presented here are derived from the New York State Birth Defects Registry (BDR), offering a comprehensive look at the occurrence of major birth defects among children born from 1992 to the latest available year.
Data Overview
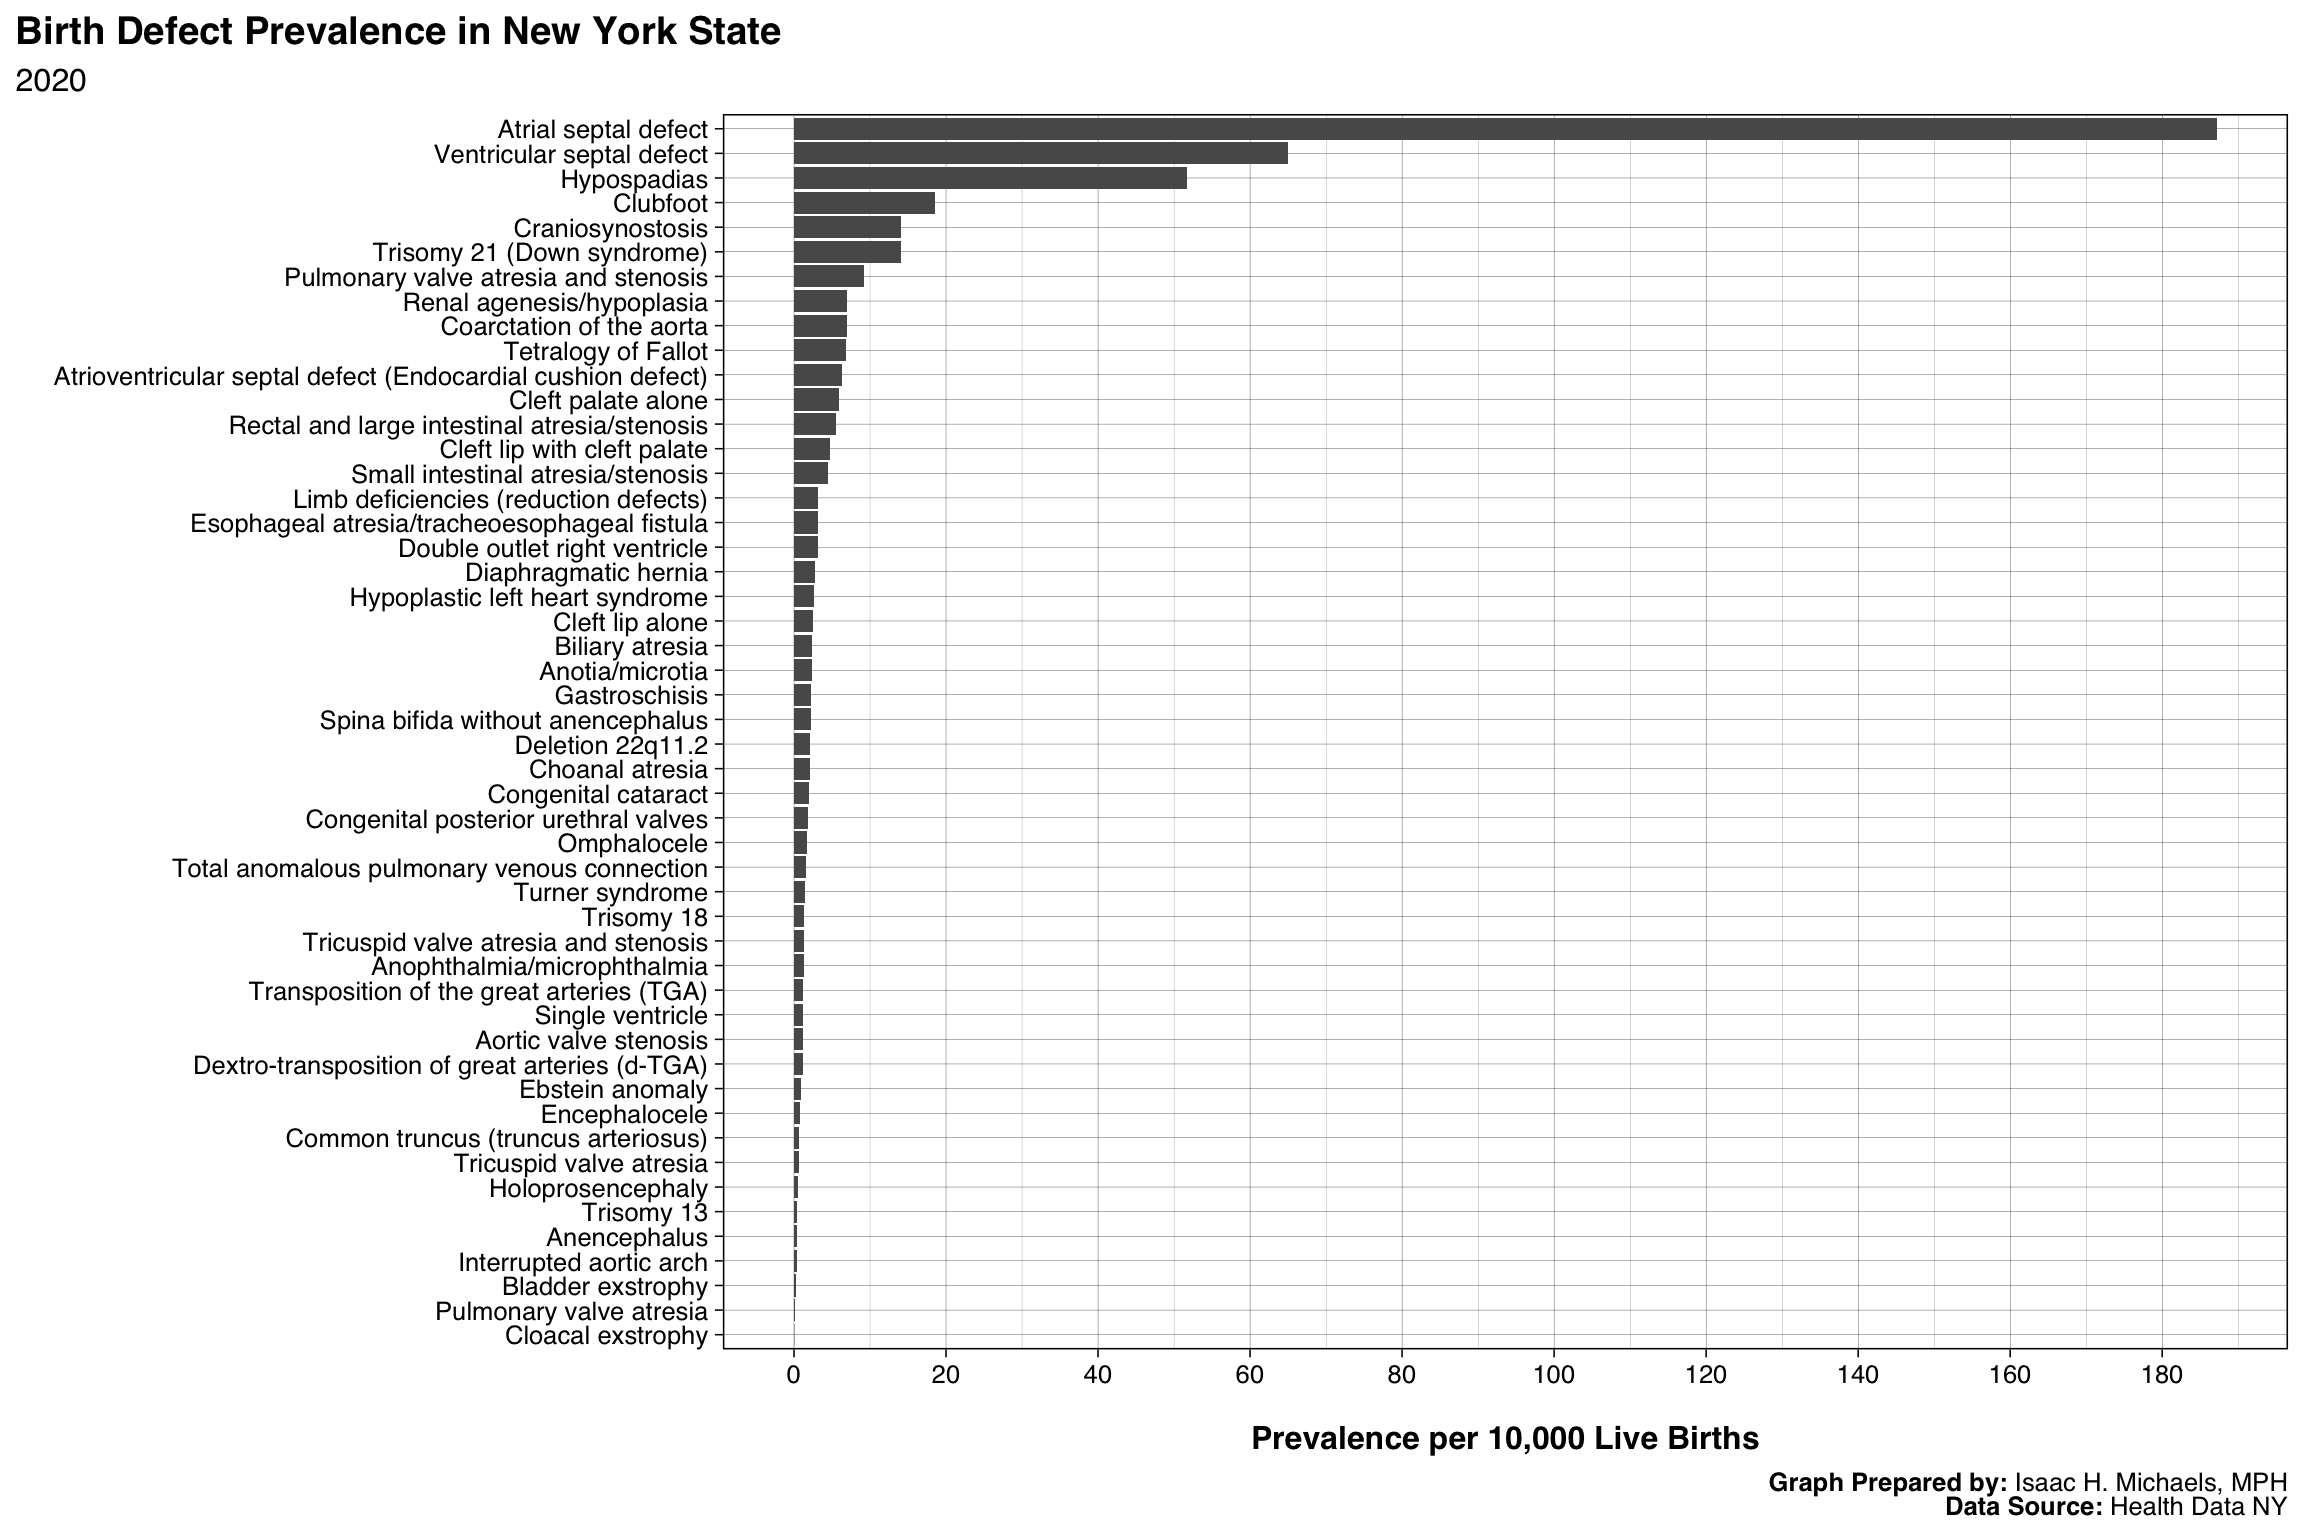
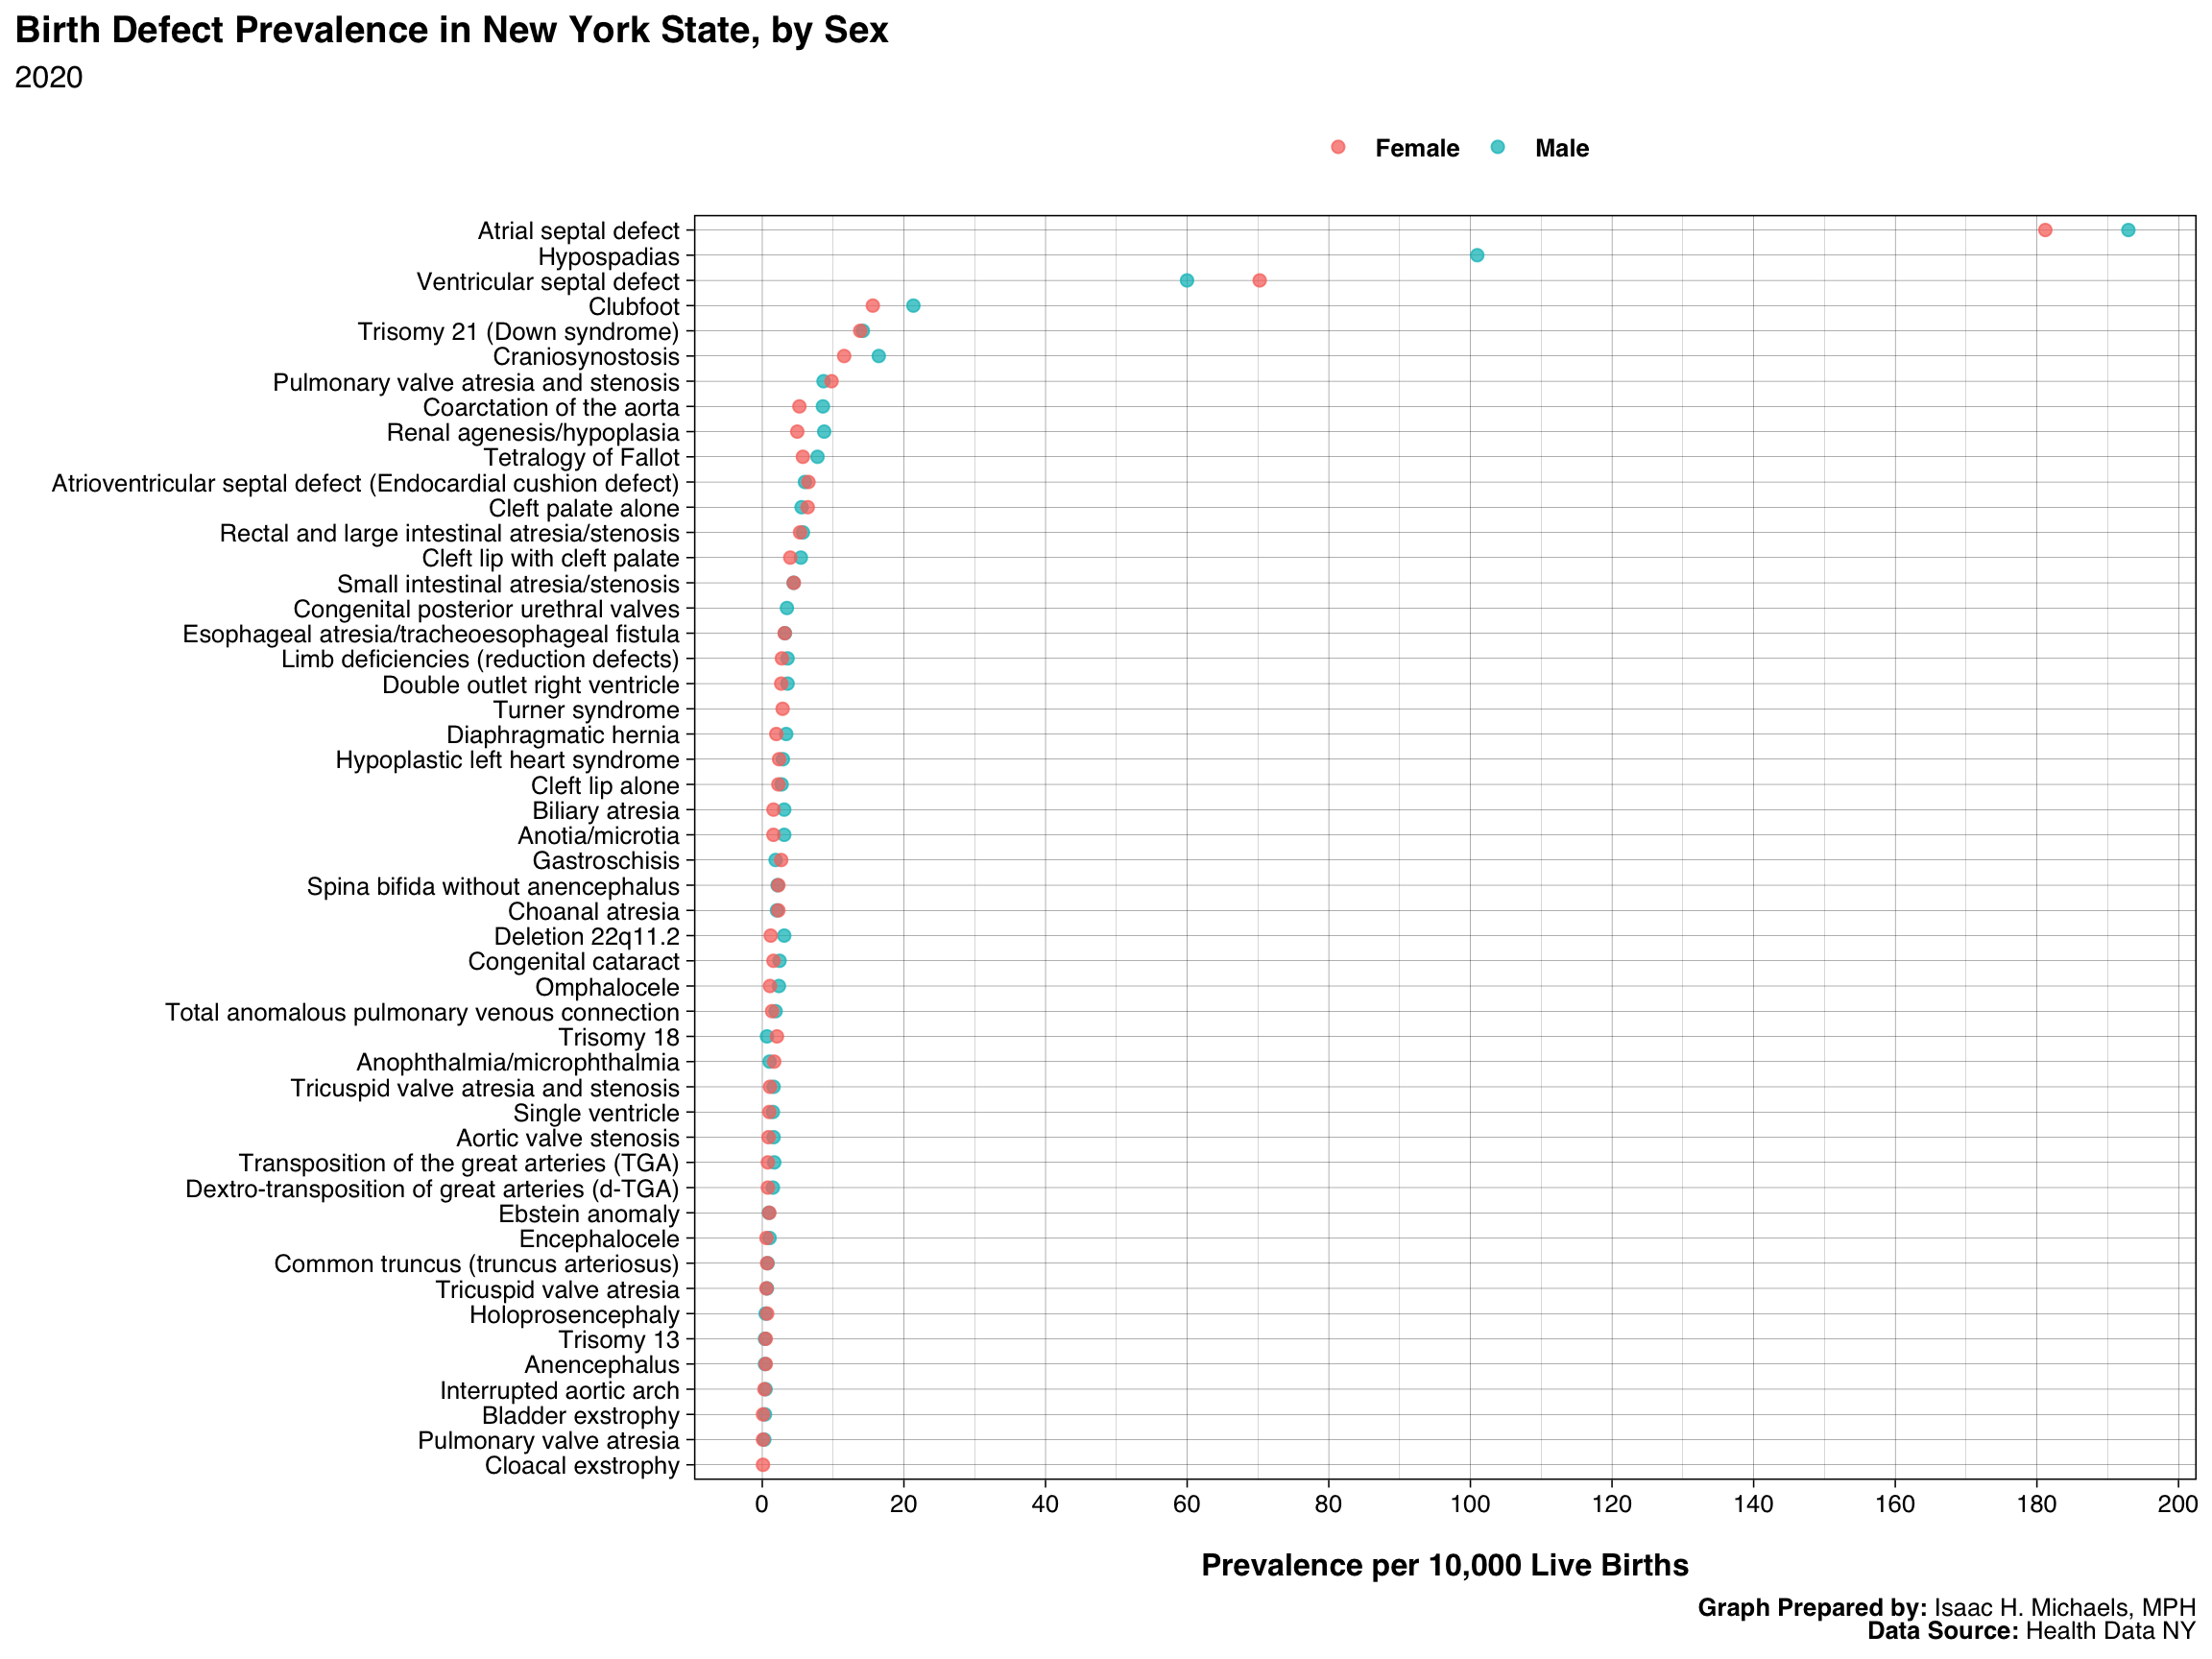
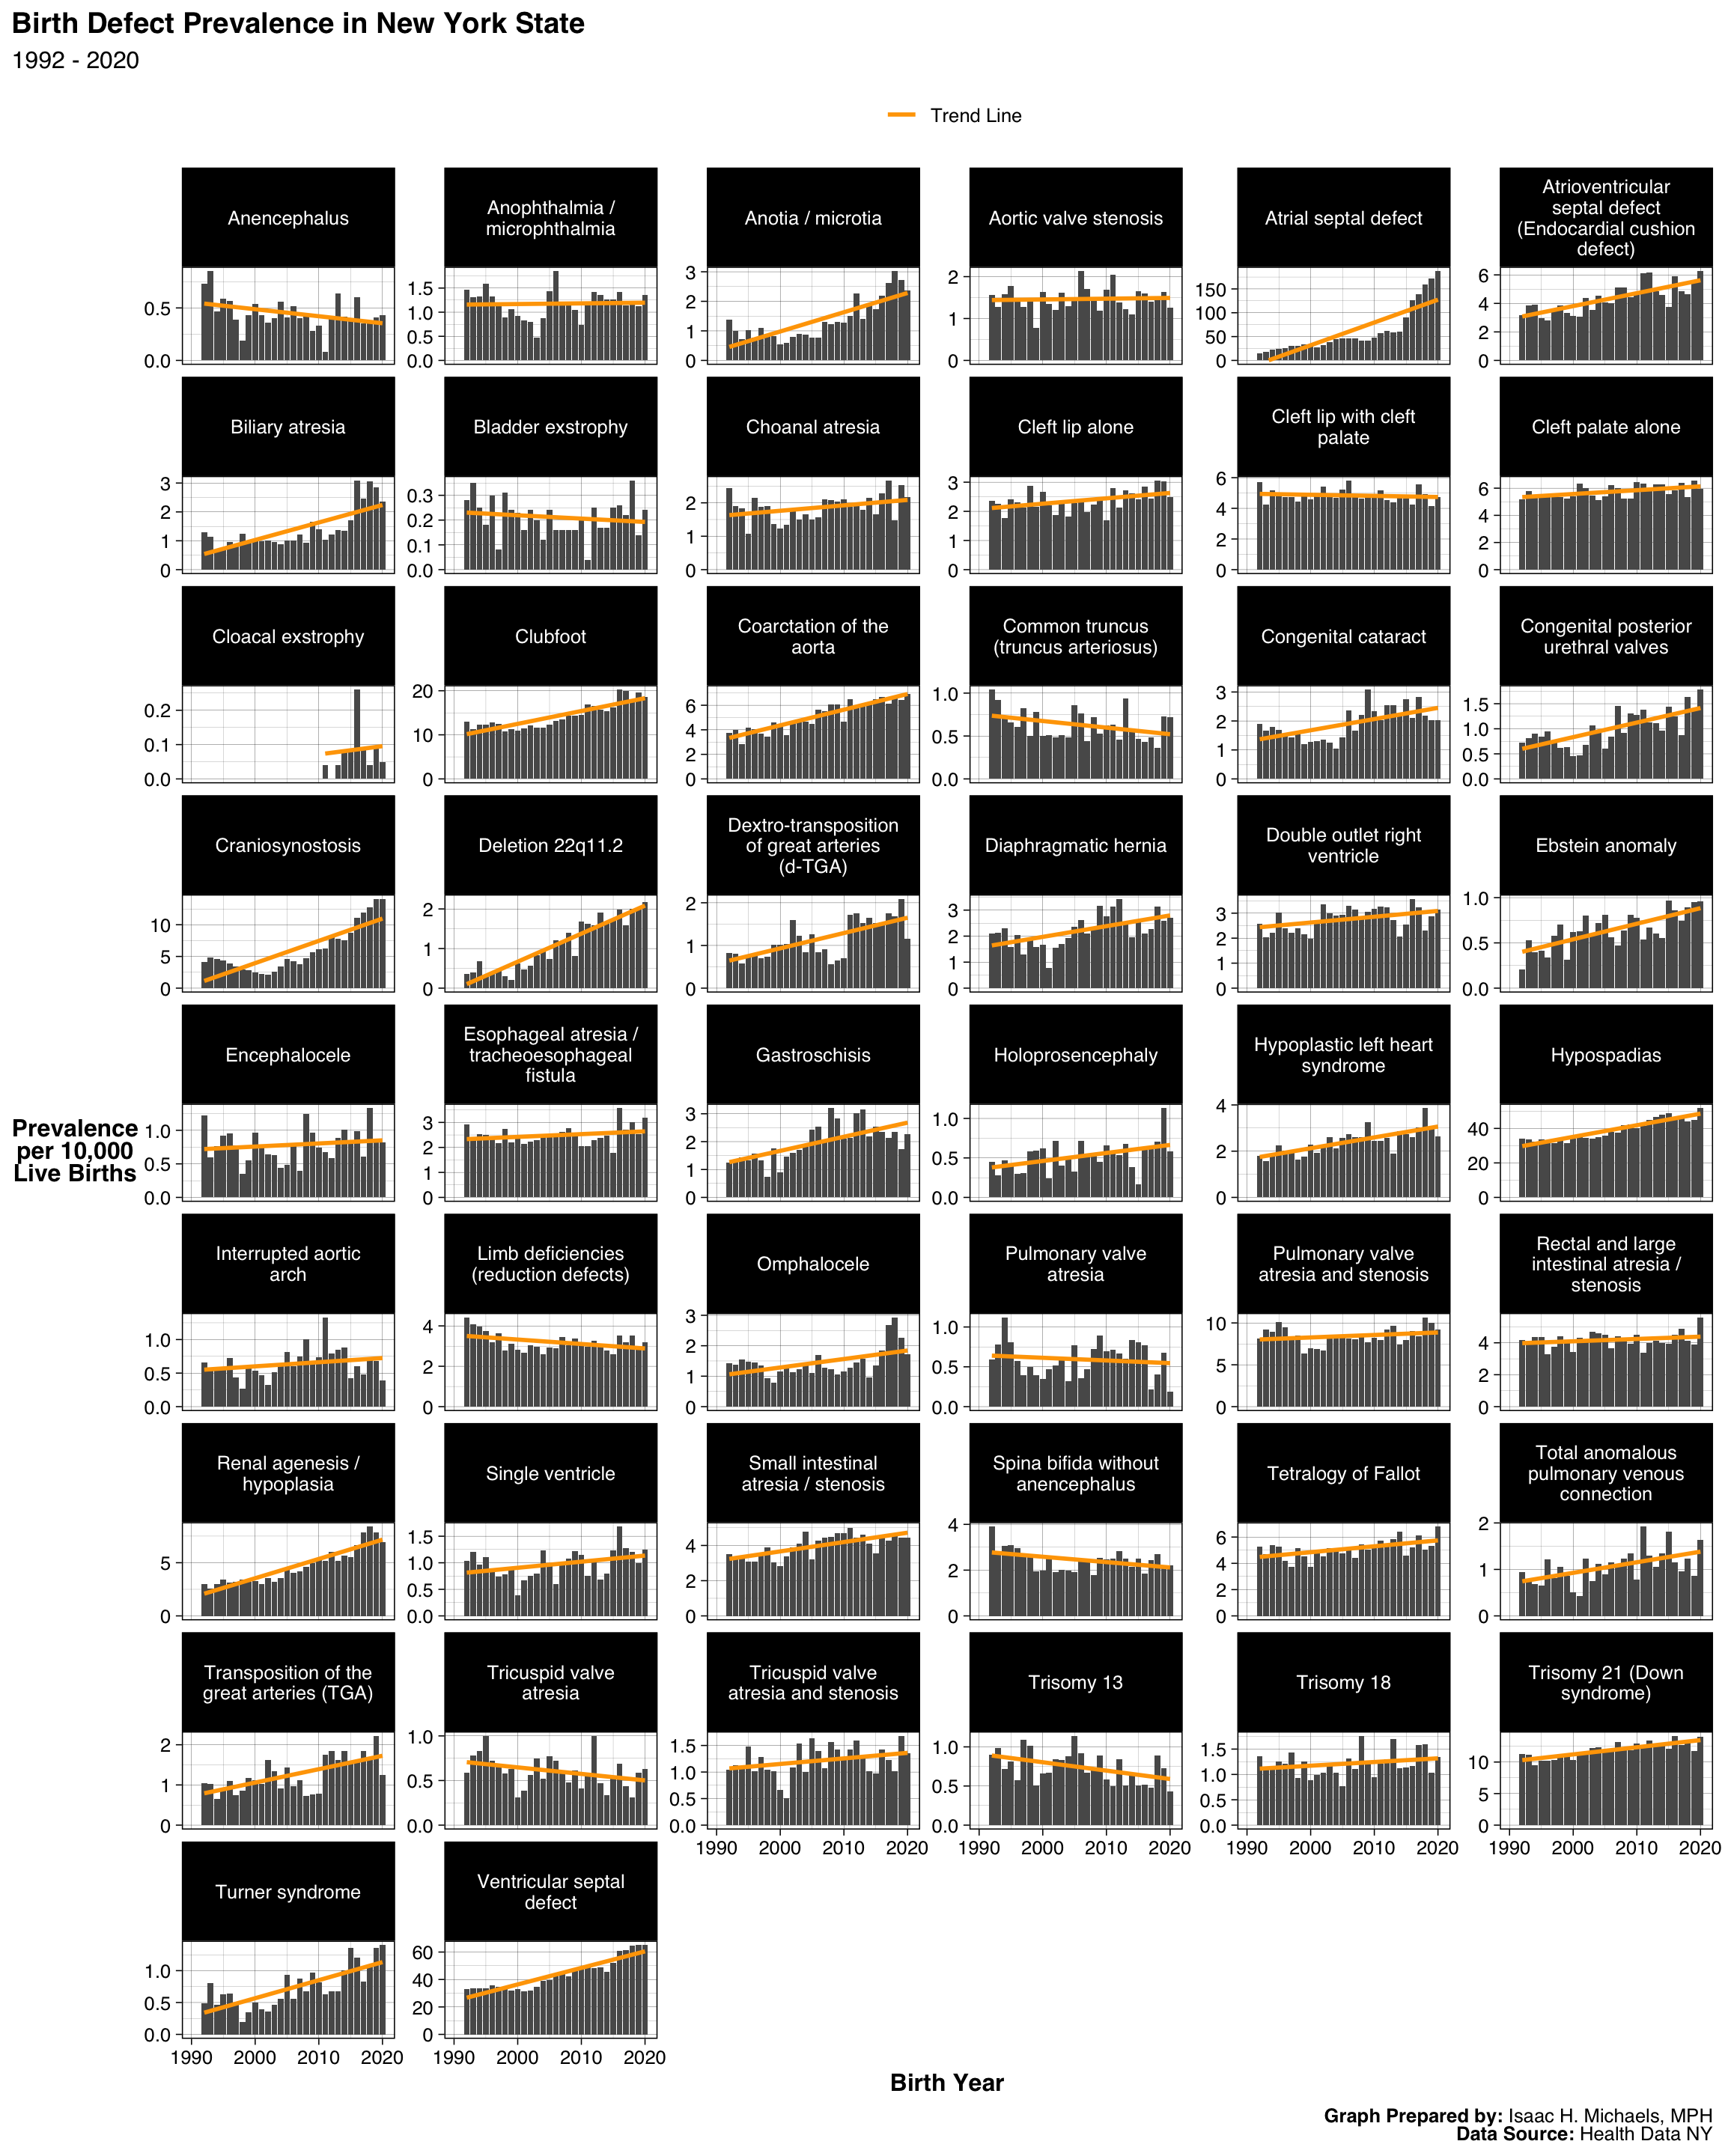
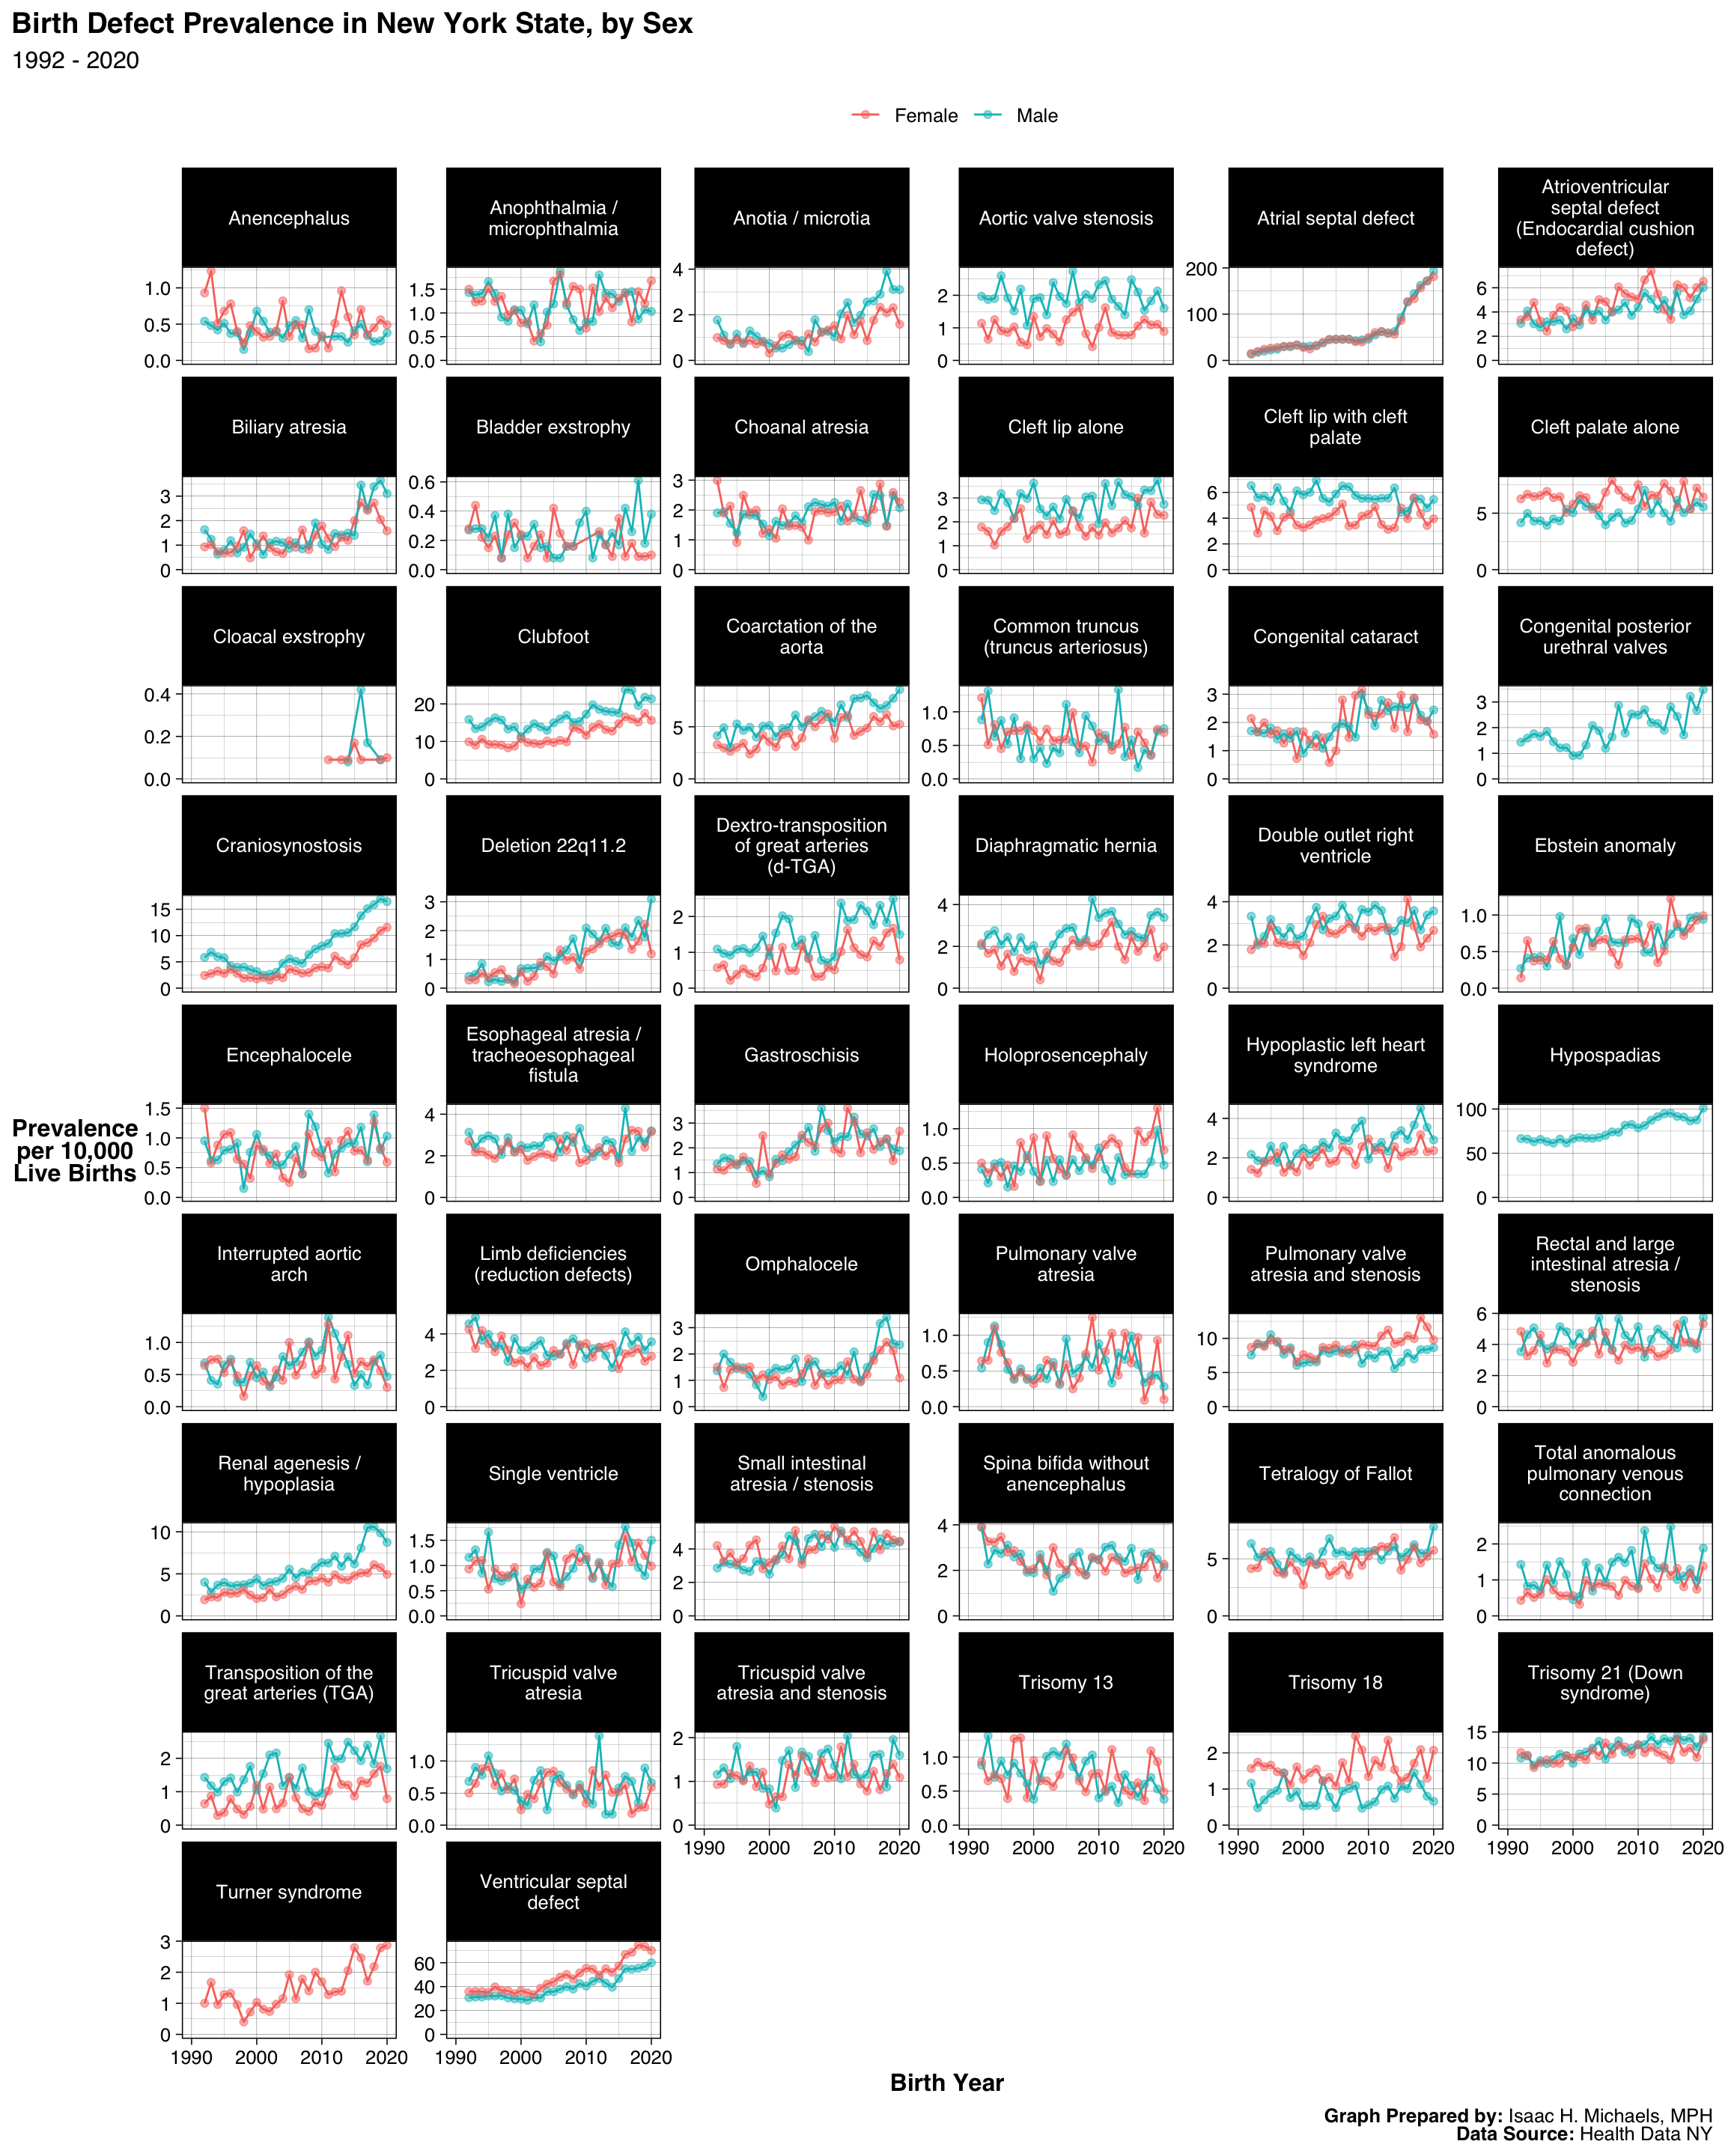
The dataset encompasses information from the entire state of New York, including New York City, and is diligently updated yearly. The Birth Defect Prevalence page incorporates a variety of visualizations to enhance the understanding of the data, including a cross-sectional bar graph illustrating prevalence by disease for the latest year, a cross-sectional dot graph showcasing prevalence by disease and sex for the same period, a set of trend graphs displaying prevalence by disease over the years, and another set of trend graphs exploring prevalence by disease, year, and sex.
How to Use These Data
Navigating through this Birth Defect Prevalence page is designed to be user-friendly. The cross-sectional graphs offer a snapshot of the latest data, while the trend graphs allow for longitudinal analysis of birth defect prevalence. You can interact with these graphs to explore specific diseases, time periods, and gender-specific trends.
Why are these data important?
Understanding birth defect prevalence is crucial for public health planning and intervention. These data can help identify patterns, assess risk factors, and guide resource allocation for the well-being of mothers and children. By delving into the intricacies of birth defect occurrences, this page aims to contribute to informed decision-making in public health.
What do these data show?
The prevalence graphs provide a visual representation of the distribution of selected major birth defects. Cross-sectional analyses highlight the latest trends, while trend graphs reveal how these trends have evolved over the years. This overview supports a nuanced understanding of the health landscape in New York State.
What do these data not show?
It’s important to note that these data do not delve into the causation of birth defects. While the trends are indicative of prevalence, further research is needed to establish causal relationships and identify specific risk factors. Additionally, the dataset does not include information on children born to non-residents.
Implications for Public Health Practice
The insights derived from these data can inform public health practices in several ways. Identifying areas with higher prevalence rates can guide targeted interventions and resource allocation. Moreover, recognizing gender-specific trends can aid in tailoring healthcare strategies to meet the diverse needs of the population.
This page aims to contribute to the ongoing dialogue surrounding public health in New York State. By regularly updating these analyses, I hope to provide a valuable resource for researchers, policymakers, and the public interested in understanding and improving maternal and child health. Your engagement with this data is essential in shaping a healthier future for our communities.