Published: March 23, 2022
Updated: May 02, 2025 at 09:38PM
Overview
Welcome to this analysis of energy-related data in New York State. This page presents an overview of the datasets used in the analysis, including greenhouse gas emissions, electric generation by fuel type, and gasoline retail prices. It also provides an overview of monthly temperature and precipitation data. The purpose of this analysis is to understand trends and patterns in energy usage and emissions in New York and to consider the implications of these trends for practice and policy.
Data Sources
The data used in this analysis consists of:
Greenhouse Gas Emissions
Greenhouse gas emissions in New York State from 1990 to the most recent year available, provided by the Department of Environmental Conservation Electric generation by fuel type in New York State from 1960 to the most recent year available, provided by the New York State Energy Research and Development Authority Weekly average gasoline retail prices by region in New York State from October 2007 to the most recent week available, provided by the New York State Energy Research and Development Authority Monthly temperature and precipitation data for the contiguous United States from 1895 to the most recent month available, provided by the National Oceanic and Atmospheric Administration.
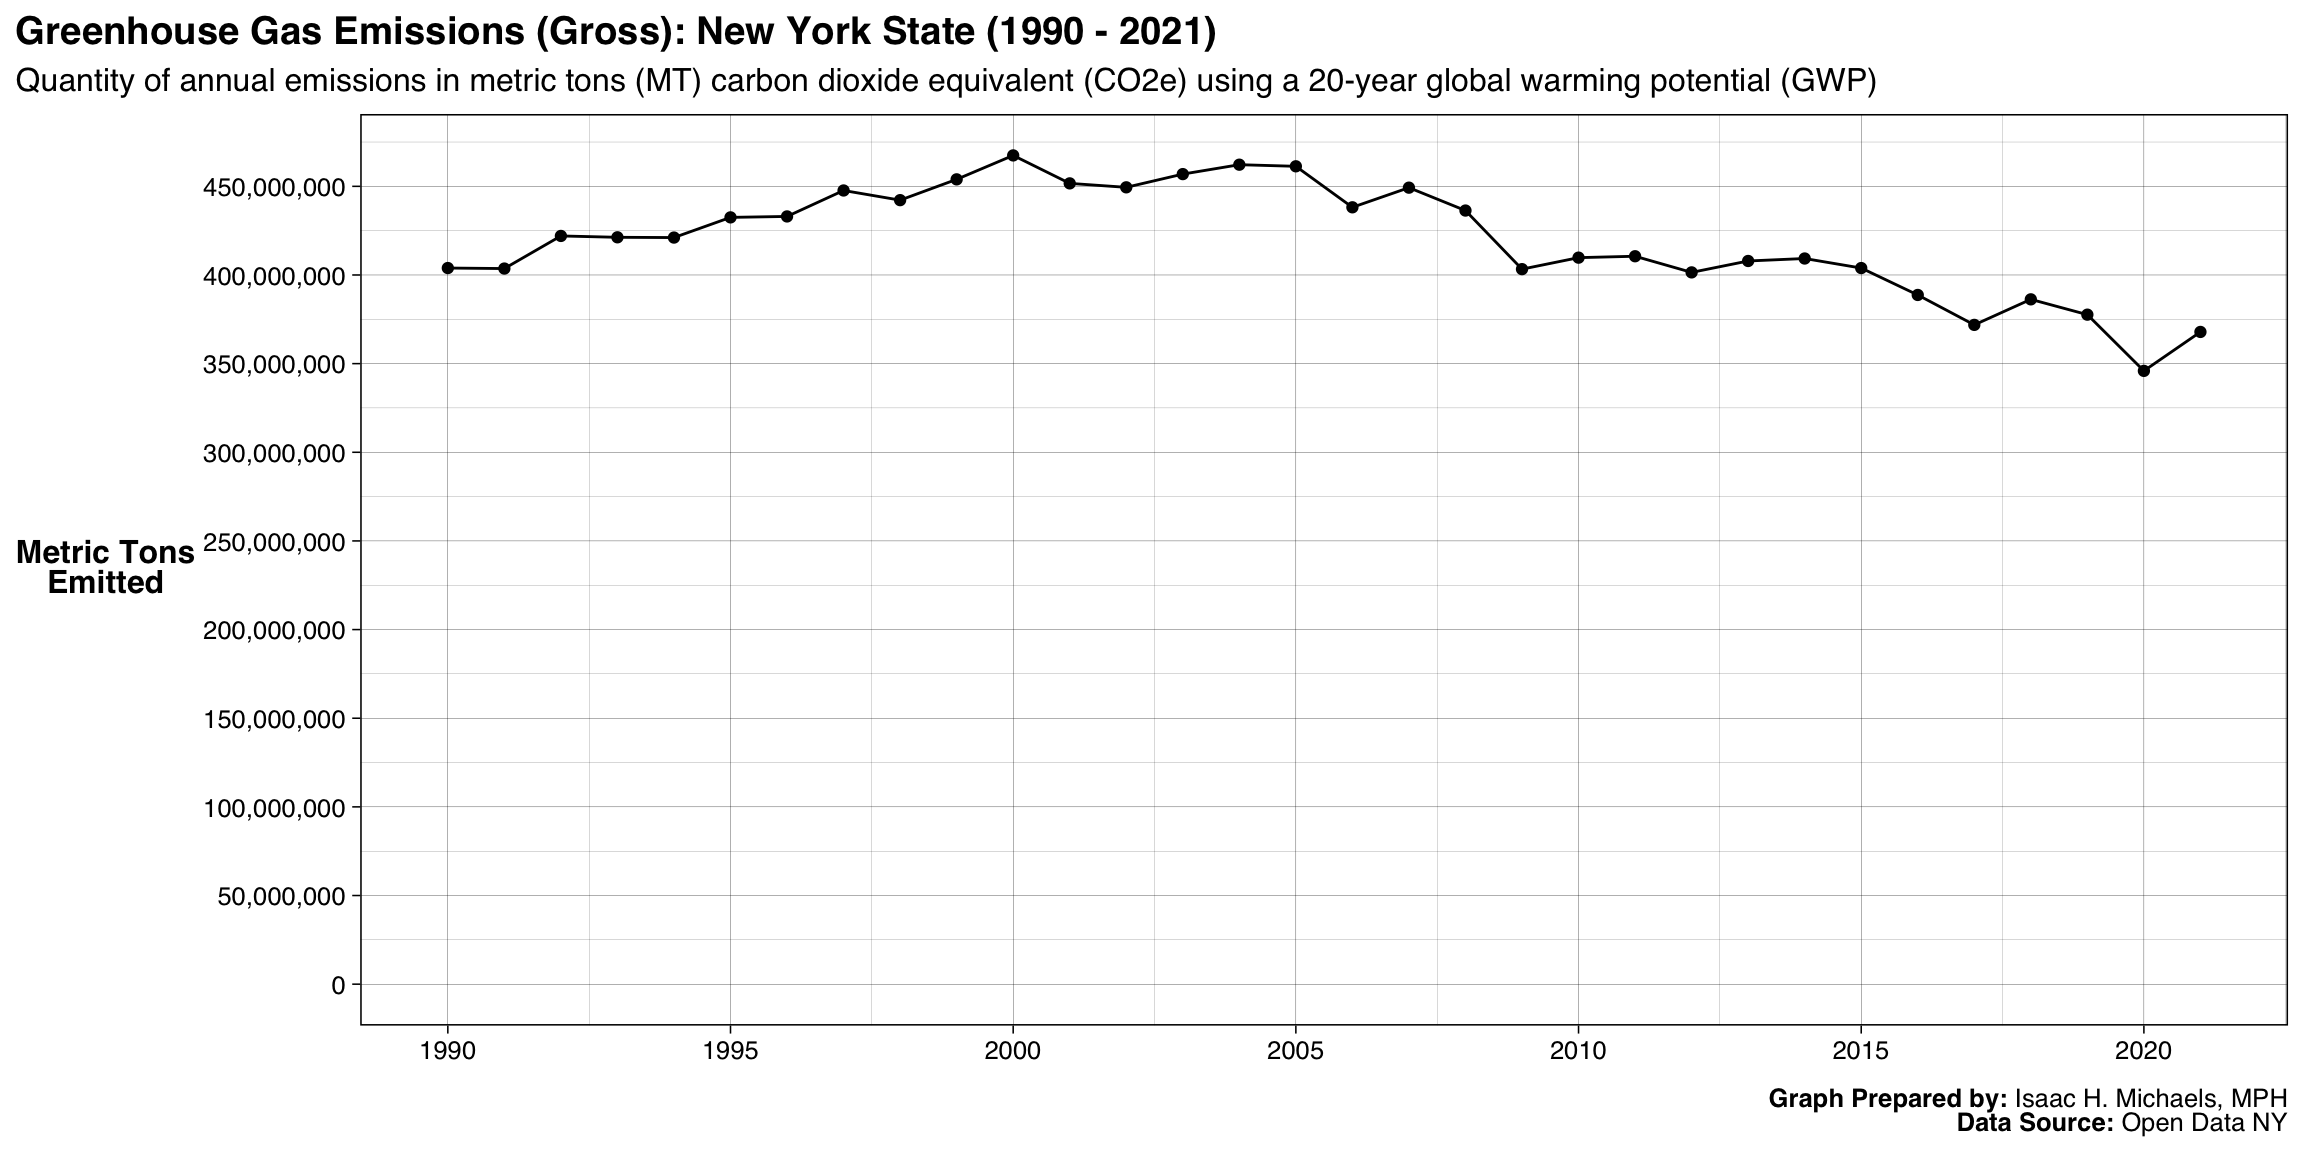
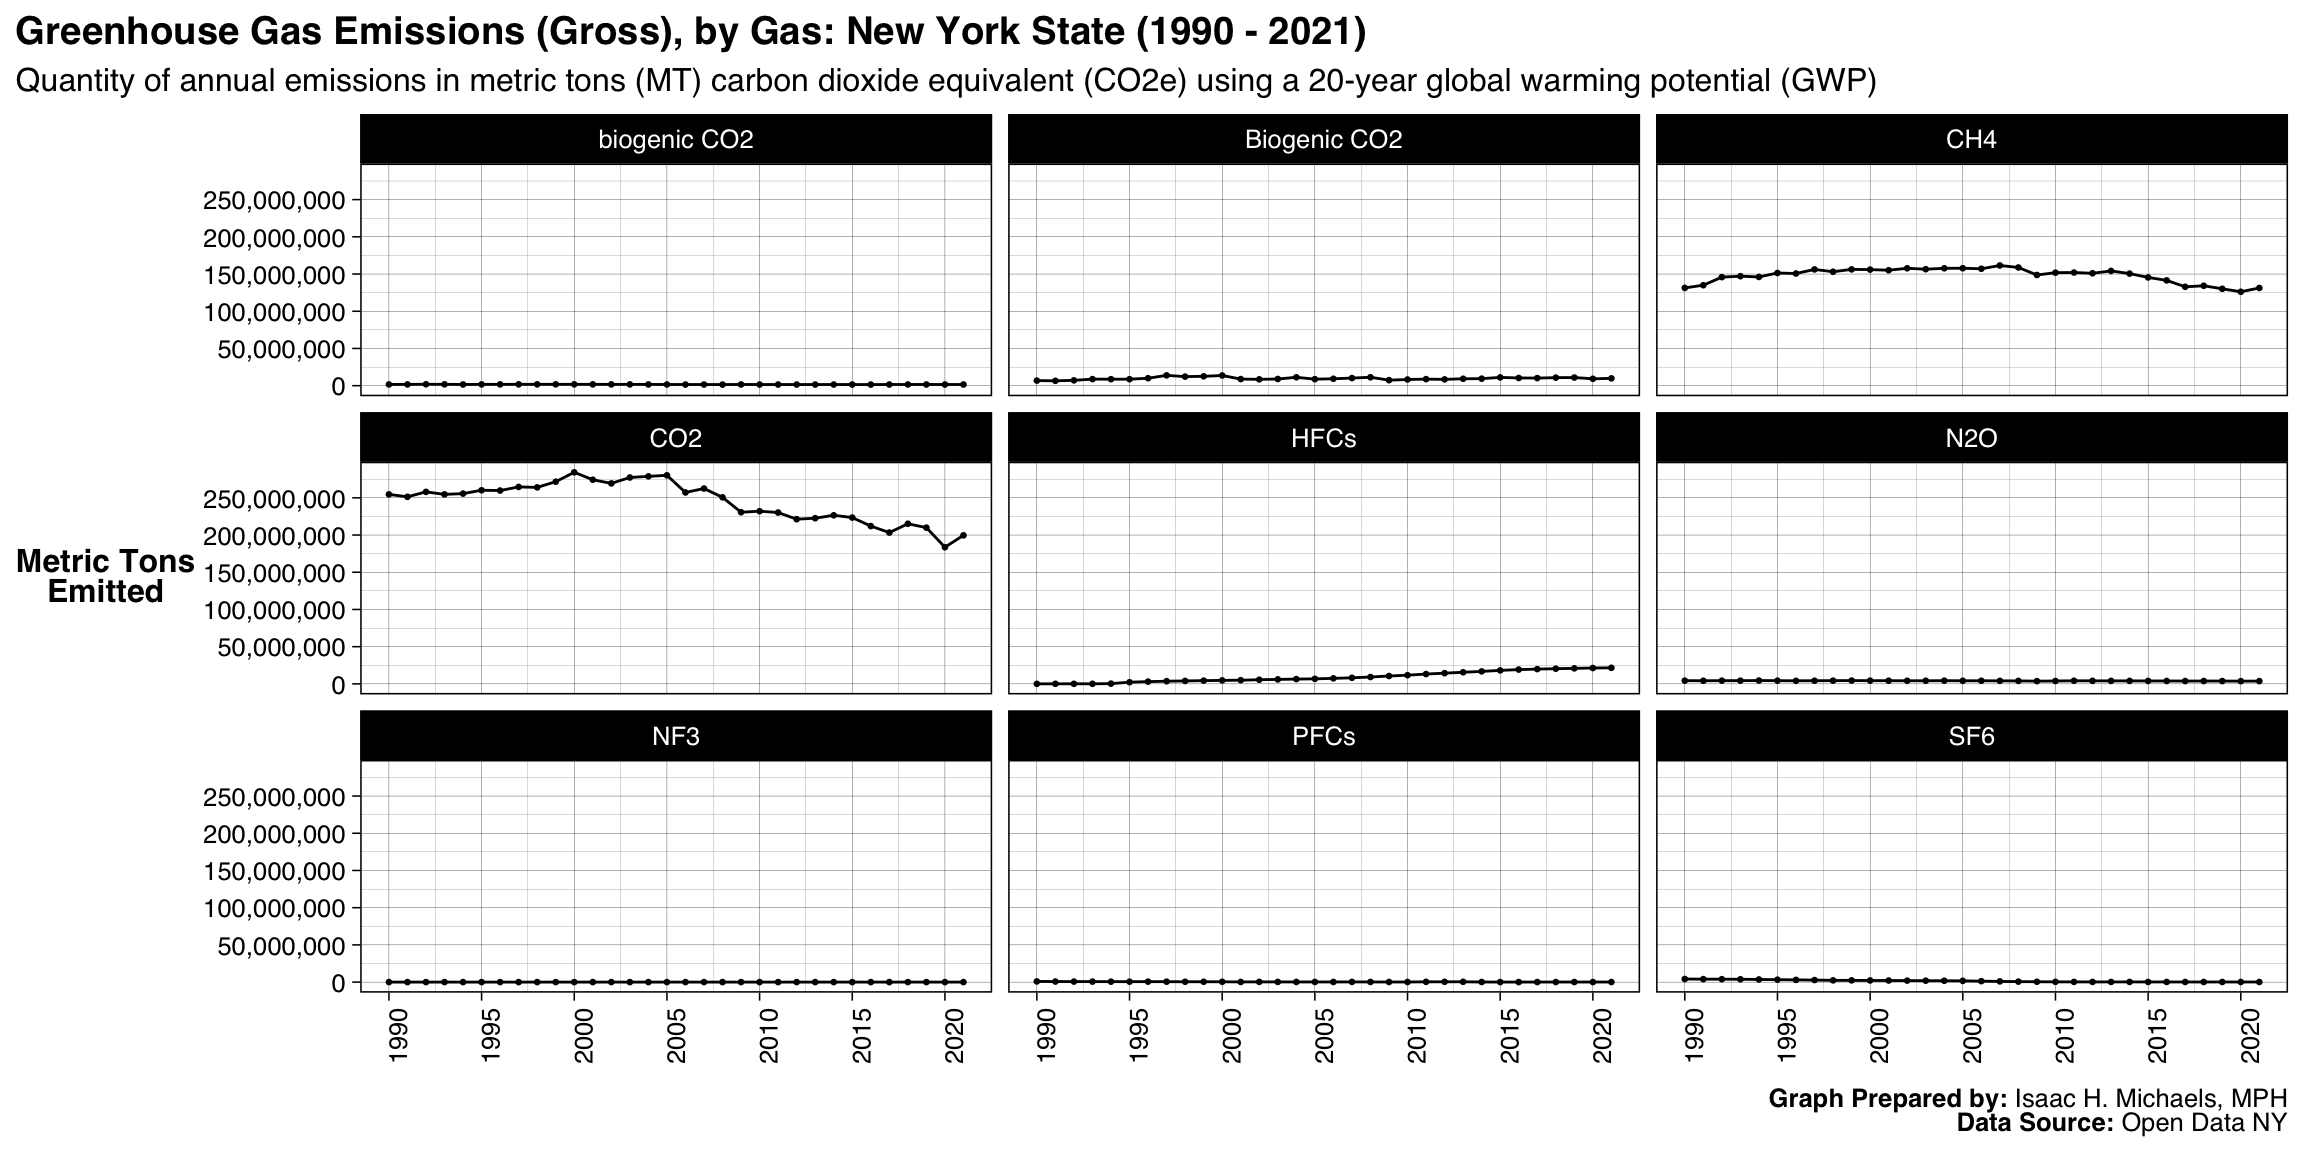
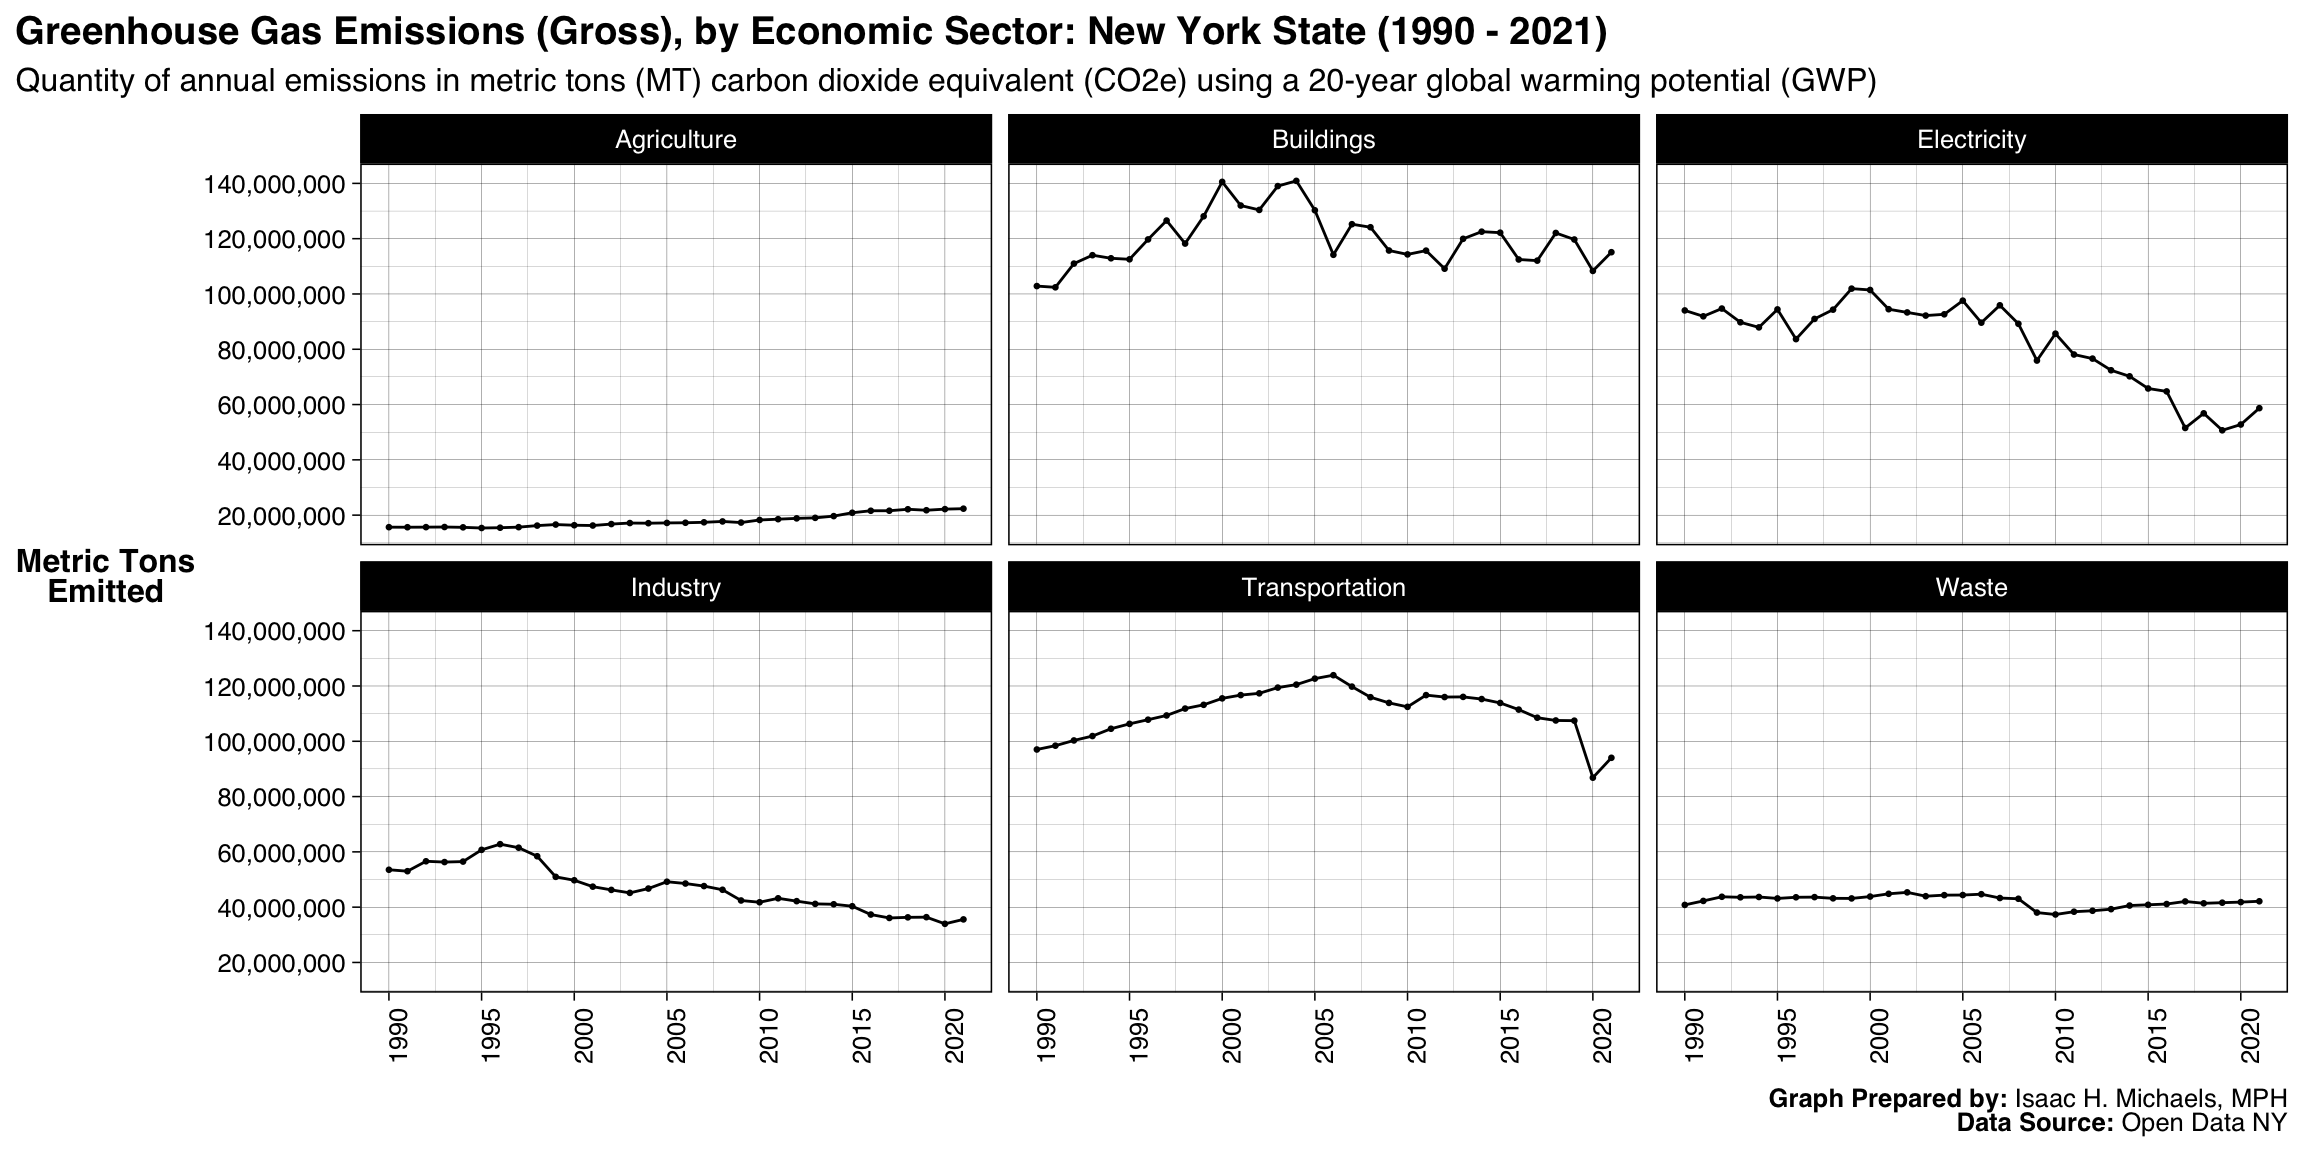
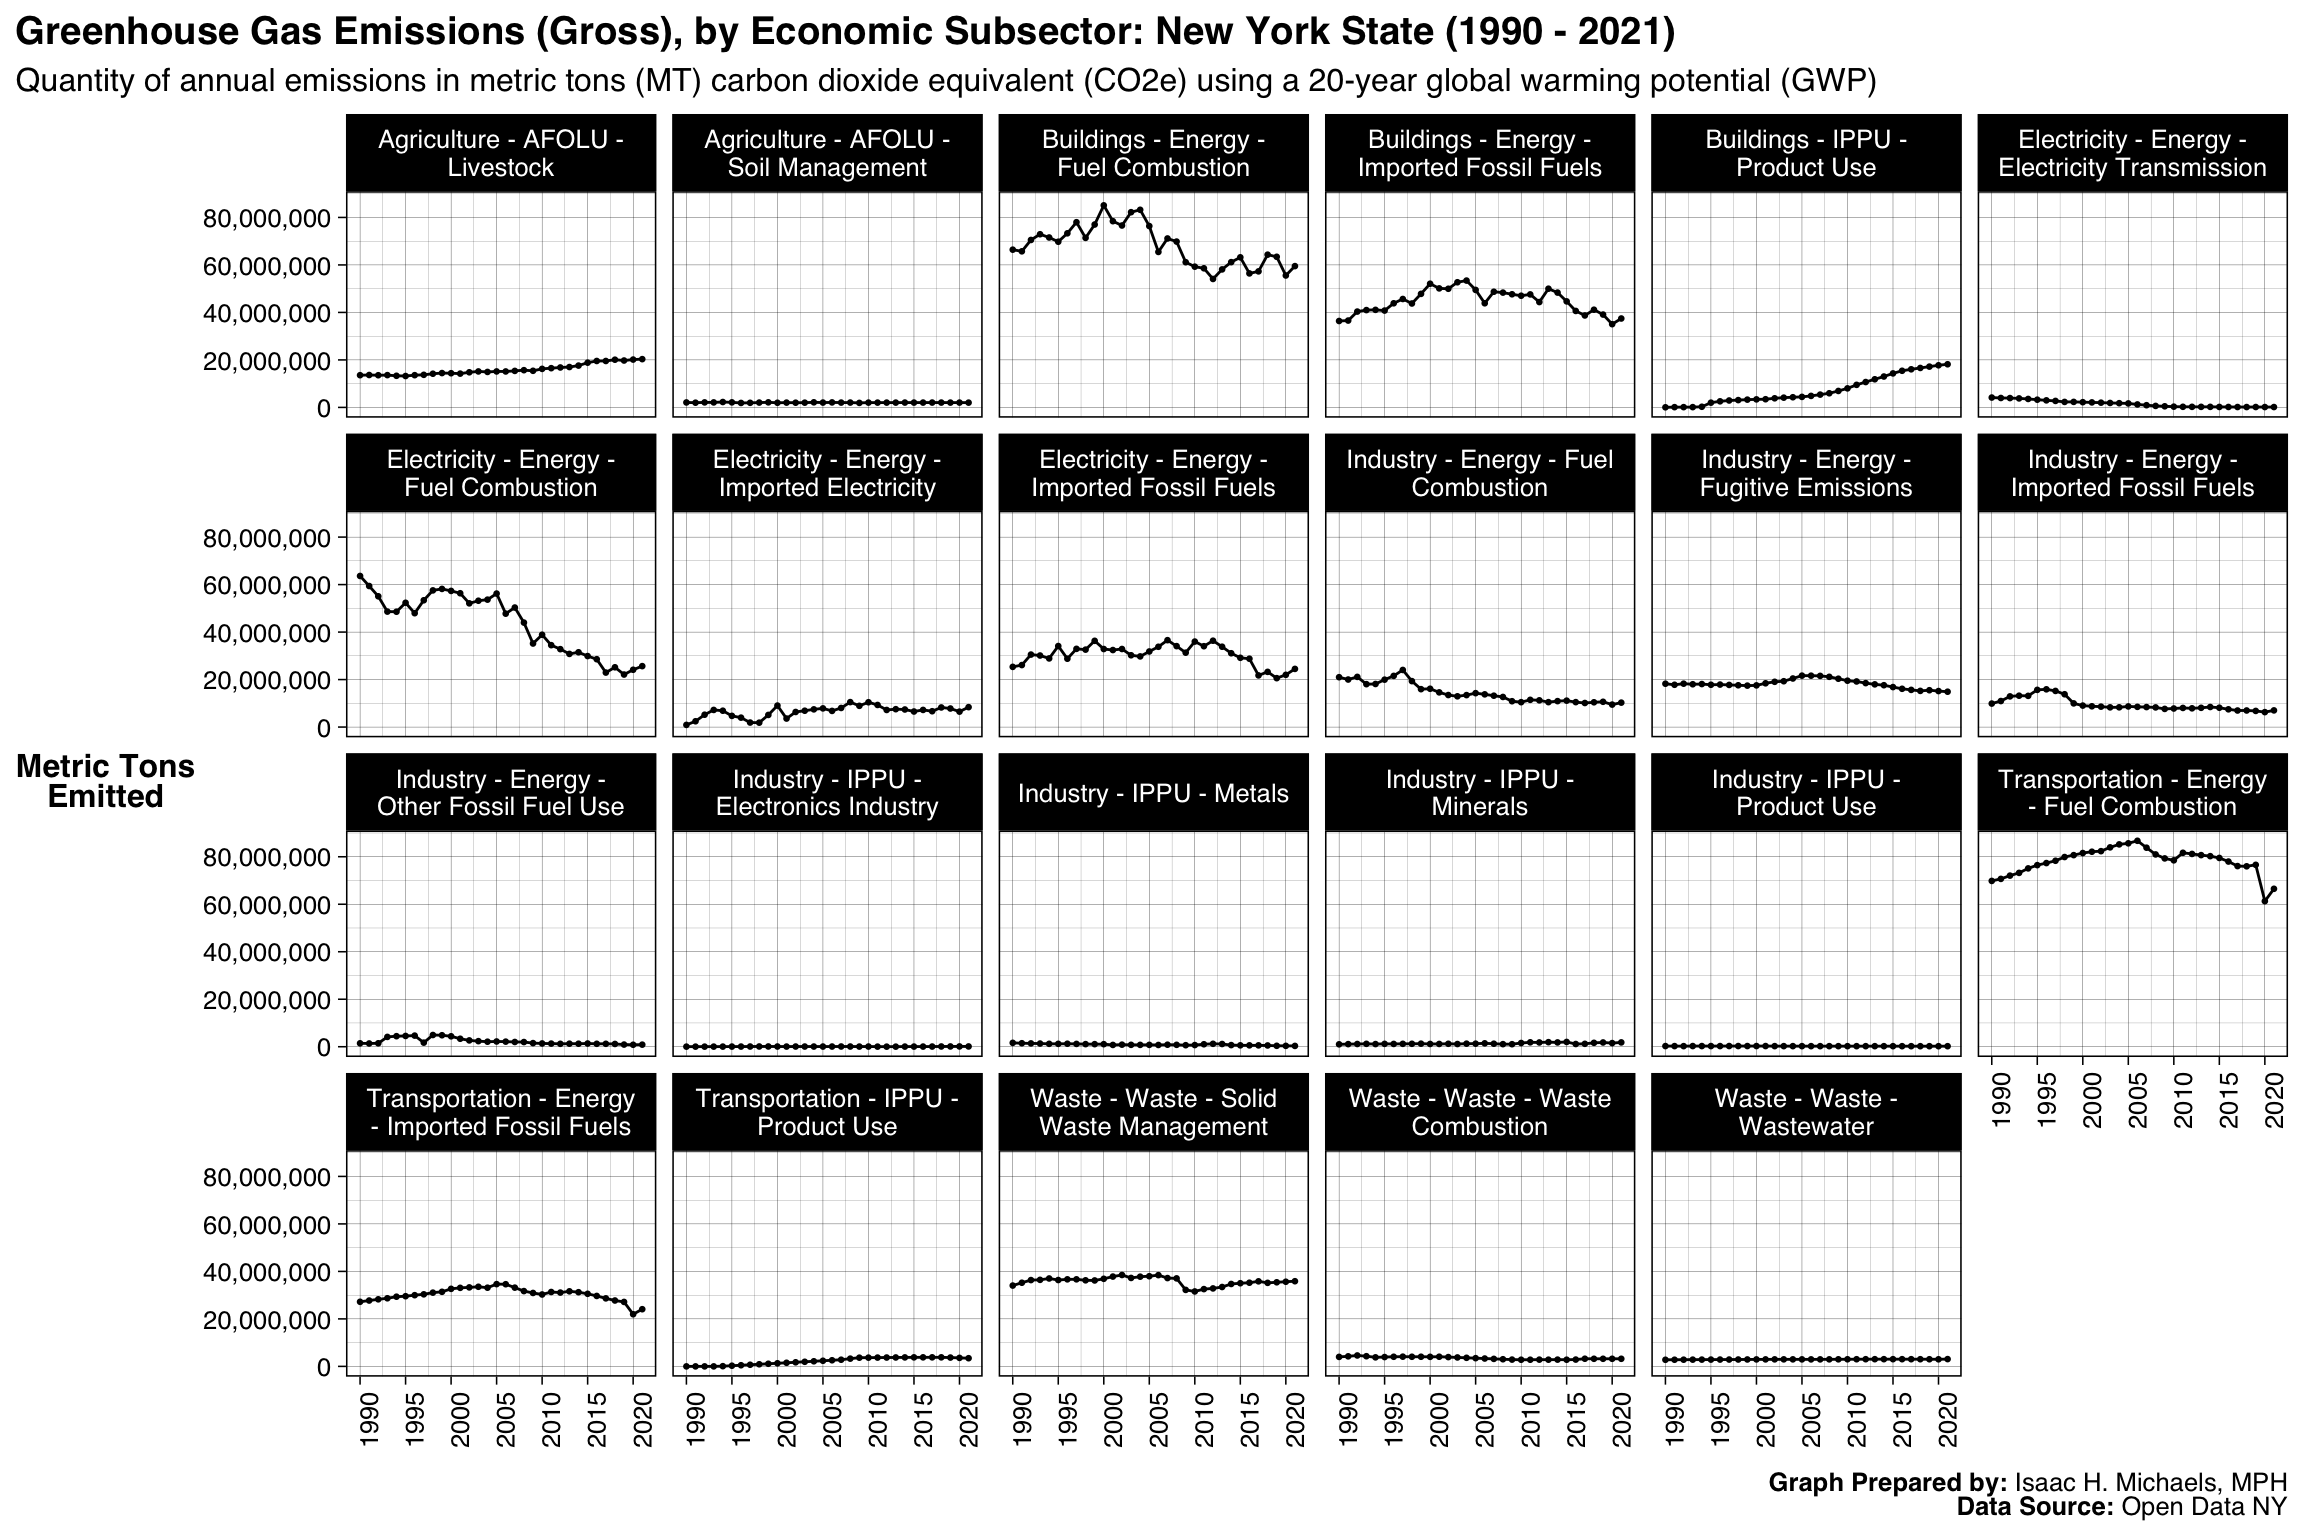
The Department of Environmental Conservation has compiled a dataset on statewide greenhouse gas emissions in New York beginning in 1990. This dataset aims to inform the 2021 New York State Statewide Greenhouse Gas Emissions Report, a key component of the state’s strategy for addressing climate change. The report is intended to meet the requirements of the Climate Leadership and Community Protection Act, track progress in reducing greenhouse gas emissions, and make greenhouse gas information accessible to the public. The dataset provides annual emissions estimates up to the most recent year for which data are available.
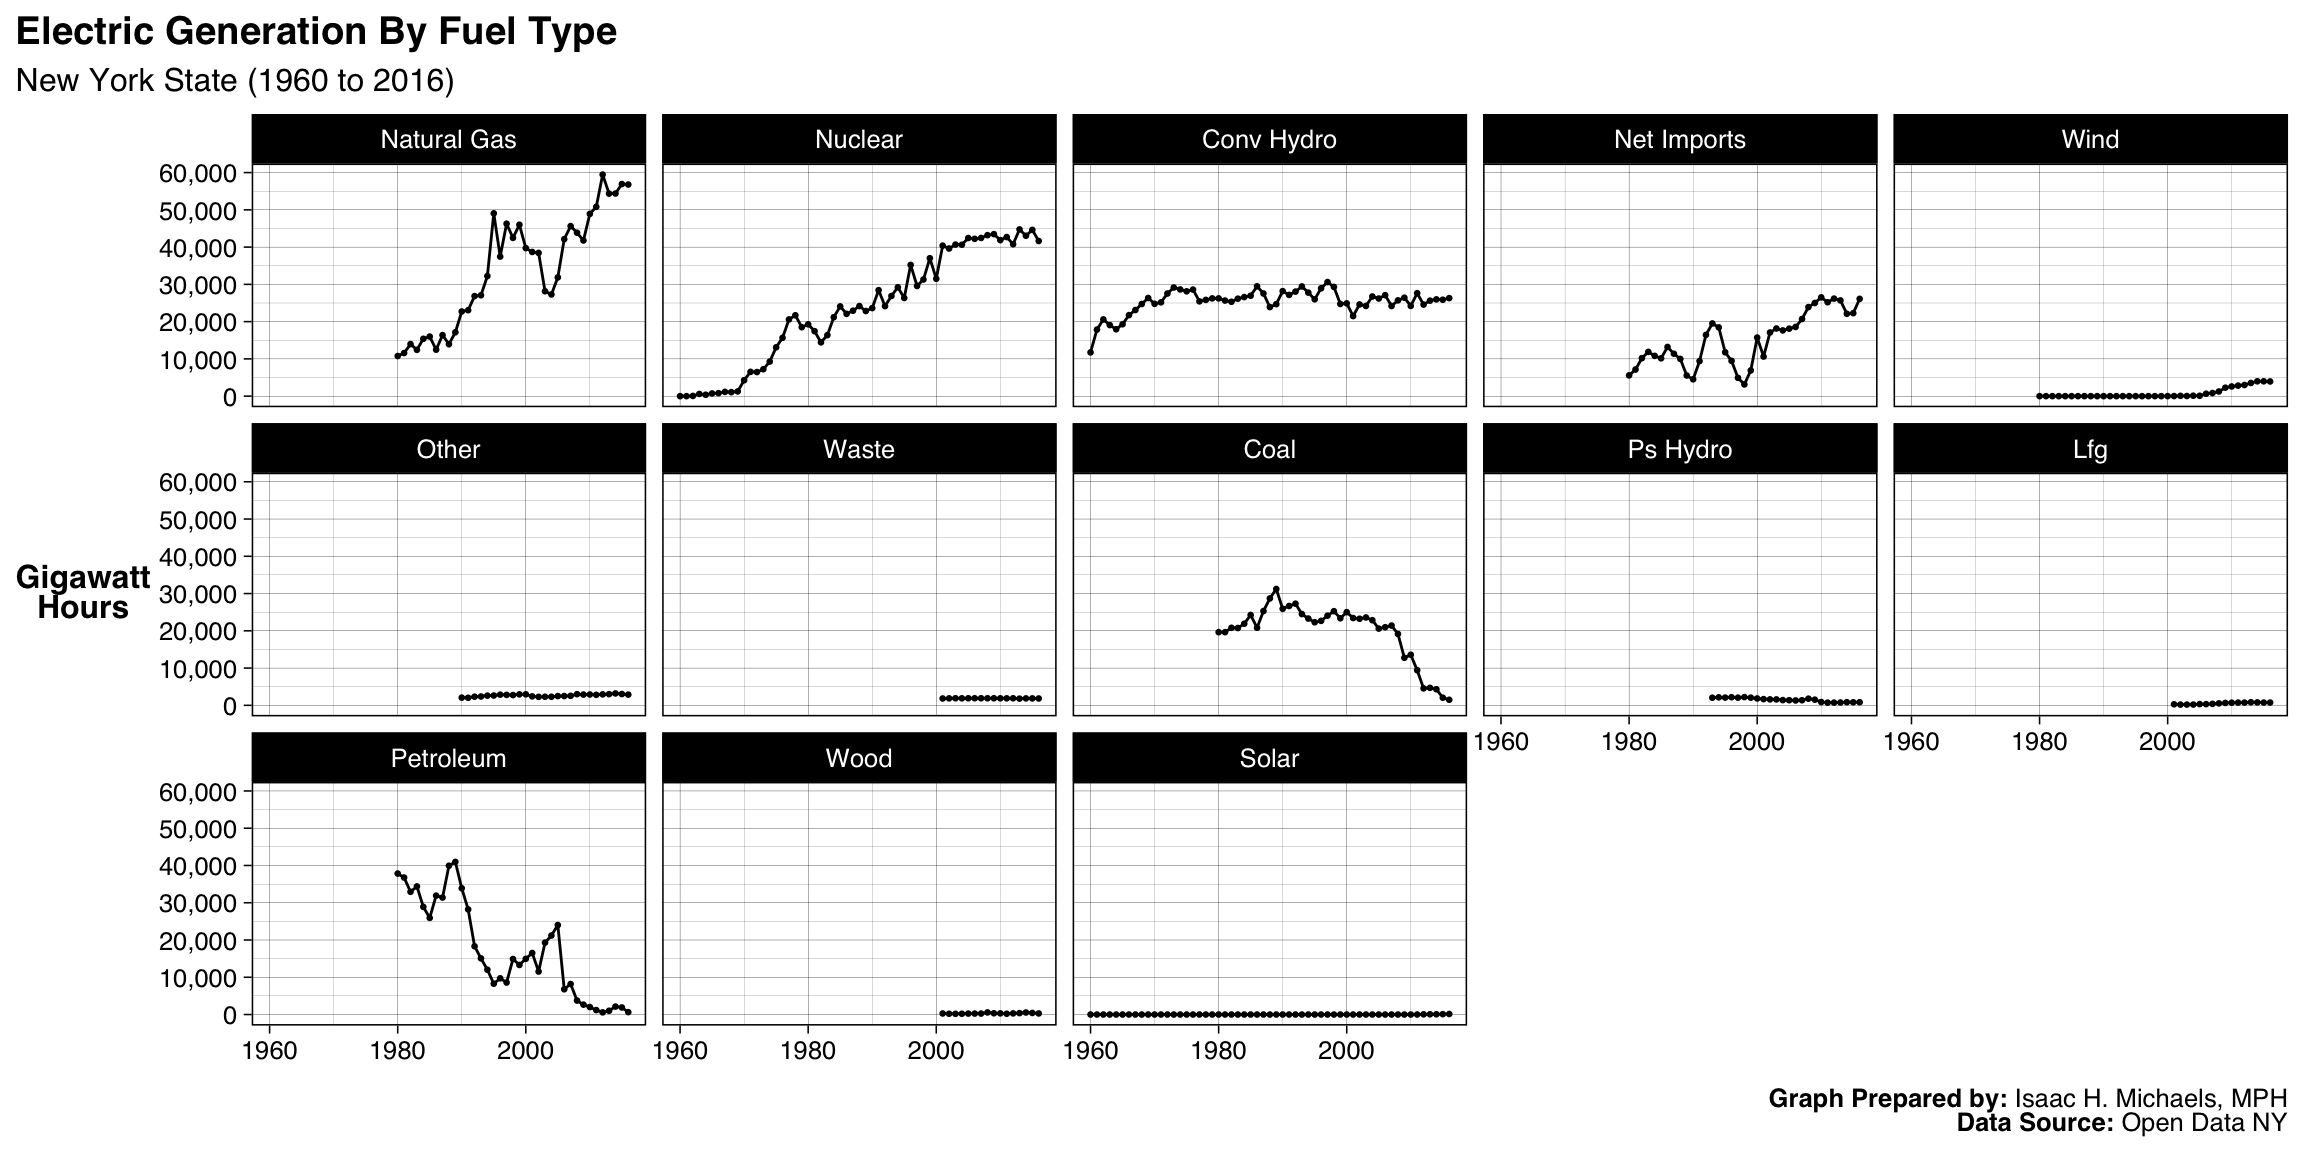
Electric Generation in New York State
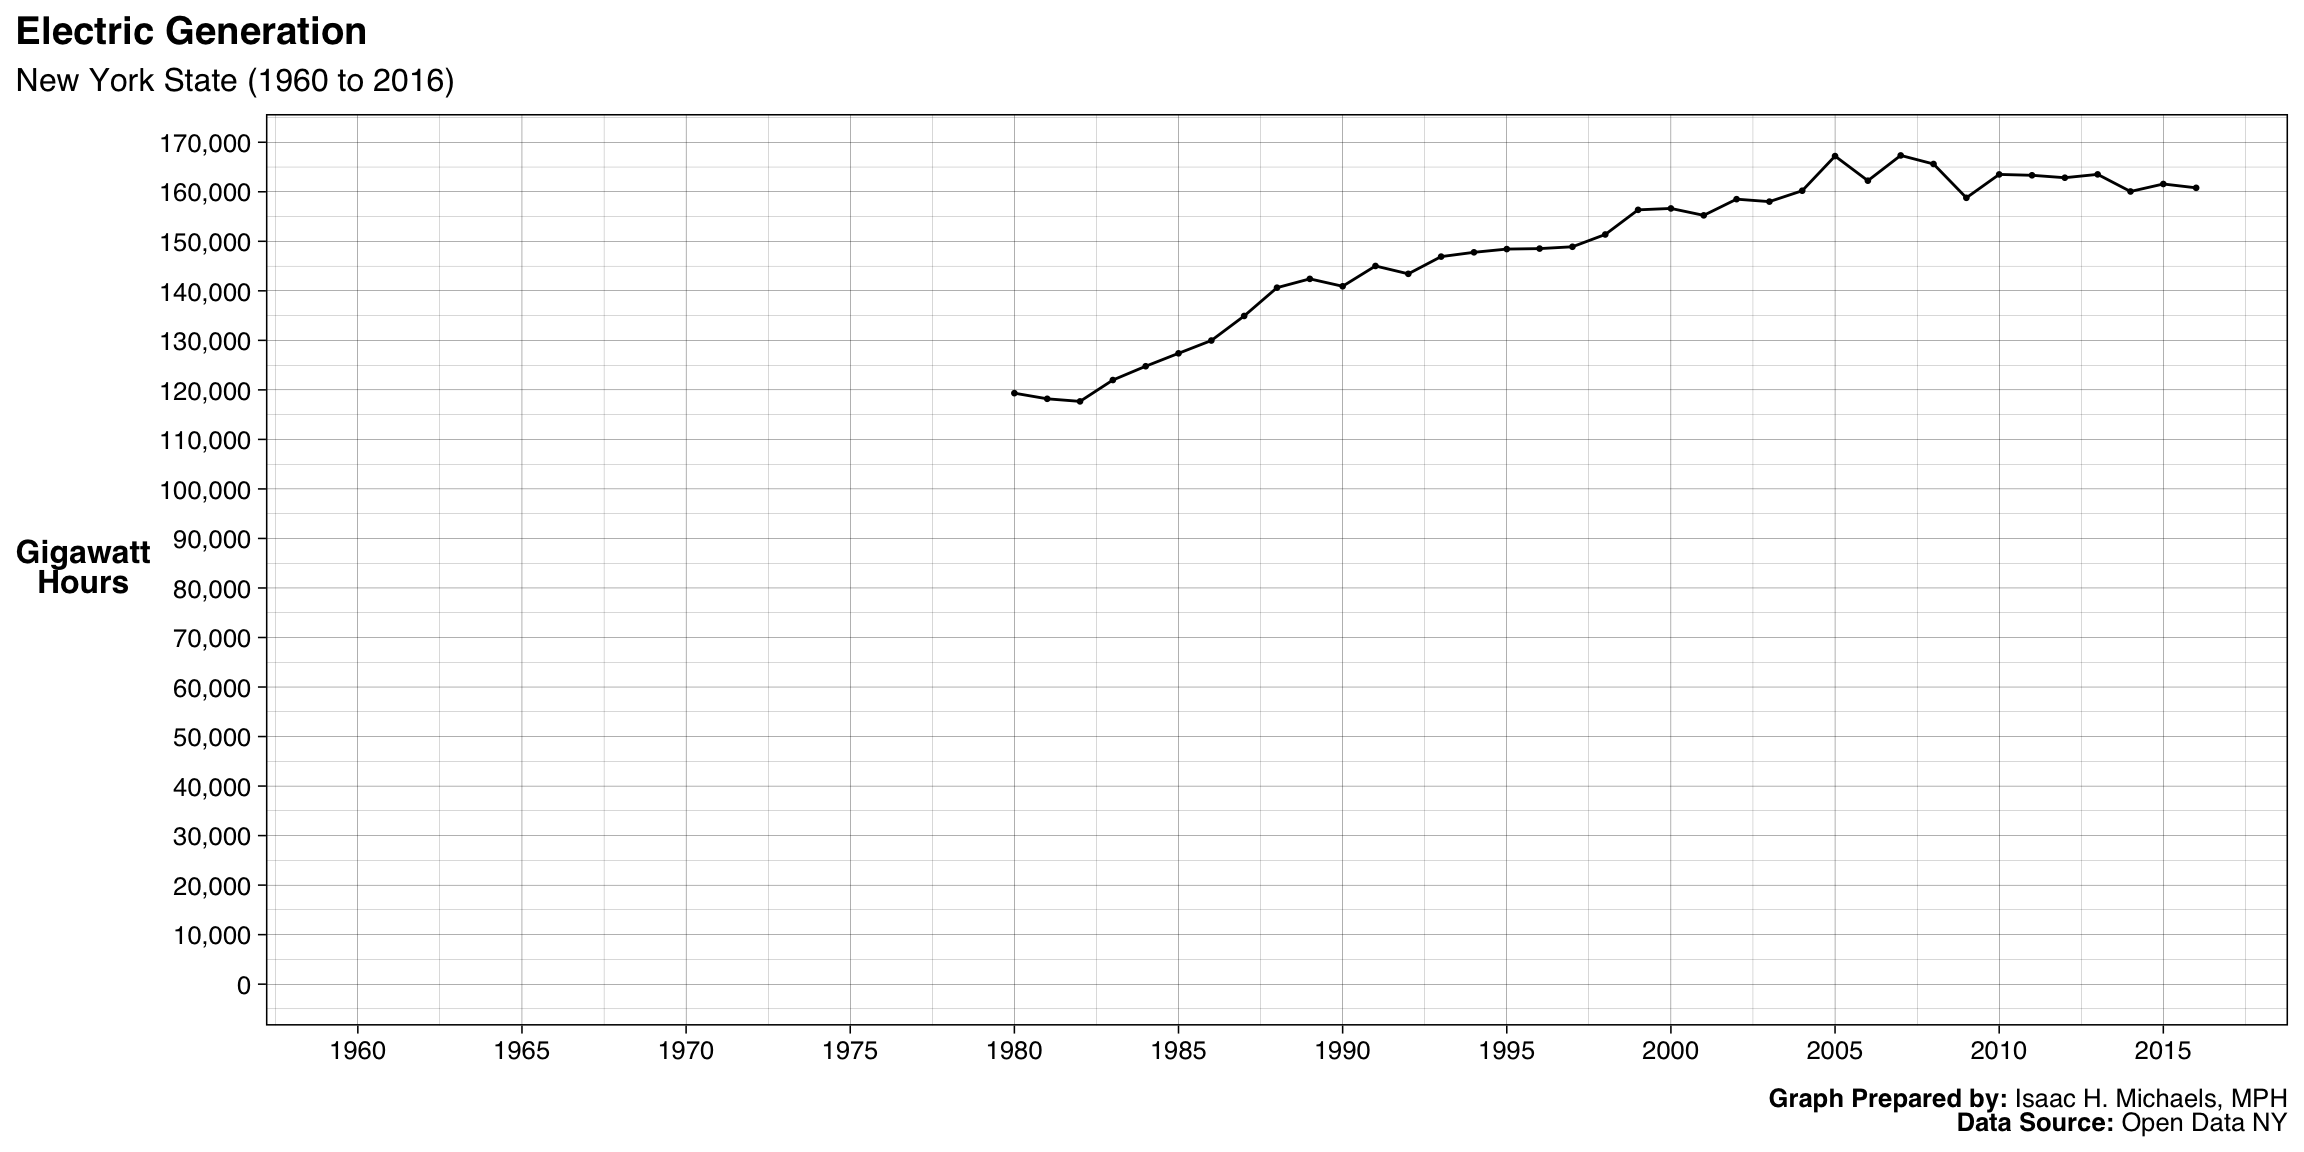
The New York State Energy Research and Development Authority has compiled a dataset on electric generation in the state by fuel type. The data, which span from 1960 to the present, include information on the total electricity requirements and in-state generation for New York in giga-watt hours. The dataset includes data on a range of fuel types, including coal, natural gas, petroleum products, hydro, nuclear, waste, landfill gas, wood, wind, solar, and net imports of electricity.
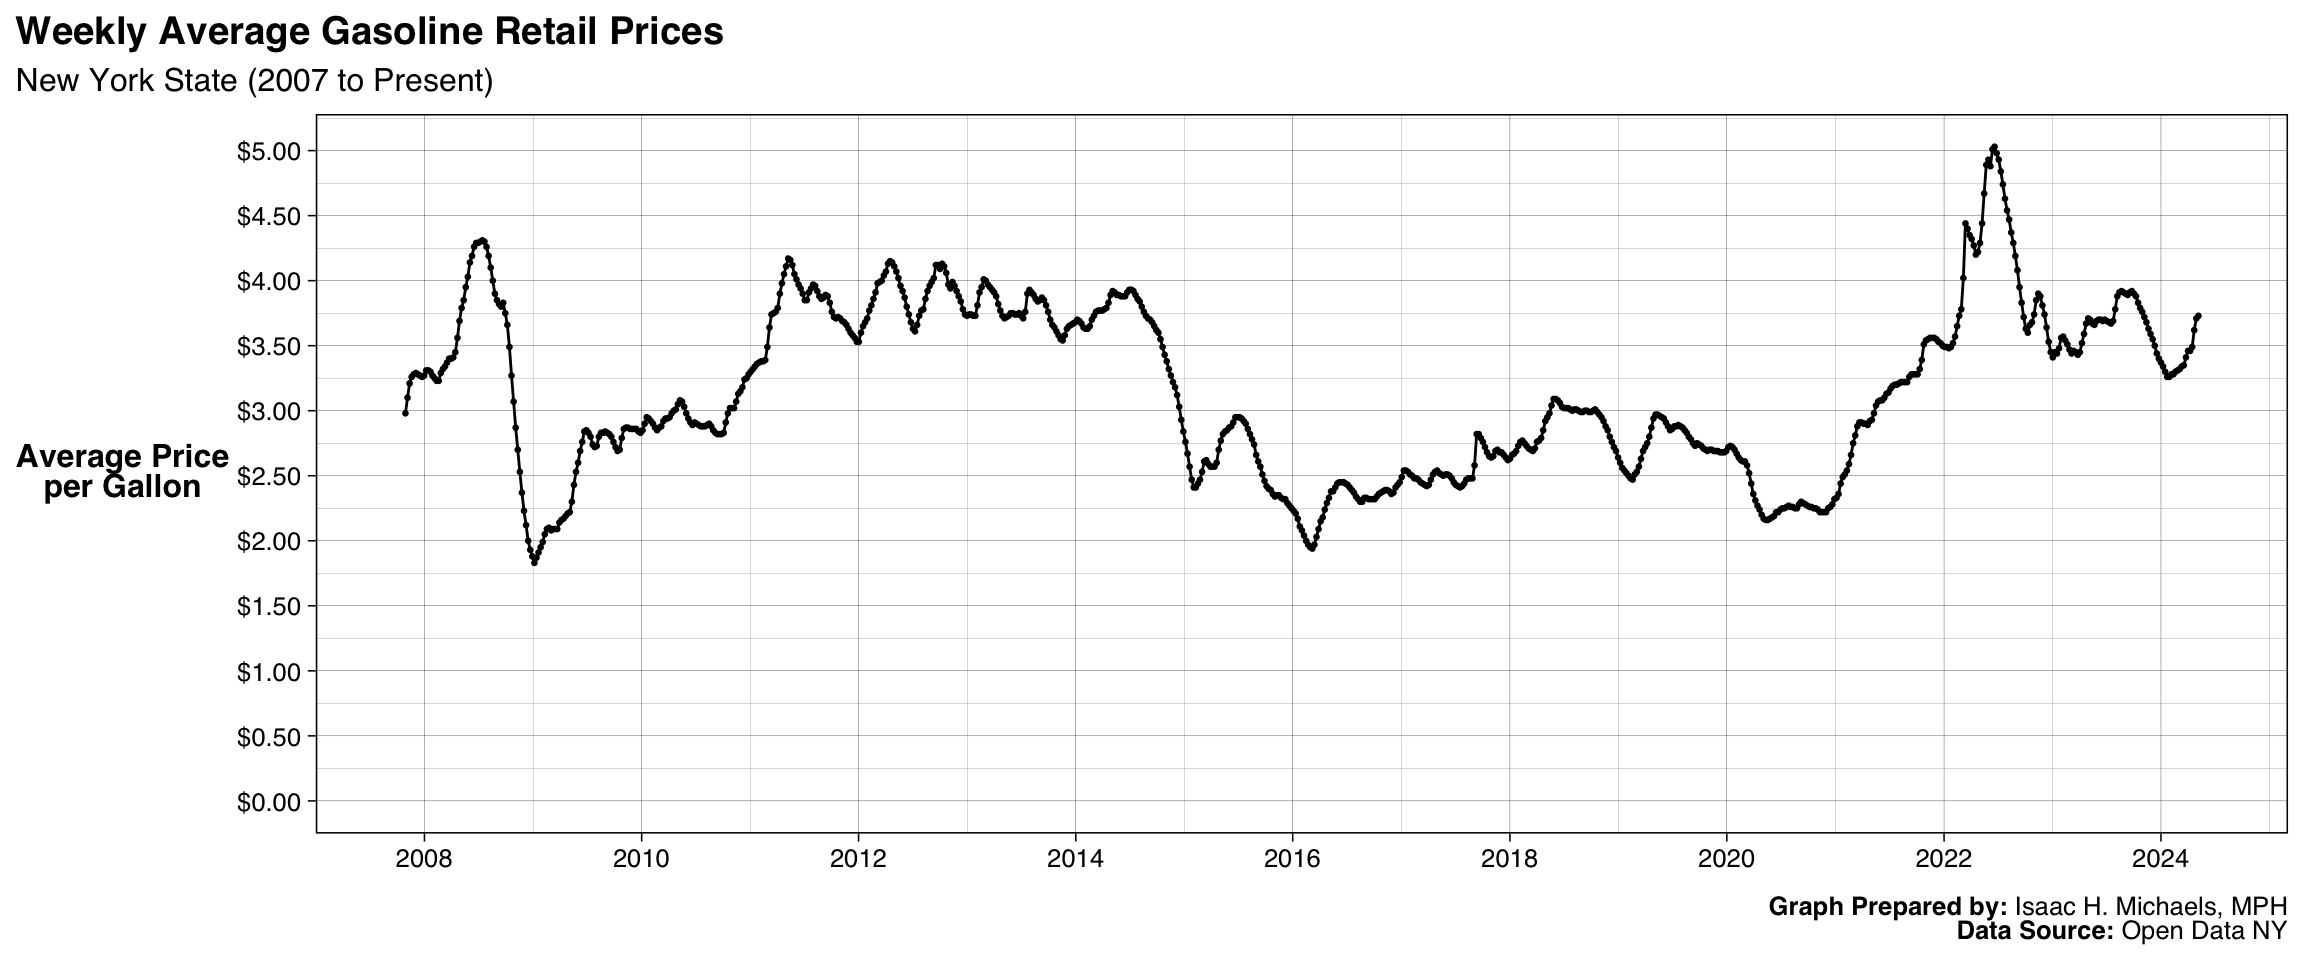
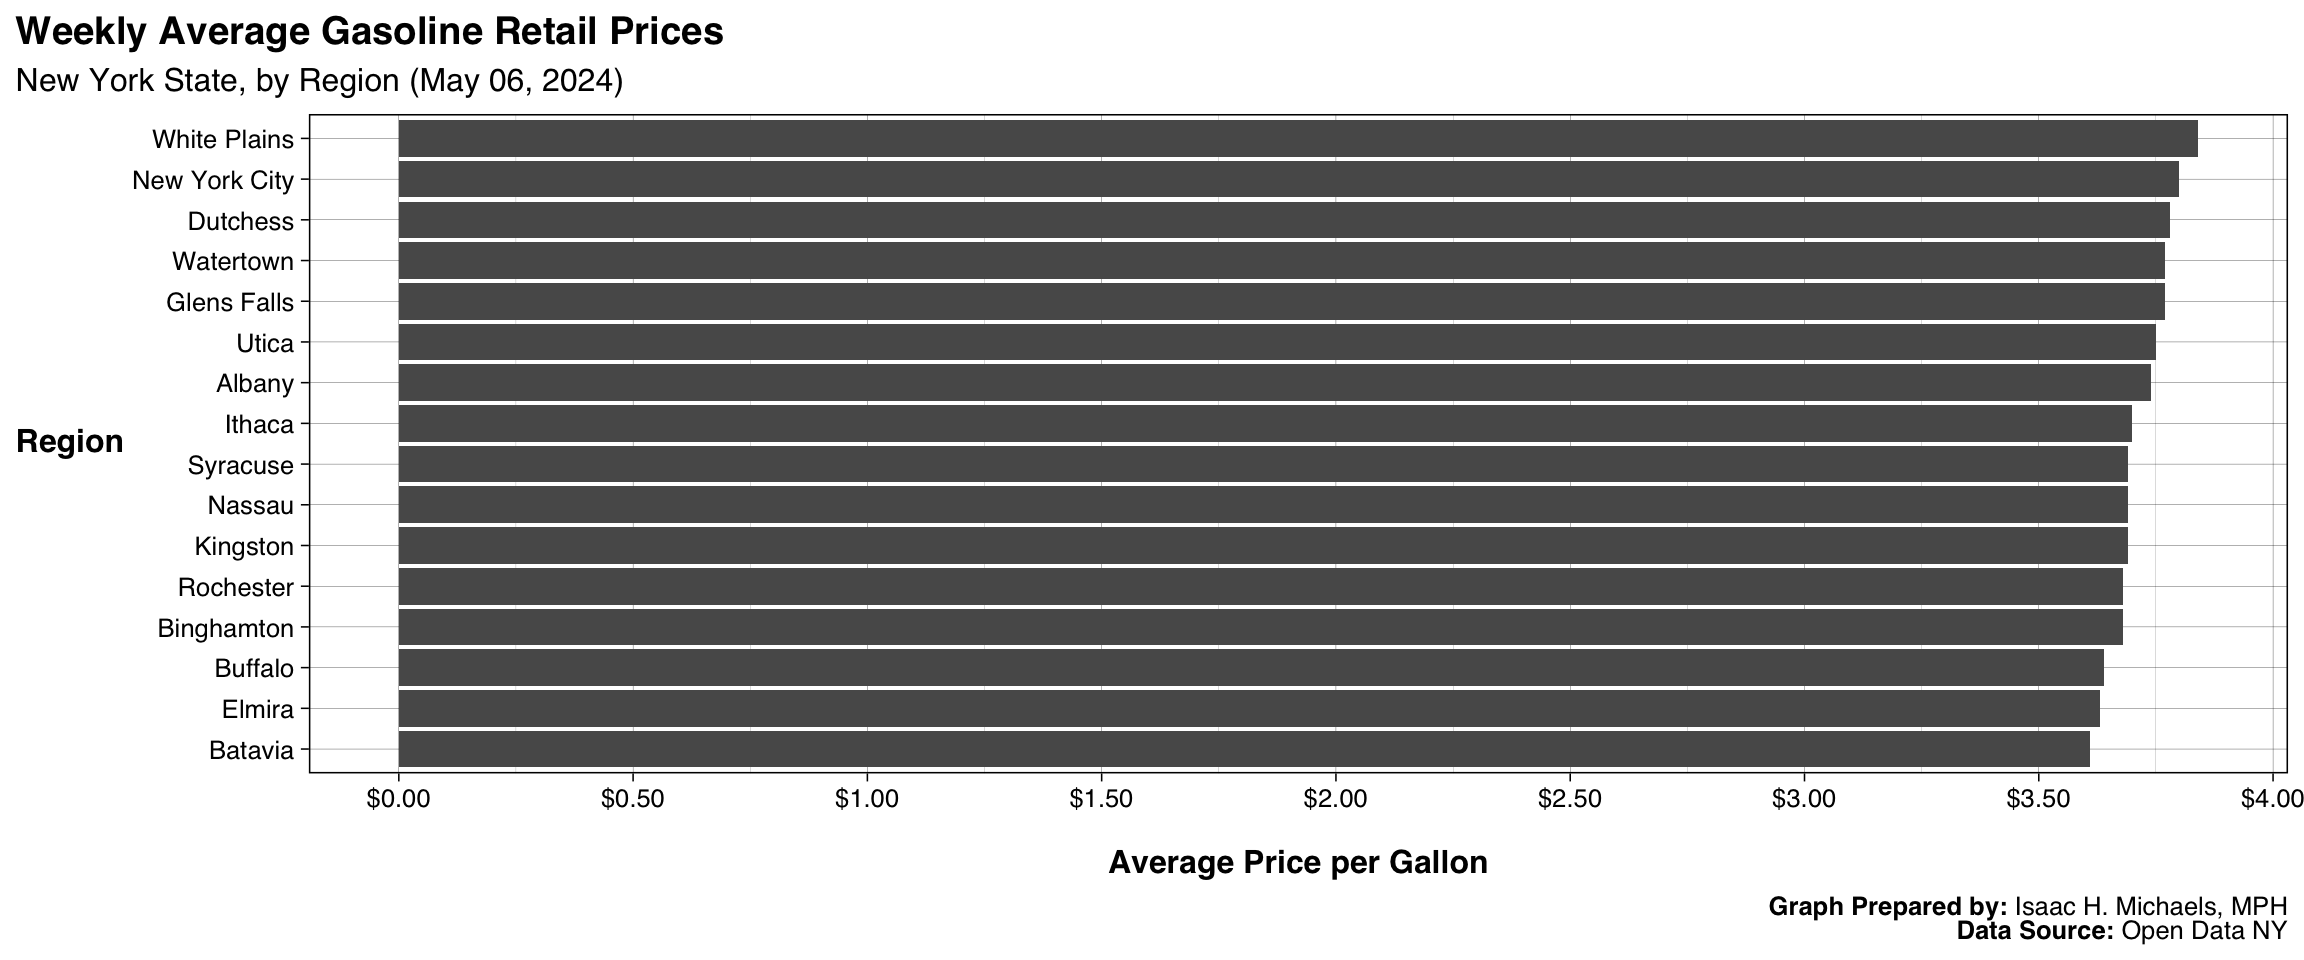
Gasoline Retail Prices in New York State
The New York State Energy Research and Development Authority has compiled a dataset on weekly average retail gasoline prices for New York State and 16 metropolitan regions in the state. The data, which span from October 2007 to the present, are collected from the American Automobile Association’s Daily Fuel Gauge Report and are provided in U.S. dollars per gallon.
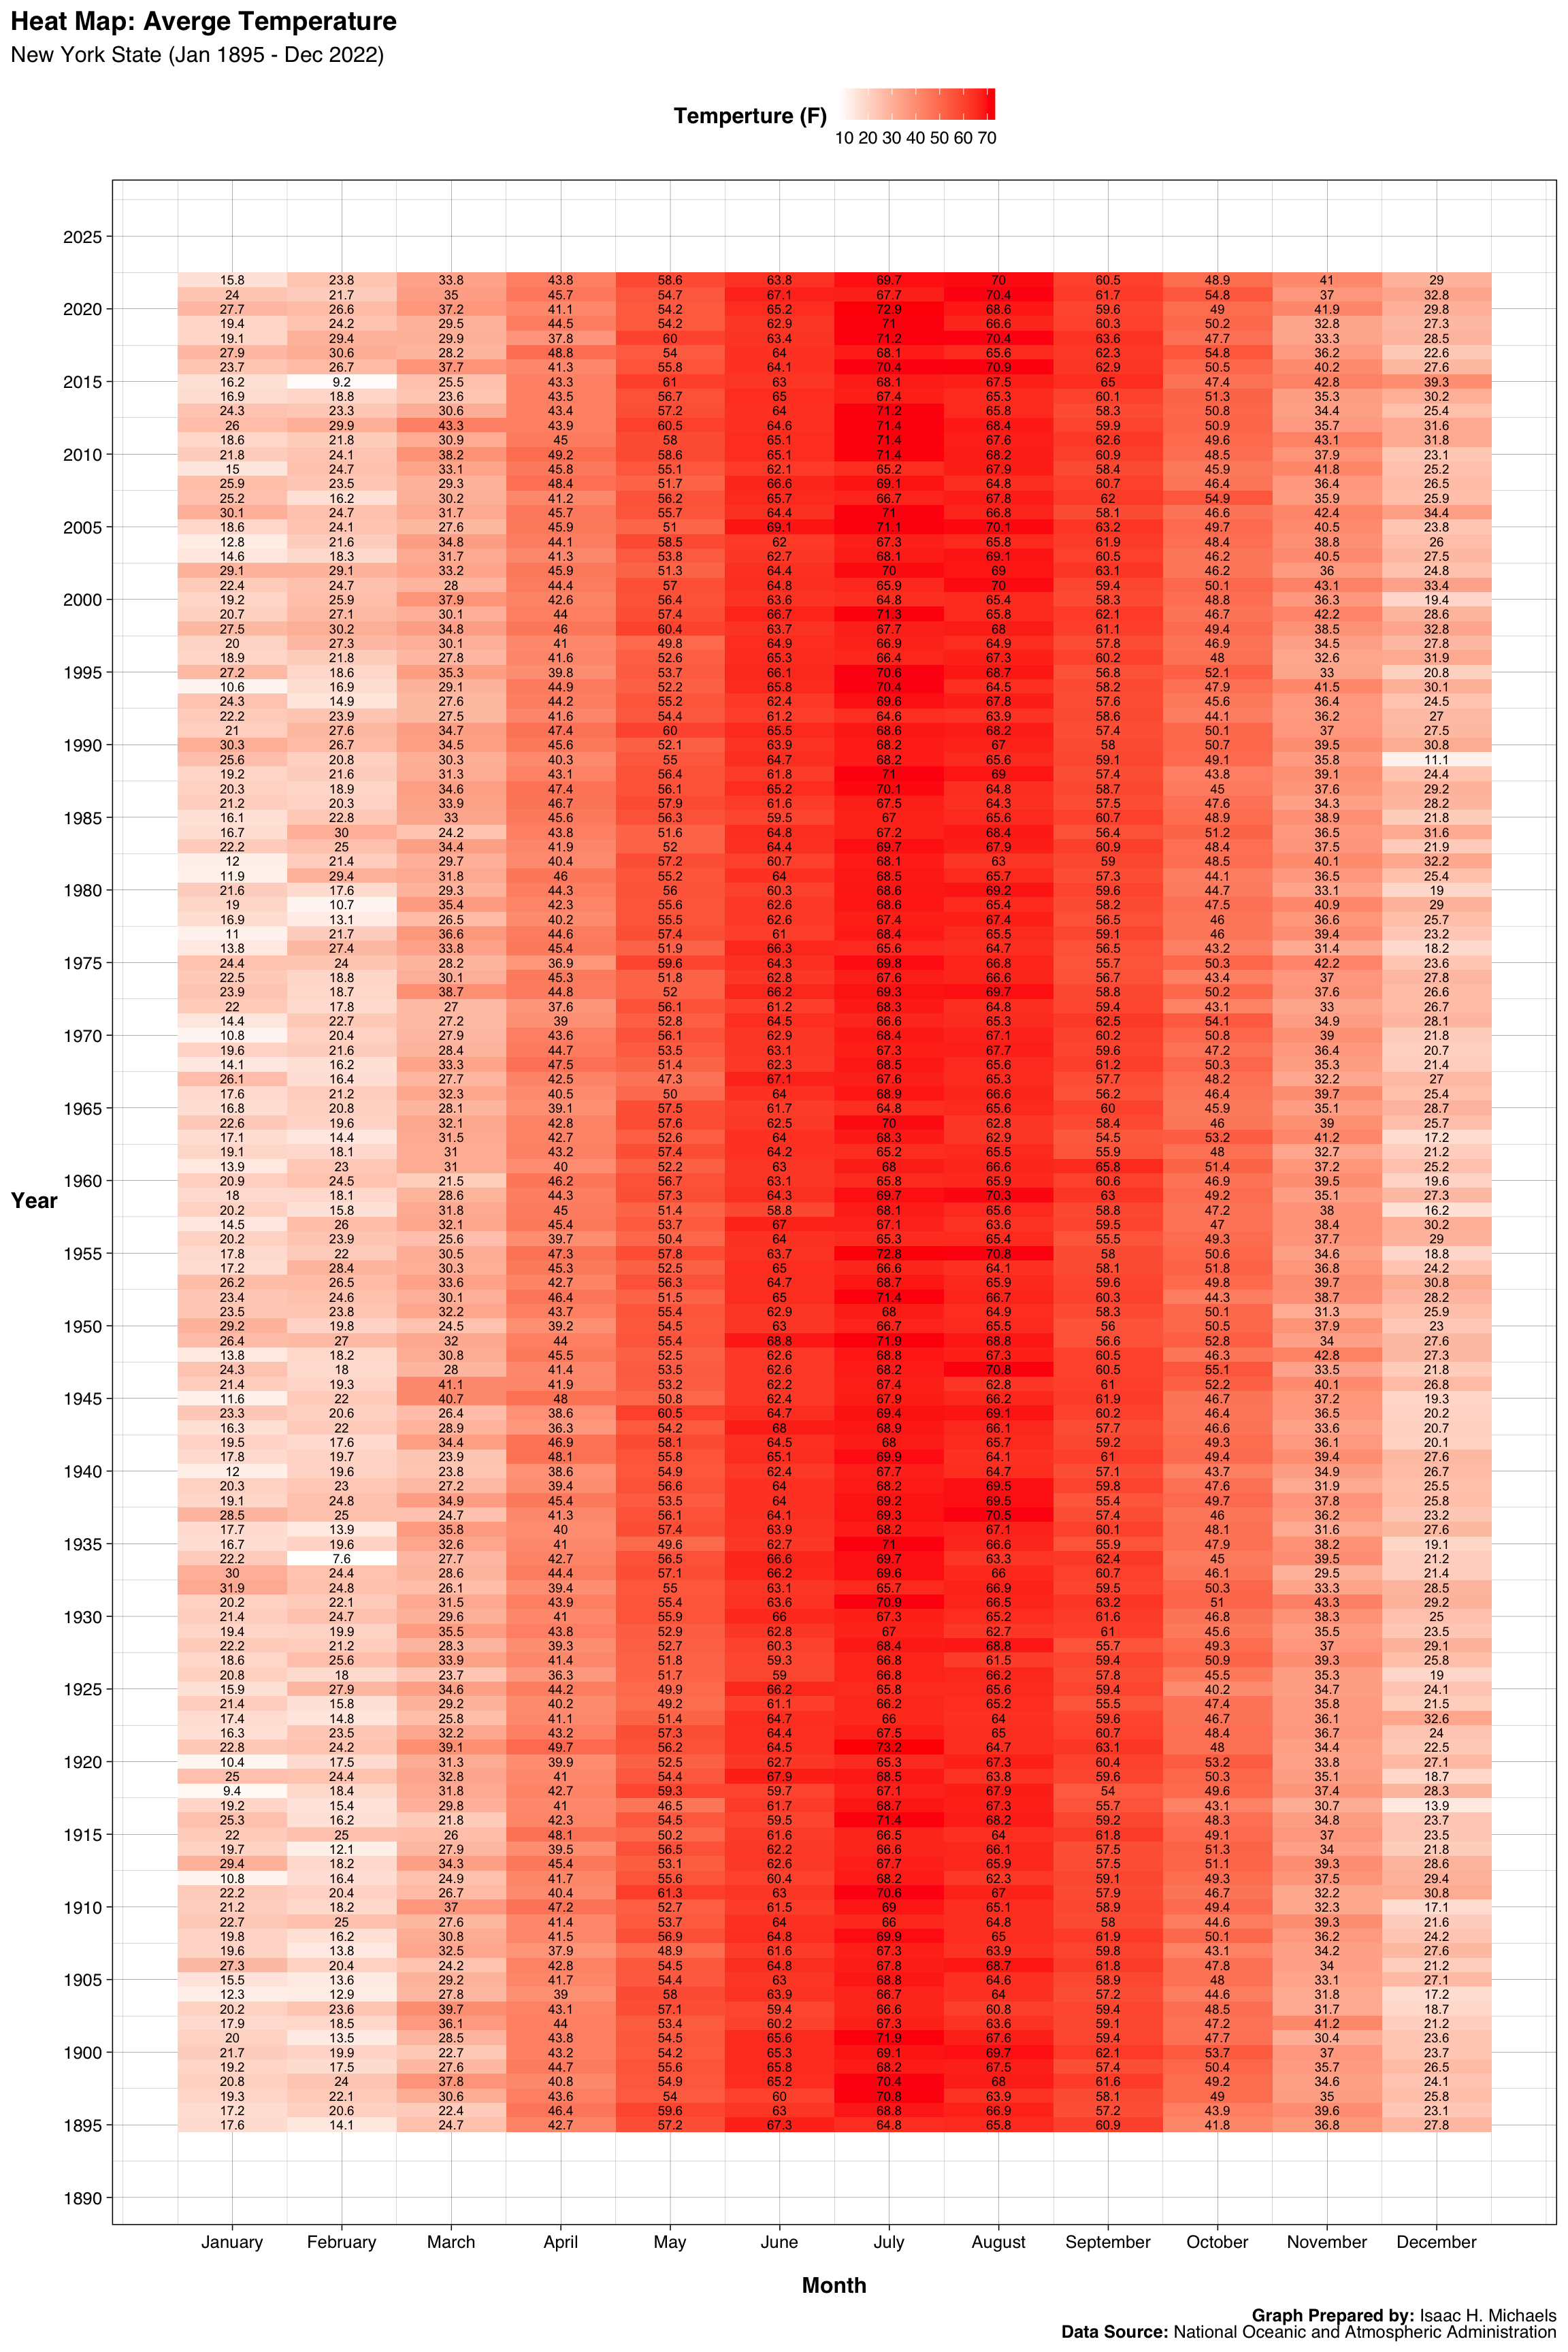
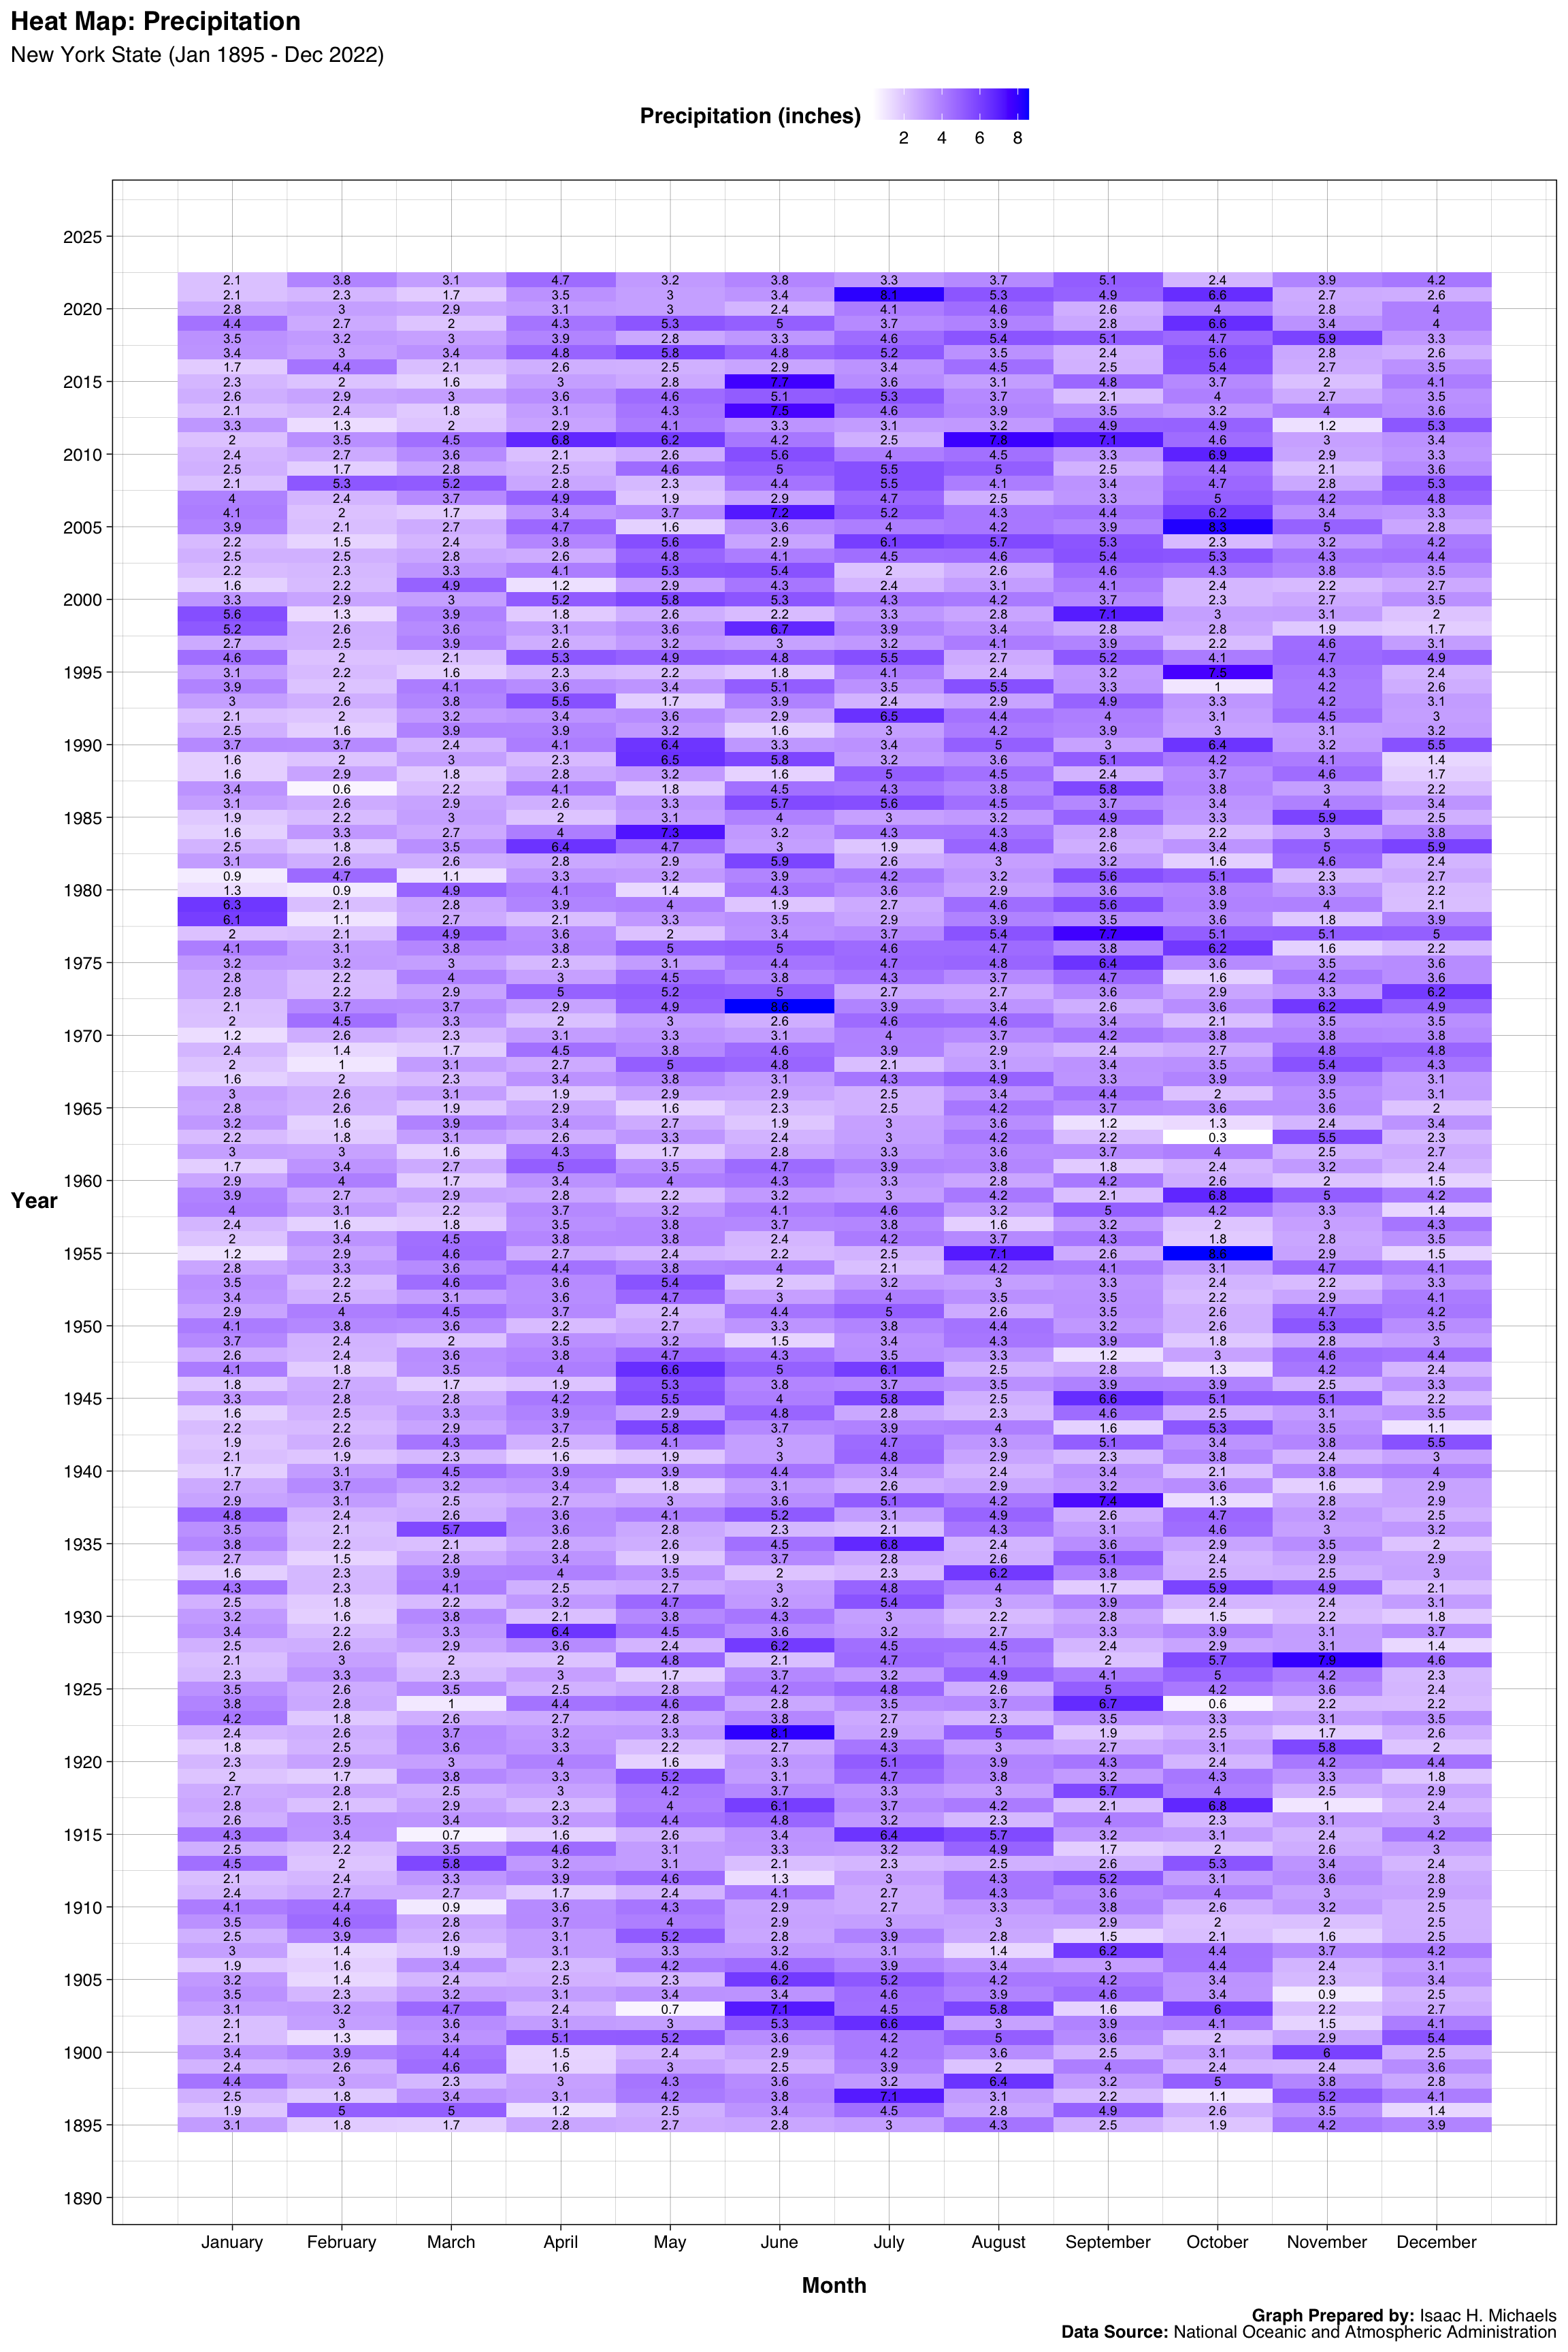
Temperature and Precipitation
The National Oceanic and Atmospheric Administration (NOAA) has compiled a dataset on monthly temperature and precipitation data for the contiguous United States. The data, which span from 1895 to the present, are designed for the study of climate variability and have been adjusted to account for artificial effects on the climate record, such as instrument changes, station relocation, observer practice changes, and urbanization. Some of the more recent data may be preliminary and subject to modification after quality control. The dataset is intended for use in near real-time analysis and for the study of climate variability.
Limitations
There are several limitations to consider when using these datasets. The greenhouse gas emissions data from the Department of Environmental Conservation may be subject to revision as data becomes available or as new methodologies are developed. The electric generation data from the New York State Energy Research and Development Authority do not include customer-sited solar photovoltaic energy and do not have data on the waste, landfill gas, and wood categories prior to 2001. The gasoline retail prices data from the New York State Energy Research and Development Authority are averages and may not reflect the exact prices at individual gas stations. The temperature and precipitation data from NOAA may be subject to revision after quality control.
Importance of the Data
These datasets are important for a number of reasons. The greenhouse gas emissions data can help inform policy decisions on reducing emissions and mitigating the impacts of climate change. The electric generation data can provide insight into the state’s energy mix and help inform decisions on energy infrastructure and development. The gasoline retail prices data can inform consumers on fuel costs and help inform policy decisions on transportation and energy. The temperature and precipitation data can help inform climate and weather forecasting and can provide insight into long-term climate trends.
Statewide Greenhouse Gas Emissions
Electric Generation (GWh)
By Fuel Type
Table
Electric Generation By Fuel Type: New York State (1980 to 2021)
|
Gigawatt Hours, by Year
|
|||||||||||||||||||||
|---|---|---|---|---|---|---|---|---|---|---|---|---|---|---|---|---|---|---|---|---|---|
| Fuel Type | 2001 | 2002 | 2003 | 2004 | 2005 | 2006 | 2007 | 2008 | 2009 | 2010 | 2011 | 2012 | 2013 | 2014 | 2015 | 2016 | 2017 | 2018 | 2019 | 2020 | 2021 |
| Natural Gas | 40,915 | 42,177 | 30,402 | 30,059 | 34,005 | 46,253 | 48,893 | 46,845 | 44,625 | 51,077 | 52,713 | 62,073 | 57,039 | 57,507 | 59,919 | 59,698 | 50,270 | 53,593 | 49,451 | 54,094 | 59,460 |
| Nuclear | 40,395 | 39,617 | 40,679 | 40,640 | 42,443 | 42,224 | 42,453 | 43,209 | 43,485 | 41,870 | 42,695 | 40,775 | 44,756 | 43,039 | 44,603 | 41,571 | 42,167 | 42,919 | 44,865 | 38,430 | 31,177 |
| Conv. Hydro | 21,486 | 24,612 | 24,207 | 26,745 | 26,204 | 27,110 | 24,184 | 25,711 | 26,420 | 24,214 | 27,634 | 24,572 | 25,631 | 25,974 | 25,879 | 26,314 | 29,554 | 29,045 | 30,141 | 29,521 | 28,675 |
| Net Imports | 7,464 | 12,245 | 14,379 | 12,733 | 14,376 | 16,743 | 18,904 | 23,344 | 23,361 | 24,912 | 24,883 | 25,516 | 25,902 | 20,789 | 19,809 | 22,358 | 24,319 | 26,766 | 23,134 | 19,990 | 27,394 |
| Wind | 21 | 82 | 41 | 116 | 103 | 655 | 833 | 1,251 | 2,266 | 2,596 | 2,828 | 2,992 | 3,539 | 3,986 | 3,984 | 3,943 | 4,219 | 3,985 | 4,454 | 4,163 | 4,111 |
| Other | 2,404 | 2,282 | 2,302 | 2,303 | 2,481 | 2,488 | 2,555 | 2,996 | 2,888 | 2,916 | 2,823 | 2,945 | 3,003 | 3,194 | 3,028 | 2,881 | 2,918 | 2,729 | 2,648 | 2,233 | 2,254 |
| Waste | 1,837 | 1,878 | 1,905 | 1,883 | 1,899 | 1,902 | 1,902 | 1,903 | 1,900 | 1,893 | 1,878 | 1,897 | 1,799 | 1,866 | 1,862 | 1,841 | 1,900 | 1,878 | 1,832 | 1,620 | 1,603 |
| PS Hydro | 1,666 | 1,601 | 1,591 | 1,408 | 1,379 | 1,312 | 1,373 | 1,790 | 1,525 | 889 | 721 | 731 | 766 | 849 | 825 | 836 | 795 | 811 | 583 | 635 | 712 |
| LFG | 284 | 198 | 205 | 209 | 329 | 326 | 397 | 533 | 648 | 708 | 735 | 736 | 828 | 789 | 745 | 748 | 730 | 648 | 661 | 613 | 651 |
| Petroleum | 17,458 | 12,652 | 20,830 | 23,353 | 25,619 | 7,441 | 8,780 | 4,001 | 2,829 | 2,094 | 1,234 | 606 | 1,057 | 2,259 | 1,992 | 676 | 636 | 1,678 | 1,994 | 2,189 | 159 |
| Solar | 0 | 0 | 0 | 0 | 0 | 0 | 0 | 0 | 0 | 0 | 7 | 53 | 52 | 51 | 52 | 54 | 47 | 49 | 52 | 48 | 50 |
| Coal | 23,432 | 23,239 | 23,581 | 22,853 | 20,598 | 20,968 | 21,406 | 19,154 | 12,759 | 13,583 | 9,426 | 4,551 | 4,697 | 4,325 | 2,046 | 1,493 | 567 | 692 | 426 | 146 | 0 |
| Wood | 283 | 206 | 192 | 211 | 253 | 260 | 256 | 560 | 340 | 315 | 210 | 311 | 377 | 539 | 422 | 292 | 288 | 203 | 155 | 0 | 0 |
Table Prepared By: Isaac H. Michaels, MPH
Data Source: Open Data NY