Published: April 18, 2021
Updated: April 05, 2026 at 04:57PM
Welcome
Welcome to my basketball season data analysis. This page presents interactive visualizations and detailed data tables capturing team and player performance throughout the National Basketball Association (NBA) season. You can explore cumulative wins, point differentials, scoring trends, and advanced player metrics such as effective field goal percentage, player efficiency, and assist-to-turnover ratios. The charts and tables highlight team momentum, offensive and defensive balance, and individual contributions, providing a clear picture of which teams and players are excelling across the season.
All data are sourced from Basketball Reference and updated daily during the regular season, allowing you to monitor performance as the year progresses. Whether you’re a fan, analyst, or fantasy basketball player, these visualizations offer an accessible, data-driven perspective on NBA competition. I hope you find these visualizations and data tables helpful in understanding the current NBA season. Thank you for visiting the page.
Executive Summary1
As the NBA regular season nears its conclusion, team performance data from April 5, 2026, reveal distinct tiers of competition and several notable trends. The Oklahoma City Thunder (61 wins), San Antonio Spurs (59 wins), and Detroit Pistons (57 wins) have established themselves as the league’s top teams by win percentage. The Thunder lead the league with a 79% win rate, supported by a median point differential of +11 points per game. The Spurs and Pistons are close behind, posting win percentages of 75% and 73%, respectively. At the other end of the spectrum, five teams have failed to reach 22 wins, with the Washington Wizards holding the league’s lowest win total at 17.
One of the most notable patterns in the recent data is the sustained success of the Detroit Pistons. A team often associated with rebuilding, the Pistons’ 57-21 record is supported by a solid median point differential of +7. The data suggest a balanced contribution from key players, with Jalen Duren ranking first in offensive rebounds per game (3.8) and second in two-point field goals made (7.4), Cade Cunningham ranking tenth in assists (9.9), and Isaiah Stewart tied for first in blocks per game (1.6). This distribution of statistical leaders across different categories could indicate a well-rounded team approach contributing to their high win total, a departure from a model centered on a single, dominant scorer.
In stark contrast, another notable pattern is the recent performance of the New Orleans Pelicans. According to the cumulative win data, the Pelicans have not secured a victory since March 19, 2026. This extended losing streak has cemented their position near the bottom of the league with a 25-53 record and a median point differential of -6.5. Individual player statistics show that the team is not lacking in offensive initiators; Zion Williamson leads the league in two-point attempts (13.0 per game), and Trey Murphy III is tied for first in three-point attempts (8.6 per game). However, this high volume has not translated to wins. The box score data do not provide insight into potential causes for this trend, such as strength of schedule or player injuries, but they confirm a substantial downturn in on-court results.
An analysis of the league’s elite teams reveals different paths to success. While the Pistons show balance, the Thunder and Spurs appear driven by dominant individual players. Oklahoma City’s league-best performance is correlated with an MVP-caliber season from Shai Gilgeous-Alexander, who ranks ninth in scoring (31.6 points per game) and eighth in free throw attempts (9.3). Similarly, the Spurs’ success is anchored by Victor Wembanyama, whose 3.1 blocks per game lead the league by a substantial margin of 1.1 over the next closest player. This suggests that while team balance can be effective, elite individual talent remains a primary component of top-tier contention.
A closer look at the player leaderboards requires careful interpretation, particularly in percentage-based categories. Several players are listed with perfect shooting percentages (1.000) in categories like 2P% and 3P%. This is a common limitation of season-to-date box score analysis, as these figures likely reflect players with a very small number of attempts who have not yet missed a shot. In volume-based statistics, the league’s scoring race is led by Luka Dončić of the Lakers (33.5 points per game), while Nikola Jokić of the Nuggets continues to redefine the center position, leading all players in assists with 10.9 per game. These individual achievements highlight the diverse skill sets of the league’s top performers.
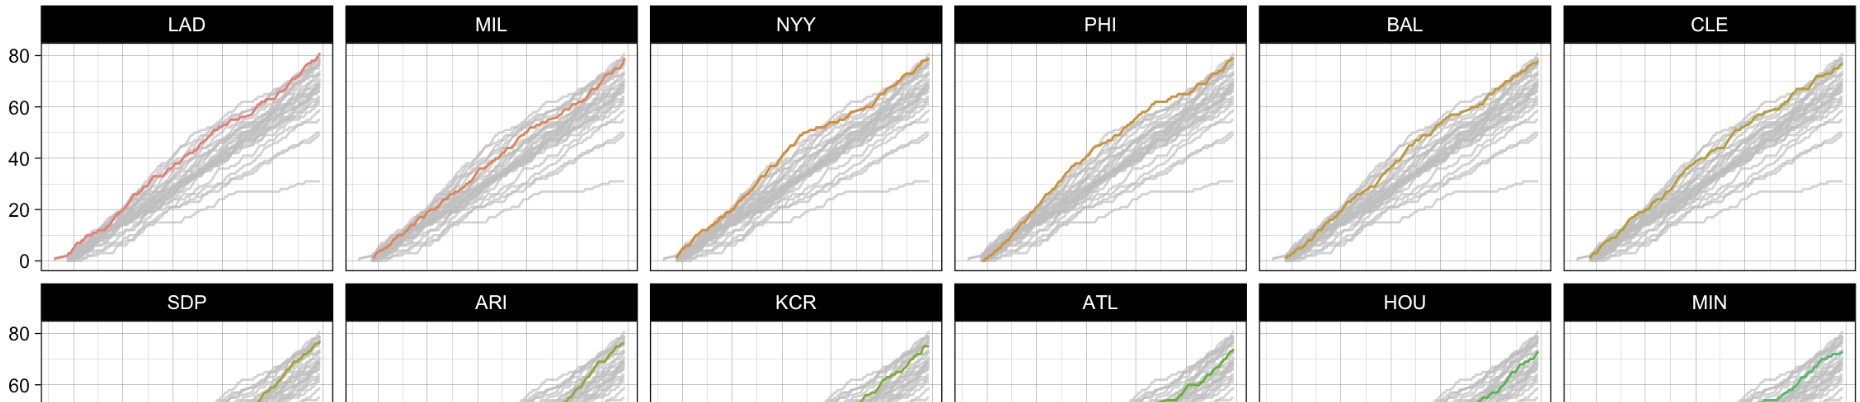
Cumulative Wins
This figure presents cumulative wins by NBA team during the current season. Each panel corresponds to a single team, with the x-axis representing the progression of the season by date and the y-axis showing the total number of wins accumulated to date. This display helps illustrate how quickly teams have been winning games relative to one another and provides a clear view of momentum, slumps, or sustained success over time. Because the plot updates automatically as new data become available, it reflects each team’s current position in the season at the time of the most recent refresh.
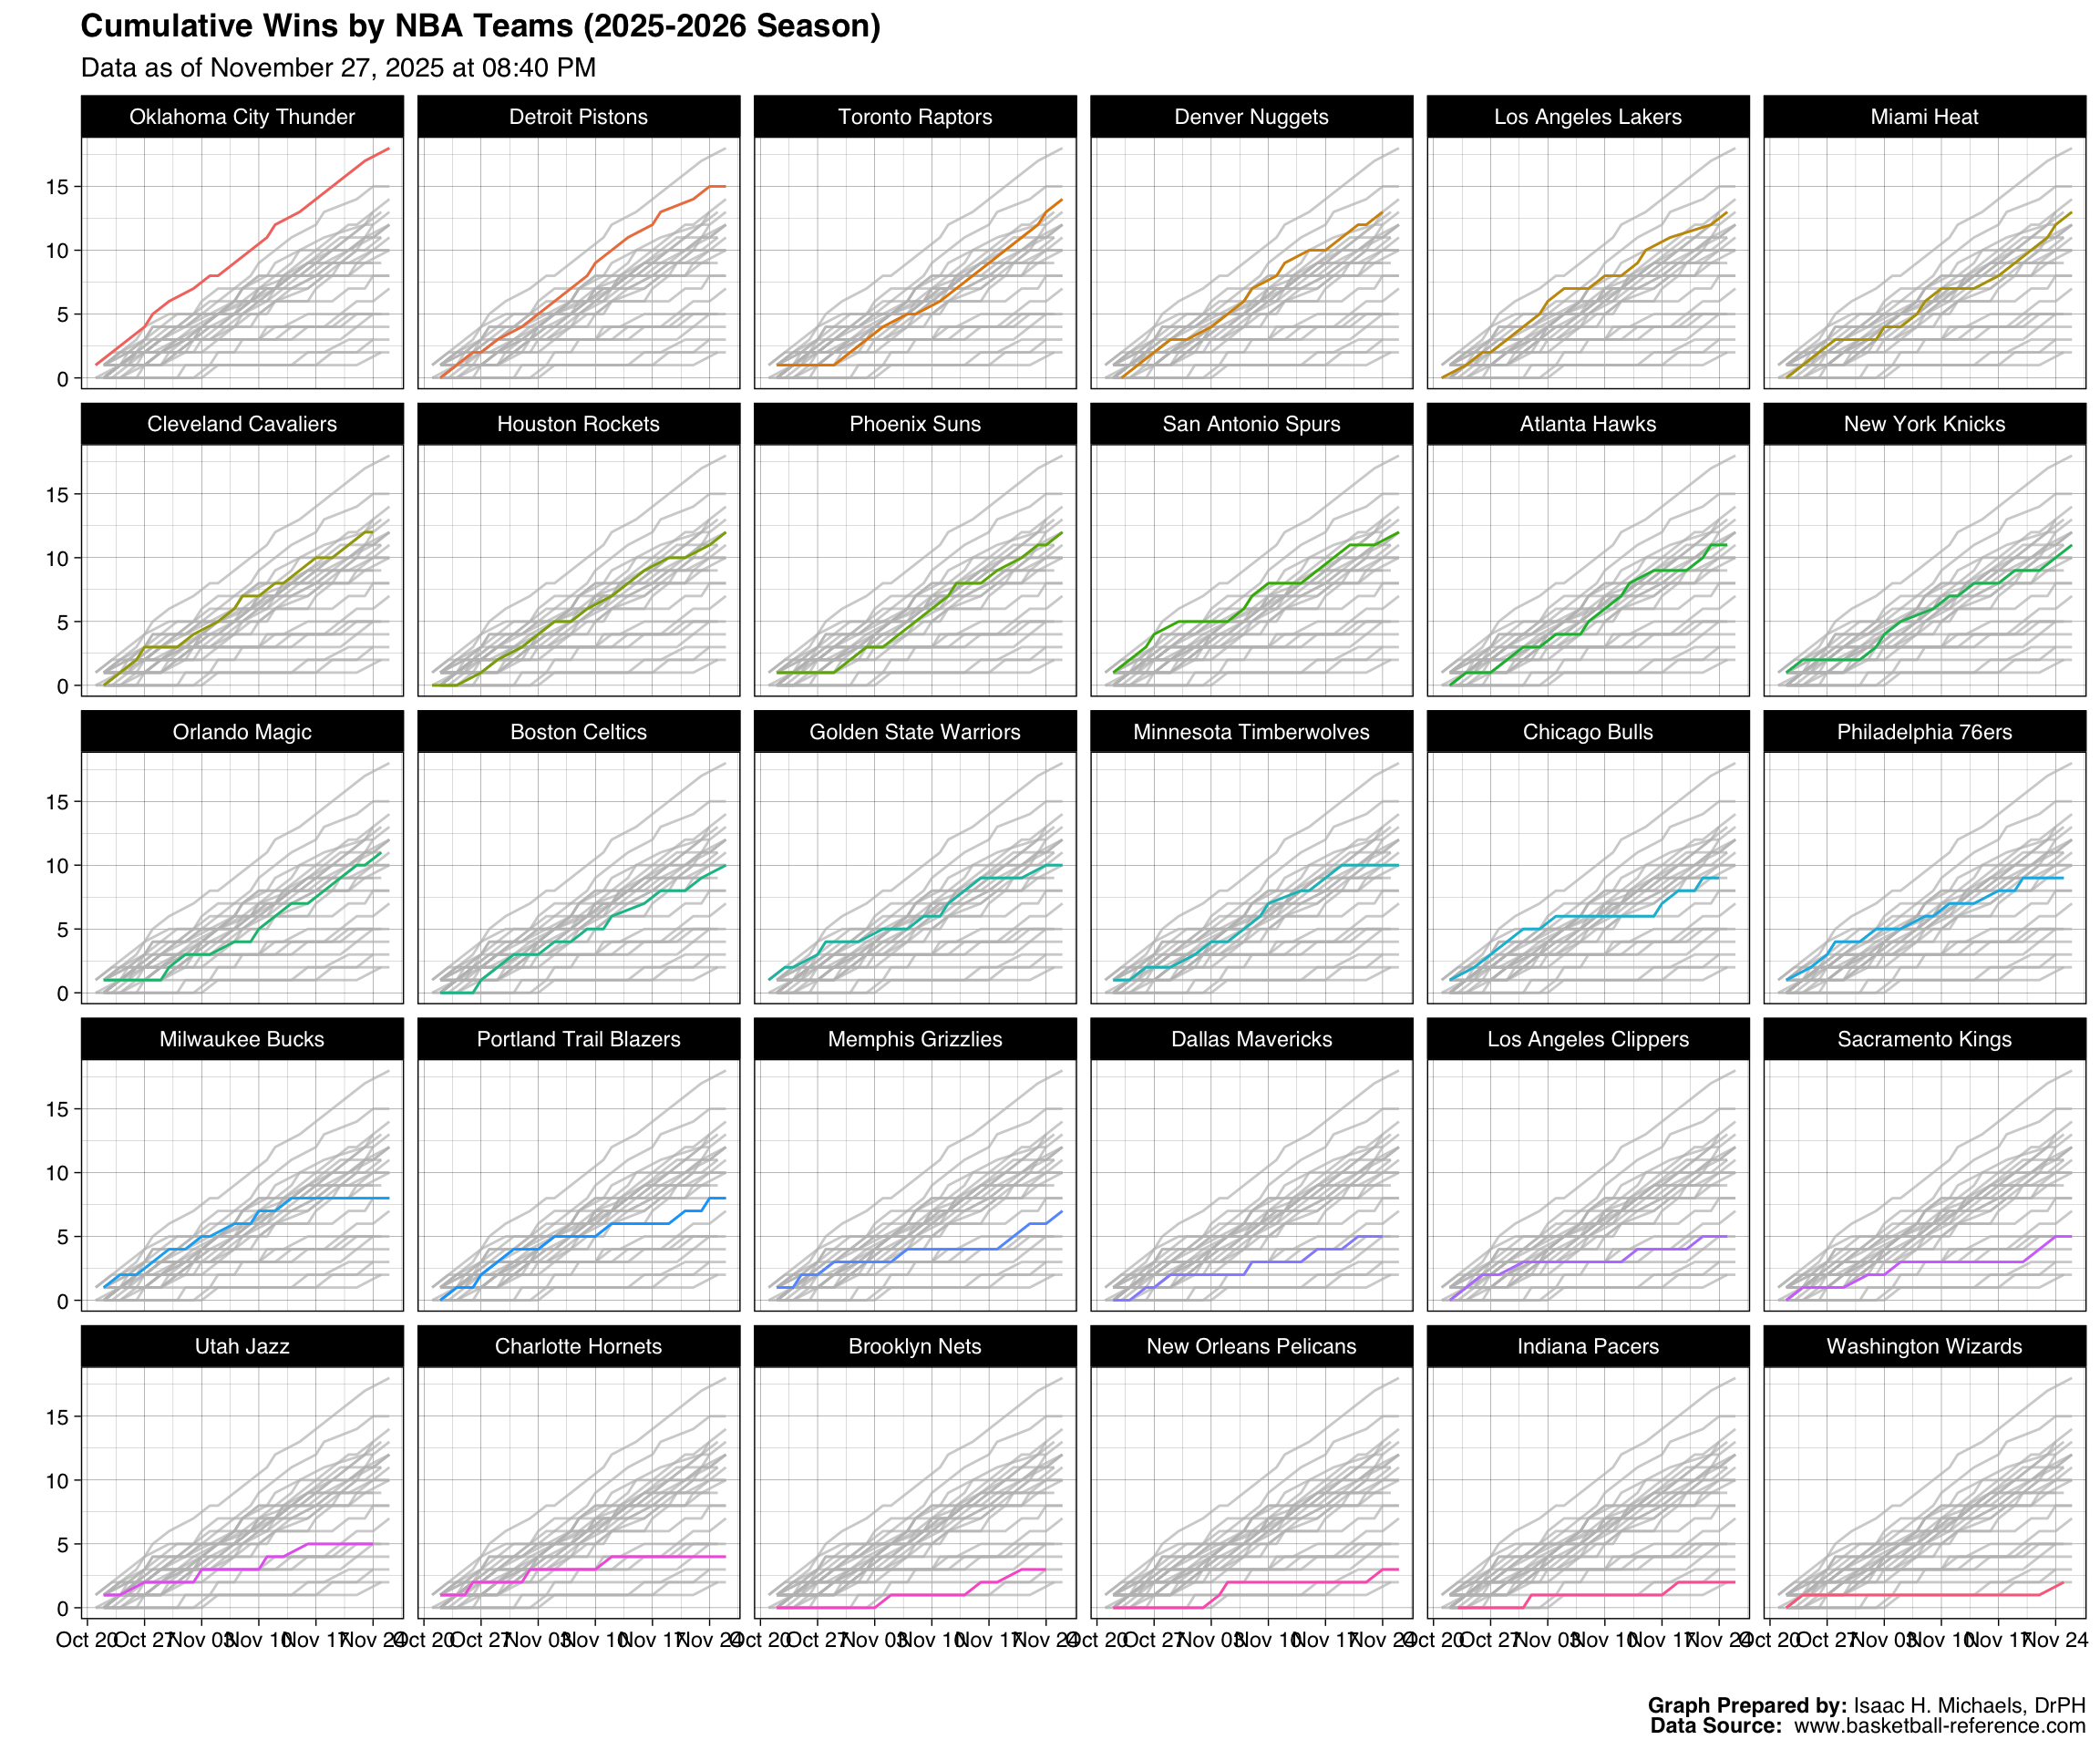
Graph Prepared By: Isaac H. Michaels, DrPH
Data Source: www.basketball-reference.com
Head-to-Head Records
This figure presents a cross-tabulated heat map detailing the head-to-head performance of each NBA team during the current season. Each row corresponds to a specific team, while the columns represent their respective opponents. The intersecting cells contain text displaying the exact win-loss record for that specific matchup. Additionally, the background of each cell is colored according to the head-to-head differential using a diverging color scale, where positive values—indicating a favorable margin—and negative values—indicating an unfavorable margin—are visually distinguished. Teams whose rows feature a higher concentration of blues demonstrate broader dominance across the league. In contrast, rows saturated with reds highlight teams struggling against a variety of opponents. This visualization offers a comprehensive, at-a-glance snapshot of individual matchup advantages, intra-league parity, and overall team competitiveness to date.
Graph Prepared By: Isaac H. Michaels, DrPH
Data Source: www.basketball-reference.com
Points Scored vs. Points Allowed
This figure plots points scored against points allowed for each NBA team during the current season. Each panel corresponds to a single team, with individual points representing games. Points above the diagonal dashed line indicate games in which the team scored more points than it allowed (wins), while points below the line indicate losses. Points are colored according to game outcome to distinguish between wins and losses. Teams with a larger number of points above the line tend to outscore their opponents more consistently, reflecting stronger overall offensive and defensive performance. The figure provides a visual summary of each team’s scoring efficiency and defensive strength across all games to date.
Graph Prepared By: Isaac H. Michaels, DrPH
Data Source: www.basketball-reference.com
Point Differentials
Histograms
This figure displays histograms of game-level point differentials for each NBA team during the current season. Each bar represents the number of games with a given scoring margin, using a bin width of five points. Positive differentials correspond to wins, while negative values correspond to losses. Bars are colored according to game outcome, distinguishing victories from defeats. Teams whose histograms are skewed to the right tend to win by larger margins or more frequently, reflecting stronger performance and offensive dominance. In contrast, teams with distributions clustered near zero or skewed to the left tend to play in closer or less favorable contests. This visualization provides a clear snapshot of each team’s competitiveness, consistency, and margin of victory throughout the season.
Graph Prepared By: Isaac H. Michaels, DrPH
Data Source: www.basketball-reference.com
Trends
This figure presents game-by-game point differentials for each NBA team throughout the current season. Each vertical bar represents a single game, with its height showing the margin of victory or defeat — positive values for wins and negative values for losses. Bars are colored green for wins and red for losses. The plot provides a visual timeline of each team’s season, highlighting streaks of dominance, close contests, and periods of inconsistency. Teams with consistently tall positive bars tend to win decisively or maintain strong offensive and defensive balance, while those with frequent negative or alternating bars exhibit more erratic outcomes. By visualizing game results in sequence, the chart offers a clear picture of momentum shifts, performance stability, and overall competitiveness over time.
Graph Prepared By: Isaac H. Michaels, DrPH
Data Source: www.basketball-reference.com
Player Statistics
Per-Game Stats
This table summarizes individual performance statistics for all NBA players who have appeared in at least 10 games during the current season. It provides a comprehensive overview of offensive and defensive contributions across multiple dimensions of play. Core indicators such as games played (G), games started (GS), and minutes per game (MP) establish each player’s level of participation and role within their team. Scoring efficiency is reflected through field goal (FG%), three-point (3P%), two-point (2P%), and free throw (FT%) percentages, along with related per-game averages for made and attempted shots.
Rebounding and playmaking statistics—offensive rebounds (ORB), defensive rebounds (DRB), total rebounds (TRB), and assists (AST)—capture control of possession and ball distribution, while defensive metrics such as steals (STL) and blocks (BLK) reflect individual defensive impact. Turnovers (TOV) and personal fouls (PF) provide additional context on possession management and defensive discipline. Points per game (PTS) serve as a key summary measure of scoring productivity.
Together, these statistics offer a balanced portrait of player performance across offensive efficiency, defensive activity, and overall on-court effectiveness. Awards and recognitions are included where applicable, highlighting standout achievements during the season.
Note: Table displays rows only for players who played in at least 10 games.
Table Prepared By: Isaac H. Michaels, DrPH
Data Source: www.basketball-reference.com
G – Games
GS – Games Started
MP – Minutes Played Per Game
PTS – Points Per Game
FG – Field Goals Per Game
FGA – Field Goal Attempts Per Game
FG% – Field Goal Percentage
3P – 3-Point Field Goals Per Game
3PA – 3-Point Field Goal Attempts Per Game
3P% – 3-Point Field Goal Percentage
2P – 2-Point Field Goals Per Game
2PA – 2-Point Field Goal Attempts Per Game
2P% – 2-Point Field Goal Percentage
eFG% – Effective Field Goal Percentage
FT – Free Throws Per Game
FTA – Free Throw Attempts Per Game
FT% – Free Throw Percentage
ORB – Offensive Rebounds Per Game
DRB – Defensive Rebounds Per Game
TRB – Total Rebounds Per Game
AST – Assists Per Game
STL – Steals Per Game
BLK – Blocks Per Game
TOV – Turnovers Per Game
PF – Personal Fouls Per Game
Distributions and Leaders in Selected Statistics
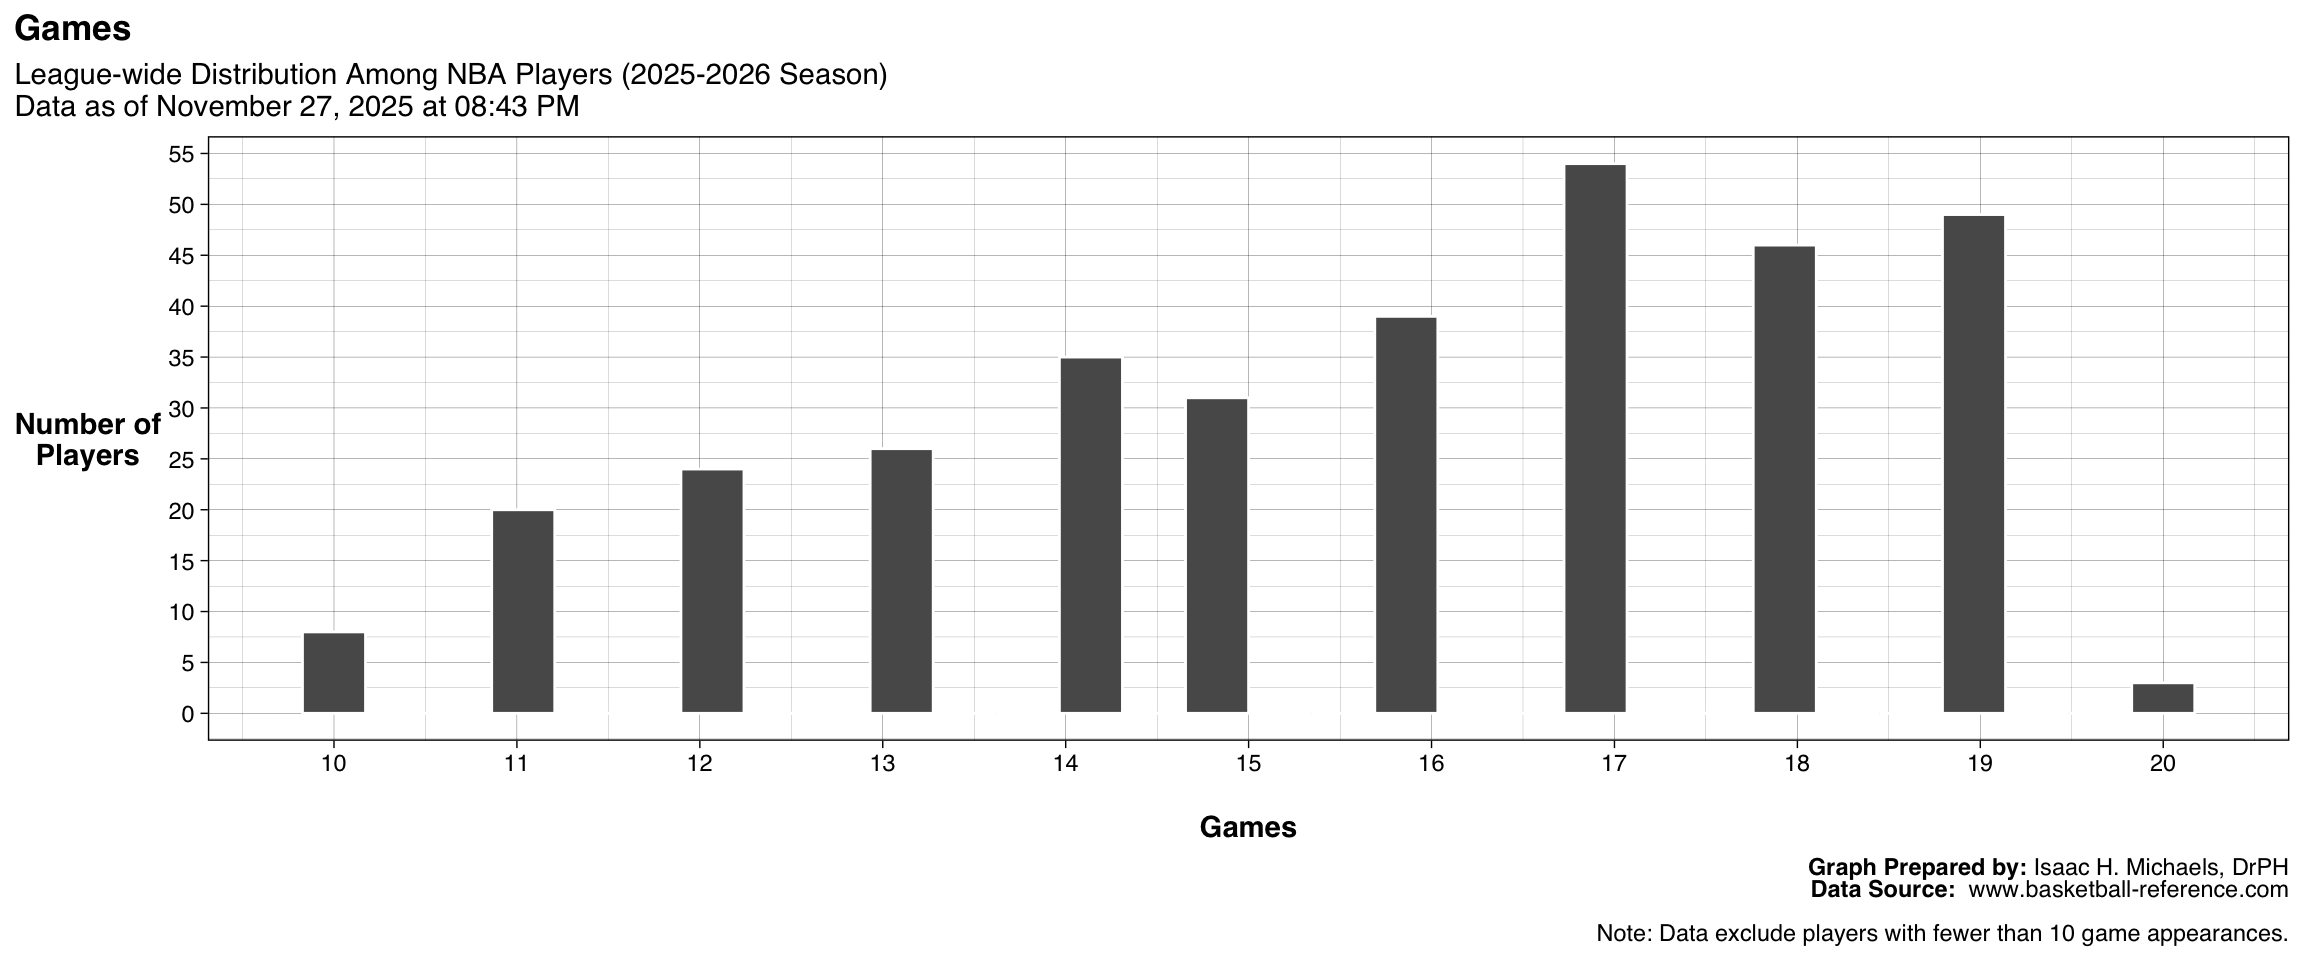
Games
This figure shows the distribution of games played among all eligible NBA players during the current season. Each bar represents the number of players who have appeared in a given range of total games. The accompanying table lists the ten players who have appeared in the most games to date. Together, these displays highlight variation in player availability and durability across the league, providing insight into who has remained consistently active throughout the season. The outputs update automatically as new games are played.
| League-wide Leaders: Games | ||||
| 2025-2026 Season Data as of April 05, 2026 at 04:57 PM |
||||
| Rank | Player | Team | Position | G |
|---|---|---|---|---|
| 1 | Mikal Bridges | New York Knicks | SF | 78 |
| 2 | Jeremiah Fears | New Orleans Pelicans | PG | 78 |
| 3 | Toumani Camara | Portland Trail Blazers | PF | 78 |
| 4 | Keldon Johnson | San Antonio Spurs | SF | 78 |
| 5 | Julian Champagnie | San Antonio Spurs | SF | 78 |
| 6 | Bruce Brown | Denver Nuggets | SG | 78 |
| 7 | Javonte Green | Detroit Pistons | SG | 78 |
| 8 | Sion James | Charlotte Hornets | SG | 78 |
| 9 | Julius Randle | Minnesota Timberwolves | PF | 77 |
| 10 | Desmond Bane | Orlando Magic | SG | 77 |
| 11 | Kon Knueppel | Charlotte Hornets | SF | 77 |
| 12 | Tim Hardaway Jr. | Denver Nuggets | SG | 77 |
| 13 | Reed Sheppard | Houston Rockets | SG | 77 |
| 14 | Brandin Podziemski | Golden State Warriors | SG | 77 |
| 15 | Donte DiVincenzo | Minnesota Timberwolves | SG | 77 |
| 16 | Derik Queen | New Orleans Pelicans | C | 77 |
| 17 | Bub Carrington | Washington Wizards | PG | 77 |
| 18 | Jay Huff | Indiana Pacers | C | 77 |
| 19 | Jake LaRavia | Los Angeles Lakers | PF | 77 |
| 20 | Kris Dunn | Los Angeles Clippers | PG | 77 |
| 21 | Jamal Shead | Toronto Raptors | PG | 77 |
| 22 | Oso Ighodaro | Phoenix Suns | PF | 77 |
| Table Prepared by: Isaac H. Michaels, DrPH Data Source: www.basketball-reference.com |
||||
| Note: Data exclude players with fewer than 10 game appearances. | ||||
Graph and Table Prepared By: Isaac H. Michaels, DrPH
Data Source: www.basketball-reference.com
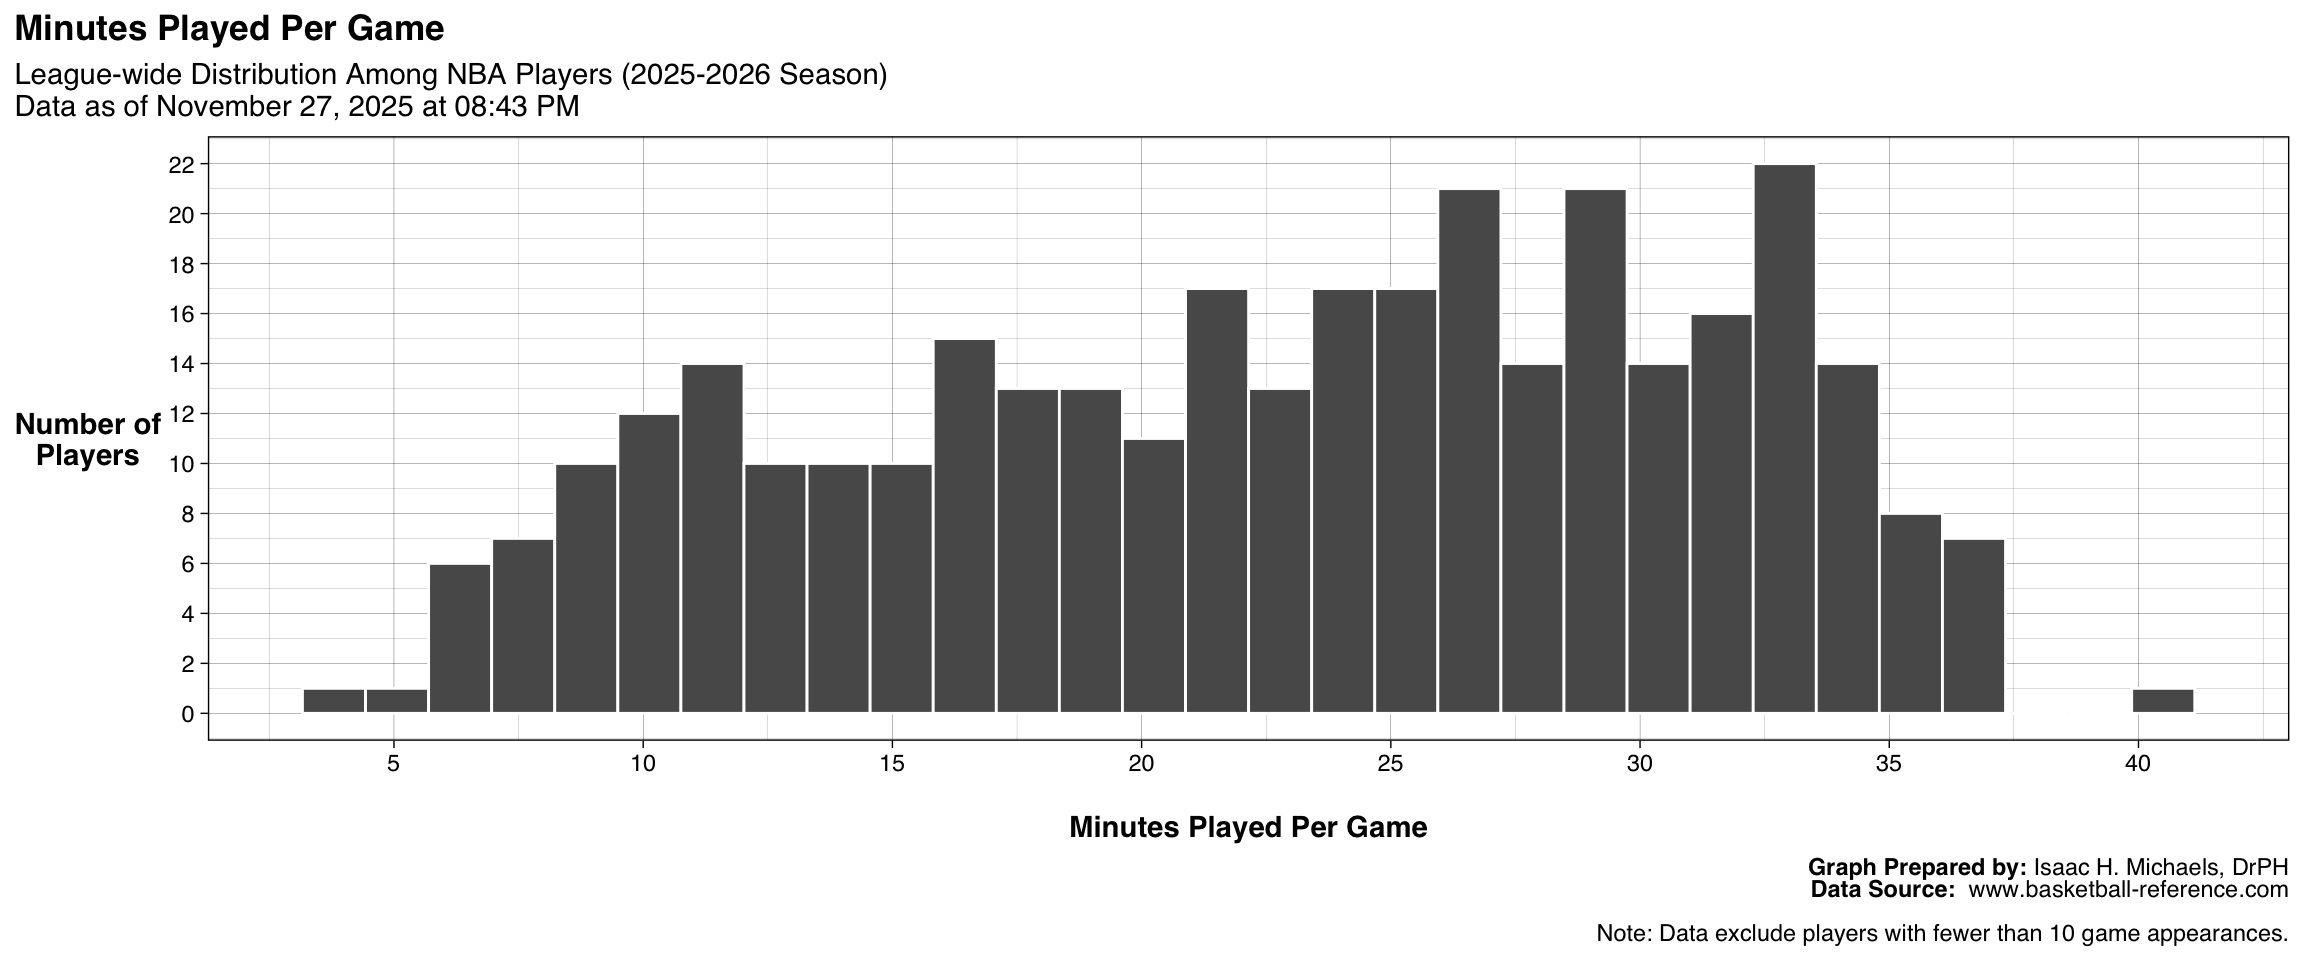
Minutes Played Per Game
This figure displays the distribution of average minutes played per game among all eligible NBA players during the current season. Each bar corresponds to the number of players whose average playing time falls within a specific range. The accompanying table lists the ten players averaging the most minutes per game. These outputs provide perspective on workload and rotation patterns across the league—players with higher values typically serve as core contributors who spend the most time on the court. The visual updates automatically as new game data become available.
| League-wide Leaders: Minutes Played Per Game | ||||
| 2025-2026 Season Data as of April 05, 2026 at 04:57 PM |
||||
| Rank | Player | Team | Position | MP |
|---|---|---|---|---|
| 1 | Tyrese Maxey | Philadelphia 76ers | PG | 38.2 |
| 2 | Amen Thompson | Houston Rockets | PG | 37.3 |
| 3 | Kevin Durant | Houston Rockets | SF | 36.4 |
| 4 | Luka Dončić | Los Angeles Lakers | PG | 35.8 |
| 5 | Trey Murphy III | New Orleans Pelicans | SF | 35.5 |
| 6 | James Harden | Los Angeles Clippers | PG | 35.4 |
| 7 | Jamal Murray | Denver Nuggets | PG | 35.3 |
| 8 | Anthony Edwards | Minnesota Timberwolves | SG | 35.2 |
| 9 | Jalen Johnson | Atlanta Hawks | SF | 35.2 |
| 10 | Jabari Smith Jr. | Houston Rockets | PF | 35.1 |
| Table Prepared by: Isaac H. Michaels, DrPH Data Source: www.basketball-reference.com |
||||
| Note: Data exclude players with fewer than 10 game appearances. | ||||
Graph and Table Prepared By: Isaac H. Michaels, DrPH
Data Source: www.basketball-reference.com
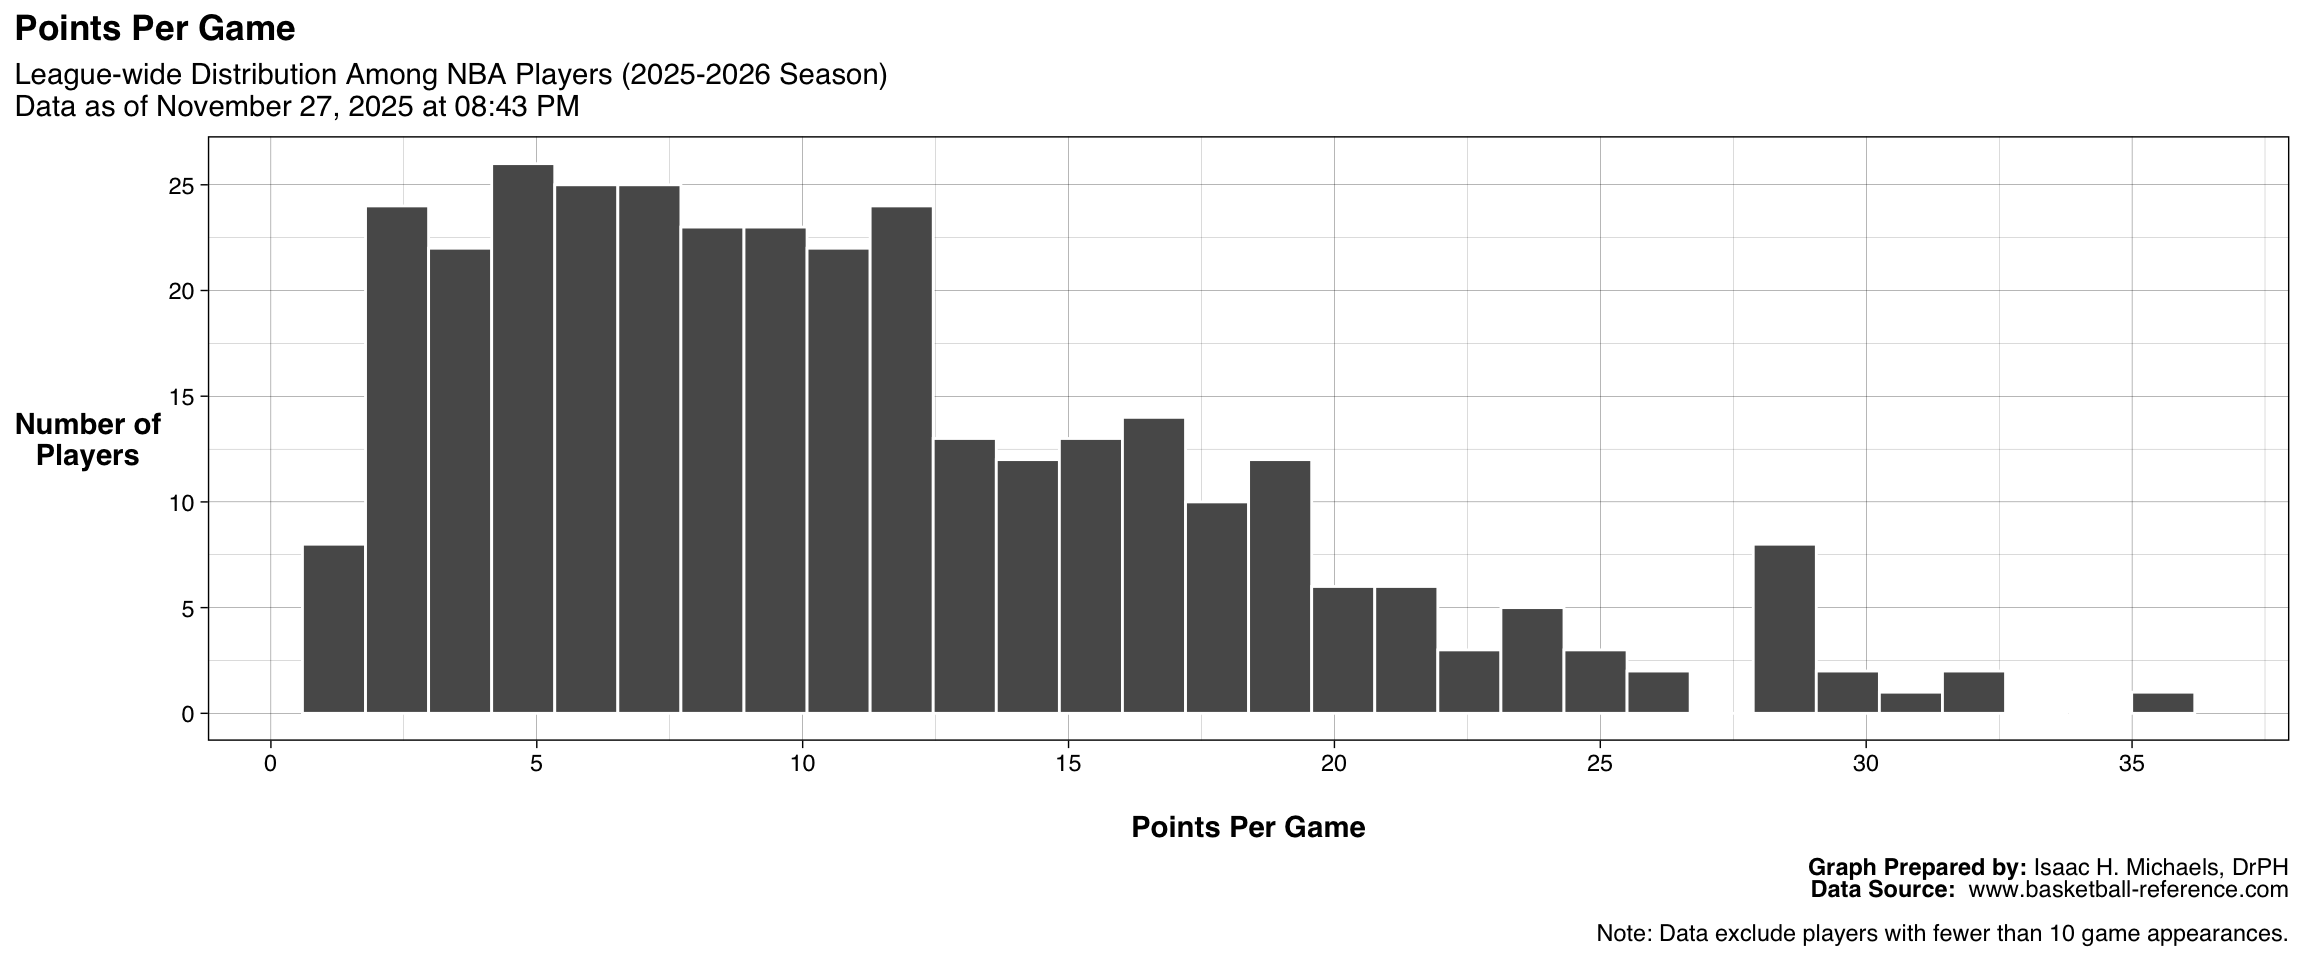
Points Per Game
This figure presents the distribution of points per game among all eligible NBA players during the current season. Each bar represents the number of players averaging a given scoring range. The accompanying table lists the ten players with the highest scoring averages. Together, these visuals illustrate league-wide scoring dynamics and distinguish the season’s most prolific scorers from players with more moderate offensive output. The figure and table refresh automatically as new games are played.
| League-wide Leaders: Points Per Game | ||||
| 2025-2026 Season Data as of April 05, 2026 at 04:57 PM |
||||
| Rank | Player | Team | Position | PTS |
|---|---|---|---|---|
| 1 | Luka Dončić | Los Angeles Lakers | PG | 33.5 |
| 2 | Shai Gilgeous-Alexander | Oklahoma City Thunder | PG | 31.6 |
| 3 | Anthony Edwards | Minnesota Timberwolves | SG | 28.9 |
| 4 | Jaylen Brown | Boston Celtics | SF | 28.7 |
| 5 | Tyrese Maxey | Philadelphia 76ers | PG | 28.6 |
| 6 | Kawhi Leonard | Los Angeles Clippers | SF | 28.0 |
| 7 | Nikola Jokić | Denver Nuggets | C | 27.9 |
| 8 | Donovan Mitchell | Cleveland Cavaliers | SG | 27.7 |
| 9 | Giannis Antetokounmpo | Milwaukee Bucks | PF | 27.6 |
| 10 | Stephen Curry | Golden State Warriors | PG | 27.2 |
| Table Prepared by: Isaac H. Michaels, DrPH Data Source: www.basketball-reference.com |
||||
| Note: Data exclude players with fewer than 10 game appearances. | ||||
Graph and Table Prepared By: Isaac H. Michaels, DrPH
Data Source: www.basketball-reference.com
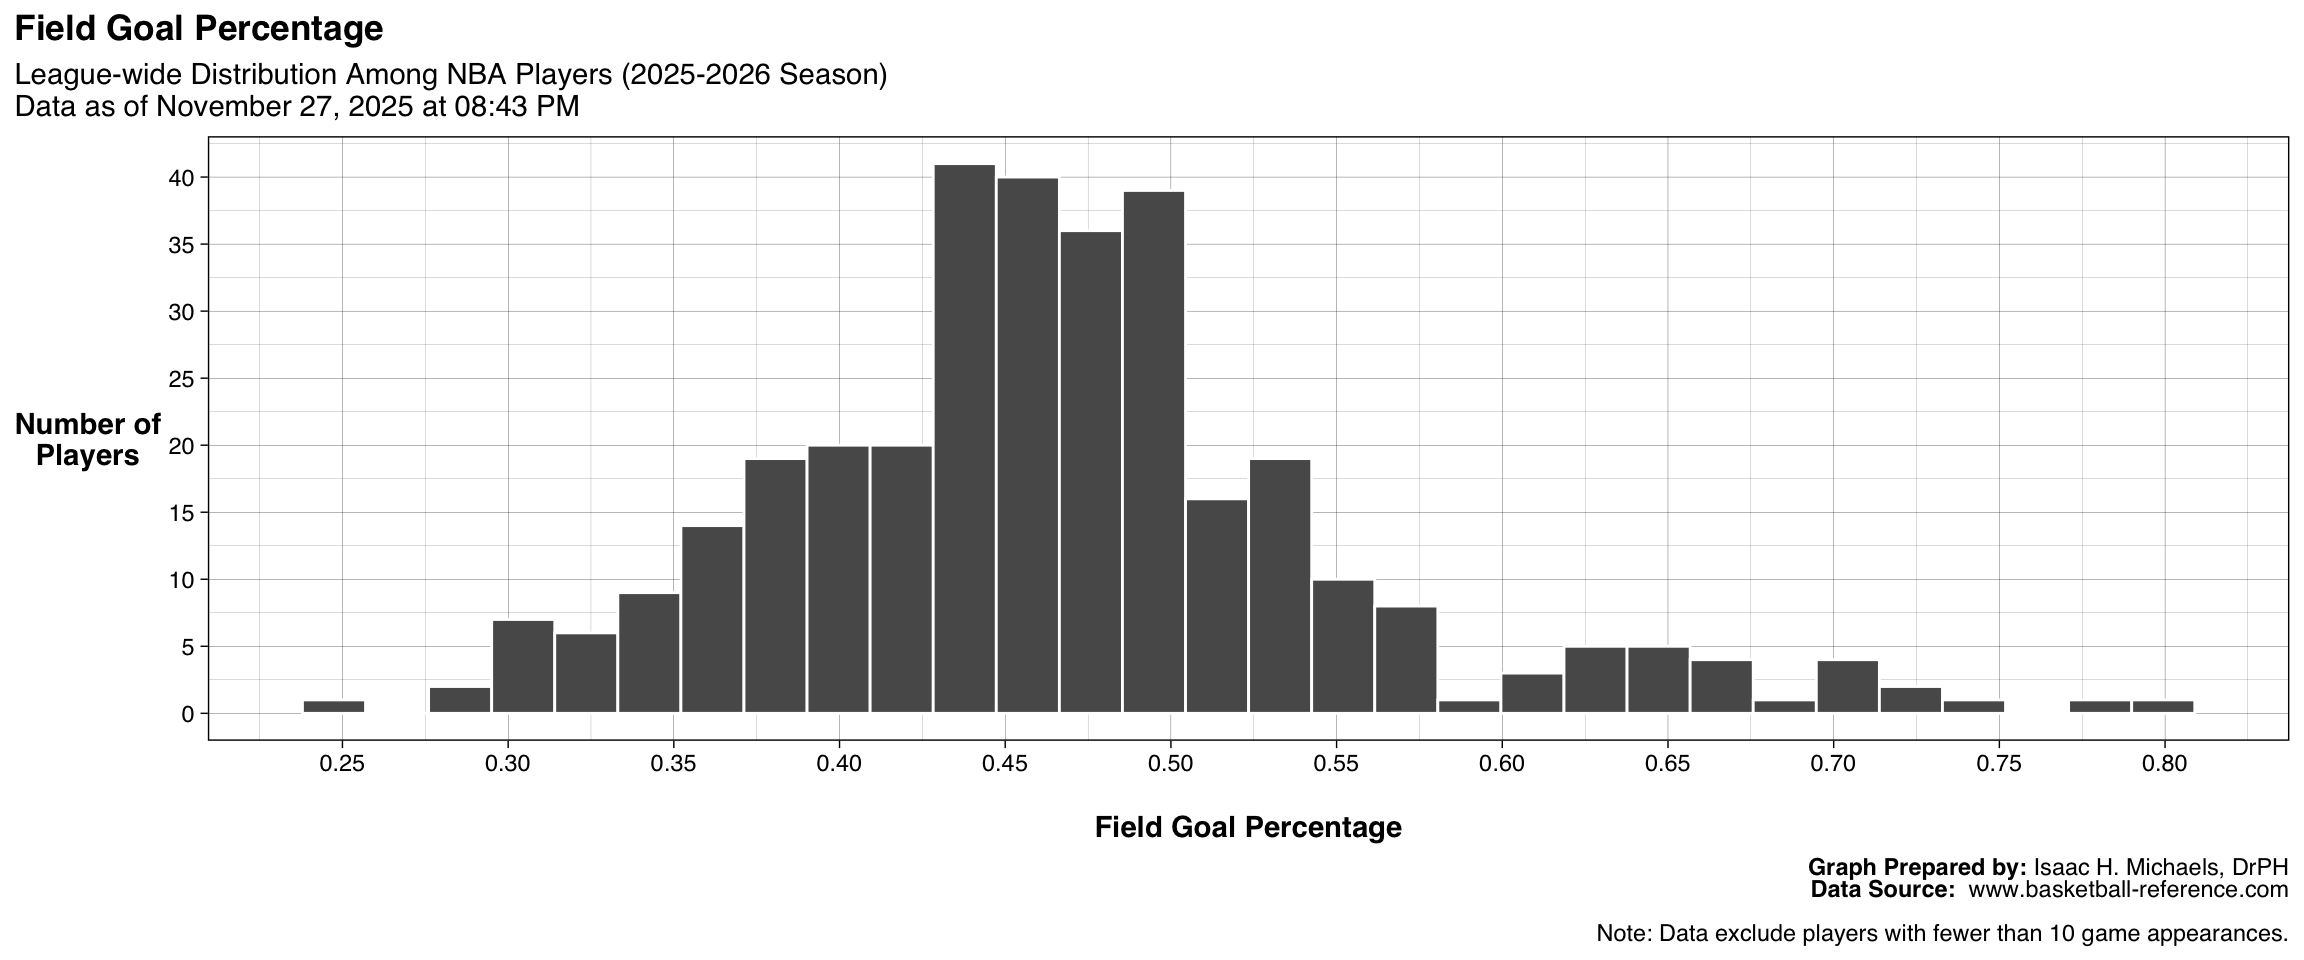
Field Goal Percentage
This figure shows the distribution of field goal percentage among all eligible NBA players during the current season. Each bar represents the number of players whose shooting accuracy falls within a given percentage range. The accompanying table lists the ten players with the highest field goal percentages. Together, these outputs offer a league-wide view of shooting efficiency, helping to identify players who convert scoring opportunities at the most consistent rates. The displays update automatically as new game data are incorporated.
| League-wide Leaders: Field Goal Percentage | ||||
| 2025-2026 Season Data as of April 05, 2026 at 04:57 PM |
||||
| Rank | Player | Team | Position | FG% |
|---|---|---|---|---|
| 1 | Jericho Sims | Milwaukee Bucks | C | 0.793 |
| 2 | Mason Plumlee | NA | C | 0.769 |
| 3 | Isaiah Jackson | Los Angeles Clippers | C | 0.764 |
| 4 | Jaxson Hayes | Los Angeles Lakers | C | 0.754 |
| 5 | Mason Plumlee | Charlotte Hornets | C | 0.750 |
| 6 | Ryan Kalkbrenner | Charlotte Hornets | C | 0.746 |
| 7 | Mitchell Robinson | New York Knicks | C | 0.724 |
| 8 | Robert Williams | Portland Trail Blazers | C | 0.716 |
| 9 | Jakob Poeltl | Toronto Raptors | C | 0.696 |
| 10 | Rudy Gobert | Minnesota Timberwolves | C | 0.686 |
| Table Prepared by: Isaac H. Michaels, DrPH Data Source: www.basketball-reference.com |
||||
| Note: Data exclude players with fewer than 10 game appearances. | ||||
Graph and Table Prepared By: Isaac H. Michaels, DrPH
Data Source: www.basketball-reference.com
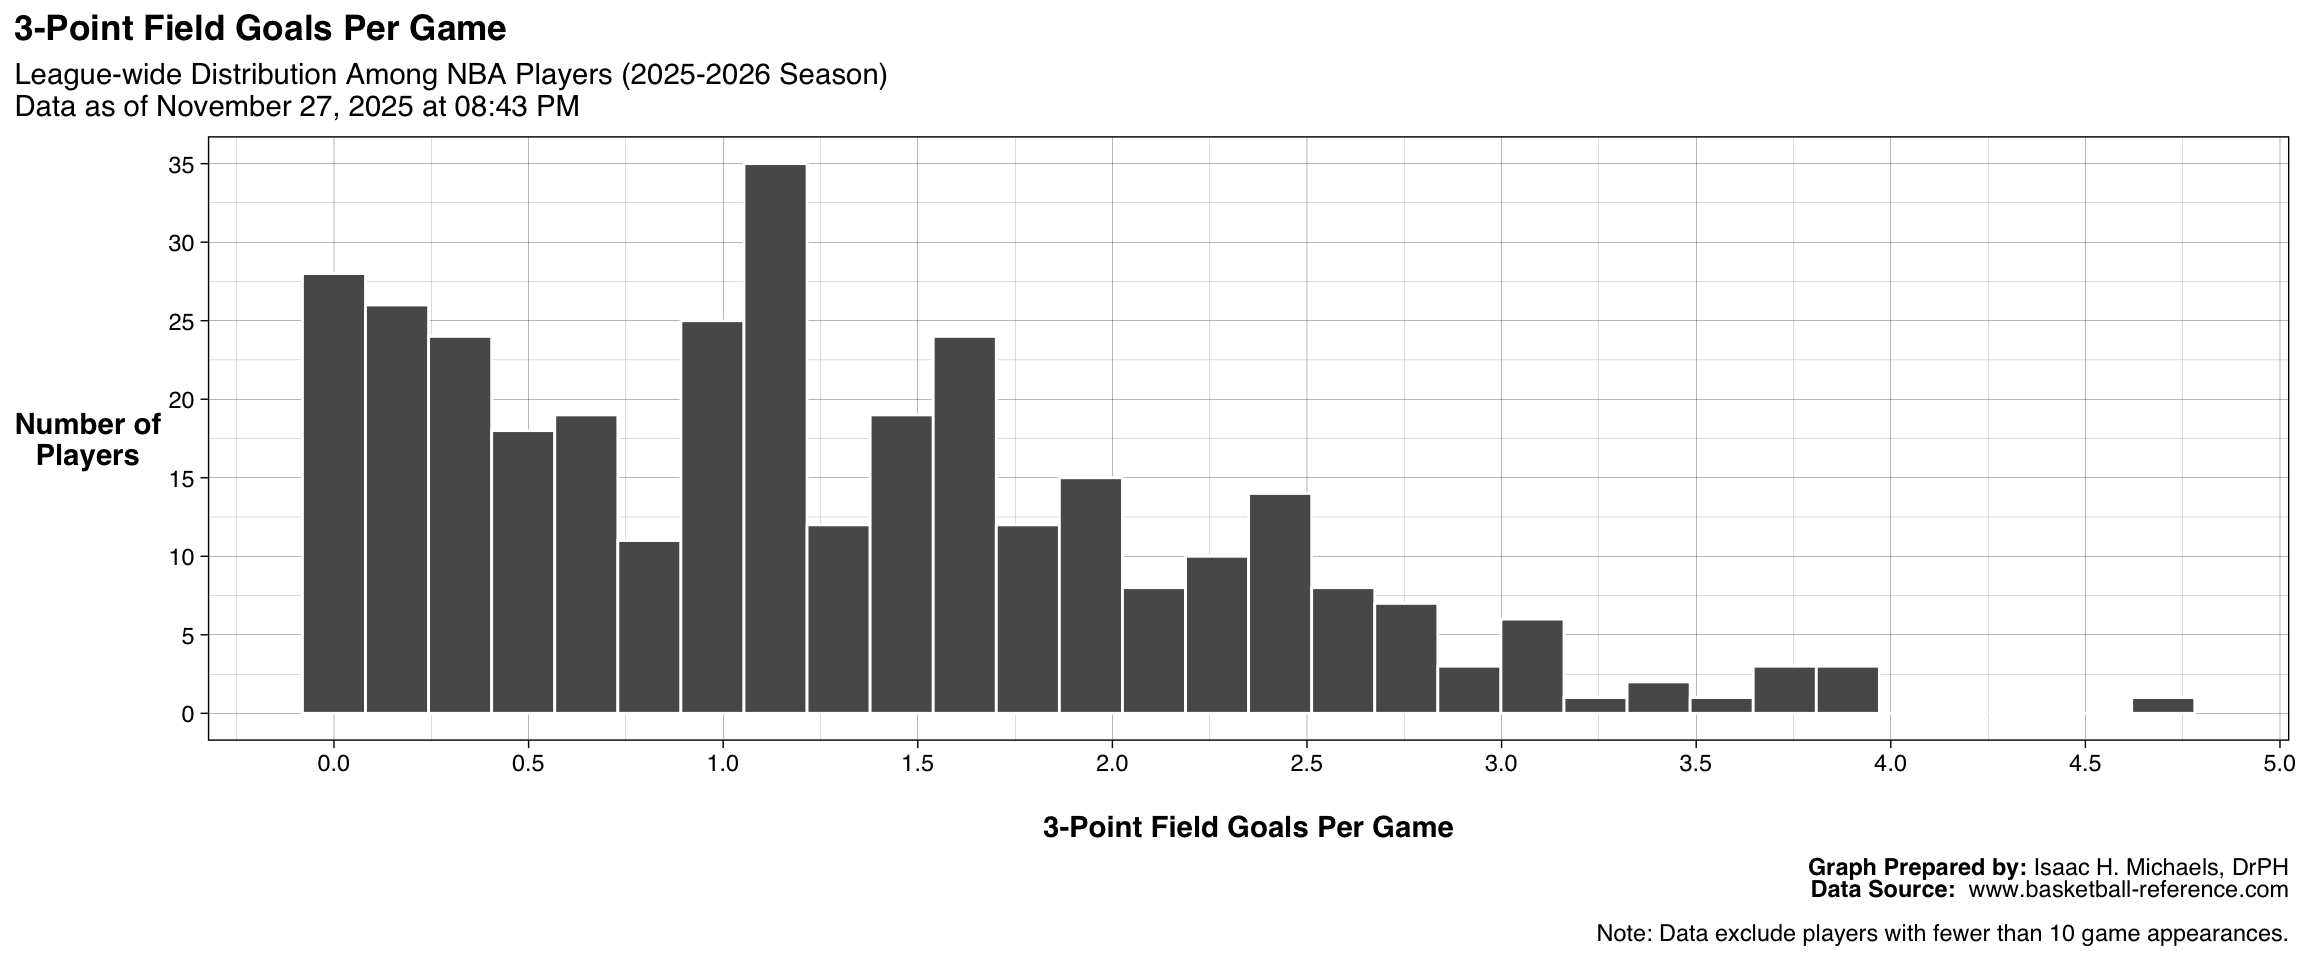
3-Point Field Goals Per Game
This figure presents the distribution of average three-point field goals made per game among all eligible NBA players during the current season. Each bar corresponds to the number of players averaging a given range of made three-pointers per game. The accompanying table lists the ten players who make the most three-point shots on average. These displays highlight league-wide variation in long-range scoring output and identify players who contribute most heavily from beyond the arc. The figure and table refresh automatically as new data become available.
| League-wide Leaders: 3-Point Field Goals Per Game | ||||
| 2025-2026 Season Data as of April 05, 2026 at 04:57 PM |
||||
| Rank | Player | Team | Position | 3P |
|---|---|---|---|---|
| 1 | Stephen Curry | Golden State Warriors | PG | 4.5 |
| 2 | Luka Dončić | Los Angeles Lakers | PG | 4.0 |
| 3 | Darius Garland | Los Angeles Clippers | PG | 3.7 |
| 4 | LaMelo Ball | Charlotte Hornets | PG | 3.6 |
| 5 | Anthony Edwards | Minnesota Timberwolves | SG | 3.4 |
| 6 | Michael Porter Jr. | Brooklyn Nets | SF | 3.4 |
| 7 | Kon Knueppel | Charlotte Hornets | SF | 3.4 |
| 8 | Donovan Mitchell | Cleveland Cavaliers | SG | 3.3 |
| 9 | Grayson Allen | Phoenix Suns | SG | 3.3 |
| 10 | Tyrese Maxey | Philadelphia 76ers | PG | 3.2 |
| 11 | Jamal Murray | Denver Nuggets | PG | 3.2 |
| 12 | Trey Murphy III | New Orleans Pelicans | SF | 3.2 |
| 13 | Nickeil Alexander-Walker | Atlanta Hawks | SG | 3.2 |
| 14 | Brandon Miller | Charlotte Hornets | SF | 3.2 |
| Table Prepared by: Isaac H. Michaels, DrPH Data Source: www.basketball-reference.com |
||||
| Note: Data exclude players with fewer than 10 game appearances. | ||||
Graph and Table Prepared By: Isaac H. Michaels, DrPH
Data Source: www.basketball-reference.com
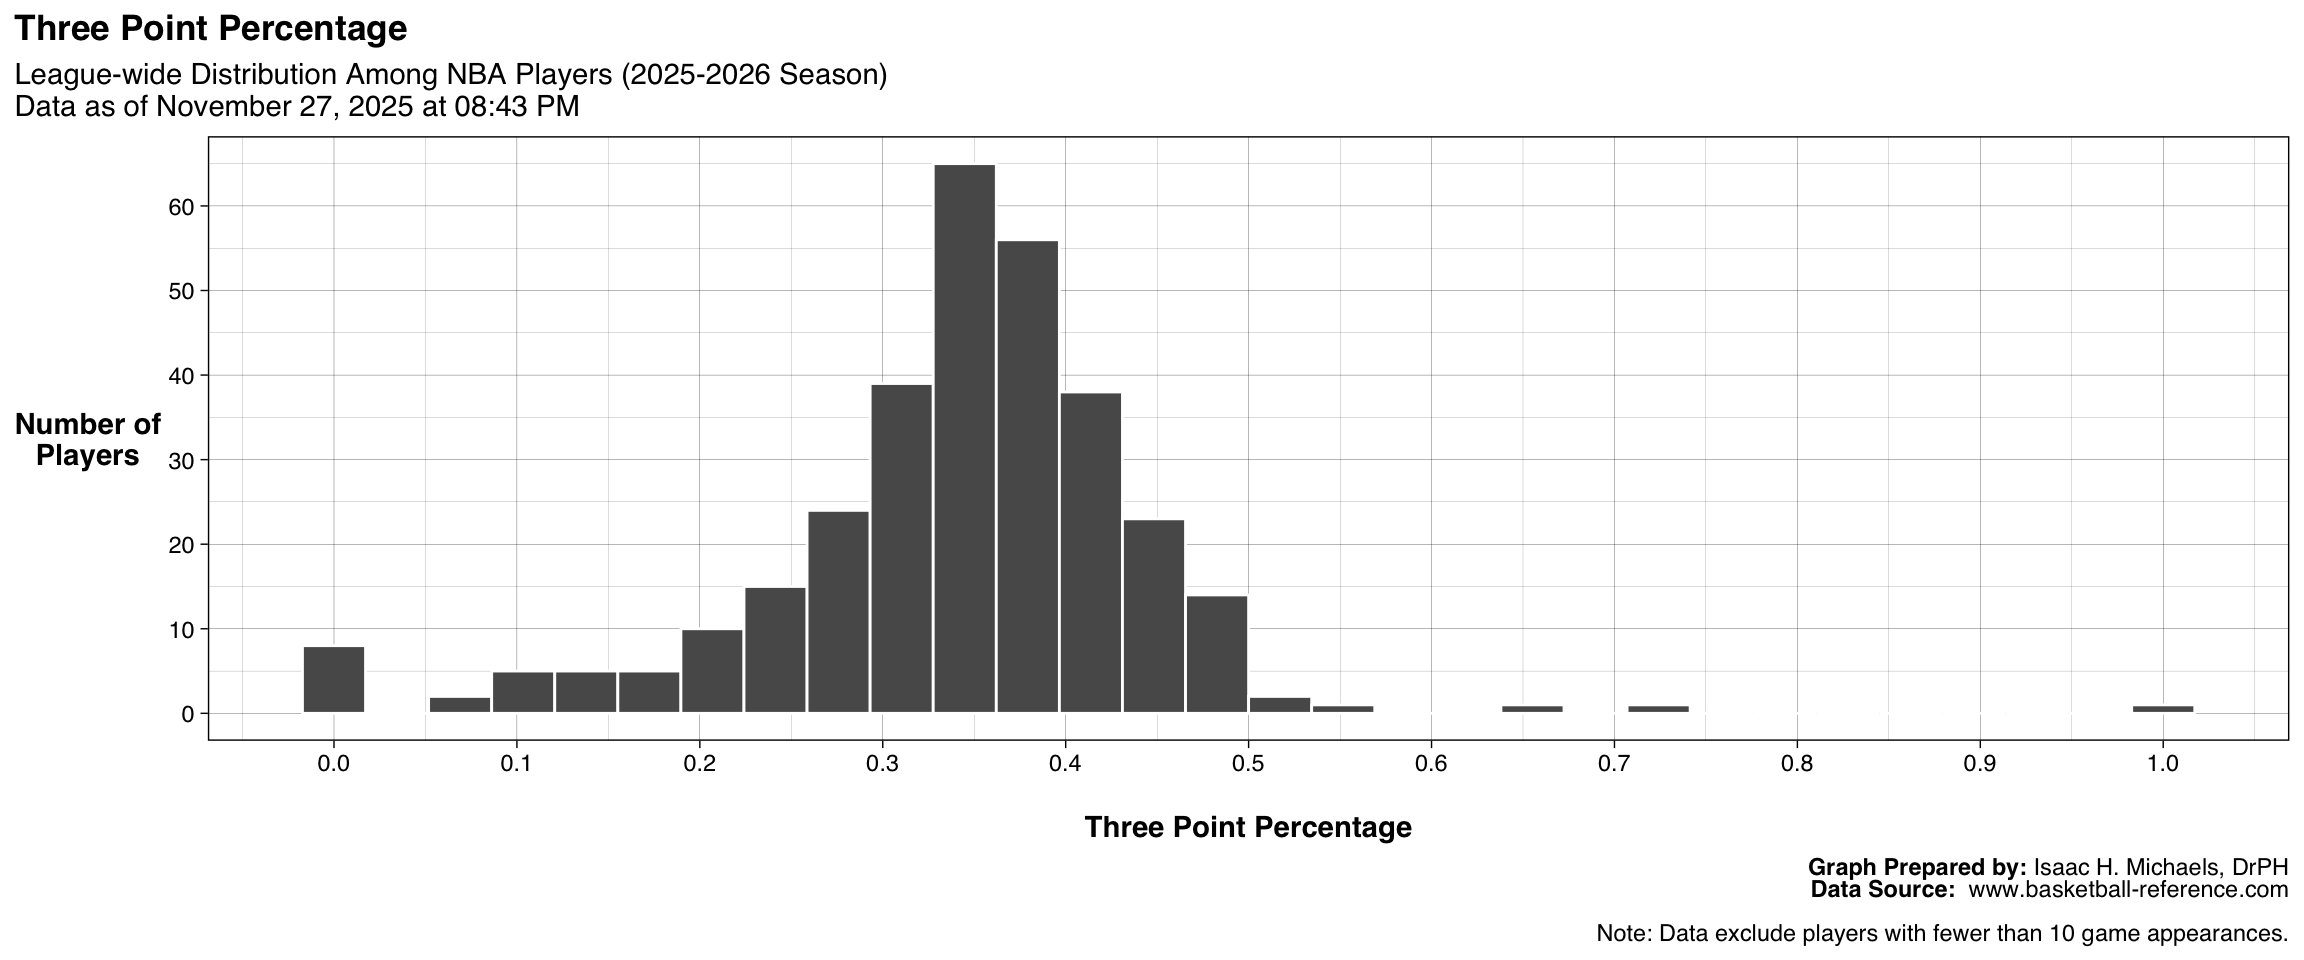
3-Point Field Goal Percentage
This figure displays the distribution of three-point field goal percentage among all eligible NBA players during the current season. Each bar represents the number of players whose accuracy from beyond the arc falls within the corresponding percentage range. The accompanying table lists the ten players with the highest three-point shooting percentages. Together, these visuals capture the range of long-distance shooting efficiency across the league and spotlight the most accurate perimeter shooters. The outputs update automatically as new games are played.
| League-wide Leaders: Three Point Percentage | ||||
| 2025-2026 Season Data as of April 05, 2026 at 04:57 PM |
||||
| Rank | Player | Team | Position | 3P% |
|---|---|---|---|---|
| 1 | Mark Williams | Phoenix Suns | C | 1.000 |
| 2 | Jaxson Hayes | Los Angeles Lakers | C | 1.000 |
| 3 | PJ Hall | Charlotte Hornets | C | 1.000 |
| 4 | Trayce Jackson-Davis | NA | C | 1.000 |
| 5 | Trayce Jackson-Davis | Golden State Warriors | C | 1.000 |
| 6 | Kyle Anderson | Utah Jazz | SF | 0.600 |
| 7 | PJ Hall | NA | C | 0.600 |
| 8 | David Jones García | San Antonio Spurs | SF | 0.600 |
| 9 | Malachi Smith | Brooklyn Nets | SG | 0.545 |
| 10 | Antonio Reeves | Charlotte Hornets | SG | 0.538 |
| Table Prepared by: Isaac H. Michaels, DrPH Data Source: www.basketball-reference.com |
||||
| Note: Data exclude players with fewer than 10 game appearances. | ||||
Graph and Table Prepared By: Isaac H. Michaels, DrPH
Data Source: www.basketball-reference.com
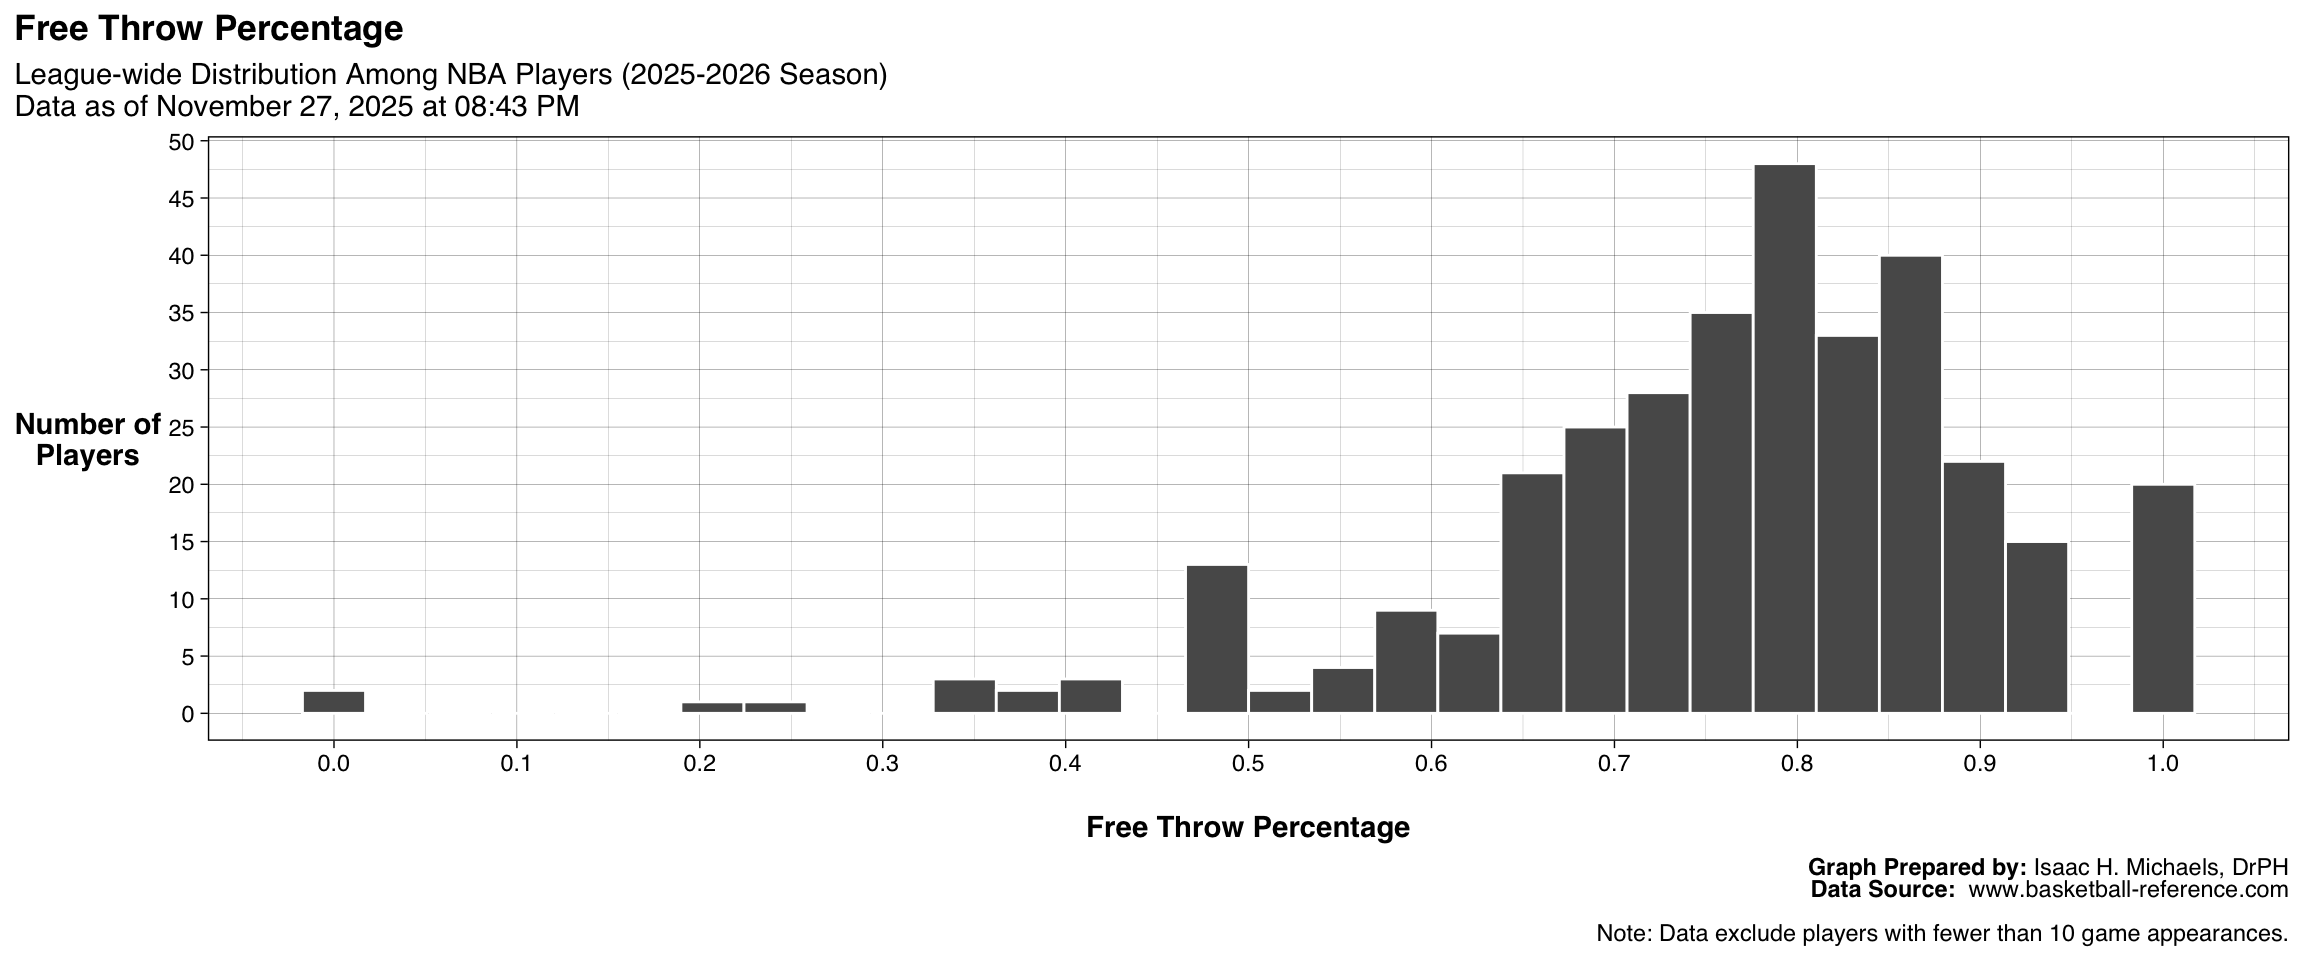
Free Throw Percentage
This figure shows the distribution of free throw percentage among all eligible NBA players during the current season. Each bar represents the number of players whose free throw accuracy falls within a given percentage range. The accompanying table lists the ten players with the highest free throw percentages. These outputs provide a league-wide view of efficiency at the foul line—an important indicator of scoring reliability in high-pressure situations. The figure and table refresh automatically as new data become available.
| League-wide Leaders: Free Throw Percentage | ||||
| 2025-2026 Season Data as of April 05, 2026 at 04:57 PM |
||||
| Rank | Player | Team | Position | FT% |
|---|---|---|---|---|
| 1 | Taurean Prince | Milwaukee Bucks | SF | 1 |
| 2 | Malachi Smith | Brooklyn Nets | SG | 1 |
| 3 | Ousmane Dieng | Oklahoma City Thunder | C | 1 |
| 4 | Jevon Carter | Chicago Bulls | PG | 1 |
| 5 | Doug McDermott | Sacramento Kings | SF | 1 |
| 6 | Gabe Vincent | Atlanta Hawks | PG | 1 |
| 7 | Miles Kelly | Dallas Mavericks | PG | 1 |
| 8 | Tyus Jones | Orlando Magic | PG | 1 |
| 9 | Christian Koloko | Atlanta Hawks | C | 1 |
| 10 | Kobe Bufkin | Los Angeles Lakers | SG | 1 |
| 11 | Caleb Houstan | Atlanta Hawks | SF | 1 |
| 12 | Luke Travers | Cleveland Cavaliers | SG | 1 |
| 13 | Jeff Green | Houston Rockets | PF | 1 |
| 14 | Jahmir Young | Miami Heat | PG | 1 |
| 15 | Pacôme Dadiet | New York Knicks | SG | 1 |
| 16 | Javonte Cooke | Portland Trail Blazers | SG | 1 |
| 17 | Joe Ingles | Minnesota Timberwolves | SF | 1 |
| 18 | Trey Jemison | New York Knicks | C | 1 |
| Table Prepared by: Isaac H. Michaels, DrPH Data Source: www.basketball-reference.com |
||||
| Note: Data exclude players with fewer than 10 game appearances. | ||||
Graph and Table Prepared By: Isaac H. Michaels, DrPH
Data Source: www.basketball-reference.com
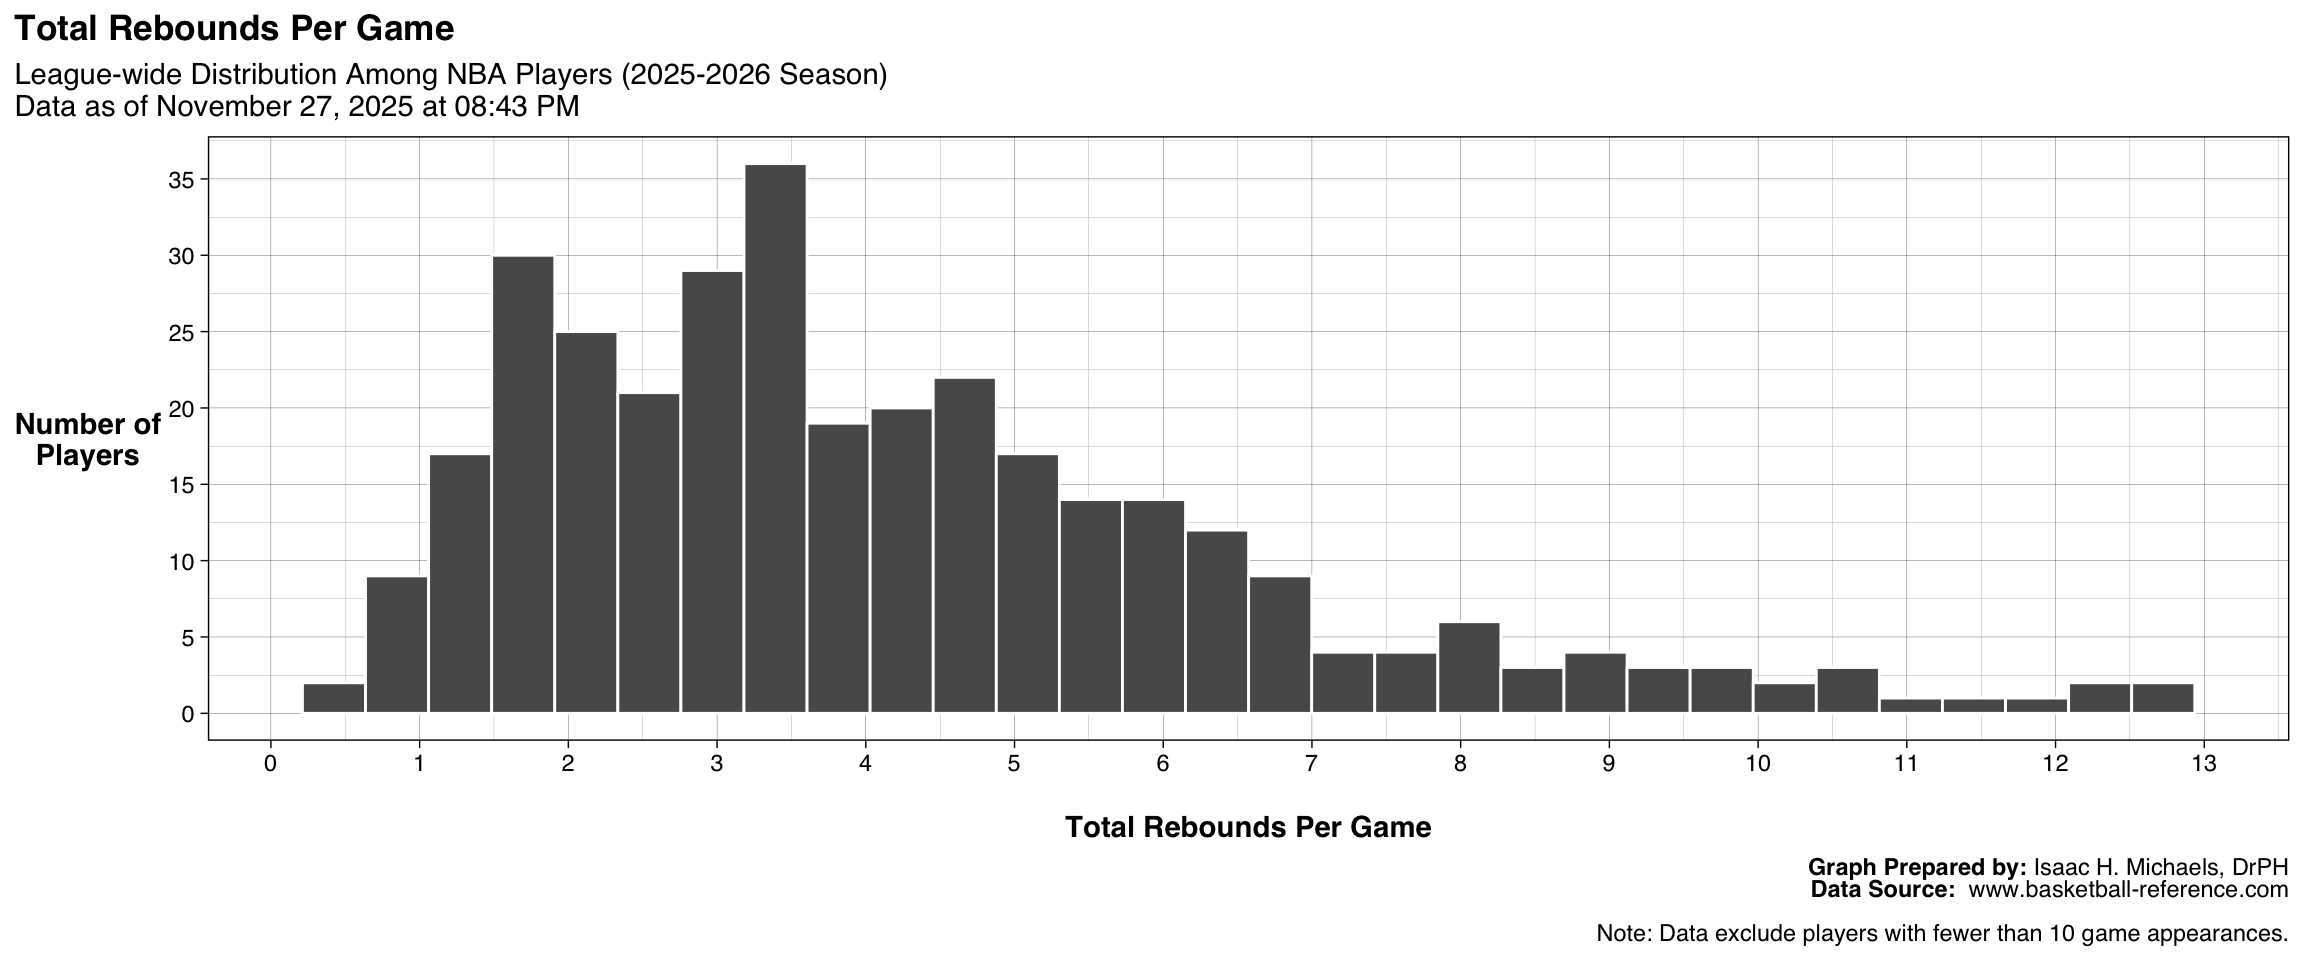
Total Rebounds Per Game
This figure displays the distribution of total rebounds per game among all eligible NBA players during the current season. Each bar represents the number of players whose average total rebounds fall within the corresponding range. The accompanying table lists the ten players with the highest rebounding averages. Together, these visuals highlight the variation in rebounding ability across the league and identify players who consistently secure possession on missed shots. The outputs refresh automatically as new data are added.
| League-wide Leaders: Total Rebounds Per Game | ||||
| 2025-2026 Season Data as of April 05, 2026 at 04:57 PM |
||||
| Rank | Player | Team | Position | TRB |
|---|---|---|---|---|
| 1 | Nikola Jokić | Denver Nuggets | C | 12.9 |
| 2 | Karl-Anthony Towns | New York Knicks | C | 11.9 |
| 3 | Victor Wembanyama | San Antonio Spurs | C | 11.6 |
| 4 | Donovan Clingan | Portland Trail Blazers | C | 11.6 |
| 5 | Rudy Gobert | Minnesota Timberwolves | C | 11.5 |
| 6 | Domantas Sabonis | Sacramento Kings | C | 11.4 |
| 7 | Anthony Davis | Dallas Mavericks | PF | 11.1 |
| 8 | Zach Edey | Memphis Grizzlies | C | 11.1 |
| 9 | Ivica Zubac | Los Angeles Clippers | C | 11.0 |
| 10 | Jalen Duren | Detroit Pistons | C | 10.6 |
| 11 | Ivica Zubac | NA | C | 10.6 |
| Table Prepared by: Isaac H. Michaels, DrPH Data Source: www.basketball-reference.com |
||||
| Note: Data exclude players with fewer than 10 game appearances. | ||||
Graph and Table Prepared By: Isaac H. Michaels, DrPH
Data Source: www.basketball-reference.com
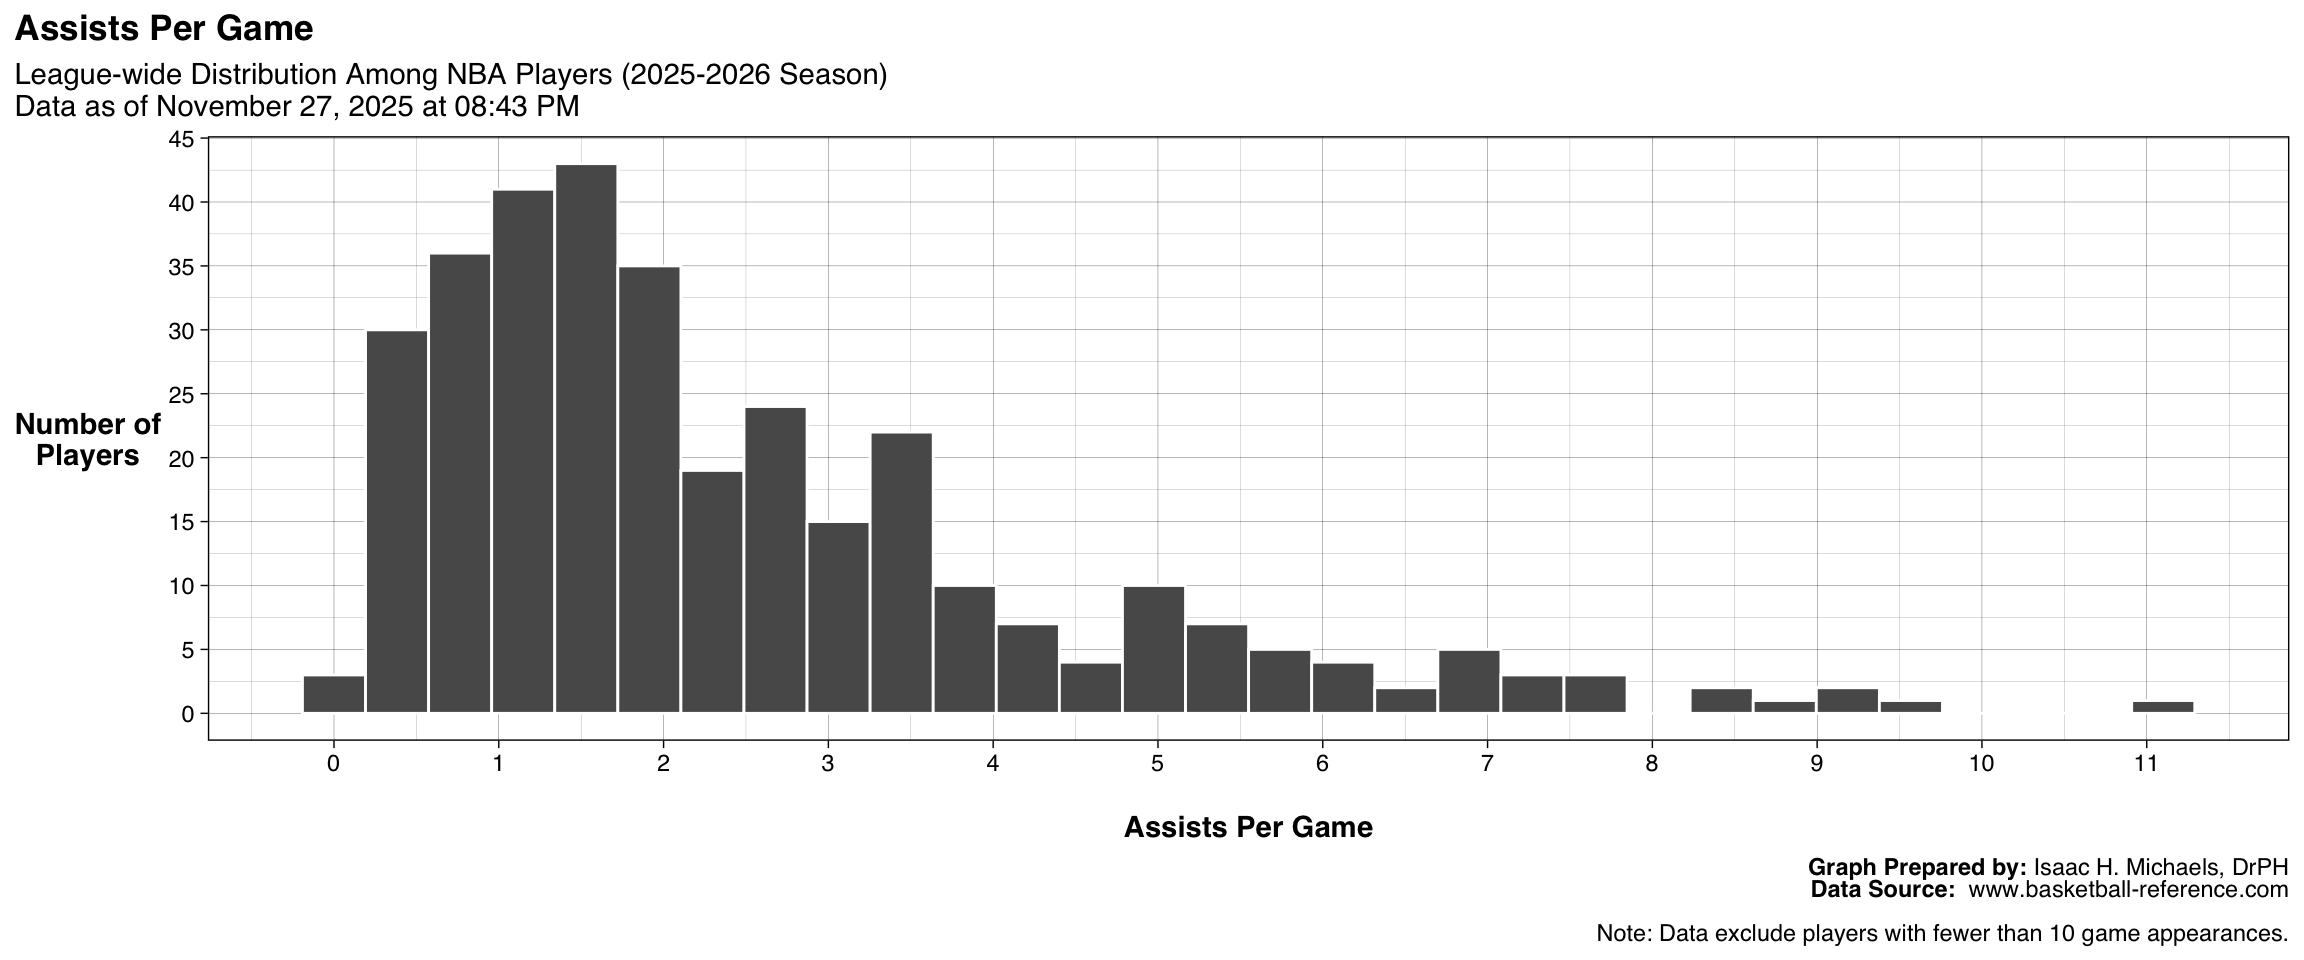
Assists Per Game
This figure presents the distribution of assists per game among all eligible NBA players during the current season. Each bar corresponds to the number of players averaging a given range of assists per game. The accompanying table lists the ten players who record the most assists on average. These outputs illustrate league-wide playmaking tendencies and highlight players who most effectively facilitate scoring opportunities for teammates. The figure and table update automatically as new games are recorded.
| League-wide Leaders: Assists Per Game | ||||
| 2025-2026 Season Data as of April 05, 2026 at 04:57 PM |
||||
| Rank | Player | Team | Position | AST |
|---|---|---|---|---|
| 1 | Nikola Jokić | Denver Nuggets | C | 10.9 |
| 2 | Cade Cunningham | Detroit Pistons | PG | 9.9 |
| 3 | Josh Giddey | Chicago Bulls | PG | 9.1 |
| 4 | Trae Young | Atlanta Hawks | PG | 8.9 |
| 5 | Luka Dončić | Los Angeles Lakers | PG | 8.3 |
| 6 | James Harden | NA | PG | 8.1 |
| 7 | James Harden | Los Angeles Clippers | PG | 8.1 |
| 8 | Ja Morant | Memphis Grizzlies | PG | 8.1 |
| 9 | James Harden | Cleveland Cavaliers | PG | 8.0 |
| 10 | Jalen Johnson | Atlanta Hawks | SF | 8.0 |
| 11 | Trae Young | NA | PG | 8.0 |
| Table Prepared by: Isaac H. Michaels, DrPH Data Source: www.basketball-reference.com |
||||
| Note: Data exclude players with fewer than 10 game appearances. | ||||
Graph and Table Prepared By: Isaac H. Michaels, DrPH
Data Source: www.basketball-reference.com
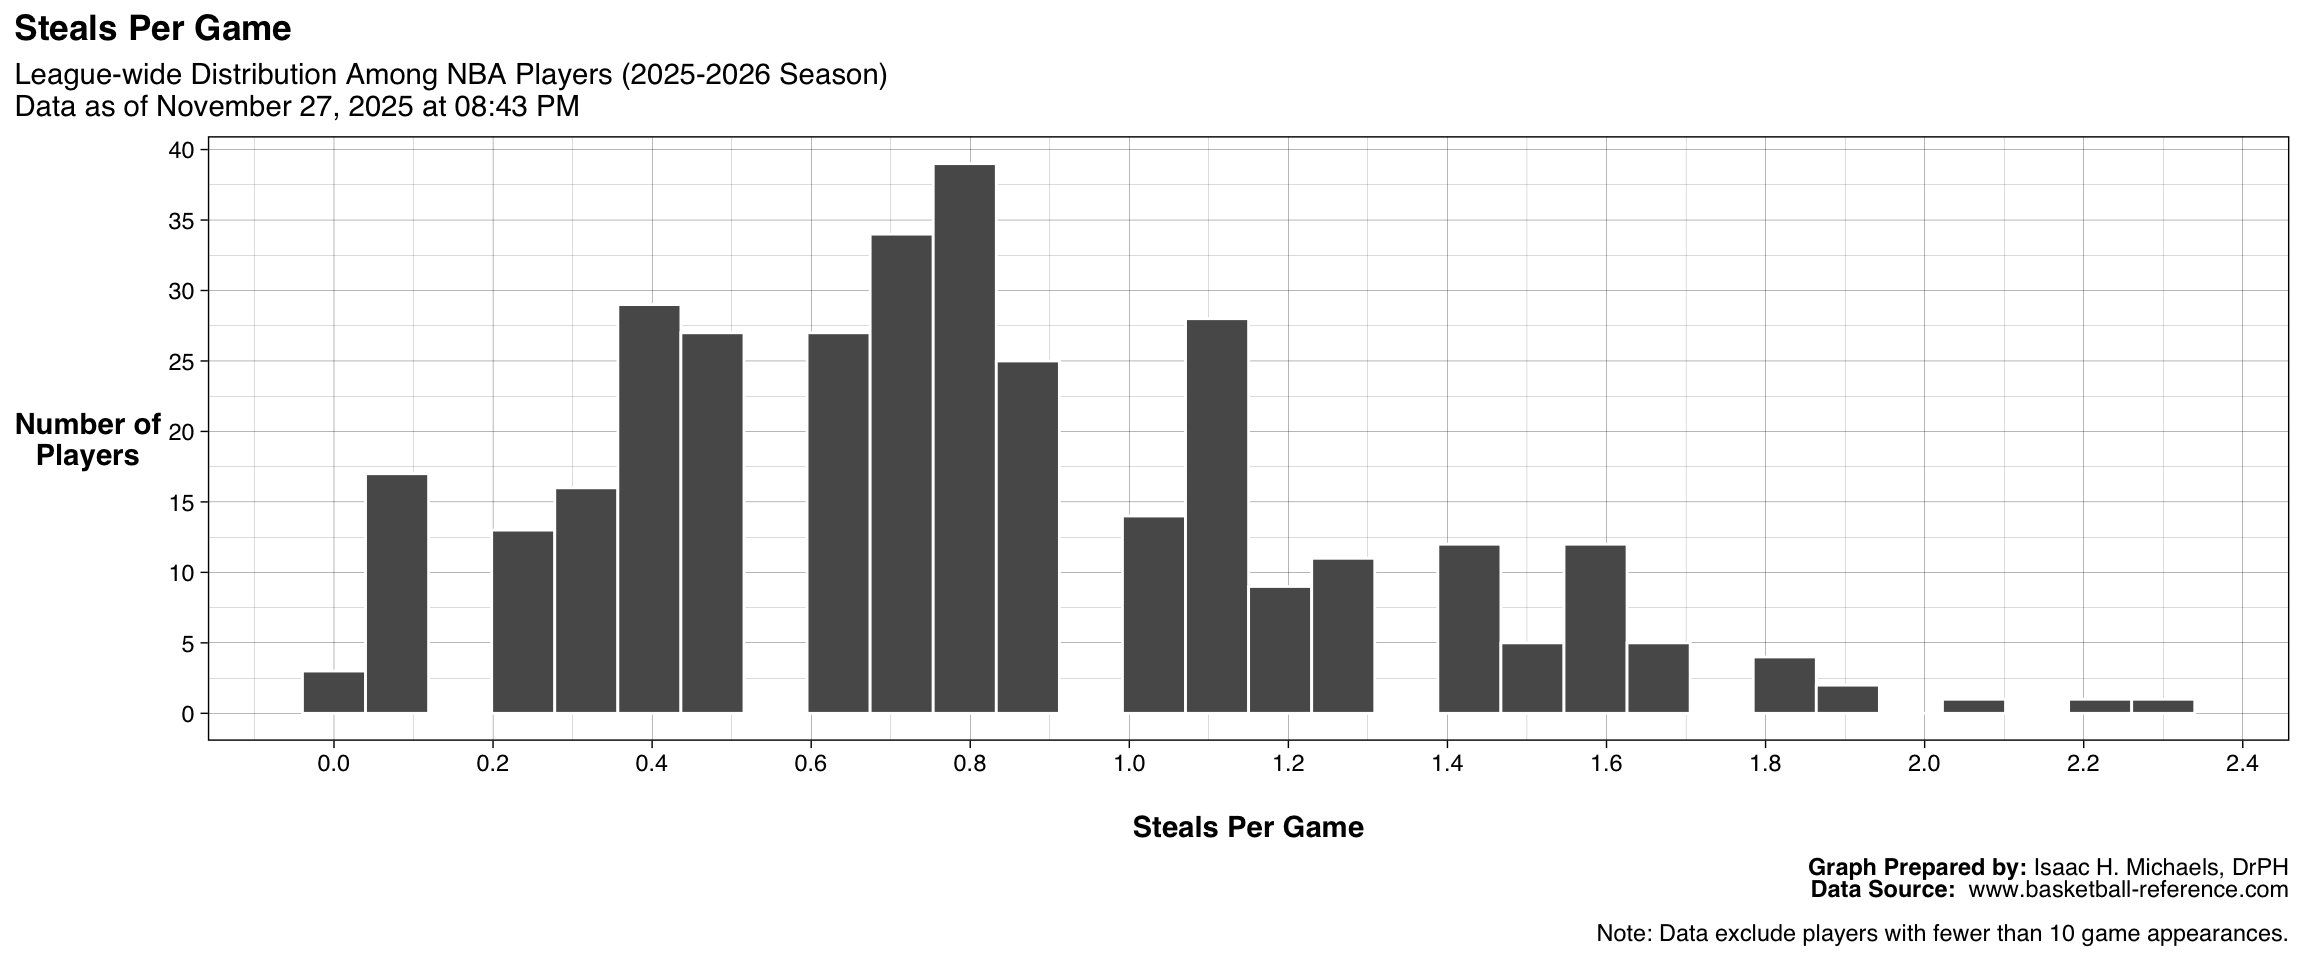
Steals Per Game
This figure shows the distribution of steals per game among all eligible NBA players during the current season. Each bar indicates how many players average a given number of steals per game. The accompanying table lists the ten players with the highest steal averages. Together, these outputs provide a snapshot of defensive activity across the league and spotlight players who most frequently disrupt opponents’ possessions. The displays refresh automatically as new game data become available.
| League-wide Leaders: Steals Per Game | ||||
| 2025-2026 Season Data as of April 05, 2026 at 04:57 PM |
||||
| Rank | Player | Team | Position | STL |
|---|---|---|---|---|
| 1 | Kevin Porter Jr. | Milwaukee Bucks | PG | 2.2 |
| 2 | Kawhi Leonard | Los Angeles Clippers | SF | 2.0 |
| 3 | Dyson Daniels | Atlanta Hawks | SG | 2.0 |
| 4 | Ausar Thompson | Detroit Pistons | SF | 2.0 |
| 5 | Cason Wallace | Oklahoma City Thunder | SG | 2.0 |
| 6 | Tyrese Maxey | Philadelphia 76ers | PG | 1.9 |
| 7 | Jalen Suggs | Orlando Magic | PG | 1.9 |
| 8 | Scotty Pippen Jr. | Memphis Grizzlies | PG | 1.9 |
| 9 | Matisse Thybulle | Portland Trail Blazers | SG | 1.9 |
| 10 | Paul George | Philadelphia 76ers | PF | 1.8 |
| 11 | Bez Mbeng | Utah Jazz | SG | 1.8 |
| Table Prepared by: Isaac H. Michaels, DrPH Data Source: www.basketball-reference.com |
||||
| Note: Data exclude players with fewer than 10 game appearances. | ||||
Graph and Table Prepared By: Isaac H. Michaels, DrPH
Data Source: www.basketball-reference.com
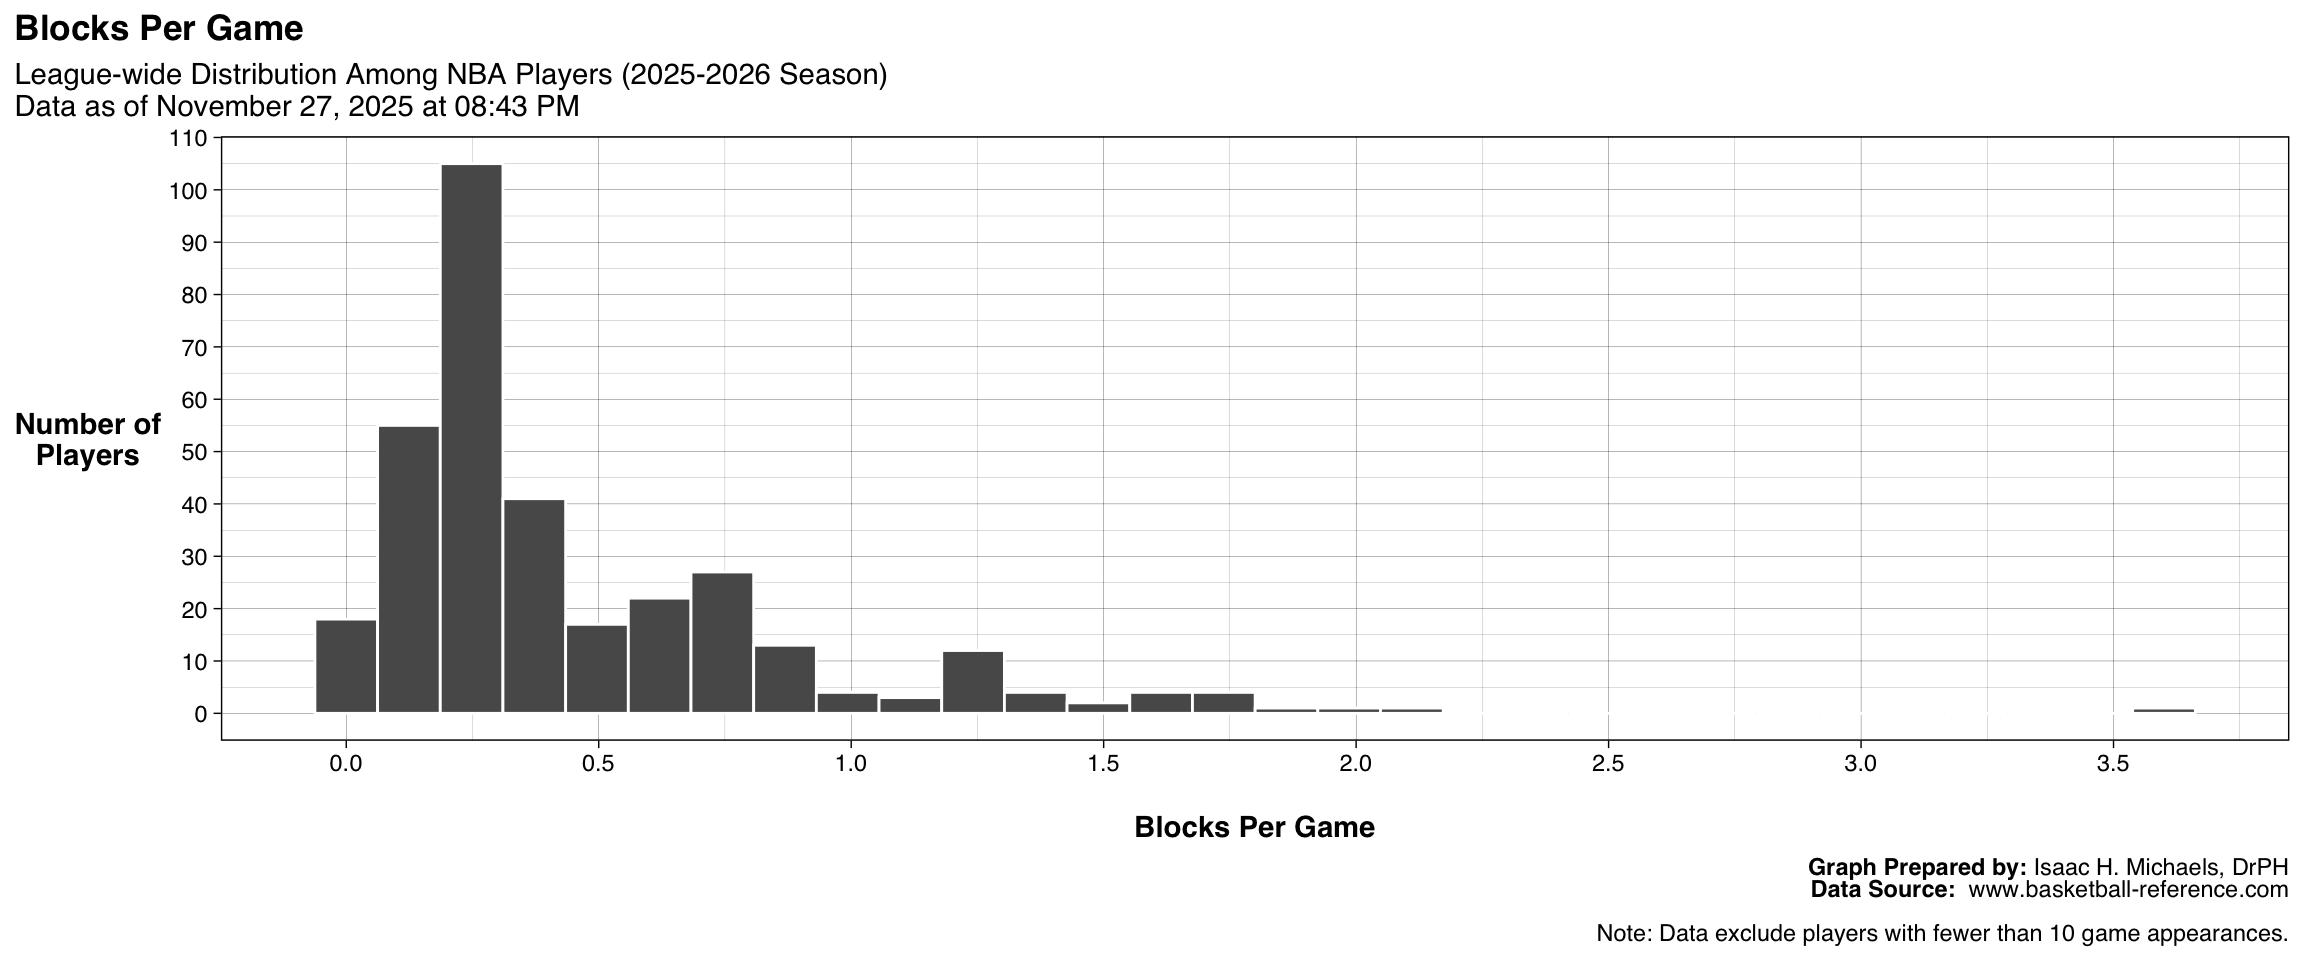
Blocks Per Game
This figure displays the distribution of blocks per game among all eligible NBA players during the current season. Each bar represents the number of players whose average shot-blocking totals fall within the corresponding range. The accompanying table lists the ten players with the highest block averages. Together, these visuals show league-wide patterns in rim protection and highlight players who most effectively deter opponents’ shots near the basket. The figure and table update automatically as new data are incorporated.
| League-wide Leaders: Blocks Per Game | ||||
| 2025-2026 Season Data as of April 05, 2026 at 04:57 PM |
||||
| Rank | Player | Team | Position | BLK |
|---|---|---|---|---|
| 1 | Victor Wembanyama | San Antonio Spurs | C | 3.1 |
| 2 | Alex Sarr | Washington Wizards | C | 2.0 |
| 3 | Zach Edey | Memphis Grizzlies | C | 1.9 |
| 4 | Evan Mobley | Cleveland Cavaliers | PF | 1.8 |
| 5 | Chet Holmgren | Oklahoma City Thunder | PF | 1.8 |
| 6 | Jay Huff | Indiana Pacers | C | 1.8 |
| 7 | Anthony Davis | Dallas Mavericks | PF | 1.7 |
| 8 | Donovan Clingan | Portland Trail Blazers | C | 1.7 |
| 9 | Keegan Murray | Sacramento Kings | PF | 1.6 |
| 10 | Myles Turner | Milwaukee Bucks | C | 1.6 |
| 11 | Rudy Gobert | Minnesota Timberwolves | C | 1.6 |
| 12 | Isaiah Stewart | Detroit Pistons | C | 1.6 |
| Table Prepared by: Isaac H. Michaels, DrPH Data Source: www.basketball-reference.com |
||||
| Note: Data exclude players with fewer than 10 game appearances. | ||||
Graph and Table Prepared By: Isaac H. Michaels, DrPH
Data Source: www.basketball-reference.com
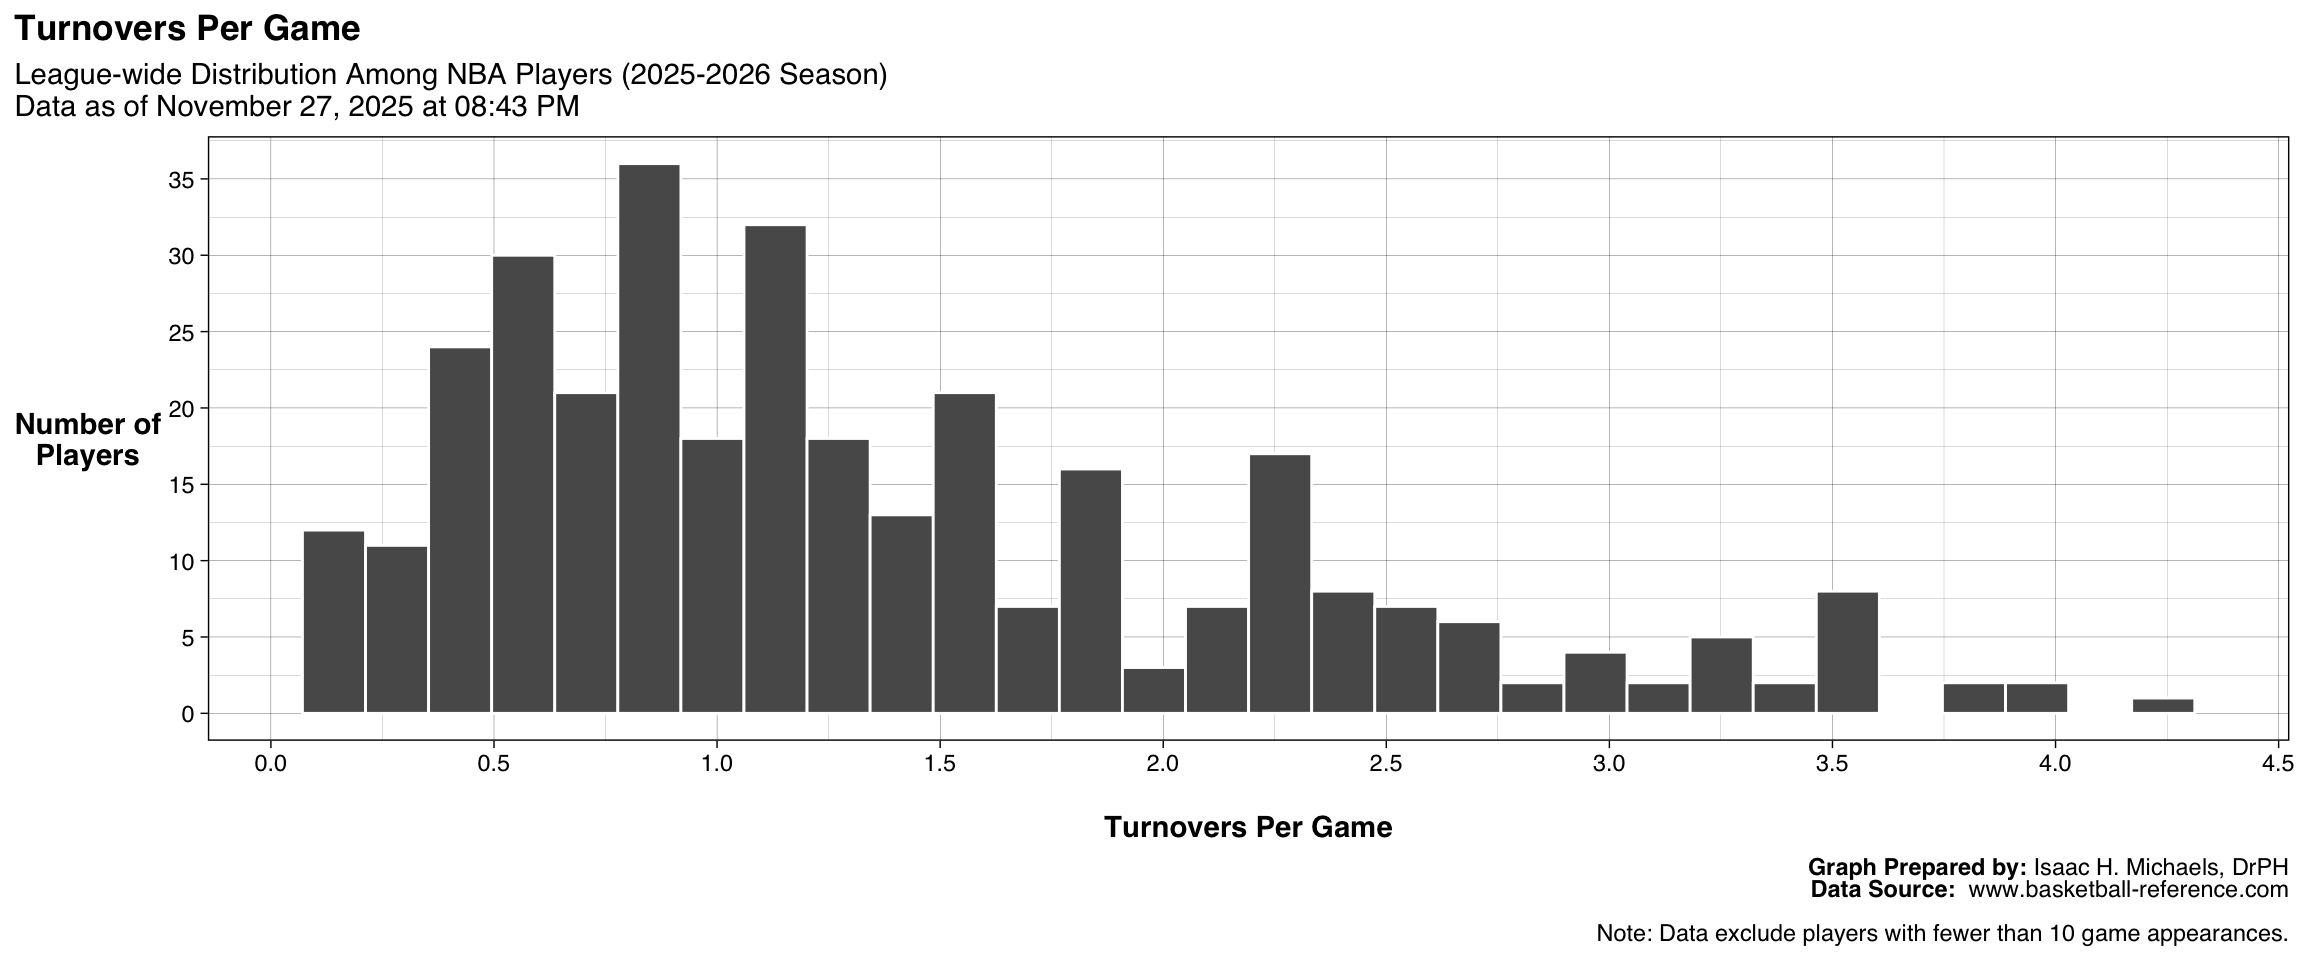
Turnovers Per Game
This figure presents the distribution of turnovers per game among all eligible NBA players during the current season. Each bar represents the number of players who commit turnovers within a given per-game range. The accompanying table lists the ten players with the highest turnover averages. These outputs provide a league-wide view of ball security, highlighting how frequently players lose possession and how turnover tendencies vary by role or playing style. The displays refresh automatically as new games are played.
| League-wide Leaders: Turnovers Per Game | ||||
| 2025-2026 Season Data as of April 05, 2026 at 04:57 PM |
||||
| Rank | Player | Team | Position | TOV |
|---|---|---|---|---|
| 1 | Luka Dončić | Los Angeles Lakers | PG | 4.0 |
| 2 | Nikola Jokić | Denver Nuggets | C | 3.8 |
| 3 | Deni Avdija | Portland Trail Blazers | SF | 3.8 |
| 4 | Cade Cunningham | Detroit Pistons | PG | 3.7 |
| 5 | James Harden | Los Angeles Clippers | PG | 3.7 |
| 6 | Jaylen Brown | Boston Celtics | SF | 3.6 |
| 7 | Ja Morant | Memphis Grizzlies | PG | 3.6 |
| 8 | Josh Giddey | Chicago Bulls | PG | 3.6 |
| 9 | James Harden | NA | PG | 3.5 |
| 10 | Jalen Johnson | Atlanta Hawks | SF | 3.4 |
| 11 | Dejounte Murray | New Orleans Pelicans | PG | 3.4 |
| Table Prepared by: Isaac H. Michaels, DrPH Data Source: www.basketball-reference.com |
||||
| Note: Data exclude players with fewer than 10 game appearances. | ||||
Graph and Table Prepared By: Isaac H. Michaels, DrPH
Data Source: www.basketball-reference.com
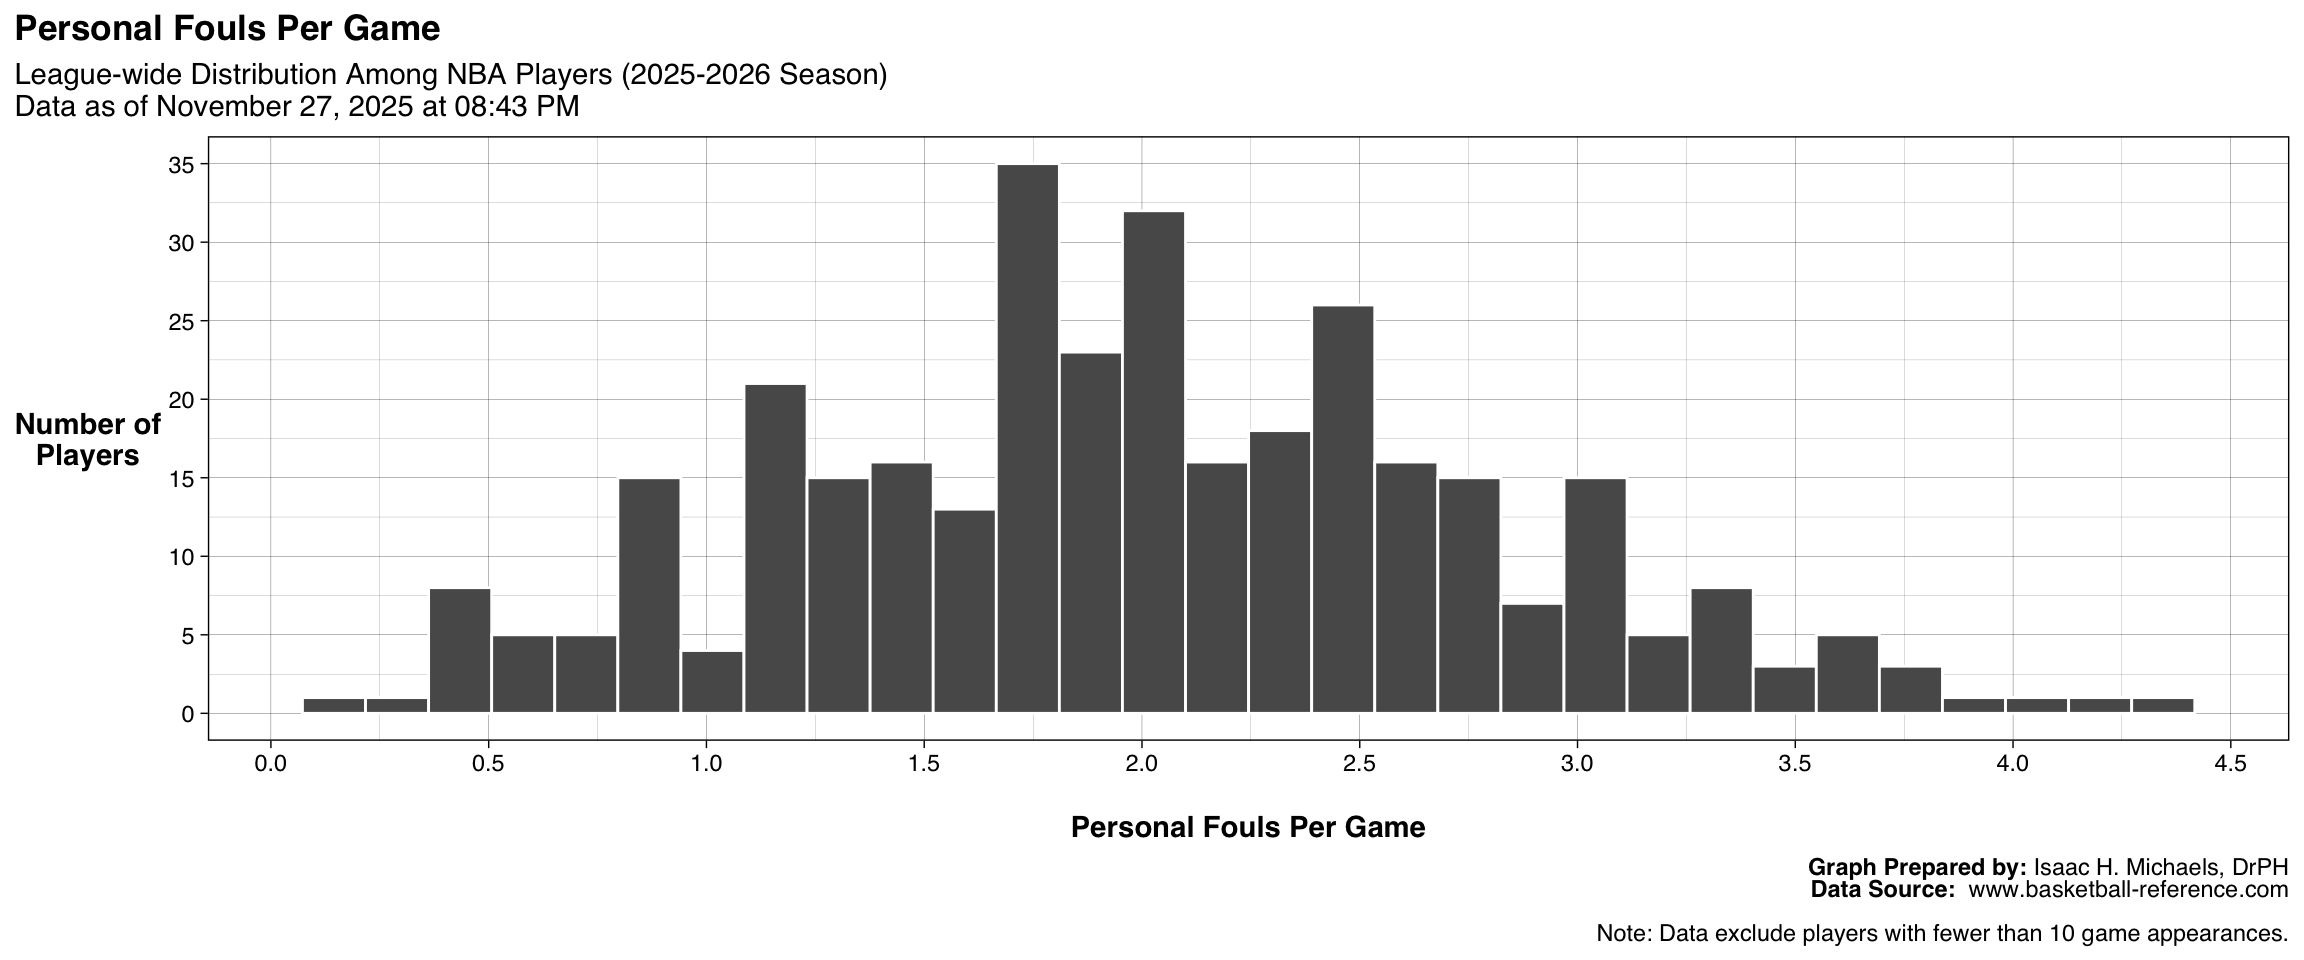
Personal Fouls Per Game
This figure shows the distribution of personal fouls per game among all eligible NBA players during the current season. Each bar indicates the number of players whose average foul rate falls within the corresponding range. The accompanying table lists the ten players with the highest averages of personal fouls per game. Together, these visuals depict how frequently players commit fouls across the league and provide insight into defensive aggressiveness and discipline. The outputs update automatically as new data are recorded.
| League-wide Leaders: Personal Fouls Per Game | ||||
| 2025-2026 Season Data as of April 05, 2026 at 04:57 PM |
||||
| Rank | Player | Team | Position | PF |
|---|---|---|---|---|
| 1 | Rayan Rupert | Memphis Grizzlies | SG | 4.1 |
| 2 | Jaren Jackson Jr. | Memphis Grizzlies | C | 3.8 |
| 3 | Jaren Jackson Jr. | NA | C | 3.7 |
| 4 | Domantas Sabonis | Sacramento Kings | C | 3.5 |
| 5 | Kyshawn George | Washington Wizards | SF | 3.5 |
| 6 | Dylan Cardwell | Sacramento Kings | C | 3.5 |
| 7 | Karl-Anthony Towns | New York Knicks | C | 3.4 |
| 8 | Onyeka Okongwu | Atlanta Hawks | C | 3.4 |
| 9 | Jaden McDaniels | Minnesota Timberwolves | PF | 3.4 |
| 10 | Zach Edey | Memphis Grizzlies | C | 3.4 |
| 11 | Wendell Carter Jr. | Orlando Magic | C | 3.4 |
| 12 | Bez Mbeng | Utah Jazz | SG | 3.4 |
| Table Prepared by: Isaac H. Michaels, DrPH Data Source: www.basketball-reference.com |
||||
| Note: Data exclude players with fewer than 10 game appearances. | ||||
Graph and Table Prepared By: Isaac H. Michaels, DrPH
Data Source: www.basketball-reference.com
This executive summary was generated by an AI summarizer agent and reviewed by an editor agent. I review any summaries flagged for revision.↩︎