Published: May 1, 2020
Updated: July 22, 2024 at 07:27PM
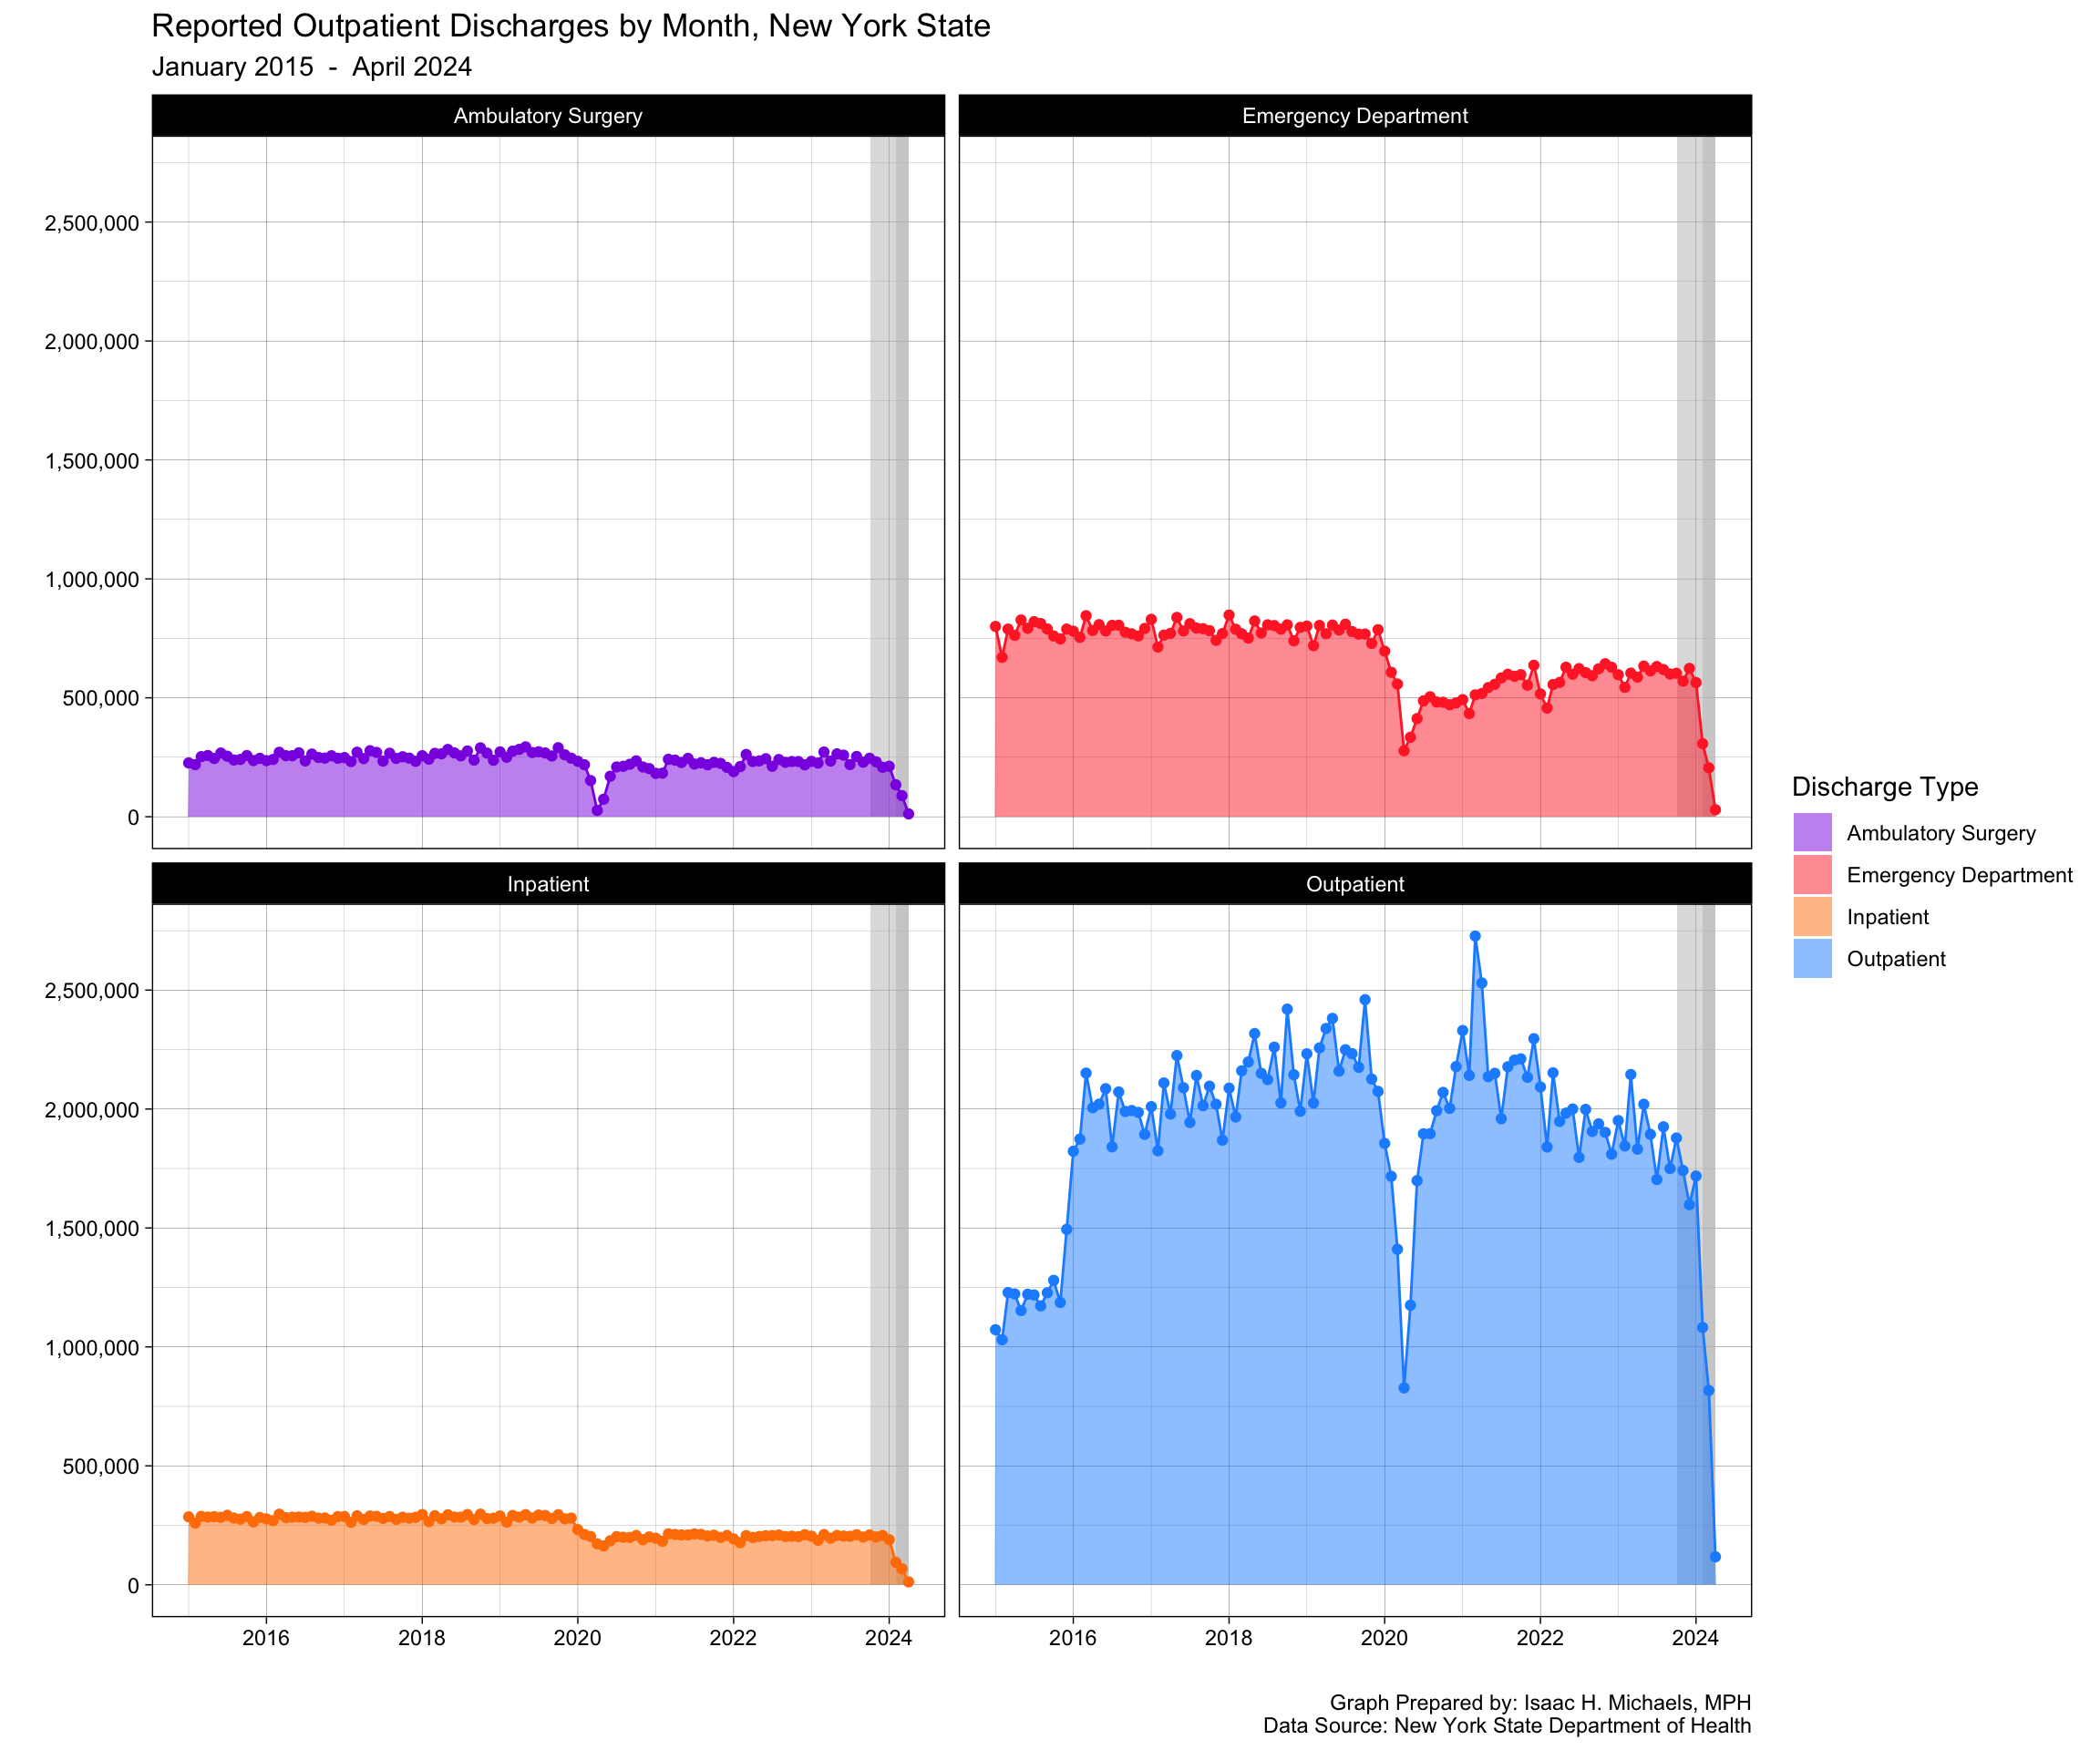
Statewide Summary
Graphs Prepared By: Isaac H. Michaels, MPH
Data Source: New York State Department of Health
Inpatient Discharges

Graphs Prepared By: Isaac H. Michaels, MPH
Data Source: New York State Department of Health
Outpatient Discharges

Graphs Prepared By: Isaac H. Michaels, MPH
Data Source: New York State Department of Health
Emergency Department Discharges

Graphs Prepared By: Isaac H. Michaels, MPH
Data Source: New York State Department of Health
Ambulatory Surgery Discharges

Graphs Prepared By: Isaac H. Michaels, MPH
Data Source: New York State Department of Health
Data Table
Annual Discharges
| County | Facility | year | Ambulatory Surgery | Emergency Department | Inpatient | Outpatient |
|---|---|---|---|---|---|---|
| Albany | Albany Medical Center - South Clinical Campus | 2024 | 1,427 | NA | 1 | 13,130 |
| 2023 | 8,397 | NA | 3 | 78,948 | ||
| 2022 | 7,758 | NA | 2 | 77,146 | ||
| 2021 | 7,001 | 2 | 6 | 77,038 | ||
| 2020 | 6,641 | 2 | 5 | 71,792 | ||
| 2019 | 8,674 | 1 | 7 | 72,369 | ||
| 2018 | 9,024 | 2 | 5 | 23,300 | ||
| 2017 | 9,634 | 2 | 10 | 23,457 | ||
| 2016 | 10,217 | NA | 8 | 22,752 | ||
| 2015 | 9,715 | NA | NA | 14,421 | ||
| Albany Medical Center Hospital | 2024 | 3,939 | 9,016 | 6,098 | 38,138 | |
| 2023 | 25,010 | 54,564 | 36,299 | 212,447 | ||
| 2022 | 22,200 | 55,391 | 34,520 | 163,523 | ||
| 2021 | 21,863 | 52,876 | 36,610 | 169,321 | ||
| 2020 | 22,323 | 46,933 | 37,365 | 158,181 | ||
| 2019 | 23,223 | 61,266 | 40,258 | 159,164 | ||
| 2018 | 21,882 | 56,340 | 40,908 | 223,443 | ||
| 2017 | 21,946 | 52,705 | 41,346 | 107,777 | ||
| 2016 | 22,158 | 52,843 | 39,013 | 114,250 | ||
| 2015 | 21,258 | 54,580 | 36,342 | 122,437 | ||
| Albany Regional Eye Surgery Center | 2024 | 4,386 | NA | NA | NA | |
| 2023 | 13,369 | NA | NA | NA | ||
| 2022 | 12,832 | NA | NA | NA | ||
| 2021 | 9,464 | NA | NA | NA | ||
| 2020 | 10,035 | NA | NA | NA | ||
| 2019 | 12,933 | NA | NA | NA | ||
| 2018 | 13,824 | NA | NA | NA | ||
| 2017 | 13,401 | NA | NA | NA | ||
| 2016 | 11,663 | NA | NA | NA | ||
| 2015 | 10,558 | NA | NA | NA | ||
| Capital Region Ambulatory Surgery Center | 2024 | 5,014 | NA | NA | NA | |
| 2023 | 9,665 | NA | NA | NA | ||
| 2022 | 9,498 | NA | NA | NA | ||
| 2021 | 9,781 | NA | NA | NA | ||
| 2020 | 8,796 | NA | NA | NA | ||
| 2019 | 9,792 | NA | NA | NA | ||
| 2018 | 9,444 | NA | NA | NA | ||
| 2017 | 9,122 | NA | NA | NA | ||
| 2016 | 8,884 | NA | NA | NA | ||
| 2015 | 9,196 | NA | NA | NA | ||
| Everett Road Surgery Center | 2024 | 1,086 | NA | NA | NA | |
| 2023 | 2,688 | NA | NA | NA | ||
| 2022 | 2,690 | NA | NA | NA | ||
| 2021 | 612 | NA | NA | NA | ||
| New England Laser & Cosmetic Surgery Center | 2024 | 156 | NA | NA | NA | |
| 2023 | 551 | NA | NA | NA | ||
| 2022 | 138 | NA | NA | NA | ||
| 2021 | 78 | NA | NA | NA | ||
| 2020 | 316 | NA | NA | NA | ||
| 2019 | 263 | NA | NA | NA | ||
| 2018 | 352 | NA | NA | NA | ||
| 2017 | 621 | NA | NA | NA | ||
| 2016 | 766 | NA | NA | NA | ||
| 2015 | 787 | NA | NA | NA | ||
| OrthoNY Ambulatory Surgery Center - Albany | 2024 | 1,575 | NA | NA | NA | |
| 2023 | 3,982 | NA | NA | NA | ||
| 2022 | 4,317 | NA | NA | NA | ||
| 2021 | 4,372 | NA | NA | 1 | ||
| 2020 | 3,935 | NA | NA | NA | ||
| 2019 | 4,828 | NA | NA | 1 | ||
| 2018 | 4,772 | NA | NA | 1 | ||
| 2017 | 4,717 | NA | NA | NA | ||
| 2016 | 4,732 | NA | NA | NA | ||
| 2015 | 4,755 | NA | NA | NA | ||
| Samaritan Hospital - Albany Memorial Campus | 2024 | 0 | 36,126 | 0 | 36,584 | |
| 2023 | 0 | 75,704 | 0 | 107,978 | ||
| 2022 | 0 | 66,282 | 0 | 154,960 | ||
| 2021 | 0 | 54,274 | 0 | 137,884 | ||
| 2020 | 2,090 | 48,834 | 268 | 104,596 | ||
| 2019 | 21,436 | 138,136 | 4,480 | 222,608 | ||
| 2018 | 24,640 | 147,736 | 8,468 | 216,192 | ||
| 2017 | 25,420 | 158,008 | 9,972 | 210,756 | ||
| 2016 | 26,836 | 157,144 | 10,152 | 228,336 | ||
| 2015 | 27,216 | 154,424 | 11,608 | 172,900 | ||
| Specialty Eye Surgery and Laser Center of the Capital Region | 2024 | 2,281 | NA | NA | NA | |
| 2023 | 4,564 | NA | NA | NA | ||
| 2022 | 3,968 | NA | NA | NA | ||
| 2021 | 3,556 | NA | NA | NA | ||
| 2020 | 2,479 | NA | NA | NA | ||
| 2019 | 2,198 | NA | NA | NA | ||
| 2018 | 407 | NA | NA | NA | ||
| St. Peter’s Addiction Recovery Center | 2024 | NA | NA | 476 | NA | |
| 2023 | NA | NA | 1,004 | NA | ||
| 2022 | NA | NA | 978 | NA | ||
| 2021 | NA | NA | 838 | NA | ||
| 2020 | NA | NA | 1,160 | NA | ||
| 2019 | NA | NA | 2,364 | NA | ||
| 2018 | NA | NA | 2,368 | NA | ||
| 2017 | NA | NA | 2,384 | NA | ||
| 2016 | NA | NA | 1,988 | NA | ||
| 2015 | NA | NA | 2,132 | NA | ||
| St. Peter’s Hospital | 2024 | 12,122 | 24,752 | 21,834 | 126,406 | |
| 2023 | 38,392 | 62,108 | 43,852 | 296,192 | ||
| 2022 | 33,506 | 66,544 | 46,880 | 298,308 | ||
| 2021 | 32,608 | 63,220 | 52,004 | 418,804 | ||
| 2020 | 29,600 | 58,748 | 52,686 | 539,300 | ||
| 2019 | 60,644 | 146,472 | 113,116 | 1,226,936 | ||
| 2018 | 58,240 | 140,048 | 110,048 | 1,215,332 | ||
| 2017 | 52,236 | 144,736 | 114,192 | 1,201,620 | ||
| 2016 | 54,260 | 153,556 | 111,112 | 1,304,436 | ||
| 2015 | 51,412 | 156,520 | 103,980 | 387,760 | ||
| St. Peter’s Surgery And Endoscopy Center | 2024 | 7,404 | NA | NA | NA | |
| 2023 | 19,280 | NA | NA | NA | ||
| 2022 | 19,792 | NA | NA | NA | ||
| 2021 | 18,750 | NA | NA | NA | ||
| 2020 | 16,890 | NA | NA | NA | ||
| 2019 | 19,410 | NA | NA | NA | ||
| 2018 | 18,121 | NA | NA | NA | ||
| 2017 | 17,837 | NA | NA | NA | ||
| 2016 | 18,477 | NA | NA | NA | ||
| 2015 | 16,030 | NA | NA | NA | ||
| Allegany | Cuba Memorial Hospital Inc | 2024 | NA | 3,853 | 25 | 470 |
| 2023 | NA | 10,217 | 70 | 1,207 | ||
| 2022 | NA | 8,987 | 2 | 1,380 | ||
| 2021 | NA | 6,133 | 5 | 1,404 | ||
| 2020 | NA | 5,484 | 11 | 1,198 | ||
| 2019 | NA | 8,710 | 25 | 1,215 | ||
| 2018 | NA | 8,639 | 32 | 1,153 | ||
| 2017 | NA | 7,188 | 21 | 2,439 | ||
| 2016 | NA | 8,421 | 35 | 5,736 | ||
| 2015 | NA | 8,463 | 64 | 5,631 | ||
| Livingston Health Services | 2024 | 1,946 | NA | NA | 6,319 | |
| 2023 | 3,559 | NA | NA | 13,374 | ||
| 2022 | 3,103 | NA | NA | 14,039 | ||
| 2021 | 2,465 | 7 | NA | 31,580 | ||
| 2020 | 2,050 | 5 | NA | 25,460 | ||
| 2019 | 2,385 | 5 | NA | 24,238 | ||
| 2018 | 2,549 | 4 | NA | 22,707 | ||
| 2017 | 2,687 | 3 | NA | 23,449 | ||
| 2016 | 2,620 | NA | NA | 24,393 | ||
| 2015 | 2,503 | 13 | NA | 7,622 | ||
| Memorial Hosp of Wm F & Gertrude F Jones A/K/A Jones Memorial Hosp | 2024 | 1,542 | 7,052 | 976 | 19,093 | |
| 2023 | 2,884 | 12,444 | 1,882 | 41,335 | ||
| 2022 | 2,537 | 11,140 | 1,913 | 49,578 | ||
| 2021 | 2,231 | 9,286 | 2,038 | 56,543 | ||
| 2020 | 1,899 | 8,386 | 1,955 | 50,861 | ||
| 2019 | 2,270 | 10,422 | 1,909 | 53,018 | ||
| 2018 | 2,479 | 10,589 | 2,124 | 42,812 | ||
| 2017 | 2,552 | 11,545 | 2,082 | 39,968 | ||
| 2016 | 2,646 | 11,594 | 1,967 | 42,234 | ||
| 2015 | 2,645 | 11,240 | 2,053 | 26,850 | ||
| Bronx | Advanced Endoscopy Center | 2024 | 3,535 | NA | NA | NA |
| 2023 | 11,361 | NA | NA | NA | ||
| 2022 | 10,359 | NA | NA | NA | ||
| 2021 | 10,466 | NA | NA | NA | ||
| 2020 | 7,686 | NA | NA | NA | ||
| 2019 | 11,310 | NA | NA | NA | ||
| 2018 | 11,008 | NA | NA | NA | ||
| 2017 | 10,885 | NA | NA | NA | ||
| 2016 | 12,157 | NA | NA | NA | ||
| 2015 | 10,850 | NA | NA | NA | ||
| Ambulatory Surgery Center of Greater New York | 2024 | 0 | NA | NA | NA | |
| 2023 | 4,761 | NA | NA | NA | ||
| 2022 | 8,394 | NA | NA | NA | ||
| 2021 | 7,887 | NA | NA | NA | ||
| 2020 | 4,939 | NA | NA | NA | ||
| 2019 | 8,836 | NA | NA | NA | ||
| 2018 | 8,905 | NA | NA | NA | ||
| 2017 | 8,880 | NA | NA | NA | ||
| 2016 | 9,450 | NA | NA | NA | ||
| 2015 | 10,503 | NA | NA | NA | ||
| Avicenna ASC | 2024 | 0 | NA | NA | NA | |
| 2023 | 1,671 | NA | NA | NA | ||
| 2022 | 3,072 | NA | NA | NA | ||
| 2021 | 4,407 | NA | NA | NA | ||
| 2020 | 4,516 | NA | NA | NA | ||
| 2019 | 6,200 | NA | NA | NA | ||
| 2018 | 5,249 | NA | NA | NA | ||
| 2017 | 4,166 | NA | NA | NA | ||
| 2016 | 2,180 | NA | NA | NA | ||
| BronxCare Hospital Center | 2024 | 4,876 | 38,990 | 10,286 | 103,676 | |
| 2023 | 12,467 | 94,662 | 24,446 | 268,536 | ||
| 2022 | 11,696 | 97,821 | 25,498 | 291,252 | ||
| 2021 | 10,657 | 93,538 | 25,705 | 289,475 | ||
| 2020 | 8,042 | 88,487 | 24,448 | 252,813 | ||
| 2019 | 11,180 | 103,014 | 28,888 | 314,854 | ||
| 2018 | 10,123 | 105,864 | 29,680 | 308,952 | ||
| 2017 | 10,742 | 93,644 | 28,163 | 273,925 | ||
| 2016 | 11,444 | 96,936 | 29,774 | 259,722 | ||
| 2015 | 11,023 | 96,158 | 32,107 | 298,760 | ||
| Calvary Hospital Inc | 2024 | NA | NA | 1,172 | 0 | |
| 2023 | NA | NA | 2,063 | 0 | ||
| 2022 | NA | NA | 1,980 | 2 | ||
| 2021 | NA | NA | 2,667 | 7 | ||
| 2020 | NA | NA | 2,704 | 6 | ||
| 2019 | NA | NA | 2,913 | 20 | ||
| 2018 | NA | NA | 2,827 | 16 | ||
| 2017 | NA | NA | 2,619 | 5 | ||
| 2016 | NA | NA | 2,847 | 636 | ||
| 2015 | NA | NA | 2,989 | 5,079 | ||
| Downtown Bronx ASC | 2024 | 0 | NA | NA | NA | |
| 2023 | 1,916 | NA | NA | NA | ||
| 2022 | 1,759 | NA | NA | NA | ||
| 2021 | 1,714 | NA | NA | NA | ||
| 2020 | 1,102 | NA | NA | NA | ||
| 2019 | 3,486 | NA | NA | NA | ||
| 2018 | 2,076 | NA | NA | NA | ||
| 2017 | 312 | NA | NA | NA | ||
| East Tremont Medical Center | 2024 | 0 | NA | NA | NA | |
| 2023 | 0 | NA | NA | NA | ||
| 2022 | 0 | NA | NA | NA | ||
| 2021 | 0 | NA | NA | NA | ||
| 2017 | 2,544 | NA | NA | NA | ||
| 2016 | 2,707 | NA | NA | NA | ||
| 2015 | 4,034 | NA | NA | NA | ||
| Empire State Ambulatory Surgery Center | 2024 | 3,350 | NA | NA | 3 | |
| 2023 | 8,178 | NA | NA | 12 | ||
| 2022 | 7,333 | NA | NA | 29 | ||
| 2021 | 7,868 | NA | NA | 1 | ||
| 2020 | 5,062 | NA | NA | 2 | ||
| 2019 | 5,633 | NA | NA | NA | ||
| 2018 | 3,827 | NA | NA | NA | ||
| 2017 | 3,993 | NA | NA | NA | ||
| 2016 | 3,748 | NA | NA | NA | ||
| 2015 | 801 | NA | NA | NA | ||
| Eye Surgery Center of New York | 2024 | 1,902 | NA | NA | NA | |
| 2023 | 3,443 | NA | NA | NA | ||
| 2022 | 3,333 | NA | NA | NA | ||
| 2021 | 2,713 | NA | NA | NA | ||
| 2020 | 2,202 | NA | NA | 15 | ||
| 2019 | 3,979 | NA | NA | NA | ||
| 2018 | 3,647 | NA | NA | NA | ||
| 2017 | 3,236 | NA | NA | NA | ||
| 2016 | 2,509 | NA | NA | NA | ||
| 2015 | 122 | NA | NA | NA | ||
| Jacobi Medical Center | 2024 | 3,072 | 43,366 | 9,036 | 141,359 | |
| 2023 | 7,461 | 93,366 | 20,301 | 303,229 | ||
| 2022 | 6,716 | 89,006 | 20,222 | 342,179 | ||
| 2021 | 6,600 | 80,653 | 20,076 | 495,964 | ||
| 2020 | 4,916 | 64,401 | 17,880 | 279,480 | ||
| 2019 | 7,100 | 85,773 | 18,566 | 270,250 | ||
| 2018 | 6,476 | 83,495 | 19,688 | 293,030 | ||
| 2017 | 7,194 | 73,422 | 19,536 | 303,289 | ||
| 2016 | 7,006 | 80,217 | 18,973 | 304,821 | ||
| 2015 | 7,445 | 78,609 | 19,232 | 275,872 | ||
| Lincoln Medical & Mental Health Center | 2024 | 3,266 | 55,627 | 8,132 | 186,325 | |
| 2023 | 7,897 | 121,397 | 17,483 | 403,009 | ||
| 2022 | 7,350 | 121,589 | 18,587 | 458,109 | ||
| 2021 | 7,538 | 107,257 | 18,119 | 517,210 | ||
| 2020 | 5,255 | 95,274 | 17,132 | 299,578 | ||
| 2019 | 10,662 | 130,367 | 19,534 | 298,068 | ||
| 2018 | 16,559 | 131,497 | 20,354 | 307,751 | ||
| 2017 | 11,378 | 135,426 | 21,474 | 330,157 | ||
| 2016 | 8,835 | 137,375 | 21,540 | 342,727 | ||
| 2015 | 8,221 | 136,693 | 22,993 | 336,213 | ||
| Mid-Bronx Endoscopy Center | 2024 | 3,047 | NA | NA | NA | |
| 2023 | 6,843 | NA | NA | NA | ||
| 2022 | 6,765 | NA | NA | NA | ||
| 2021 | 6,233 | NA | NA | NA | ||
| 2020 | 4,721 | NA | NA | NA | ||
| 2019 | 6,363 | NA | NA | NA | ||
| 2018 | 4,514 | NA | NA | NA | ||
| 2017 | 939 | NA | NA | NA | ||
| Montefiore Hutchinson Campus | 2024 | 10,041 | NA | NA | 100,079 | |
| 2023 | 19,546 | NA | NA | 195,553 | ||
| 2022 | 19,120 | NA | NA | 173,000 | ||
| 2021 | 18,916 | 1 | 5 | 250,736 | ||
| 2020 | 14,582 | NA | 36 | 135,468 | ||
| 2019 | 16,095 | NA | NA | 156,237 | ||
| 2018 | 16,788 | 1 | NA | 153,760 | ||
| 2017 | 15,641 | NA | NA | 138,976 | ||
| 2016 | 14,857 | NA | NA | 401 | ||
| 2015 | 10,683 | NA | NA | 660 | ||
| Montefiore Med Center - Jack D Weiler Hosp of A Einstein College Div | 2024 | 3,417 | 24,374 | 11,930 | 4,710 | |
| 2023 | 6,468 | 45,819 | 25,077 | 10,817 | ||
| 2022 | 5,510 | 44,369 | 24,616 | 11,338 | ||
| 2021 | 5,169 | 42,272 | 24,408 | 16,262 | ||
| 2020 | 4,013 | 37,766 | 25,343 | 10,309 | ||
| 2019 | 5,492 | 54,624 | 29,039 | 9,203 | ||
| 2018 | 4,774 | 57,211 | 29,742 | 7,554 | ||
| 2017 | 4,832 | 56,209 | 29,207 | 6,969 | ||
| 2016 | 4,945 | 57,793 | 29,946 | 10,665 | ||
| 2015 | 5,683 | 57,965 | 29,106 | 2,503 | ||
| Montefiore Medical Center - Henry & Lucy Moses Div | 2024 | 7,904 | 55,743 | 18,173 | 346,798 | |
| 2023 | 15,693 | 106,766 | 35,051 | 680,577 | ||
| 2022 | 13,578 | 95,129 | 35,256 | 668,447 | ||
| 2021 | 13,521 | 85,063 | 36,077 | 648,240 | ||
| 2020 | 11,382 | 73,035 | 35,370 | 562,236 | ||
| 2019 | 14,643 | 110,999 | 44,660 | 646,831 | ||
| 2018 | 13,189 | 113,863 | 45,275 | 558,793 | ||
| 2017 | 14,563 | 115,460 | 43,091 | 502,980 | ||
| 2016 | 15,335 | 121,114 | 42,706 | 460,004 | ||
| 2015 | 15,236 | 124,749 | 42,748 | 260,136 | ||
| Montefiore Medical Center - Montefiore Westchester Square | 2024 | 0 | 17,646 | NA | 1,417 | |
| 2023 | 0 | 32,071 | NA | 4,091 | ||
| 2022 | 0 | 30,811 | NA | 3,482 | ||
| 2021 | 1 | 27,458 | NA | 2,951 | ||
| 2020 | 1,292 | 22,922 | NA | 1,286 | ||
| 2019 | 6,205 | 33,098 | NA | 2,044 | ||
| 2018 | 5,792 | 32,045 | NA | 2,108 | ||
| 2017 | 5,864 | 30,024 | NA | 2,002 | ||
| 2016 | 6,468 | 29,138 | NA | 1,785 | ||
| 2015 | 6,366 | 25,441 | NA | 182 | ||
| Montefiore Medical Center-Wakefield Hospital | 2024 | 2,661 | 19,697 | 7,689 | 17,349 | |
| 2023 | 4,531 | 37,374 | 15,377 | 35,766 | ||
| 2022 | 3,906 | 36,623 | 14,846 | 32,674 | ||
| 2021 | 3,798 | 35,601 | 14,916 | 64,663 | ||
| 2020 | 2,665 | 32,793 | 14,873 | 28,574 | ||
| 2019 | 3,198 | 46,197 | 16,854 | 35,648 | ||
| 2018 | 2,855 | 46,647 | 15,840 | 33,234 | ||
| 2017 | 2,821 | 45,212 | 15,326 | 32,618 | ||
| 2016 | 2,638 | 52,102 | 15,832 | 33,189 | ||
| 2015 | 3,407 | 53,463 | 17,467 | 13,222 | ||
| New York GI Center, LLC | 2024 | 2,497 | NA | NA | NA | |
| 2023 | 10,641 | NA | NA | NA | ||
| 2022 | 9,433 | NA | NA | NA | ||
| 2021 | 8,854 | NA | NA | NA | ||
| 2020 | 6,310 | NA | NA | NA | ||
| 2019 | 9,512 | NA | NA | NA | ||
| 2018 | 9,291 | NA | NA | NA | ||
| 2017 | 9,167 | NA | NA | NA | ||
| 2016 | 9,251 | NA | NA | NA | ||
| 2015 | 9,566 | NA | NA | NA | ||
| North Central Bronx Hospital | 2024 | 1,139 | 21,578 | 3,401 | 69,328 | |
| 2023 | 2,544 | 44,805 | 7,253 | 146,375 | ||
| 2022 | 2,887 | 41,445 | 7,120 | 148,108 | ||
| 2021 | 3,386 | 35,913 | 7,705 | 243,441 | ||
| 2020 | 2,007 | 29,437 | 6,263 | 162,773 | ||
| 2019 | 3,419 | 47,132 | 6,988 | 138,066 | ||
| 2018 | 2,562 | 46,052 | 7,746 | 146,426 | ||
| 2017 | 2,539 | 43,759 | 7,377 | 144,406 | ||
| 2016 | 2,613 | 45,584 | 7,587 | 144,474 | ||
| 2015 | 2,663 | 44,534 | 7,294 | 133,726 | ||
| SBH Health System | 2024 | 0 | 0 | 0 | 0 | |
| 2023 | 4,946 | 50,213 | 11,996 | 79,218 | ||
| 2022 | 5,697 | 61,868 | 14,019 | 100,109 | ||
| 2021 | 4,366 | 57,970 | 13,902 | 101,494 | ||
| 2020 | 3,120 | 52,056 | 13,615 | 67,789 | ||
| 2019 | 5,747 | 69,055 | 15,222 | 95,755 | ||
| 2018 | 6,545 | 75,926 | 15,261 | 100,124 | ||
| 2017 | 5,171 | 72,380 | 14,835 | 95,543 | ||
| 2016 | 7,327 | 78,431 | 14,336 | 107,457 | ||
| 2015 | 6,233 | 74,808 | 14,669 | 107,627 | ||
| Triborough Ambulatory Surgery Center | 2024 | 1,055 | NA | NA | NA | |
| 2023 | 3,651 | NA | NA | NA | ||
| 2022 | 2,483 | NA | NA | NA | ||
| Broome | Greater Binghamton Eye Surgery Center | 2024 | 788 | NA | NA | NA |
| 2023 | 2,291 | NA | NA | NA | ||
| 2022 | 2,391 | NA | NA | NA | ||
| 2021 | 371 | NA | NA | NA | ||
| Our Lady of Lourdes Memorial Hospital | 2024 | 1,343 | 2,315 | 715 | 10,474 | |
| 2023 | 17,579 | 27,695 | 8,542 | 143,091 | ||
| 2022 | 16,600 | 26,878 | 9,654 | 141,099 | ||
| 2021 | 17,511 | 25,782 | 10,205 | 144,996 | ||
| 2020 | 16,168 | 23,499 | 10,112 | 117,346 | ||
| 2019 | 17,843 | 34,097 | 10,525 | 134,780 | ||
| 2018 | 16,541 | 34,691 | 10,632 | 154,719 | ||
| 2017 | 18,039 | 39,472 | 10,651 | 166,492 | ||
| 2016 | 18,704 | 37,963 | 11,993 | 138,652 | ||
| 2015 | 15,877 | 35,433 | 11,648 | 62,609 | ||
| United Health Services Hospitals Inc. - Binghamton General Hospital | 2024 | 5,729 | 8,234 | 1,783 | 21,799 | |
| 2023 | 10,340 | 17,060 | 3,380 | 32,206 | ||
| 2022 | 10,128 | 16,954 | 3,072 | 22,039 | ||
| 2021 | 8,056 | 14,618 | 3,546 | 18,780 | ||
| 2020 | 8,578 | 12,965 | 3,384 | 73,474 | ||
| 2019 | 9,502 | 15,301 | 4,350 | 108,893 | ||
| 2018 | 9,959 | 15,979 | 4,530 | 93,760 | ||
| 2017 | 9,028 | 15,116 | 4,678 | 85,894 | ||
| 2016 | 9,253 | 15,007 | 4,653 | 76,085 | ||
| 2015 | 8,085 | 15,526 | 4,348 | 57,294 | ||
| United Health Services Hospitals Inc. - Wilson Medical Center | 2024 | 5,473 | 18,250 | 6,632 | 33,342 | |
| 2023 | 10,394 | 35,225 | 13,137 | 70,019 | ||
| 2022 | 8,358 | 31,486 | 12,606 | 66,256 | ||
| 2021 | 7,711 | 24,415 | 13,517 | 50,052 | ||
| 2020 | 8,340 | 24,510 | 13,017 | 102,091 | ||
| 2019 | 11,085 | 29,457 | 15,089 | 135,017 | ||
| 2018 | 11,186 | 27,842 | 12,954 | 135,878 | ||
| 2017 | 11,024 | 27,412 | 13,510 | 133,475 | ||
| 2016 | 11,497 | 26,539 | 13,284 | 66,581 | ||
| 2015 | 11,411 | 27,153 | 13,327 | 16,422 | ||
| Wilson Place Ambulatory Surgery Center | 2024 | 2,355 | NA | NA | 65 | |
| 2023 | 4,109 | NA | NA | 19 | ||
| 2022 | 2,753 | NA | NA | 8 | ||
| 2021 | 4,231 | NA | 1 | 17 | ||
| 2020 | 4,400 | NA | NA | 22 | ||
| 2019 | 6,009 | NA | NA | 4,118 | ||
| 2018 | 6,310 | NA | NA | 9,283 | ||
| 2017 | 6,237 | NA | NA | 8,255 | ||
| 2016 | 3,403 | NA | NA | 8,377 | ||
| 2015 | 2,197 | NA | NA | NA | ||
| Cattaraugus | Olean General Hospital | 2024 | 6,768 | 16,600 | 4,930 | 88,886 |
| 2023 | 17,440 | 43,978 | 12,202 | 220,262 | ||
| 2022 | 15,678 | 42,344 | 11,058 | 216,414 | ||
| 2021 | 12,602 | 42,112 | 12,468 | 248,008 | ||
| 2020 | 15,096 | 41,040 | 12,098 | 226,480 | ||
| 2019 | 31,848 | 107,600 | 26,424 | 483,908 | ||
| 2018 | 31,360 | 111,096 | 24,372 | 483,484 | ||
| 2017 | 27,784 | 105,012 | 24,248 | 481,612 | ||
| 2016 | 32,996 | 112,008 | 22,212 | 465,368 | ||
| 2015 | 33,040 | 111,552 | 23,644 | 53,900 | ||
| Cayuga | Auburn Community Hospital | 2024 | 3,103 | 8,406 | 2,008 | 50,723 |
| 2023 | 7,023 | 19,786 | 4,499 | 111,543 | ||
| 2022 | 6,185 | 20,486 | 4,723 | 113,605 | ||
| 2021 | 5,787 | 19,519 | 5,220 | 114,213 | ||
| 2020 | 5,010 | 17,516 | 4,760 | 91,353 | ||
| 2019 | 6,296 | 20,979 | 4,730 | 99,347 | ||
| 2018 | 6,102 | 21,893 | 5,239 | 104,551 | ||
| 2017 | 6,459 | 22,322 | 5,229 | 111,688 | ||
| 2016 | 5,991 | 23,027 | 5,285 | 103,570 | ||
| 2015 | 5,815 | 22,324 | 5,353 | 23,779 | ||
| Chautauqua | Brooks-TLC Hospital System, Inc. | 2024 | 1,209 | 7,654 | 435 | 20,499 |
| 2023 | 3,011 | 20,250 | 1,007 | 52,199 | ||
| 2022 | 3,174 | 19,433 | 1,288 | 51,340 | ||
| 2021 | 3,027 | 18,148 | 1,819 | 56,864 | ||
| 2020 | 2,734 | 16,817 | 1,893 | 52,523 | ||
| 2019 | 3,690 | 17,209 | 2,028 | 52,261 | ||
| 2018 | 1,042 | 5,260 | 1,902 | 11,831 | ||
| 2017 | 3,986 | 15,756 | 1,947 | 45,415 | ||
| 2016 | 4,363 | 14,485 | 2,151 | 46,941 | ||
| 2015 | 4,071 | 17,426 | 2,481 | 16,260 | ||
| UPMC Chautauqua at WCA | 2024 | 4,621 | 10,464 | 2,068 | 41,636 | |
| 2023 | 14,183 | 31,008 | 6,112 | 118,135 | ||
| 2022 | 12,210 | 29,600 | 5,849 | 114,783 | ||
| 2021 | 12,317 | 27,377 | 5,987 | 122,741 | ||
| 2020 | 10,220 | 25,717 | 6,029 | 98,050 | ||
| 2019 | 9,626 | 30,039 | 7,341 | 104,017 | ||
| 2018 | 7,904 | 30,367 | 7,450 | 115,691 | ||
| 2017 | 7,650 | 32,017 | 7,547 | 111,465 | ||
| 2016 | 8,504 | 32,301 | 7,243 | 110,740 | ||
| 2015 | 8,251 | 32,097 | 6,911 | 36,770 | ||
| Westfield Memorial Hospital Inc | 2024 | 195 | 3,570 | 47 | 5,141 | |
| 2023 | 488 | 9,088 | 143 | 14,320 | ||
| 2022 | 490 | 8,391 | 164 | 14,656 | ||
| 2021 | 500 | 7,418 | 189 | 14,026 | ||
| 2020 | 536 | 5,968 | 65 | 11,594 | ||
| 2019 | 850 | 7,450 | 79 | 12,766 | ||
| 2018 | 847 | 7,652 | 14 | 11,612 | ||
| 2017 | 989 | 6,966 | 16 | 12,779 | ||
| 2016 | 1,048 | 7,247 | 24 | 13,145 | ||
| 2015 | 1,014 | 7,203 | 14 | 6,282 | ||
| Chemung | Arnot Ogden Medical Center | 2024 | 1,196 | 6,867 | 2,825 | 46,855 |
| 2023 | 3,941 | 28,229 | 7,849 | 179,721 | ||
| 2022 | 3,745 | 28,193 | 7,813 | 168,028 | ||
| 2021 | 4,204 | 26,476 | 8,306 | 207,939 | ||
| 2020 | 3,404 | 24,213 | 8,899 | 333,240 | ||
| 2019 | 4,583 | 32,585 | 11,529 | 324,062 | ||
| 2018 | 5,395 | 32,185 | 11,772 | 213,513 | ||
| 2017 | 5,656 | 32,751 | 11,107 | 212,923 | ||
| 2016 | 5,788 | 34,495 | 10,849 | 217,723 | ||
| 2015 | 5,433 | 34,854 | 11,035 | 217,857 | ||
| Corning Hospital Same Day Surgery Center | 2024 | 2,559 | NA | NA | 14 | |
| 2023 | 6,150 | NA | NA | 28 | ||
| 2022 | 5,749 | NA | NA | 24 | ||
| 2021 | 5,539 | 2 | NA | 39 | ||
| 2020 | 3,459 | NA | NA | 11 | ||
| 2019 | 4,432 | 1 | NA | 13 | ||
| 2018 | 4,897 | NA | NA | 40 | ||
| 2017 | 4,299 | NA | NA | 66 | ||
| 2016 | 4,190 | NA | NA | NA | ||
| 2015 | 3,201 | NA | NA | NA | ||
| Elmira ASC, LLC | 2024 | 0 | NA | NA | NA | |
| 2023 | 1,053 | NA | NA | NA | ||
| 2022 | 1,624 | NA | NA | NA | ||
| 2021 | 1,716 | NA | NA | NA | ||
| 2020 | 1,696 | NA | NA | NA | ||
| 2019 | 1,952 | NA | NA | NA | ||
| 2018 | 2,113 | NA | NA | NA | ||
| 2017 | 1,632 | NA | NA | NA | ||
| 2016 | 1,899 | NA | NA | NA | ||
| 2015 | 1,738 | NA | NA | NA | ||
| St. Joseph’s Hospital | 2024 | 1,110 | 0 | 307 | 6,399 | |
| 2023 | 3,862 | 0 | 971 | 19,747 | ||
| 2022 | 3,567 | 0 | 898 | 18,607 | ||
| 2021 | 3,228 | 1 | 1,080 | 15,244 | ||
| 2020 | 2,521 | 2,092 | 1,310 | 7,283 | ||
| 2019 | 3,099 | 7,298 | 1,607 | 12,252 | ||
| 2018 | 3,386 | 8,157 | 1,990 | 18,192 | ||
| 2017 | 3,416 | 8,623 | 2,164 | 19,878 | ||
| 2016 | 2,916 | 9,167 | 2,417 | 22,717 | ||
| 2015 | 3,025 | 9,660 | 2,823 | 21,415 | ||
| Chenango | Chenango Memorial Hospital Inc | 2024 | 1,169 | 8,226 | 699 | 18,621 |
| 2023 | 2,196 | 16,789 | 1,262 | 35,223 | ||
| 2022 | 2,090 | 15,375 | 1,239 | 30,711 | ||
| 2021 | 1,334 | 16,031 | 1,307 | 26,541 | ||
| 2020 | 1,612 | 12,521 | 1,142 | 27,227 | ||
| 2019 | 2,559 | 17,023 | 1,300 | 30,461 | ||
| 2018 | 2,150 | 16,794 | 1,398 | 28,569 | ||
| 2017 | 2,562 | 17,169 | 1,396 | 31,699 | ||
| 2016 | 2,635 | 16,339 | 1,573 | 33,271 | ||
| 2015 | 2,768 | 16,806 | 1,645 | 742 | ||
| Clinton | Cataract Center for the Adirondacks | 2024 | 111 | NA | NA | NA |
| 2023 | 2,094 | NA | NA | NA | ||
| 2022 | 1,962 | NA | NA | NA | ||
| 2021 | 1,939 | NA | NA | NA | ||
| 2020 | 1,988 | NA | NA | NA | ||
| 2019 | 3,518 | NA | NA | NA | ||
| 2018 | 3,669 | NA | NA | NA | ||
| 2017 | 3,124 | NA | NA | NA | ||
| 2016 | 2,529 | NA | NA | NA | ||
| 2015 | 2,457 | NA | NA | NA | ||
| Surgical Pain Center of the Adirondacks LLC | 2024 | 1,389 | NA | NA | NA | |
| 2023 | 3,349 | NA | NA | NA | ||
| 2022 | 3,098 | NA | NA | NA | ||
| 2021 | 3,775 | NA | NA | NA | ||
| 2020 | 2,705 | NA | NA | NA | ||
| The University of Vermont Health Network - Champlain Valley Physicians Hospital | 2024 | 3,173 | 14,958 | 3,797 | 120,772 | |
| 2023 | 8,543 | 29,321 | 7,817 | 244,609 | ||
| 2022 | 9,515 | 26,251 | 8,293 | 192,484 | ||
| 2021 | 7,570 | 26,263 | 11,317 | 80,208 | ||
| 2020 | 6,247 | 25,747 | 10,102 | 70,590 | ||
| 2019 | 6,495 | 34,405 | 9,009 | 59,096 | ||
| 2018 | 6,981 | 37,044 | 8,794 | 61,168 | ||
| 2017 | 6,381 | 45,669 | 8,856 | 68,627 | ||
| 2016 | 5,669 | 40,063 | 8,876 | 60,098 | ||
| 2015 | 4,739 | 38,426 | 9,824 | 41,475 | ||
| The University of Vermont Health Network- Champlain Valley Physicians Hospital Kevin J. Carroll Ambulatory Svce. | 2024 | 2,168 | NA | NA | 8 | |
| 2023 | 4,994 | NA | NA | 19 | ||
| 2022 | 4,316 | NA | NA | 16 | ||
| 2021 | 4,863 | NA | NA | 18 | ||
| 2020 | 4,226 | NA | NA | 112 | ||
| 2019 | 5,573 | NA | NA | 398 | ||
| 2018 | 5,945 | NA | NA | 340 | ||
| 2017 | 7,648 | 1 | NA | 354 | ||
| 2016 | 6,736 | NA | NA | 303 | ||
| 2015 | 6,517 | NA | NA | 245 | ||
| Columbia | Columbia Memorial Hospital | 2024 | 2,479 | 7,016 | 1,191 | 5,515 |
| 2023 | 6,289 | 18,477 | 2,975 | 14,099 | ||
| 2022 | 6,060 | 18,172 | 2,909 | 13,876 | ||
| 2021 | 6,277 | 18,275 | 3,340 | 14,110 | ||
| 2020 | 5,399 | 18,352 | 3,585 | 11,580 | ||
| 2019 | 6,205 | 22,408 | 5,731 | 14,133 | ||
| 2018 | 6,504 | 26,354 | 6,347 | 15,562 | ||
| 2017 | 6,708 | 24,053 | 5,292 | 15,894 | ||
| 2016 | 6,173 | 22,438 | 5,573 | 13,813 | ||
| 2015 | 5,675 | 22,846 | 5,850 | 11,997 | ||
| Cortland | Cortland Surgical Center | 2024 | 402 | NA | NA | NA |
| 2023 | 757 | NA | NA | NA | ||
| 2022 | 279 | NA | NA | NA | ||
| 2021 | 280 | NA | NA | NA | ||
| 2020 | 253 | NA | NA | NA | ||
| 2019 | 275 | NA | NA | NA | ||
| 2018 | 265 | NA | NA | NA | ||
| 2017 | 286 | NA | NA | NA | ||
| 2016 | 209 | NA | NA | NA | ||
| 2015 | 210 | NA | NA | NA | ||
| Guthrie Cortland Medical Center | 2024 | 2,887 | 8,511 | 1,714 | 26,658 | |
| 2023 | 6,248 | 21,968 | 3,737 | 70,109 | ||
| 2022 | 5,486 | 21,737 | 3,731 | 75,320 | ||
| 2021 | 4,673 | 20,207 | 3,600 | 73,901 | ||
| 2020 | 3,211 | 19,135 | 3,247 | 47,086 | ||
| 2019 | 4,033 | 26,589 | 3,692 | 39,806 | ||
| 2018 | 4,144 | 26,726 | 3,840 | 42,690 | ||
| 2017 | 4,400 | 27,040 | 3,881 | 40,632 | ||
| 2016 | 3,706 | 26,507 | 3,547 | 33,508 | ||
| 2015 | 3,515 | 24,719 | 3,931 | 7,060 | ||
| Delaware | A.O. Fox Memorial Hospital - Tri-Town Campus | 2024 | NA | 3,505 | NA | 5,212 |
| 2023 | NA | 7,849 | NA | 10,809 | ||
| 2022 | NA | 7,734 | NA | 11,635 | ||
| 2021 | NA | 7,269 | NA | 13,488 | ||
| 2020 | 60 | 6,321 | NA | 13,219 | ||
| 2019 | NA | 9,022 | NA | 12,373 | ||
| 2018 | NA | 9,407 | NA | 11,758 | ||
| 2017 | NA | 9,880 | NA | 12,038 | ||
| 2016 | NA | 9,966 | NA | 3,559 | ||
| 2015 | NA | 9,813 | NA | 2,157 | ||
| Delaware Valley Hospital Inc | 2024 | 91 | 2,755 | 87 | 7,444 | |
| 2023 | 155 | 5,992 | 169 | 12,341 | ||
| 2022 | 103 | 5,311 | 149 | 10,614 | ||
| 2021 | 89 | 4,356 | 169 | 9,282 | ||
| 2020 | 52 | 3,828 | 152 | 18,720 | ||
| 2019 | 99 | 5,325 | 252 | 31,758 | ||
| 2018 | 142 | 5,478 | 298 | 29,076 | ||
| 2017 | 93 | 4,900 | 310 | 26,768 | ||
| 2016 | 105 | 5,305 | 363 | 29,414 | ||
| 2015 | 110 | 5,509 | 382 | 22,622 | ||
| Margaretville Hospital | 2024 | 86 | 2,928 | 70 | 3,614 | |
| 2023 | 222 | 7,526 | 186 | 9,122 | ||
| 2022 | 214 | 7,278 | 200 | 11,584 | ||
| 2021 | 254 | 6,620 | 172 | 17,072 | ||
| 2020 | 212 | 5,752 | 184 | 13,744 | ||
| 2019 | 468 | 13,756 | 612 | 27,476 | ||
| 2018 | 484 | 15,092 | 632 | 27,960 | ||
| 2017 | 476 | 16,312 | 464 | 25,688 | ||
| 2016 | 656 | 16,724 | 636 | 27,684 | ||
| 2015 | 880 | 16,916 | 544 | 4,280 | ||
| O’Connor Hospital | 2024 | 34 | 2,954 | 95 | 11,348 | |
| 2023 | 244 | 6,190 | 162 | 24,058 | ||
| 2022 | 328 | 5,858 | 126 | 23,031 | ||
| 2021 | 391 | 4,984 | 110 | 25,631 | ||
| 2020 | 345 | 4,059 | 66 | 22,268 | ||
| 2019 | 367 | 5,424 | 128 | 22,354 | ||
| 2018 | 357 | 5,337 | 169 | 21,895 | ||
| 2017 | 328 | 5,558 | 162 | 16,893 | ||
| 2016 | 324 | 5,627 | 168 | 10,261 | ||
| 2015 | 324 | 5,663 | 175 | 8,347 | ||
| Dutchess | Bridgeview Endoscopy | 2024 | 3,776 | NA | NA | NA |
| 2023 | 8,873 | NA | NA | NA | ||
| 2022 | 8,338 | NA | NA | NA | ||
| 2021 | 8,215 | NA | NA | NA | ||
| 2020 | 5,742 | NA | NA | NA | ||
| 2019 | 5,653 | NA | NA | NA | ||
| 2018 | 5,453 | NA | NA | NA | ||
| 2017 | 3,576 | NA | NA | NA | ||
| 2016 | 224 | NA | NA | NA | ||
| Central New York Eye Center | 2024 | 0 | NA | NA | NA | |
| 2023 | 2,227 | NA | NA | NA | ||
| 2022 | 2,300 | NA | NA | NA | ||
| 2021 | 1,996 | NA | NA | NA | ||
| 2020 | 1,810 | NA | NA | 2 | ||
| 2019 | 2,054 | NA | NA | NA | ||
| 2018 | 1,984 | NA | NA | 1 | ||
| 2017 | 1,748 | NA | NA | NA | ||
| 2016 | 1,915 | NA | NA | NA | ||
| 2015 | 1,741 | NA | NA | NA | ||
| Dutchess Ambulatory Surgical Center | 2024 | 2,275 | NA | NA | NA | |
| 2023 | 4,536 | NA | NA | NA | ||
| 2022 | 4,004 | NA | NA | NA | ||
| 2021 | 3,943 | NA | NA | NA | ||
| 2020 | 3,160 | NA | NA | NA | ||
| 2019 | 4,157 | NA | NA | 222 | ||
| 2018 | 3,343 | NA | NA | 1,036 | ||
| 2017 | 2,834 | NA | NA | 434 | ||
| 2016 | 2,321 | NA | NA | NA | ||
| 2015 | 2,289 | NA | NA | NA | ||
| Fishkill Ambulatory Surgery Center | 2024 | 1,406 | 0 | NA | 15,748 | |
| 2023 | 4,036 | 0 | NA | 43,838 | ||
| 2022 | 3,458 | 2 | NA | 40,994 | ||
| 2021 | 2,956 | NA | NA | 40,314 | ||
| 2020 | 2,358 | NA | NA | 35,094 | ||
| 2019 | 6,160 | 4 | NA | 85,872 | ||
| 2018 | 5,768 | 4 | NA | 90,008 | ||
| 2017 | 10,016 | 17,268 | NA | 115,464 | ||
| 2016 | 12,056 | 17,204 | NA | 130,140 | ||
| 2015 | 9,952 | NA | NA | NA | ||
| Hudson Valley Endoscopic Center | 2024 | 3,163 | NA | NA | NA | |
| 2023 | 6,576 | NA | NA | NA | ||
| 2022 | 6,484 | NA | NA | NA | ||
| 2021 | 6,410 | NA | NA | NA | ||
| 2020 | 4,788 | NA | NA | NA | ||
| 2019 | 7,785 | NA | NA | NA | ||
| 2018 | 7,515 | NA | NA | NA | ||
| 2017 | 7,517 | NA | NA | NA | ||
| 2016 | 7,691 | NA | NA | NA | ||
| 2015 | 7,005 | NA | NA | NA | ||
| Mid-Hudson Valley Division of Westchester Medical Center | 2024 | 1,525 | 9,754 | 2,754 | 16,623 | |
| 2023 | 4,426 | 29,282 | 8,436 | 47,360 | ||
| 2022 | 4,336 | 28,621 | 7,801 | 53,048 | ||
| 2021 | 3,768 | 24,368 | 7,759 | 68,211 | ||
| 2020 | 3,258 | 19,830 | 6,411 | 35,183 | ||
| 2019 | 3,553 | 23,374 | 6,407 | 28,741 | ||
| 2018 | 4,060 | 22,255 | 6,518 | 27,546 | ||
| 2017 | 4,253 | 22,493 | 5,944 | 29,595 | ||
| 2016 | 4,125 | 22,109 | 5,960 | 32,381 | ||
| 2015 | 4,083 | 21,181 | 5,730 | 33,888 | ||
| Northern Dutchess Hospital | 2024 | 3,604 | 14,974 | 3,978 | 17,350 | |
| 2023 | 10,358 | 48,098 | 12,170 | 49,262 | ||
| 2022 | 9,546 | 45,564 | 12,478 | 48,114 | ||
| 2021 | 9,460 | 40,850 | 11,622 | 50,756 | ||
| 2020 | 7,606 | 34,258 | 11,162 | 43,556 | ||
| 2019 | 15,896 | 85,704 | 24,608 | 96,812 | ||
| 2018 | 15,496 | 81,292 | 24,576 | 89,716 | ||
| 2017 | 15,244 | 76,568 | 22,700 | 83,808 | ||
| 2016 | 16,032 | 73,076 | 21,592 | 79,616 | ||
| 2015 | 14,744 | 65,108 | 20,512 | 27,192 | ||
| The Surgery Center at Orthopedic Associates, LLC | 2024 | 810 | NA | NA | NA | |
| 2023 | 2,562 | NA | NA | NA | ||
| 2022 | 4,712 | NA | NA | NA | ||
| 2021 | 5,077 | NA | NA | NA | ||
| 2020 | 4,934 | NA | NA | NA | ||
| 2019 | 5,485 | NA | NA | NA | ||
| 2018 | 5,496 | NA | NA | NA | ||
| 2017 | 4,645 | NA | NA | NA | ||
| 2016 | 4,579 | NA | NA | NA | ||
| 2015 | 4,127 | NA | NA | NA | ||
| Vassar Brothers Medical Center | 2024 | 5,806 | 26,410 | 14,784 | 49,890 | |
| 2023 | 17,712 | 78,800 | 43,852 | 142,074 | ||
| 2022 | 16,682 | 80,208 | 44,452 | 143,454 | ||
| 2021 | 19,618 | 77,740 | 42,476 | 162,678 | ||
| 2020 | 16,332 | 74,890 | 41,198 | 311,564 | ||
| 2019 | 40,672 | 214,856 | 95,976 | 607,696 | ||
| 2018 | 42,048 | 234,160 | 94,388 | 519,596 | ||
| 2017 | 36,996 | 207,976 | 96,740 | 415,568 | ||
| 2016 | 38,220 | 216,952 | 93,416 | 365,408 | ||
| 2015 | 35,756 | 221,916 | 87,008 | 50,576 | ||
| Erie | Ambulatory Surgery Center of Western New York LLC | 2024 | 0 | NA | NA | NA |
| 2023 | 7,922 | NA | NA | NA | ||
| 2022 | 13,314 | NA | NA | NA | ||
| 2021 | 12,794 | NA | NA | 1 | ||
| 2020 | 9,556 | NA | NA | NA | ||
| 2019 | 11,747 | NA | NA | 2 | ||
| 2018 | 12,167 | NA | NA | 4 | ||
| 2017 | 14,470 | NA | NA | NA | ||
| 2016 | 11,868 | NA | NA | NA | ||
| 2015 | 13,084 | NA | NA | NA | ||
| Bertrand Chaffee Hospital | 2024 | 605 | 3,548 | 240 | 9,288 | |
| 2023 | 2,006 | 10,899 | 702 | 28,930 | ||
| 2022 | 1,621 | 10,013 | 728 | 31,545 | ||
| 2021 | 1,407 | 9,241 | 842 | 36,642 | ||
| 2020 | 1,169 | 8,206 | 852 | 25,285 | ||
| 2019 | 1,346 | 8,779 | 793 | 23,893 | ||
| 2018 | 1,442 | 8,692 | 855 | 25,825 | ||
| 2017 | 1,396 | 8,562 | 961 | 27,215 | ||
| 2016 | 1,373 | 8,343 | 895 | 28,760 | ||
| 2015 | 1,446 | 8,096 | 988 | 14,420 | ||
| Buffalo Ambulatory Surgery Center | 2024 | 2,761 | NA | NA | 5 | |
| 2023 | 8,142 | NA | NA | 20 | ||
| 2022 | 9,420 | NA | NA | 25 | ||
| 2021 | 9,184 | NA | NA | 5 | ||
| 2020 | 8,555 | NA | NA | 7 | ||
| 2019 | 11,836 | NA | NA | 30 | ||
| 2018 | 11,857 | NA | NA | 21 | ||
| 2017 | 11,697 | NA | NA | NA | ||
| 2016 | 12,300 | NA | NA | NA | ||
| 2015 | 10,826 | NA | NA | NA | ||
| Buffalo General Medical Center | 2024 | 7,052 | 12,450 | 7,747 | 4,439 | |
| 2023 | 19,794 | 37,216 | 23,443 | 14,098 | ||
| 2022 | 20,780 | 36,692 | 22,443 | 14,054 | ||
| 2021 | 17,059 | 33,157 | 22,634 | 16,839 | ||
| 2020 | 15,197 | 31,772 | 22,546 | 22,030 | ||
| 2019 | 17,674 | 42,772 | 23,874 | 29,031 | ||
| 2018 | 16,034 | 42,383 | 24,936 | 30,171 | ||
| 2017 | 15,243 | 43,116 | 24,681 | 28,547 | ||
| 2016 | 16,121 | 42,917 | 23,977 | 29,973 | ||
| 2015 | 15,395 | 43,184 | 22,879 | 28,713 | ||
| Buffalo Surgery Center,LLC | 2024 | 0 | NA | NA | NA | |
| 2023 | 18,216 | NA | NA | NA | ||
| 2022 | 18,240 | NA | NA | NA | ||
| 2021 | 18,204 | NA | NA | 1 | ||
| 2020 | 13,388 | NA | NA | 1 | ||
| 2019 | 16,199 | NA | NA | NA | ||
| 2018 | 15,249 | NA | NA | NA | ||
| 2017 | 13,859 | NA | NA | NA | ||
| 2016 | 7,557 | NA | NA | NA | ||
| 2015 | 5,381 | NA | NA | NA | ||
| Center for Ambulatory Surgery LLC | 2024 | 975 | NA | NA | NA | |
| 2023 | 11,522 | NA | NA | NA | ||
| 2022 | 8,490 | NA | NA | NA | ||
| 2021 | 0 | NA | NA | NA | ||
| 2019 | 9,159 | NA | NA | NA | ||
| 2018 | 9,566 | NA | NA | NA | ||
| 2017 | 10,349 | NA | NA | NA | ||
| 2016 | 11,578 | NA | NA | NA | ||
| 2015 | 11,765 | NA | NA | NA | ||
| Endoscopy Center of Western New York, LLC | 2024 | 4,656 | NA | NA | NA | |
| 2023 | 14,041 | NA | NA | NA | ||
| 2022 | 13,727 | NA | NA | NA | ||
| 2021 | 12,755 | NA | NA | NA | ||
| 2020 | 10,424 | NA | NA | NA | ||
| 2019 | 13,821 | NA | NA | NA | ||
| 2018 | 12,942 | NA | NA | NA | ||
| 2017 | 11,358 | NA | NA | NA | ||
| 2016 | 10,427 | NA | NA | NA | ||
| 2015 | 10,083 | NA | NA | NA | ||
| Erie County Medical Center | 2024 | 4,297 | 12,856 | 5,130 | 40,245 | |
| 2023 | 10,946 | 34,958 | 15,280 | 144,103 | ||
| 2022 | 11,223 | 35,166 | 16,174 | 169,670 | ||
| 2021 | 11,192 | 41,759 | 17,562 | 224,360 | ||
| 2020 | 7,741 | 39,396 | 17,606 | 183,275 | ||
| 2019 | 11,326 | 43,294 | 18,236 | 152,005 | ||
| 2018 | 9,820 | 44,260 | 18,437 | 124,126 | ||
| 2017 | 7,097 | 41,498 | 15,765 | 105,989 | ||
| 2016 | 7,193 | 44,372 | 16,356 | 103,609 | ||
| 2015 | 8,056 | 45,041 | 16,240 | 70,624 | ||
| Eye Health Associates Inc | 2024 | 768 | NA | NA | NA | |
| 2023 | 3,677 | NA | NA | NA | ||
| 2022 | 3,654 | NA | NA | NA | ||
| 2021 | 3,769 | NA | NA | NA | ||
| 2020 | 2,954 | NA | NA | NA | ||
| 2019 | 4,251 | NA | NA | NA | ||
| 2018 | 4,012 | NA | NA | NA | ||
| 2017 | 4,092 | NA | NA | NA | ||
| 2016 | 4,181 | NA | NA | NA | ||
| 2015 | 4,878 | NA | NA | NA | ||
| Harlem Road Ambulatory Surgery Center | 2024 | 6,742 | NA | NA | 34 | |
| 2023 | 17,192 | NA | NA | 112 | ||
| 2022 | 5,087 | NA | NA | 24 | ||
| John R. Oishei Children’s Hospital | 2024 | 4,310 | 14,806 | 4,313 | 17,965 | |
| 2023 | 13,000 | 45,037 | 12,898 | 49,846 | ||
| 2022 | 13,058 | 47,172 | 13,382 | 54,575 | ||
| 2021 | 10,786 | 40,712 | 12,115 | 55,865 | ||
| 2020 | 9,374 | 36,672 | 10,922 | 49,519 | ||
| 2019 | 13,088 | 48,612 | 12,260 | 60,479 | ||
| 2018 | 13,061 | 46,474 | 12,727 | 57,675 | ||
| 2017 | 13,183 | 45,957 | 12,425 | 61,211 | ||
| 2016 | 13,525 | 44,811 | 12,448 | 61,474 | ||
| 2015 | 12,725 | 42,240 | 13,070 | 59,960 | ||
| Kenmore Mercy Hospital | 2024 | 1,348 | 8,876 | 2,090 | 9,618 | |
| 2023 | 4,918 | 28,894 | 5,959 | 28,294 | ||
| 2022 | 5,056 | 25,753 | 6,072 | 25,252 | ||
| 2021 | 5,555 | 24,362 | 5,495 | 29,845 | ||
| 2020 | 4,693 | 24,945 | 5,984 | 30,885 | ||
| 2019 | 4,664 | 32,429 | 7,203 | 31,350 | ||
| 2018 | 4,310 | 32,334 | 8,549 | 29,865 | ||
| 2017 | 4,714 | 32,251 | 8,164 | 28,446 | ||
| 2016 | 6,708 | 31,661 | 8,058 | 29,026 | ||
| 2015 | 8,261 | 29,404 | 7,988 | 12,274 | ||
| Mercy Hospital - Mercy Hospital Orchard Park Division | 2024 | 25 | 7,561 | NA | 11,381 | |
| 2023 | 104 | 24,067 | NA | 32,568 | ||
| 2022 | 82 | 19,193 | NA | 30,038 | ||
| 2021 | 93 | 17,130 | 0 | 40,084 | ||
| 2020 | 26 | 20,320 | NA | 54,089 | ||
| 2019 | 29 | 26,179 | NA | 58,272 | ||
| 2018 | 11 | 23,826 | NA | 59,381 | ||
| 2017 | 15 | 24,301 | NA | 61,190 | ||
| 2016 | NA | 25,183 | NA | 59,648 | ||
| 2015 | 7 | 24,114 | NA | 22,504 | ||
| Mercy Hospital of Buffalo | 2024 | 2,914 | 9,418 | 5,931 | 4,337 | |
| 2023 | 8,479 | 29,378 | 17,201 | 13,120 | ||
| 2022 | 7,803 | 26,693 | 16,365 | 12,076 | ||
| 2021 | 7,977 | 28,140 | 16,288 | 18,494 | ||
| 2020 | 7,251 | 32,434 | 17,825 | 13,022 | ||
| 2019 | 9,563 | 40,251 | 19,972 | 12,797 | ||
| 2018 | 10,412 | 39,482 | 21,347 | 13,102 | ||
| 2017 | 11,436 | 40,486 | 21,739 | 13,427 | ||
| 2016 | 12,020 | 42,859 | 21,598 | 28,188 | ||
| 2015 | 12,991 | 42,712 | 20,302 | 9,515 | ||
| Millard Fillmore Suburban Hospital | 2024 | 7,517 | 12,498 | 5,496 | 4,813 | |
| 2023 | 22,572 | 38,479 | 17,397 | 14,186 | ||
| 2022 | 25,220 | 35,539 | 17,559 | 13,203 | ||
| 2021 | 21,183 | 31,893 | 17,970 | 13,510 | ||
| 2020 | 18,690 | 34,249 | 17,154 | 11,745 | ||
| 2019 | 19,392 | 36,953 | 18,179 | 7,672 | ||
| 2018 | 19,355 | 37,650 | 17,855 | 7,231 | ||
| 2017 | 20,141 | 36,683 | 17,411 | 4,458 | ||
| 2016 | 21,651 | 34,981 | 17,129 | 2,798 | ||
| 2015 | 22,178 | 31,800 | 16,760 | 3,309 | ||
| Millard Fillmore Surgery Center, LLC | 2024 | 842 | NA | NA | 6 | |
| 2023 | 3,271 | NA | NA | 35 | ||
| 2022 | 3,874 | NA | NA | 17 | ||
| 2021 | 3,967 | NA | NA | NA | ||
| 2020 | 3,127 | NA | NA | NA | ||
| 2019 | 3,827 | NA | NA | NA | ||
| 2018 | 3,707 | NA | NA | NA | ||
| 2017 | 3,891 | NA | NA | NA | ||
| 2016 | 4,922 | NA | NA | NA | ||
| 2015 | 5,220 | NA | NA | NA | ||
| Premier Ambulatory Surgery Center | 2024 | 2,738 | NA | NA | NA | |
| 2023 | 5,772 | NA | NA | NA | ||
| 2022 | 4,334 | NA | NA | NA | ||
| 2021 | 1,760 | NA | NA | NA | ||
| 2020 | 1,214 | NA | NA | NA | ||
| 2019 | 0 | NA | NA | NA | ||
| 2018 | 0 | NA | NA | NA | ||
| Roswell Park Cancer Institute | 2024 | 6,949 | NA | 1,935 | 87,543 | |
| 2023 | 20,131 | NA | 5,128 | 264,541 | ||
| 2022 | 18,870 | NA | 5,085 | 265,663 | ||
| 2021 | 18,354 | NA | 5,004 | 260,144 | ||
| 2020 | 16,843 | NA | 4,850 | 233,048 | ||
| 2019 | 17,032 | NA | 5,284 | 227,740 | ||
| 2018 | 8,165 | NA | 5,054 | 212,113 | ||
| 2017 | 6,495 | NA | 4,891 | 186,598 | ||
| 2016 | 6,257 | NA | 4,699 | 176,264 | ||
| 2015 | 6,177 | NA | 4,503 | 140,261 | ||
| Sisters of Charity Hospital | 2024 | 2,776 | 6,977 | 3,754 | 22,614 | |
| 2023 | 8,043 | 23,266 | 10,960 | 63,200 | ||
| 2022 | 7,838 | 23,731 | 11,278 | 59,658 | ||
| 2021 | 9,070 | 24,420 | 12,500 | 72,647 | ||
| 2020 | 8,501 | 26,573 | 11,834 | 40,974 | ||
| 2019 | 8,344 | 34,883 | 13,154 | 30,367 | ||
| 2018 | 8,460 | 36,044 | 14,291 | 38,181 | ||
| 2017 | 9,421 | 35,822 | 14,904 | 42,490 | ||
| 2016 | 11,501 | 38,501 | 14,722 | 40,573 | ||
| 2015 | 12,358 | 37,727 | 14,161 | 22,884 | ||
| Sisters of Charity Hospital - St. Joseph Campus | 2024 | 1,508 | 7,306 | 464 | 3,209 | |
| 2023 | 4,693 | 21,358 | 1,127 | 10,393 | ||
| 2022 | 5,267 | 17,712 | 1,071 | 9,616 | ||
| 2021 | 4,443 | 7,891 | 1,166 | 10,119 | ||
| 2020 | 3,036 | 9,526 | 2,104 | 4,706 | ||
| 2019 | 7,262 | 27,812 | 3,481 | 10,529 | ||
| 2018 | 7,309 | 26,609 | 4,020 | 11,091 | ||
| 2017 | 7,278 | 27,333 | 4,247 | 11,988 | ||
| 2016 | 7,582 | 28,343 | 3,951 | 11,883 | ||
| 2015 | 7,961 | 27,180 | 3,774 | 6,646 | ||
| Southtowns Surgery Center | 2024 | 1,134 | NA | NA | 11 | |
| 2023 | 3,069 | NA | NA | 22 | ||
| 2022 | 3,123 | NA | NA | 13 | ||
| 2021 | 2,832 | NA | NA | 1 | ||
| 2020 | 2,343 | NA | NA | 2 | ||
| 2019 | 2,747 | NA | NA | 8 | ||
| 2018 | 2,291 | NA | NA | NA | ||
| 2017 | 1,857 | NA | NA | NA | ||
| 2016 | 351 | NA | NA | NA | ||
| Sterling Surgical Center, LLC | 2024 | 0 | NA | NA | NA | |
| 2023 | 3,861 | NA | NA | NA | ||
| 2022 | 4,772 | NA | NA | NA | ||
| 2021 | 4,442 | NA | NA | NA | ||
| 2020 | 3,159 | NA | NA | NA | ||
| 2019 | 5,467 | NA | NA | NA | ||
| 2018 | 5,747 | NA | NA | NA | ||
| 2017 | 5,825 | NA | NA | NA | ||
| 2016 | 5,511 | NA | NA | NA | ||
| 2015 | 4,982 | NA | NA | NA | ||
| Sunrise Surgery Center | 2024 | 1,425 | NA | NA | NA | |
| 2023 | 316 | NA | NA | NA | ||
| WNY Medical Management | 2024 | 0 | NA | NA | NA | |
| 2023 | 0 | NA | NA | NA | ||
| 2022 | 87 | NA | NA | NA | ||
| 2021 | 2,208 | NA | NA | NA | ||
| 2020 | 1,976 | NA | NA | NA | ||
| 2019 | 2,816 | NA | NA | NA | ||
| 2018 | 2,093 | NA | NA | NA | ||
| 2017 | 2,110 | NA | NA | NA | ||
| 2016 | 1,736 | NA | NA | NA | ||
| 2015 | 1,070 | NA | NA | NA | ||
| WNY Medical Management - Sheridan Drive | 2024 | 1,471 | NA | NA | NA | |
| 2023 | 4,737 | NA | NA | NA | ||
| 2022 | 3,524 | NA | NA | NA | ||
| 2021 | 1,735 | NA | NA | 1 | ||
| 2020 | 1,358 | NA | NA | NA | ||
| 2019 | 102 | NA | NA | NA | ||
| Wehrle Drive ASC, LLC | 2024 | 1,401 | NA | NA | NA | |
| 2023 | 2,926 | NA | NA | NA | ||
| 2022 | 1,178 | NA | NA | NA | ||
| Essex | Adirondack Medical Center-Lake Placid Site | 2024 | NA | 0 | NA | 8,519 |
| 2023 | NA | 1,930 | NA | 26,045 | ||
| 2022 | NA | 2,912 | NA | 26,707 | ||
| 2021 | NA | 2,638 | NA | 25,341 | ||
| 2020 | NA | 2,539 | NA | 21,615 | ||
| 2019 | NA | 3,481 | NA | 22,837 | ||
| 2018 | 1 | 3,282 | NA | 21,319 | ||
| 2017 | NA | 3,089 | NA | 19,299 | ||
| 2016 | NA | 3,196 | NA | 18,917 | ||
| 2015 | NA | 3,192 | NA | 8,532 | ||
| The University of Vermont Health Network - Elizabethtown Community Hospital | 2024 | 0 | 3,448 | 359 | 17,681 | |
| 2023 | 51 | 7,359 | 663 | 36,059 | ||
| 2022 | 9 | 6,368 | 573 | 28,255 | ||
| 2021 | 3 | 5,645 | 305 | 14,368 | ||
| 2020 | 24 | 4,542 | 239 | 13,305 | ||
| 2019 | 32 | 6,662 | 335 | 13,226 | ||
| 2018 | 45 | 6,587 | 374 | 12,426 | ||
| 2017 | 60 | 7,146 | 401 | 12,255 | ||
| 2016 | 181 | 6,937 | 316 | 13,240 | ||
| 2015 | 227 | 6,285 | 336 | 3,874 | ||
| The University of Vermont Health Network - Elizabethtown Community Hospital Moses Ludington | 2024 | NA | 3,306 | NA | 5,898 | |
| 2023 | NA | 7,002 | NA | 10,856 | ||
| 2022 | NA | 6,732 | NA | 11,030 | ||
| 2021 | 2 | 5,942 | NA | 13,219 | ||
| 2020 | 4 | 5,195 | NA | 10,611 | ||
| 2019 | NA | 6,517 | NA | 11,165 | ||
| 2018 | NA | 6,526 | NA | 12,372 | ||
| 2017 | NA | 6,447 | 14 | 13,705 | ||
| 2016 | NA | 6,478 | 70 | 13,907 | ||
| 2015 | NA | 6,463 | 143 | 741 | ||
| Franklin | Adirondack Medical Center-Saranac Lake Site | 2024 | 910 | 4,111 | 719 | 21,951 |
| 2023 | 2,526 | 11,603 | 2,196 | 67,493 | ||
| 2022 | 2,259 | 10,904 | 2,246 | 80,752 | ||
| 2021 | 2,726 | 9,863 | 2,312 | 80,476 | ||
| 2020 | 2,595 | 8,109 | 2,216 | 55,431 | ||
| 2019 | 2,849 | 10,216 | 2,544 | 56,419 | ||
| 2018 | 2,706 | 10,176 | 2,389 | 48,904 | ||
| 2017 | 2,602 | 9,748 | 2,404 | 45,001 | ||
| 2016 | 2,591 | 9,558 | 2,186 | 39,842 | ||
| 2015 | 2,905 | 9,207 | 2,381 | 9,882 | ||
| Fulton | Johnstown Surgery Center | 2024 | 361 | NA | NA | 0 |
| 2023 | 912 | NA | NA | 0 | ||
| 2022 | 746 | NA | NA | 5 | ||
| 2021 | 773 | NA | NA | NA | ||
| 2020 | 162 | NA | NA | NA | ||
| 2019 | 352 | NA | NA | NA | ||
| 2018 | 534 | NA | NA | NA | ||
| 2017 | 625 | NA | NA | NA | ||
| 2016 | 883 | NA | NA | NA | ||
| 2015 | 785 | NA | NA | NA | ||
| Nathan Littauer Hospital | 2024 | 2,114 | 6,368 | 762 | 27,850 | |
| 2023 | 5,593 | 18,790 | 2,370 | 81,154 | ||
| 2022 | 5,656 | 17,603 | 2,575 | 84,432 | ||
| 2021 | 4,539 | 16,081 | 2,436 | 77,267 | ||
| 2020 | 4,407 | 14,565 | 2,297 | 71,430 | ||
| 2019 | 5,626 | 20,262 | 2,620 | 76,454 | ||
| 2018 | 5,973 | 20,961 | 2,639 | 74,796 | ||
| 2017 | 5,761 | 20,777 | 2,869 | 72,971 | ||
| 2016 | 5,436 | 21,691 | 2,444 | 67,709 | ||
| 2015 | 5,296 | 20,587 | 2,934 | 8,677 | ||
| Genesee | United Memorial Medical Center Bank Street Campus | 2024 | NA | 1 | 111 | 3,016 |
| 2023 | NA | 2 | 432 | 42,629 | ||
| 2022 | NA | 1,085 | 388 | 58,110 | ||
| 2021 | NA | 2,145 | 279 | 51,661 | ||
| 2020 | NA | 1,927 | 311 | 45,189 | ||
| 2019 | NA | 1 | 527 | 53,124 | ||
| 2018 | NA | NA | 513 | 51,398 | ||
| 2017 | NA | NA | 457 | 50,687 | ||
| 2016 | NA | NA | 384 | 53,425 | ||
| 2015 | NA | NA | 317 | 13,475 | ||
| United Memorial Medical Center North Street Campus | 2024 | 2,448 | 7,732 | 1,231 | 11,263 | |
| 2023 | 6,459 | 20,488 | 4,572 | 26,626 | ||
| 2022 | 5,551 | 18,035 | 4,541 | 29,610 | ||
| 2021 | 5,040 | 16,064 | 4,245 | 37,150 | ||
| 2020 | 4,945 | 15,144 | 3,961 | 34,640 | ||
| 2019 | 7,110 | 17,769 | 4,392 | 43,078 | ||
| 2018 | 6,466 | 18,449 | 4,375 | 44,304 | ||
| 2017 | 6,851 | 18,538 | 4,359 | 38,616 | ||
| 2016 | 6,831 | 17,613 | 4,281 | 39,472 | ||
| 2015 | 6,741 | 17,474 | 3,979 | 26,438 | ||
| Herkimer | Bassett Healthcare Herkimer | 2024 | 49 | NA | NA | 37,484 |
| 2023 | 129 | NA | NA | 87,931 | ||
| 2022 | 153 | NA | NA | 91,424 | ||
| 2021 | 231 | NA | NA | 93,414 | ||
| 2020 | 152 | NA | NA | 92,349 | ||
| 2019 | 199 | NA | NA | 88,736 | ||
| 2018 | 310 | NA | NA | 81,565 | ||
| 2017 | 327 | 23 | NA | 69,230 | ||
| 2016 | 352 | 80 | NA | 57,558 | ||
| 2015 | 534 | 57 | NA | NA | ||
| Little Falls Hospital | 2024 | 668 | 7,479 | 400 | 11,460 | |
| 2023 | 1,650 | 15,989 | 687 | 25,161 | ||
| 2022 | 1,535 | 15,134 | 592 | 27,500 | ||
| 2021 | 1,466 | 13,296 | 631 | 35,745 | ||
| 2020 | 1,400 | 11,192 | 520 | 32,476 | ||
| 2019 | 1,974 | 14,578 | 605 | 24,964 | ||
| 2018 | 1,877 | 14,622 | 675 | 21,998 | ||
| 2017 | 1,346 | 15,195 | 771 | 20,113 | ||
| 2016 | 1,309 | 15,024 | 758 | 17,470 | ||
| 2015 | 1,063 | 14,385 | 736 | 1,349 | ||
| Jefferson | Carthage Area Hospital Inc | 2024 | 615 | 4,290 | 300 | 3,994 |
| 2023 | 2,581 | 16,541 | 1,017 | 15,897 | ||
| 2022 | 2,351 | 15,369 | 1,199 | 17,190 | ||
| 2021 | 2,700 | 12,294 | 1,168 | 15,794 | ||
| 2020 | 2,162 | 10,831 | 1,082 | 12,584 | ||
| 2019 | 2,061 | 14,782 | 1,241 | 14,559 | ||
| 2018 | 1,870 | 13,929 | 1,142 | 13,540 | ||
| 2017 | 1,740 | 11,919 | 1,287 | 13,730 | ||
| 2016 | 1,921 | 10,996 | 1,351 | 14,358 | ||
| 2015 | 1,864 | 10,784 | 1,031 | 489 | ||
| North Country Orthopaedic Ambulatory Surgery Center, LLC | 2024 | 206 | NA | NA | NA | |
| 2023 | 561 | NA | NA | NA | ||
| 2022 | 1,474 | NA | NA | NA | ||
| 2021 | 1,688 | NA | NA | NA | ||
| 2020 | 1,556 | NA | NA | NA | ||
| 2019 | 1,452 | NA | NA | NA | ||
| 2018 | 1,329 | NA | NA | NA | ||
| 2017 | 1,387 | NA | NA | NA | ||
| 2016 | 1,503 | NA | NA | NA | ||
| 2015 | 1,648 | NA | NA | NA | ||
| River Hospital, Inc. | 2024 | 94 | 1,039 | 26 | 8,755 | |
| 2023 | 538 | 7,947 | 114 | 50,393 | ||
| 2022 | 457 | 8,086 | 118 | 46,737 | ||
| 2021 | 447 | 6,963 | 96 | 43,290 | ||
| 2020 | 625 | 5,510 | 72 | 39,160 | ||
| 2019 | 746 | 6,977 | 62 | 38,334 | ||
| 2018 | 574 | 7,382 | 84 | 36,758 | ||
| 2017 | 703 | 6,911 | 107 | 33,722 | ||
| 2016 | 425 | 7,633 | 77 | 27,496 | ||
| 2015 | 684 | 6,780 | 111 | 1,710 | ||
| Samaritan Medical Center | 2024 | 4,556 | 10,531 | 2,767 | 70,681 | |
| 2023 | 10,932 | 26,168 | 9,056 | 168,585 | ||
| 2022 | 9,329 | 25,435 | 9,331 | 168,083 | ||
| 2021 | 8,205 | 29,105 | 9,609 | 185,795 | ||
| 2020 | 7,378 | 28,853 | 9,585 | 147,187 | ||
| 2019 | 9,095 | 38,020 | 9,900 | 166,008 | ||
| 2018 | 9,822 | 38,222 | 10,153 | 170,233 | ||
| 2017 | 8,496 | 37,340 | 9,989 | 168,893 | ||
| 2016 | 8,184 | 42,038 | 9,798 | 155,034 | ||
| 2015 | 8,390 | 45,287 | 9,691 | 23,889 | ||
| Kings | All City Family Healthcare Center, Inc. | 2024 | 3,931 | NA | NA | 0 |
| 2023 | 12,271 | NA | NA | 7 | ||
| 2022 | 10,476 | NA | NA | 7 | ||
| 2021 | 8,664 | NA | NA | 1 | ||
| 2020 | 5,611 | NA | NA | 2 | ||
| 2019 | 7,358 | NA | NA | 2 | ||
| 2018 | 6,373 | NA | NA | NA | ||
| 2017 | 1,798 | NA | NA | NA | ||
| 2016 | 1,206 | NA | NA | NA | ||
| 2015 | 1,244 | NA | NA | NA | ||
| Bay Ridge Surgi-Center | 2024 | 0 | NA | NA | 0 | |
| 2023 | 4,104 | NA | NA | 25 | ||
| 2022 | 3,382 | NA | NA | 56 | ||
| 2021 | 3,113 | NA | NA | 60 | ||
| 2020 | 1,337 | NA | NA | 10 | ||
| 2019 | 1,184 | NA | NA | 88 | ||
| 2018 | 16 | NA | NA | NA | ||
| Brook Plaza Ambulatory Surgical Center Inc | 2024 | 5,096 | NA | NA | NA | |
| 2023 | 11,816 | NA | NA | NA | ||
| 2022 | 10,463 | NA | NA | NA | ||
| 2021 | 10,871 | NA | NA | NA | ||
| 2020 | 7,980 | NA | NA | NA | ||
| 2019 | 12,421 | NA | NA | NA | ||
| 2018 | 11,629 | NA | NA | NA | ||
| 2017 | 11,476 | NA | NA | NA | ||
| 2016 | 11,263 | NA | NA | NA | ||
| 2015 | 10,694 | NA | NA | NA | ||
| Brookdale Hospital Medical Center | 2024 | 2,051 | 23,798 | 5,531 | 89,264 | |
| 2023 | 5,719 | 62,852 | 13,157 | 210,349 | ||
| 2022 | 3,980 | 56,615 | 13,195 | 210,130 | ||
| 2021 | 1,573 | 27,930 | 12,309 | 165,608 | ||
| 2020 | 3,813 | 53,039 | 13,645 | 145,765 | ||
| 2019 | 5,390 | 62,277 | 15,179 | 127,555 | ||
| 2018 | 5,754 | 77,328 | 14,475 | 162,470 | ||
| 2017 | 5,242 | 78,798 | 14,255 | 160,713 | ||
| 2016 | 5,019 | 85,931 | 14,613 | 164,994 | ||
| 2015 | 5,050 | 84,743 | 14,910 | 124,928 | ||
| Brooklyn Eye Surgery Center | 2024 | 2,961 | NA | NA | 0 | |
| 2023 | 7,152 | NA | NA | 0 | ||
| 2022 | 7,097 | NA | NA | 2 | ||
| 2021 | 7,093 | NA | NA | 14 | ||
| 2020 | 5,145 | NA | NA | 15 | ||
| 2019 | 6,695 | NA | NA | 3 | ||
| 2018 | 6,292 | NA | NA | NA | ||
| 2017 | 5,029 | NA | NA | NA | ||
| 2016 | 5,163 | NA | NA | NA | ||
| 2015 | 5,576 | NA | NA | NA | ||
| Brooklyn Hospital Center - Downtown Campus | 2024 | 3,385 | 19,234 | 4,901 | 55,839 | |
| 2023 | 7,779 | 42,564 | 11,805 | 128,072 | ||
| 2022 | 7,517 | 39,430 | 11,417 | 132,792 | ||
| 2021 | 8,665 | 35,422 | 11,992 | 151,514 | ||
| 2020 | 6,728 | 35,502 | 11,851 | 122,709 | ||
| 2019 | 8,654 | 51,984 | 15,159 | 148,370 | ||
| 2018 | 7,427 | 56,846 | 15,289 | 140,823 | ||
| 2017 | 8,265 | 57,703 | 14,262 | 143,176 | ||
| 2016 | 8,777 | 61,808 | 13,952 | 133,235 | ||
| 2015 | 9,888 | 65,449 | 14,934 | 95,922 | ||
| Brooklyn Surgery Center | 2024 | 0 | NA | NA | NA | |
| 2023 | 0 | NA | NA | NA | ||
| 2022 | 9,088 | NA | NA | NA | ||
| 2021 | 9,862 | NA | NA | NA | ||
| 2020 | 7,844 | NA | NA | NA | ||
| 2019 | 10,278 | NA | NA | 3 | ||
| 2018 | 9,915 | NA | NA | NA | ||
| 2017 | 8,337 | NA | NA | NA | ||
| 2016 | 10,199 | NA | NA | NA | ||
| 2015 | 10,120 | NA | NA | NA | ||
| Calvary Hospital | 2024 | 0 | 0 | 189 | 0 | |
| 2023 | 0 | 0 | 343 | 0 | ||
| 2022 | 0 | 0 | 298 | 0 | ||
| Center for Community Health | 2024 | 3,709 | NA | NA | 47,956 | |
| 2023 | 9,177 | NA | NA | 96,100 | ||
| 2022 | 1 | NA | NA | NA | ||
| Endoscopic Ambulatory Specialty Center of Bay Ridge, Inc. | 2024 | 0 | NA | NA | NA | |
| 2023 | 0 | NA | NA | NA | ||
| 2022 | 0 | NA | NA | NA | ||
| 2021 | 0 | NA | NA | NA | ||
| 2017 | 508 | NA | NA | 1 | ||
| 2016 | 1,114 | NA | NA | NA | ||
| 2015 | 787 | NA | NA | NA | ||
| Endoscopic Diagnostic and Treatment Center, LLC | 2024 | 620 | NA | NA | NA | |
| 2023 | 1,579 | NA | NA | NA | ||
| 2022 | 1,577 | NA | NA | NA | ||
| 2021 | 1,350 | NA | NA | NA | ||
| 2020 | 1,121 | NA | NA | NA | ||
| 2019 | 1,913 | NA | NA | NA | ||
| 2018 | 1,799 | NA | NA | NA | ||
| 2017 | 1,756 | NA | NA | NA | ||
| 2016 | 2,172 | NA | NA | NA | ||
| 2015 | 2,054 | NA | NA | NA | ||
| Gastroenterology Care, Inc | 2024 | 1,395 | NA | NA | NA | |
| 2023 | 3,319 | NA | NA | NA | ||
| 2022 | 2,119 | NA | NA | NA | ||
| 2021 | 2,489 | NA | NA | NA | ||
| 2020 | 1,686 | NA | NA | NA | ||
| 2019 | 2,510 | NA | NA | NA | ||
| 2018 | 2,787 | NA | NA | NA | ||
| 2017 | 3,296 | NA | NA | NA | ||
| 2016 | 3,653 | NA | NA | NA | ||
| 2015 | 4,085 | NA | NA | NA | ||
| GoldStep Ambulatory Surgery Center, LLC | 2024 | 641 | NA | NA | NA | |
| 2023 | 1,708 | NA | NA | NA | ||
| 2022 | 1,570 | NA | NA | NA | ||
| 2021 | 1,489 | NA | NA | 1 | ||
| 2020 | 1,340 | NA | NA | NA | ||
| 2019 | 1,848 | NA | NA | NA | ||
| 2018 | 1,595 | NA | NA | NA | ||
| 2017 | 1,287 | NA | NA | 1 | ||
| 2016 | 764 | NA | NA | NA | ||
| 2015 | 59 | NA | NA | NA | ||
| Greater New York Endoscopy Surgical Center | 2024 | 0 | NA | NA | NA | |
| 2023 | 0 | NA | NA | NA | ||
| 2022 | 2,809 | NA | NA | NA | ||
| 2021 | 9,205 | NA | NA | NA | ||
| 2020 | 6,482 | NA | NA | NA | ||
| 2019 | 7,270 | NA | NA | NA | ||
| 2018 | 9,233 | NA | NA | NA | ||
| 2017 | 8,344 | NA | NA | NA | ||
| 2016 | 8,062 | NA | NA | NA | ||
| 2015 | 8,352 | NA | NA | NA | ||
| Interfaith Medical Center | 2024 | 947 | 12,057 | 1,477 | 25,146 | |
| 2023 | 2,282 | 30,636 | 5,589 | 61,269 | ||
| 2022 | 1,683 | 28,638 | 5,284 | 67,298 | ||
| 2021 | 1,539 | 28,380 | 6,439 | 67,072 | ||
| 2020 | 1,159 | 29,731 | 6,840 | 74,091 | ||
| 2019 | 1,878 | 35,225 | 7,534 | 84,936 | ||
| 2018 | 2,011 | 38,169 | 8,568 | 84,901 | ||
| 2017 | 1,917 | 36,656 | 8,742 | 90,243 | ||
| 2016 | 2,076 | 38,756 | 9,214 | 102,956 | ||
| 2015 | 1,700 | 32,616 | 8,698 | 109,012 | ||
| Island Ambulatory Surgery Center | 2024 | 4,926 | NA | NA | NA | |
| 2023 | 10,917 | NA | NA | NA | ||
| 2022 | 9,736 | NA | NA | NA | ||
| 2021 | 7,447 | NA | NA | NA | ||
| 2020 | 5,888 | NA | NA | NA | ||
| 2019 | 7,423 | NA | NA | NA | ||
| 2018 | 6,470 | NA | NA | NA | ||
| 2017 | 5,174 | NA | NA | 1 | ||
| 2016 | 5,082 | NA | NA | NA | ||
| 2015 | 3,206 | NA | NA | NA | ||
| Kings County Hospital Center | 2024 | 2,450 | 49,612 | 8,711 | 218,645 | |
| 2023 | 5,836 | 105,602 | 17,974 | 448,713 | ||
| 2022 | 5,986 | 100,211 | 17,567 | 552,508 | ||
| 2021 | 5,426 | 90,745 | 18,494 | 829,156 | ||
| 2020 | 4,056 | 68,451 | 17,793 | 473,377 | ||
| 2019 | 18,390 | 116,135 | 18,103 | 365,601 | ||
| 2018 | 20,104 | 120,748 | 19,570 | 396,236 | ||
| 2017 | 12,290 | 115,588 | 21,621 | 416,228 | ||
| 2016 | 10,755 | 110,974 | 22,309 | 418,305 | ||
| 2015 | 10,714 | 114,874 | 24,558 | 424,278 | ||
| Kingsbrook Jewish Medical Village | 2024 | 0 | 0 | 0 | 17,121 | |
| 2023 | 678 | 11,808 | 433 | 44,016 | ||
| 2022 | 1,076 | 13,412 | 1,151 | 42,115 | ||
| 2021 | 1,642 | 14,398 | 3,365 | 48,724 | ||
| 2020 | 1,286 | 15,427 | 6,260 | 50,611 | ||
| 2019 | 2,126 | 24,785 | 7,686 | 62,802 | ||
| 2018 | 2,170 | 26,408 | 8,000 | 60,483 | ||
| 2017 | 2,329 | 27,471 | 8,495 | 64,092 | ||
| 2016 | 2,613 | 27,523 | 8,525 | 66,029 | ||
| 2015 | 2,516 | 28,618 | 7,894 | 54,728 | ||
| Maimonides Medical Center | 2024 | 6,127 | 28,079 | 13,946 | 40,701 | |
| 2023 | 17,708 | 78,629 | 31,327 | 106,374 | ||
| 2022 | 17,600 | 77,153 | 34,679 | 93,786 | ||
| 2021 | 17,089 | 70,762 | 36,590 | 84,906 | ||
| 2020 | 13,104 | 62,336 | 35,500 | 57,803 | ||
| 2019 | 18,051 | 96,753 | 41,290 | 63,225 | ||
| 2018 | 18,345 | 98,039 | 42,047 | 62,446 | ||
| 2017 | 13,646 | 75,289 | 40,589 | 62,597 | ||
| 2016 | 16,775 | 88,762 | 42,986 | 55,137 | ||
| 2015 | 16,957 | 74,267 | 41,926 | 35,847 | ||
| Maimonides Midwood Community Hospital | 2024 | 1,414 | 7,274 | 2,093 | 1,579 | |
| 2023 | 3,200 | 20,908 | 4,497 | 3,309 | ||
| 2022 | 2,601 | 15,070 | 3,025 | 2,467 | ||
| 2021 | 1,877 | 15,211 | 5,259 | 5,774 | ||
| 2020 | 2,088 | 10,687 | 4,773 | 3,326 | ||
| 2019 | 3,506 | 14,353 | 5,895 | 1,086 | ||
| 2018 | 3,939 | 16,150 | 6,914 | 1,411 | ||
| 2017 | 4,451 | 15,900 | 6,855 | 1,386 | ||
| 2016 | 4,587 | 14,735 | 7,157 | 1,062 | ||
| 2015 | 4,184 | 12,831 | 7,093 | 5 | ||
| Moshenyat Gastroenterology Center | 2024 | 884 | NA | NA | NA | |
| 2023 | 2,374 | NA | NA | NA | ||
| 2022 | 2,355 | NA | NA | NA | ||
| 2021 | 98 | NA | NA | NA | ||
| Mount Sinai Brooklyn | 2024 | 1,253 | 3,478 | 3,821 | 4,832 | |
| 2023 | 3,251 | 28,799 | 9,164 | 15,260 | ||
| 2022 | 3,012 | 30,290 | 8,121 | 16,798 | ||
| 2021 | 2,804 | 32,496 | 7,460 | 33,787 | ||
| 2020 | 2,840 | 24,771 | 7,209 | 13,336 | ||
| 2019 | 3,732 | 26,581 | 8,418 | 12,373 | ||
| 2018 | 3,655 | 24,309 | 8,945 | 9,212 | ||
| 2017 | 3,685 | 25,637 | 9,333 | 6,863 | ||
| 2016 | 3,774 | 26,625 | 9,204 | 6,524 | ||
| 2015 | 4,011 | 27,031 | 9,840 | 3,118 | ||
| NYU Langone Brooklyn Ambulatory Surgery and Endoscopy Center | 2024 | 2,810 | NA | NA | 5 | |
| 2023 | 7,738 | NA | NA | 26 | ||
| 2022 | 7,453 | NA | NA | 17 | ||
| 2021 | 7,652 | NA | NA | 19 | ||
| 2020 | 5,872 | NA | NA | 24 | ||
| 2019 | 7,536 | NA | NA | 24 | ||
| 2018 | 7,582 | NA | NA | 15 | ||
| 2017 | 7,360 | NA | NA | 21 | ||
| 2016 | 7,135 | NA | NA | NA | ||
| 2015 | 5,842 | NA | NA | 11 | ||
| NYU Langone Hospital - Joseph S. and Diane H. Steinberg Ambulatory Care Center | 2024 | 2,634 | 17,956 | NA | 10,895 | |
| 2023 | 3,113 | 36,767 | NA | 12,732 | ||
| 2022 | 2 | 27,963 | NA | 4 | ||
| 2021 | NA | 22,883 | NA | 163 | ||
| 2020 | NA | 18,859 | NA | 108 | ||
| 2019 | NA | 25,647 | NA | 2 | ||
| 2018 | NA | 23,392 | NA | 1 | ||
| 2017 | NA | 18,900 | NA | 1 | ||
| 2016 | NA | 17,194 | NA | NA | ||
| 2015 | NA | 13,771 | NA | NA | ||
| NYU Langone Hospital-Brooklyn | 2024 | 5,470 | 29,652 | 12,571 | 28,347 | |
| 2023 | 12,499 | 78,002 | 28,314 | 70,899 | ||
| 2022 | 11,919 | 65,716 | 27,053 | 66,230 | ||
| 2021 | 11,611 | 57,395 | 25,936 | 65,557 | ||
| 2020 | 9,134 | 50,012 | 24,696 | 59,226 | ||
| 2019 | 11,641 | 68,425 | 26,970 | 77,805 | ||
| 2018 | 10,139 | 66,365 | 25,203 | 80,390 | ||
| 2017 | 7,294 | 56,283 | 24,023 | 82,686 | ||
| 2016 | 6,896 | 50,411 | 22,283 | 74,581 | ||
| 2015 | 8,273 | 52,092 | 25,379 | 58,725 | ||
| NewYork-Presbyterian Brooklyn Methodist Hospital | 2024 | 3,313 | 34,115 | 14,322 | 44,573 | |
| 2023 | 7,974 | 67,203 | 28,651 | 92,858 | ||
| 2022 | 14,480 | 69,021 | 29,259 | 195,150 | ||
| 2021 | 14,906 | 66,486 | 29,559 | 212,629 | ||
| 2020 | 12,058 | 58,619 | 30,020 | 138,528 | ||
| 2019 | 17,734 | 82,986 | 36,681 | 171,472 | ||
| 2018 | 17,431 | 83,220 | 38,003 | 125,968 | ||
| 2017 | 16,321 | 82,553 | 38,248 | 109,194 | ||
| 2016 | 16,973 | 82,526 | 40,242 | 97,229 | ||
| 2015 | 17,289 | 77,687 | 40,050 | 55,029 | ||
| PBGS, LLC | 2024 | 2,337 | NA | NA | NA | |
| 2023 | 6,240 | NA | NA | NA | ||
| 2022 | 7,069 | NA | NA | NA | ||
| 2021 | 7,331 | NA | NA | NA | ||
| 2020 | 5,618 | NA | NA | 2 | ||
| 2019 | 5,814 | NA | NA | NA | ||
| 2018 | 6,693 | NA | NA | 1 | ||
| 2017 | 6,463 | NA | NA | NA | ||
| 2016 | 6,078 | NA | NA | NA | ||
| 2015 | 5,910 | NA | NA | NA | ||
| Performance Surgical Center | 2024 | 0 | NA | NA | NA | |
| 2023 | 31 | NA | NA | NA | ||
| 2022 | 326 | NA | NA | NA | ||
| 2021 | 104 | NA | NA | NA | ||
| 2020 | 191 | NA | NA | NA | ||
| 2019 | 372 | NA | NA | NA | ||
| 2018 | 276 | NA | NA | NA | ||
| 2017 | 339 | NA | NA | NA | ||
| 2016 | 316 | NA | NA | NA | ||
| 2015 | 403 | NA | NA | NA | ||
| Sheepshead Bay Surgery Center | 2024 | 2,002 | NA | NA | NA | |
| 2023 | 4,990 | NA | NA | NA | ||
| 2022 | 5,039 | NA | NA | NA | ||
| 2021 | 4,922 | NA | NA | NA | ||
| 2020 | 3,408 | NA | NA | NA | ||
| 2019 | 4,903 | NA | NA | NA | ||
| 2018 | 4,736 | NA | NA | NA | ||
| 2017 | 4,827 | NA | NA | NA | ||
| 2016 | 4,981 | NA | NA | NA | ||
| 2015 | 5,005 | NA | NA | NA | ||
| South Brooklyn Endoscopy Center | 2024 | 7,686 | NA | NA | NA | |
| 2023 | 15,989 | NA | NA | NA | ||
| 2022 | 14,848 | NA | NA | NA | ||
| 2021 | 14,271 | NA | NA | NA | ||
| 2020 | 9,810 | NA | NA | NA | ||
| 2019 | 14,629 | NA | NA | NA | ||
| 2018 | 16,353 | NA | NA | NA | ||
| 2017 | 14,711 | NA | NA | NA | ||
| 2016 | 14,643 | NA | NA | NA | ||
| 2015 | 12,278 | NA | NA | NA | ||
| South Brooklyn Health | 2024 | 3,064 | 38,608 | 6,737 | 109,644 | |
| 2023 | 6,053 | 79,308 | 13,978 | 231,866 | ||
| 2022 | 5,743 | 72,917 | 13,024 | 355,699 | ||
| 2021 | 6,601 | 61,647 | 12,215 | 676,717 | ||
| 2020 | 4,317 | 49,668 | 11,634 | 287,552 | ||
| 2019 | 5,922 | 70,858 | 13,420 | 214,542 | ||
| 2018 | 4,477 | 70,522 | 14,224 | 230,600 | ||
| 2017 | 4,576 | 68,822 | 14,282 | 237,151 | ||
| 2016 | 5,048 | 74,704 | 14,875 | 246,318 | ||
| 2015 | 4,712 | 71,285 | 15,002 | 221,641 | ||
| Surgery of Tomorrow | 2024 | 355 | NA | NA | NA | |
| 2023 | 760 | NA | NA | NA | ||
| 2022 | 670 | NA | NA | NA | ||
| 2021 | 609 | NA | NA | NA | ||
| 2018 | 1 | NA | NA | NA | ||
| 2017 | 120 | NA | NA | NA | ||
| SurgiCare of Brooklyn | 2024 | 3,323 | NA | NA | NA | |
| 2023 | 5,692 | NA | NA | NA | ||
| 2022 | 6,920 | NA | NA | NA | ||
| 2021 | 3,860 | NA | NA | NA | ||
| 2020 | 4,666 | NA | NA | NA | ||
| 2019 | 2,802 | NA | NA | NA | ||
| 2018 | 1,834 | NA | NA | NA | ||
| 2017 | 2,090 | NA | NA | NA | ||
| 2016 | 1,317 | NA | NA | NA | ||
| 2015 | 864 | NA | NA | NA | ||
| University Hospital of Brooklyn | 2024 | 1,107 | 10,545 | 2,845 | 22,395 | |
| 2023 | 4,201 | 37,021 | 7,244 | 74,024 | ||
| 2022 | 3,807 | 36,546 | 7,209 | 64,111 | ||
| 2021 | 4,114 | 31,803 | 7,669 | 67,596 | ||
| 2020 | 3,425 | 26,074 | 7,097 | 60,237 | ||
| 2019 | 6,411 | 39,569 | 9,196 | 81,273 | ||
| 2018 | 5,362 | 44,670 | 10,032 | 75,551 | ||
| 2017 | 4,920 | 42,974 | 11,227 | 65,462 | ||
| 2016 | 4,809 | 44,410 | 12,241 | 65,819 | ||
| 2015 | 4,850 | 45,465 | 13,425 | 61,032 | ||
| University Hospital of Brooklyn - SUNY Downstate at Bay Ridge | 2024 | 465 | NA | NA | 32 | |
| 2023 | 1,249 | NA | NA | 54 | ||
| 2022 | 1,123 | NA | NA | 56 | ||
| 2021 | 1,081 | NA | NA | 15 | ||
| 2020 | 663 | NA | NA | 18 | ||
| 2019 | 108 | NA | NA | 4 | ||
| 2018 | 1,720 | 1 | NA | 2,450 | ||
| 2017 | 2,929 | NA | NA | 3,519 | ||
| 2016 | 3,131 | 627 | NA | 4,422 | ||
| 2015 | 3,292 | 5,277 | NA | 65 | ||
| Woodhull Medical & Mental Health Center | 2024 | 3,021 | 36,745 | 3,943 | 132,176 | |
| 2023 | 5,126 | 73,182 | 8,215 | 259,494 | ||
| 2022 | 4,342 | 73,124 | 9,370 | 294,396 | ||
| 2021 | 4,788 | 63,867 | 9,024 | 393,612 | ||
| 2020 | 2,720 | 58,912 | 9,011 | 234,735 | ||
| 2019 | 4,864 | 82,179 | 10,660 | 238,951 | ||
| 2018 | 8,752 | 84,844 | 10,698 | 239,731 | ||
| 2017 | 6,798 | 86,013 | 11,108 | 271,233 | ||
| 2016 | 5,890 | 90,693 | 12,044 | 314,467 | ||
| 2015 | 6,653 | 96,084 | 12,190 | 317,259 | ||
| Wyckoff Heights Medical Center | 2024 | 1,871 | 23,092 | 3,993 | 62,175 | |
| 2023 | 5,057 | 71,817 | 12,163 | 177,099 | ||
| 2022 | 4,889 | 69,009 | 11,610 | 206,753 | ||
| 2021 | 4,488 | 58,008 | 11,675 | 211,047 | ||
| 2020 | 3,115 | 61,275 | 10,763 | 162,407 | ||
| 2019 | 4,813 | 74,632 | 11,629 | 177,757 | ||
| 2018 | 4,660 | 76,155 | 12,666 | 176,481 | ||
| 2017 | 5,170 | 71,963 | 13,625 | 151,769 | ||
| 2016 | 6,578 | 73,602 | 13,741 | 146,840 | ||
| 2015 | 6,111 | 75,670 | 13,310 | 133,515 | ||
| Lewis | Lewis County General Hospital | 2024 | 454 | 2,399 | 213 | 15,986 |
| 2023 | 1,469 | 9,997 | 789 | 54,101 | ||
| 2022 | 1,225 | 9,526 | 802 | 49,125 | ||
| 2021 | 1,241 | 8,958 | 1,296 | 55,526 | ||
| 2020 | 1,191 | 8,204 | 1,262 | 53,356 | ||
| 2019 | 1,351 | 9,811 | 1,478 | 44,770 | ||
| 2018 | 1,328 | 9,554 | 1,283 | 32,669 | ||
| 2017 | 1,195 | 9,755 | 1,278 | 32,208 | ||
| 2016 | 1,271 | 10,389 | 1,411 | 32,304 | ||
| 2015 | 1,257 | 10,273 | 1,418 | 5,958 | ||
| Livingston | Nicholas H. Noyes Memorial Hospital | 2024 | 2,001 | 6,656 | 1,244 | 29,160 |
| 2023 | 3,634 | 13,157 | 2,191 | 65,868 | ||
| 2022 | 3,096 | 12,128 | 2,287 | 74,447 | ||
| 2021 | 2,592 | 11,522 | 2,406 | 76,431 | ||
| 2020 | 2,375 | 10,398 | 2,140 | 61,765 | ||
| 2019 | 2,945 | 13,436 | 2,159 | 66,625 | ||
| 2018 | 2,973 | 12,922 | 2,346 | 64,891 | ||
| 2017 | 2,939 | 13,114 | 2,403 | 62,385 | ||
| 2016 | 2,968 | 12,343 | 2,371 | 70,546 | ||
| 2015 | 2,902 | 12,963 | 2,295 | 19,473 | ||
| Madison | Community Memorial Hospital Inc | 2024 | 931 | 4,804 | 310 | 17,835 |
| 2023 | 2,279 | 11,483 | 759 | 36,214 | ||
| 2022 | 1,880 | 11,303 | 1,052 | 37,979 | ||
| 2021 | 1,581 | 9,063 | 957 | 39,639 | ||
| 2020 | 1,324 | 7,366 | 738 | 32,588 | ||
| 2019 | 1,480 | 10,523 | 1,199 | 34,147 | ||
| 2018 | 1,503 | 9,816 | 1,187 | 30,291 | ||
| 2017 | 1,624 | 9,157 | 1,444 | 30,653 | ||
| 2016 | 1,748 | 9,199 | 1,404 | 27,768 | ||
| 2015 | 2,232 | 8,940 | 1,433 | 3,769 | ||
| Oneida Health Hospital | 2024 | 3,287 | 9,170 | 1,138 | 13,272 | |
| 2023 | 7,340 | 21,234 | 2,673 | 40,494 | ||
| 2022 | 6,722 | 21,438 | 2,767 | 37,884 | ||
| 2021 | 6,402 | 19,479 | 3,242 | 47,249 | ||
| 2020 | 5,018 | 16,618 | 2,933 | 44,236 | ||
| 2019 | 5,491 | 19,764 | 2,810 | 32,301 | ||
| 2018 | 6,126 | 20,395 | 3,011 | 25,766 | ||
| 2017 | 6,277 | 21,056 | 2,975 | 22,762 | ||
| 2016 | 6,379 | 21,499 | 3,153 | 28,925 | ||
| 2015 | 7,320 | 22,983 | 3,279 | 2,654 | ||
| Monroe | Brighton Surgery Center,LLC | 2024 | 3,187 | NA | NA | NA |
| 2023 | 6,984 | NA | NA | NA | ||
| 2022 | 7,182 | NA | NA | NA | ||
| 2021 | 9,532 | NA | NA | NA | ||
| 2020 | 8,968 | NA | NA | NA | ||
| 2019 | 11,324 | NA | NA | NA | ||
| 2018 | 7,861 | NA | NA | NA | ||
| 2017 | 4,793 | NA | NA | 5 | ||
| 2016 | 6,170 | NA | NA | NA | ||
| 2015 | 6,134 | NA | NA | 16 | ||
| Cornerstone Surgery Center | 2024 | 2,359 | NA | NA | NA | |
| 2023 | 4,989 | NA | NA | NA | ||
| 2022 | 4,416 | NA | NA | NA | ||
| 2021 | 1,036 | NA | NA | NA | ||
| Highland Hospital | 2024 | 8,926 | 17,364 | 8,330 | 14,029 | |
| 2023 | 16,681 | 32,405 | 16,967 | 42,153 | ||
| 2022 | 14,325 | 28,832 | 17,721 | 51,052 | ||
| 2021 | 13,435 | 31,606 | 18,591 | 51,809 | ||
| 2020 | 10,946 | 27,506 | 19,274 | 48,678 | ||
| 2019 | 12,397 | 35,206 | 20,715 | 100,275 | ||
| 2018 | 11,739 | 36,060 | 19,034 | 61,864 | ||
| 2017 | 10,488 | 32,798 | 19,058 | 89,278 | ||
| 2016 | 11,751 | 35,061 | 18,697 | 30,772 | ||
| 2015 | 10,809 | 33,472 | 18,810 | 28,957 | ||
| Linden Surgery Center | 2024 | 2,127 | NA | NA | NA | |
| 2023 | 8,938 | NA | NA | NA | ||
| 2022 | 9,031 | NA | NA | NA | ||
| 2021 | 8,778 | NA | NA | NA | ||
| 2020 | 7,155 | NA | NA | NA | ||
| 2019 | 10,146 | NA | NA | NA | ||
| 2018 | 11,482 | NA | NA | NA | ||
| 2017 | 7,171 | NA | NA | NA | ||
| 2016 | 5,410 | NA | NA | NA | ||
| 2015 | 6,033 | NA | NA | NA | ||
| Lindsay House Surgery Center, LLC | 2024 | 482 | NA | NA | NA | |
| 2023 | 986 | NA | NA | NA | ||
| 2022 | 1,012 | NA | NA | NA | ||
| 2021 | 1,073 | NA | NA | NA | ||
| 2020 | 814 | NA | NA | NA | ||
| 2019 | 760 | NA | NA | NA | ||
| 2018 | 868 | NA | NA | NA | ||
| 2017 | 672 | NA | NA | NA | ||
| 2016 | 607 | NA | NA | NA | ||
| 2015 | 545 | NA | NA | NA | ||
| Outpatient Extension Clinic | 2024 | 3,014 | NA | NA | 29,778 | |
| 2023 | 4,803 | NA | NA | 23,171 | ||
| Rochester General Hospital | 2024 | 10,039 | 30,265 | 9,864 | 78,365 | |
| 2023 | 22,872 | 72,828 | 27,773 | 176,938 | ||
| 2022 | 17,162 | 73,848 | 26,877 | 198,414 | ||
| 2021 | 19,963 | 74,910 | 29,870 | 251,971 | ||
| 2020 | 17,209 | 83,574 | 29,164 | 202,410 | ||
| 2019 | 24,735 | 98,796 | 32,450 | 229,161 | ||
| 2018 | 24,519 | 99,653 | 32,815 | 233,920 | ||
| 2017 | 28,088 | 105,709 | 33,234 | 296,583 | ||
| 2016 | 27,232 | 104,928 | 31,843 | 396,792 | ||
| 2015 | 27,230 | 102,187 | 29,842 | 143,267 | ||
| Rochester Surgery Center | 2024 | 2,004 | NA | NA | NA | |
| 2023 | 7,957 | NA | NA | NA | ||
| 2022 | 8,484 | NA | NA | NA | ||
| 2021 | 8,246 | NA | NA | NA | ||
| 2020 | 6,485 | NA | NA | NA | ||
| 2019 | 7,224 | NA | NA | NA | ||
| 2018 | 7,289 | NA | NA | NA | ||
| 2017 | 7,413 | NA | NA | NA | ||
| 2016 | 5,182 | NA | NA | NA | ||
| 2015 | 4,943 | NA | NA | NA | ||
| Strong Memorial Hospital | 2024 | 15,781 | 42,428 | 20,213 | 113,450 | |
| 2023 | 30,349 | 86,058 | 41,240 | 506,059 | ||
| 2022 | 29,939 | 76,936 | 39,922 | 793,519 | ||
| 2021 | 26,483 | 77,161 | 41,775 | 797,896 | ||
| 2020 | 22,806 | 68,788 | 39,327 | 750,049 | ||
| 2019 | 30,071 | 82,481 | 41,066 | 852,190 | ||
| 2018 | 29,466 | 82,972 | 41,940 | 670,053 | ||
| 2017 | 29,767 | 83,934 | 43,314 | 247,854 | ||
| 2016 | 31,432 | 84,640 | 41,693 | 280,922 | ||
| 2015 | 30,009 | 78,893 | 38,732 | 123,523 | ||
| The Unity Hospital of Rochester | 2024 | 6,309 | 14,407 | 6,549 | 18,584 | |
| 2023 | 15,059 | 35,495 | 18,813 | 44,030 | ||
| 2022 | 12,963 | 35,031 | 16,712 | 50,697 | ||
| 2021 | 11,654 | 32,832 | 18,375 | 52,693 | ||
| 2020 | 11,078 | 34,319 | 18,583 | 44,068 | ||
| 2019 | 13,118 | 40,370 | 19,899 | 49,826 | ||
| 2018 | 12,376 | 40,560 | 19,034 | 58,509 | ||
| 2017 | 13,567 | 44,749 | 17,184 | 37,035 | ||
| 2016 | 14,648 | 46,784 | 17,380 | 19,263 | ||
| 2015 | 16,114 | 44,744 | 17,238 | 15,124 | ||
| URMC Ambulatory Center | 2024 | 7,721 | 3 | NA | 7,077 | |
| 2023 | 13,827 | 6 | NA | 13,933 | ||
| 2022 | 15,804 | 3 | NA | 14,806 | ||
| 2021 | 13,247 | NA | NA | 14,087 | ||
| 2020 | 11,386 | 2 | NA | 11,839 | ||
| 2019 | 17,008 | 2 | NA | 13,416 | ||
| 2018 | 15,643 | NA | NA | 12,159 | ||
| 2017 | 15,871 | NA | NA | 9,424 | ||
| 2016 | 17,436 | NA | NA | 7,264 | ||
| 2015 | 16,576 | NA | NA | 4,155 | ||
| URMC Strong West | 2024 | 1,676 | 11,972 | NA | 13,862 | |
| 2023 | 3,505 | 22,291 | NA | 29,882 | ||
| 2022 | 2,688 | 20,006 | NA | 30,778 | ||
| 2021 | 2,805 | 16,855 | NA | 36,517 | ||
| 2020 | 1,699 | 12,918 | NA | 27,926 | ||
| 2019 | 2,086 | 16,624 | NA | 27,422 | ||
| 2018 | 1,863 | 16,023 | NA | 24,394 | ||
| 2017 | 1,441 | 15,518 | NA | 23,622 | ||
| 2016 | 684 | 14,941 | NA | 17,625 | ||
| 2015 | 389 | 13,679 | NA | 5,708 | ||
| Unity Specialty Hospital | 2024 | NA | 0 | 146 | 0 | |
| 2023 | NA | 0 | 401 | 0 | ||
| 2022 | NA | 0 | 334 | 0 | ||
| 2021 | NA | 4 | 452 | 4,153 | ||
| 2020 | NA | NA | 468 | 26,993 | ||
| 2019 | NA | 2 | 482 | 29,692 | ||
| 2018 | NA | 18 | 431 | 27,560 | ||
| 2017 | 1 | 847 | 497 | 24,733 | ||
| 2016 | NA | 1,093 | 580 | 34,967 | ||
| 2015 | NA | 1,341 | 592 | 33,866 | ||
| Westfall Surgery Center | 2024 | 2,280 | NA | NA | NA | |
| 2023 | 7,173 | NA | NA | NA | ||
| 2022 | 10,439 | NA | NA | NA | ||
| 2021 | 7,951 | NA | NA | NA | ||
| 2020 | 6,612 | NA | NA | NA | ||
| 2019 | 6,990 | NA | NA | NA | ||
| 2018 | 11,012 | NA | NA | NA | ||
| 2017 | 13,532 | NA | NA | NA | ||
| 2016 | 13,753 | NA | NA | NA | ||
| 2015 | 15,292 | NA | NA | NA | ||
| Montgomery | Mohawk Valley Eye Surgery Center | 2024 | 172 | NA | NA | NA |
| 2023 | 570 | NA | NA | NA | ||
| 2022 | 761 | NA | NA | NA | ||
| 2021 | 834 | NA | NA | NA | ||
| 2020 | 745 | NA | NA | NA | ||
| 2019 | 1,005 | NA | NA | NA | ||
| 2018 | 1,100 | NA | NA | NA | ||
| 2017 | 1,297 | NA | NA | NA | ||
| 2016 | 1,271 | NA | NA | NA | ||
| 2015 | 1,223 | NA | NA | NA | ||
| St. Mary’s Healthcare | 2024 | 1,693 | 11,758 | 1,235 | 28,772 | |
| 2023 | 6,178 | 32,039 | 3,483 | 90,301 | ||
| 2022 | 388 | 1,231 | 3,080 | 11,987 | ||
| 2021 | 5,629 | 18,377 | 3,668 | 137,052 | ||
| 2020 | 5,190 | 17,010 | 4,078 | 138,740 | ||
| 2019 | 6,991 | 23,612 | 4,923 | 142,537 | ||
| 2018 | 8,465 | 26,983 | 5,562 | 160,120 | ||
| 2017 | 7,468 | 24,279 | 6,078 | 157,146 | ||
| 2016 | 8,530 | 27,385 | 6,615 | 161,483 | ||
| 2015 | 6,425 | 26,771 | 6,731 | 34,437 | ||
| St. Mary’s Healthcare - Amsterdam Memorial Campus | 2024 | NA | 3,760 | 81 | 30,962 | |
| 2023 | NA | 9,307 | 293 | 93,792 | ||
| 2022 | NA | 583 | 132 | 1,080 | ||
| 2021 | 1 | 17,540 | 127 | 19,990 | ||
| 2020 | 3 | 15,773 | 125 | 16,777 | ||
| 2019 | 1 | 22,867 | 154 | 21,294 | ||
| 2018 | 1 | 22,021 | 192 | 20,283 | ||
| 2017 | NA | 24,407 | 183 | 18,248 | ||
| 2016 | NA | 24,679 | 166 | 17,102 | ||
| 2015 | NA | 18,897 | 196 | 16,361 | ||
| Nassau | Day OP of North Nassau Inc | 2024 | 0 | NA | NA | NA |
| 2023 | 0 | NA | NA | NA | ||
| 2022 | 0 | NA | NA | NA | ||
| 2021 | 0 | NA | NA | NA | ||
| 2017 | 390 | NA | NA | NA | ||
| 2016 | 1,138 | NA | NA | NA | ||
| 2015 | 957 | NA | NA | NA | ||
| East Hills Surgery Center | 2024 | 1,418 | NA | NA | NA | |
| 2023 | 5,909 | NA | NA | NA | ||
| 2022 | 5,559 | NA | NA | NA | ||
| 2021 | 4,886 | NA | NA | NA | ||
| 2020 | 3,964 | NA | NA | NA | ||
| 2019 | 3,001 | NA | NA | NA | ||
| 2018 | 1,678 | NA | NA | NA | ||
| Endoscopy Center of Long Island, LLC | 2024 | 5,216 | NA | NA | NA | |
| 2023 | 10,712 | NA | NA | NA | ||
| 2022 | 9,742 | NA | NA | NA | ||
| 2021 | 8,696 | NA | NA | NA | ||
| 2020 | 6,874 | NA | NA | NA | ||
| 2019 | 8,547 | NA | NA | NA | ||
| 2018 | 8,017 | NA | NA | NA | ||
| 2017 | 7,250 | NA | NA | NA | ||
| 2016 | 8,154 | NA | NA | NA | ||
| 2015 | 7,206 | NA | NA | NA | ||
| Garden City Surgi Center | 2024 | 3,162 | NA | NA | NA | |
| 2023 | 7,238 | NA | NA | NA | ||
| 2022 | 7,127 | NA | NA | NA | ||
| 2021 | 7,066 | NA | NA | NA | ||
| 2020 | 5,628 | NA | NA | NA | ||
| 2019 | 7,109 | NA | NA | NA | ||
| 2018 | 7,524 | NA | NA | NA | ||
| 2017 | 7,466 | NA | NA | NA | ||
| 2016 | 6,728 | NA | NA | NA | ||
| 2015 | 6,101 | NA | NA | NA | ||
| Glen Cove Hospital | 2024 | 3,616 | 11,112 | 4,166 | 26,552 | |
| 2023 | 9,894 | 32,116 | 11,436 | 78,288 | ||
| 2022 | 8,070 | 32,170 | 10,752 | 75,276 | ||
| 2021 | 6,242 | 32,482 | 9,808 | 71,826 | ||
| 2020 | 4,572 | 23,628 | 9,180 | 54,806 | ||
| 2019 | 11,308 | 58,852 | 18,392 | 138,728 | ||
| 2018 | 11,856 | 59,896 | 18,520 | 150,804 | ||
| 2017 | 11,540 | 59,412 | 18,604 | 129,544 | ||
| 2016 | 9,840 | 60,488 | 17,852 | 144,300 | ||
| 2015 | 6,216 | 60,820 | 16,068 | 81,436 | ||
| HSS Long Island Outpatient Center | 2024 | 958 | NA | NA | 13,682 | |
| 2023 | 1,911 | NA | NA | 24,482 | ||
| 2022 | 1,549 | NA | NA | 20,619 | ||
| 2021 | 1,008 | NA | NA | 14,524 | ||
| 2020 | 794 | NA | NA | 10,571 | ||
| 2019 | 935 | NA | NA | 10,064 | ||
| 2018 | 954 | NA | NA | 8,832 | ||
| 2017 | 924 | NA | 1 | 8,495 | ||
| 2016 | 868 | NA | NA | 7,316 | ||
| 2015 | 910 | NA | NA | NA | ||
| Island Eye Surgicenter LLC | 2024 | 8,415 | NA | NA | 73 | |
| 2023 | 18,812 | NA | NA | 235 | ||
| 2022 | 18,873 | NA | NA | 173 | ||
| 2021 | 17,210 | NA | NA | 157 | ||
| 2020 | 11,290 | NA | NA | 147 | ||
| 2019 | 16,538 | NA | NA | 231 | ||
| 2018 | 15,180 | NA | NA | 162 | ||
| 2017 | 12,755 | NA | NA | NA | ||
| 2016 | 10,741 | NA | NA | NA | ||
| 2015 | 10,500 | NA | NA | NA | ||
| LIJ Center for Advanced Medicine | 2024 | 4,008 | NA | NA | 90,406 | |
| 2023 | 12,104 | NA | NA | 269,062 | ||
| 2022 | 12,372 | NA | NA | 262,938 | ||
| 2021 | 11,770 | 4 | NA | 254,428 | ||
| 2020 | 9,198 | NA | NA | 223,608 | ||
| 2019 | 24,852 | 16 | NA | 518,028 | ||
| 2018 | 26,504 | 4 | NA | 461,508 | ||
| 2017 | 26,424 | NA | NA | 438,752 | ||
| 2016 | 28,196 | NA | NA | 421,864 | ||
| 2015 | 29,364 | NA | NA | 195,684 | ||
| Long Island Center for Digestive Health, LLC | 2024 | 3,076 | NA | NA | NA | |
| 2023 | 5,877 | NA | NA | NA | ||
| 2022 | 5,497 | NA | NA | NA | ||
| 2021 | 5,605 | NA | NA | NA | ||
| 2020 | 4,267 | NA | NA | NA | ||
| 2019 | 6,508 | NA | NA | NA | ||
| 2018 | 6,058 | NA | NA | NA | ||
| 2017 | 5,663 | NA | NA | NA | ||
| 2016 | 5,857 | NA | NA | NA | ||
| 2015 | 6,001 | NA | NA | NA | ||
| Long Island Jewish Valley Stream | 2024 | 1,792 | 21,834 | 6,930 | 3,208 | |
| 2023 | 5,088 | 63,000 | 20,322 | 10,342 | ||
| 2022 | 6,698 | 62,394 | 19,290 | 10,126 | ||
| 2021 | 6,710 | 60,028 | 18,308 | 9,930 | ||
| 2020 | 5,192 | 46,732 | 17,802 | 7,192 | ||
| 2019 | 13,128 | 124,252 | 40,108 | 22,244 | ||
| 2018 | 12,844 | 123,652 | 39,284 | 23,588 | ||
| 2017 | 14,468 | 122,704 | 34,520 | 24,932 | ||
| 2016 | 16,104 | 126,628 | 35,836 | 23,760 | ||
| 2015 | 17,660 | 135,748 | 35,408 | 21,628 | ||
| Lynbrook Surgery Center | 2024 | 2,399 | NA | NA | NA | |
| 2023 | 6,436 | NA | NA | NA | ||
| 2022 | 5,689 | NA | NA | NA | ||
| 2021 | 6,207 | NA | NA | NA | ||
| 2020 | 5,647 | NA | NA | NA | ||
| 2019 | 7,325 | NA | NA | NA | ||
| 2018 | 7,227 | NA | NA | NA | ||
| 2017 | 7,419 | NA | NA | NA | ||
| 2016 | 7,930 | NA | NA | NA | ||
| 2015 | 5,684 | NA | NA | NA | ||
| Meadowbrook Endoscopy Center | 2024 | 3,402 | NA | NA | NA | |
| 2023 | 8,502 | NA | NA | NA | ||
| 2022 | 8,595 | NA | NA | NA | ||
| 2021 | 9,553 | NA | NA | NA | ||
| 2020 | 7,850 | NA | NA | NA | ||
| 2019 | 10,088 | NA | NA | NA | ||
| 2018 | 9,403 | NA | NA | NA | ||
| 2017 | 9,060 | NA | NA | NA | ||
| 2016 | 8,581 | NA | NA | NA | ||
| 2015 | 8,044 | NA | NA | NA | ||
| Mercy Hospital | 2024 | 2,528 | 6,247 | 2,762 | 13,299 | |
| 2023 | 10,433 | 25,693 | 11,618 | 51,728 | ||
| 2022 | 9,491 | 26,386 | 11,307 | 47,960 | ||
| 2021 | 9,365 | 26,325 | 10,494 | 45,787 | ||
| 2020 | 7,389 | 20,676 | 10,365 | 39,468 | ||
| 2019 | 7,071 | 27,556 | 11,349 | 26,583 | ||
| 2018 | 6,883 | 29,211 | 11,371 | 24,047 | ||
| 2017 | 6,613 | 30,278 | 10,864 | 20,495 | ||
| 2016 | 6,844 | 31,081 | 10,579 | 20,416 | ||
| 2015 | 7,245 | 31,969 | 11,172 | 5,943 | ||
| Mount Sinai South Nassau | 2024 | 5,374 | 14,910 | 7,115 | 25,960 | |
| 2023 | 15,462 | 43,795 | 20,059 | 78,598 | ||
| 2022 | 15,772 | 41,994 | 19,972 | 83,526 | ||
| 2021 | 14,782 | 39,733 | 20,784 | 100,906 | ||
| 2020 | 11,518 | 36,192 | 19,271 | 72,575 | ||
| 2019 | 13,943 | 49,902 | 21,647 | 51,220 | ||
| 2018 | 13,497 | 46,932 | 21,272 | 48,409 | ||
| 2017 | 19,951 | 77,103 | 21,707 | 112,651 | ||
| 2016 | 8,196 | 44,234 | 21,965 | 82,544 | ||
| 2015 | 10,196 | 48,162 | 21,461 | 90,392 | ||
| NYU Langone Hospital -Long Island Ambulatory Surgery Center | 2024 | 2,779 | NA | NA | 3,565 | |
| 2023 | 6,065 | NA | NA | 8,533 | ||
| 2022 | 6,181 | NA | NA | 8,063 | ||
| 2021 | 5,795 | 1 | NA | 7,408 | ||
| 2020 | 4,416 | NA | NA | 6,905 | ||
| 2019 | 6,809 | NA | NA | 17,520 | ||
| 2018 | 6,575 | NA | NA | 17 | ||
| 2017 | 6,300 | NA | NA | 52 | ||
| 2016 | 5,559 | NA | NA | 1,152 | ||
| 2015 | 4,924 | NA | NA | 145 | ||
| NYU Langone Hospital-Long Island | 2024 | 10,633 | 24,957 | 16,663 | 29,349 | |
| 2023 | 22,060 | 55,537 | 36,627 | 71,591 | ||
| 2022 | 20,033 | 52,976 | 35,364 | 64,802 | ||
| 2021 | 18,710 | 47,314 | 35,532 | 62,725 | ||
| 2020 | 15,491 | 40,095 | 33,172 | 61,852 | ||
| 2019 | 19,388 | 59,420 | 37,622 | 50,181 | ||
| 2018 | 18,435 | 59,825 | 36,799 | 41,265 | ||
| 2017 | 17,231 | 57,031 | 36,543 | 41,812 | ||
| 2016 | 18,129 | 55,204 | 35,847 | 51,087 | ||
| 2015 | 18,088 | 53,207 | 34,951 | 11,167 | ||
| Nassau University Medical Center | 2024 | 1,670 | 18,365 | 7,336 | 49,784 | |
| 2023 | 3,306 | 46,480 | 15,321 | 105,565 | ||
| 2022 | 3,805 | 46,654 | 16,486 | 110,431 | ||
| 2021 | 3,608 | 41,083 | 17,227 | 156,200 | ||
| 2020 | 2,598 | 33,928 | 16,579 | 107,878 | ||
| 2019 | 3,669 | 43,532 | 18,793 | 121,233 | ||
| 2018 | 3,173 | 39,723 | 18,827 | 120,507 | ||
| 2017 | 3,897 | 49,437 | 18,059 | 125,215 | ||
| 2016 | 4,051 | 50,257 | 18,896 | 122,389 | ||
| 2015 | 4,764 | 50,015 | 19,273 | 120,394 | ||
| New Hyde Park Endoscopy | 2024 | 1,040 | NA | NA | NA | |
| 2023 | 12,404 | NA | NA | NA | ||
| 2022 | 7,676 | NA | NA | NA | ||
| 2021 | 6,350 | NA | NA | NA | ||
| 2020 | 4,859 | NA | NA | NA | ||
| 2019 | 4,900 | NA | NA | NA | ||
| 2018 | 2,323 | NA | NA | NA | ||
| 2017 | 67 | NA | NA | NA | ||
| North Shore University Hospital | 2024 | 22,352 | 29,878 | 32,170 | 254,422 | |
| 2023 | 66,670 | 88,602 | 98,592 | 719,258 | ||
| 2022 | 63,110 | 88,446 | 97,714 | 676,434 | ||
| 2021 | 61,782 | 84,614 | 99,096 | 672,742 | ||
| 2020 | 28,824 | 76,500 | 91,732 | 519,978 | ||
| 2019 | 74,860 | 209,544 | 211,320 | 1,217,556 | ||
| 2018 | 75,472 | 220,436 | 202,472 | 1,174,904 | ||
| 2017 | 74,596 | 219,976 | 193,684 | 1,150,392 | ||
| 2016 | 71,960 | 215,108 | 195,748 | 1,051,060 | ||
| 2015 | 76,572 | 224,636 | 191,156 | 532,516 | ||
| Plainview Hospital | 2024 | 4,362 | 14,510 | 6,114 | 13,470 | |
| 2023 | 13,170 | 45,860 | 16,396 | 37,312 | ||
| 2022 | 11,828 | 43,750 | 15,572 | 36,396 | ||
| 2021 | 13,056 | 40,510 | 15,136 | 39,938 | ||
| 2020 | 10,852 | 32,624 | 15,834 | 35,206 | ||
| 2019 | 29,376 | 92,416 | 33,252 | 85,832 | ||
| 2018 | 28,700 | 93,692 | 33,368 | 85,980 | ||
| 2017 | 27,468 | 95,460 | 33,828 | 88,764 | ||
| 2016 | 26,596 | 96,464 | 34,152 | 82,612 | ||
| 2015 | 23,676 | 94,592 | 33,532 | 69,820 | ||
| Pro Health Ambulatory Surgery Center, LLC | 2024 | 0 | NA | NA | NA | |
| 2023 | 0 | NA | NA | NA | ||
| 2022 | 0 | NA | NA | NA | ||
| 2021 | 0 | NA | NA | NA | ||
| 2020 | 3,299 | NA | NA | NA | ||
| 2018 | 1,462 | NA | NA | NA | ||
| 2017 | 6,437 | NA | NA | NA | ||
| 2016 | 6,001 | NA | NA | NA | ||
| 2015 | 6,503 | NA | NA | NA | ||
| ProHEALTH Day Op Ambulatory Surgery Center | 2024 | 0 | NA | NA | NA | |
| 2023 | 0 | NA | NA | NA | ||
| 2022 | 0 | NA | NA | NA | ||
| 2021 | 0 | NA | NA | NA | ||
| 2020 | 2,380 | NA | NA | NA | ||
| 2018 | 542 | NA | NA | NA | ||
| 2017 | 1,861 | NA | NA | NA | ||
| 2016 | 2,605 | NA | NA | NA | ||
| 2015 | 2,903 | NA | NA | NA | ||
| Renal Focus ASC Plainview | 2024 | 1,324 | NA | NA | NA | |
| 2023 | 2,734 | NA | NA | NA | ||
| 2022 | 535 | NA | NA | NA | ||
| South Nassau Communities Hospital Off-Campus Emergency Department | 2024 | NA | 3,120 | NA | NA | |
| 2023 | NA | 9,314 | NA | NA | ||
| 2022 | NA | 9,235 | NA | NA | ||
| 2021 | NA | 8,857 | NA | NA | ||
| 2020 | 1 | 7,151 | NA | 1 | ||
| 2019 | 2 | 8,854 | NA | NA | ||
| 2018 | 2 | 9,149 | NA | NA | ||
| 2017 | NA | 8,574 | NA | NA | ||
| 2016 | NA | 8,669 | NA | NA | ||
| 2015 | NA | 3,033 | NA | NA | ||
| St. Francis Hospital & Heart Center | 2024 | 5,782 | 6,847 | 6,502 | 47,795 | |
| 2023 | 17,501 | 21,208 | 19,503 | 145,672 | ||
| 2022 | 16,475 | 26,620 | 19,294 | 138,382 | ||
| 2021 | 15,859 | 38,589 | 19,579 | 129,907 | ||
| 2020 | 13,364 | 15,167 | 17,739 | 105,624 | ||
| 2019 | 15,657 | 15,766 | 20,515 | 44,302 | ||
| 2018 | 16,087 | 15,203 | 18,363 | 42,124 | ||
| 2017 | 16,658 | 14,556 | 16,891 | 39,639 | ||
| 2016 | 16,010 | 14,648 | 16,194 | 35,635 | ||
| 2015 | 15,391 | 14,143 | 15,639 | 16,403 | ||
| St. Joseph Hospital | 2024 | 981 | 6,657 | 1,665 | 3,699 | |
| 2023 | 3,808 | 26,905 | 6,293 | 14,078 | ||
| 2022 | 3,206 | 29,183 | 6,172 | 12,881 | ||
| 2021 | 2,811 | 28,279 | 5,639 | 13,162 | ||
| 2020 | 2,787 | 19,606 | 5,226 | 11,571 | ||
| 2019 | 3,011 | 24,756 | 6,093 | 12,451 | ||
| 2018 | 3,036 | 25,854 | 6,081 | 11,058 | ||
| 2017 | 2,892 | 26,525 | 6,080 | 10,347 | ||
| 2016 | 2,879 | 27,415 | 6,132 | 10,121 | ||
| 2015 | 3,081 | 27,478 | 6,094 | 9,961 | ||
| Star Surgical Suites | 2024 | 1,727 | NA | NA | NA | |
| 2023 | 4,222 | NA | NA | NA | ||
| 2022 | 1,788 | NA | NA | NA | ||
| 2021 | 807 | NA | NA | NA | ||
| Syosset Hospital | 2024 | 4,068 | 8,116 | 2,886 | 3,354 | |
| 2023 | 11,968 | 25,502 | 7,928 | 12,368 | ||
| 2022 | 10,146 | 24,724 | 7,866 | 24,330 | ||
| 2021 | 10,732 | 21,684 | 6,970 | 23,322 | ||
| 2020 | 10,042 | 18,472 | 4,752 | 18,150 | ||
| 2019 | 37,488 | 46,972 | 18,112 | 21,840 | ||
| 2018 | 44,008 | 47,496 | 15,900 | 22,124 | ||
| 2017 | 43,760 | 48,236 | 14,020 | 22,256 | ||
| 2016 | 45,408 | 48,704 | 15,404 | 21,524 | ||
| 2015 | 49,100 | 50,864 | 15,020 | 16,232 | ||
| Syosset SurgiCenter | 2024 | 2,340 | NA | NA | NA | |
| 2023 | 5,270 | NA | NA | NA | ||
| 2022 | 4,916 | NA | NA | NA | ||
| 2021 | 4,993 | NA | NA | NA | ||
| 2020 | 3,886 | NA | NA | NA | ||
| 2019 | 709 | NA | NA | NA | ||
| New York | Bellevue Hospital Center | 2024 | 3,943 | 42,881 | 13,386 | 240,972 |
| 2023 | 9,947 | 89,979 | 28,370 | 497,866 | ||
| 2022 | 10,308 | 79,386 | 27,927 | 534,920 | ||
| 2021 | 10,769 | 73,433 | 26,614 | 703,762 | ||
| 2020 | 7,132 | 60,433 | 22,335 | 416,592 | ||
| 2019 | 10,397 | 91,150 | 20,812 | 371,287 | ||
| 2018 | 15,917 | 106,657 | 25,184 | 349,175 | ||
| 2017 | 12,540 | 95,087 | 25,910 | 393,814 | ||
| 2016 | 11,139 | 88,698 | 26,944 | 383,350 | ||
| 2015 | 10,909 | 87,909 | 26,401 | 396,488 | ||
| Blavatnik Family - Chelsea Medical Center at Mount Sinai | 2024 | 886 | NA | NA | 21,460 | |
| 2023 | 2,361 | NA | NA | 55,809 | ||
| 2022 | 2,081 | NA | NA | 54,320 | ||
| 2021 | 1,897 | NA | NA | 56,460 | ||
| 2020 | 1,576 | 1 | NA | 48,373 | ||
| 2019 | 2,392 | NA | NA | 45,254 | ||
| 2018 | 2,191 | NA | NA | 41,764 | ||
| 2017 | 1,675 | NA | NA | 39,990 | ||
| 2016 | 1,128 | NA | NA | 26,588 | ||
| 2015 | 881 | NA | NA | 17,801 | ||
| Carnegie Hill Endoscopy, LLC | 2024 | 5,461 | NA | NA | NA | |
| 2023 | 13,760 | NA | NA | NA | ||
| 2022 | 13,651 | NA | NA | NA | ||
| 2021 | 12,943 | NA | NA | NA | ||
| 2020 | 9,581 | NA | NA | NA | ||
| 2019 | 13,862 | NA | NA | NA | ||
| 2018 | 12,280 | NA | NA | NA | ||
| 2017 | 11,718 | NA | NA | NA | ||
| 2016 | 12,201 | NA | NA | NA | ||
| 2015 | 11,898 | NA | NA | NA | ||
| David H. Koch Center For Cancer Care | 2024 | 8,788 | NA | 342 | 67,353 | |
| 2023 | 24,646 | NA | 1,143 | 212,902 | ||
| 2022 | 20,488 | NA | 1,044 | 220,399 | ||
| 2021 | 14,843 | 0 | 980 | 237,806 | ||
| 2020 | 10,869 | NA | 801 | 137,574 | ||
| East Side Endoscopy and Pain Management Center | 2024 | 4,544 | NA | NA | NA | |
| 2023 | 9,306 | NA | NA | NA | ||
| 2022 | 9,092 | NA | NA | NA | ||
| 2021 | 9,269 | NA | NA | NA | ||
| 2020 | 6,038 | NA | NA | NA | ||
| 2019 | 8,812 | NA | NA | NA | ||
| 2018 | 8,829 | NA | NA | NA | ||
| 2017 | 9,498 | NA | NA | NA | ||
| 2016 | 9,839 | NA | NA | NA | ||
| 2015 | 9,302 | NA | NA | NA | ||
| Fifth Avenue Surgery Center | 2024 | 4,340 | NA | NA | NA | |
| 2023 | 9,863 | NA | NA | NA | ||
| 2022 | 8,093 | NA | NA | NA | ||
| 2021 | 5,089 | NA | NA | NA | ||
| 2020 | 3,464 | NA | NA | 2 | ||
| 2019 | 3,936 | NA | NA | 15 | ||
| 2018 | 4,121 | NA | NA | NA | ||
| 2017 | 1,997 | NA | NA | NA | ||
| 2016 | 587 | NA | NA | NA | ||
| 2015 | 751 | NA | NA | NA | ||
| Gramercy Park DDC - Bennett Avenue | 2024 | 3,058 | NA | NA | NA | |
| 2023 | 6,494 | NA | NA | NA | ||
| 2022 | 6,323 | NA | NA | NA | ||
| 2021 | 5,385 | NA | NA | NA | ||
| 2020 | 2,122 | NA | NA | NA | ||
| Gramercy Park Digestive Disease Center | 2024 | 4,437 | NA | NA | NA | |
| 2023 | 8,655 | NA | NA | NA | ||
| 2022 | 8,187 | NA | NA | NA | ||
| 2021 | 7,989 | NA | NA | NA | ||
| 2020 | 5,941 | NA | NA | NA | ||
| 2019 | 12,335 | NA | NA | NA | ||
| 2018 | 11,972 | NA | NA | NA | ||
| 2017 | 13,648 | NA | NA | NA | ||
| 2016 | 13,288 | NA | NA | NA | ||
| 2015 | 12,613 | NA | NA | NA | ||
| Gramercy Surgery Center, Inc | 2024 | 1,939 | NA | NA | NA | |
| 2023 | 5,704 | NA | NA | NA | ||
| 2022 | 5,726 | NA | NA | NA | ||
| 2021 | 4,582 | NA | NA | NA | ||
| 2020 | 3,521 | NA | NA | 3 | ||
| 2019 | 4,851 | NA | NA | NA | ||
| 2018 | 3,105 | NA | NA | NA | ||
| 2017 | 3,368 | NA | NA | 4 | ||
| 2016 | 3,303 | NA | NA | NA | ||
| 2015 | 3,031 | NA | NA | NA | ||
| HSS ASC of Manhattan | 2024 | 2,002 | NA | NA | NA | |
| 2023 | 3,491 | NA | NA | NA | ||
| 2022 | 3,300 | NA | NA | NA | ||
| 2021 | 3,223 | NA | NA | 1 | ||
| 2020 | 2,647 | NA | NA | NA | ||
| 2019 | 3,604 | NA | NA | 4 | ||
| 2018 | 1,889 | NA | NA | NA | ||
| 2017 | 2 | NA | NA | NA | ||
| HSS Physiatry & Pain Management | 2024 | 4,860 | NA | NA | 4,417 | |
| 2023 | 8,920 | NA | NA | 7,483 | ||
| 2022 | 8,717 | NA | NA | 6,613 | ||
| 2021 | 8,446 | NA | NA | 6,612 | ||
| 2020 | 5,902 | NA | NA | 5,771 | ||
| 2019 | 6,880 | NA | NA | 10,551 | ||
| 2018 | 6,328 | NA | NA | 7,692 | ||
| 2017 | 6,405 | NA | NA | 8,272 | ||
| 2016 | 7,055 | NA | NA | 7,579 | ||
| 2015 | 7,342 | NA | NA | 13 | ||
| HSS West Side ASC | 2024 | 1,707 | NA | NA | NA | |
| 2023 | 2,539 | NA | NA | NA | ||
| 2022 | 1,985 | NA | NA | NA | ||
| 2021 | 1,852 | NA | NA | NA | ||
| 2020 | 1,377 | NA | NA | NA | ||
| 2019 | 284 | NA | NA | NA | ||
| Harlem Hospital Center | 2024 | 2,118 | 39,381 | 4,914 | 93,259 | |
| 2023 | 4,485 | 78,849 | 10,899 | 192,883 | ||
| 2022 | 3,850 | 73,260 | 10,530 | 213,188 | ||
| 2021 | 4,423 | 64,365 | 9,991 | 284,327 | ||
| 2020 | 3,339 | 54,742 | 9,730 | 171,191 | ||
| 2019 | 4,168 | 75,470 | 9,914 | 161,895 | ||
| 2018 | 7,643 | 84,331 | 12,071 | 170,735 | ||
| 2017 | 5,162 | 78,519 | 11,860 | 176,548 | ||
| 2016 | 4,211 | 69,944 | 12,637 | 189,211 | ||
| 2015 | 4,540 | 68,061 | 12,167 | 195,011 | ||
| Henry J. Carter Specialty Hospital | 2024 | NA | NA | 191 | 3 | |
| 2023 | NA | NA | 501 | 17 | ||
| 2022 | NA | NA | 535 | 30 | ||
| 2021 | NA | NA | 565 | 29 | ||
| 2020 | 1 | NA | 457 | 4 | ||
| 2019 | NA | NA | 324 | NA | ||
| 2018 | NA | NA | 303 | NA | ||
| 2017 | NA | NA | 278 | NA | ||
| 2016 | NA | NA | 278 | NA | ||
| 2015 | NA | NA | 269 | NA | ||
| Hospital for Special Surgery | 2024 | 9,445 | NA | 4,493 | 173,557 | |
| 2023 | 16,990 | NA | 9,782 | 328,456 | ||
| 2022 | 16,556 | NA | 11,464 | 322,122 | ||
| 2021 | 14,103 | NA | 12,389 | 309,490 | ||
| 2020 | 11,136 | 26 | 12,325 | 237,258 | ||
| 2019 | 13,931 | NA | 15,421 | 302,304 | ||
| 2018 | 13,115 | NA | 15,232 | 221,013 | ||
| 2017 | 12,673 | NA | 15,187 | 211,777 | ||
| 2016 | 18,229 | NA | 14,840 | 198,537 | ||
| 2015 | 20,992 | NA | 15,079 | 59,107 | ||
| Hudson Specialty Surgery Center | 2024 | 0 | NA | NA | NA | |
| 2023 | 0 | NA | NA | NA | ||
| 2022 | 0 | NA | NA | NA | ||
| Hudson Surgery Center, LLC | 2024 | 0 | NA | NA | NA | |
| 2023 | 0 | NA | NA | NA | ||
| 2022 | 0 | NA | NA | NA | ||
| Josie Robertson Surgery Center | 2024 | 3,631 | NA | NA | 83 | |
| 2023 | 10,499 | NA | NA | 238 | ||
| 2022 | 9,312 | NA | NA | 217 | ||
| 2021 | 9,457 | NA | NA | 233 | ||
| 2020 | 8,032 | NA | 30 | 175 | ||
| 2019 | 8,308 | NA | NA | 150 | ||
| 2018 | 7,452 | 0 | NA | 94 | ||
| 2017 | 6,885 | 26 | NA | NA | ||
| 2016 | 6,291 | NA | NA | NA | ||
| Kips Bay Endoscopy Center, LLC | 2024 | 4,506 | NA | NA | NA | |
| 2023 | 9,415 | NA | NA | NA | ||
| 2022 | 9,377 | NA | NA | NA | ||
| 2021 | 9,480 | NA | NA | NA | ||
| 2020 | 6,431 | NA | NA | NA | ||
| 2019 | 10,051 | NA | NA | 2 | ||
| 2018 | 9,436 | NA | NA | NA | ||
| 2017 | 9,410 | NA | NA | NA | ||
| 2016 | 9,873 | NA | NA | NA | ||
| 2015 | 9,561 | NA | NA | NA | ||
| Lenox Health Greenwich Village | 2024 | 4,478 | 22,952 | NA | 310 | |
| 2023 | 8,640 | 67,410 | NA | 902 | ||
| 2022 | 5,908 | 63,960 | NA | 1,062 | ||
| 2021 | 2,224 | 69,252 | NA | 1,606 | ||
| 2020 | NA | 59,234 | NA | 522 | ||
| 2019 | 4 | 138,248 | NA | 1,600 | ||
| 2018 | NA | 136,596 | NA | 1,120 | ||
| 2017 | NA | 108,372 | NA | 1,780 | ||
| 2016 | NA | 105,752 | NA | 2,316 | ||
| 2015 | NA | 98,972 | NA | 2,800 | ||
| Lenox Hill Hospital | 2024 | 8,196 | 25,190 | 20,886 | 59,342 | |
| 2023 | 23,492 | 73,456 | 62,540 | 169,466 | ||
| 2022 | 20,680 | 71,750 | 60,620 | 148,828 | ||
| 2021 | 21,300 | 94,258 | 65,472 | 151,032 | ||
| 2020 | 16,380 | 65,060 | 58,470 | 113,500 | ||
| 2019 | 48,432 | 156,516 | 137,148 | 321,704 | ||
| 2018 | 45,364 | 158,400 | 128,324 | 294,640 | ||
| 2017 | 36,400 | 149,096 | 130,432 | 263,916 | ||
| 2016 | 34,656 | 158,488 | 124,864 | 244,752 | ||
| 2015 | 35,044 | 161,240 | 125,560 | 110,804 | ||
| Lenox Hill Hospital Extension Clinic at MEETH | 2024 | 11,620 | 24 | NA | 3,138 | |
| 2023 | 32,558 | 240 | NA | 9,706 | ||
| 2022 | 31,510 | 558 | NA | 10,366 | ||
| 2021 | 32,352 | 432 | NA | 11,358 | ||
| 2020 | 24,866 | 112 | NA | 9,394 | ||
| 2019 | 60,432 | 400 | NA | 28,908 | ||
| 2018 | 61,580 | 788 | NA | 37,604 | ||
| 2017 | 59,744 | 100 | NA | 42,212 | ||
| 2016 | 60,236 | NA | NA | 58,776 | ||
| 2015 | 58,484 | NA | NA | 59,016 | ||
| Liberty Endoscopy Center | 2024 | 4,038 | NA | NA | NA | |
| 2023 | 8,982 | NA | NA | NA | ||
| 2022 | 5,512 | NA | NA | NA | ||
| 2021 | 4,954 | NA | NA | NA | ||
| 2020 | 4,154 | NA | NA | NA | ||
| 2019 | 6,568 | NA | NA | NA | ||
| 2018 | 5,240 | NA | NA | NA | ||
| 2017 | 1,679 | NA | NA | NA | ||
| Manhattan Endoscopy Center, LLC | 2024 | 4,577 | NA | NA | NA | |
| 2023 | 10,908 | NA | NA | NA | ||
| 2022 | 11,592 | NA | NA | NA | ||
| 2021 | 10,871 | NA | NA | NA | ||
| 2020 | 8,122 | NA | NA | NA | ||
| 2019 | 12,298 | NA | NA | NA | ||
| 2018 | 12,614 | NA | NA | NA | ||
| 2017 | 14,616 | NA | NA | NA | ||
| 2016 | 16,063 | NA | NA | NA | ||
| 2015 | 12,773 | NA | NA | NA | ||
| Manhattan Reproductive Surgery Center | 2024 | 1,473 | NA | NA | 0 | |
| 2023 | 3,473 | NA | NA | 0 | ||
| 2022 | 3,354 | NA | NA | 2 | ||
| 2021 | 3,016 | NA | NA | NA | ||
| 2020 | 2,674 | NA | NA | NA | ||
| 2019 | 1,904 | NA | NA | 3 | ||
| Manhattan Surgery Center | 2024 | 1,367 | NA | NA | NA | |
| 2023 | 5,382 | NA | NA | NA | ||
| 2022 | 4,788 | NA | NA | NA | ||
| 2021 | 4,799 | NA | NA | 1 | ||
| 2020 | 4,091 | NA | NA | 1 | ||
| 2019 | 6,326 | NA | NA | 1 | ||
| 2018 | 6,100 | NA | NA | NA | ||
| 2017 | 6,364 | NA | NA | 1 | ||
| 2016 | 5,870 | NA | NA | NA | ||
| 2015 | 5,087 | NA | NA | NA | ||
| Memorial Hospital for Cancer and Allied Diseases | 2024 | 7,631 | 4,158 | 8,026 | 33,087 | |
| 2023 | 22,123 | 12,854 | 24,056 | 106,708 | ||
| 2022 | 22,788 | 11,373 | 22,718 | 111,461 | ||
| 2021 | 22,501 | 9,714 | 23,178 | 115,877 | ||
| 2020 | 20,181 | 8,378 | 21,961 | 102,857 | ||
| 2019 | 30,397 | 10,192 | 25,582 | 204,731 | ||
| 2018 | 29,176 | 10,174 | 23,964 | 193,465 | ||
| 2017 | 22,839 | 10,429 | 22,953 | 155,449 | ||
| 2016 | 19,897 | 10,824 | 23,042 | 155,032 | ||
| 2015 | 24,077 | 10,746 | 22,386 | 114,854 | ||
| Metropolitan Hospital Center | 2024 | 1,849 | 27,190 | 3,835 | 143,808 | |
| 2023 | 9,150 | 49,802 | 7,822 | 298,955 | ||
| 2022 | 7,380 | 49,131 | 7,804 | 313,897 | ||
| 2021 | 7,575 | 41,800 | 7,692 | 587,391 | ||
| 2020 | 4,753 | 35,057 | 7,373 | 275,435 | ||
| 2019 | 10,228 | 59,720 | 8,022 | 220,701 | ||
| 2018 | 13,326 | 76,735 | 9,105 | 199,224 | ||
| 2017 | 5,615 | 55,694 | 10,567 | 227,647 | ||
| 2016 | 5,185 | 50,065 | 11,687 | 253,051 | ||
| 2015 | 5,661 | 55,409 | 12,656 | 253,540 | ||
| Midtown Surgery Center | 2024 | 556 | NA | NA | NA | |
| 2023 | 2,087 | NA | NA | NA | ||
| 2022 | 2,047 | NA | NA | NA | ||
| 2021 | 1,765 | NA | NA | NA | ||
| 2020 | 2,449 | NA | NA | NA | ||
| 2019 | 3,749 | NA | NA | NA | ||
| 2018 | 2,745 | NA | NA | NA | ||
| 2017 | 2,411 | NA | NA | NA | ||
| 2016 | 2,666 | NA | NA | NA | ||
| 2015 | 2,598 | NA | NA | 10 | ||
| Mount Sinai Beth Israel | 2024 | 828 | 6,123 | 2,373 | 11,327 | |
| 2023 | 4,626 | 50,691 | 11,282 | 77,953 | ||
| 2022 | 5,406 | 55,275 | 11,662 | 107,164 | ||
| 2021 | 4,765 | 63,506 | 11,459 | 149,591 | ||
| 2020 | 7,293 | 50,845 | 11,414 | 124,766 | ||
| 2019 | 10,782 | 68,963 | 13,996 | 153,265 | ||
| 2018 | 10,775 | 72,133 | 15,972 | 162,167 | ||
| 2017 | 12,823 | 72,312 | 20,187 | 172,917 | ||
| 2016 | 15,663 | 76,119 | 30,017 | 198,087 | ||
| 2015 | 15,781 | 81,375 | 34,515 | 207,783 | ||
| Mount Sinai Downtown Union Square | 2024 | 2,222 | NA | NA | 108,293 | |
| 2023 | 6,779 | NA | NA | 291,961 | ||
| 2022 | 6,479 | NA | NA | 292,092 | ||
| 2021 | 6,517 | NA | NA | 309,442 | ||
| 2020 | 5,604 | NA | NA | 227,767 | ||
| 2019 | 7,455 | 9 | NA | 202,768 | ||
| 2018 | 7,796 | NA | NA | 187,950 | ||
| 2017 | 8,438 | NA | NA | 209,155 | ||
| 2016 | 7,716 | NA | NA | 150,544 | ||
| 2015 | 8,891 | NA | NA | 36,740 | ||
| Mount Sinai Hospital | 2024 | 12,940 | 8,376 | 17,804 | 219,097 | |
| 2023 | 33,258 | 71,478 | 49,488 | 581,853 | ||
| 2022 | 33,331 | 69,692 | 50,200 | 608,566 | ||
| 2021 | 35,099 | 66,812 | 50,015 | 677,341 | ||
| 2020 | 26,951 | 59,314 | 49,645 | 507,019 | ||
| 2019 | 34,997 | 81,131 | 55,325 | 510,943 | ||
| 2018 | 34,423 | 83,623 | 52,900 | 507,801 | ||
| 2017 | 33,340 | 82,227 | 52,701 | 515,472 | ||
| 2016 | 37,296 | 87,665 | 55,868 | 497,030 | ||
| 2015 | 36,513 | 82,631 | 55,931 | 286,698 | ||
| Mount Sinai Morningside | 2024 | 5,042 | 7,029 | 6,878 | 70,893 | |
| 2023 | 9,717 | 56,287 | 16,954 | 157,777 | ||
| 2022 | 8,881 | 57,999 | 15,989 | 161,214 | ||
| 2021 | 8,189 | 56,116 | 15,455 | 184,647 | ||
| 2020 | 8,832 | 51,751 | 13,852 | 144,122 | ||
| 2019 | 10,631 | 73,359 | 15,284 | 152,322 | ||
| 2018 | 11,194 | 75,813 | 14,443 | 170,156 | ||
| 2017 | 9,810 | 78,950 | 14,075 | 160,171 | ||
| 2016 | 7,924 | 86,386 | 13,298 | 178,806 | ||
| 2015 | 6,985 | 86,376 | 12,875 | 180,432 | ||
| Mount Sinai West | 2024 | 5,976 | 6,586 | 10,816 | 49,667 | |
| 2023 | 15,295 | 51,221 | 25,448 | 143,969 | ||
| 2022 | 14,701 | 47,937 | 22,998 | 153,199 | ||
| 2021 | 15,744 | 46,274 | 23,039 | 153,630 | ||
| 2020 | 10,906 | 40,388 | 23,338 | 115,743 | ||
| 2019 | 11,511 | 54,467 | 26,527 | 127,953 | ||
| 2018 | 9,554 | 55,845 | 25,695 | 126,177 | ||
| 2017 | 10,288 | 64,686 | 25,584 | 149,706 | ||
| 2016 | 10,745 | 56,886 | 22,713 | 129,397 | ||
| 2015 | 10,011 | 58,178 | 24,397 | 120,868 | ||
| NYU Langone Ambulatory Surgery Center | 2024 | 2,076 | NA | NA | 1,951 | |
| 2023 | 3,121 | NA | NA | 3,571 | ||
| 2022 | 1,026 | NA | NA | 1,384 | ||
| NYU Langone Center for Women’s Health | 2024 | 2,002 | NA | NA | 3 | |
| 2023 | 3,782 | NA | NA | 31 | ||
| 2022 | 3,022 | NA | NA | 11,918 | ||
| 2021 | 3,003 | NA | NA | 16,338 | ||
| 2020 | 2,165 | 1 | NA | 11,761 | ||
| 2019 | 2,458 | NA | NA | 14,295 | ||
| 2018 | 2,221 | NA | NA | 11,581 | ||
| 2017 | 1,252 | NA | NA | 9,357 | ||
| 2016 | 712 | NA | NA | 8,326 | ||
| 2015 | 613 | NA | NA | 7,070 | ||
| NYU Langone Hospitals | 2024 | 18,282 | 37,686 | 21,996 | 63,493 | |
| 2023 | 41,641 | 84,102 | 47,634 | 144,247 | ||
| 2022 | 34,948 | 69,877 | 43,535 | 152,863 | ||
| 2021 | 34,401 | 59,728 | 43,339 | 225,833 | ||
| 2020 | 22,789 | 46,766 | 39,481 | 84,352 | ||
| 2019 | 34,504 | 67,914 | 43,537 | 100,593 | ||
| 2018 | 30,579 | 65,576 | 38,895 | 96,669 | ||
| 2017 | 21,193 | 55,188 | 36,726 | 92,538 | ||
| 2016 | 21,931 | 56,431 | 34,436 | 83,196 | ||
| 2015 | 19,465 | 52,161 | 33,129 | 64,014 | ||
| NYU Langone Orthopedic Hospital | 2024 | 2,641 | 787 | 2,012 | 21,180 | |
| 2023 | 5,466 | 1,605 | 4,738 | 48,370 | ||
| 2022 | 5,281 | 1,331 | 4,427 | 47,708 | ||
| 2021 | 5,866 | 1,225 | 3,932 | 49,700 | ||
| 2020 | 4,767 | 1,081 | 4,091 | 39,405 | ||
| 2019 | 4,627 | 1,337 | 6,000 | 51,753 | ||
| 2018 | 5,562 | 1,224 | 7,233 | 53,392 | ||
| 2017 | 5,288 | 981 | 7,196 | 51,577 | ||
| 2016 | 6,171 | 700 | 7,116 | 49,591 | ||
| 2015 | 6,727 | 634 | 6,560 | 47,050 | ||
| NYU Langone Outpatient Surgery Center | 2024 | 2,313 | NA | NA | 6 | |
| 2023 | 5,493 | NA | NA | 18 | ||
| 2022 | 5,466 | NA | NA | 18 | ||
| 2021 | 5,479 | NA | NA | 20 | ||
| 2020 | 5,125 | NA | NA | 6 | ||
| 2019 | 6,734 | NA | NA | 13 | ||
| 2018 | 6,312 | NA | NA | 15 | ||
| 2017 | 5,869 | NA | NA | 21 | ||
| 2016 | 5,459 | NA | NA | 19 | ||
| 2015 | 4,067 | NA | NA | 12 | ||
| NYU Langone Rusk Ambulatory Care Center | 2024 | 6,946 | NA | NA | 31,590 | |
| 2023 | 14,806 | NA | NA | 70,238 | ||
| 2022 | 13,101 | NA | NA | 58,436 | ||
| 2021 | 13,246 | 1 | NA | 58,495 | ||
| 2020 | 9,981 | NA | NA | 47,076 | ||
| 2019 | 13,452 | 1 | NA | 72,442 | ||
| 2018 | 13,413 | NA | NA | 70,728 | ||
| 2017 | 10,914 | 2 | 3 | 67,004 | ||
| 2016 | 6,928 | NA | NA | 63,745 | ||
| 2015 | 5,341 | NA | NA | 59,627 | ||
| New York Center For Ambulatory Surgery | 2024 | 159 | NA | NA | NA | |
| 2023 | 767 | NA | NA | NA | ||
| 2022 | 1,037 | NA | NA | NA | ||
| 2021 | 934 | NA | NA | NA | ||
| 2020 | 471 | NA | NA | NA | ||
| 2019 | 7 | NA | NA | NA | ||
| New York Eye and Ear Infirmary of Mount Sinai | 2024 | 3,953 | NA | 69 | 22,828 | |
| 2023 | 14,282 | NA | 292 | 81,335 | ||
| 2022 | 15,493 | NA | 328 | 86,197 | ||
| 2021 | 16,778 | NA | 456 | 85,880 | ||
| 2020 | 13,594 | NA | 312 | 68,693 | ||
| 2019 | 21,710 | NA | 436 | 117,017 | ||
| 2018 | 22,943 | NA | 307 | 118,892 | ||
| 2017 | 25,568 | NA | 273 | 132,624 | ||
| 2016 | 26,096 | NA | 297 | 127,367 | ||
| 2015 | 27,385 | NA | 385 | 135,754 | ||
| New York-Presbyterian David H. Koch Center | 2024 | 16,529 | 3,247 | 8,738 | 24,948 | |
| 2023 | 29,587 | 5,923 | 15,759 | 45,384 | ||
| 2022 | 11 | 2 | 3 | 19 | ||
| 2021 | 0 | 0 | 0 | 0 | ||
| 2020 | 0 | 0 | 0 | 0 | ||
| 2019 | 0 | 0 | 0 | 0 | ||
| 2018 | 0 | 0 | 0 | 0 | ||
| New York-Presbyterian Hospital - Allen Hospital | 2024 | 2,459 | 20,744 | 6,229 | 6,886 | |
| 2023 | 4,589 | 39,365 | 11,984 | 15,628 | ||
| 2022 | 4,426 | 35,649 | 12,671 | 21,282 | ||
| 2021 | 4,771 | 32,600 | 11,882 | 30,919 | ||
| 2020 | 3,176 | 27,448 | 10,157 | 18,917 | ||
| 2019 | 4,256 | 39,204 | 12,618 | 16,559 | ||
| 2018 | 4,417 | 39,474 | 12,198 | 15,170 | ||
| 2017 | 4,487 | 36,421 | 12,011 | 13,886 | ||
| 2016 | 4,398 | 38,080 | 12,087 | 10,506 | ||
| 2015 | 4,160 | 37,114 | 11,925 | 4,199 | ||
| New York-Presbyterian Hospital - Columbia Presbyterian Center | 2024 | 21,280 | 68,406 | 23,300 | 284,656 | |
| 2023 | 40,550 | 132,004 | 44,554 | 578,452 | ||
| 2022 | 38,724 | 123,175 | 44,462 | 690,147 | ||
| 2021 | 38,397 | 107,874 | 42,135 | 924,216 | ||
| 2020 | 23,862 | 81,019 | 40,430 | 499,384 | ||
| 2019 | 42,018 | 129,177 | 49,751 | 533,417 | ||
| 2018 | 39,740 | 132,444 | 49,352 | 521,339 | ||
| 2017 | 38,588 | 128,303 | 48,738 | 498,784 | ||
| 2016 | 37,651 | 126,673 | 47,689 | 519,709 | ||
| 2015 | 35,491 | 122,030 | 47,564 | 238,577 | ||
| New York-Presbyterian Hospital - New York Weill Cornell Center | 2024 | 12,324 | 32,471 | 15,226 | 193,136 | |
| 2023 | 19,305 | 63,353 | 27,658 | 430,261 | ||
| 2022 | 45,448 | 63,313 | 43,927 | 600,712 | ||
| 2021 | 48,007 | 55,751 | 42,471 | 677,935 | ||
| 2020 | 35,356 | 45,606 | 37,126 | 485,700 | ||
| 2019 | 48,927 | 69,879 | 46,197 | 583,735 | ||
| 2018 | 41,510 | 68,893 | 44,731 | 553,980 | ||
| 2017 | 35,043 | 63,902 | 24,643 | 326,717 | ||
| 2016 | 37,722 | 66,561 | 25,828 | 154,167 | ||
| 2015 | 35,901 | 64,987 | 43,185 | 129,264 | ||
| New York-Presbyterian/Lower Manhattan Hospital | 2024 | 2,184 | 17,645 | 5,063 | 7,862 | |
| 2023 | 4,402 | 34,170 | 9,370 | 15,392 | ||
| 2022 | 4,674 | 30,284 | 8,894 | 16,636 | ||
| 2021 | 4,397 | 26,718 | 9,025 | 20,149 | ||
| 2020 | 3,022 | 25,828 | 9,414 | 17,921 | ||
| 2019 | 4,938 | 41,915 | 12,016 | 24,078 | ||
| 2018 | 5,496 | 42,871 | 12,768 | 27,513 | ||
| 2017 | 5,916 | 41,176 | 12,959 | 31,580 | ||
| 2016 | 6,559 | 39,538 | 12,475 | 30,567 | ||
| 2015 | 6,258 | 37,154 | 10,496 | 2,427 | ||
| Retinal Ambulatory Surgery Center of New York Inc | 2024 | 2,143 | NA | NA | 8 | |
| 2023 | 4,952 | NA | NA | 19 | ||
| 2022 | 4,509 | NA | NA | 9 | ||
| 2021 | 4,529 | NA | NA | 1 | ||
| 2020 | 3,142 | NA | NA | NA | ||
| 2019 | 4,882 | NA | NA | NA | ||
| 2018 | 4,181 | NA | NA | NA | ||
| 2017 | 4,167 | NA | NA | NA | ||
| 2016 | 3,787 | NA | NA | NA | ||
| 2015 | 2,963 | NA | NA | NA | ||
| SurgiCare of Manhattan, LLC | 2024 | 0 | NA | NA | NA | |
| 2023 | 3,493 | NA | NA | NA | ||
| 2022 | 3,321 | NA | NA | NA | ||
| 2021 | 2,655 | NA | NA | NA | ||
| 2020 | 2,878 | NA | NA | NA | ||
| 2019 | 4,257 | NA | NA | NA | ||
| 2018 | 4,377 | NA | NA | NA | ||
| 2017 | 3,967 | NA | NA | NA | ||
| 2016 | 4,353 | NA | NA | NA | ||
| 2015 | 4,439 | NA | NA | NA | ||
| Surgicare of Westside | 2024 | 0 | NA | NA | NA | |
| 2023 | 718 | NA | NA | NA | ||
| 2022 | 453 | NA | NA | NA | ||
| The Derfner Foundation Ambulatory Surgery Center | 2024 | 484 | NA | NA | NA | |
| 2023 | 668 | NA | NA | NA | ||
| 2022 | 642 | NA | NA | NA | ||
| The Endoscopy Center of New York | 2024 | 5,942 | NA | NA | NA | |
| 2023 | 13,821 | NA | NA | NA | ||
| 2022 | 13,653 | NA | NA | NA | ||
| 2021 | 13,421 | NA | NA | NA | ||
| 2020 | 9,907 | NA | NA | NA | ||
| 2019 | 14,758 | NA | NA | NA | ||
| 2018 | 13,377 | NA | NA | NA | ||
| 2017 | 12,488 | NA | NA | NA | ||
| 2016 | 9,754 | NA | NA | NA | ||
| 2015 | 8,596 | NA | NA | NA | ||
| Upper West Side Endoscopy | 2024 | 1,205 | NA | NA | NA | |
| 2023 | 6,716 | NA | NA | NA | ||
| 2022 | 4,772 | NA | NA | NA | ||
| 2021 | 1,201 | NA | NA | NA | ||
| West Side GI | 2024 | 1,433 | NA | NA | NA | |
| 2023 | 2,959 | NA | NA | NA | ||
| 2022 | 13,811 | NA | NA | NA | ||
| 2021 | 11,401 | NA | NA | NA | ||
| 2020 | 10,431 | NA | NA | NA | ||
| 2019 | 17,894 | NA | NA | NA | ||
| 2018 | 18,694 | NA | NA | NA | ||
| 2017 | 17,802 | NA | NA | NA | ||
| 2016 | 15,341 | NA | NA | NA | ||
| 2015 | 14,608 | NA | NA | NA | ||
| Niagara | Ambulatory Surgery Center of Niagara | 2024 | 717 | NA | NA | 1 |
| 2023 | 2,343 | NA | NA | 8 | ||
| 2022 | 2,239 | NA | NA | 3 | ||
| 2021 | 2,278 | NA | NA | 2 | ||
| 2020 | 1,766 | NA | NA | NA | ||
| 2019 | 2,054 | NA | NA | NA | ||
| 2018 | 1,900 | NA | NA | 1 | ||
| 2017 | 1,633 | NA | NA | NA | ||
| 2016 | 438 | NA | NA | NA | ||
| DeGraff Medical Park | 2024 | 0 | 6,265 | 0 | 257 | |
| 2023 | 0 | 18,264 | 6 | 440 | ||
| 2022 | 0 | 18,007 | 5 | 1,135 | ||
| 2021 | 268 | 14,421 | 6 | 1,510 | ||
| 2020 | 4 | 10,157 | 5 | 936 | ||
| 2019 | NA | 13,331 | 318 | 7,568 | ||
| 2018 | 401 | 11,630 | 318 | 11,139 | ||
| 2017 | 1,601 | 12,535 | 1,212 | 12,680 | ||
| 2016 | 2,171 | 12,807 | 1,741 | 14,518 | ||
| 2015 | 2,339 | 12,459 | 1,774 | 14,606 | ||
| Endoscopy Center of Niagara, LLC | 2024 | 1,977 | NA | NA | NA | |
| 2023 | 4,418 | NA | NA | NA | ||
| 2022 | 4,292 | NA | NA | NA | ||
| 2021 | 3,954 | NA | NA | NA | ||
| 2020 | 3,397 | NA | NA | NA | ||
| 2019 | 4,929 | NA | NA | NA | ||
| 2018 | 3,961 | NA | NA | NA | ||
| 2017 | 4,315 | NA | NA | NA | ||
| 2016 | 4,044 | NA | NA | NA | ||
| 2015 | 3,159 | NA | NA | NA | ||
| Lockport Memorial Hospital, a Campus of Mount St Mary’s | 2024 | NA | 5,531 | 303 | 7,167 | |
| 2023 | NA | 635 | 86 | 1,007 | ||
| Mount St. Mary’s Ambulatory Campus, a Department of Mount St. Mary’s Hospital and Health Center | 2024 | 1,406 | NA | NA | 51 | |
| 2023 | 3,845 | NA | NA | 6,038 | ||
| 2022 | 3,814 | NA | NA | 16,945 | ||
| 2021 | 3,422 | 3 | NA | 21,222 | ||
| 2020 | 2,615 | 3 | NA | 24,944 | ||
| 2019 | 3,042 | 2 | NA | 23,583 | ||
| 2018 | 2,641 | 1,088 | NA | 22,815 | ||
| 2017 | 2,240 | 8 | NA | 22,859 | ||
| 2016 | 2,134 | NA | NA | 21,781 | ||
| 2015 | 1,251 | NA | NA | NA | ||
| Mount St. Mary’s Hospital and Health Center | 2024 | 2 | 4,730 | 769 | 21,389 | |
| 2023 | 2,308 | 17,832 | 3,229 | 66,430 | ||
| 2022 | 3,480 | 15,060 | 4,534 | 57,865 | ||
| 2021 | 3,819 | 15,380 | 4,517 | 53,489 | ||
| 2020 | 3,983 | 13,722 | 4,133 | 78,292 | ||
| 2019 | 4,810 | 17,861 | 4,725 | 93,195 | ||
| 2018 | 4,994 | 17,971 | 5,057 | 84,654 | ||
| 2017 | 5,729 | 17,802 | 5,147 | 85,135 | ||
| 2016 | 5,843 | 18,950 | 5,593 | 90,377 | ||
| 2015 | 6,227 | 17,958 | 5,320 | 50,122 | ||
| Niagara Falls Memorial Medical Center | 2024 | 1,662 | 7,755 | 1,679 | 10,092 | |
| 2023 | 3,306 | 18,699 | 3,904 | 24,912 | ||
| 2022 | 3,227 | 17,121 | 3,703 | 28,709 | ||
| 2021 | 3,595 | 18,212 | 4,206 | 52,443 | ||
| 2020 | 3,440 | 18,288 | 4,832 | 54,025 | ||
| 2019 | 3,723 | 23,964 | 5,224 | 43,655 | ||
| 2018 | 4,228 | 25,728 | 5,020 | 44,417 | ||
| 2017 | 4,407 | 26,430 | 5,550 | 44,320 | ||
| 2016 | 4,262 | 24,828 | 5,316 | 45,562 | ||
| 2015 | 4,773 | 22,902 | 5,370 | 20,764 | ||
| Oneida | Apex Surgical Center | 2024 | 0 | NA | NA | NA |
| 2023 | 4,788 | NA | NA | NA | ||
| 2022 | 4,871 | NA | NA | NA | ||
| 2021 | 4,397 | NA | NA | 5 | ||
| 2020 | 3,367 | NA | NA | NA | ||
| 2019 | 4,238 | NA | NA | NA | ||
| 2018 | 4,109 | NA | NA | NA | ||
| 2017 | 3,322 | NA | NA | NA | ||
| 2016 | 3,449 | NA | NA | NA | ||
| 2015 | 362 | NA | NA | NA | ||
| Faxton St Luke’s Healthcare Campus | 2024 | 0 | 0 | 0 | 0 | |
| 2023 | 6,567 | 25,317 | 9,988 | 25,508 | ||
| 2022 | 6,011 | 30,193 | 11,665 | 41,318 | ||
| 2021 | 5,921 | 29,198 | 11,923 | 49,591 | ||
| 2020 | 5,189 | 28,548 | 11,357 | 40,937 | ||
| 2019 | 7,469 | 29,140 | 13,829 | 28,323 | ||
| 2018 | 9,606 | 30,683 | 14,362 | 23,445 | ||
| 2017 | 9,444 | 31,934 | 15,043 | 24,229 | ||
| 2016 | 10,009 | 30,585 | 14,919 | 24,650 | ||
| 2015 | 7,683 | 27,873 | 16,041 | 11,443 | ||
| Griffiss Surgery Center | 2024 | 0 | NA | NA | NA | |
| 2023 | 9,309 | NA | NA | NA | ||
| 2022 | 9,221 | NA | NA | NA | ||
| 2021 | 9,602 | NA | NA | NA | ||
| 2020 | 7,956 | NA | NA | NA | ||
| 2019 | 7,597 | NA | NA | NA | ||
| 2018 | 4,774 | NA | NA | NA | ||
| 2017 | 4,505 | NA | NA | 1 | ||
| 2016 | 3,786 | NA | NA | NA | ||
| 2015 | 3,331 | NA | NA | NA | ||
| OMNI Surgery Center | 2024 | 0 | NA | NA | NA | |
| 2023 | 0 | NA | NA | NA | ||
| 2022 | 1,917 | NA | NA | NA | ||
| 2021 | 693 | NA | NA | NA | ||
| 2020 | 1,289 | NA | NA | NA | ||
| 2019 | 3,501 | NA | NA | NA | ||
| 2018 | 3,357 | NA | NA | 3 | ||
| 2017 | 3,440 | NA | NA | NA | ||
| 2016 | 2,486 | NA | NA | NA | ||
| Rome Memorial Hospital, Inc | 2024 | 988 | 9,815 | 1,434 | 10,729 | |
| 2023 | 2,389 | 27,523 | 3,636 | 32,349 | ||
| 2022 | 2,570 | 26,162 | 3,818 | 31,801 | ||
| 2021 | 2,815 | 23,172 | 3,805 | 45,282 | ||
| 2020 | 2,296 | 20,189 | 3,188 | 42,043 | ||
| 2019 | 2,920 | 25,251 | 3,539 | 46,388 | ||
| 2018 | 3,860 | 26,833 | 3,528 | 45,010 | ||
| 2017 | 3,802 | 28,373 | 3,833 | 43,790 | ||
| 2016 | 4,145 | 27,770 | 3,979 | 52,729 | ||
| 2015 | 4,201 | 27,430 | 3,906 | 18,737 | ||
| St. Elizabeth’s Community Health System Campus | 2024 | 0 | 0 | 0 | 0 | |
| 2023 | 3,164 | 24,181 | 7,480 | 88,595 | ||
| 2022 | 3,725 | 28,610 | 8,047 | 95,885 | ||
| 2021 | 3,983 | 27,470 | 9,097 | 106,775 | ||
| 2020 | 3,800 | 23,141 | 9,209 | 109,278 | ||
| 2019 | 4,141 | 27,239 | 9,800 | 93,650 | ||
| 2018 | 4,999 | 29,673 | 9,856 | 84,622 | ||
| 2017 | 4,643 | 27,640 | 9,840 | 74,964 | ||
| 2016 | 6,273 | 27,104 | 10,063 | 74,944 | ||
| 2015 | 7,333 | 26,288 | 9,978 | 7,467 | ||
| Wynn Hospital | 2024 | 5,748 | 25,120 | 9,514 | 33,779 | |
| 2023 | 1,694 | 5,907 | 2,307 | 11,680 | ||
| Onondaga | Camillus Surgery Center | 2024 | 0 | NA | NA | NA |
| 2023 | 658 | NA | NA | NA | ||
| 2022 | 874 | NA | NA | NA | ||
| 2021 | 1,158 | NA | NA | NA | ||
| 2020 | 937 | NA | NA | NA | ||
| 2019 | 1,481 | NA | NA | NA | ||
| 2018 | 1,697 | NA | NA | 1 | ||
| 2017 | 2,447 | NA | NA | 18 | ||
| 2016 | 2,309 | NA | NA | NA | ||
| 2015 | 2,616 | NA | NA | NA | ||
| Crouse Hospital | 2024 | 6,716 | 19,768 | 8,577 | 21,237 | |
| 2023 | 15,037 | 47,147 | 19,973 | 48,244 | ||
| 2022 | 14,482 | 44,814 | 20,342 | 46,864 | ||
| 2021 | 14,550 | 47,661 | 20,874 | 48,595 | ||
| 2020 | 21,209 | 56,636 | 19,940 | 53,876 | ||
| 2019 | 14,785 | 52,137 | 21,284 | 49,923 | ||
| 2018 | 14,330 | 39,851 | 22,168 | 77,435 | ||
| 2017 | 12,792 | 33,234 | 20,351 | 83,521 | ||
| 2016 | 12,399 | 34,036 | 21,882 | 66,791 | ||
| 2015 | 12,123 | 32,732 | 22,477 | 16,092 | ||
| Crouse Hospital - Commonwealth Division | 2024 | NA | NA | 211 | NA | |
| 2023 | NA | NA | 389 | NA | ||
| 2022 | NA | NA | 430 | NA | ||
| 2021 | NA | NA | 377 | NA | ||
| 2020 | NA | NA | 427 | NA | ||
| 2019 | NA | NA | 722 | NA | ||
| 2018 | NA | NA | 732 | NA | ||
| 2017 | NA | NA | 727 | NA | ||
| 2016 | NA | NA | 657 | NA | ||
| Digestive Disease Center of Central New York, LLC | 2024 | 6,036 | NA | NA | NA | |
| 2023 | 11,082 | NA | NA | NA | ||
| 2022 | 10,293 | NA | NA | NA | ||
| 2021 | 9,898 | NA | NA | NA | ||
| 2020 | 9,588 | NA | NA | NA | ||
| 2019 | 10,935 | NA | NA | NA | ||
| 2018 | 10,756 | NA | NA | NA | ||
| 2017 | 9,863 | NA | NA | NA | ||
| 2016 | 9,739 | NA | NA | NA | ||
| 2015 | 9,067 | NA | NA | NA | ||
| Endoscopic Procedure Center | 2024 | 633 | NA | NA | NA | |
| 2023 | 7,126 | NA | NA | NA | ||
| 2022 | 7,998 | NA | NA | NA | ||
| 2021 | 6,959 | NA | NA | NA | ||
| 2020 | 5,402 | NA | NA | NA | ||
| 2019 | 5,914 | NA | NA | NA | ||
| 2018 | 5,986 | NA | NA | NA | ||
| 2017 | 5,980 | NA | NA | NA | ||
| 2016 | 5,913 | NA | NA | NA | ||
| 2015 | 5,747 | NA | NA | NA | ||
| Endoscopy Center of Central New York | 2024 | 404 | NA | NA | NA | |
| 2023 | 4,554 | NA | NA | NA | ||
| 2022 | 4,236 | NA | NA | NA | ||
| 2021 | 3,021 | NA | NA | NA | ||
| 2020 | 2,910 | NA | NA | NA | ||
| 2019 | 4,395 | NA | NA | NA | ||
| 2018 | 4,338 | NA | NA | 2,633 | ||
| 2017 | 3,680 | NA | NA | 116 | ||
| 2016 | 4,141 | NA | NA | NA | ||
| 2015 | 3,902 | NA | NA | NA | ||
| Heritage One Day Surgery | 2024 | 6,268 | NA | NA | NA | |
| 2023 | 15,092 | NA | NA | NA | ||
| 2022 | 14,942 | NA | NA | NA | ||
| 2021 | 16,172 | NA | NA | 1 | ||
| 2020 | 14,611 | NA | NA | NA | ||
| 2019 | 20,722 | NA | NA | NA | ||
| 2018 | 17,971 | NA | NA | NA | ||
| 2017 | 16,851 | NA | NA | 1 | ||
| 2016 | 15,517 | NA | NA | NA | ||
| 2015 | 14,345 | NA | NA | NA | ||
| SJHHC Northeast Medical Center | 2024 | 2,188 | NA | NA | 3,152 | |
| 2023 | 8,874 | NA | NA | 17,646 | ||
| 2022 | 6,444 | NA | NA | 17,902 | ||
| 2021 | 7,630 | NA | NA | 22,056 | ||
| 2020 | 6,464 | NA | NA | 21,700 | ||
| 2019 | 12,396 | 4 | NA | 47,288 | ||
| 2018 | 9,916 | NA | NA | 48,420 | ||
| 2017 | 10,492 | NA | NA | 59,856 | ||
| 2016 | 11,008 | NA | NA | 61,900 | ||
| 2015 | 11,532 | NA | NA | 55,208 | ||
| Specialists’ One-Day Surgery Center, LLC | 2024 | 4,815 | NA | NA | NA | |
| 2023 | 14,213 | NA | NA | NA | ||
| 2022 | 19,671 | NA | NA | NA | ||
| 2021 | 25,022 | NA | NA | NA | ||
| 2020 | 22,554 | NA | NA | NA | ||
| 2019 | 30,322 | NA | NA | NA | ||
| 2018 | 14,469 | NA | NA | NA | ||
| 2017 | 14,518 | NA | NA | NA | ||
| 2016 | 14,852 | NA | NA | NA | ||
| 2015 | 14,358 | NA | NA | NA | ||
| Specialty Surgery Center of Central New York | 2024 | 6,005 | NA | NA | 0 | |
| 2023 | 14,436 | NA | NA | 0 | ||
| 2022 | 14,120 | NA | NA | 1 | ||
| 2021 | 13,764 | NA | NA | NA | ||
| 2020 | 10,193 | NA | NA | NA | ||
| 2019 | 14,412 | NA | NA | NA | ||
| 2018 | 13,697 | NA | NA | NA | ||
| 2017 | 12,684 | NA | NA | 8 | ||
| 2016 | 12,173 | NA | NA | 18 | ||
| 2015 | 10,876 | NA | NA | 11 | ||
| St Josephs Hospital Health Center-Asc | 2024 | 0 | NA | NA | 0 | |
| 2023 | 0 | NA | NA | 0 | ||
| 2022 | 608 | NA | NA | 2,102 | ||
| 2021 | 0 | NA | NA | NA | ||
| 2020 | 2,096 | NA | NA | NA | ||
| 2019 | 18,368 | NA | NA | NA | ||
| 2018 | 16,680 | NA | NA | NA | ||
| 2017 | 17,332 | NA | NA | NA | ||
| 2016 | 18,952 | NA | NA | NA | ||
| 2015 | 18,148 | NA | NA | NA | ||
| St. Joseph’s Hospital Health Center | 2024 | 5,872 | 41,738 | 16,442 | 51,574 | |
| 2023 | 21,562 | 81,234 | 35,706 | 98,214 | ||
| 2022 | 15,818 | 63,064 | 34,576 | 240,510 | ||
| 2021 | 16,926 | 76,622 | 44,496 | 255,960 | ||
| 2020 | 16,774 | 79,734 | 44,778 | 171,858 | ||
| 2019 | 34,044 | 198,256 | 108,060 | 359,656 | ||
| 2018 | 32,004 | 199,572 | 108,068 | 333,996 | ||
| 2017 | 30,608 | 204,504 | 106,252 | 330,412 | ||
| 2016 | 29,348 | 191,444 | 106,060 | 306,408 | ||
| 2015 | 26,160 | 195,976 | 102,940 | 206,768 | ||
| Syracuse Endoscopy Associates, LLC | 2024 | 3,180 | NA | NA | NA | |
| 2023 | 7,270 | NA | NA | NA | ||
| 2022 | 7,129 | NA | NA | NA | ||
| 2021 | 7,068 | NA | NA | NA | ||
| 2020 | 5,390 | NA | NA | NA | ||
| 2019 | 6,417 | NA | NA | NA | ||
| 2018 | 6,590 | NA | NA | NA | ||
| 2017 | 6,762 | NA | NA | NA | ||
| 2016 | 6,046 | NA | NA | NA | ||
| 2015 | 5,498 | NA | NA | NA | ||
| Syracuse Surgery Center | 2024 | 861 | NA | NA | 16 | |
| 2023 | 2,492 | NA | NA | 24 | ||
| 2022 | 2,267 | NA | NA | 28 | ||
| 2021 | 1,975 | NA | NA | 20 | ||
| 2020 | 1,476 | NA | NA | 17 | ||
| 2019 | 2,018 | NA | NA | 19 | ||
| 2018 | 1,771 | NA | NA | 22 | ||
| 2017 | 1,493 | NA | NA | 11 | ||
| 2016 | 1,225 | NA | NA | NA | ||
| 2015 | 1,145 | NA | NA | 15 | ||
| UHCC - Harrison | 2024 | 1,018 | NA | NA | 18,311 | |
| 2023 | 3,331 | NA | NA | 65,013 | ||
| 2022 | 2,728 | NA | NA | 63,796 | ||
| 2021 | 3,127 | 3 | NA | 58,646 | ||
| 2020 | 2,724 | 3 | NA | 56,667 | ||
| 2019 | 2,775 | NA | NA | 62,066 | ||
| 2018 | 2,251 | 2 | NA | 57,936 | ||
| 2017 | 2,244 | 1 | NA | 52,316 | ||
| 2016 | 2,137 | NA | NA | 51,039 | ||
| 2015 | 1,874 | NA | NA | 29,453 | ||
| UPSTATE University Hospital at Community General | 2024 | 2,047 | 9,036 | 3,132 | 23,203 | |
| 2023 | 5,455 | 26,817 | 9,843 | 72,262 | ||
| 2022 | 3,934 | 23,740 | 8,895 | 82,958 | ||
| 2021 | 4,172 | 26,327 | 10,215 | 92,477 | ||
| 2020 | 3,228 | 24,192 | 9,322 | 48,220 | ||
| 2019 | 4,200 | 24,864 | 10,043 | 46,983 | ||
| 2018 | 3,838 | 22,516 | 9,445 | 40,587 | ||
| 2017 | 3,317 | 21,692 | 8,524 | 37,336 | ||
| 2016 | 3,185 | 22,135 | 8,253 | 37,746 | ||
| 2015 | 2,927 | 22,148 | 8,307 | 16,978 | ||
| University Gastroenterology at the Philip G. Holtzapple Endoscopy Center | 2024 | 112 | NA | NA | NA | |
| 2023 | 688 | NA | NA | NA | ||
| 2022 | 609 | NA | NA | NA | ||
| 2021 | 736 | NA | NA | NA | ||
| 2020 | 799 | NA | NA | NA | ||
| 2019 | 1,439 | NA | NA | NA | ||
| 2018 | 1,693 | NA | NA | NA | ||
| 2017 | 2,168 | NA | NA | 17 | ||
| 2016 | 2,000 | NA | NA | 17 | ||
| 2015 | 1,622 | NA | NA | 17 | ||
| University Hospital SUNY Health Science Center | 2024 | 3,423 | 18,874 | 7,419 | 61,980 | |
| 2023 | 9,746 | 52,088 | 21,063 | 129,525 | ||
| 2022 | 8,338 | 45,241 | 20,178 | 91,034 | ||
| 2021 | 7,880 | 47,440 | 22,979 | 97,755 | ||
| 2020 | 7,521 | 46,274 | 22,617 | 77,139 | ||
| 2019 | 9,427 | 57,231 | 25,241 | 82,283 | ||
| 2018 | 10,315 | 56,432 | 24,442 | 81,454 | ||
| 2017 | 10,880 | 56,599 | 24,821 | 86,538 | ||
| 2016 | 10,823 | 57,255 | 22,744 | 76,703 | ||
| 2015 | 10,375 | 56,471 | 21,385 | 52,893 | ||
| Upstate Orthopedics Ambulatory Surgery Center | 2024 | 2,863 | NA | NA | NA | |
| 2023 | 6,252 | NA | NA | NA | ||
| 2022 | 5,849 | NA | NA | NA | ||
| 2021 | 6,237 | NA | NA | NA | ||
| 2020 | 4,799 | NA | NA | NA | ||
| 2019 | 5,630 | NA | NA | NA | ||
| 2018 | 5,609 | NA | NA | NA | ||
| 2017 | 5,500 | NA | NA | NA | ||
| 2016 | 5,216 | NA | NA | NA | ||
| 2015 | 5,413 | NA | NA | NA | ||
| Ontario | Clifton Springs Hospital and Clinic | 2024 | 3,313 | 3,716 | 1,042 | 26,345 |
| 2023 | 7,793 | 8,826 | 2,812 | 58,822 | ||
| 2022 | 6,501 | 7,636 | 2,952 | 58,084 | ||
| 2021 | 6,625 | 6,970 | 2,700 | 59,485 | ||
| 2020 | 4,737 | 6,851 | 2,374 | 47,295 | ||
| 2019 | 5,366 | 7,727 | 2,471 | 53,124 | ||
| 2018 | 4,231 | 7,338 | 2,417 | 47,661 | ||
| 2017 | 3,618 | 7,098 | 2,350 | 44,797 | ||
| 2016 | 3,988 | 5,410 | 2,230 | 31,230 | ||
| 2015 | 4,849 | 6,495 | 2,351 | 15,771 | ||
| F.F. Thompson Hospital | 2024 | 5,702 | 13,941 | 2,933 | 24,011 | |
| 2023 | 10,993 | 28,347 | 5,610 | 77,553 | ||
| 2022 | 9,931 | 26,425 | 5,644 | 115,354 | ||
| 2021 | 8,897 | 24,318 | 6,024 | 146,865 | ||
| 2020 | 9,520 | 20,154 | 5,229 | 111,234 | ||
| 2019 | 11,027 | 23,603 | 5,581 | 105,277 | ||
| 2018 | 11,258 | 23,394 | 5,494 | 176,074 | ||
| 2017 | 11,165 | 23,176 | 5,550 | 168,978 | ||
| 2016 | 11,087 | 22,828 | 5,606 | 155,441 | ||
| 2015 | 10,683 | 21,706 | 5,751 | 14,548 | ||
| Finger Lakes Surgery Center | 2024 | 2,507 | NA | NA | 52 | |
| 2023 | 5,189 | NA | NA | 133 | ||
| 2022 | 2,067 | NA | NA | 70 | ||
| 2021 | 5,285 | NA | NA | 69 | ||
| 2020 | 5,223 | NA | NA | 60 | ||
| 2019 | 6,510 | NA | NA | 55 | ||
| 2018 | 6,009 | NA | NA | 45 | ||
| 2017 | 6,839 | NA | NA | 45 | ||
| 2016 | 5,838 | NA | NA | 26 | ||
| 2015 | 6,357 | NA | NA | 20 | ||
| Geneva General Hospital | 2024 | 1,099 | 7,904 | 1,112 | 19,398 | |
| 2023 | 2,249 | 19,334 | 2,538 | 45,384 | ||
| 2022 | 3,680 | 19,665 | 2,644 | 45,380 | ||
| 2021 | 1,750 | 17,293 | 2,970 | 51,932 | ||
| 2020 | 1,516 | 15,611 | 2,894 | 47,635 | ||
| 2019 | 1,865 | 18,866 | 3,460 | 45,666 | ||
| 2018 | 1,419 | 18,583 | 3,716 | 42,434 | ||
| 2017 | 1,434 | 19,948 | 3,794 | 42,916 | ||
| 2016 | 1,139 | 19,682 | 3,750 | 42,020 | ||
| 2015 | 1,141 | 20,268 | 3,845 | 10,336 | ||
| Orange | Bon Secours Community Hospital | 2024 | 807 | 6,663 | 1,213 | 7,271 |
| 2023 | 1,949 | 17,360 | 2,721 | 21,072 | ||
| 2022 | 1,819 | 17,643 | 3,008 | 26,027 | ||
| 2021 | 1,969 | 16,646 | 3,237 | 33,913 | ||
| 2020 | 1,571 | 13,768 | 3,044 | 24,855 | ||
| 2019 | 1,700 | 18,453 | 3,500 | 22,462 | ||
| 2018 | 1,712 | 19,718 | 3,658 | 23,991 | ||
| 2017 | 1,772 | 19,500 | 3,551 | 27,106 | ||
| 2016 | 2,010 | 20,637 | 3,593 | 29,626 | ||
| 2015 | 2,177 | 20,940 | 3,948 | 7,055 | ||
| Crystal Run Ambulatory Surgery Center of Middletown | 2024 | 2,000 | NA | NA | NA | |
| 2023 | 8,219 | NA | NA | NA | ||
| 2022 | 8,486 | NA | NA | NA | ||
| 2021 | 8,925 | NA | NA | NA | ||
| 2020 | 7,192 | NA | NA | NA | ||
| 2019 | 9,552 | NA | NA | NA | ||
| 2018 | 10,342 | NA | NA | NA | ||
| 2017 | 11,571 | NA | NA | NA | ||
| 2016 | 10,944 | NA | NA | NA | ||
| 2015 | 10,615 | NA | NA | NA | ||
| Eastern Orange Ambulatory Surgery Center, LLC | 2024 | 1,619 | NA | NA | NA | |
| 2023 | 4,858 | NA | NA | NA | ||
| 2022 | 4,701 | NA | NA | NA | ||
| 2021 | 4,837 | NA | NA | NA | ||
| 2020 | 3,884 | NA | NA | NA | ||
| 2019 | 5,278 | NA | NA | 1 | ||
| 2018 | 4,940 | NA | NA | NA | ||
| 2017 | 4,992 | NA | NA | NA | ||
| 2016 | 4,431 | NA | NA | NA | ||
| 2015 | 4,304 | NA | NA | NA | ||
| Garnet Health Medical Center | 2024 | 6,484 | 21,777 | 9,098 | 30,974 | |
| 2023 | 13,485 | 52,603 | 20,640 | 69,032 | ||
| 2022 | 12,190 | 52,569 | 20,046 | 71,460 | ||
| 2021 | 13,064 | 52,440 | 20,621 | 67,827 | ||
| 2020 | 12,050 | 46,423 | 20,945 | 61,375 | ||
| 2019 | 13,809 | 56,338 | 23,770 | 68,073 | ||
| 2018 | 13,814 | 55,752 | 23,632 | 58,436 | ||
| 2017 | 11,728 | 52,459 | 22,939 | 60,309 | ||
| 2016 | 10,611 | 54,858 | 23,485 | 28,414 | ||
| 2015 | 9,468 | 54,718 | 22,659 | 12,482 | ||
| Hudson Valley Ambulatory Surgery, LLC | 2024 | 265 | NA | NA | NA | |
| 2023 | 1,826 | NA | NA | NA | ||
| 2022 | 2,201 | NA | NA | NA | ||
| 2021 | 2,449 | NA | NA | NA | ||
| 2020 | 1,931 | NA | NA | NA | ||
| 2019 | 2,660 | NA | NA | NA | ||
| 2018 | 2,525 | NA | NA | NA | ||
| 2017 | 2,539 | NA | NA | NA | ||
| 2016 | 2,700 | NA | NA | NA | ||
| 2015 | 2,897 | NA | NA | NA | ||
| Montefiore St. Luke’s Cornwall - Cornwall Campus | 2024 | NA | 0 | NA | 11,420 | |
| 2023 | NA | 0 | NA | 23,628 | ||
| 2022 | NA | 4 | NA | 20,806 | ||
| 2021 | NA | 2 | NA | 17,820 | ||
| 2020 | NA | 2 | NA | 16,852 | ||
| 2019 | NA | 2 | NA | 19,541 | ||
| 2018 | NA | 6 | NA | 19,438 | ||
| 2017 | NA | 666 | NA | 13,202 | ||
| 2016 | NA | 11,707 | NA | 10,217 | ||
| 2015 | NA | 13,059 | NA | 9,875 | ||
| Orange Regional Medical Pavilion | 2024 | NA | NA | NA | 5,012 | |
| 2023 | NA | NA | NA | 12,727 | ||
| 2022 | NA | NA | NA | 14,257 | ||
| 2021 | 0 | 1 | NA | 15,746 | ||
| 2020 | NA | 1 | NA | 11,413 | ||
| 2019 | 1 | NA | NA | 10,093 | ||
| 2018 | NA | 1 | NA | 7,281 | ||
| 2017 | NA | 2 | NA | 4,507 | ||
| 2016 | 1,189 | NA | NA | 35,217 | ||
| 2015 | 1,549 | NA | NA | NA | ||
| St Anthony Community Hospital | 2024 | 1,330 | 5,075 | 773 | 9,882 | |
| 2023 | 3,017 | 12,428 | 2,098 | 24,130 | ||
| 2022 | 3,141 | 12,189 | 2,120 | 28,848 | ||
| 2021 | 3,421 | 11,121 | 1,996 | 36,633 | ||
| 2020 | 2,831 | 8,303 | 2,487 | 26,942 | ||
| 2019 | 3,031 | 9,906 | 2,508 | 24,386 | ||
| 2018 | 3,200 | 9,793 | 2,258 | 24,008 | ||
| 2017 | 3,309 | 10,110 | 2,374 | 24,499 | ||
| 2016 | 3,415 | 10,337 | 2,568 | 24,790 | ||
| 2015 | 3,537 | 10,507 | 2,608 | 7,967 | ||
| St Luke’s Cornwall Hospital/Newburgh | 2024 | 2,306 | 22,066 | 4,916 | 7,862 | |
| 2023 | 4,761 | 41,776 | 10,756 | 14,174 | ||
| 2022 | 4,971 | 38,692 | 10,219 | 15,439 | ||
| 2021 | 4,952 | 33,628 | 10,026 | 20,129 | ||
| 2020 | 4,416 | 28,476 | 9,741 | 12,506 | ||
| 2019 | 5,798 | 38,377 | 11,196 | 14,466 | ||
| 2018 | 5,361 | 38,263 | 10,986 | 14,561 | ||
| 2017 | 5,459 | 37,835 | 10,464 | 15,033 | ||
| 2016 | 5,755 | 34,467 | 10,399 | 15,924 | ||
| 2015 | 5,383 | 36,277 | 10,317 | 6,834 | ||
| Orleans | Medina Memorial Hospital | 2024 | 180 | 3,764 | 90 | 13,080 |
| 2023 | 757 | 7,754 | 211 | 29,838 | ||
| 2022 | 943 | 6,858 | 261 | 22,742 | ||
| 2021 | 1,116 | 5,599 | 307 | 17,741 | ||
| 2020 | 987 | 5,294 | 252 | 14,140 | ||
| 2019 | 1,183 | 6,817 | 337 | 16,696 | ||
| 2018 | 1,040 | 7,118 | 292 | 16,692 | ||
| 2017 | 1,071 | 7,305 | 385 | 18,078 | ||
| 2016 | 1,440 | 8,418 | 795 | 14,685 | ||
| 2015 | 1,503 | 8,282 | 1,250 | 1,808 | ||
| Oswego | Lakeview Center for Mental Health and Wellness | 2024 | NA | NA | 528 | 5,471 |
| 2023 | NA | NA | 1,193 | 16,092 | ||
| 2022 | NA | NA | 1,198 | 18,527 | ||
| 2021 | NA | NA | 1,284 | 17,028 | ||
| 2020 | NA | NA | 1,109 | 14,441 | ||
| 2019 | NA | NA | 1,114 | 11,340 | ||
| 2018 | NA | NA | 796 | 13,463 | ||
| 2017 | NA | NA | 788 | 14,029 | ||
| 2016 | NA | NA | 781 | 16,602 | ||
| 2015 | NA | NA | 711 | 17,928 | ||
| Oswego Hospital | 2024 | 1,777 | 6,562 | 1,634 | 23,434 | |
| 2023 | 5,569 | 20,424 | 3,463 | 54,471 | ||
| 2022 | 4,396 | 20,312 | 3,584 | 51,725 | ||
| 2021 | 3,783 | 20,207 | 3,645 | 60,339 | ||
| 2020 | 4,084 | 18,639 | 3,515 | 45,154 | ||
| 2019 | 5,157 | 22,767 | 3,764 | 50,145 | ||
| 2018 | 4,905 | 23,850 | 3,791 | 50,393 | ||
| 2017 | 6,383 | 25,020 | 3,714 | 49,206 | ||
| 2016 | 5,953 | 23,408 | 3,953 | 72,454 | ||
| 2015 | 5,500 | 23,313 | 4,013 | 4,951 | ||
| Otsego | A.O. Fox Memorial Hospital | 2024 | 1,536 | 7,840 | 704 | 22,253 |
| 2023 | 3,356 | 16,170 | 1,144 | 43,498 | ||
| 2022 | 3,013 | 16,108 | 1,143 | 40,743 | ||
| 2021 | 2,941 | 16,976 | 1,532 | 32,094 | ||
| 2020 | 2,499 | 18,141 | 1,712 | 32,092 | ||
| 2019 | 2,908 | 23,002 | 2,217 | 30,923 | ||
| 2018 | 4,216 | 23,910 | 2,152 | 36,564 | ||
| 2017 | 3,786 | 15,056 | 2,009 | 88,531 | ||
| 2016 | 3,981 | 13,478 | 2,253 | 85,721 | ||
| 2015 | 3,804 | 13,926 | 2,565 | 38,808 | ||
| Bassett Healthcare Oneonta Specialty Services | 2024 | 1,382 | NA | NA | 22,322 | |
| 2023 | 2,908 | NA | NA | 59,635 | ||
| 2022 | 2,425 | NA | NA | 57,800 | ||
| 2021 | 2,631 | NA | NA | 58,536 | ||
| 2020 | 2,355 | NA | NA | 50,694 | ||
| 2019 | 3,066 | NA | NA | 58,606 | ||
| 2018 | 1,919 | NA | NA | 46,403 | ||
| 2017 | 1,984 | 23 | NA | 46,086 | ||
| 2016 | 2,222 | 49 | NA | 39,708 | ||
| 2015 | 2,269 | 34 | NA | 34,066 | ||
| Mary Imogene Bassett Hospital | 2024 | 5,620 | 6,718 | 4,723 | 88,400 | |
| 2023 | 10,606 | 14,146 | 9,128 | 230,922 | ||
| 2022 | 9,139 | 13,368 | 8,785 | 233,220 | ||
| 2021 | 9,953 | 12,120 | 9,773 | 251,063 | ||
| 2020 | 8,216 | 10,785 | 9,369 | 211,802 | ||
| 2019 | 9,584 | 13,668 | 9,981 | 231,241 | ||
| 2018 | 9,276 | 13,981 | 10,595 | 206,794 | ||
| 2017 | 10,617 | 13,614 | 10,082 | 217,628 | ||
| 2016 | 10,238 | 12,728 | 10,437 | 256,495 | ||
| 2015 | 9,830 | 12,324 | 9,710 | 149,182 | ||
| Putnam | Putnam Gastroenterology | 2024 | 0 | NA | NA | NA |
| 2023 | 285 | NA | NA | NA | ||
| 2022 | 0 | NA | NA | NA | ||
| 2021 | 2,543 | NA | NA | NA | ||
| 2020 | 276 | NA | NA | NA | ||
| 2019 | 518 | NA | NA | NA | ||
| 2018 | 2,374 | NA | NA | NA | ||
| 2017 | 1,801 | NA | NA | NA | ||
| 2016 | 2,615 | NA | NA | NA | ||
| 2015 | 2,368 | NA | NA | NA | ||
| Putnam Hospital | 2024 | 2,870 | 11,448 | 2,064 | 13,564 | |
| 2023 | 7,392 | 36,192 | 6,604 | 37,818 | ||
| 2022 | 7,166 | 34,226 | 7,164 | 33,352 | ||
| 2021 | 8,108 | 34,370 | 8,656 | 39,952 | ||
| 2020 | 7,496 | 31,482 | 9,602 | 32,124 | ||
| 2019 | 21,388 | 88,236 | 24,204 | 80,360 | ||
| 2018 | 22,700 | 88,644 | 26,264 | 83,364 | ||
| 2017 | 23,732 | 87,112 | 28,320 | 80,084 | ||
| 2016 | 24,272 | 88,664 | 28,000 | 82,116 | ||
| 2015 | 27,332 | 86,668 | 27,192 | 21,636 | ||
| Queens | Apex Eye Surgery Center | 2024 | 195 | NA | NA | NA |
| 2023 | 2,570 | NA | NA | NA | ||
| 2022 | 1,756 | NA | NA | NA | ||
| 2021 | 1,631 | NA | NA | 3 | ||
| 2020 | 1,159 | NA | NA | NA | ||
| 2019 | 2,071 | NA | NA | NA | ||
| 2018 | 1,864 | NA | NA | NA | ||
| 2017 | 2,084 | NA | NA | NA | ||
| 2016 | 1,232 | NA | NA | NA | ||
| 2015 | 439 | NA | NA | NA | ||
| Choices Women’s Medical Center Inc | 2024 | 0 | NA | NA | 0 | |
| 2023 | 0 | NA | NA | 0 | ||
| 2022 | 0 | NA | NA | 0 | ||
| 2021 | 0 | NA | NA | 0 | ||
| 2017 | 6,158 | NA | NA | 736 | ||
| 2016 | 14,786 | NA | NA | 1,423 | ||
| 2015 | 15,453 | NA | NA | 1,463 | ||
| CitiMed Surgery Center | 2024 | 1,507 | NA | NA | NA | |
| 2023 | 4,534 | NA | NA | NA | ||
| 2022 | 4,744 | NA | NA | NA | ||
| 2021 | 3,178 | NA | NA | NA | ||
| EMU Health | 2024 | 0 | NA | NA | NA | |
| 2023 | 3,827 | NA | NA | NA | ||
| 2022 | 2,913 | NA | NA | NA | ||
| 2021 | 1,205 | NA | NA | NA | ||
| 2020 | 2,947 | NA | NA | NA | ||
| 2019 | 7,297 | NA | NA | 26 | ||
| 2018 | 6,393 | NA | NA | 17 | ||
| 2017 | 5,712 | NA | NA | NA | ||
| 2016 | 5,159 | NA | NA | NA | ||
| 2015 | 6,220 | NA | NA | NA | ||
| Elmhurst Hospital Center | 2024 | 2,715 | 54,016 | 9,816 | 230,218 | |
| 2023 | 6,277 | 115,027 | 20,679 | 477,616 | ||
| 2022 | 6,301 | 108,160 | 19,907 | 540,457 | ||
| 2021 | 7,368 | 86,001 | 18,122 | 819,620 | ||
| 2020 | 5,196 | 62,500 | 17,111 | 532,839 | ||
| 2019 | 7,587 | 88,005 | 18,740 | 459,604 | ||
| 2018 | 6,688 | 101,605 | 19,951 | 481,792 | ||
| 2017 | 6,844 | 103,595 | 20,854 | 470,968 | ||
| 2016 | 7,288 | 111,134 | 19,762 | 472,622 | ||
| 2015 | 7,919 | 114,433 | 21,194 | 457,852 | ||
| Flushing Endoscopy Center, LLC | 2024 | 4,004 | NA | NA | NA | |
| 2023 | 11,323 | NA | NA | NA | ||
| 2022 | 10,030 | NA | NA | NA | ||
| 2021 | 8,541 | NA | NA | NA | ||
| 2020 | 5,275 | NA | NA | NA | ||
| 2019 | 8,739 | NA | NA | NA | ||
| 2018 | 11,304 | NA | NA | NA | ||
| 2017 | 13,429 | NA | NA | NA | ||
| 2016 | 14,662 | NA | NA | NA | ||
| 2015 | 15,116 | NA | NA | NA | ||
| Flushing Hospital Medical Center | 2024 | 1,591 | 10,074 | 4,404 | 33,281 | |
| 2023 | 4,885 | 31,778 | 12,542 | 99,984 | ||
| 2022 | 4,818 | 29,603 | 12,502 | 102,712 | ||
| 2021 | 4,744 | 24,406 | 11,557 | 111,431 | ||
| 2020 | 3,927 | 21,287 | 12,780 | 90,350 | ||
| 2019 | 5,848 | 34,414 | 15,434 | 99,254 | ||
| 2018 | 5,928 | 34,947 | 15,611 | 99,654 | ||
| 2017 | 6,332 | 35,185 | 16,706 | 103,596 | ||
| 2016 | 6,472 | 35,295 | 18,075 | 109,659 | ||
| 2015 | 6,553 | 35,215 | 16,415 | 88,800 | ||
| Gramercy Surgery Center, Inc. - Queens | 2024 | 1,204 | NA | NA | NA | |
| 2023 | 3,544 | NA | NA | NA | ||
| 2022 | 3,055 | NA | NA | NA | ||
| 2021 | 2,290 | NA | NA | NA | ||
| 2020 | 1,578 | NA | NA | NA | ||
| 2019 | 1,808 | NA | NA | 1 | ||
| 2018 | 1,828 | NA | NA | NA | ||
| 2017 | 2,205 | NA | NA | 3 | ||
| 2016 | 1,235 | NA | NA | NA | ||
| 2015 | 328 | NA | NA | NA | ||
| Jamaica Hospital Medical Center | 2024 | 1,898 | 32,264 | 5,515 | 33,290 | |
| 2023 | 5,822 | 91,586 | 15,763 | 102,247 | ||
| 2022 | 5,352 | 84,955 | 16,023 | 94,552 | ||
| 2021 | 5,254 | 74,833 | 19,018 | 132,247 | ||
| 2020 | 3,719 | 62,692 | 17,192 | 76,317 | ||
| 2019 | 5,923 | 94,484 | 17,880 | 110,502 | ||
| 2018 | 5,453 | 92,388 | 18,842 | 101,175 | ||
| 2017 | 4,990 | 97,787 | 21,498 | 102,462 | ||
| 2016 | 5,665 | 101,984 | 23,912 | 116,779 | ||
| 2015 | 6,012 | 102,396 | 23,755 | 97,826 | ||
| Long Island Jewish Forest Hills | 2024 | 4,092 | 29,948 | 10,170 | 14,018 | |
| 2023 | 12,650 | 90,282 | 30,018 | 45,864 | ||
| 2022 | 12,136 | 88,228 | 30,152 | 46,358 | ||
| 2021 | 11,172 | 79,824 | 29,474 | 48,558 | ||
| 2020 | 8,616 | 66,656 | 29,570 | 36,592 | ||
| 2019 | 22,160 | 167,096 | 66,932 | 93,184 | ||
| 2018 | 21,676 | 172,924 | 67,388 | 101,572 | ||
| 2017 | 17,948 | 170,332 | 63,024 | 103,168 | ||
| 2016 | 17,924 | 168,412 | 63,768 | 95,188 | ||
| 2015 | 17,320 | 154,432 | 67,180 | 74,488 | ||
| Long Island Jewish Medical Center | 2024 | 9,344 | 41,722 | 27,090 | 148,588 | |
| 2023 | 26,454 | 129,040 | 79,816 | 447,812 | ||
| 2022 | 24,642 | 120,464 | 78,860 | 471,776 | ||
| 2021 | 24,450 | 122,054 | 82,022 | 483,770 | ||
| 2020 | 18,800 | 108,616 | 76,118 | 414,056 | ||
| 2019 | 52,808 | 283,428 | 176,060 | 902,240 | ||
| 2018 | 48,620 | 284,848 | 179,324 | 895,080 | ||
| 2017 | 46,940 | 278,180 | 175,040 | 869,176 | ||
| 2016 | 49,192 | 271,668 | 169,720 | 767,116 | ||
| 2015 | 45,112 | 259,368 | 163,840 | 628,728 | ||
| Medex Diagnostic and Treatment Center | 2024 | 2,271 | NA | NA | NA | |
| 2023 | 3,318 | NA | NA | NA | ||
| 2022 | 89 | NA | NA | NA | ||
| Mount Sinai Hospital - Mount Sinai Hospital of Queens | 2024 | 2,171 | 7,010 | 3,970 | 30,216 | |
| 2023 | 5,916 | 59,594 | 9,706 | 51,357 | ||
| 2022 | 4,771 | 58,771 | 8,850 | 56,984 | ||
| 2021 | 3,414 | 58,942 | 7,854 | 65,116 | ||
| 2020 | 4,333 | 48,206 | 8,183 | 38,966 | ||
| 2019 | 4,803 | 54,605 | 9,494 | 52,731 | ||
| 2018 | 4,941 | 56,306 | 9,686 | 52,908 | ||
| 2017 | 4,586 | 51,654 | 8,758 | 46,158 | ||
| 2016 | 4,610 | 48,421 | 8,379 | 42,619 | ||
| 2015 | 4,562 | 41,599 | 8,226 | 39,421 | ||
| New York Surgery Center Queens, LLC | 2024 | 0 | NA | NA | NA | |
| 2023 | 1,805 | NA | NA | NA | ||
| 2022 | 2,235 | NA | NA | NA | ||
| 2021 | 2,216 | NA | NA | NA | ||
| 2020 | 1,676 | NA | NA | NA | ||
| 2019 | 1,820 | NA | NA | NA | ||
| 2018 | 2,769 | NA | NA | NA | ||
| 2017 | 3,337 | NA | NA | NA | ||
| 2016 | 3,966 | NA | NA | NA | ||
| 2015 | 3,086 | NA | NA | NA | ||
| NewYork-Presbyterian/Queens | 2024 | 9,679 | 35,360 | 14,630 | 82,045 | |
| 2023 | 18,660 | 75,008 | 28,315 | 183,886 | ||
| 2022 | 16,858 | 67,380 | 27,632 | 210,989 | ||
| 2021 | 13,960 | 58,744 | 28,406 | 199,870 | ||
| 2020 | 13,181 | 59,416 | 28,200 | 139,783 | ||
| 2019 | 18,201 | 95,643 | 32,597 | 207,014 | ||
| 2018 | 16,707 | 95,265 | 32,918 | 199,023 | ||
| 2017 | 15,527 | 93,575 | 33,754 | 128,501 | ||
| 2016 | 15,614 | 96,091 | 31,452 | 91,547 | ||
| 2015 | 17,038 | 94,383 | 31,018 | 27,473 | ||
| North Queens Surgical Center | 2024 | 3,568 | NA | NA | 1 | |
| 2023 | 9,653 | NA | NA | 35 | ||
| 2022 | 8,774 | NA | NA | 22 | ||
| 2021 | 9,865 | NA | NA | NA | ||
| 2020 | 7,440 | NA | NA | NA | ||
| 2019 | 7,907 | NA | NA | NA | ||
| 2018 | 4,449 | NA | NA | NA | ||
| 2017 | 4,836 | NA | NA | NA | ||
| 2016 | 4,593 | NA | NA | NA | ||
| 2015 | 1,175 | NA | NA | NA | ||
| Physicians Choice Surgicenter | 2024 | 0 | NA | NA | NA | |
| 2023 | 93 | NA | NA | NA | ||
| 2022 | 517 | NA | NA | NA | ||
| 2021 | 680 | NA | NA | NA | ||
| 2020 | 537 | NA | NA | NA | ||
| 2019 | 586 | NA | NA | NA | ||
| 2018 | 571 | NA | NA | NA | ||
| 2017 | 670 | NA | NA | NA | ||
| 2016 | 602 | NA | NA | NA | ||
| 2015 | 663 | NA | NA | NA | ||
| Queens Boulevard ASC, LLC | 2024 | 4,901 | NA | NA | NA | |
| 2023 | 11,145 | NA | NA | NA | ||
| 2022 | 10,370 | NA | NA | NA | ||
| 2021 | 11,849 | NA | NA | NA | ||
| 2017 | 7,173 | NA | NA | NA | ||
| 2016 | 9,597 | NA | NA | NA | ||
| 2015 | 9,221 | NA | NA | NA | ||
| Queens Endoscopy ASC, LLC | 2024 | 5,432 | NA | NA | NA | |
| 2023 | 12,089 | NA | NA | NA | ||
| 2022 | 10,966 | NA | NA | NA | ||
| 2021 | 9,141 | NA | NA | NA | ||
| 2020 | 6,485 | NA | NA | NA | ||
| 2019 | 9,663 | NA | NA | NA | ||
| 2018 | 5,342 | NA | NA | NA | ||
| 2017 | 9,020 | NA | NA | NA | ||
| 2016 | 12,586 | NA | NA | NA | ||
| 2015 | 12,879 | NA | NA | NA | ||
| Queens Hospital Center | 2024 | 3,366 | 42,119 | 6,033 | 167,821 | |
| 2023 | 7,164 | 89,045 | 12,269 | 349,938 | ||
| 2022 | 5,289 | 84,173 | 13,173 | 400,236 | ||
| 2021 | 4,981 | 71,443 | 12,359 | 556,887 | ||
| 2020 | 3,548 | 58,669 | 11,832 | 365,684 | ||
| 2019 | 4,493 | 78,920 | 13,572 | 290,823 | ||
| 2018 | 4,205 | 78,294 | 13,751 | 311,640 | ||
| 2017 | 4,248 | 75,419 | 13,790 | 323,225 | ||
| 2016 | 4,218 | 80,558 | 13,827 | 325,476 | ||
| 2015 | 4,902 | 86,962 | 12,998 | 299,254 | ||
| Queens Surgical Center | 2024 | 1,323 | NA | NA | NA | |
| 2023 | 2,238 | NA | NA | NA | ||
| 2022 | 1,264 | NA | NA | NA | ||
| 2021 | 545 | NA | NA | NA | ||
| Rockaways ASC Development, LLC | 2024 | 47 | NA | NA | NA | |
| 2023 | 6,851 | NA | NA | NA | ||
| 2022 | 10,435 | NA | NA | NA | ||
| 2021 | 7,484 | NA | NA | NA | ||
| 2020 | 3,122 | NA | NA | NA | ||
| St Johns Episcopal Hospital So Shore | 2024 | 392 | 10,480 | 3,064 | 22,872 | |
| 2023 | 1,521 | 37,144 | 9,124 | 88,222 | ||
| 2022 | 1,486 | 37,267 | 7,875 | 80,991 | ||
| 2021 | 1,470 | 34,685 | 6,569 | 84,026 | ||
| 2020 | 1,533 | 31,499 | 7,495 | 77,349 | ||
| 2019 | 2,052 | 38,355 | 7,653 | 69,992 | ||
| 2018 | 2,265 | 38,197 | 8,047 | 73,839 | ||
| 2017 | 2,383 | 37,975 | 7,885 | 64,725 | ||
| 2016 | 2,508 | 37,680 | 8,335 | 71,590 | ||
| 2015 | 2,397 | 36,887 | 8,713 | 69,161 | ||
| The Endoscopy Center of Queens | 2024 | 2,727 | NA | NA | NA | |
| 2023 | 9,893 | NA | NA | NA | ||
| 2022 | 7,689 | NA | NA | NA | ||
| 2021 | 7,547 | NA | NA | NA | ||
| 2020 | 5,477 | NA | NA | NA | ||
| 2019 | 7,195 | NA | NA | NA | ||
| 2018 | 6,042 | NA | NA | NA | ||
| 2017 | 2,598 | NA | NA | NA | ||
| 2016 | 137 | NA | NA | NA | ||
| The Mackool Eye Institute LLC | 2024 | 1,239 | NA | NA | 19 | |
| 2023 | 8,133 | NA | NA | 116 | ||
| 2022 | 7,718 | NA | NA | 52 | ||
| 2021 | 5,951 | NA | NA | NA | ||
| 2020 | 4,600 | NA | NA | NA | ||
| 2019 | 7,032 | NA | NA | NA | ||
| 2018 | 7,029 | NA | NA | NA | ||
| 2017 | 3,043 | NA | NA | NA | ||
| 2016 | 7,095 | NA | NA | NA | ||
| 2015 | 6,888 | NA | NA | NA | ||
| Rensselaer | Samaritan Hospital | 2024 | 7,086 | 32,948 | 8,646 | 63,474 |
| 2023 | 29,600 | 78,170 | 19,360 | 141,052 | ||
| 2022 | 28,822 | 81,240 | 18,466 | 144,958 | ||
| 2021 | 27,592 | 75,722 | 18,520 | 159,414 | ||
| 2020 | 26,052 | 63,152 | 14,516 | 97,410 | ||
| 2019 | 68,572 | 167,768 | 33,680 | 272,700 | ||
| 2018 | 51,628 | 172,056 | 33,160 | 224,792 | ||
| 2017 | 45,476 | 133,856 | 32,640 | 222,524 | ||
| 2016 | 45,188 | 137,892 | 28,640 | 228,528 | ||
| 2015 | 42,708 | 137,012 | 25,648 | 121,156 | ||
| Samaritan Hospital - St. Mary’s Campus | 2024 | 0 | 0 | 0 | 36,172 | |
| 2023 | 10 | 0 | 186 | 73,214 | ||
| 2022 | 32 | 0 | 438 | 69,506 | ||
| 2021 | 34 | 0 | 568 | 63,230 | ||
| 2020 | 536 | 2 | 708 | 67,472 | ||
| 2019 | 7,328 | 12 | 1,320 | 192,068 | ||
| 2018 | 14,932 | 68 | 1,864 | 224,668 | ||
| 2017 | 20,380 | 85,088 | 1,640 | 134,160 | ||
| 2016 | 28,816 | 101,352 | 10,084 | 143,068 | ||
| 2015 | 31,128 | 108,672 | 14,224 | 91,268 | ||
| St. Peter’s Hospital - SPARC | 2024 | NA | NA | 268 | NA | |
| 2023 | NA | NA | 314 | NA | ||
| Richmond | RUMC-Bayley Seton | 2018 | NA | NA | 3 | NA |
| 2017 | 2 | 1 | 352 | 1 | ||
| 2016 | NA | NA | 555 | 19,992 | ||
| 2015 | 1 | NA | 466 | 16,202 | ||
| Richmond Pain Management ASC | 2024 | 722 | NA | NA | 4 | |
| 2023 | 3,852 | NA | NA | 30 | ||
| 2022 | 2,576 | NA | NA | 24 | ||
| 2021 | 2,615 | NA | NA | 9 | ||
| 2020 | 2,897 | NA | NA | 36 | ||
| 2019 | 4,370 | NA | NA | 13 | ||
| 2018 | 3,711 | NA | NA | 5 | ||
| 2017 | 3,497 | NA | NA | 1 | ||
| 2016 | 723 | NA | NA | NA | ||
| Richmond University Medical Center | 2024 | 2,919 | 16,008 | 4,731 | 12,240 | |
| 2023 | 8,836 | 44,959 | 13,607 | 34,595 | ||
| 2022 | 8,365 | 45,016 | 14,000 | 37,126 | ||
| 2021 | 9,254 | 44,596 | 13,497 | 38,152 | ||
| 2020 | 7,276 | 38,276 | 13,605 | 30,200 | ||
| 2019 | 9,737 | 55,737 | 14,394 | 43,221 | ||
| 2018 | 10,085 | 57,139 | 15,241 | 47,188 | ||
| 2017 | 11,010 | 51,852 | 16,348 | 47,949 | ||
| 2016 | 11,120 | 53,307 | 17,445 | 48,487 | ||
| 2015 | 11,013 | 55,398 | 15,034 | 44,399 | ||
| Staten Island University Hosp-North | 2024 | 11,594 | 48,204 | 21,406 | 188,432 | |
| 2023 | 34,008 | 142,896 | 62,520 | 559,566 | ||
| 2022 | 27,354 | 137,638 | 59,518 | 478,296 | ||
| 2021 | 27,306 | 121,172 | 59,044 | 470,092 | ||
| 2020 | 23,084 | 102,236 | 54,272 | 376,140 | ||
| 2019 | 56,872 | 293,380 | 128,408 | 1,445,032 | ||
| 2018 | 63,300 | 322,940 | 124,196 | 1,399,152 | ||
| 2017 | 50,604 | 290,740 | 123,552 | 924,984 | ||
| 2016 | 49,572 | 289,324 | 125,140 | 881,136 | ||
| 2015 | 53,024 | 280,244 | 128,992 | 697,576 | ||
| Staten Island University Hospital Prince’s Bay | 2024 | 3,372 | 17,476 | 5,108 | 9,128 | |
| 2023 | 9,858 | 52,718 | 14,816 | 34,804 | ||
| 2022 | 10,464 | 49,514 | 14,418 | 37,582 | ||
| 2021 | 10,792 | 43,938 | 14,196 | 37,186 | ||
| 2020 | 9,112 | 34,486 | 12,870 | 65,904 | ||
| 2019 | 24,100 | 95,532 | 36,540 | 188,096 | ||
| 2018 | 24,032 | 107,672 | 37,568 | 162,832 | ||
| 2017 | 22,288 | 104,960 | 37,368 | 168,520 | ||
| 2016 | 20,064 | 103,172 | 38,204 | 172,640 | ||
| 2015 | 19,632 | 103,912 | 36,984 | 163,480 | ||
| Rockland | Advanced Surgery Center | 2024 | 180 | NA | NA | NA |
| 2023 | 486 | NA | NA | NA | ||
| 2022 | 529 | NA | NA | NA | ||
| 2021 | 252 | NA | NA | NA | ||
| 2020 | 329 | NA | NA | NA | ||
| 2019 | 306 | NA | NA | NA | ||
| 2018 | 501 | NA | NA | NA | ||
| 2017 | 485 | NA | NA | NA | ||
| 2016 | 456 | NA | NA | NA | ||
| 2015 | 409 | NA | NA | NA | ||
| Good Samaritan Hospital of Suffern | 2024 | 3,646 | 12,799 | 7,023 | 22,160 | |
| 2023 | 7,524 | 29,920 | 17,466 | 58,051 | ||
| 2022 | 6,643 | 29,748 | 17,617 | 70,938 | ||
| 2021 | 6,728 | 28,899 | 17,229 | 87,842 | ||
| 2020 | 5,907 | 25,344 | 15,778 | 58,489 | ||
| 2019 | 7,693 | 32,773 | 17,339 | 56,280 | ||
| 2018 | 8,006 | 32,635 | 17,497 | 52,603 | ||
| 2017 | 7,596 | 32,378 | 15,784 | 39,696 | ||
| 2016 | 7,051 | 31,476 | 16,647 | 36,784 | ||
| 2015 | 7,304 | 30,323 | 16,249 | 23,925 | ||
| Helen Hayes Hospital | 2024 | 0 | NA | 666 | 2,703 | |
| 2023 | 0 | NA | 1,422 | 7,893 | ||
| 2022 | 0 | NA | 1,517 | 8,380 | ||
| 2021 | 0 | NA | 1,529 | 7,993 | ||
| 2020 | NA | NA | 1,566 | 6,637 | ||
| 2019 | NA | NA | 2,428 | 14,690 | ||
| 2018 | NA | NA | 2,463 | 16,338 | ||
| 2017 | NA | NA | 2,381 | 17,379 | ||
| 2016 | NA | NA | 1,982 | 16,851 | ||
| 2015 | 0 | NA | 1,959 | 14,632 | ||
| Montefiore Nyack | 2024 | 2,293 | 20,410 | 6,206 | 57,904 | |
| 2023 | 4,503 | 40,644 | 11,847 | 97,779 | ||
| 2022 | 3,791 | 38,647 | 11,722 | 84,349 | ||
| 2021 | 3,274 | 34,442 | 11,629 | 80,313 | ||
| 2020 | 3,038 | 28,639 | 11,207 | 44,636 | ||
| 2019 | 4,018 | 41,123 | 12,048 | 45,934 | ||
| 2018 | 3,584 | 42,243 | 12,028 | 38,228 | ||
| 2017 | 3,438 | 44,243 | 12,889 | 27,343 | ||
| 2016 | 3,489 | 47,600 | 13,219 | 29,039 | ||
| 2015 | 3,453 | 48,718 | 13,494 | 18,495 | ||
| Saratoga | Center for Advanced Ambulatory Surgery | 2024 | 2,412 | NA | NA | NA |
| 2023 | 3,794 | NA | NA | NA | ||
| 2022 | 3,156 | NA | NA | NA | ||
| 2021 | 797 | NA | NA | 1 | ||
| Northeastern New York Surgical Center | 2024 | 2,283 | NA | NA | NA | |
| 2023 | 4,605 | NA | NA | NA | ||
| 2022 | 4,089 | NA | NA | NA | ||
| 2021 | 3,789 | NA | NA | NA | ||
| 2020 | 3,168 | NA | NA | NA | ||
| 2019 | 3,655 | NA | NA | NA | ||
| 2018 | 3,660 | NA | NA | NA | ||
| 2017 | 3,637 | NA | NA | NA | ||
| 2016 | 3,401 | NA | NA | NA | ||
| 2015 | 2,450 | NA | NA | NA | ||
| OrthoNY Surgical Suites | 2024 | 1,758 | NA | NA | NA | |
| 2023 | 4,757 | NA | NA | NA | ||
| 2022 | 4,621 | NA | NA | NA | ||
| Saratoga Hospital | 2024 | 4,858 | 9,919 | 3,435 | 27,460 | |
| 2023 | 14,087 | 30,008 | 10,427 | 84,162 | ||
| 2022 | 13,370 | 29,274 | 10,999 | 97,800 | ||
| 2021 | 13,008 | 27,200 | 10,892 | 114,014 | ||
| 2020 | 10,389 | 24,259 | 10,313 | 107,614 | ||
| 2019 | 10,329 | 30,622 | 11,534 | 64,211 | ||
| 2018 | 10,147 | 30,156 | 10,918 | 53,379 | ||
| 2017 | 8,434 | 28,358 | 10,473 | 54,824 | ||
| 2016 | 9,434 | 29,439 | 9,875 | 53,491 | ||
| 2015 | 7,692 | 28,502 | 9,239 | 31,442 | ||
| Saratoga Surgery Center | 2024 | 2,316 | NA | NA | 17,593 | |
| 2023 | 6,193 | NA | NA | 39,158 | ||
| 2022 | 4,253 | NA | NA | 39,198 | ||
| 2021 | 5,291 | NA | NA | 51,391 | ||
| 2020 | 5,684 | NA | NA | 47,071 | ||
| 2019 | 7,977 | 1 | NA | 41,439 | ||
| 2018 | 8,105 | NA | NA | 34,077 | ||
| 2017 | 6,388 | NA | NA | 23,385 | ||
| 2016 | 7,874 | NA | NA | 12,020 | ||
| 2015 | 7,767 | NA | NA | 9,011 | ||
| Saratoga-Schenectady Endoscopy Center, LLC | 2024 | 10,964 | NA | NA | NA | |
| 2023 | 19,509 | NA | NA | NA | ||
| 2022 | 15,937 | NA | NA | NA | ||
| 2021 | 15,568 | NA | NA | NA | ||
| 2020 | 10,260 | NA | NA | NA | ||
| 2019 | 14,111 | NA | NA | NA | ||
| 2018 | 14,000 | NA | NA | NA | ||
| 2017 | 12,232 | NA | NA | NA | ||
| 2016 | 10,581 | NA | NA | NA | ||
| 2015 | 9,840 | NA | NA | NA | ||
| The Northway Surgery and Pain Center | 2024 | 4,859 | NA | NA | NA | |
| 2023 | 8,779 | NA | NA | NA | ||
| 2022 | 9,077 | NA | NA | NA | ||
| 2021 | 10,686 | NA | NA | NA | ||
| 2020 | 10,326 | NA | NA | NA | ||
| 2019 | 12,281 | NA | NA | NA | ||
| 2018 | 12,064 | NA | NA | NA | ||
| 2017 | 10,877 | NA | NA | NA | ||
| 2016 | 6,360 | NA | NA | NA | ||
| 2015 | 339 | NA | NA | NA | ||
| Schenectady | Albany Medical Center Hospital Ambulatory Surgery Center - Niskayuna | 2024 | 0 | NA | NA | NA |
| 2023 | 0 | NA | NA | NA | ||
| 2022 | 92 | NA | NA | NA | ||
| 2021 | 3 | NA | NA | 1 | ||
| Ellis Hospital | 2024 | 2,177 | 12,496 | 3,047 | 26,946 | |
| 2023 | 6,603 | 36,910 | 8,855 | 80,674 | ||
| 2022 | 5,437 | 40,209 | 8,798 | 100,430 | ||
| 2021 | 5,367 | 41,380 | 10,687 | 106,862 | ||
| 2020 | 5,127 | 36,362 | 9,919 | 46,081 | ||
| 2019 | 6,008 | 42,867 | 12,994 | 56,276 | ||
| 2018 | 6,869 | 50,317 | 13,954 | 62,929 | ||
| 2017 | 8,867 | 59,753 | 14,644 | 74,874 | ||
| 2016 | 9,116 | 61,680 | 15,390 | 93,981 | ||
| 2015 | 8,237 | 59,302 | 14,376 | 36,865 | ||
| Ellis Hospital - Bellevue Woman’s Care Center Division | 2024 | 497 | 14 | 1,153 | 5,511 | |
| 2023 | 1,411 | 26 | 3,615 | 16,301 | ||
| 2022 | 1,349 | 31 | 3,762 | 17,321 | ||
| 2021 | 1,494 | 28 | 4,145 | 18,789 | ||
| 2020 | 1,078 | 32 | 3,639 | 15,002 | ||
| 2019 | 1,109 | 45 | 3,895 | 16,582 | ||
| 2018 | 1,665 | 35 | 4,430 | 20,422 | ||
| 2017 | 1,748 | 44 | 5,078 | 22,133 | ||
| 2016 | 1,808 | NA | 5,437 | 21,337 | ||
| 2015 | 1,829 | 67 | 5,648 | 5,205 | ||
| Ellis Hospital McClellan St. Health Center | 2024 | 0 | NA | NA | 680 | |
| 2023 | 0 | NA | NA | 2,113 | ||
| 2022 | 0 | NA | NA | 10,201 | ||
| 2021 | 0 | 2 | NA | 11,889 | ||
| 2020 | 606 | NA | NA | 9,490 | ||
| 2019 | 3,342 | 1 | NA | 14,441 | ||
| 2018 | 4,440 | 1 | NA | 43,425 | ||
| 2017 | 5,155 | 1 | NA | 63,050 | ||
| 2016 | 4,859 | NA | NA | 58,577 | ||
| 2015 | 4,431 | 1 | NA | 27,271 | ||
| Sunnyview Hospital and Rehabilitation Center | 2024 | NA | NA | 2,180 | 7,954 | |
| 2023 | NA | NA | 4,134 | 27,442 | ||
| 2022 | NA | NA | 3,996 | 24,616 | ||
| 2021 | NA | NA | 3,944 | 21,650 | ||
| 2020 | NA | NA | 4,362 | 14,208 | ||
| 2019 | NA | NA | 9,020 | 32,428 | ||
| 2018 | NA | NA | 9,644 | 31,756 | ||
| 2017 | NA | NA | 9,620 | 28,280 | ||
| 2016 | NA | NA | 9,504 | 31,300 | ||
| 2015 | NA | NA | 9,224 | 31,228 | ||
| Schoharie | Cobleskill Regional Hospital | 2024 | 286 | 5,058 | 222 | 29,157 |
| 2023 | 717 | 11,279 | 430 | 61,257 | ||
| 2022 | 620 | 11,436 | 411 | 56,840 | ||
| 2021 | 690 | 10,389 | 483 | 53,005 | ||
| 2020 | 526 | 8,453 | 375 | 43,779 | ||
| 2019 | 781 | 10,824 | 444 | 46,338 | ||
| 2018 | 273 | 3,803 | 149 | 16,358 | ||
| 2017 | NA | NA | NA | 5 | ||
| Schuyler | Schuyler Hospital | 2024 | 364 | 3,201 | 142 | 10,814 |
| 2023 | 713 | 7,709 | 278 | 23,424 | ||
| 2022 | 610 | 7,630 | 290 | 22,443 | ||
| 2021 | 532 | 7,057 | 263 | 31,809 | ||
| 2020 | 487 | 6,106 | 239 | 26,449 | ||
| 2019 | 488 | 7,542 | 416 | 26,744 | ||
| 2018 | 461 | 7,115 | 492 | 27,949 | ||
| 2017 | 429 | 7,368 | 502 | 32,811 | ||
| 2016 | 464 | 7,937 | 494 | 32,486 | ||
| 2015 | 517 | 8,168 | 603 | 14,481 | ||
| St. Lawrence | Canton-Potsdam Hospital | 2024 | 3,507 | 8,774 | 1,729 | 20,959 |
| 2023 | 9,112 | 22,661 | 4,867 | 49,793 | ||
| 2022 | 7,162 | 23,376 | 5,062 | 62,384 | ||
| 2021 | 6,899 | 22,059 | 5,099 | 94,834 | ||
| 2020 | 5,457 | 19,080 | 4,414 | 66,260 | ||
| 2019 | 7,657 | 24,520 | 4,581 | 53,343 | ||
| 2018 | 8,433 | 23,188 | 5,083 | 46,979 | ||
| 2017 | 7,875 | 22,556 | 5,315 | 46,684 | ||
| 2016 | 7,831 | 21,979 | 5,409 | 75,348 | ||
| 2015 | 6,887 | 21,984 | 5,244 | 17,299 | ||
| Claxton-Hepburn Medical Center | 2024 | 0 | 0 | 0 | 0 | |
| 2023 | 396 | 2,072 | 526 | 16,175 | ||
| 2022 | 1,259 | 11,182 | 2,631 | 62,482 | ||
| 2021 | 3,632 | 10,915 | 2,841 | 65,372 | ||
| 2020 | 3,488 | 9,388 | 2,711 | 57,439 | ||
| 2019 | 5,104 | 12,432 | 2,972 | 62,045 | ||
| 2018 | 5,355 | 12,802 | 3,032 | 61,507 | ||
| 2017 | 5,889 | 13,508 | 3,035 | 60,223 | ||
| 2016 | 6,509 | 13,615 | 3,250 | 81,047 | ||
| 2015 | 5,741 | 13,826 | 3,054 | 18,169 | ||
| Clifton-Fine Hospital | 2024 | NA | 374 | 8 | 349 | |
| 2023 | NA | 1,230 | 20 | 682 | ||
| 2022 | NA | 1,395 | 45 | 730 | ||
| 2021 | NA | 1,201 | 34 | 547 | ||
| 2020 | NA | 1,041 | 38 | 377 | ||
| 2019 | NA | 1,828 | 44 | 467 | ||
| 2018 | NA | 1,805 | 34 | 427 | ||
| 2017 | NA | 2,870 | 44 | 379 | ||
| 2016 | NA | 2,181 | 57 | 430 | ||
| 2015 | NA | 1,970 | 83 | 318 | ||
| Gouverneur Hospital | 2024 | 251 | 3,877 | 165 | 12,152 | |
| 2023 | 264 | 9,614 | 531 | 29,062 | ||
| 2022 | 162 | 9,384 | 507 | 25,940 | ||
| 2021 | 155 | 7,403 | 522 | 24,760 | ||
| 2020 | 200 | 6,852 | 757 | 17,924 | ||
| 2019 | 612 | 9,530 | 759 | 18,316 | ||
| 2018 | 698 | 9,479 | 590 | 17,214 | ||
| 2017 | 636 | 8,892 | 304 | 16,260 | ||
| 2016 | 368 | 8,842 | 352 | 15,361 | ||
| 2015 | 333 | 7,746 | 400 | 481 | ||
| Massena Hospital | 2024 | 814 | 5,275 | 404 | 19,443 | |
| 2023 | 1,743 | 12,638 | 1,207 | 42,545 | ||
| 2022 | 1,389 | 13,171 | 1,347 | 39,902 | ||
| 2021 | 1,306 | 12,519 | 1,094 | 49,305 | ||
| 2020 | 1,305 | 10,689 | 1,051 | 37,545 | ||
| 2019 | 1,810 | 12,886 | 1,519 | 38,961 | ||
| 2018 | 2,148 | 13,332 | 1,736 | 37,816 | ||
| 2017 | 1,812 | 12,263 | 2,160 | 30,608 | ||
| 2016 | 2,135 | 13,308 | 2,197 | 31,514 | ||
| 2015 | 2,170 | 13,355 | 2,331 | 5,875 | ||
| Steuben | Corning Hospital | 2024 | 3,341 | 11,251 | 1,666 | 35,653 |
| 2023 | 8,023 | 28,892 | 4,573 | 88,362 | ||
| 2022 | 7,345 | 28,640 | 4,565 | 89,948 | ||
| 2021 | 6,153 | 26,078 | 4,598 | 85,572 | ||
| 2020 | 5,967 | 20,997 | 4,295 | 68,867 | ||
| 2019 | 6,568 | 25,801 | 4,972 | 73,498 | ||
| 2018 | 6,242 | 25,182 | 5,017 | 70,971 | ||
| 2017 | 5,586 | 23,472 | 4,772 | 59,816 | ||
| 2016 | 6,411 | 23,456 | 4,605 | 39,500 | ||
| 2015 | 6,596 | 20,338 | 4,736 | 12,571 | ||
| Ira Davenport Memorial Hospital | 2024 | 491 | 4,389 | 83 | 22,397 | |
| 2023 | 620 | 8,721 | 210 | 24,528 | ||
| 2022 | 516 | 8,450 | 155 | 22,814 | ||
| 2021 | 534 | 7,933 | 253 | 26,253 | ||
| 2020 | 522 | 7,058 | 144 | 15,235 | ||
| 2019 | 819 | 9,234 | 192 | 16,405 | ||
| 2018 | 688 | 9,233 | 254 | 15,814 | ||
| 2017 | 572 | 9,125 | 349 | 17,754 | ||
| 2016 | 547 | 9,576 | 391 | 23,447 | ||
| 2015 | 795 | 9,370 | 602 | 2,241 | ||
| St. James Hospital | 2024 | 1,355 | 7,114 | 464 | 6,959 | |
| 2023 | 2,667 | 13,068 | 922 | 23,438 | ||
| 2022 | 2,014 | 11,720 | 931 | 39,542 | ||
| 2021 | 2,007 | 10,027 | 874 | 56,419 | ||
| 2020 | 1,643 | 8,383 | 728 | 46,236 | ||
| 2019 | 1,849 | 10,198 | 832 | 40,812 | ||
| 2018 | 1,709 | 10,363 | 848 | 39,433 | ||
| 2017 | 1,509 | 10,794 | 809 | 37,581 | ||
| 2016 | 1,881 | 11,079 | 829 | 38,268 | ||
| 2015 | 1,818 | 11,345 | 819 | 3,577 | ||
| Suffolk | Advanced Surgery Center of Long Island | 2024 | 4,590 | NA | NA | NA |
| 2023 | 10,383 | NA | NA | NA | ||
| 2022 | 9,555 | NA | NA | NA | ||
| 2021 | 8,932 | NA | NA | NA | ||
| 2020 | 6,287 | NA | NA | NA | ||
| 2019 | 8,447 | NA | NA | NA | ||
| 2018 | 7,876 | NA | NA | NA | ||
| 2017 | 7,107 | NA | NA | NA | ||
| 2016 | 7,152 | NA | NA | NA | ||
| 2015 | 6,627 | NA | NA | NA | ||
| Atlantic Surgery Center | 2024 | 0 | NA | NA | NA | |
| 2023 | 4,199 | NA | NA | NA | ||
| 2022 | 993 | NA | NA | NA | ||
| Digestive Health Center of Huntington | 2024 | 2,100 | NA | NA | NA | |
| 2023 | 4,502 | NA | NA | NA | ||
| 2022 | 4,074 | NA | NA | NA | ||
| 2021 | 4,591 | NA | NA | NA | ||
| 2020 | 3,489 | NA | NA | NA | ||
| 2019 | 4,038 | NA | NA | NA | ||
| 2018 | 4,361 | NA | NA | NA | ||
| 2017 | 3,020 | NA | NA | NA | ||
| 2016 | 3,807 | NA | NA | NA | ||
| 2015 | 3,458 | NA | NA | NA | ||
| Good Samaritan Hospital Medical Center | 2024 | 6,828 | 21,634 | 8,241 | 30,921 | |
| 2023 | 21,478 | 65,325 | 25,932 | 90,015 | ||
| 2022 | 21,751 | 70,732 | 25,637 | 83,788 | ||
| 2021 | 20,689 | 64,047 | 24,824 | 80,291 | ||
| 2020 | 16,910 | 48,429 | 23,530 | 99,405 | ||
| 2019 | 20,667 | 67,134 | 25,957 | 66,843 | ||
| 2018 | 19,600 | 68,023 | 26,479 | 54,884 | ||
| 2017 | 17,700 | 66,109 | 26,314 | 51,518 | ||
| 2016 | 16,859 | 68,705 | 27,209 | 53,892 | ||
| 2015 | 17,578 | 66,358 | 26,355 | 9,111 | ||
| Great South Bay Endoscopy Center, LLC | 2024 | 4,465 | NA | NA | NA | |
| 2023 | 8,909 | NA | NA | NA | ||
| 2022 | 8,205 | NA | NA | NA | ||
| 2021 | 7,056 | NA | NA | NA | ||
| 2020 | 5,305 | NA | NA | NA | ||
| 2019 | 6,720 | NA | NA | NA | ||
| 2018 | 6,198 | NA | NA | NA | ||
| 2017 | 5,838 | NA | NA | NA | ||
| 2016 | 5,170 | NA | NA | NA | ||
| 2015 | 4,565 | NA | NA | NA | ||
| Huntington Hospital | 2024 | 2,799 | 13,773 | 6,830 | 6,307 | |
| 2023 | 8,066 | 41,785 | 21,039 | 19,263 | ||
| 2022 | 7,554 | 41,578 | 20,477 | 20,356 | ||
| 2021 | 7,883 | 37,862 | 19,884 | 39,529 | ||
| 2020 | 6,578 | 46,719 | 17,018 | 28,874 | ||
| 2019 | 9,257 | 38,517 | 17,930 | 15,270 | ||
| 2018 | 9,666 | 42,354 | 17,488 | 14,824 | ||
| 2017 | 11,150 | 49,936 | 16,783 | 17,732 | ||
| 2016 | 9,499 | 37,614 | 17,375 | 13,392 | ||
| 2015 | 8,612 | 37,985 | 16,321 | 14,193 | ||
| Island Digestive Health Center | 2024 | 3,002 | NA | NA | NA | |
| 2023 | 7,275 | NA | NA | NA | ||
| 2022 | 6,937 | NA | NA | NA | ||
| 2021 | 6,142 | NA | NA | NA | ||
| 2020 | 4,672 | NA | NA | NA | ||
| 2019 | 6,964 | NA | NA | NA | ||
| 2018 | 5,554 | NA | NA | NA | ||
| 2017 | 5,747 | NA | NA | NA | ||
| 2016 | 5,467 | NA | NA | NA | ||
| 2015 | 5,044 | NA | NA | NA | ||
| Island Endoscopy Center, LLC | 2024 | 0 | NA | NA | NA | |
| 2023 | 593 | NA | NA | NA | ||
| 2022 | 2,724 | NA | NA | NA | ||
| 2021 | 4,305 | NA | NA | NA | ||
| 2019 | 26 | NA | NA | NA | ||
| 2018 | 67 | NA | NA | NA | ||
| 2017 | 5,574 | NA | NA | NA | ||
| 2016 | 8,739 | NA | NA | NA | ||
| 2015 | 8,982 | NA | NA | NA | ||
| John T Mather Memorial Hospital of Port Jefferson New York Inc | 2024 | 0 | 0 | 0 | 0 | |
| 2023 | 9,573 | 27,207 | 8,377 | 81,907 | ||
| 2022 | 9,819 | 26,694 | 8,493 | 83,074 | ||
| 2021 | 10,504 | 25,413 | 8,306 | 77,102 | ||
| 2020 | 6,459 | 20,337 | 8,137 | 71,626 | ||
| 2019 | 7,808 | 26,735 | 9,938 | 72,268 | ||
| 2018 | 9,094 | 27,482 | 11,129 | 69,949 | ||
| 2017 | 9,134 | 34,328 | 11,833 | 66,950 | ||
| 2016 | 9,247 | 29,552 | 11,218 | 65,171 | ||
| 2015 | 9,557 | 30,078 | 10,980 | 44,735 | ||
| Long Island Ambulatory Surgery Center | 2024 | 8,663 | NA | NA | NA | |
| 2023 | 16,891 | NA | NA | NA | ||
| 2022 | 14,555 | NA | NA | NA | ||
| 2021 | 12,057 | NA | NA | NA | ||
| 2020 | 9,284 | NA | NA | NA | ||
| 2019 | 14,642 | NA | NA | NA | ||
| 2018 | 14,187 | NA | NA | NA | ||
| 2017 | 12,554 | NA | NA | NA | ||
| 2016 | 13,975 | NA | NA | NA | ||
| 2015 | 11,942 | NA | NA | NA | ||
| Long Island Community Hospital | 2024 | 2,719 | 15,549 | 3,808 | 9,612 | |
| 2023 | 4,940 | 37,686 | 8,576 | 25,793 | ||
| 2022 | 3,812 | 32,409 | 7,816 | 20,773 | ||
| 2021 | 4,295 | 32,863 | 7,959 | 21,855 | ||
| 2020 | 4,271 | 28,631 | 8,587 | 23,281 | ||
| 2019 | 4,700 | 40,000 | 10,971 | 33,802 | ||
| 2018 | 3,447 | 40,111 | 12,021 | 38,200 | ||
| 2017 | 2,791 | 42,703 | 12,088 | 32,633 | ||
| 2016 | 3,247 | 47,606 | 11,851 | 29,515 | ||
| 2015 | 3,506 | 53,870 | 12,204 | 14,009 | ||
| Long Island Hand and Orthopedic Surgery Center, LLC | 2024 | 293 | NA | NA | NA | |
| 2023 | 588 | NA | NA | NA | ||
| 2022 | 603 | NA | NA | NA | ||
| 2021 | 659 | NA | NA | NA | ||
| 2020 | 595 | NA | NA | NA | ||
| 2019 | 666 | NA | NA | NA | ||
| 2018 | 651 | NA | NA | NA | ||
| 2017 | 751 | NA | NA | NA | ||
| 2016 | 670 | NA | NA | NA | ||
| 2015 | 638 | NA | NA | NA | ||
| Melville Surgery Center | 2024 | 728 | NA | NA | 9 | |
| 2023 | 4,330 | NA | NA | 58 | ||
| 2022 | 4,223 | NA | NA | 51 | ||
| 2021 | 4,273 | NA | NA | 18 | ||
| 2020 | 4,611 | NA | NA | 8 | ||
| 2019 | 5,917 | NA | NA | 2 | ||
| 2018 | 6,585 | NA | NA | NA | ||
| 2017 | 6,263 | NA | NA | 4 | ||
| 2016 | 6,429 | NA | NA | NA | ||
| 2015 | 5,994 | NA | NA | NA | ||
| North Fork Surgery Center | 2024 | 0 | NA | NA | NA | |
| 2023 | 1,528 | NA | NA | NA | ||
| 2022 | 2,793 | NA | NA | NA | ||
| 2021 | 3,321 | NA | NA | NA | ||
| 2020 | 1,298 | NA | NA | NA | ||
| North Shore Surgi-Center | 2024 | 1,337 | NA | NA | 0 | |
| 2023 | 5,521 | NA | NA | 0 | ||
| 2022 | 5,841 | NA | NA | 3 | ||
| 2021 | 6,215 | NA | NA | 2 | ||
| 2020 | 6,364 | NA | NA | 10 | ||
| 2019 | 7,226 | NA | NA | 6 | ||
| 2018 | 6,235 | NA | NA | 2 | ||
| 2017 | 5,962 | NA | NA | 3 | ||
| 2016 | 6,159 | NA | NA | NA | ||
| 2015 | 7,178 | NA | NA | NA | ||
| Northeast Endoscopy, LLC | 2024 | 1,205 | NA | NA | NA | |
| 2023 | 1,459 | NA | NA | NA | ||
| 2022 | 486 | NA | NA | NA | ||
| Peconic Bay Medical Center | 2024 | 2,869 | 10,028 | 3,409 | 5,591 | |
| 2023 | 7,665 | 30,953 | 10,847 | 20,946 | ||
| 2022 | 6,218 | 29,382 | 9,873 | 31,270 | ||
| 2021 | 5,483 | 27,426 | 9,259 | 42,514 | ||
| 2020 | 4,374 | 21,369 | 8,247 | 36,658 | ||
| 2019 | 5,697 | 29,389 | 8,796 | 38,779 | ||
| 2018 | 4,747 | 26,078 | 8,695 | 40,164 | ||
| 2017 | 5,132 | 28,126 | 8,544 | 45,894 | ||
| 2016 | 5,366 | 29,159 | 8,214 | 47,663 | ||
| 2015 | 5,198 | 29,892 | 7,879 | 10,259 | ||
| Port Jefferson Ambulatory Surgery Center | 2024 | 0 | NA | NA | NA | |
| 2023 | 0 | NA | NA | NA | ||
| 2022 | 0 | NA | NA | NA | ||
| 2021 | 0 | NA | NA | NA | ||
| 2020 | 2,041 | NA | NA | NA | ||
| 2019 | 2,570 | NA | NA | NA | ||
| 2018 | 853 | NA | NA | NA | ||
| PrecisionCare Surgery Center | 2024 | 970 | NA | NA | NA | |
| 2023 | 2,485 | NA | NA | NA | ||
| 2022 | 2,120 | NA | NA | NA | ||
| 2021 | 628 | NA | NA | NA | ||
| Progressive Surgery Center, LLC | 2024 | 0 | NA | NA | NA | |
| 2023 | 1,141 | NA | NA | NA | ||
| 2022 | 1,855 | NA | NA | NA | ||
| 2021 | 2,092 | NA | NA | NA | ||
| 2020 | 1,510 | NA | NA | 3 | ||
| 2019 | 2,886 | NA | NA | 6 | ||
| 2018 | 1,519 | NA | NA | NA | ||
| 2017 | 1,008 | NA | NA | NA | ||
| 2016 | 820 | NA | NA | NA | ||
| 2015 | 1,112 | NA | NA | NA | ||
| South Shore Surgery Center | 2024 | 1,784 | NA | NA | 0 | |
| 2023 | 3,748 | NA | NA | 0 | ||
| 2022 | 3,458 | NA | NA | 3 | ||
| 2021 | 3,856 | NA | NA | NA | ||
| 2020 | 3,389 | NA | NA | NA | ||
| 2019 | 4,828 | NA | NA | NA | ||
| 2018 | 4,611 | NA | NA | NA | ||
| 2017 | 4,321 | NA | NA | NA | ||
| 2016 | 4,528 | NA | NA | NA | ||
| 2015 | 4,089 | NA | NA | NA | ||
| South Shore University Hospital | 2024 | 4,768 | 44,162 | 16,954 | 18,612 | |
| 2023 | 12,964 | 133,274 | 49,502 | 54,488 | ||
| 2022 | 11,160 | 129,582 | 46,804 | 51,224 | ||
| 2021 | 8,484 | 142,762 | 47,026 | 53,080 | ||
| 2020 | 6,700 | 93,106 | 42,270 | 33,198 | ||
| 2019 | 18,024 | 242,152 | 94,980 | 93,772 | ||
| 2018 | 18,072 | 229,440 | 93,756 | 110,912 | ||
| 2017 | 20,412 | 218,656 | 91,484 | 109,268 | ||
| 2016 | 34,284 | 190,988 | 85,248 | 114,272 | ||
| 2015 | 33,388 | 187,636 | 76,940 | 95,460 | ||
| South Shore University Hospital Endoscopy and Pain Management Center | 2024 | 4,206 | NA | NA | NA | |
| 2023 | 12,490 | NA | NA | NA | ||
| 2022 | 10,642 | NA | NA | NA | ||
| 2021 | 10,934 | NA | NA | NA | ||
| 2020 | 9,884 | NA | NA | NA | ||
| 2019 | 31,548 | NA | NA | NA | ||
| 2018 | 27,864 | NA | NA | NA | ||
| 2017 | 28,364 | NA | NA | NA | ||
| St Catherine of Siena Hospital | 2024 | 3,049 | 4,357 | 3,160 | 4,658 | |
| 2023 | 9,712 | 13,883 | 10,899 | 13,809 | ||
| 2022 | 8,866 | 15,371 | 10,543 | 13,575 | ||
| 2021 | 9,655 | 14,712 | 10,663 | 14,853 | ||
| 2020 | 7,898 | 11,520 | 10,680 | 13,352 | ||
| 2019 | 10,009 | 17,006 | 12,084 | 16,051 | ||
| 2018 | 9,988 | 17,714 | 12,086 | 14,187 | ||
| 2017 | 9,386 | 19,245 | 11,108 | 12,732 | ||
| 2016 | 9,741 | 19,942 | 11,158 | 13,713 | ||
| 2015 | 9,767 | 20,518 | 11,163 | 3,023 | ||
| St. Charles Hospital | 2024 | 1,983 | 3,127 | 2,611 | 12,505 | |
| 2023 | 9,007 | 13,009 | 10,138 | 49,220 | ||
| 2022 | 8,304 | 14,947 | 10,243 | 45,186 | ||
| 2021 | 8,859 | 14,525 | 10,957 | 46,329 | ||
| 2020 | 7,809 | 11,209 | 10,457 | 38,786 | ||
| 2019 | 9,204 | 15,927 | 11,470 | 50,638 | ||
| 2018 | 9,160 | 16,685 | 11,566 | 32,478 | ||
| 2017 | 9,464 | 17,084 | 10,968 | 28,052 | ||
| 2016 | 9,194 | 16,997 | 11,178 | 29,940 | ||
| 2015 | 8,210 | 18,060 | 11,138 | 20,408 | ||
| Stony Brook Eastern Long Island Hospital | 2024 | 0 | 0 | 0 | 0 | |
| 2023 | 718 | 5,037 | 1,288 | 7,320 | ||
| 2022 | 859 | 5,373 | 1,542 | 8,362 | ||
| 2021 | 796 | 5,240 | 1,736 | 9,025 | ||
| 2020 | 915 | 4,389 | 1,920 | 8,827 | ||
| 2019 | 3,966 | 5,958 | 2,464 | 10,656 | ||
| 2018 | 5,082 | 6,663 | 2,673 | 10,910 | ||
| 2017 | 5,679 | 6,604 | 2,753 | 11,352 | ||
| 2016 | 6,042 | 7,025 | 2,577 | 11,748 | ||
| 2015 | 6,193 | 7,204 | 2,577 | 346 | ||
| Stony Brook Southampton Hospital | 2024 | 1,289 | 4,622 | 1,423 | 16,257 | |
| 2023 | 3,965 | 17,125 | 4,459 | 47,477 | ||
| 2022 | 4,656 | 17,836 | 4,615 | 47,418 | ||
| 2021 | 5,614 | 17,180 | 4,680 | 42,063 | ||
| 2020 | 4,787 | 15,318 | 4,375 | 44,670 | ||
| 2019 | 6,065 | 18,309 | 4,902 | 31,560 | ||
| 2018 | 5,974 | 18,436 | 5,112 | 28,780 | ||
| 2017 | 5,784 | 19,402 | 4,743 | 27,945 | ||
| 2016 | 6,007 | 18,760 | 5,208 | 17,902 | ||
| 2015 | 5,643 | 20,377 | 5,451 | 4,073 | ||
| Stony Brook University Hospital | 2024 | 11,423 | 30,919 | 11,548 | 63,706 | |
| 2023 | 32,535 | 92,502 | 34,131 | 172,709 | ||
| 2022 | 29,195 | 89,038 | 34,987 | 158,534 | ||
| 2021 | 30,567 | 81,497 | 36,099 | 153,617 | ||
| 2020 | 25,180 | 66,071 | 32,838 | 134,469 | ||
| 2019 | 31,231 | 84,046 | 34,396 | 172,238 | ||
| 2018 | 28,093 | 84,454 | 33,744 | 174,452 | ||
| 2017 | 27,749 | 83,193 | 36,112 | 180,335 | ||
| 2016 | 25,579 | 85,785 | 33,950 | 186,616 | ||
| 2015 | 24,439 | 80,034 | 35,307 | 78,568 | ||
| Suffolk Surgery Center, LLC | 2024 | 1,618 | NA | NA | NA | |
| 2023 | 4,258 | NA | NA | NA | ||
| 2022 | 4,081 | NA | NA | NA | ||
| 2021 | 3,953 | NA | NA | NA | ||
| 2020 | 3,655 | NA | NA | NA | ||
| 2019 | 5,724 | NA | NA | NA | ||
| 2018 | 5,933 | NA | NA | NA | ||
| 2017 | 5,745 | NA | NA | NA | ||
| 2016 | 6,116 | NA | NA | NA | ||
| 2015 | 6,305 | NA | NA | NA | ||
| The Center for Advanced Spine and Joint Surgery | 2024 | 0 | NA | NA | NA | |
| 2023 | 147 | NA | NA | NA | ||
| 2022 | 835 | NA | NA | NA | ||
| Sullivan | Garnet Health Medical Center - Catskills | 2024 | 1,141 | 9,398 | 1,433 | 9,195 |
| 2023 | 2,534 | 23,598 | 3,579 | 22,864 | ||
| 2022 | 2,242 | 23,771 | 3,811 | 23,622 | ||
| 2021 | 2,321 | 23,771 | 4,320 | 30,100 | ||
| 2020 | 2,275 | 21,462 | 4,141 | 28,884 | ||
| 2019 | 4,424 | 23,524 | 4,215 | 30,838 | ||
| 2018 | 3,762 | 23,526 | 4,374 | 31,220 | ||
| 2017 | 2,846 | 23,277 | 4,444 | 33,454 | ||
| 2016 | 3,459 | 24,802 | 4,504 | 37,038 | ||
| 2015 | 3,610 | 24,094 | 4,308 | 13,891 | ||
| Garnet Health Medical Center - Catskills - G. Hermann Site | 2024 | NA | 1,700 | 37 | 2,751 | |
| 2023 | NA | 4,047 | 99 | 6,391 | ||
| 2022 | NA | 3,439 | 86 | 4,068 | ||
| 2021 | NA | 2,874 | 69 | 3,592 | ||
| 2020 | NA | 2,675 | 119 | 4,059 | ||
| 2019 | NA | 3,502 | 97 | 4,598 | ||
| 2018 | NA | 3,511 | 63 | 4,781 | ||
| 2017 | NA | 3,413 | 41 | 5,185 | ||
| 2016 | NA | 3,519 | 31 | 5,148 | ||
| 2015 | NA | 3,813 | 52 | 2,118 | ||
| Tompkins | Cayuga Endoscopy Center | 2024 | 1,185 | NA | NA | 4 |
| 2023 | 2,605 | NA | NA | 9 | ||
| 2022 | 2,516 | NA | NA | 39 | ||
| 2021 | 2,404 | NA | NA | 9 | ||
| 2020 | 2,152 | NA | NA | 9 | ||
| 2019 | 1,812 | NA | NA | 7 | ||
| 2018 | 1,951 | NA | NA | 9 | ||
| 2017 | 1,775 | NA | NA | 6 | ||
| 2016 | 2,001 | NA | NA | NA | ||
| 2015 | 1,572 | NA | NA | NA | ||
| Cayuga Medical Center at Ithaca | 2024 | 2,191 | 9,247 | 1,813 | 66,105 | |
| 2023 | 6,325 | 28,760 | 5,978 | 186,067 | ||
| 2022 | 5,993 | 28,679 | 5,990 | 78,318 | ||
| 2021 | 5,601 | 25,302 | 6,695 | 73,433 | ||
| 2020 | 4,939 | 19,707 | 5,917 | 64,779 | ||
| 2019 | 5,046 | 22,514 | 6,702 | 71,449 | ||
| 2018 | 4,920 | 23,136 | 6,098 | 67,896 | ||
| 2017 | 5,002 | 22,705 | 7,081 | 64,905 | ||
| 2016 | 5,429 | 23,393 | 7,147 | 63,983 | ||
| 2015 | 5,373 | 24,316 | 7,248 | 22,597 | ||
| Convenient Care Center | 2024 | 913 | NA | NA | 3,004 | |
| 2023 | 2,738 | NA | NA | 9,103 | ||
| 2022 | 2,833 | NA | NA | 7,608 | ||
| 2021 | 2,660 | 2 | NA | 8,887 | ||
| 2020 | 2,201 | 33 | NA | 18,243 | ||
| 2019 | 2,473 | 20 | NA | 22,612 | ||
| 2018 | 2,409 | 3 | NA | 20,984 | ||
| 2017 | 2,434 | 4 | NA | 22,199 | ||
| 2016 | 2,345 | NA | NA | 23,991 | ||
| 2015 | 3,061 | 1 | NA | 23,275 | ||
| Ulster | Ellenville Regional Hospital | 2024 | 125 | 2,287 | 21 | 1,856 |
| 2023 | 882 | 14,116 | 91 | 12,404 | ||
| 2022 | 794 | 13,851 | 106 | 10,608 | ||
| 2021 | 787 | 12,285 | 128 | 10,423 | ||
| 2020 | 581 | 10,160 | 144 | 8,767 | ||
| 2019 | 614 | 12,935 | 141 | 10,209 | ||
| 2018 | 835 | 12,375 | 238 | 10,143 | ||
| 2017 | 459 | 12,584 | 332 | 8,209 | ||
| 2016 | 468 | 13,822 | 260 | 5,309 | ||
| 2015 | 536 | 13,971 | 264 | 2,338 | ||
| Grand Street Gastroenterology, Inc. | 2024 | 0 | NA | NA | NA | |
| 2023 | 0 | NA | NA | NA | ||
| 2022 | 0 | NA | NA | NA | ||
| 2021 | 0 | NA | NA | NA | ||
| 2017 | 522 | NA | NA | NA | ||
| 2016 | 944 | NA | NA | NA | ||
| 2015 | 854 | NA | NA | NA | ||
| HealthAlliance Hospital Broadway Campus | 2024 | 0 | 0 | 0 | 9,726 | |
| 2023 | 2 | 0 | 0 | 23,674 | ||
| 2022 | 5,498 | 47,616 | 10,910 | 60,582 | ||
| 2021 | 6,100 | 48,216 | 11,208 | 83,840 | ||
| 2020 | 4,250 | 45,544 | 10,574 | 40,592 | ||
| 2019 | 8,988 | 127,784 | 24,520 | 66,008 | ||
| 2018 | 7,964 | 130,256 | 23,104 | 62,116 | ||
| 2017 | 8,584 | 130,964 | 27,796 | 59,804 | ||
| 2016 | 10,836 | 136,620 | 31,148 | 63,808 | ||
| 2015 | 11,860 | 148,360 | 32,236 | 44,608 | ||
| HealthAlliance Hospital Mary’s Avenue Campus | 2024 | 4,772 | 21,152 | 5,522 | 16,784 | |
| 2023 | 12,880 | 49,880 | 12,356 | 40,014 | ||
| 2022 | 676 | 2,204 | 570 | 14,574 | ||
| 2021 | 558 | NA | 0 | 18,772 | ||
| 2020 | 934 | NA | 1,072 | 27,322 | ||
| 2019 | 5,192 | 240 | 11,120 | 81,604 | ||
| 2018 | 5,076 | NA | 11,468 | 66,260 | ||
| 2017 | 4,824 | NA | 11,636 | 54,220 | ||
| 2016 | 5,692 | NA | 12,140 | 49,732 | ||
| 2015 | 7,268 | NA | 12,220 | 25,256 | ||
| Warren | Glens Falls Hospital | 2024 | 4,624 | 12,975 | 5,086 | 66,589 |
| 2023 | 10,895 | 33,503 | 12,007 | 160,704 | ||
| 2022 | 10,466 | 33,265 | 11,978 | 153,270 | ||
| 2021 | 10,221 | 32,028 | 11,602 | 158,957 | ||
| 2020 | 10,376 | 30,003 | 11,020 | 138,075 | ||
| 2019 | 12,416 | 36,115 | 11,821 | 142,811 | ||
| 2018 | 11,027 | 35,104 | 13,048 | 226,595 | ||
| 2017 | 11,640 | 37,501 | 13,464 | 224,889 | ||
| 2016 | 14,969 | 39,617 | 14,168 | 259,837 | ||
| 2015 | 15,293 | 39,106 | 14,096 | 39,949 | ||
| Northern GI Endoscopy Center | 2024 | 3,361 | NA | NA | NA | |
| 2023 | 6,328 | NA | NA | NA | ||
| 2022 | 5,538 | NA | NA | NA | ||
| 2021 | 5,047 | NA | NA | NA | ||
| 2020 | 3,530 | NA | NA | NA | ||
| 2019 | 4,918 | NA | NA | NA | ||
| 2018 | 4,603 | NA | NA | NA | ||
| 2017 | 1,658 | NA | NA | NA | ||
| Wayne | Newark-Wayne Community Hospital | 2024 | 1,613 | 7,260 | 1,816 | 20,050 |
| 2023 | 4,104 | 18,490 | 5,060 | 44,412 | ||
| 2022 | 4,018 | 18,157 | 5,049 | 47,184 | ||
| 2021 | 4,126 | 17,255 | 5,140 | 57,325 | ||
| 2020 | 4,141 | 16,010 | 5,323 | 44,518 | ||
| 2019 | 5,806 | 21,381 | 6,293 | 55,510 | ||
| 2018 | 5,474 | 21,370 | 5,936 | 55,781 | ||
| 2017 | 5,333 | 21,587 | 6,554 | 67,866 | ||
| 2016 | 5,594 | 22,372 | 5,988 | 101,715 | ||
| 2015 | 5,832 | 21,857 | 5,666 | 10,453 | ||
| Westchester | Blythedale Children’s Hospital | 2024 | NA | NA | 154 | 899 |
| 2023 | NA | NA | 378 | 2,586 | ||
| 2022 | NA | NA | 417 | 935 | ||
| 2021 | NA | NA | 391 | 913 | ||
| 2020 | NA | NA | 408 | 731 | ||
| 2019 | NA | NA | 409 | 908 | ||
| 2018 | NA | NA | 498 | 922 | ||
| 2017 | NA | NA | 587 | 996 | ||
| 2016 | NA | NA | 621 | 1,292 | ||
| 2015 | NA | NA | 616 | 1,842 | ||
| Eye Surgery Center of Westchester | 2024 | 1,877 | NA | NA | NA | |
| 2023 | 5,500 | NA | NA | NA | ||
| 2022 | 5,232 | NA | NA | NA | ||
| 2021 | 5,098 | NA | NA | NA | ||
| 2020 | 3,450 | NA | NA | NA | ||
| 2019 | 4,798 | NA | NA | NA | ||
| 2018 | 5,601 | NA | NA | NA | ||
| 2017 | 5,292 | NA | NA | NA | ||
| 2016 | 4,262 | NA | NA | NA | ||
| 2015 | 4,453 | NA | NA | NA | ||
| Gastroenterology of Westchester, LLC | 2024 | 709 | NA | NA | NA | |
| 2023 | 2,958 | NA | NA | NA | ||
| 2022 | 2,922 | NA | NA | NA | ||
| 2021 | 2,603 | NA | NA | NA | ||
| 2020 | 2,398 | NA | NA | NA | ||
| 2019 | 461 | NA | NA | NA | ||
| 2018 | 646 | NA | NA | NA | ||
| 2017 | 564 | NA | NA | NA | ||
| 2016 | 25 | NA | NA | NA | ||
| Montefiore Mount Vernon Hospital | 2024 | 574 | 7,034 | 1,457 | 8,968 | |
| 2023 | 973 | 14,676 | 1,947 | 23,823 | ||
| 2022 | 1,098 | 13,892 | 1,747 | 25,674 | ||
| 2021 | 1,069 | 14,622 | 1,749 | 32,468 | ||
| 2020 | 758 | 13,320 | 1,899 | 21,367 | ||
| 2019 | 1,360 | 18,209 | 3,186 | 31,126 | ||
| 2018 | 1,440 | 18,250 | 3,324 | 29,080 | ||
| 2017 | 1,472 | 18,708 | 3,063 | 30,062 | ||
| 2016 | 1,358 | 19,607 | 3,010 | 30,277 | ||
| 2015 | 1,477 | 17,957 | 3,096 | 20,280 | ||
| Montefiore New Rochelle Hospital | 2024 | 1,896 | 14,907 | 2,391 | 18,802 | |
| 2023 | 4,373 | 32,980 | 5,516 | 43,056 | ||
| 2022 | 4,420 | 32,607 | 5,786 | 47,563 | ||
| 2021 | 4,395 | 27,396 | 5,742 | 52,292 | ||
| 2020 | 3,807 | 23,198 | 4,820 | 36,526 | ||
| 2019 | 5,623 | 32,516 | 6,642 | 45,619 | ||
| 2018 | 5,410 | 31,573 | 7,049 | 45,710 | ||
| 2017 | 5,311 | 31,970 | 6,882 | 49,529 | ||
| 2016 | 5,667 | 33,872 | 7,164 | 54,043 | ||
| 2015 | 5,905 | 32,029 | 7,873 | 41,649 | ||
| New York Endoscopy Center | 2024 | 0 | NA | NA | NA | |
| 2023 | 0 | NA | NA | NA | ||
| 2022 | 1,530 | NA | NA | NA | ||
| 2021 | 2,546 | NA | NA | NA | ||
| 2020 | 1,911 | NA | NA | NA | ||
| 2019 | 2,341 | NA | NA | NA | ||
| 2018 | 2,323 | NA | NA | NA | ||
| 2017 | 2,213 | NA | NA | NA | ||
| 2016 | 2,117 | NA | NA | NA | ||
| 2015 | 1,743 | NA | NA | NA | ||
| New York-Presbyterian Westchester | 2024 | 5,593 | 16,352 | 6,417 | 31,946 | |
| 2023 | 8,842 | 31,995 | 11,874 | 70,961 | ||
| 2022 | 8,205 | 30,645 | 11,557 | 97,276 | ||
| 2021 | 7,617 | 26,521 | 11,016 | 67,279 | ||
| 2020 | 5,316 | 23,057 | 10,545 | 13,251 | ||
| 2019 | 6,541 | 31,095 | 11,351 | 19,202 | ||
| 2018 | 6,647 | 33,387 | 11,899 | 16,570 | ||
| 2017 | 5,535 | 35,822 | 11,476 | 15,808 | ||
| 2016 | 4,539 | 35,954 | 11,337 | 13,714 | ||
| 2015 | 4,164 | 35,512 | 11,376 | 13,158 | ||
| New York-Presbyterian Westchester Behavioral Health Center | 2024 | NA | NA | 1,630 | 9,224 | |
| 2023 | NA | NA | 3,190 | 15,518 | ||
| 2022 | NA | NA | 3,509 | 12,703 | ||
| 2021 | NA | 1 | 3,788 | 15,032 | ||
| 2020 | NA | 4 | 4,350 | 15,045 | ||
| 2019 | NA | NA | 5,003 | 14,662 | ||
| 2018 | NA | NA | 4,366 | 14,494 | ||
| 2017 | NA | NA | 4,369 | 14,816 | ||
| 2016 | NA | NA | 4,998 | 14,999 | ||
| 2015 | NA | NA | 4,957 | 15,007 | ||
| NewYork-Presbyterian/Hudson Valley Hospital | 2024 | 4,772 | 15,249 | 4,542 | 30,674 | |
| 2023 | 7,656 | 27,596 | 8,051 | 56,066 | ||
| 2022 | 7,573 | 27,448 | 7,583 | 68,142 | ||
| 2021 | 3,438 | 28,743 | 8,101 | 61,720 | ||
| 2020 | 2,813 | 25,042 | 7,511 | 50,545 | ||
| 2019 | 3,987 | 33,333 | 8,286 | 59,600 | ||
| 2018 | 4,167 | 32,338 | 8,457 | 58,447 | ||
| 2017 | 4,100 | 32,409 | 9,260 | 59,863 | ||
| 2016 | 3,811 | 33,206 | 8,815 | 57,686 | ||
| 2015 | 3,657 | 33,767 | 8,310 | 21,673 | ||
| Northern Westchester Hospital | 2024 | 3,937 | 8,712 | 3,481 | 17,700 | |
| 2023 | 11,887 | 26,913 | 10,289 | 52,007 | ||
| 2022 | 11,361 | 25,545 | 10,736 | 55,469 | ||
| 2021 | 11,626 | 22,275 | 10,335 | 62,650 | ||
| 2020 | 8,810 | 17,774 | 9,270 | 49,095 | ||
| 2019 | 11,107 | 23,285 | 9,923 | 43,087 | ||
| 2018 | 11,834 | 21,581 | 10,172 | 36,053 | ||
| 2017 | 7,225 | 20,618 | 10,022 | 36,521 | ||
| 2016 | 7,136 | 20,390 | 10,433 | 38,584 | ||
| 2015 | 6,876 | 21,659 | 10,198 | 38,759 | ||
| Phelps Hospital | 2024 | 4,682 | 8,659 | 2,400 | 32,406 | |
| 2023 | 10,884 | 20,859 | 7,241 | 91,433 | ||
| 2022 | 10,324 | 20,005 | 7,293 | 96,888 | ||
| 2021 | 10,550 | 18,215 | 7,216 | 109,099 | ||
| 2020 | 7,442 | 15,046 | 7,377 | 83,632 | ||
| 2019 | 8,235 | 19,255 | 8,341 | 80,377 | ||
| 2018 | 7,935 | 19,410 | 8,484 | 111,261 | ||
| 2017 | 7,362 | 19,357 | 8,036 | 107,539 | ||
| 2016 | 7,068 | 20,513 | 7,754 | 103,757 | ||
| 2015 | 6,362 | 20,748 | 7,978 | 28,627 | ||
| SJRH - Dobbs Ferry Pavillion | 2024 | 1,121 | 2,119 | 142 | 4,909 | |
| 2023 | 2,999 | 4,960 | 356 | 12,304 | ||
| 2022 | 3,000 | 4,552 | 390 | 13,723 | ||
| 2021 | 2,678 | 4,297 | 558 | 13,236 | ||
| 2020 | 2,235 | 4,069 | 692 | 11,427 | ||
| 2019 | 2,652 | 6,541 | 924 | 11,750 | ||
| 2018 | 2,588 | 7,207 | 781 | 12,759 | ||
| 2017 | 2,338 | 7,085 | 801 | 13,300 | ||
| 2016 | 2,699 | 7,310 | 959 | 13,671 | ||
| 2015 | 3,042 | 7,617 | 960 | 5,122 | ||
| SJRH - Park Care Pavilion | 2024 | NA | NA | 2,555 | 19,496 | |
| 2023 | NA | NA | 7,113 | 50,954 | ||
| 2022 | NA | NA | 7,363 | 56,387 | ||
| 2021 | NA | NA | 5,934 | 62,909 | ||
| 2020 | NA | NA | 5,619 | 58,613 | ||
| 2019 | NA | NA | 8,564 | 42,999 | ||
| 2018 | NA | 1 | 7,622 | 40,696 | ||
| 2017 | NA | NA | 6,949 | 40,855 | ||
| 2016 | NA | NA | 7,315 | 37,849 | ||
| 2015 | NA | NA | 7,303 | 37,849 | ||
| SJRH - St Johns Division | 2024 | 1,824 | 9,627 | 3,283 | 19,392 | |
| 2023 | 5,218 | 22,273 | 7,458 | 48,994 | ||
| 2022 | 4,614 | 22,260 | 7,623 | 53,354 | ||
| 2021 | 4,113 | 22,908 | 8,508 | 61,079 | ||
| 2020 | 3,097 | 22,908 | 9,311 | 46,753 | ||
| 2019 | 3,728 | 32,551 | 9,666 | 51,585 | ||
| 2018 | 3,705 | 34,221 | 8,818 | 46,848 | ||
| 2017 | 3,821 | 34,687 | 8,946 | 48,352 | ||
| 2016 | 4,078 | 35,239 | 9,743 | 44,578 | ||
| 2015 | 4,297 | 35,842 | 9,770 | 19,134 | ||
| St. Joseph’s MC-St. Vincent’s Westchester Division | 2024 | NA | NA | 1,352 | 17,972 | |
| 2023 | NA | NA | 2,620 | 35,710 | ||
| 2022 | NA | NA | 2,573 | 38,013 | ||
| 2021 | NA | NA | 2,716 | 40,231 | ||
| 2020 | NA | NA | 2,896 | 36,021 | ||
| 2019 | NA | NA | 3,050 | 32,863 | ||
| 2018 | NA | NA | 2,920 | 30,140 | ||
| 2017 | NA | NA | 3,083 | 26,963 | ||
| 2016 | NA | NA | 3,174 | 25,488 | ||
| 2015 | NA | NA | 3,179 | 26,844 | ||
| St. Joseph’s Medical Center | 2024 | 1,289 | 7,717 | 1,056 | 8,794 | |
| 2023 | 3,274 | 23,075 | 2,925 | 26,565 | ||
| 2022 | 3,288 | 21,753 | 2,818 | 25,031 | ||
| 2021 | 3,420 | 20,744 | 2,971 | 22,305 | ||
| 2020 | 2,489 | 20,585 | 3,455 | 19,759 | ||
| 2019 | 3,792 | 28,305 | 4,011 | 23,145 | ||
| 2018 | 3,346 | 30,544 | 4,019 | 23,737 | ||
| 2017 | 3,670 | 30,007 | 3,900 | 24,570 | ||
| 2016 | 4,201 | 30,479 | 3,811 | 26,243 | ||
| 2015 | 4,181 | 30,169 | 4,795 | 9,702 | ||
| Surgical Specialty Center of Westchester | 2024 | 2,230 | NA | NA | 0 | |
| 2023 | 3,450 | NA | NA | 0 | ||
| 2022 | 3,329 | NA | NA | 1 | ||
| 2021 | 3,330 | NA | NA | NA | ||
| 2020 | 2,712 | NA | NA | NA | ||
| 2019 | 3,145 | NA | NA | NA | ||
| 2018 | 3,099 | NA | NA | NA | ||
| 2017 | 2,922 | NA | NA | NA | ||
| 2016 | 2,902 | NA | NA | NA | ||
| 2015 | 2,481 | NA | NA | NA | ||
| The Ambulatory Surgery Center of Westchester | 2024 | 534 | NA | NA | NA | |
| 2023 | 3,833 | NA | NA | NA | ||
| 2022 | 3,796 | NA | NA | NA | ||
| 2021 | 3,825 | NA | NA | NA | ||
| 2020 | 3,377 | NA | NA | NA | ||
| 2019 | 4,399 | NA | NA | NA | ||
| 2018 | 4,031 | NA | NA | NA | ||
| 2017 | 4,623 | NA | NA | NA | ||
| 2016 | 4,779 | NA | NA | NA | ||
| 2015 | 4,573 | NA | NA | NA | ||
| The Rye ASC | 2024 | 831 | NA | NA | NA | |
| 2023 | 5,065 | NA | NA | NA | ||
| 2022 | 5,314 | NA | NA | NA | ||
| 2021 | 4,972 | NA | NA | NA | ||
| 2020 | 3,708 | NA | NA | NA | ||
| 2019 | 5,007 | NA | NA | NA | ||
| 2018 | 4,808 | NA | NA | NA | ||
| 2017 | 4,847 | NA | NA | NA | ||
| 2016 | 4,657 | NA | NA | NA | ||
| 2015 | 4,195 | NA | NA | NA | ||
| Westchester Medical Center | 2024 | 6,727 | 16,823 | 8,527 | 66,272 | |
| 2023 | 18,839 | 49,376 | 25,467 | 191,101 | ||
| 2022 | 16,727 | 47,796 | 23,984 | 192,928 | ||
| 2021 | 15,331 | 38,625 | 22,755 | 251,468 | ||
| 2020 | 12,342 | 28,906 | 20,076 | 174,110 | ||
| 2019 | 14,830 | 37,177 | 22,540 | 149,786 | ||
| 2018 | 13,504 | 35,615 | 21,971 | 139,422 | ||
| 2017 | 12,296 | 33,081 | 21,727 | 138,142 | ||
| 2016 | 12,185 | 32,426 | 21,258 | 120,658 | ||
| 2015 | 11,657 | 30,772 | 21,500 | 74,179 | ||
| White Plains Hospital Ambulatory Surgery Center | 2024 | 1,387 | NA | NA | 0 | |
| 2023 | 1,814 | NA | NA | 1 | ||
| 2022 | 366 | NA | NA | 2 | ||
| 2021 | 29 | NA | NA | NA | ||
| White Plains Hospital Center | 2024 | 11,374 | 36,427 | 11,451 | 214,321 | |
| 2023 | 23,830 | 70,678 | 24,249 | 413,584 | ||
| 2022 | 21,029 | 64,633 | 21,403 | 361,902 | ||
| 2021 | 17,695 | 57,005 | 21,281 | 246,706 | ||
| 2020 | 12,347 | 43,924 | 18,887 | 121,016 | ||
| 2019 | 14,129 | 52,244 | 21,246 | 130,645 | ||
| 2018 | 11,699 | 46,736 | 18,023 | 113,798 | ||
| 2017 | 11,202 | 41,086 | 17,696 | 115,474 | ||
| 2016 | 10,045 | 39,432 | 16,561 | 107,173 | ||
| 2015 | 9,353 | 39,809 | 15,367 | 91,886 | ||
| Winifred Masterson Burke Rehabilitation Hospital | 2024 | NA | NA | 1,517 | 15,186 | |
| 2023 | NA | NA | 2,862 | 34,008 | ||
| 2022 | NA | NA | 2,699 | 31,293 | ||
| 2021 | NA | NA | 2,581 | 19,272 | ||
| 2020 | NA | NA | 2,773 | 4,662 | ||
| 2019 | NA | NA | 2,889 | 8,772 | ||
| 2018 | NA | NA | 2,780 | 8,937 | ||
| 2017 | NA | NA | 2,420 | 9,395 | ||
| 2016 | NA | NA | 2,101 | 9,294 | ||
| 2015 | NA | NA | 2,249 | 7,905 | ||
| Yorktown Center for Specialty Surgery | 2024 | 0 | NA | NA | NA | |
| 2023 | 1,516 | NA | NA | NA | ||
| 2022 | 2,711 | NA | NA | NA | ||
| 2021 | 2,686 | NA | NA | NA | ||
| 2020 | 2,098 | NA | NA | NA | ||
| 2019 | 1,031 | NA | NA | NA | ||
| Yates | Soldiers and Sailors Memorial Hospital of Yates County | 2024 | 0 | 3,228 | 98 | 10,838 |
| 2023 | 0 | 7,662 | 315 | 25,382 | ||
| 2022 | 0 | 7,389 | 294 | 25,820 | ||
| 2021 | 0 | 6,744 | 297 | 25,165 | ||
| 2020 | NA | 5,948 | 291 | 19,992 | ||
| 2019 | NA | 7,723 | 400 | 23,156 | ||
| 2018 | NA | 7,337 | 604 | 23,485 | ||
| 2017 | 55 | 7,619 | 716 | 24,968 | ||
| 2016 | 206 | 7,733 | 713 | 24,439 | ||
| 2015 | 197 | 7,625 | 747 | 2,405 |
Table Prepared By: Isaac H. Michaels, MPH
Data Source: New York State Department of Health
Technical Notes
Please see this page for information about data submission requirements, including the following:
- “95% of the facility’s SPARCS data must be submitted 60 days following the month of patient discharge.”
- “100% of a facility’s SPARCS data is due 180 days following the end of the facility’s fiscal year.”