Published: June 25, 2021
Updated: May 30, 2025 at 06:01PM
Overview
Welcome to my Baseball Season Data Analysis page. Here, you’ll find a collection of visualizations and data tables that provide insights into the current MLB season. All of the data come from baseball-reference.com, and the page is updated on a daily basis during the regular season and post season.
Animation of Cumulative Wins, by Team, Over Time
The first visualization is an animation of cumulative wins, by team, over time. This animation allows you to see how each team’s record has evolved throughout the season, and get a sense of which teams are consistently performing well and which are struggling. You can use the controls to pause, rewind, and fast-forward through the animation, and see how each team’s record changes from day to day.
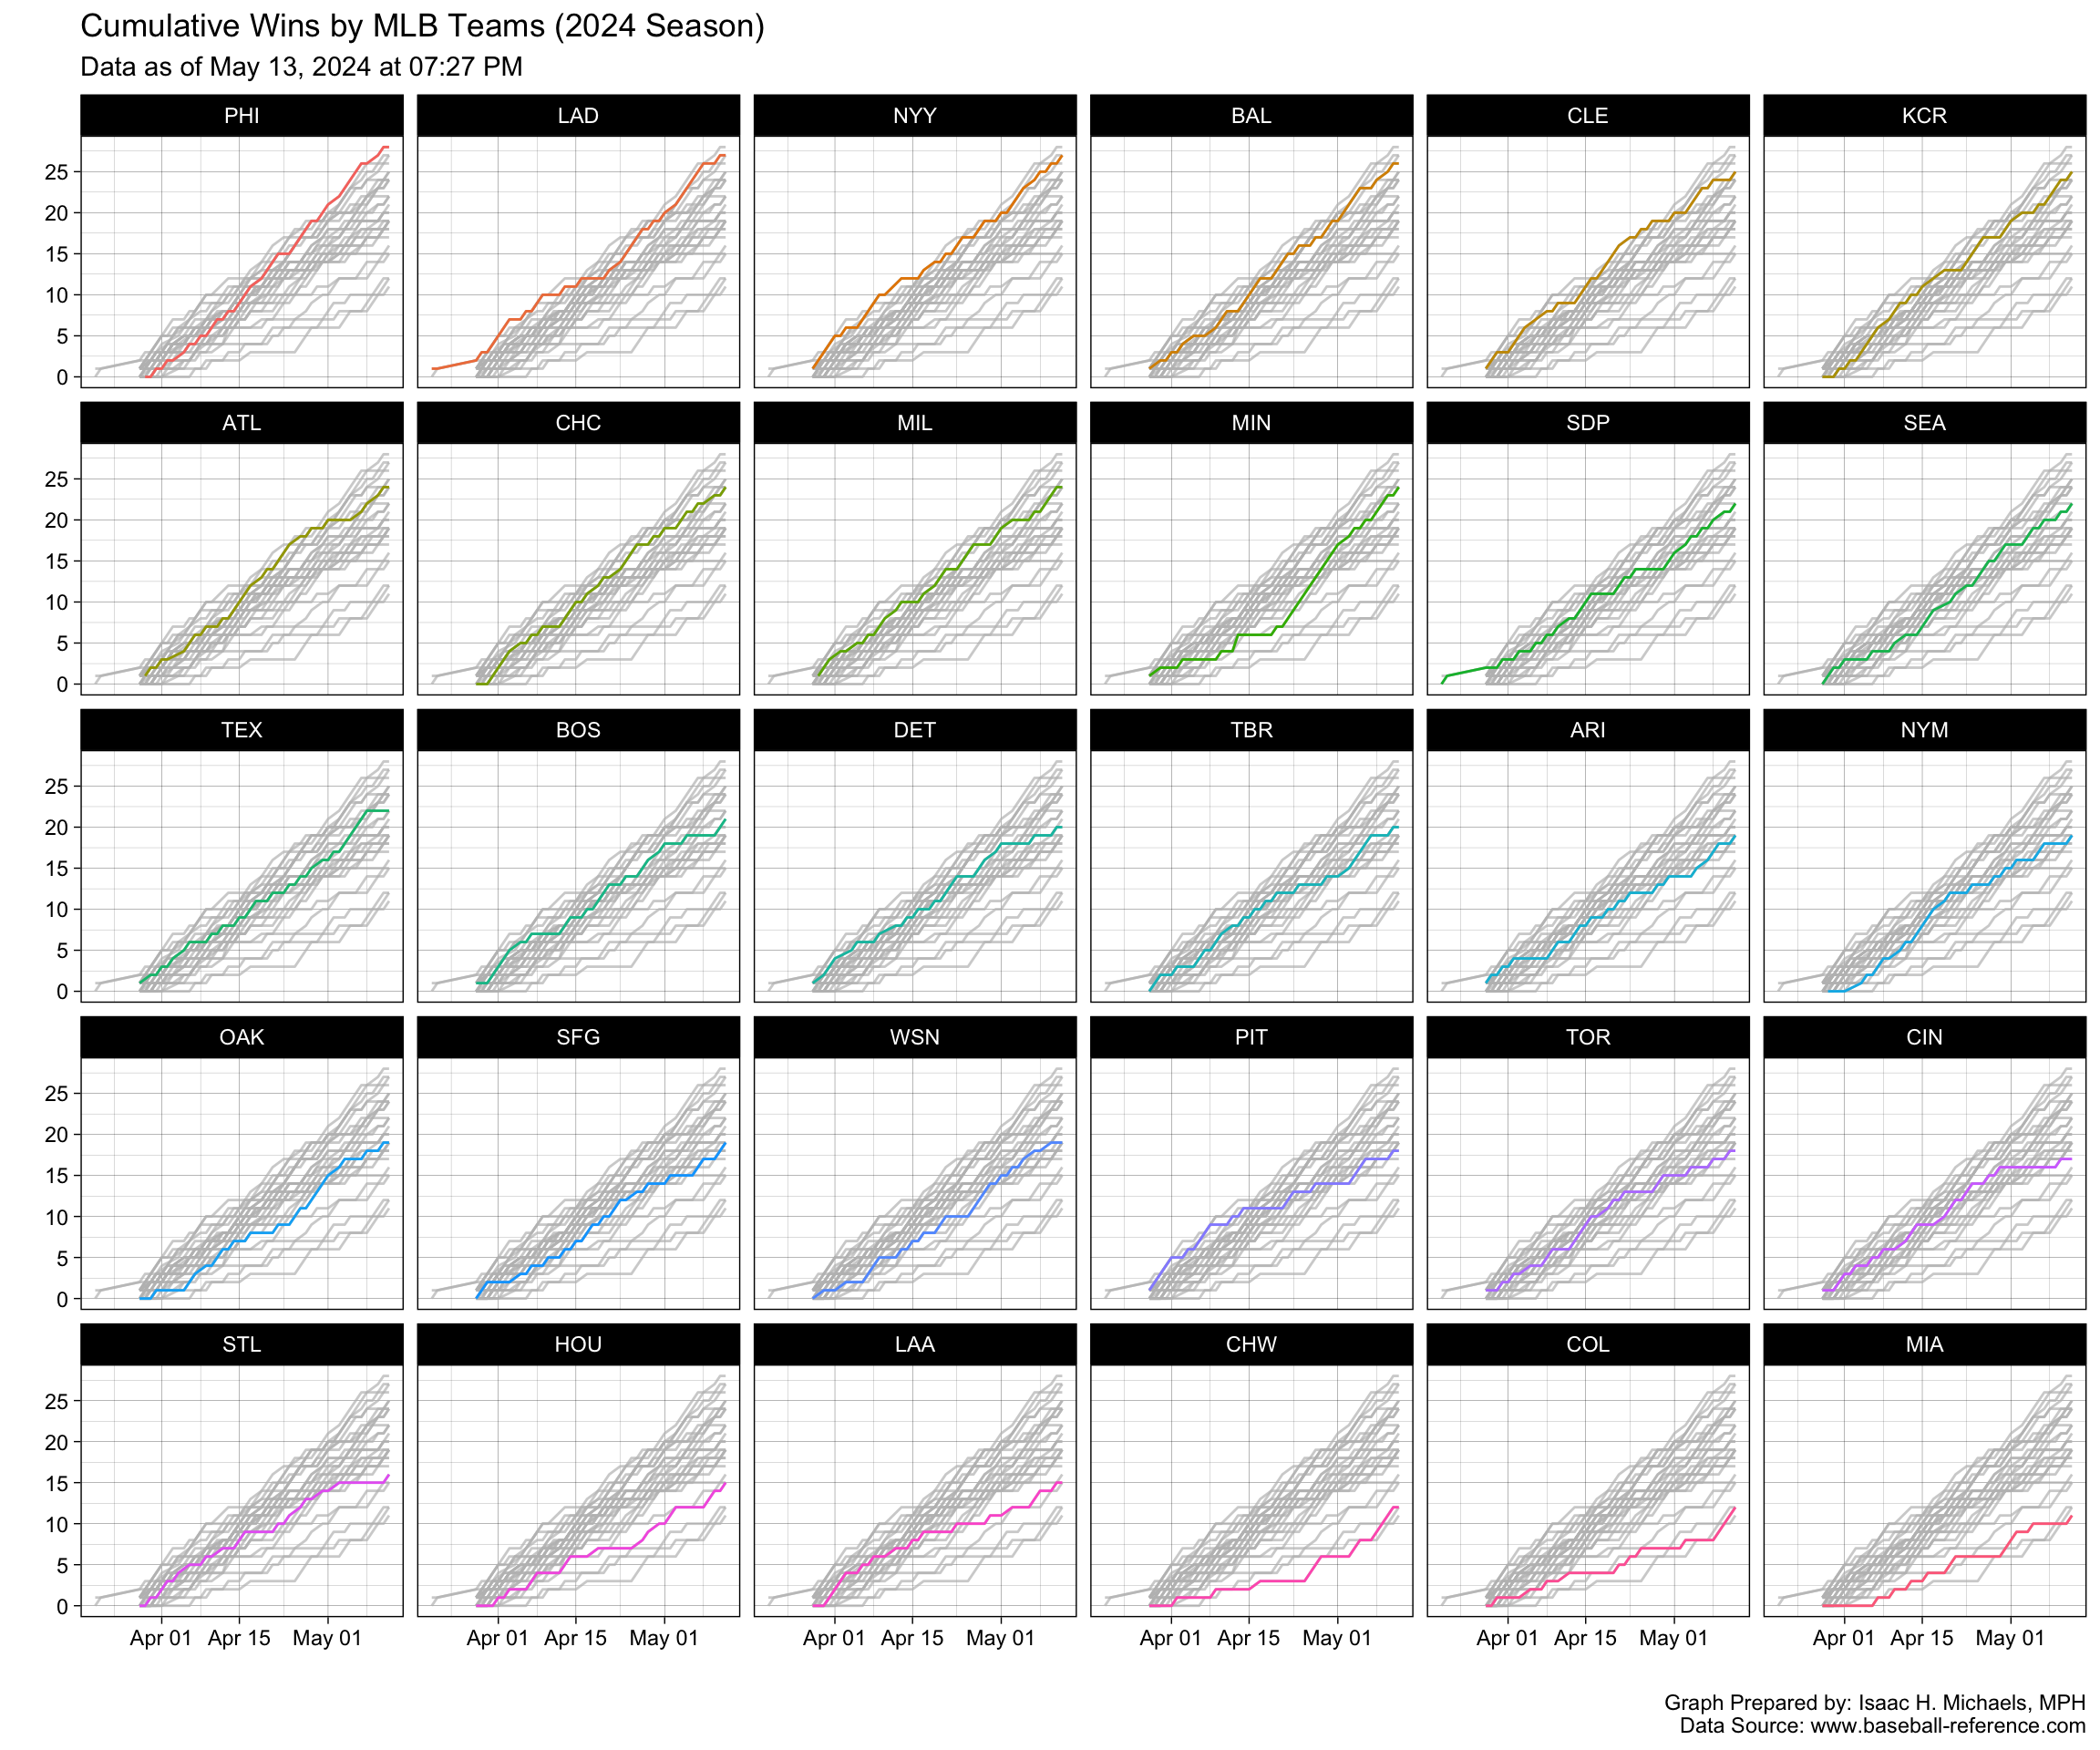
Trend Graphs of Cumulative Wins Over Time
In addition to the animation, I’ve also included trend graphs of cumulative wins over time, arrayed by team. These graphs allow you to see the overall trend in each team’s record over the course of the season, and get a sense of whether a team is on the rise or falling off.
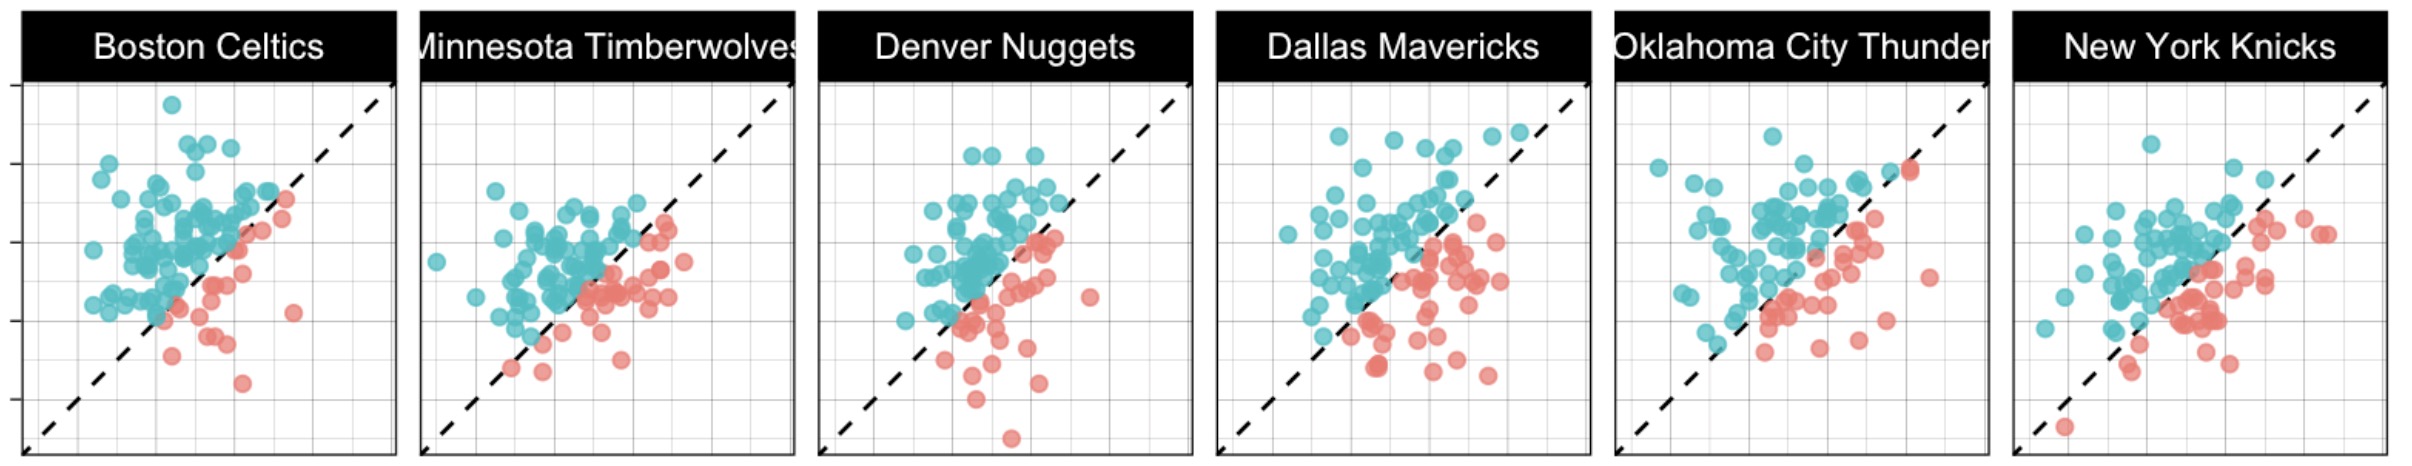
Scatter Plots of Runs Scored vs. Runs Allowed
Another visualization I’ve included is a set of scatter plots of runs scored vs. runs allowed in each game of the season, arrayed by team. These plots allow you to see how each team is performing offensively and defensively, and get a sense of which teams are particularly strong in one area or the other.
Bar Graphs of Games Played by Run Differential
I’ve also included bar graphs that show the number of games played by each team, broken down by run differential.
Bar Graphs of Run Differential Over Time
In addition to the bar graphs of games played by run differential, I’ve also included bar graphs that show the run differential for each team over time. These graphs allow you to see how each team’s performance has evolved over the course of the season, and get a sense of whether a team is consistently strong or prone to fluctuations.
Data Tables with Choropleth Shading
Finally, I’ve included data tables that compare individual players’ batting, pitching, and fielding stats, with choropleth shading to highlight the best and worst performers in each category. These tables allow you to see how each player stacks up against their peers, and get a sense of which players are having the most impact on their team’s performance.
I hope you find these visualizations and data tables helpful in understanding the current MLB season. Thank you for visiting the page.
Cumulative Wins
Graph Prepared By: Isaac H. Michaels, MPH
Data Source: www.baseball-reference.com
Graph Prepared By: Isaac H. Michaels, MPH
Data Source: www.baseball-reference.com
Runs Scored vs. Runs Allowed
Graph Prepared By: Isaac H. Michaels, MPH
Data Source: www.baseball-reference.com
Runs Differentials
Player Statistics
Batting
Note: Table displays rows only for players with at least 25 at bats.
Table Prepared By: Isaac H. Michaels, MPH
Data Source: www.baseball-reference.com
*: Left-Handed Batter
#: Switch Hitter
G – Games Played
PA – Plate Appearances
AB – At Bats
R – Runs Scored/Allowed
H – Hits/Hits Allowed
2B – Doubles Hit/Allowed
3B – Triples Hit/Allowed
HR – Home Runs Hit/Allowed
RBI – Runs Batted In
SB – Stolen Bases
CS – Caught Stealing
BB – Bases on Balls/Walks
SO – Strikeouts
BA – Hits/At Bats
OBP – (H + BB + HBP)/(At Bats + BB + HBP + SF)
SLG – Total Bases/At Bats
OPS – On-Base + Slugging Percentages
OPS+ – OPS+ Adjusted to the player’s ballpark(s)
GDP – Double Plays Grounded Into
IBB – Intentional Bases on Balls
Pitching
Note: Table displays rows only for players that played in at least 10 games.
Table Prepared By: Isaac H. Michaels, MPH
Data Source: www.baseball-reference.com
: Left-Handed Pitcher
W – Wins
L – Losses
W-L% – Win-Loss Percentage
ERA – 9 ER / IP
G – Games Played or Pitched
GS – Games Started
GF – Games Finished
CG – Complete Game
SHO – Shutouts
SV – Saves
IP – Innings Pitched
H – Hits/Hits Allowed
R – Runs Scored/Allowed
ER – Earned Runs Allowed
HR – Home Runs Hit/Allowed
BB – Bases on Balls/Walks
IBB – Intentional Bases on Balls
SO – Strikeouts
HBP – Times Hit by a Pitch
BK – Balks
WP – Wild Pitches
BF – Batters Faced
ERA+ – ERA+ Adjusted to the player’s ballpark(s)
WHIP – (BB + H)/IP
H9 – 9 x H / IP
HR9 – 9 x HR / IP
BB9 – 9 x BB / IP
SO9 – 9 x SO / IP
SO/W – SO/W or SO/BB
Fielding
Note: Table displays rows only for players that played in at least 10 games.
Table Prepared By: Isaac H. Michaels, MPH
Data Source: www.baseball-reference.com
G – Games Played or Pitched
GS – Games Started
CG – Complete Game
Inn – Innings Played in Field
Ch – Defensive Chances = Putouts + Assists + Errors
PO – Putouts
A – Assists
E – Errors Committed
DP – Double Plays Turned
Fld% – Fielding Percentage = (Putouts + Assists) / (Putouts + Assists + Errors)