Published: September 10, 2023
Updated: October 28, 2025 at 02:09AM
Welcome
Welcome to this page, which explores the trends in births and fertility rates among New York State residents over the years. The data presented here were gathered from the CDC WONDER database, and provide valuable insights into birth patterns and fertility rates in New York State.
Data Overview
The dataset covers a span of years from 1995 to 2024, allowing us to track birth counts, female population data, and fertility rates. I have created two visualizations to help you understand the trends over this period: a bar graph displaying the annual birth counts and a line graph illustrating fertility rates.
How to Use These Data
These data on births and fertility rates in New York State offer valuable insights that can be leveraged by various stakeholders, including researchers, policymakers, public health officials, and demographers. Here’s a detailed guide on how to make the most of this dataset:
Monitoring Temporal Trends: The annual birth counts and fertility rates are crucial for tracking temporal trends in New York State’s population dynamics. Researchers can utilize this information to identify long-term patterns and anomalies. By analyzing year-to-year changes, you can spot shifts in birth rates and fertility trends, which can be indicative of broader societal changes or the impact of public health initiatives.
Comparative Analysis: These data can be used for comparative analyses, both within New York State and across different regions or states. Researchers can assess how New York State’s birth and fertility patterns compare to national trends or trends in neighboring states. This comparative perspective can provide insights into whether New York State is experiencing unique demographic shifts or following broader national trends.
Forecasting and Planning: Demographers can use these data to make population projections and forecasts. By understanding past birth and fertility trends, they can estimate future population growth or decline. This information is valuable for urban planning, resource allocation, and ensuring that healthcare infrastructure meets the needs of the population.
Research on Socioeconomic Factors: Researchers interested in the relationship between socioeconomic factors and birth/fertility rates can explore this dataset. By correlating birth rates with economic indicators, educational levels, or other demographic variables, researchers can gain insights into the complex interplay between societal factors and population dynamics.
These data provide a wealth of information for a wide range of applications. Whether you are conducting research, shaping policies, or planning healthcare services, the insights derived from this dataset can play a pivotal role in informed decision-making and addressing the evolving needs of New York State’s population.
Why are these data important?
Birth and fertility rate data are essential for public health officials, policymakers, and researchers. Understanding these trends helps in planning and implementing various programs related to maternal and child health. It also informs policies on family planning, healthcare infrastructure, and resource allocation.
What do these data show?
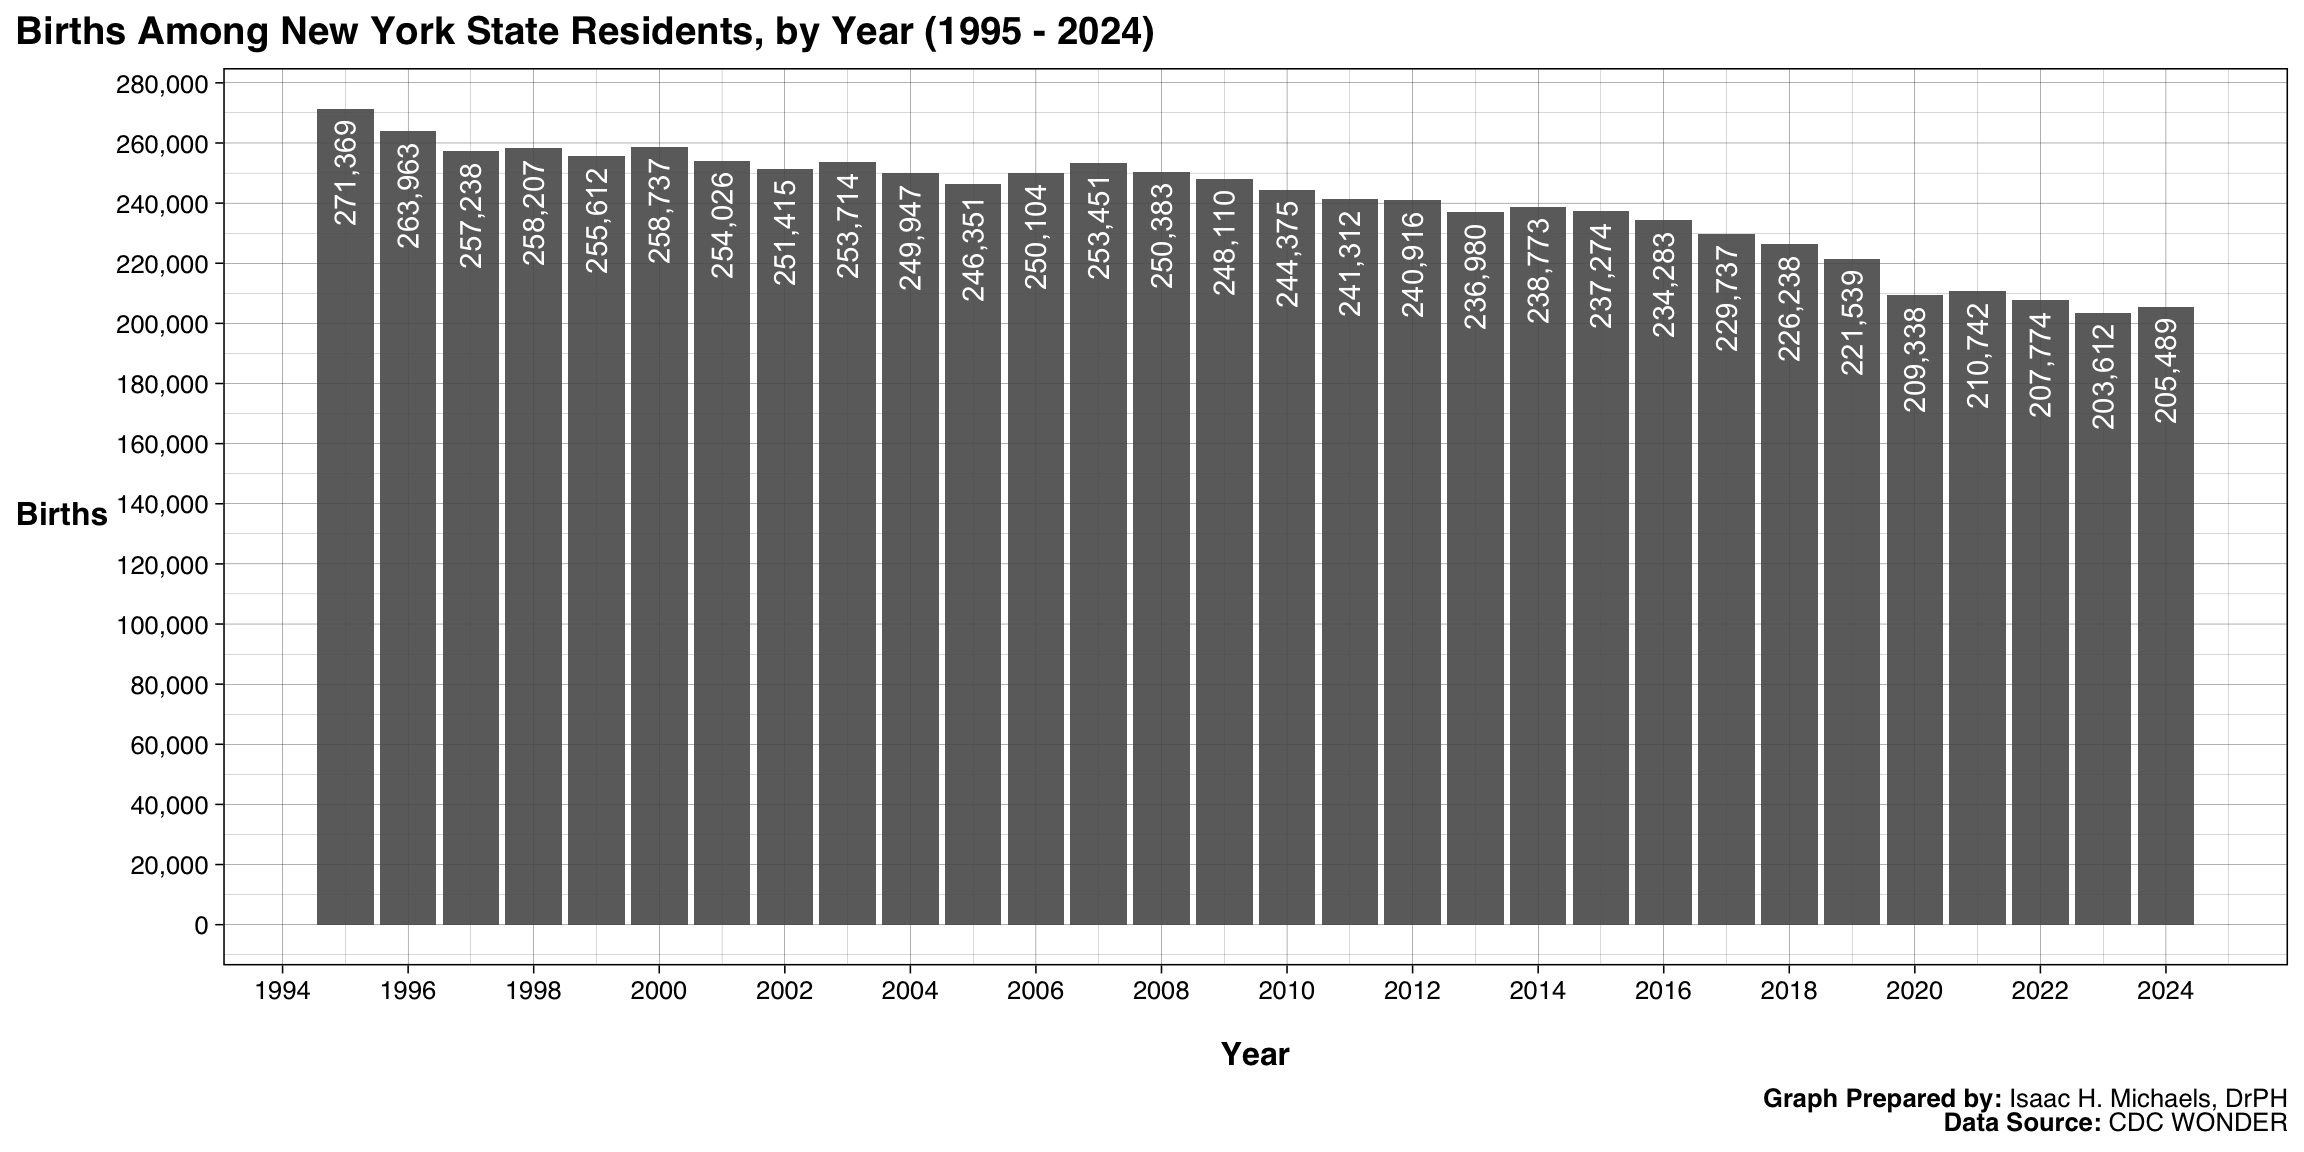
The bar graph displays the annual birth counts in New York State from 1995 to 2021. During the earlier years, birth counts were relatively high, reaching over 270,000 births in 1995. However, the number of births gradually decreased over the years, dropping to around 209,000 births in 2020.
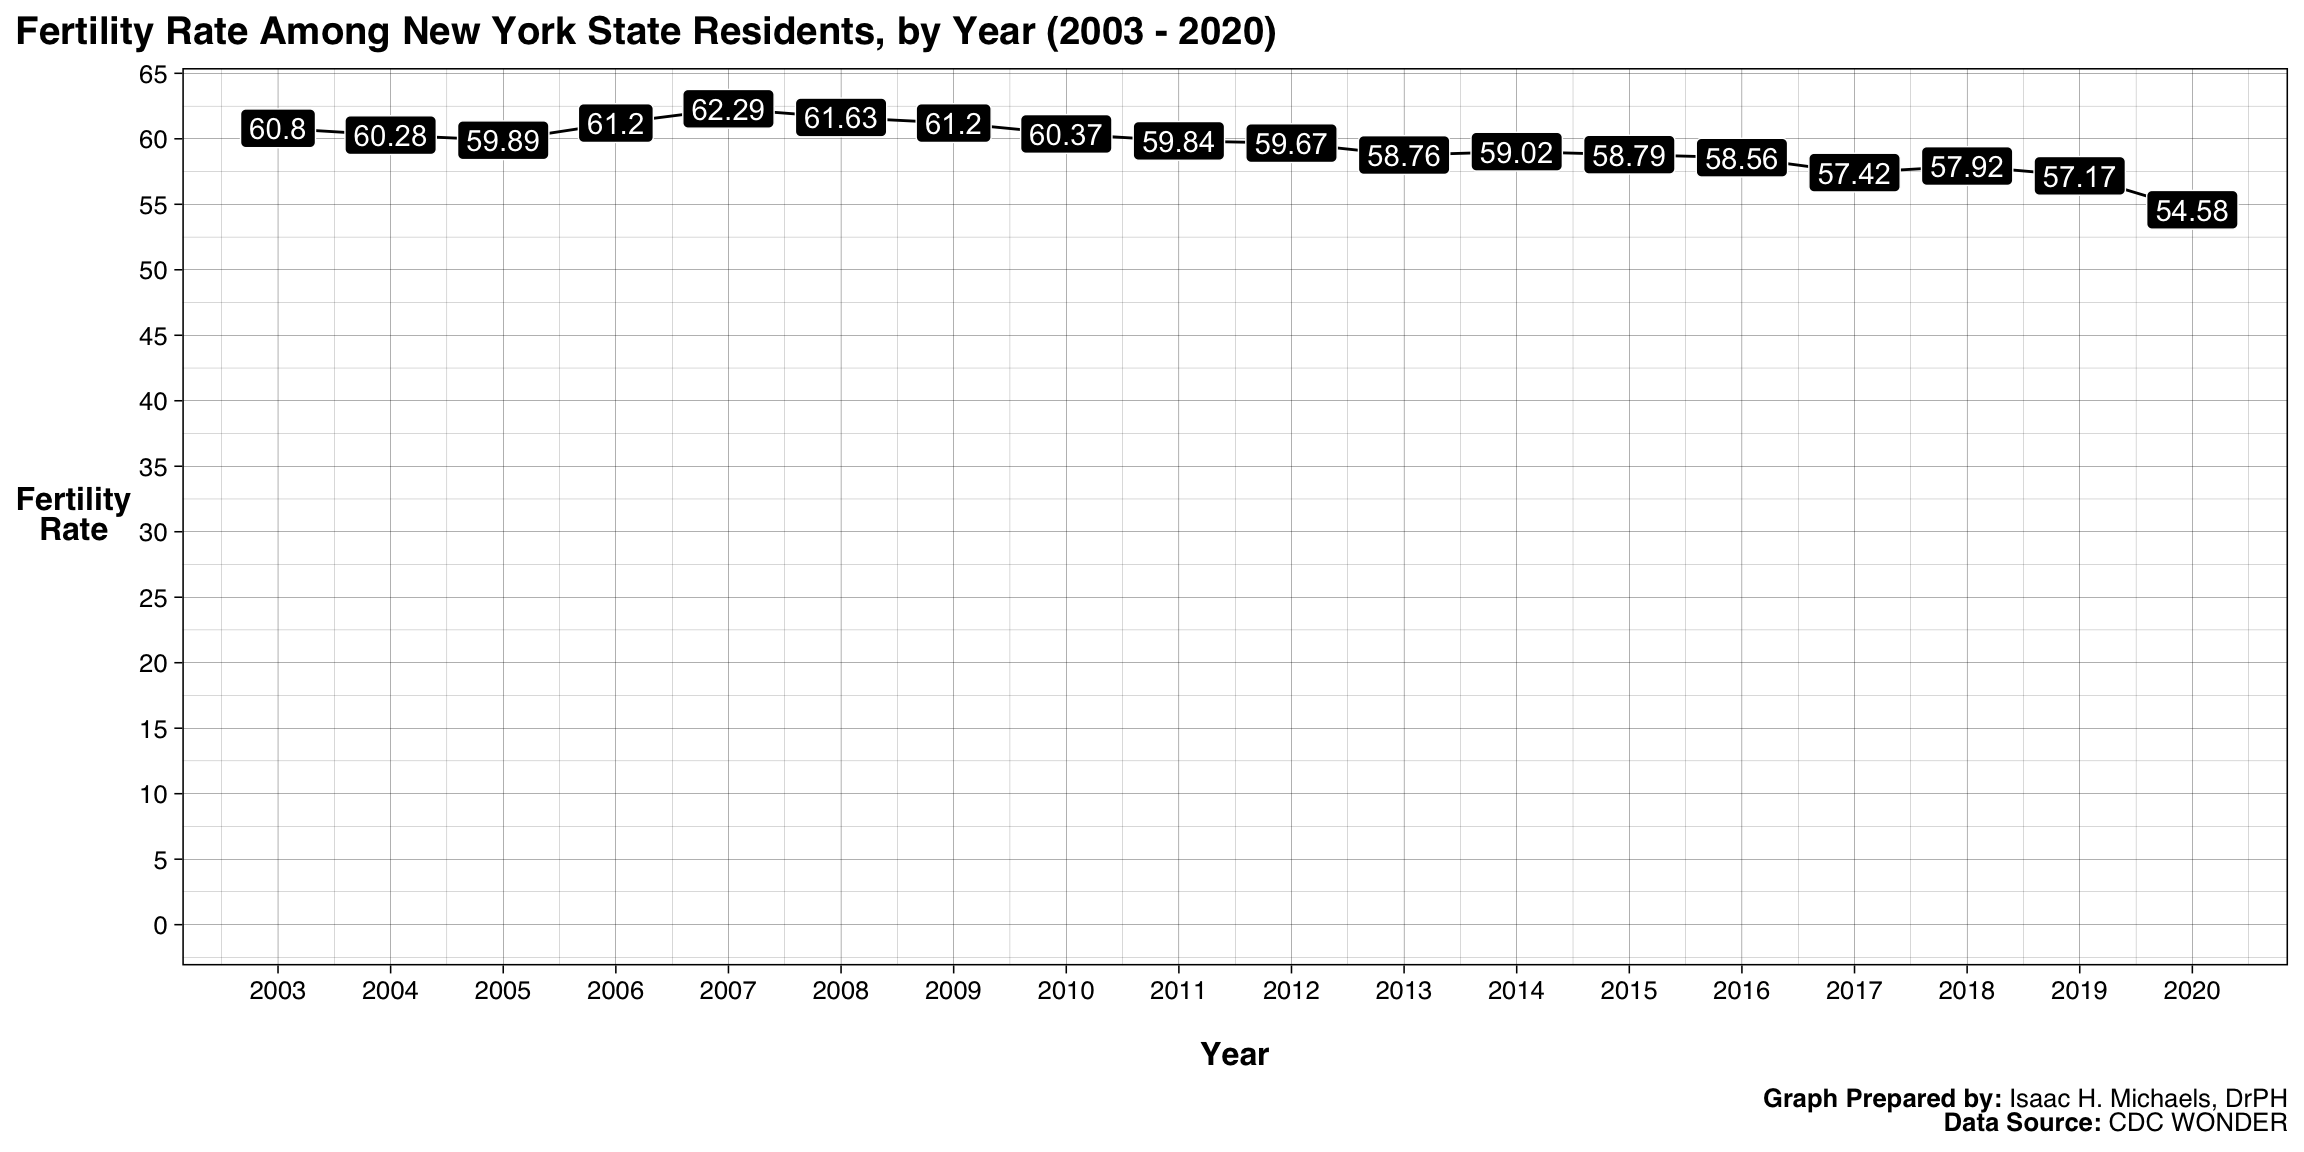
The line graph illustrates fertility rates, which represent the number of births per 1,000 females ages 15 - 44 years old in the given year. In the early years of the dataset, fertility rates are not available (NA) as the data does not include female population figures. From 2003 onwards, fertility rates are presented, and they follow a declining trend. In 2003, the fertility rate was 60.8 births per 1,000 women, and it gradually decreased to 54.6 in 2020.
What do these data not show?
While these data provide valuable insights into birth trends and fertility rates, they do not provide information about the underlying reasons for these trends. Factors such as socioeconomic status, healthcare access, cultural changes, and family planning initiatives can influence birth rates but are not explicitly captured in this dataset. Additionally, the data have gaps where female population figures and fertility rates were not available.
Implications for Public Health Practice
These data have implications for public health practice in New York State. Understanding the declining birth trends and fertility rates can help policymakers and healthcare professionals make informed decisions regarding maternal and child health services. It can also inform family planning programs and resource allocation to address the evolving needs of the population.
These birth and fertility rate data offer valuable insights into the demographic dynamics of New York State. They provide a foundation for further research and policy development in areas related to maternal and child health and family planning.
Births
This chart presents the annual number of births among New York State residents from the earliest available year in the dataset through the most recent year of finalized data. Each bar represents the total count of births for a given year, labeled directly to facilitate year-to-year comparison. The visualization shows how the number of births has varied over time, reflecting demographic changes, fertility trends, and population size shifts. These data help public health professionals monitor reproductive patterns and assess the demand for maternal and child health services statewide.
 Graphs Prepared By: Isaac H. Michaels, DrPH
Data Source: CDC WONDER
Fertility Rates
This figure illustrates the fertility rate among New York State residents over time, defined as the number of births per 1,000 women aged 15–44. The line shows the annual fertility rate, with labeled data points highlighting each year’s value. The trend helps identify long-term shifts in reproductive behavior, such as delayed childbearing, changes in population age structure, and evolving social or economic factors influencing family planning. Tracking fertility rates complements birth count data by accounting for population size, offering a clearer view of reproductive trends.
 Graphs Prepared By: Isaac H. Michaels, DrPH
Data Source: CDC WONDER