Overview
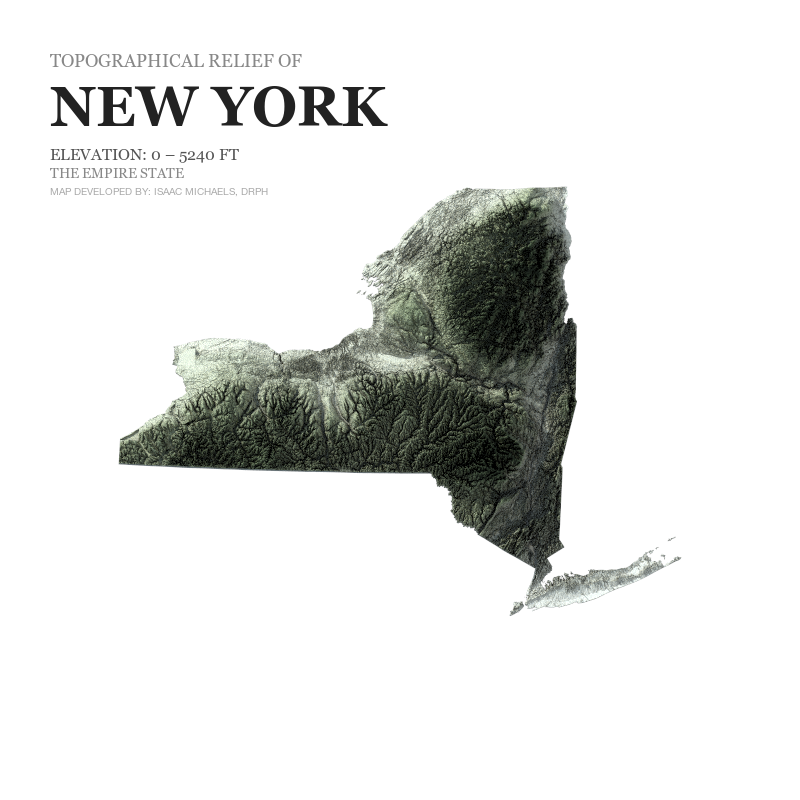
Explore this collection of high-resolution digital elevation models (DEM) detailing the topographical diversity of New York State. Using a custom cartographic pipeline developed in R, this project employs 3D path-tracing and elevation clamping to visualize the state’s physical geography across regional, municipal, and city-level scales.
By neutralizing modern infrastructure—such as urban skylines—these renders isolate the underlying bedrock ridges, glacial moraines, and dissected plateaus that define the region. The resulting maps present complex spatial data through a unified cartographic aesthetic, providing a clear visualization of New York’s geological formations.
Click any map to view the high-resolution render.
Methodology & Pipeline
- Data Extraction: Elevation rasters were queried via the elevatr package, utilizing USGS 3DEP 1/3 arc-second (~10-meter) Digital Elevation Models (DEM). Spatial bounding and matrix conversions were handled using sf, terra, and rayshader.
- Elevation Clamping: Dynamic elevation thresholds were applied to the raw matrices to standardize baselines (e.g., setting sea level or river surfaces to a constant zero) and to cap extreme elevation anomalies, ensuring consistent spatial scaling within specific bounding boxes.
- Ray-Traced Rendering: The terrain matrices were converted into 3D geometric meshes and rendered using the rayrender package. Simulated direct and ambient path-traced lighting, alongside customized vertical exaggeration (\(z\)-scale) multipliers, were applied to maintain visual fidelity across differing geographic scales.
The Empire State
The NYC Portrait Series
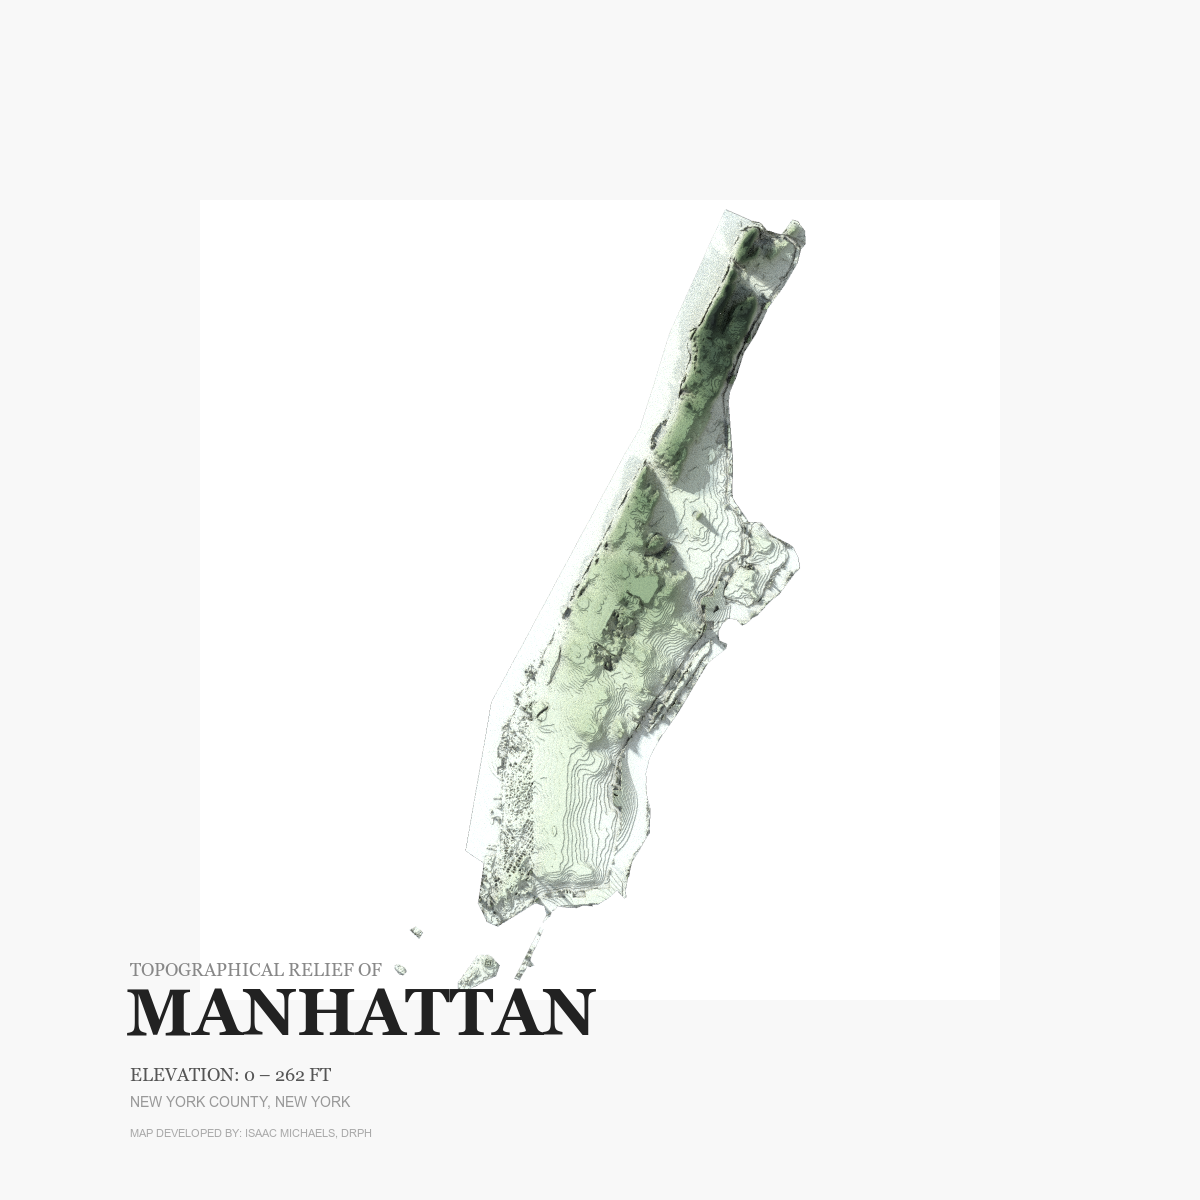
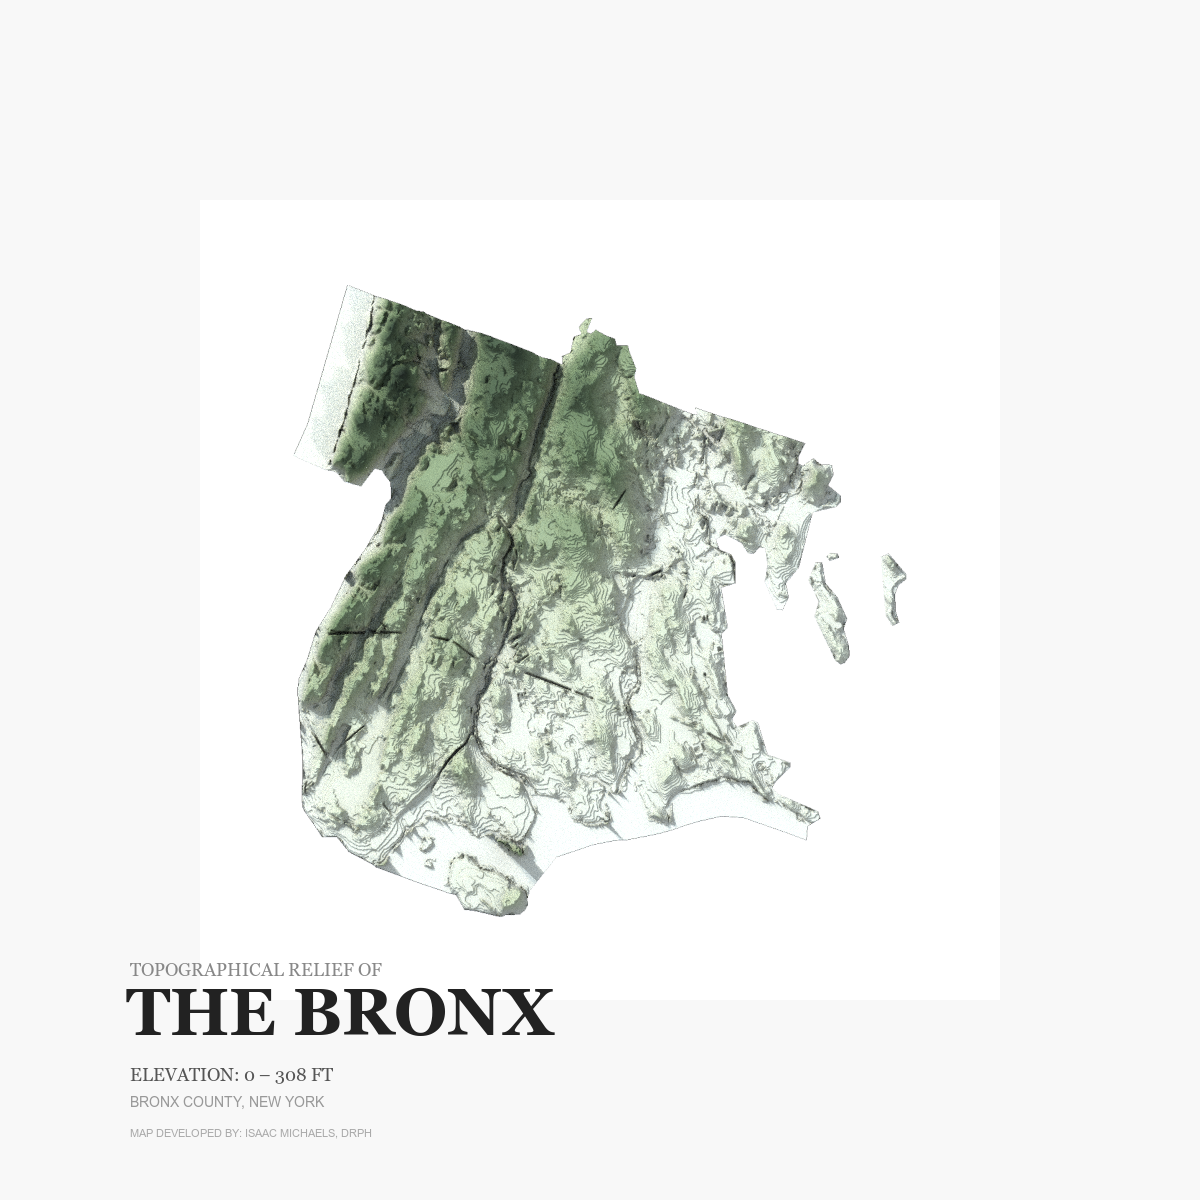
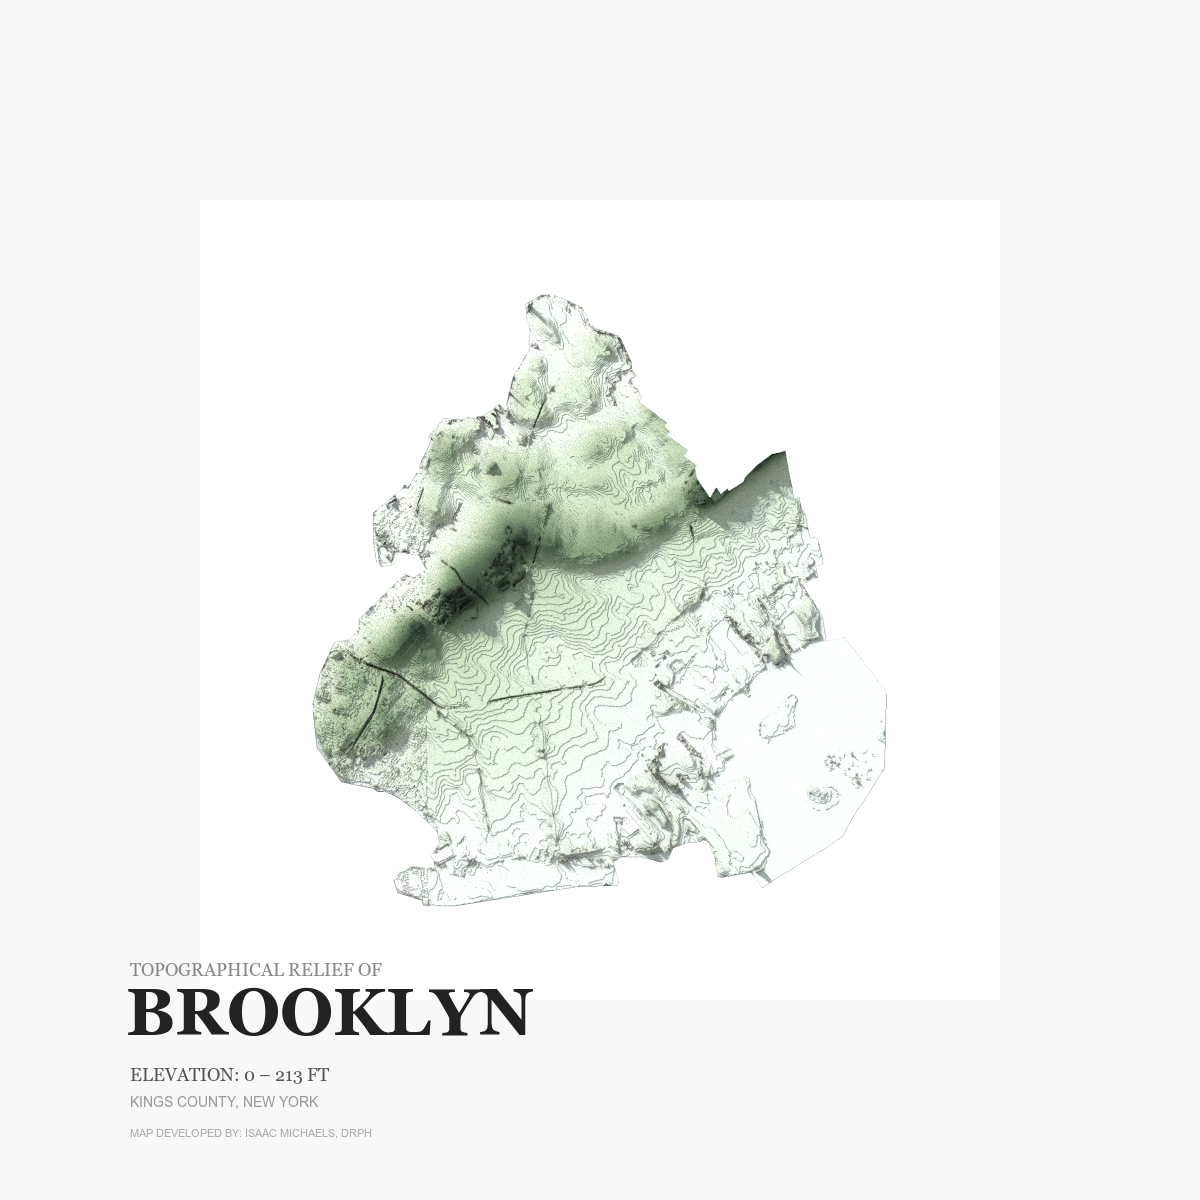
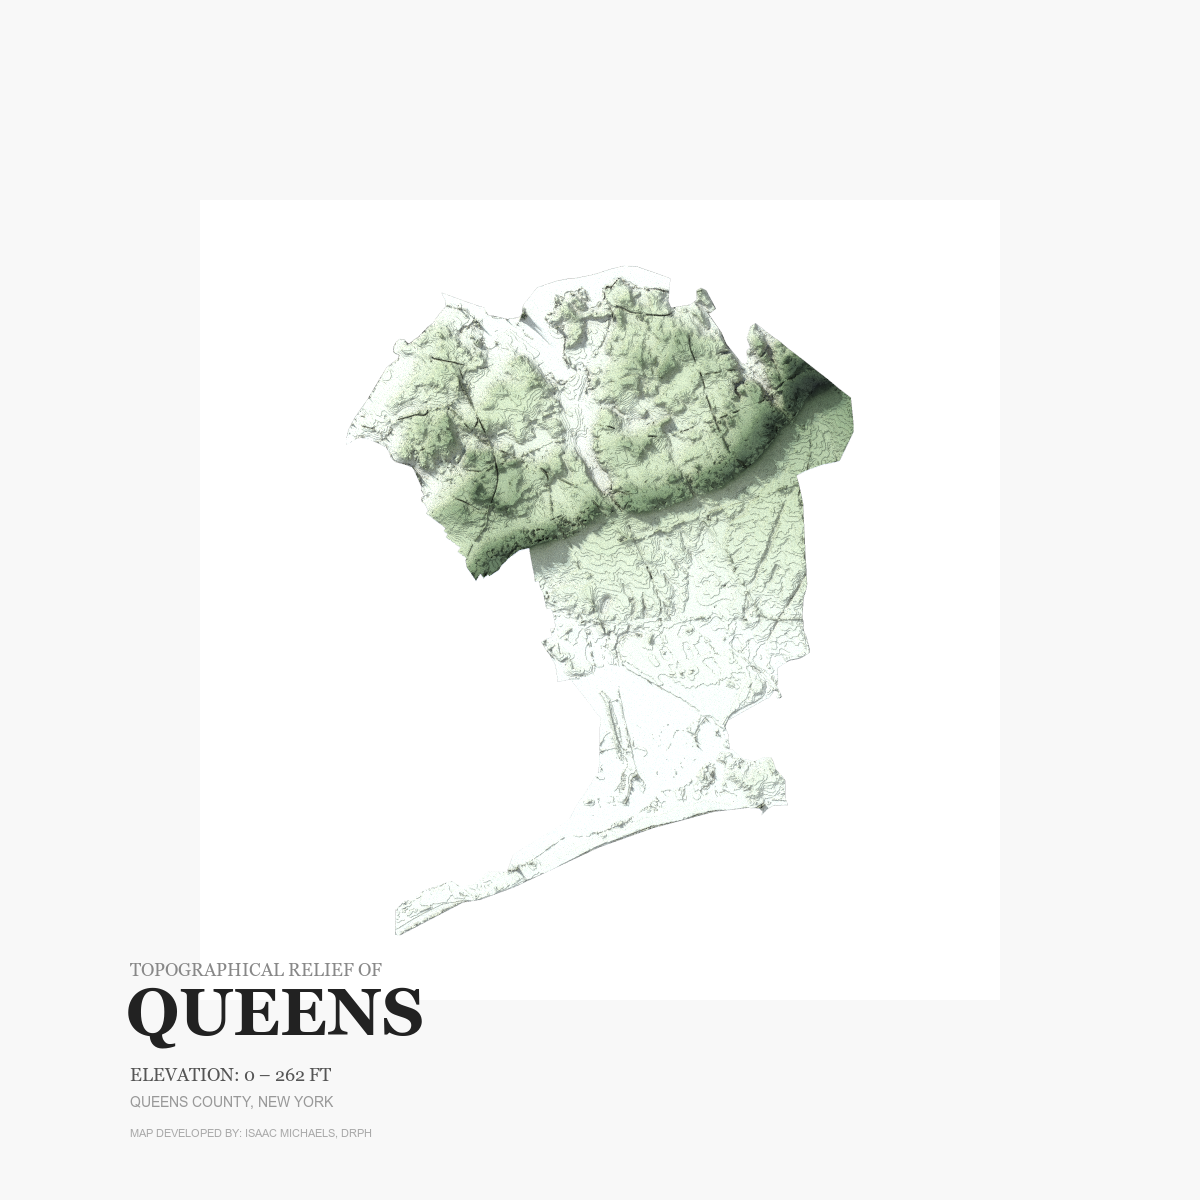
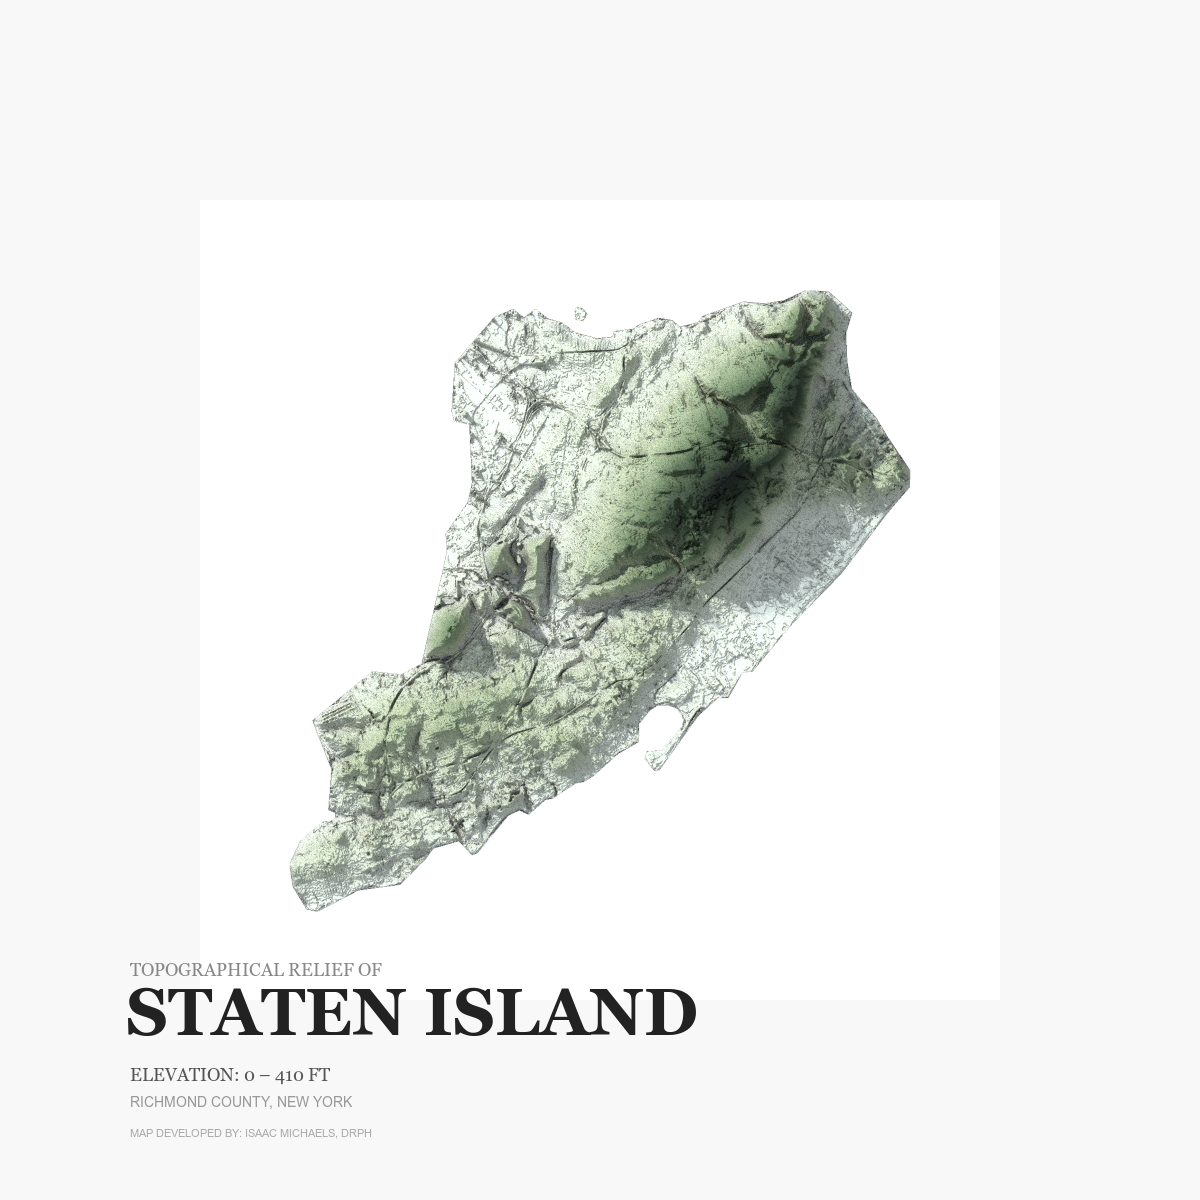
Spatial Features: Urban Elevation Differences, Natural Ridges, Low-Lying Coastlines | Vertical Exaggeration: 0.5x | Elevation Clamped: 125m
These plates display the topography of the five boroughs by removing buildings and modern infrastructure. Northern Manhattan and the western Bronx show sharp ridges and significant elevation changes, which historically directed transit lines and development patterns. Southern Brooklyn and eastern Queens consist of flat, low-lying ground, illustrating the natural terrain beneath the city’s modern flood zones and drainage basins.
Coastal Edges
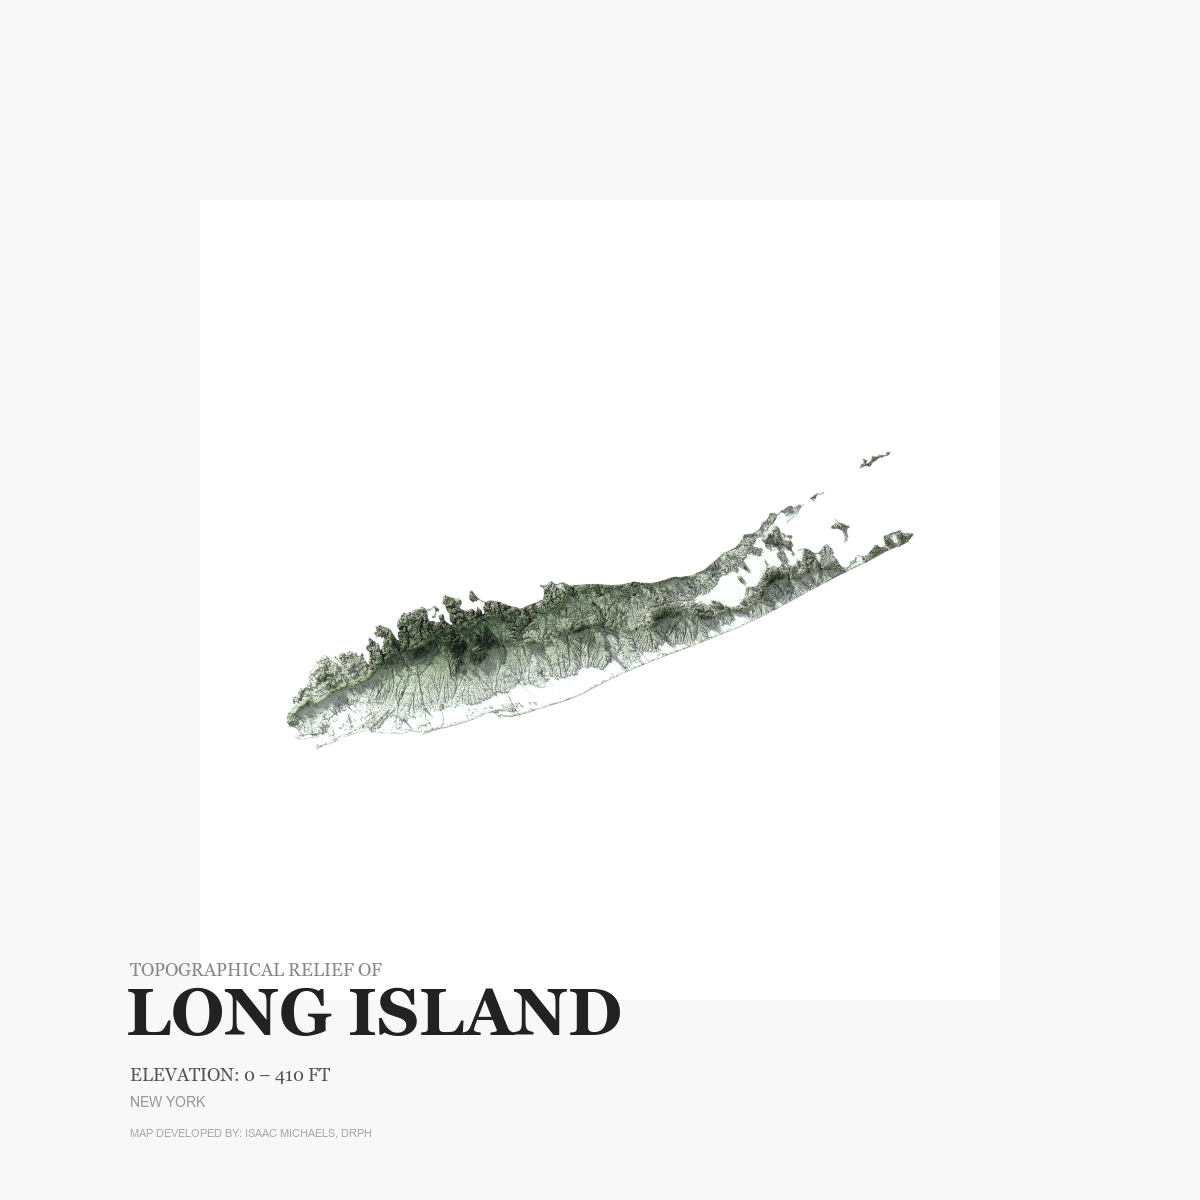
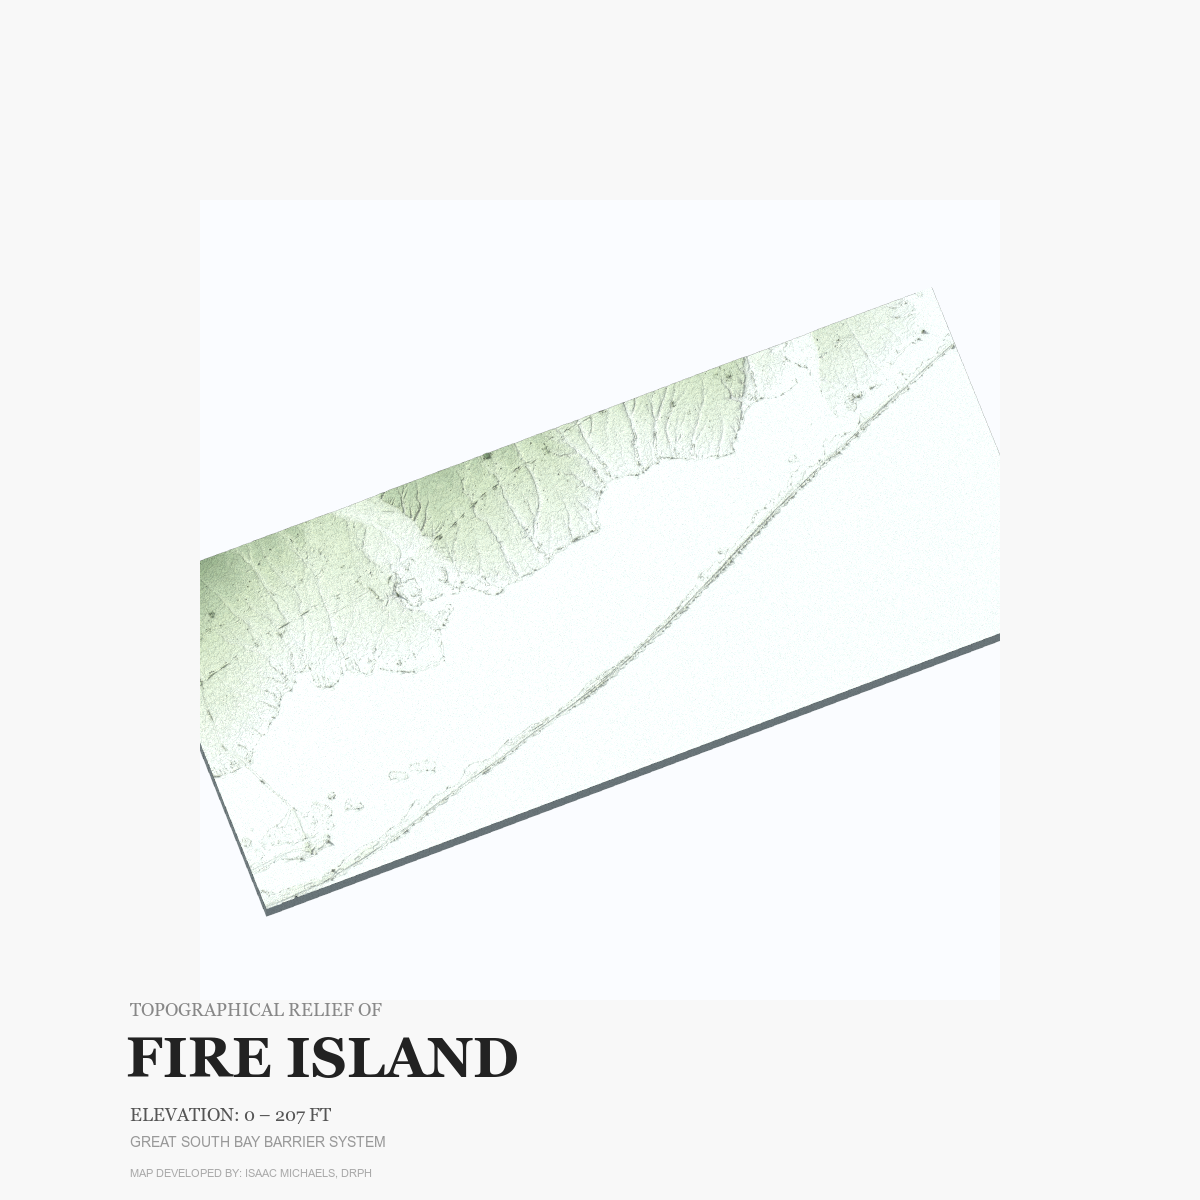
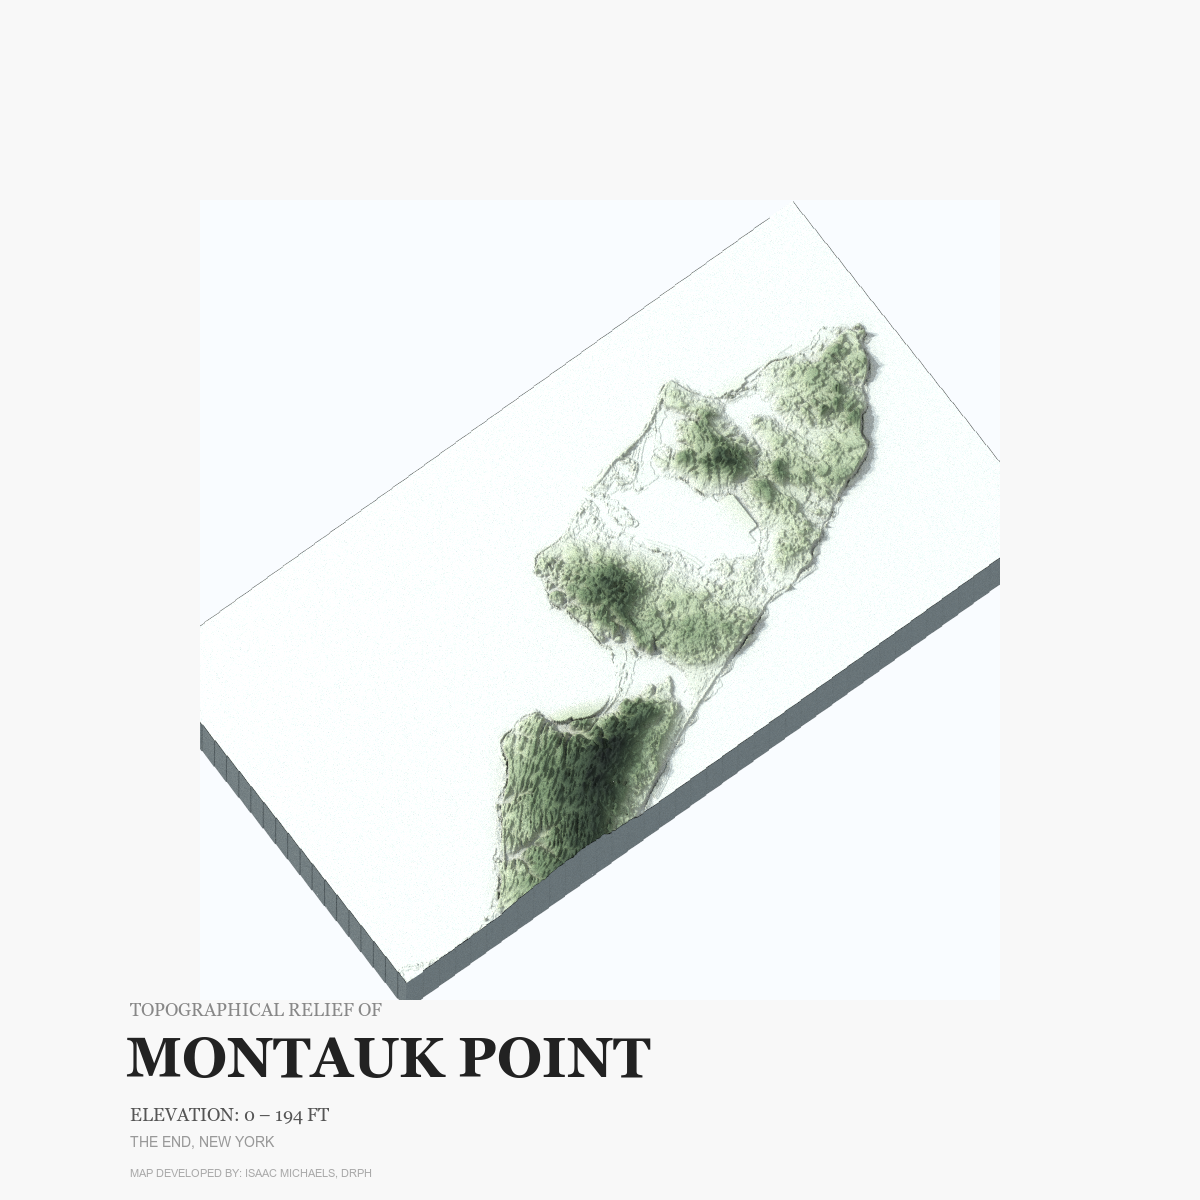
Spatial Features: Coastal Elevation Profiles, Low Plains, Ocean Bluffs | Vertical Exaggeration: 0.3x – 1.5x
These models capture the shape of Long Island from west to east. The terrain transitions from low, flat coastal plains along the southern shore to rolling high ground along the north. At Montauk Point, the land narrows into elevated bluffs that drop straight into the Atlantic Ocean.
The High Peaks & Plateaus
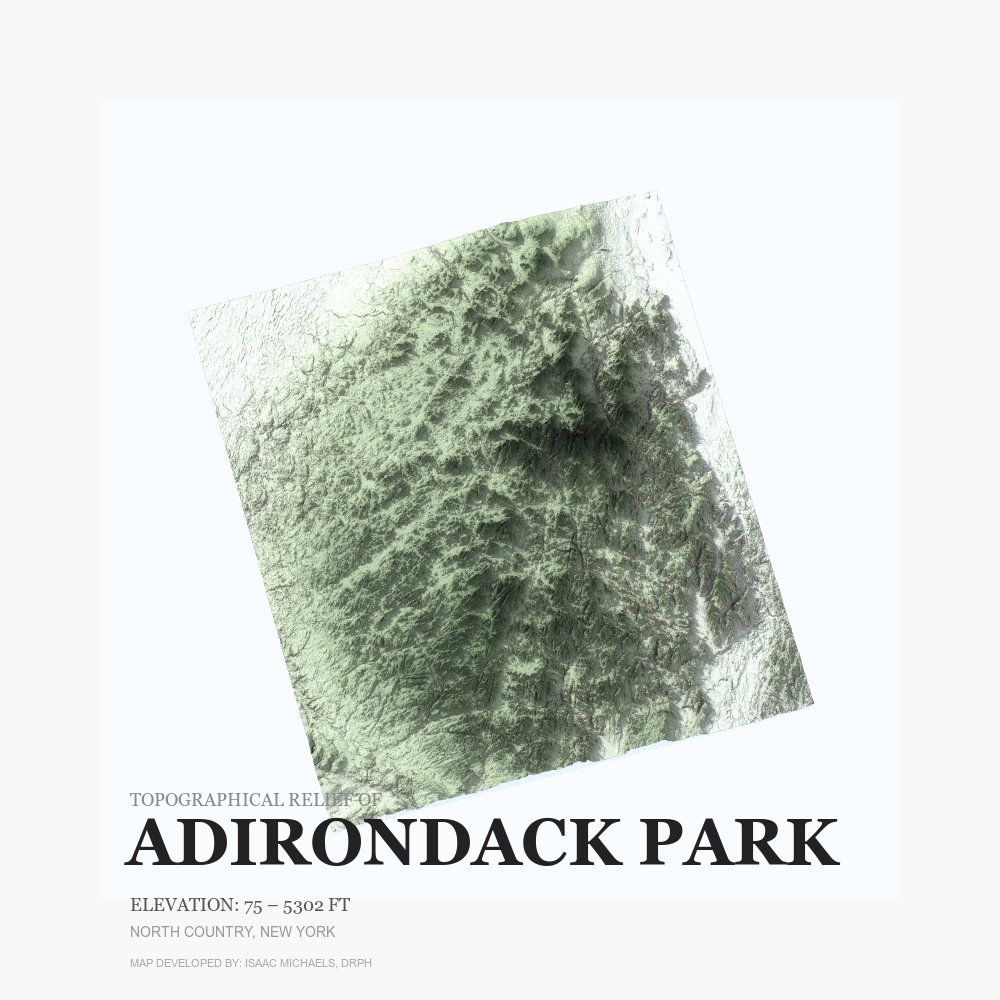
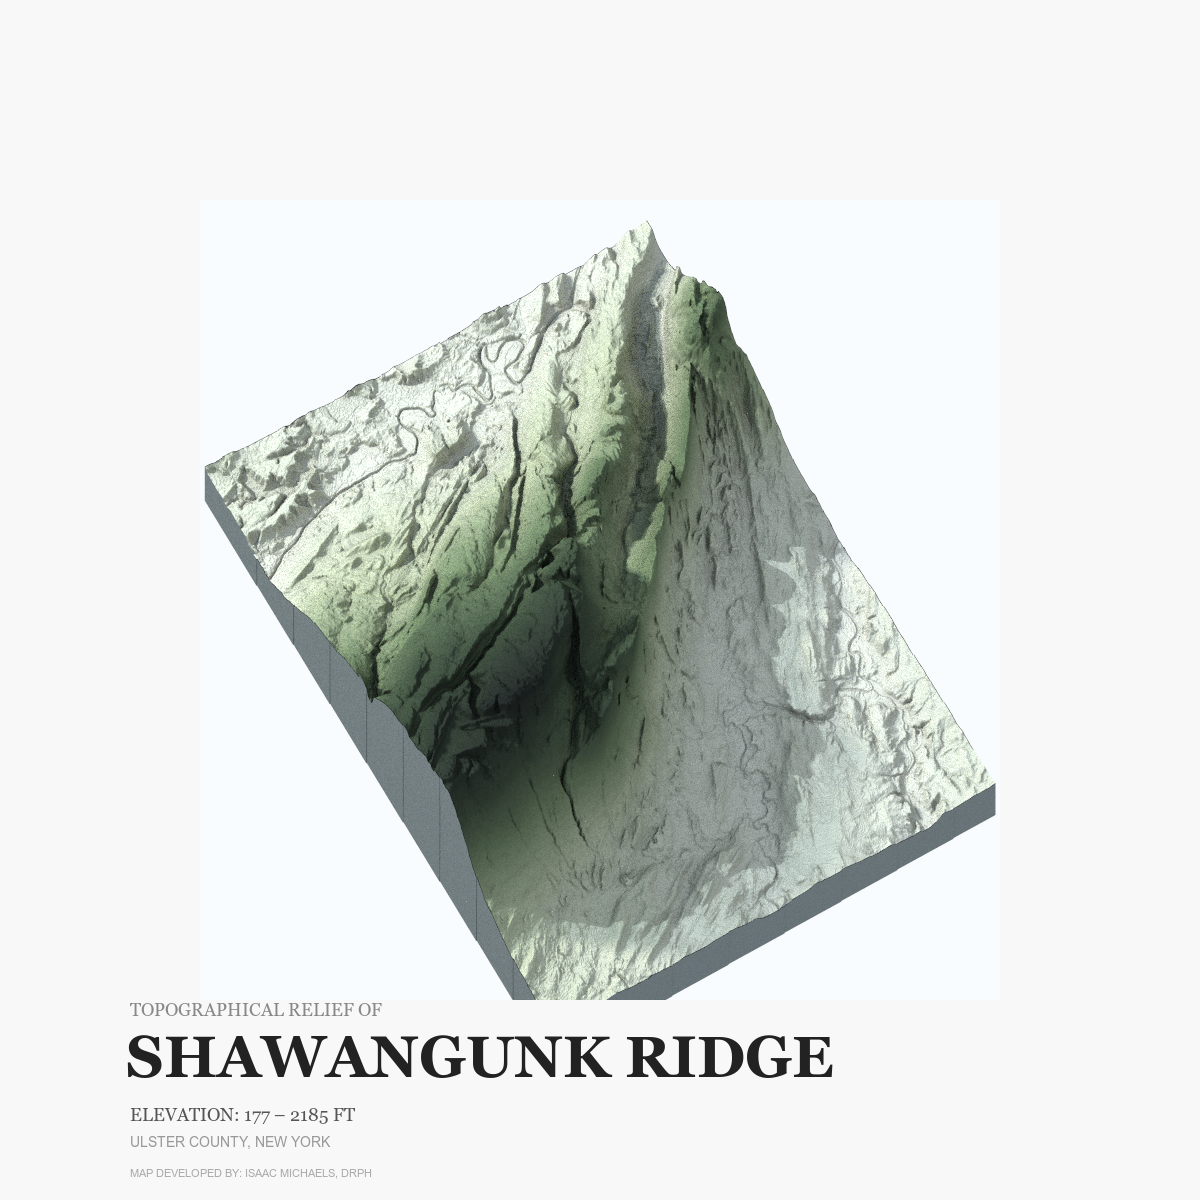
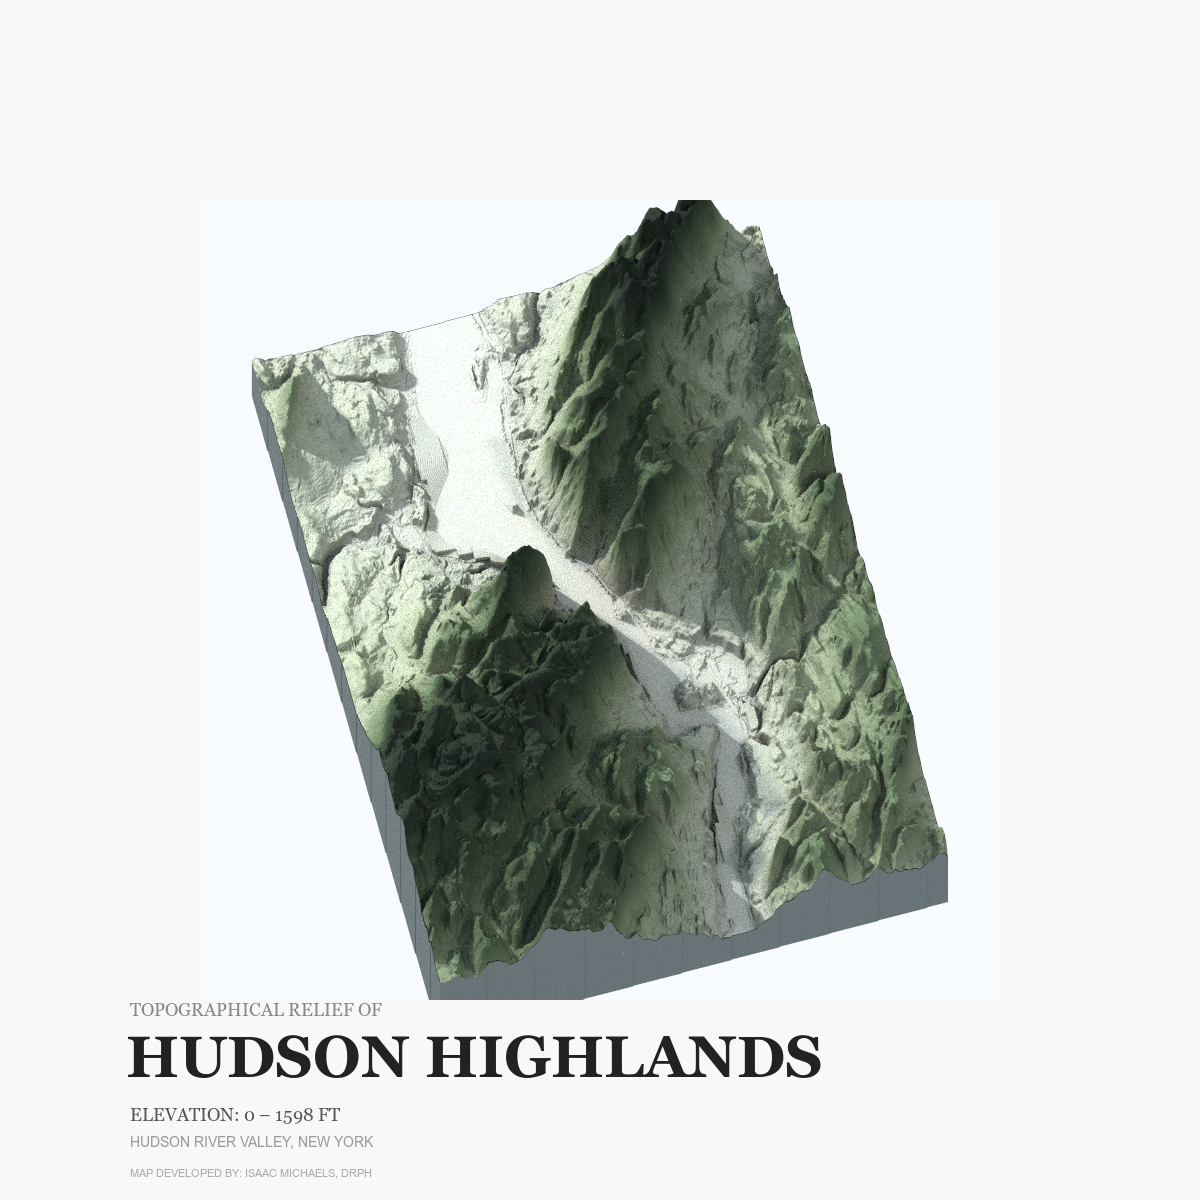
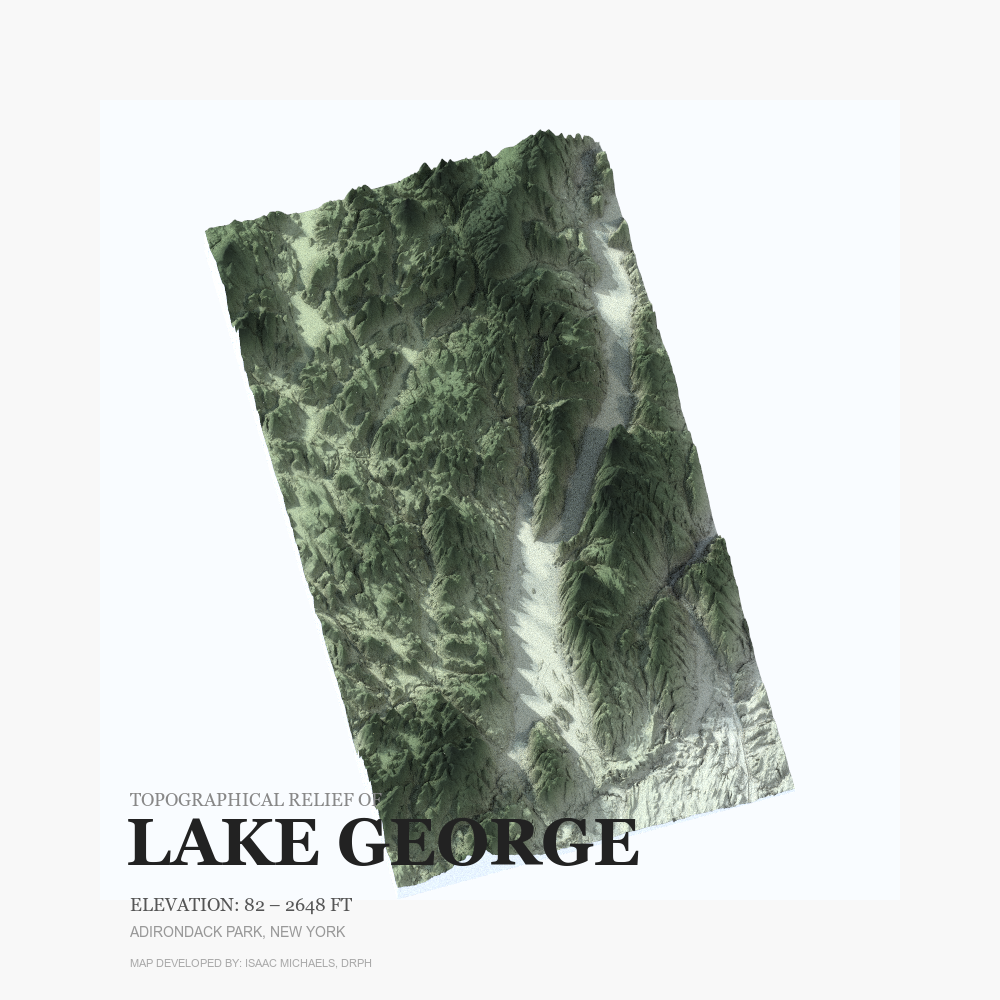
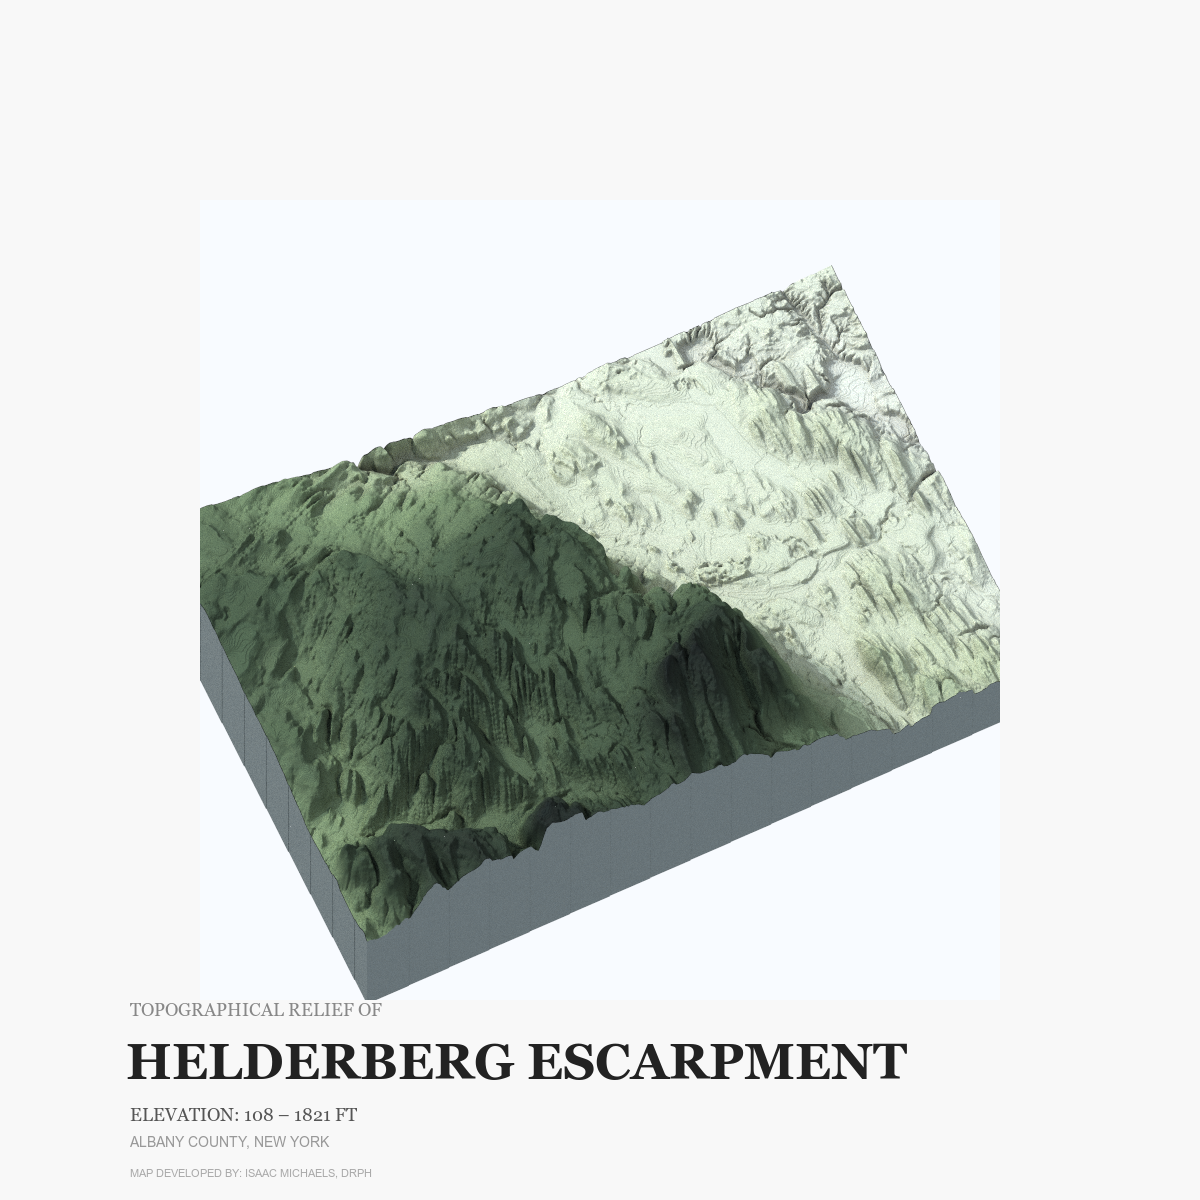
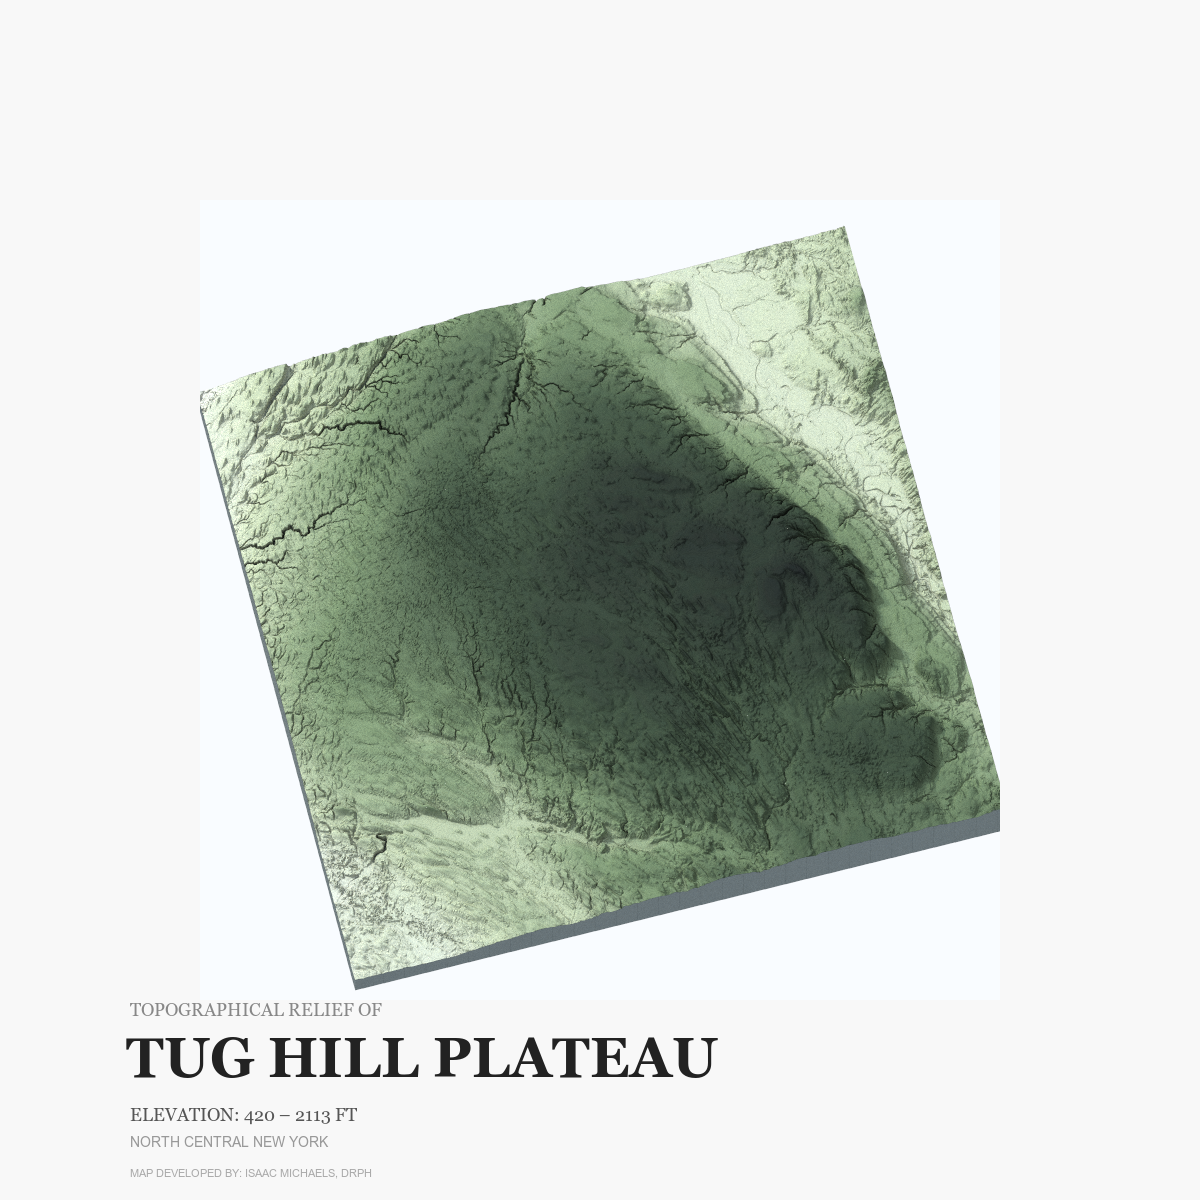
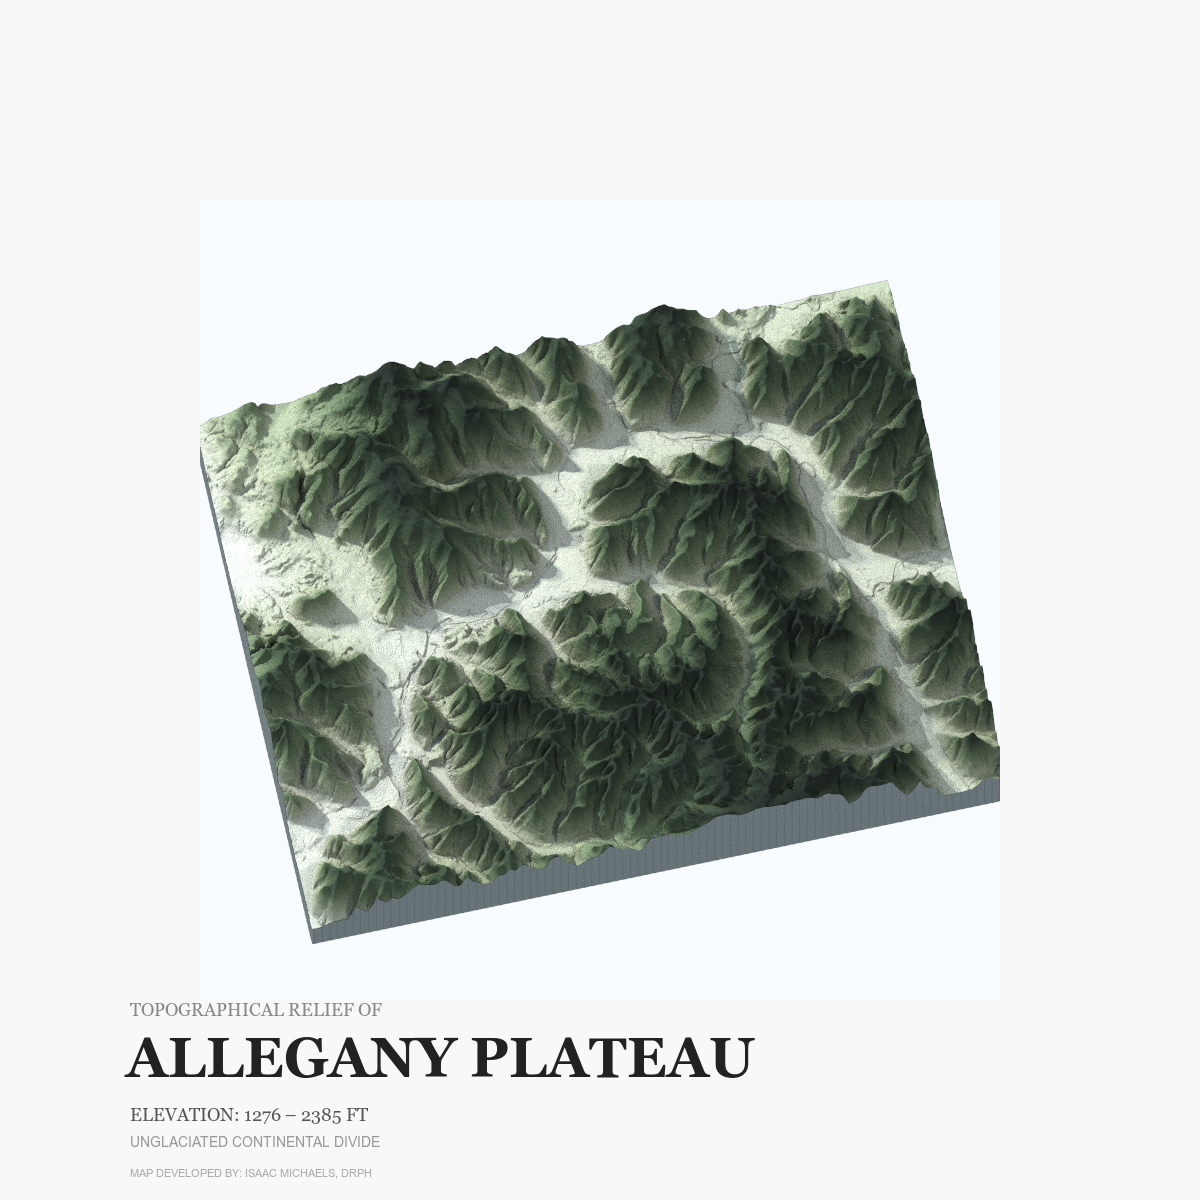
Spatial Features: High-Elevation Ranges, Steep Slopes, Mountain Clusters | Vertical Exaggeration: 1.2x – 1.5x
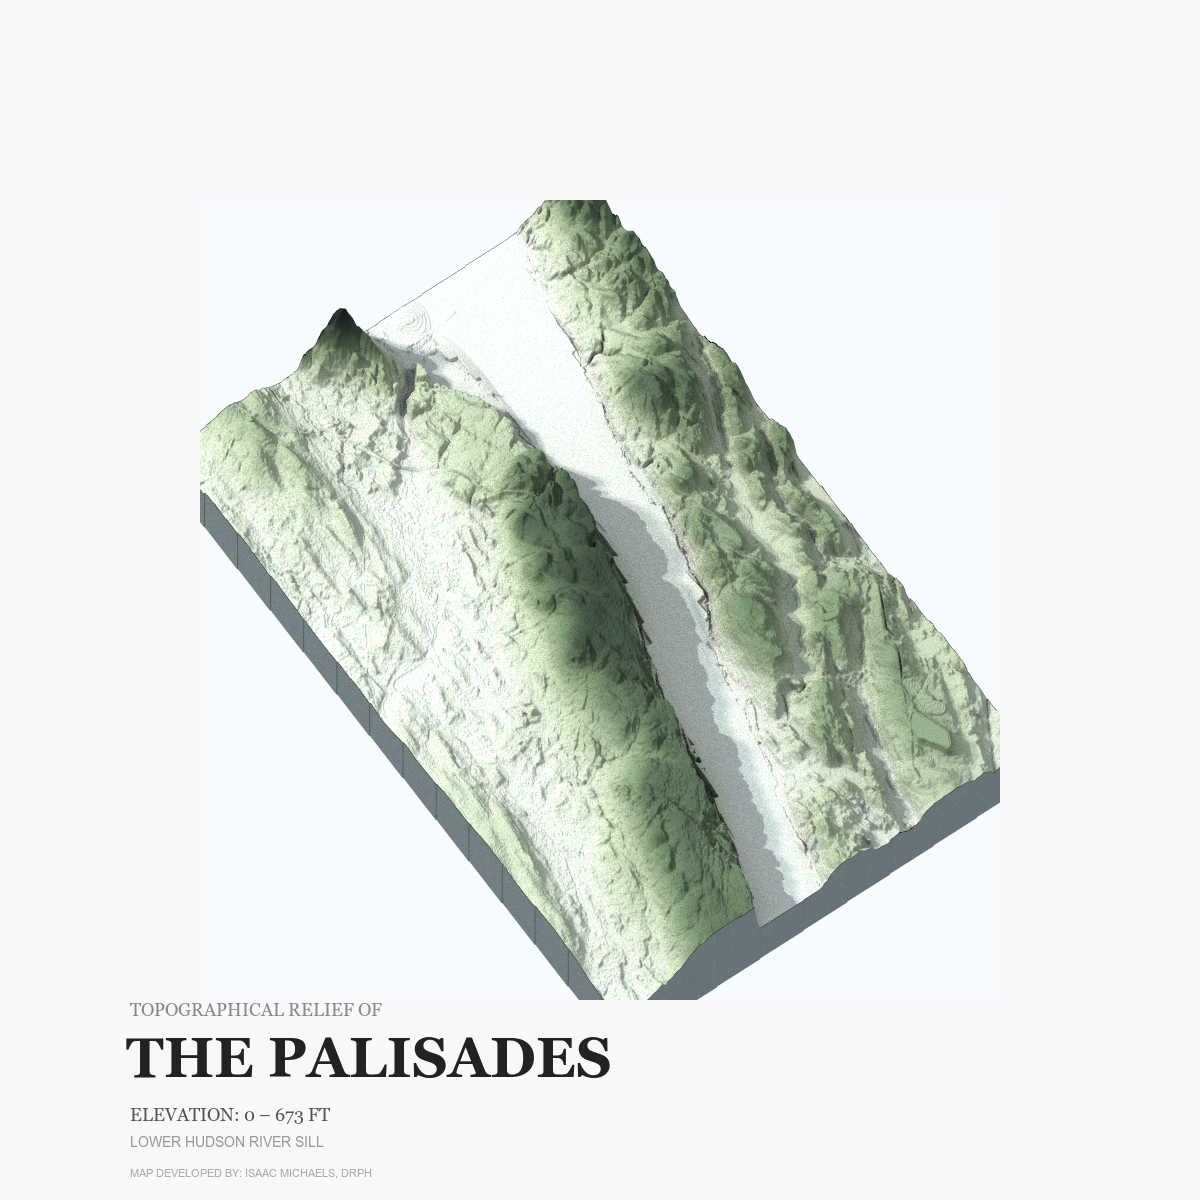
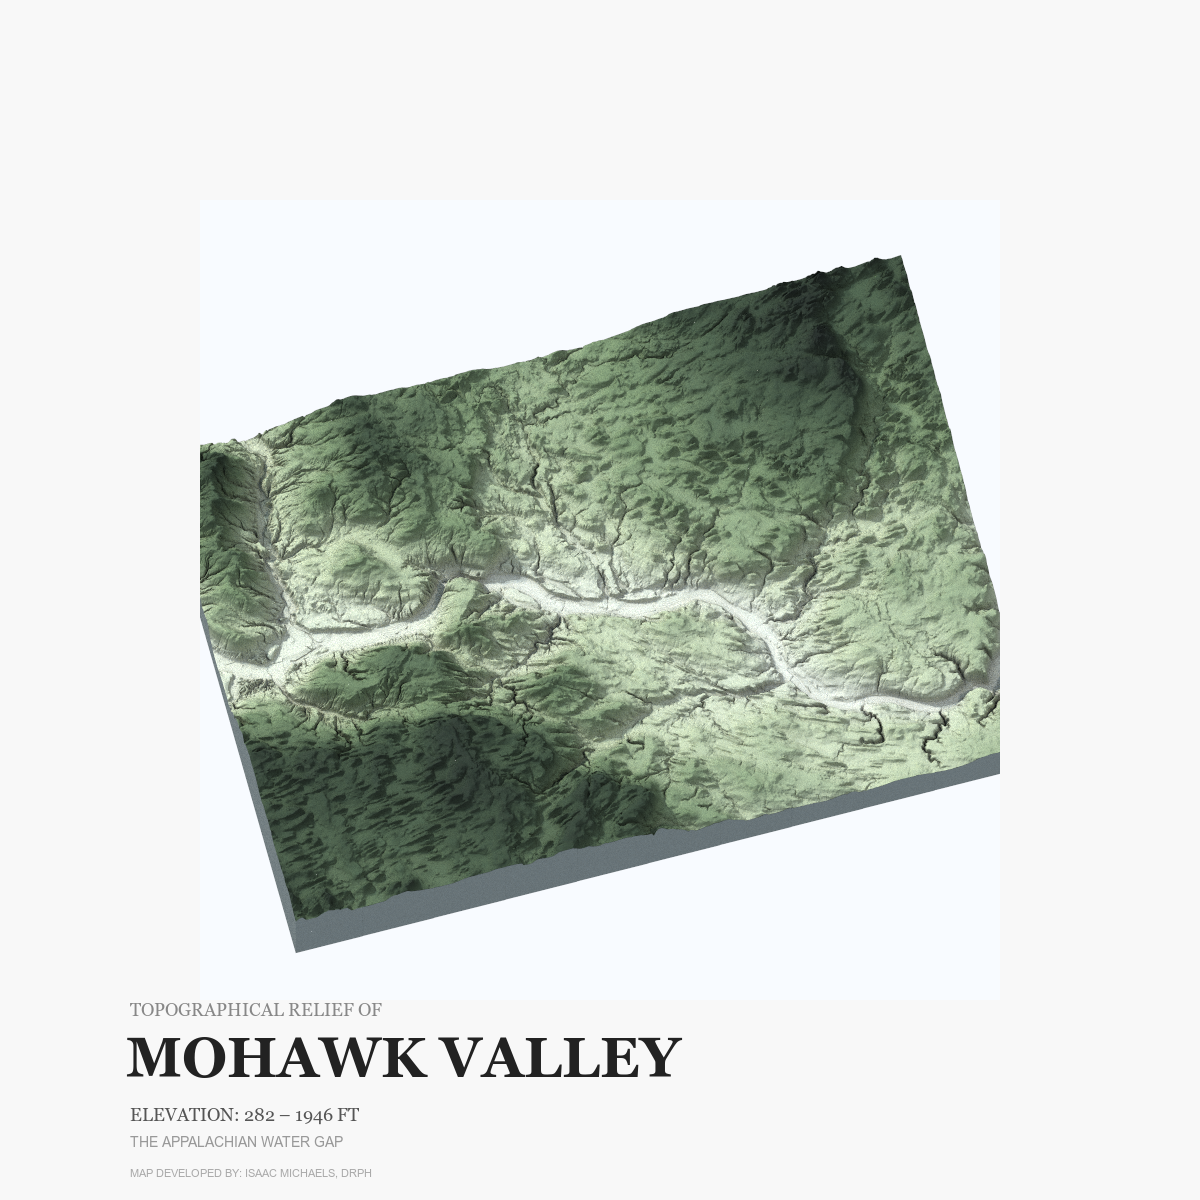
This section highlights the highest terrain in New York State. The Adirondack Park features steep, clustered summits and the state’s highest elevation points. Further south, the Catskills and the Shawangunk Ridge show broad plateaus, valleys, and continuous cliff lines that create large, natural elevation divides.

Glacial Troughs & River Gorges
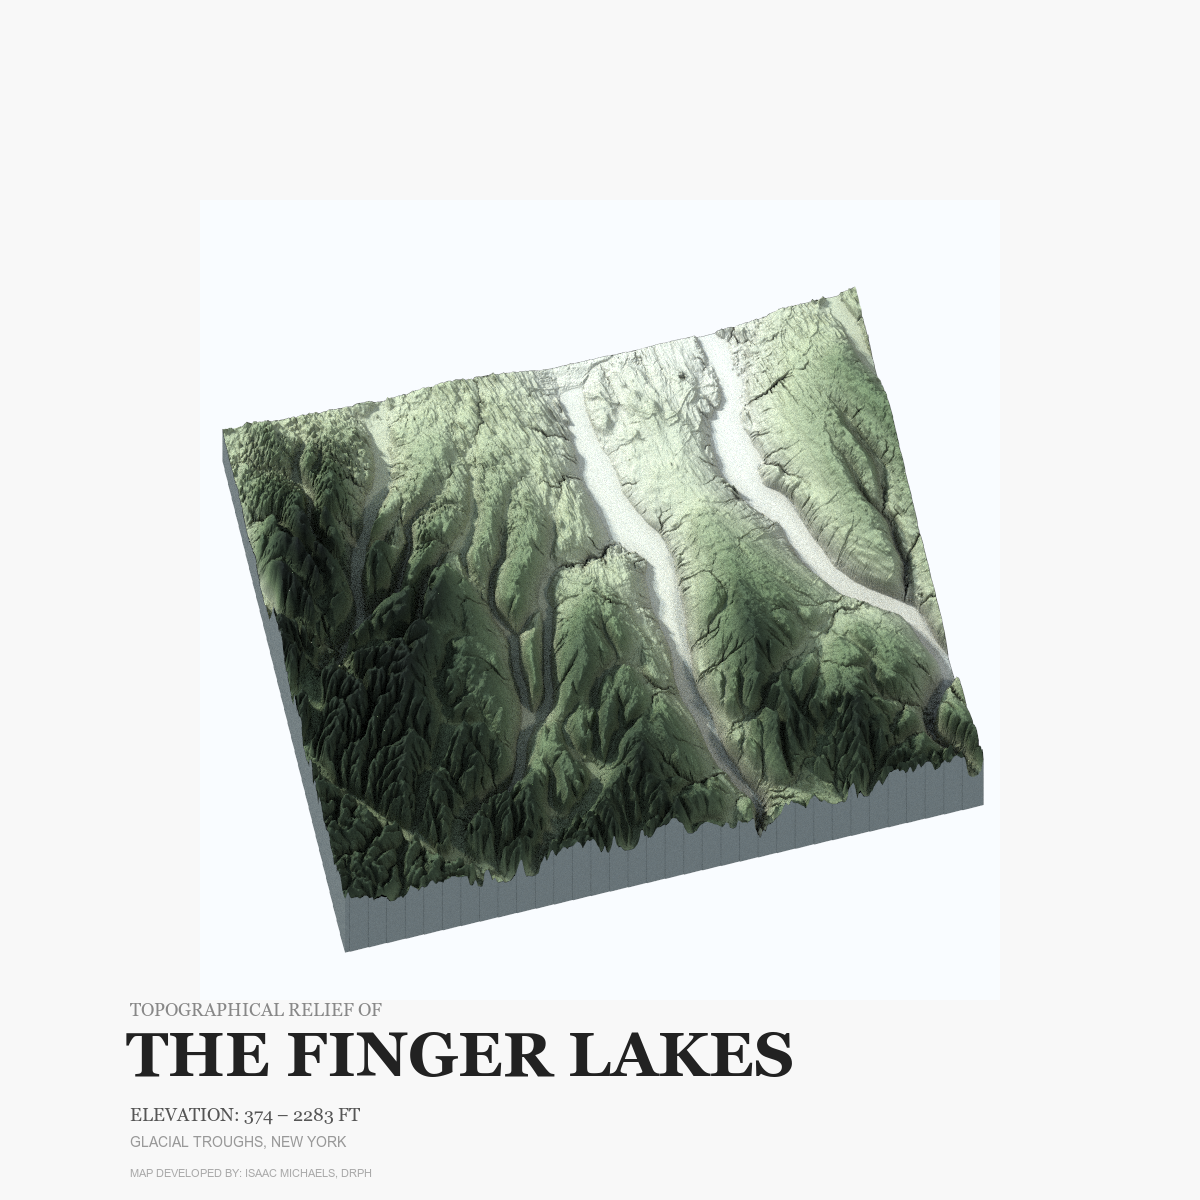
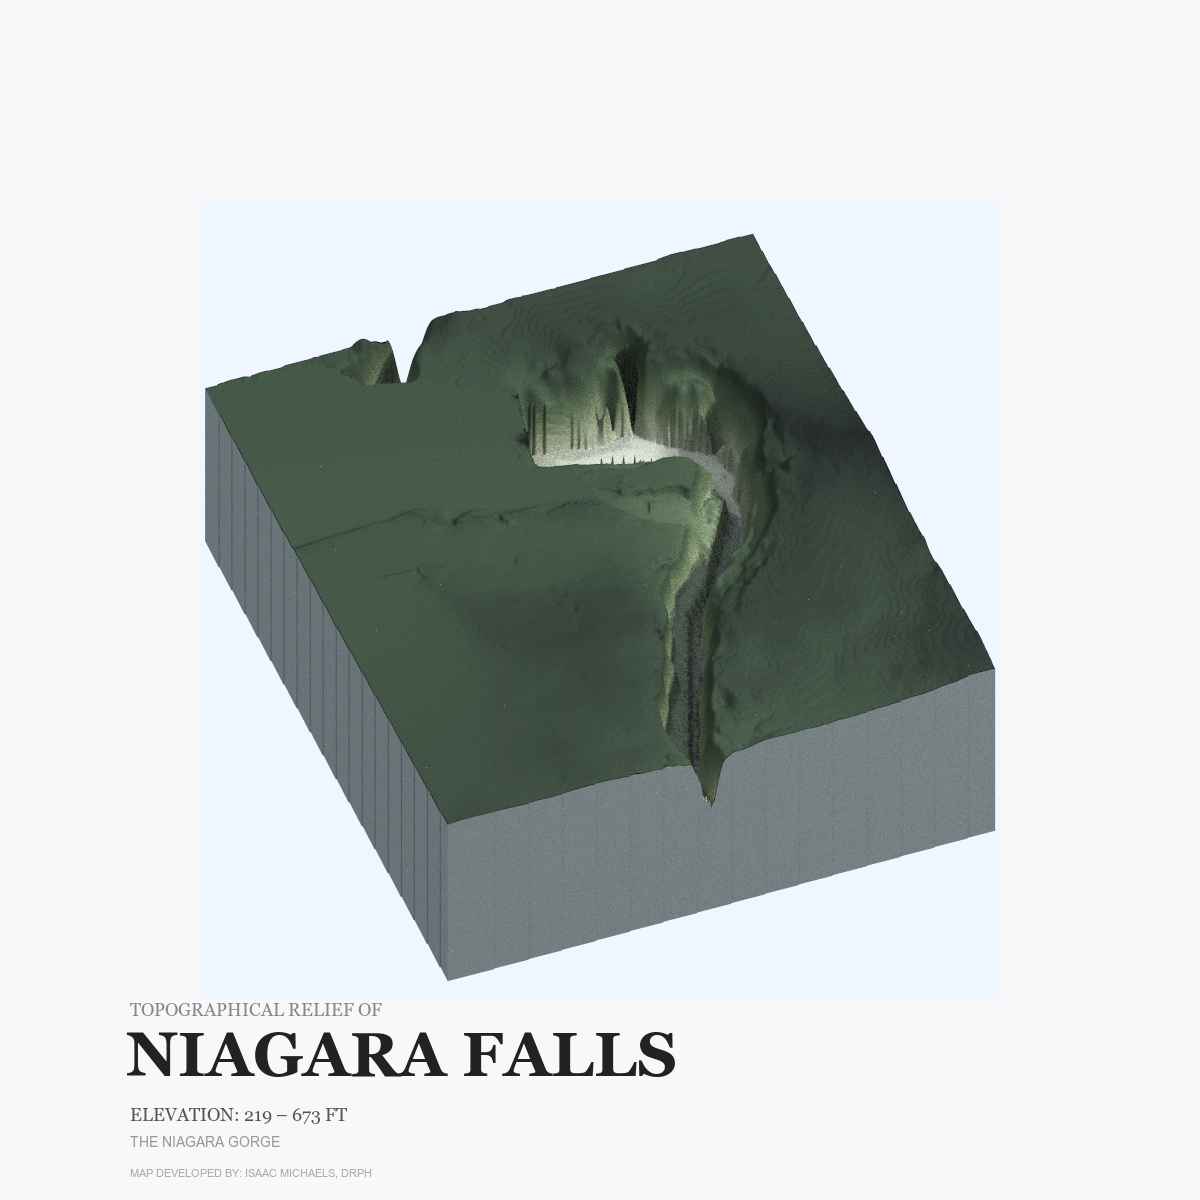
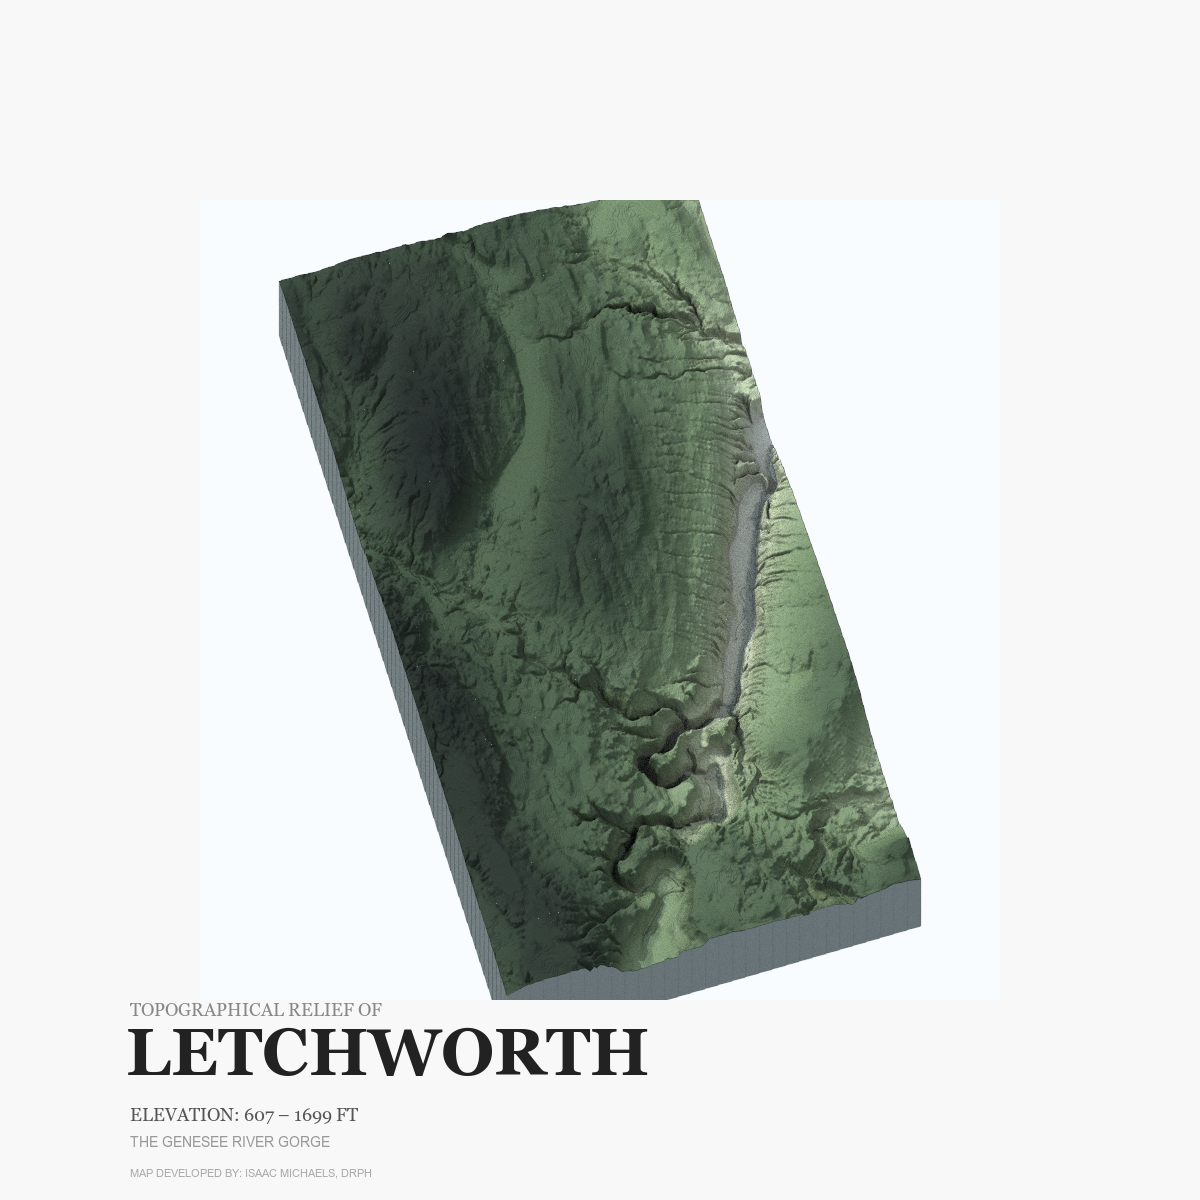
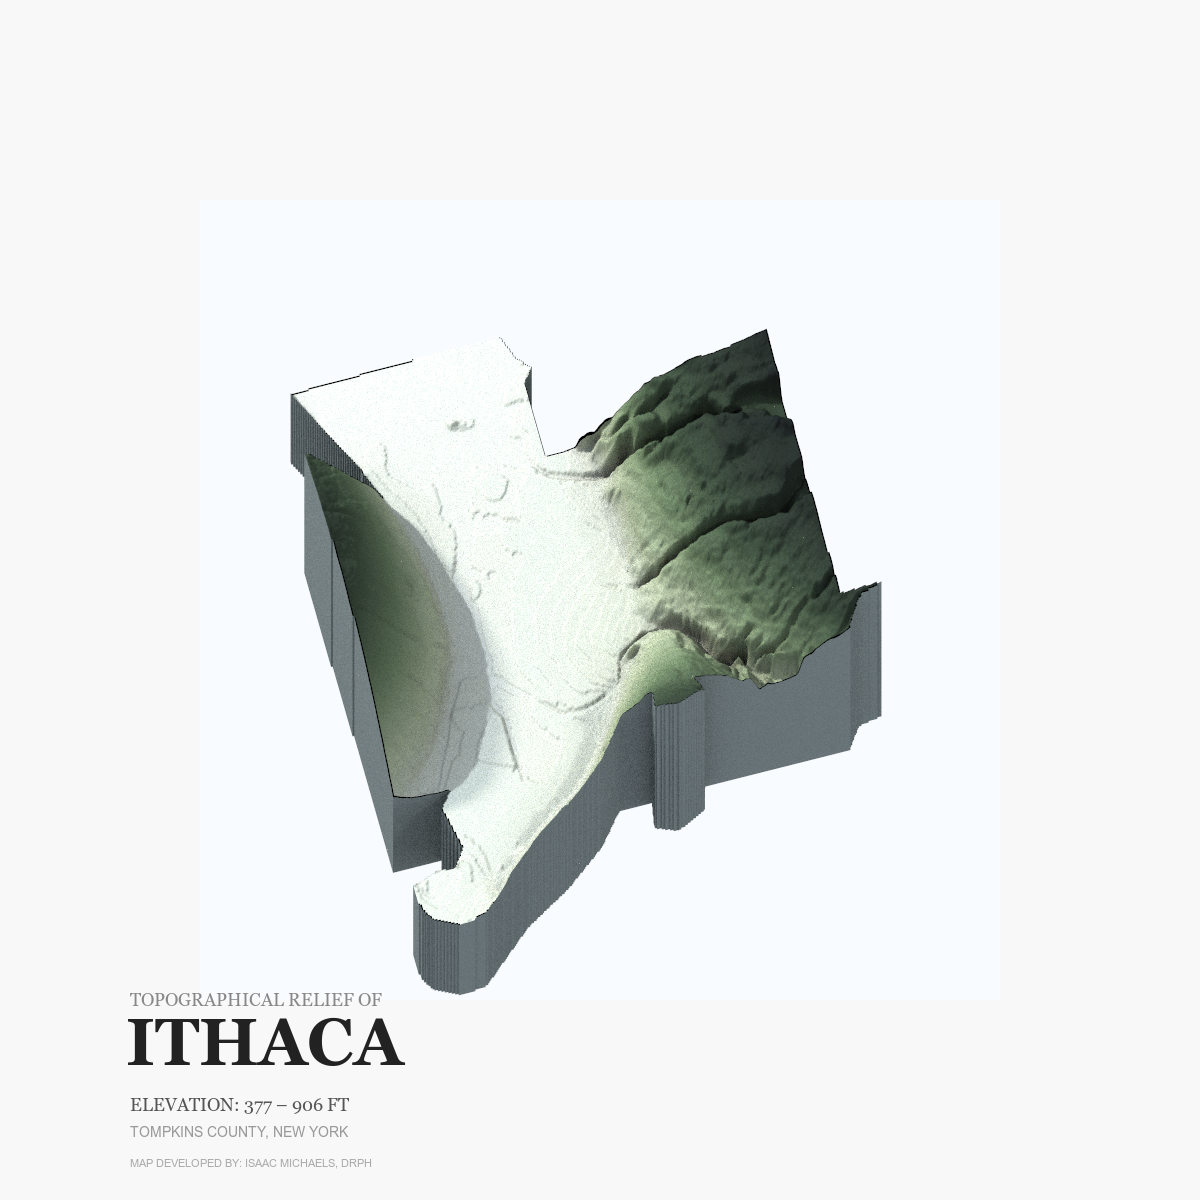
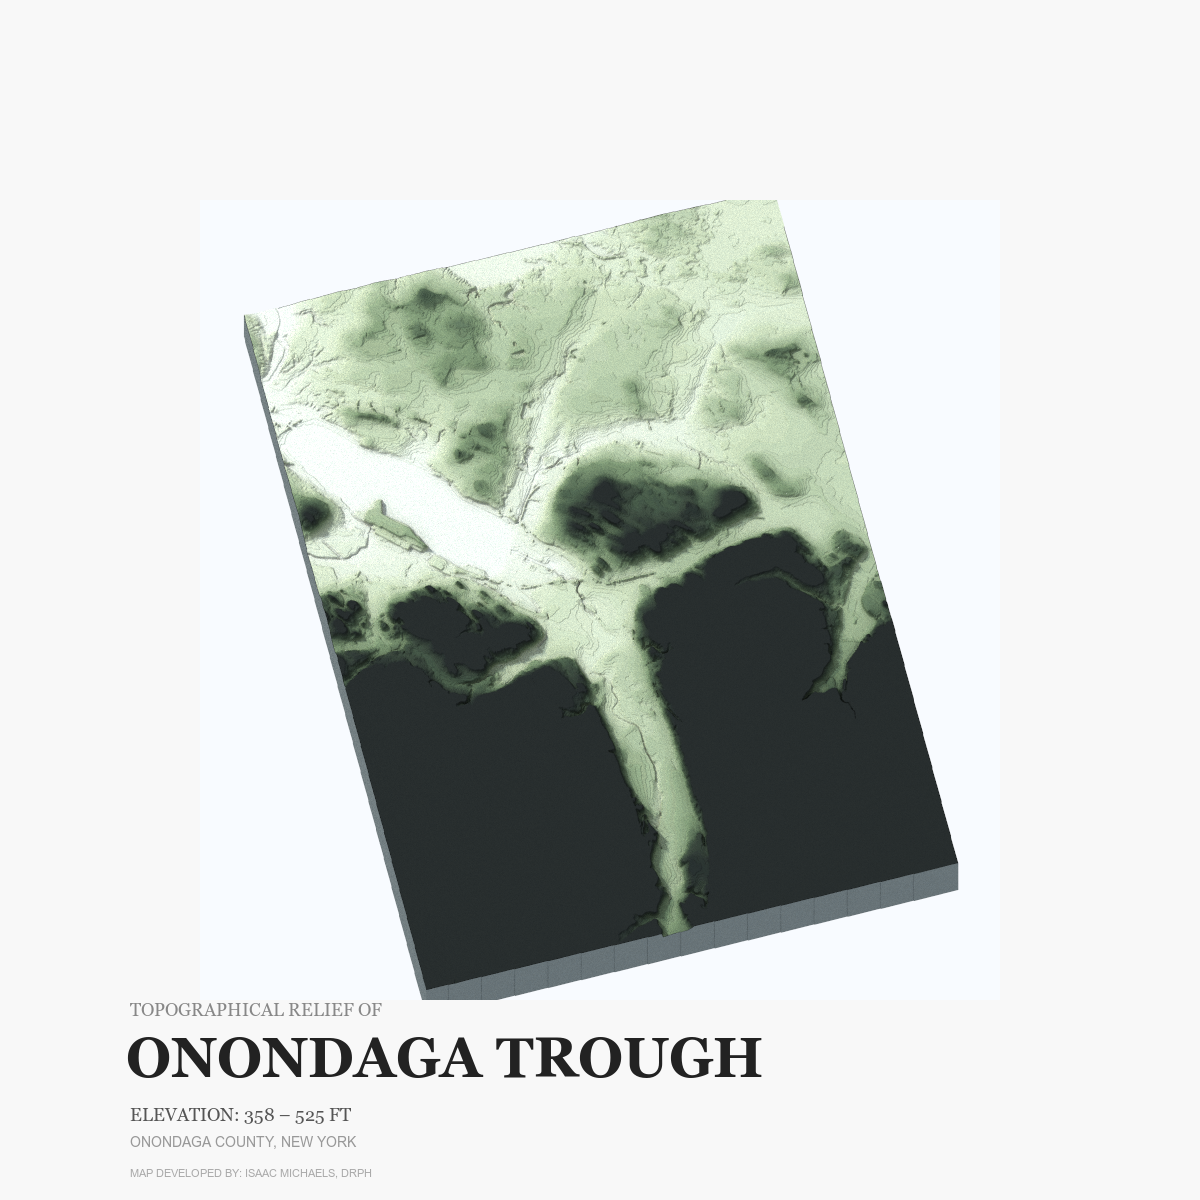
Spatial Features: Parallel Lake Basins, Deep Gorges, Waterfalls | Vertical Exaggeration: 1.0x – 1.5x
These maps show major cuts and depressions in the landscape across Central and Western New York. The Finger Lakes appear as long, parallel basins carved deep below the surrounding hills. Further west, Letchworth State Park and Niagara Falls highlight dramatic, vertical river gorges where water drops rapidly across steep rock walls.

Geological Textures
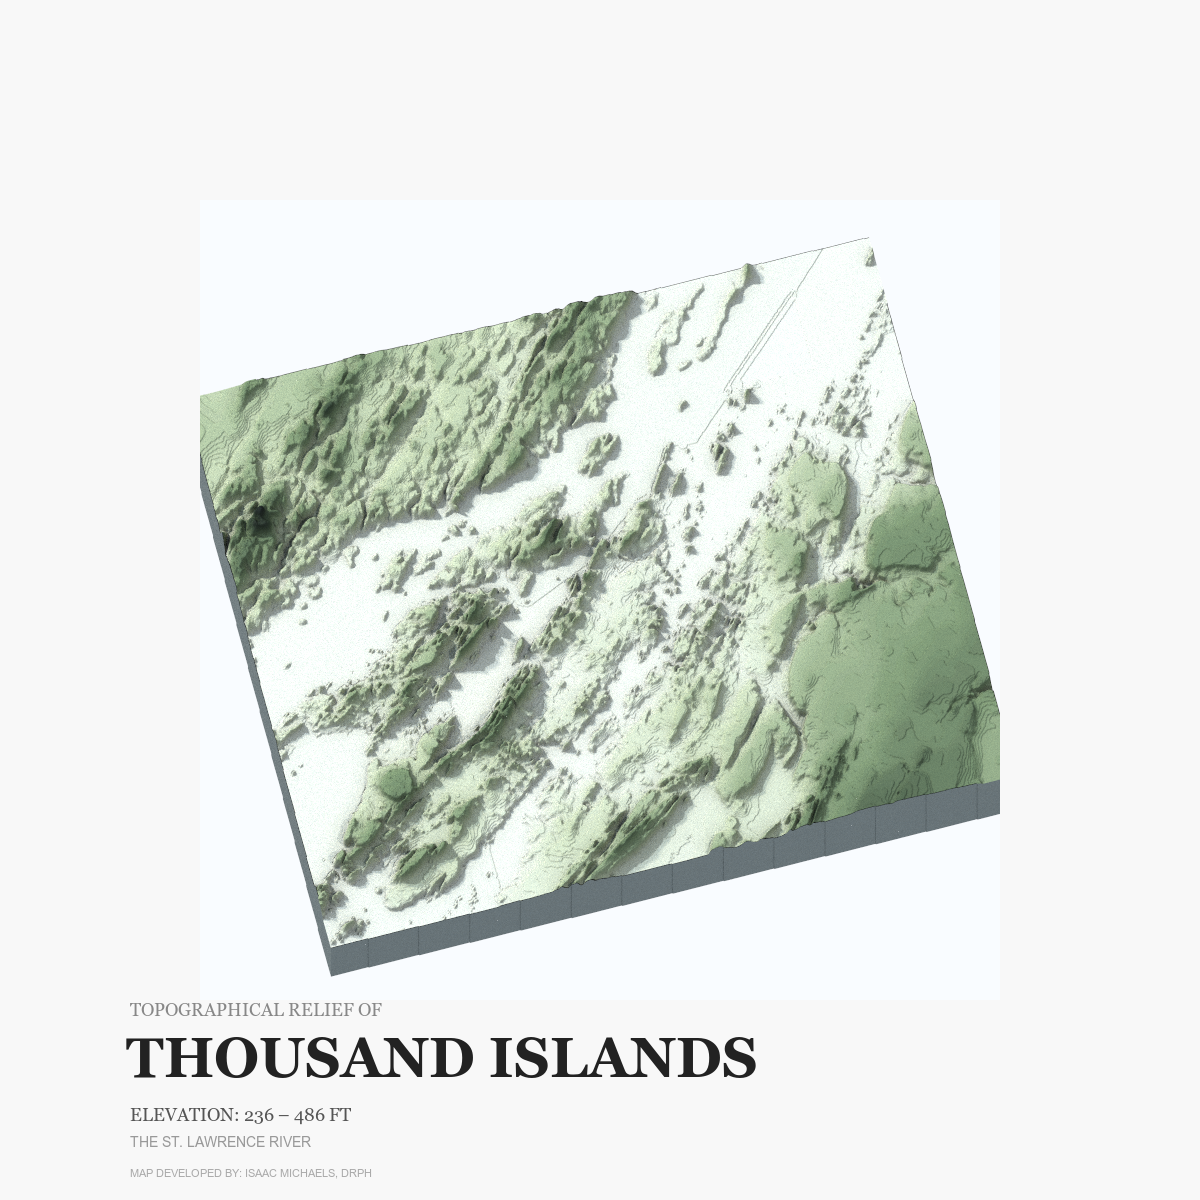
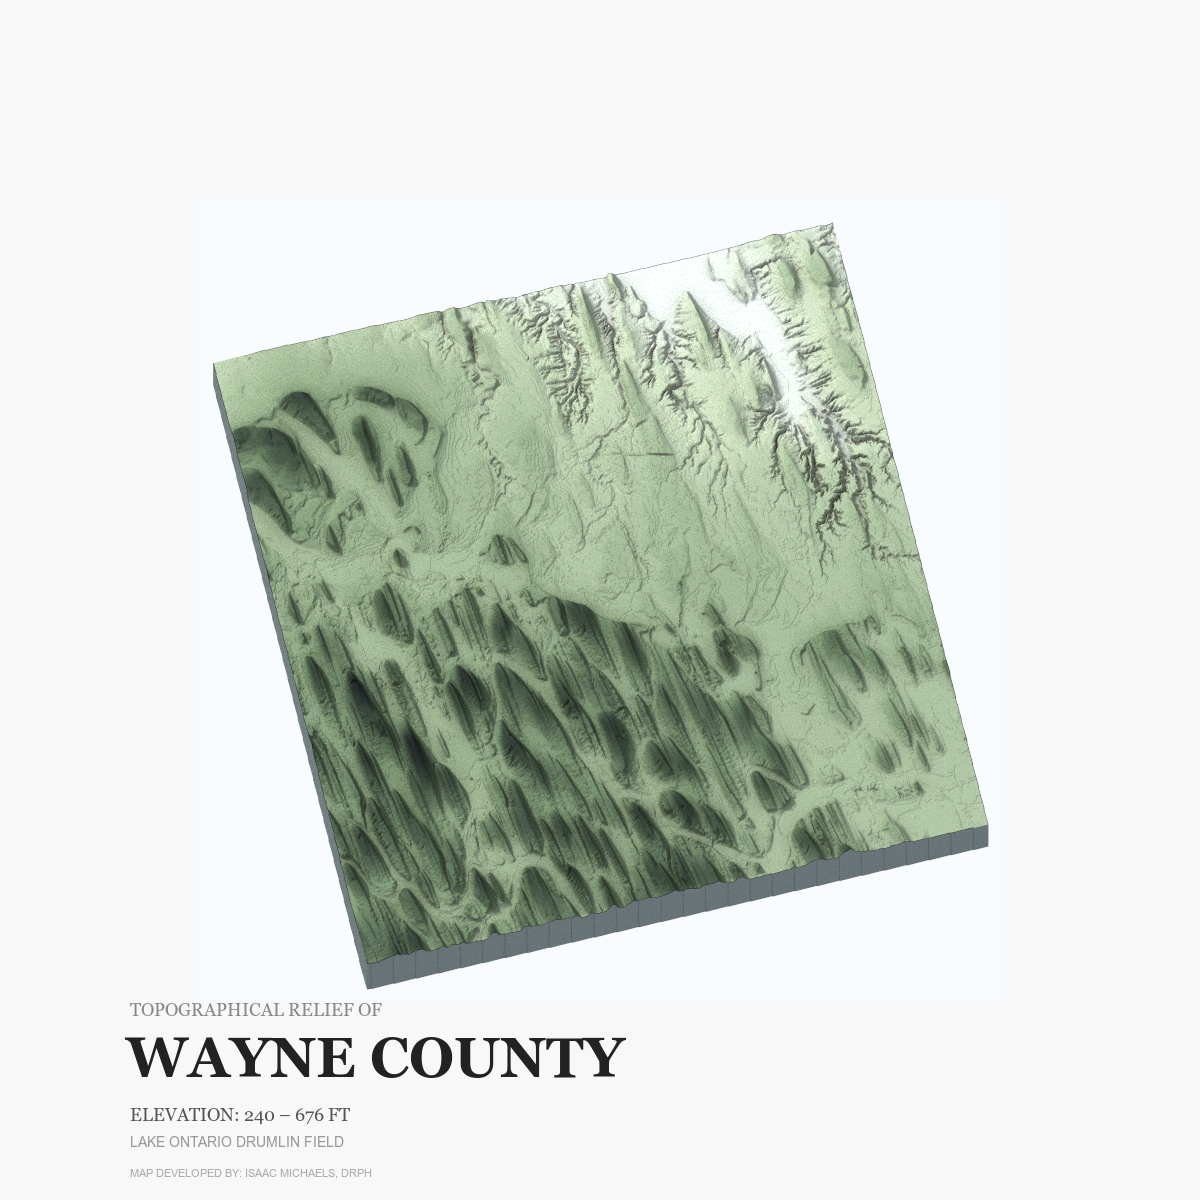
Spatial Features: Island Clusters, Uniform Hill Formations, Dendritic Dissection | Vertical Exaggeration: 1.0x – 1.5x
This series focuses on repeating topographic patterns across specific regions. The Thousand Islands show a fragmented landscape of hundreds of rocky islands scattered across the St. Lawrence River. In Wayne County, the terrain is covered by dense clusters of smooth, teardrop-shaped hills (drumlins) that all point in the same direction.
The Capital District
Spatial Features: Municipal Borders, River Valleys, Urban Elevation | Vertical Exaggeration: 1.0x – 1.2x
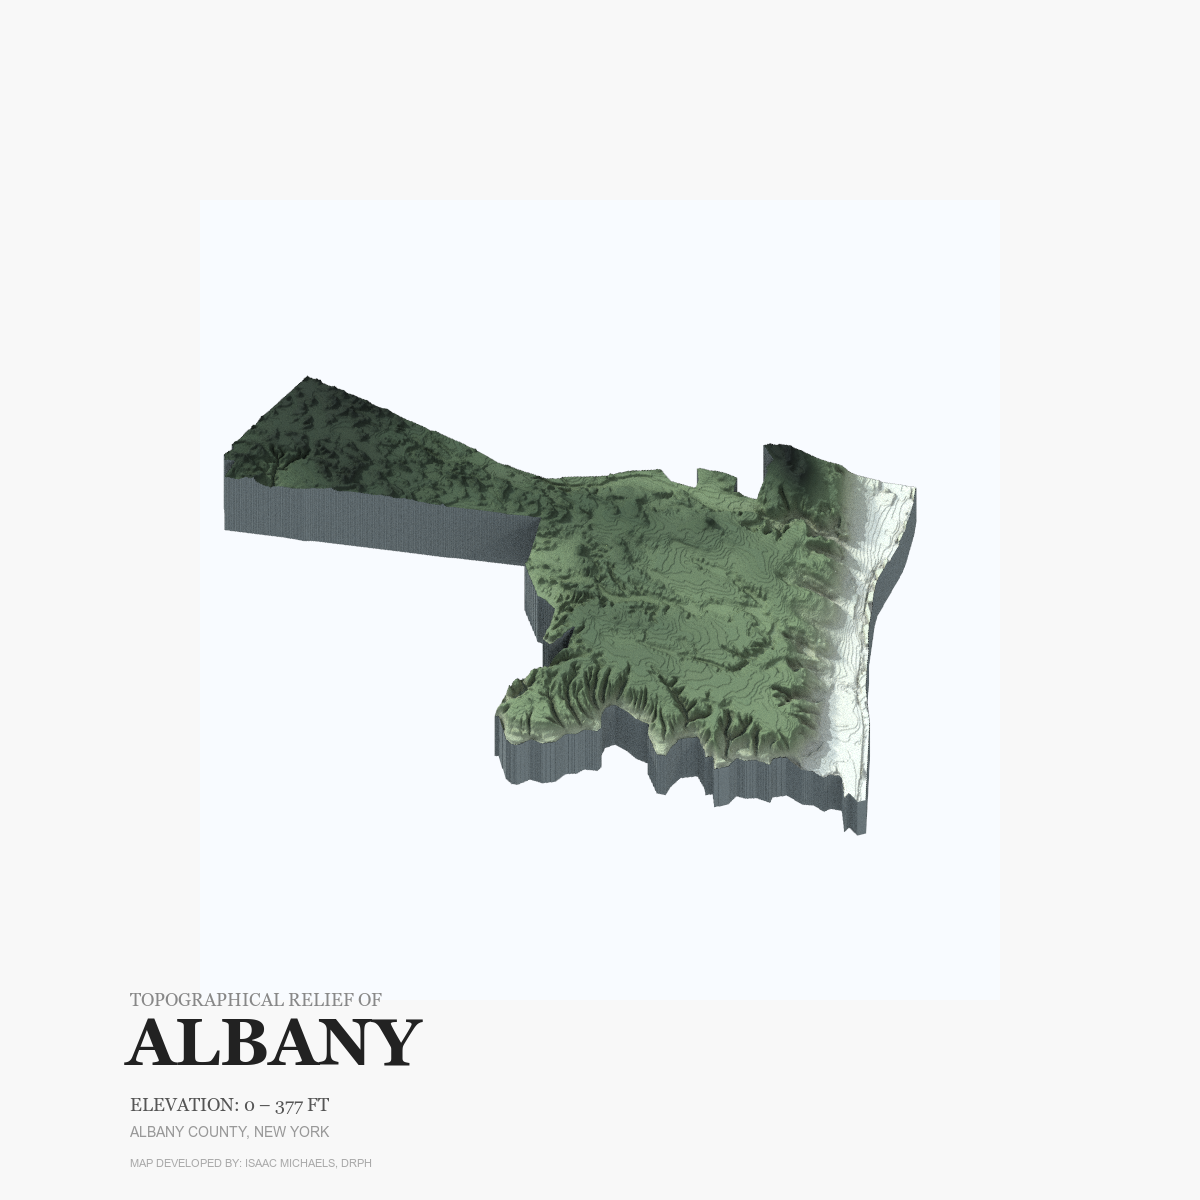
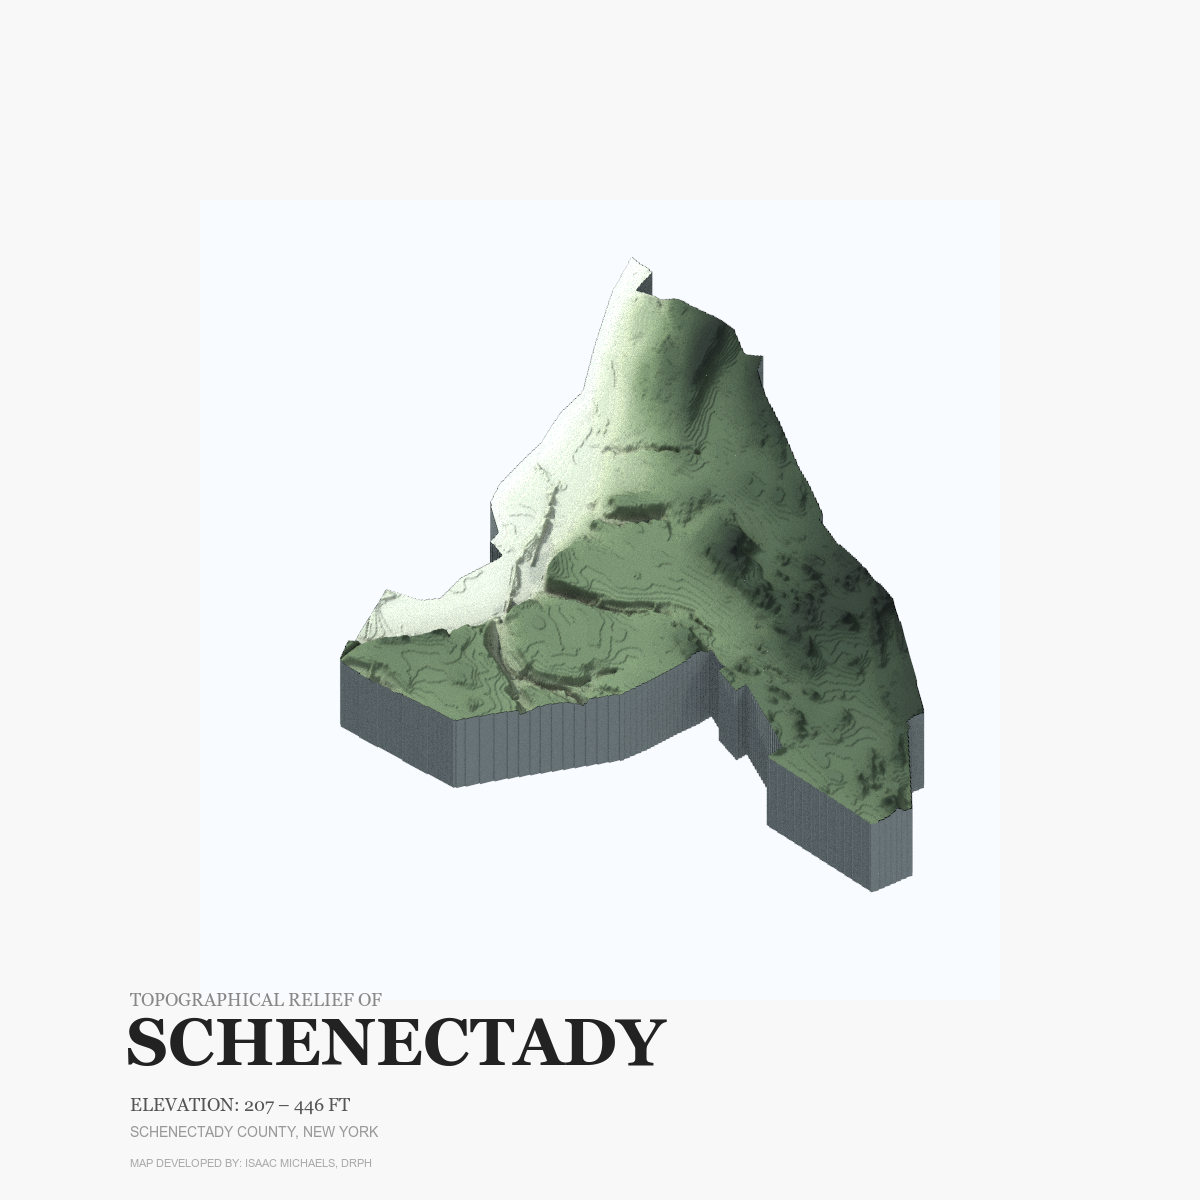
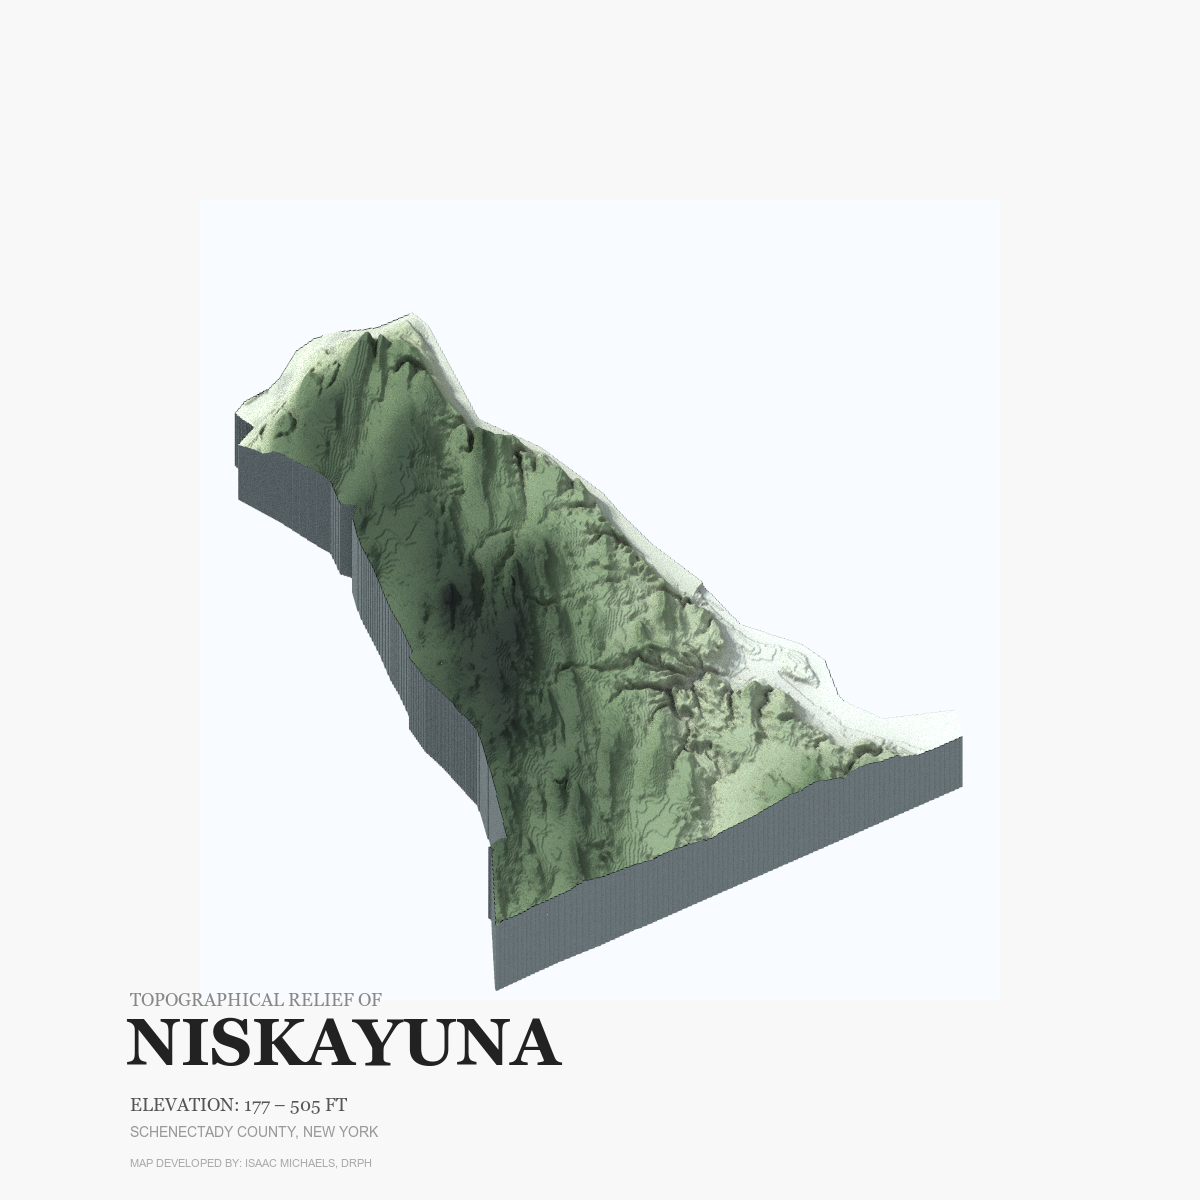
These plates use exact municipal boundaries to isolate the terrain of Albany, Schenectady, and Niskayuna. Bounding the digital elevation data to city borders shows how local administrative lines align with natural river valleys, high ridges, and waterfront areas.