Baseball Bivariate Analyses

June 10, 2021
Sabermetrics baseball sports


Published: August 3, 2020
Updated: June 10, 2021 at 07:04PM


On-Base Plus Slugging Percentage


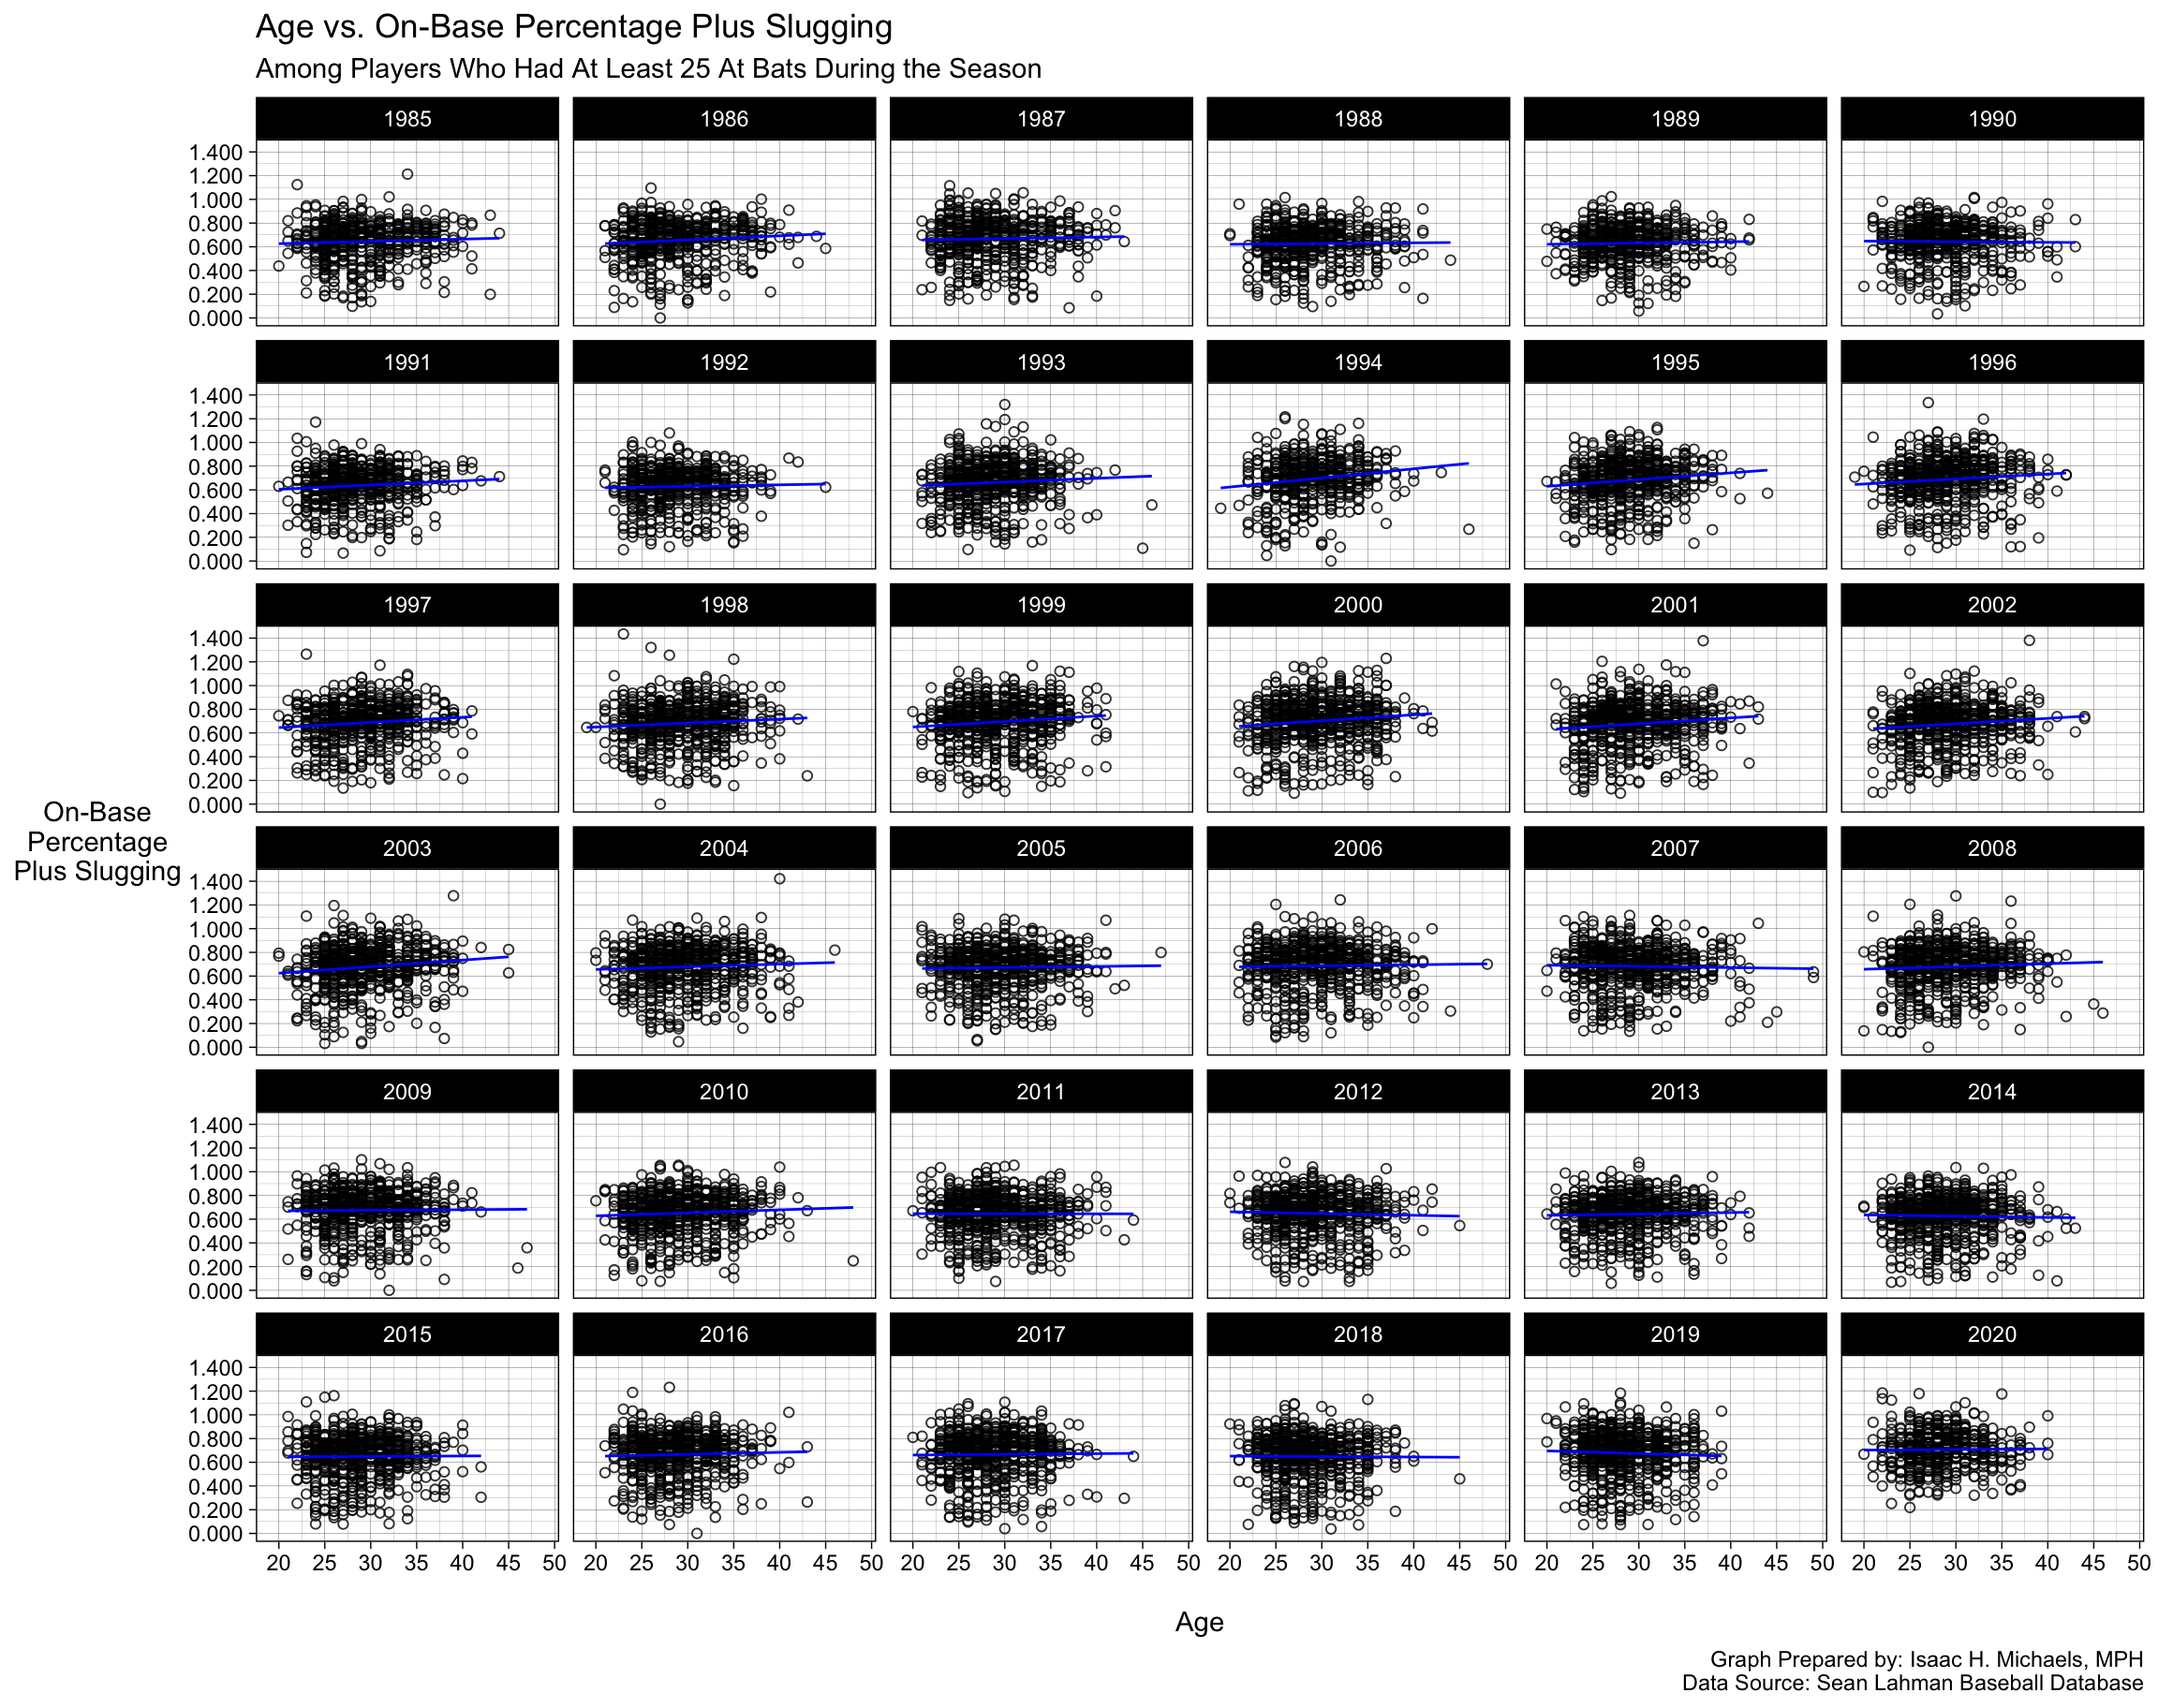
Age vs. OPS


Graph Prepared By: Isaac H. Michaels, MPH
Data Source: Sean Lahman Baseball Database


Back to top


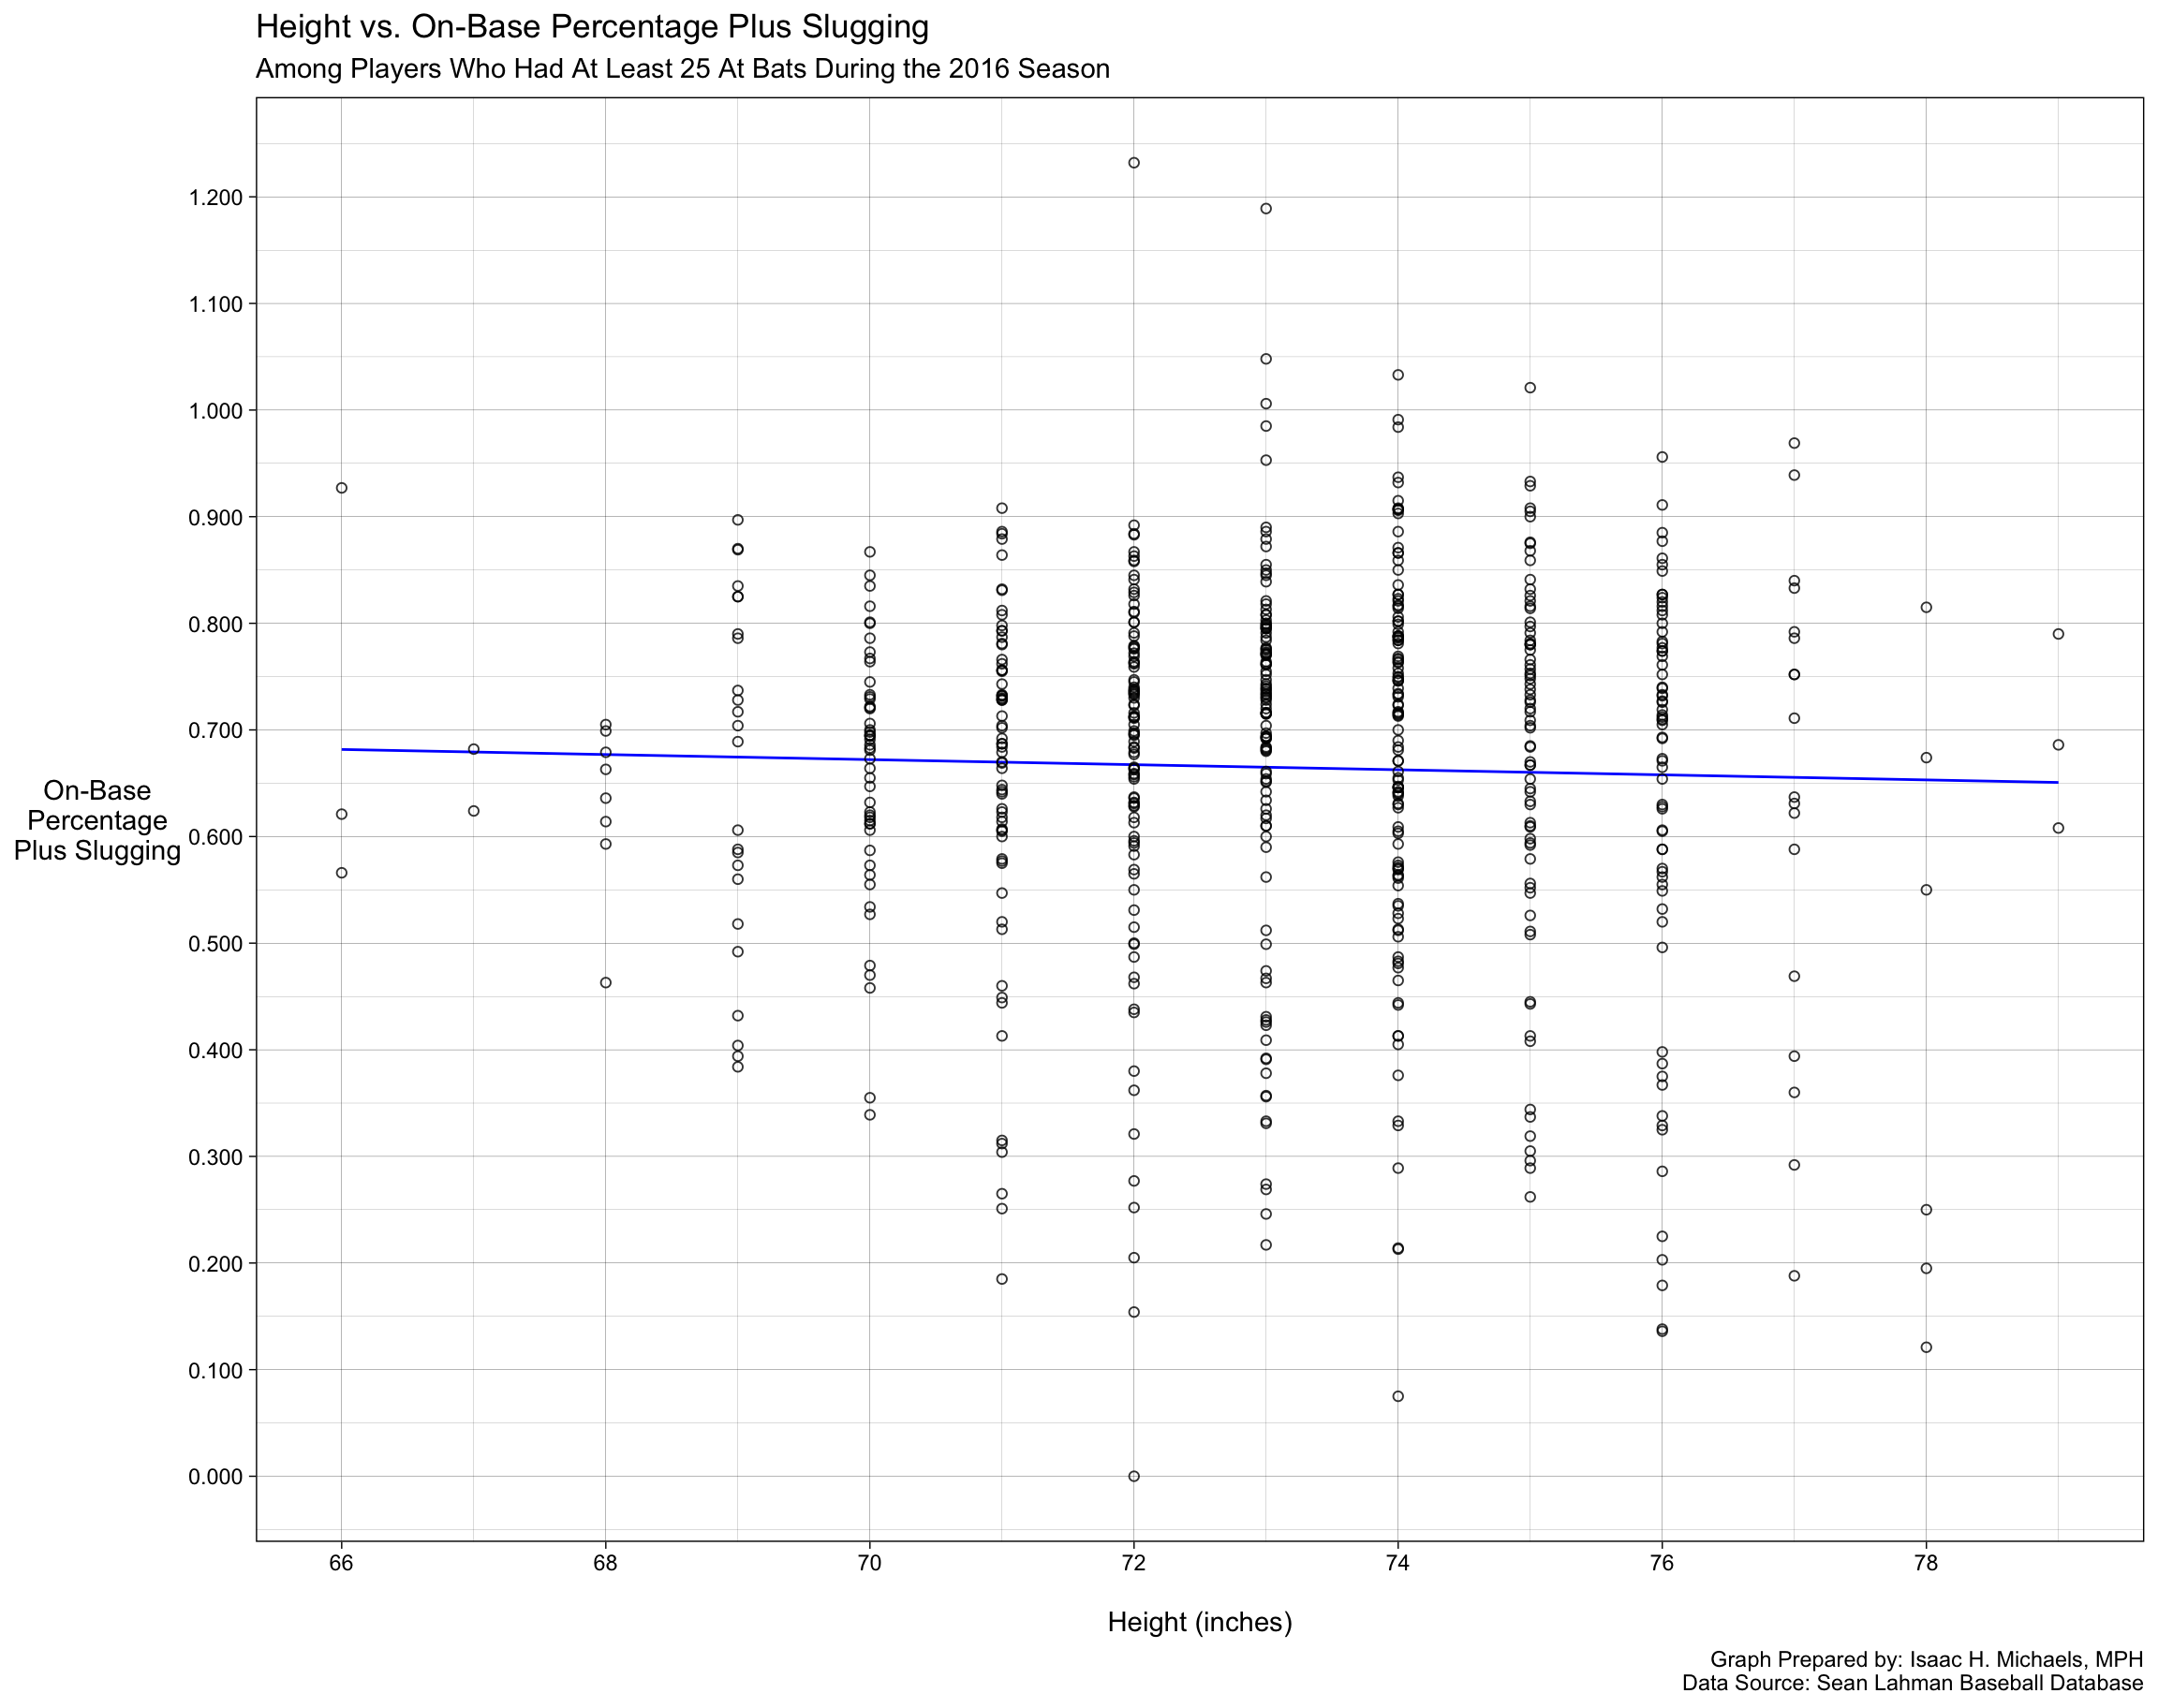
Height vs. OPS


Graph Prepared By: Isaac H. Michaels, MPH
Data Source: Sean Lahman Baseball Database


Back to top


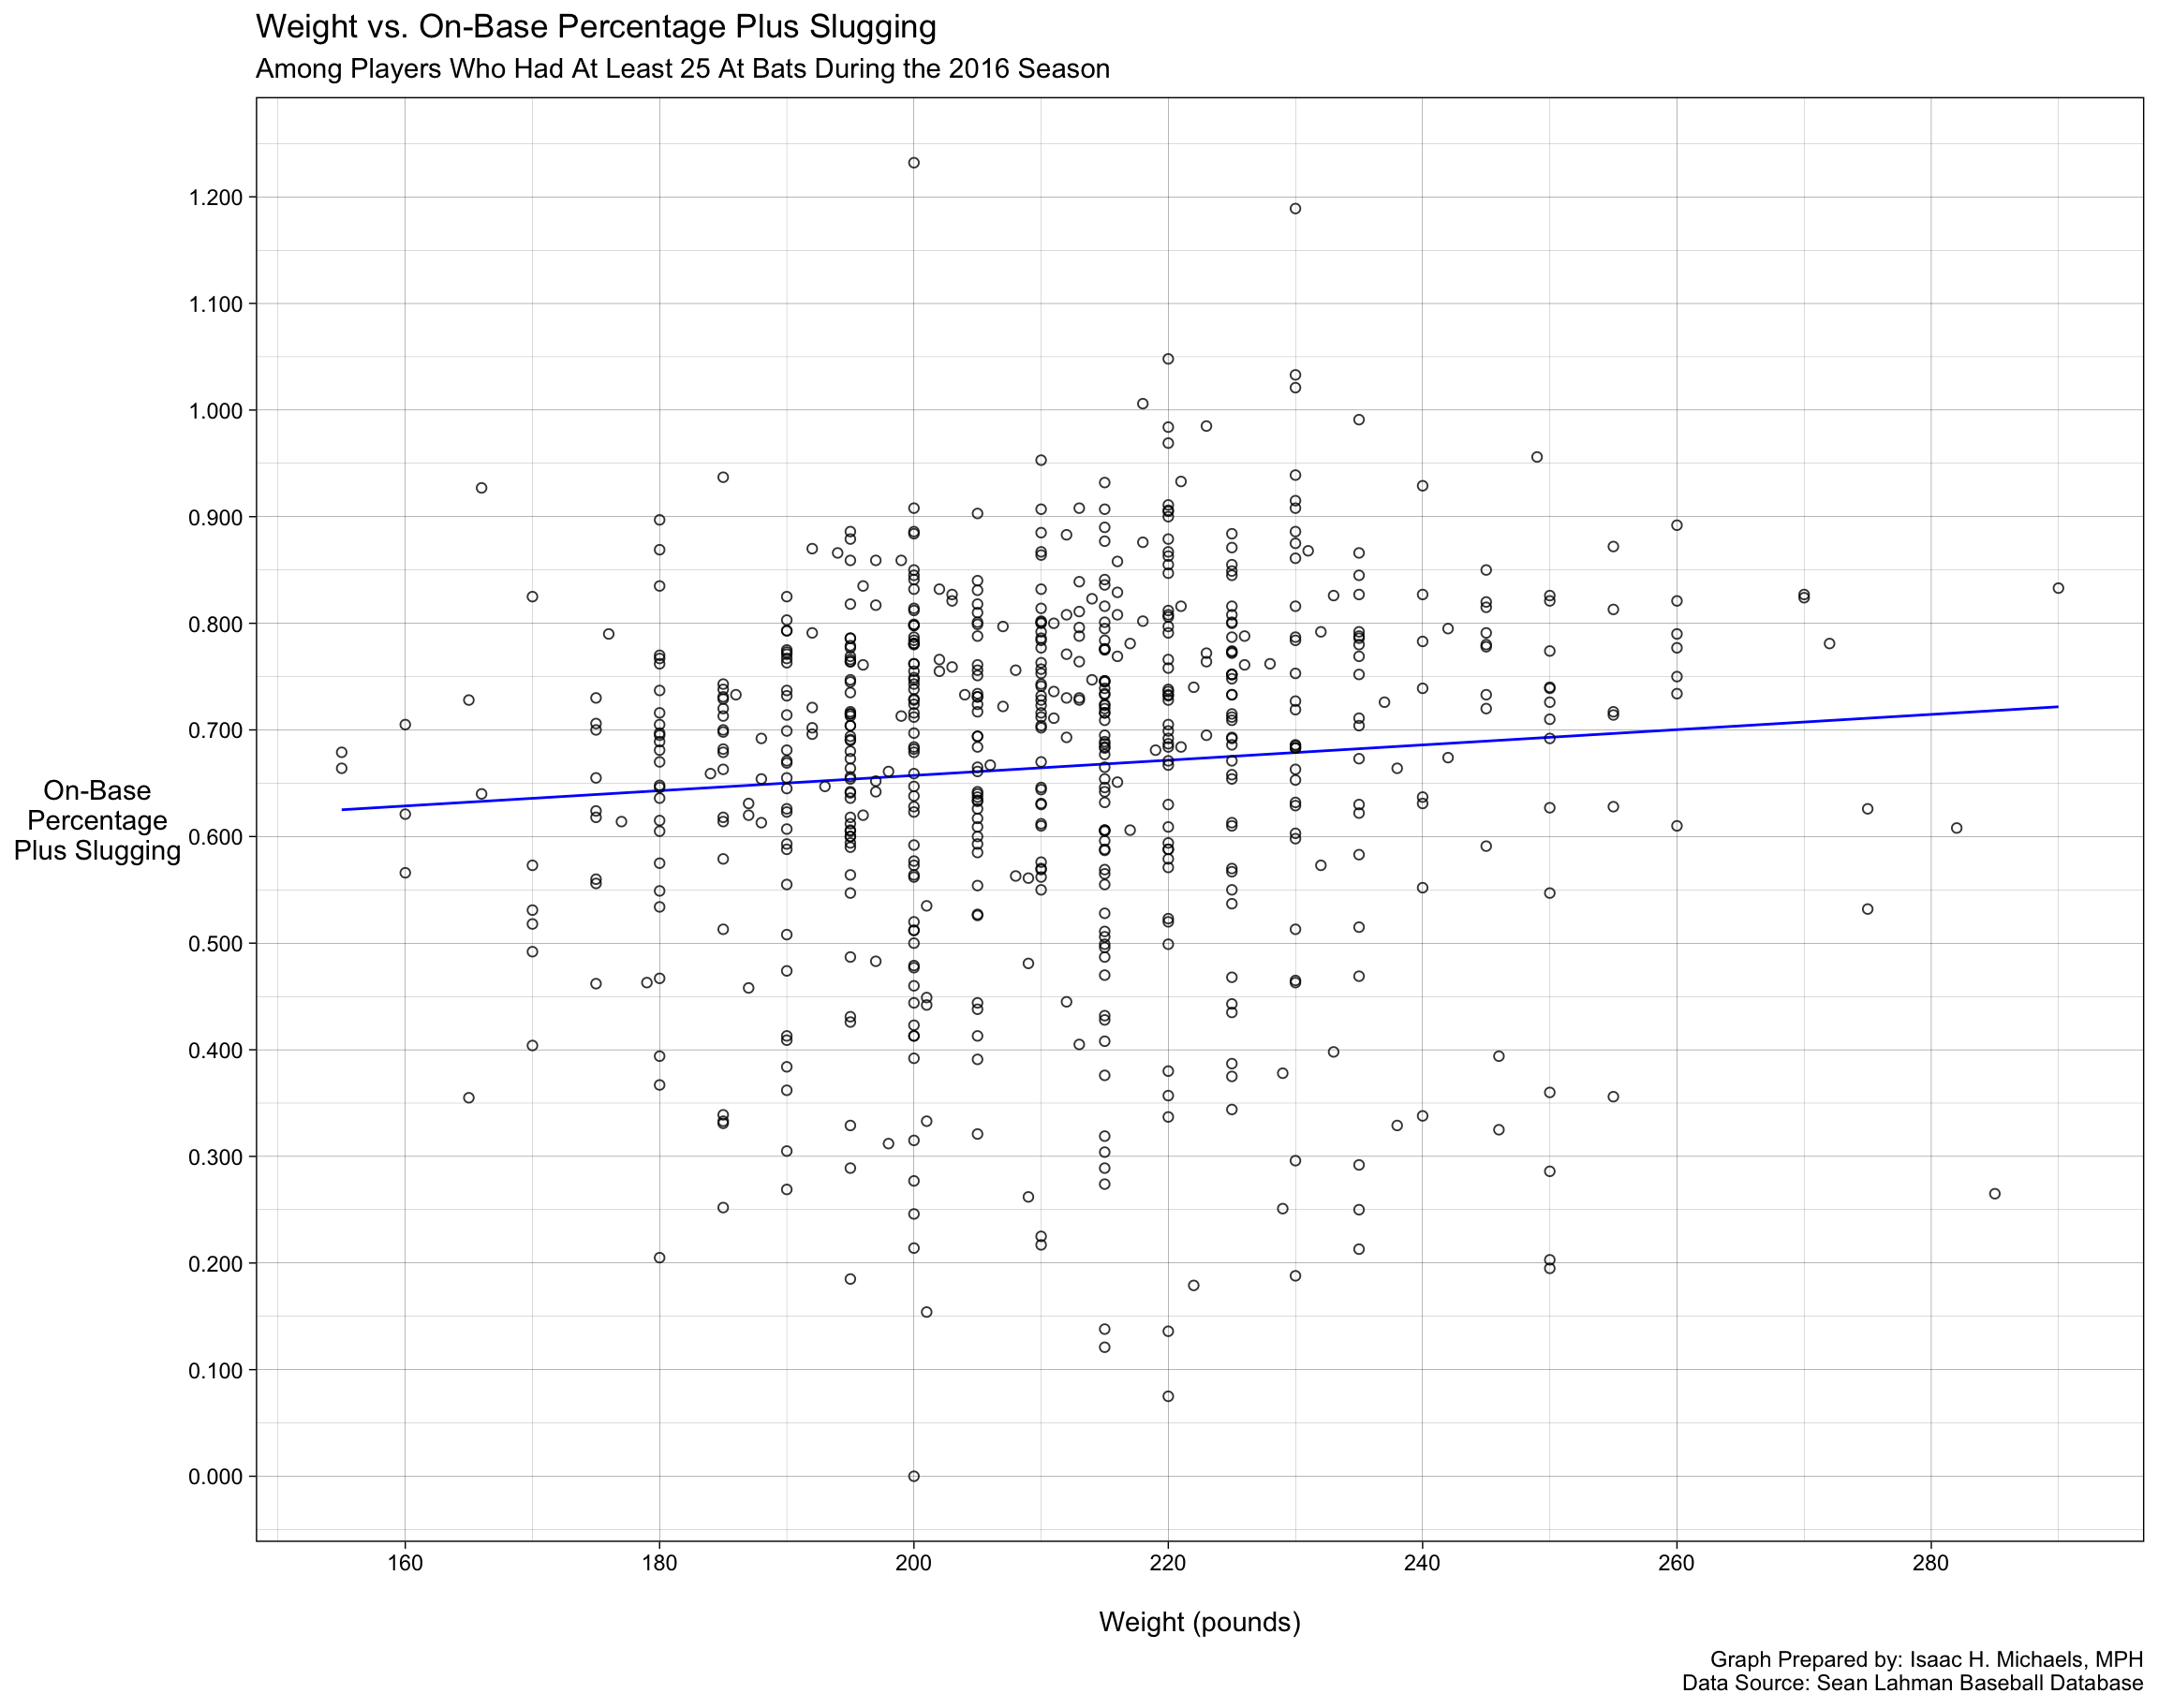
Weight vs. OPS


Graph Prepared By: Isaac H. Michaels, MPH
Data Source: Sean Lahman Baseball Database


Back to top


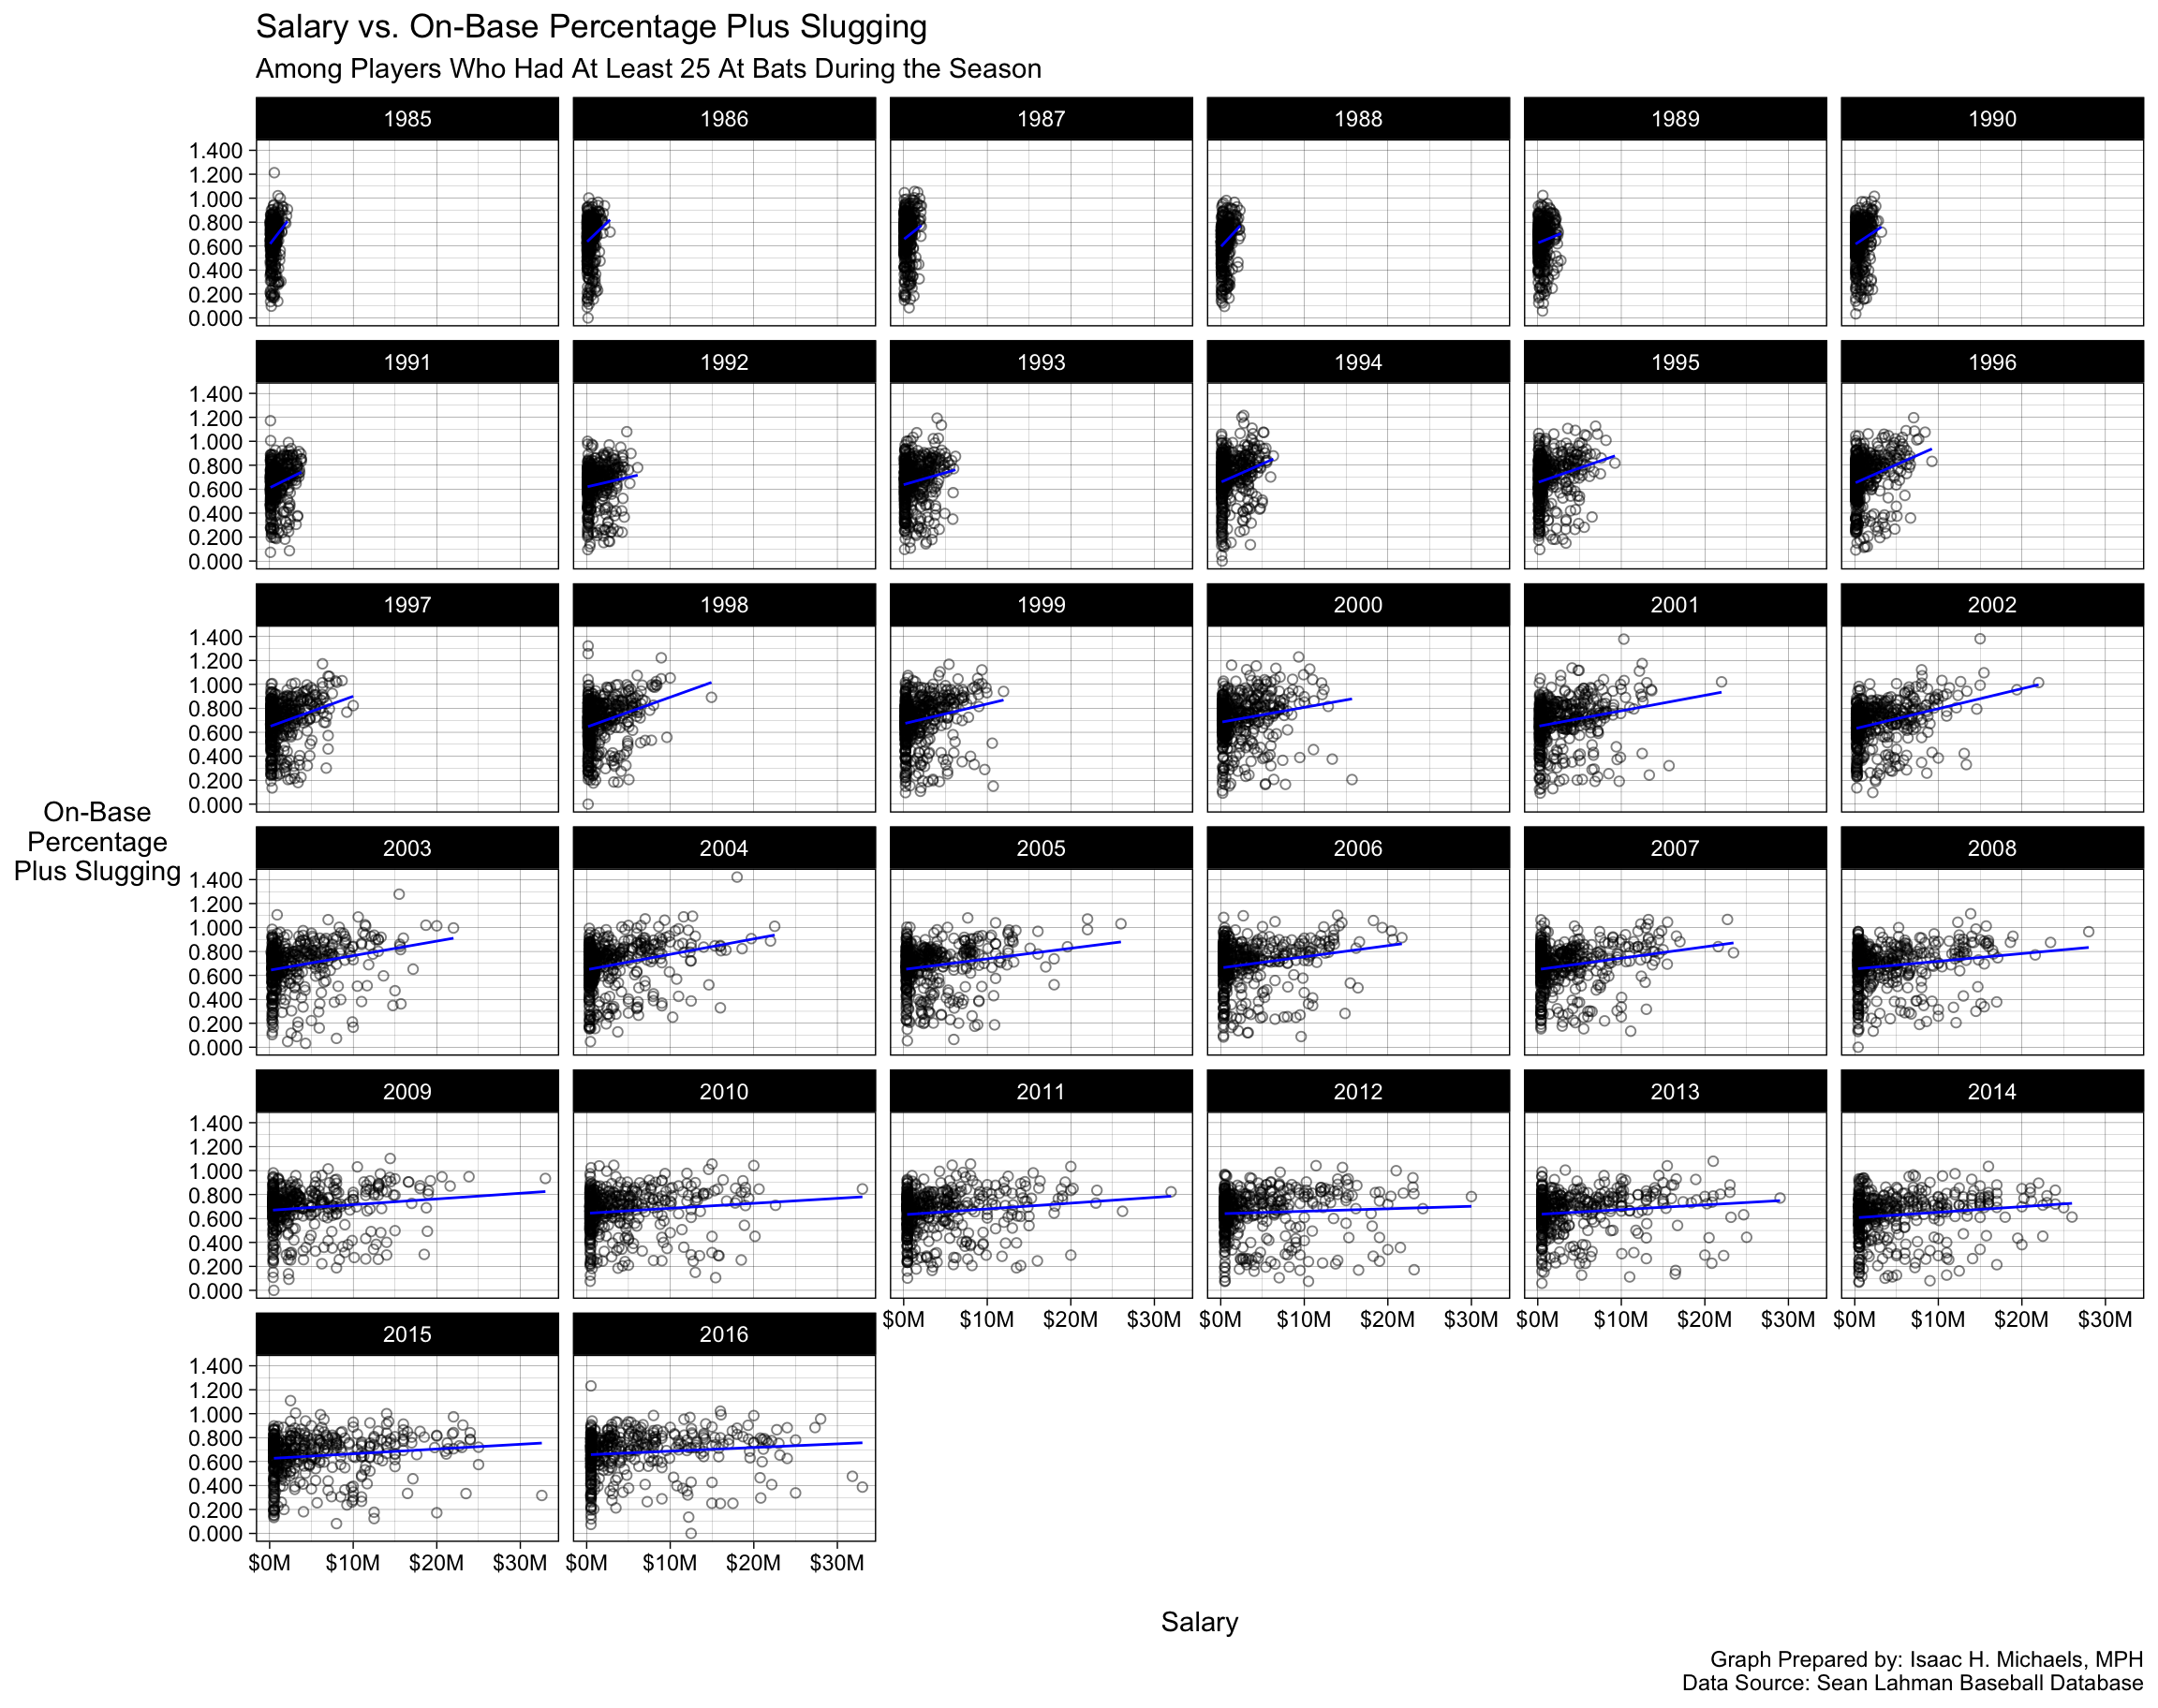
Salary vs. OPS


Graph Prepared By: Isaac H. Michaels, MPH
Data Source: Sean Lahman Baseball Database


Back to top


Earned Run Average


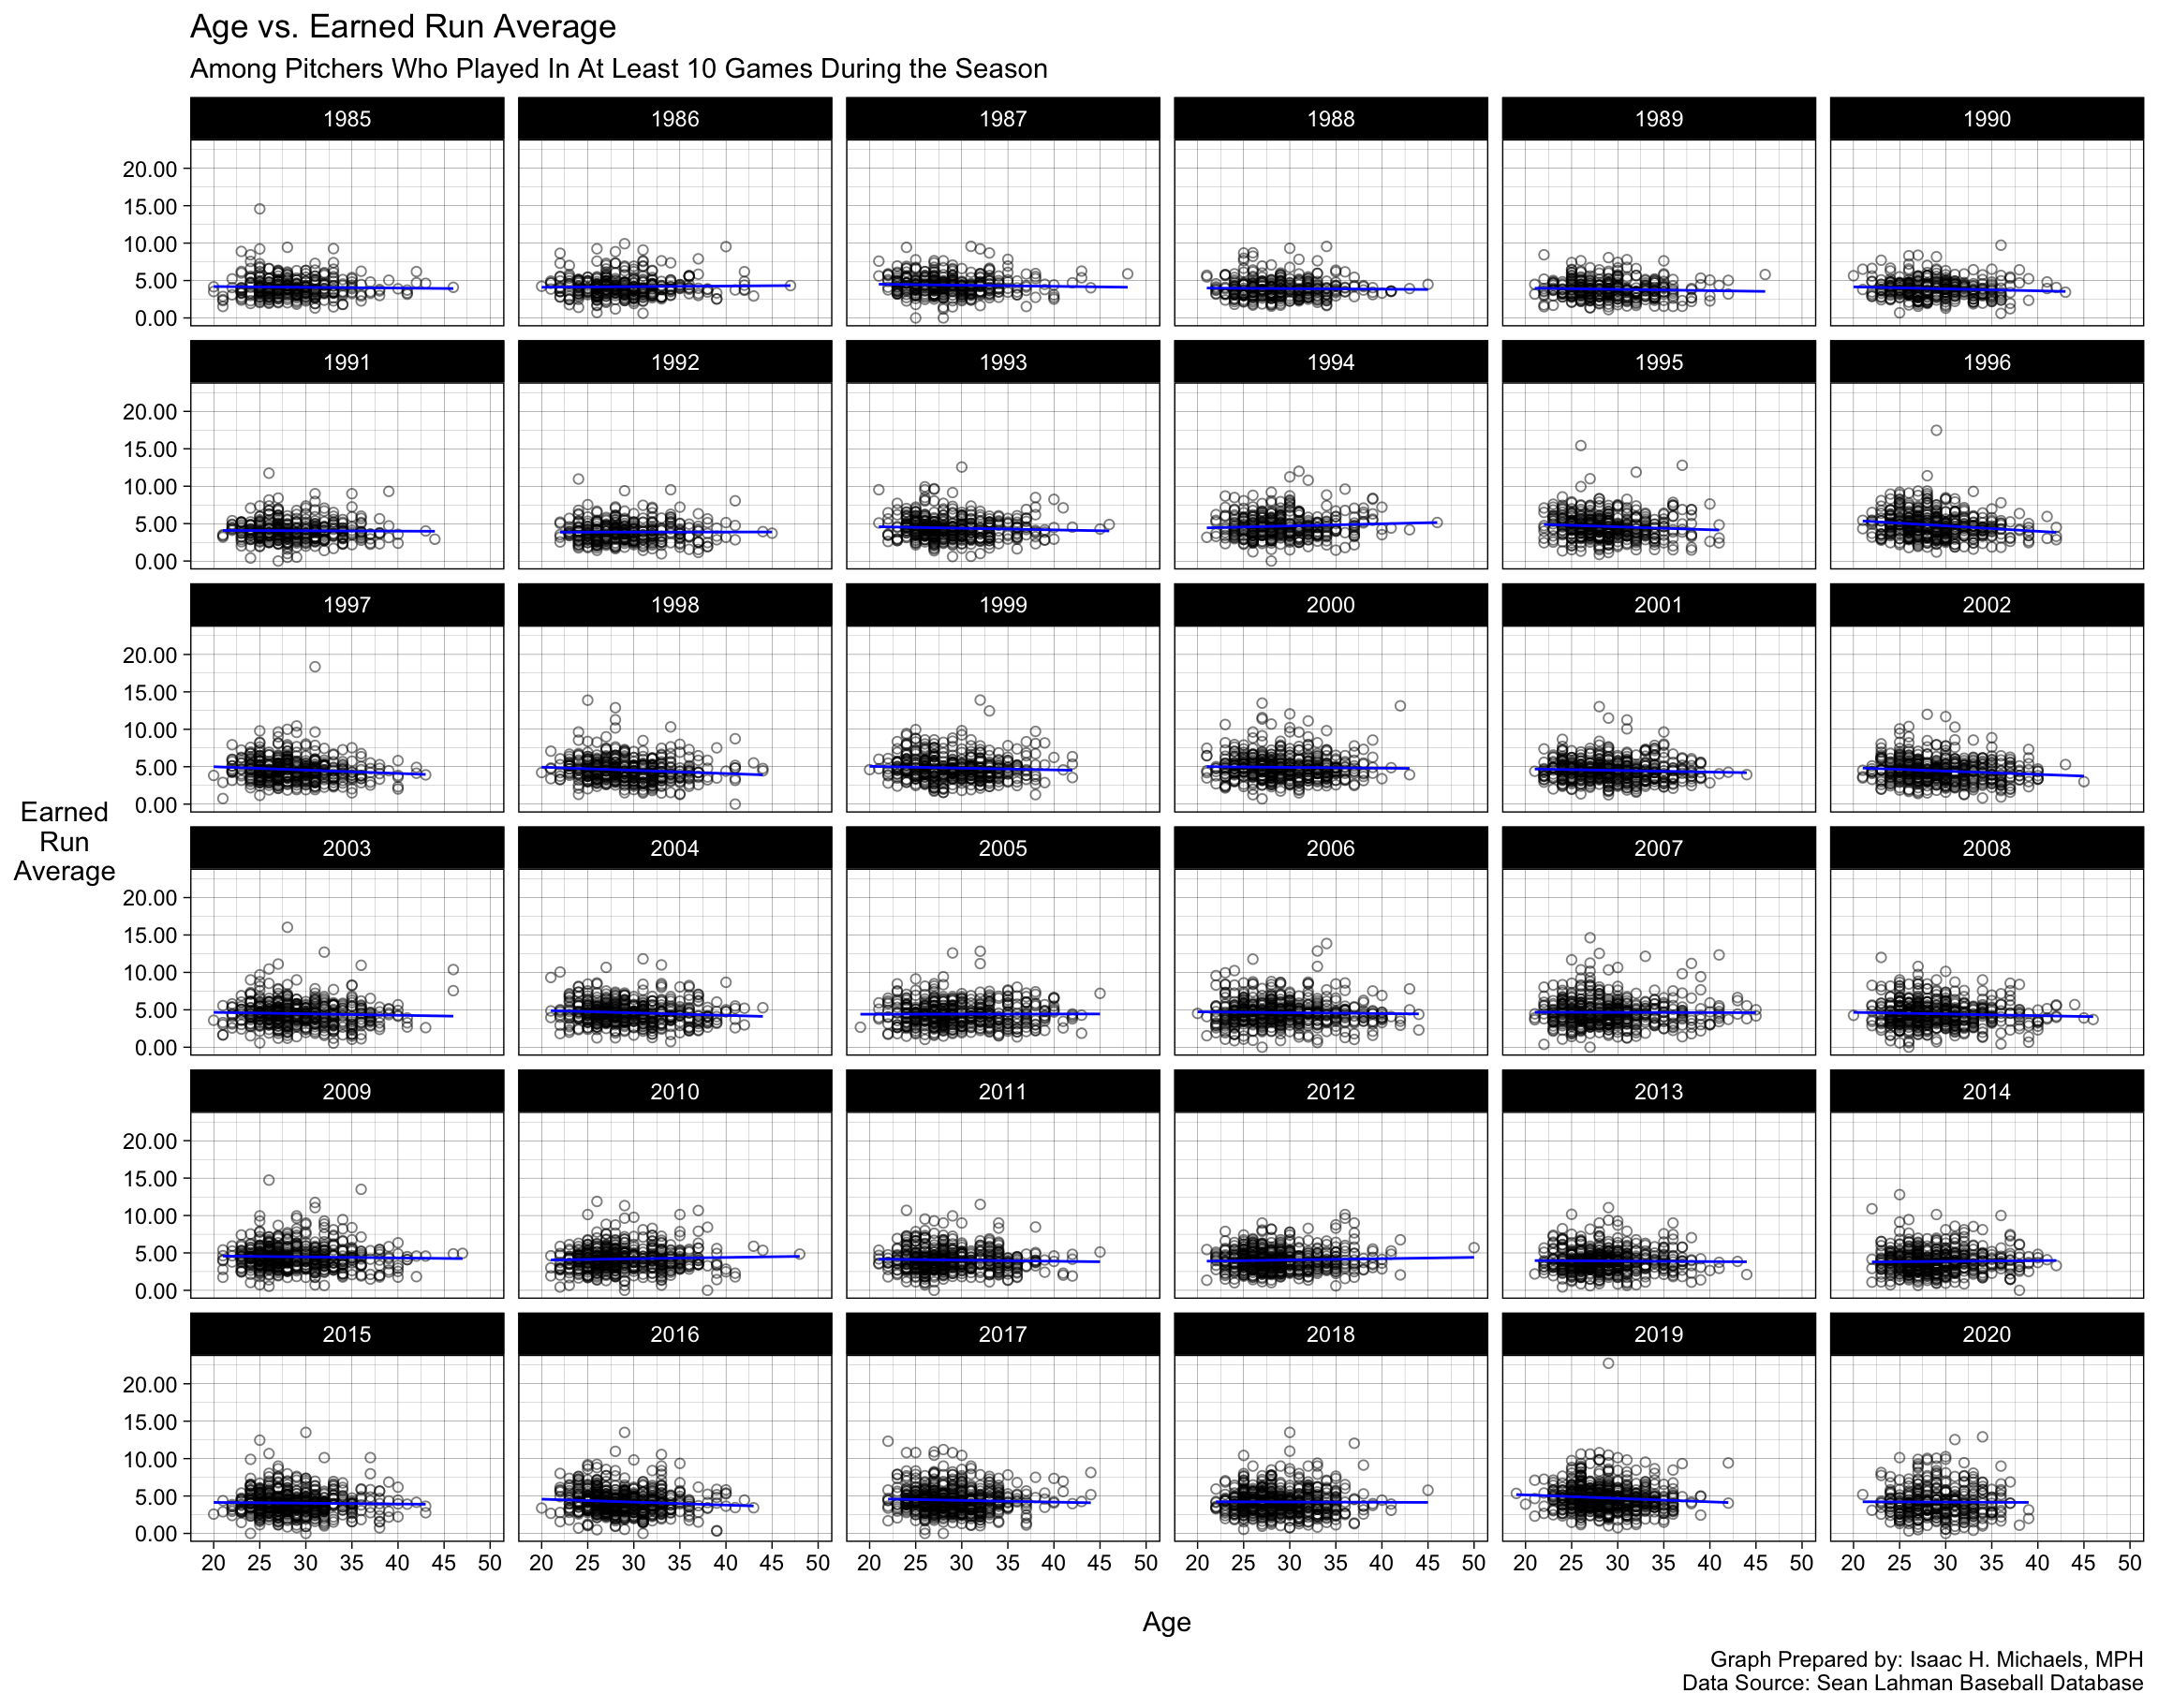
Age vs. ERA


Graph Prepared By: Isaac H. Michaels, MPH
Data Source: Sean Lahman Baseball Database


Back to top


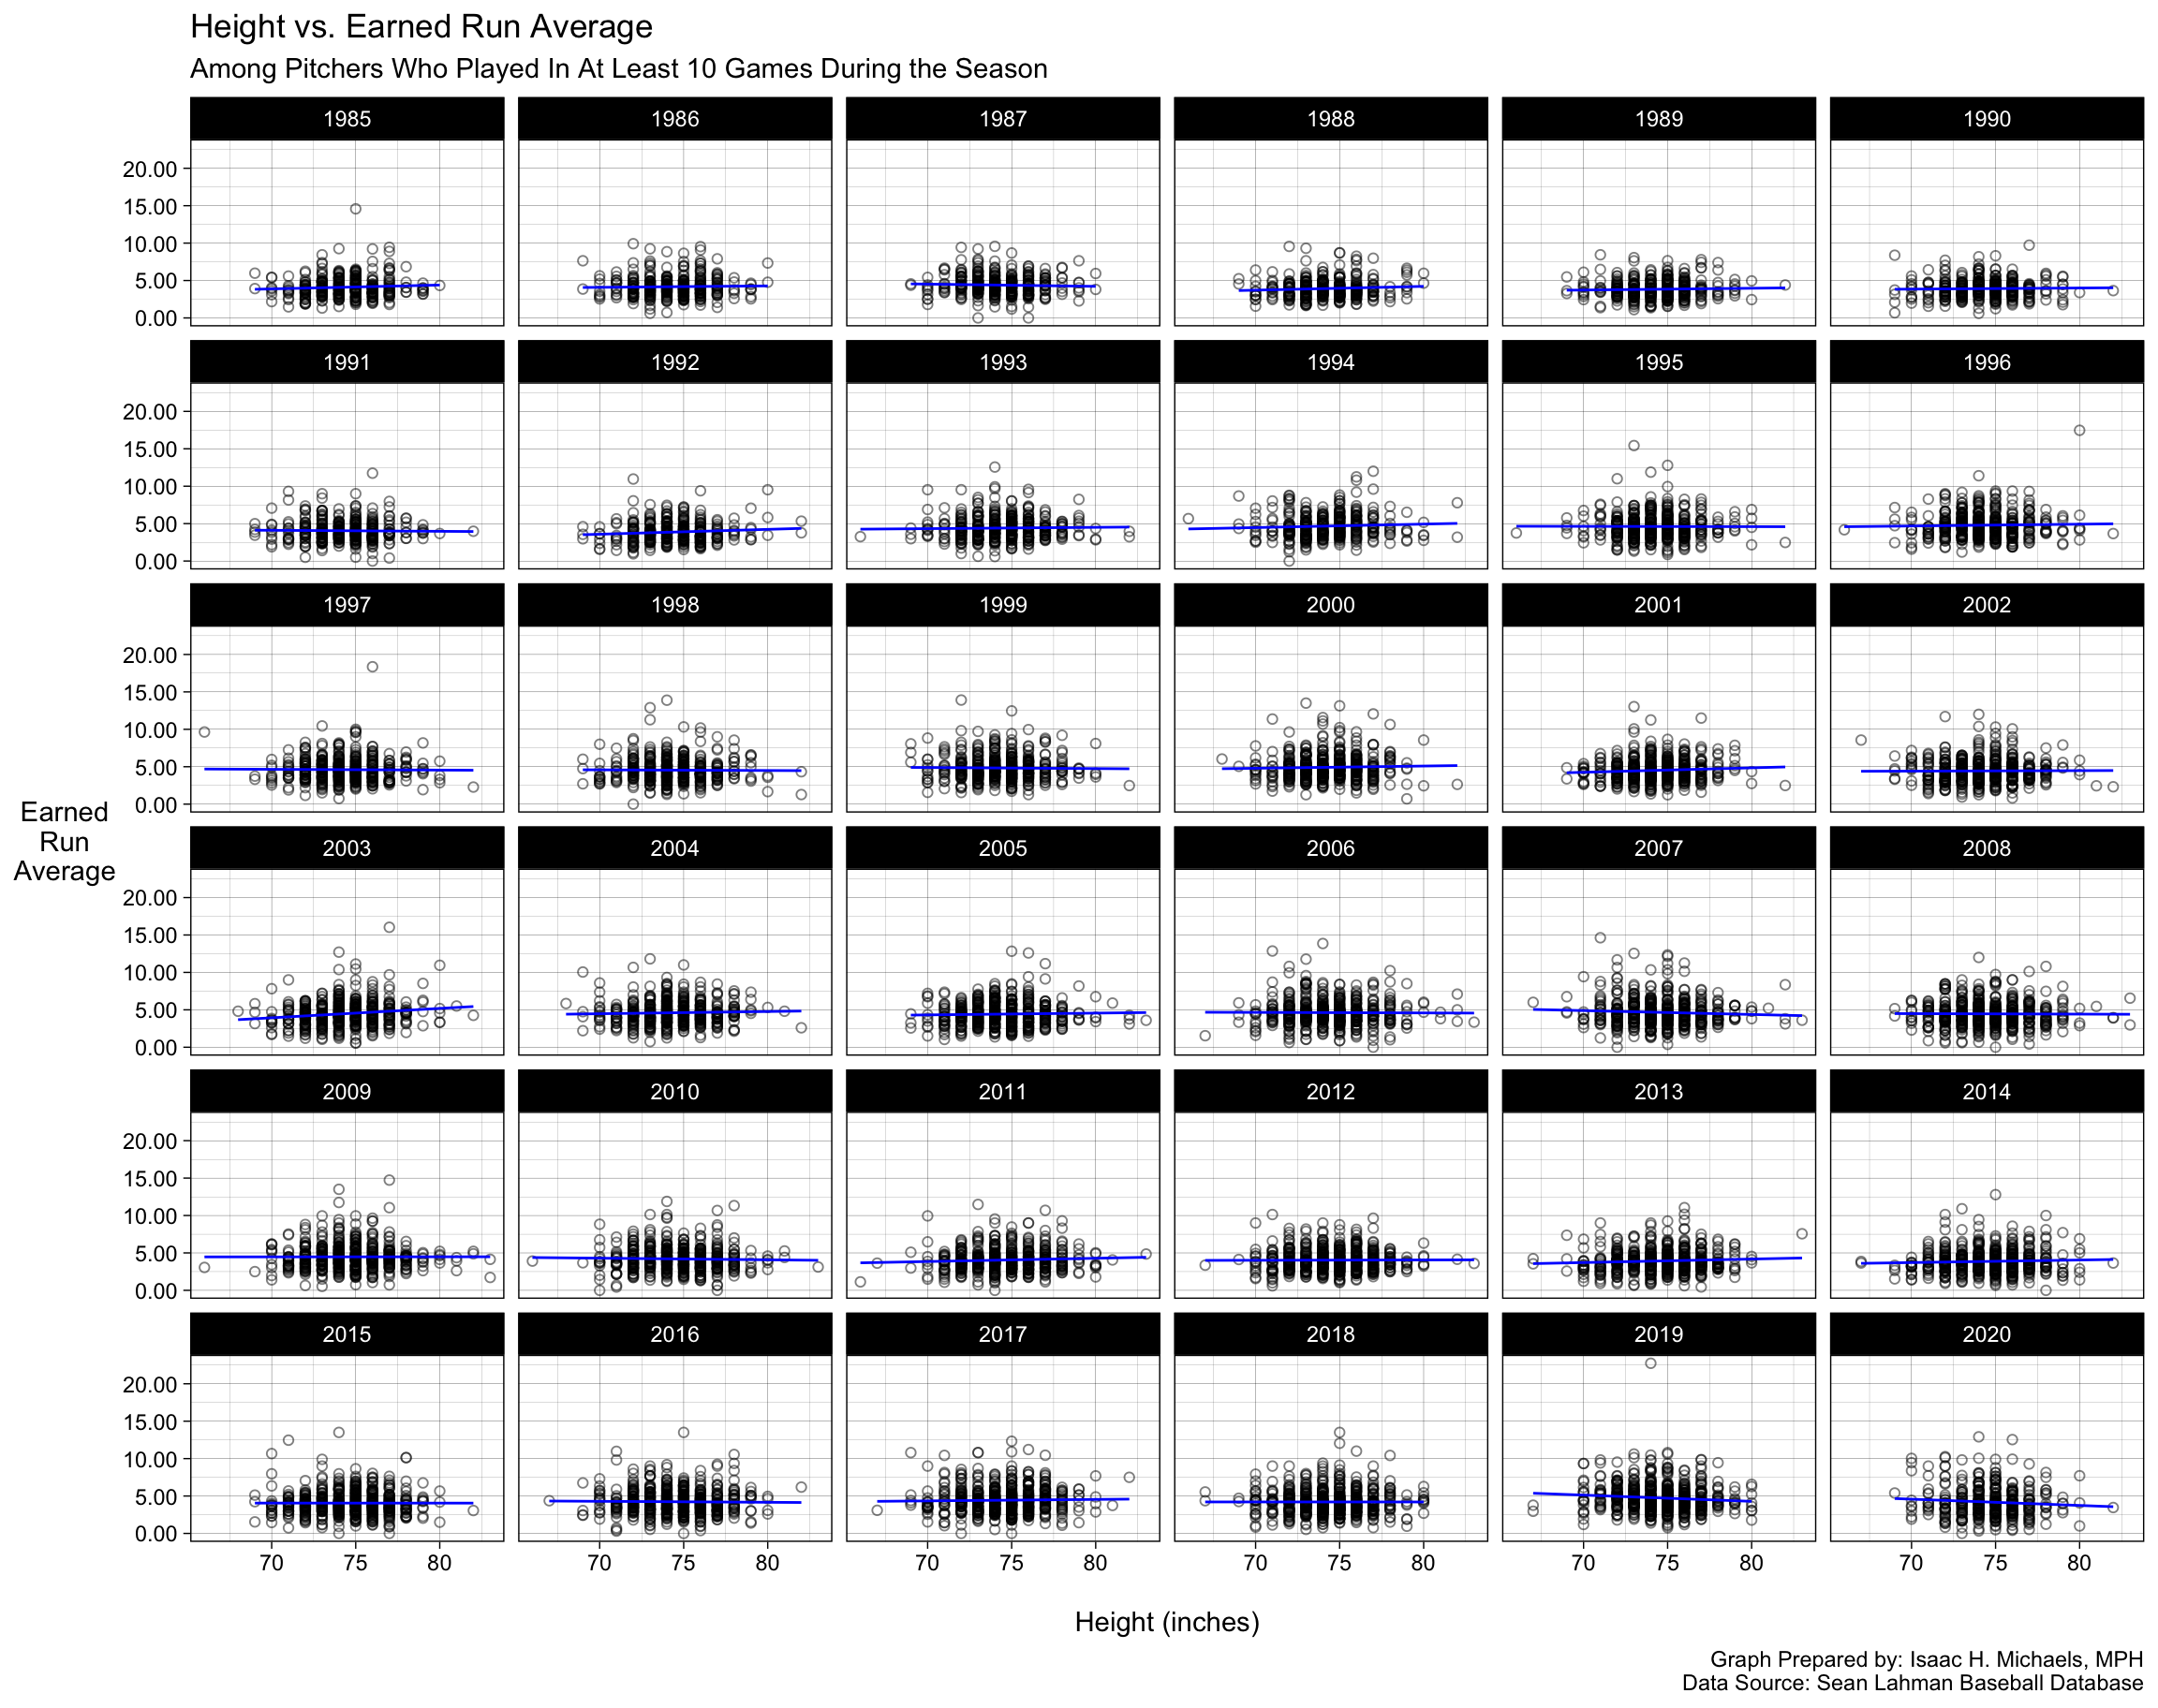
Height vs. ERA


Graph Prepared By: Isaac H. Michaels, MPH
Data Source: Sean Lahman Baseball Database


Back to top


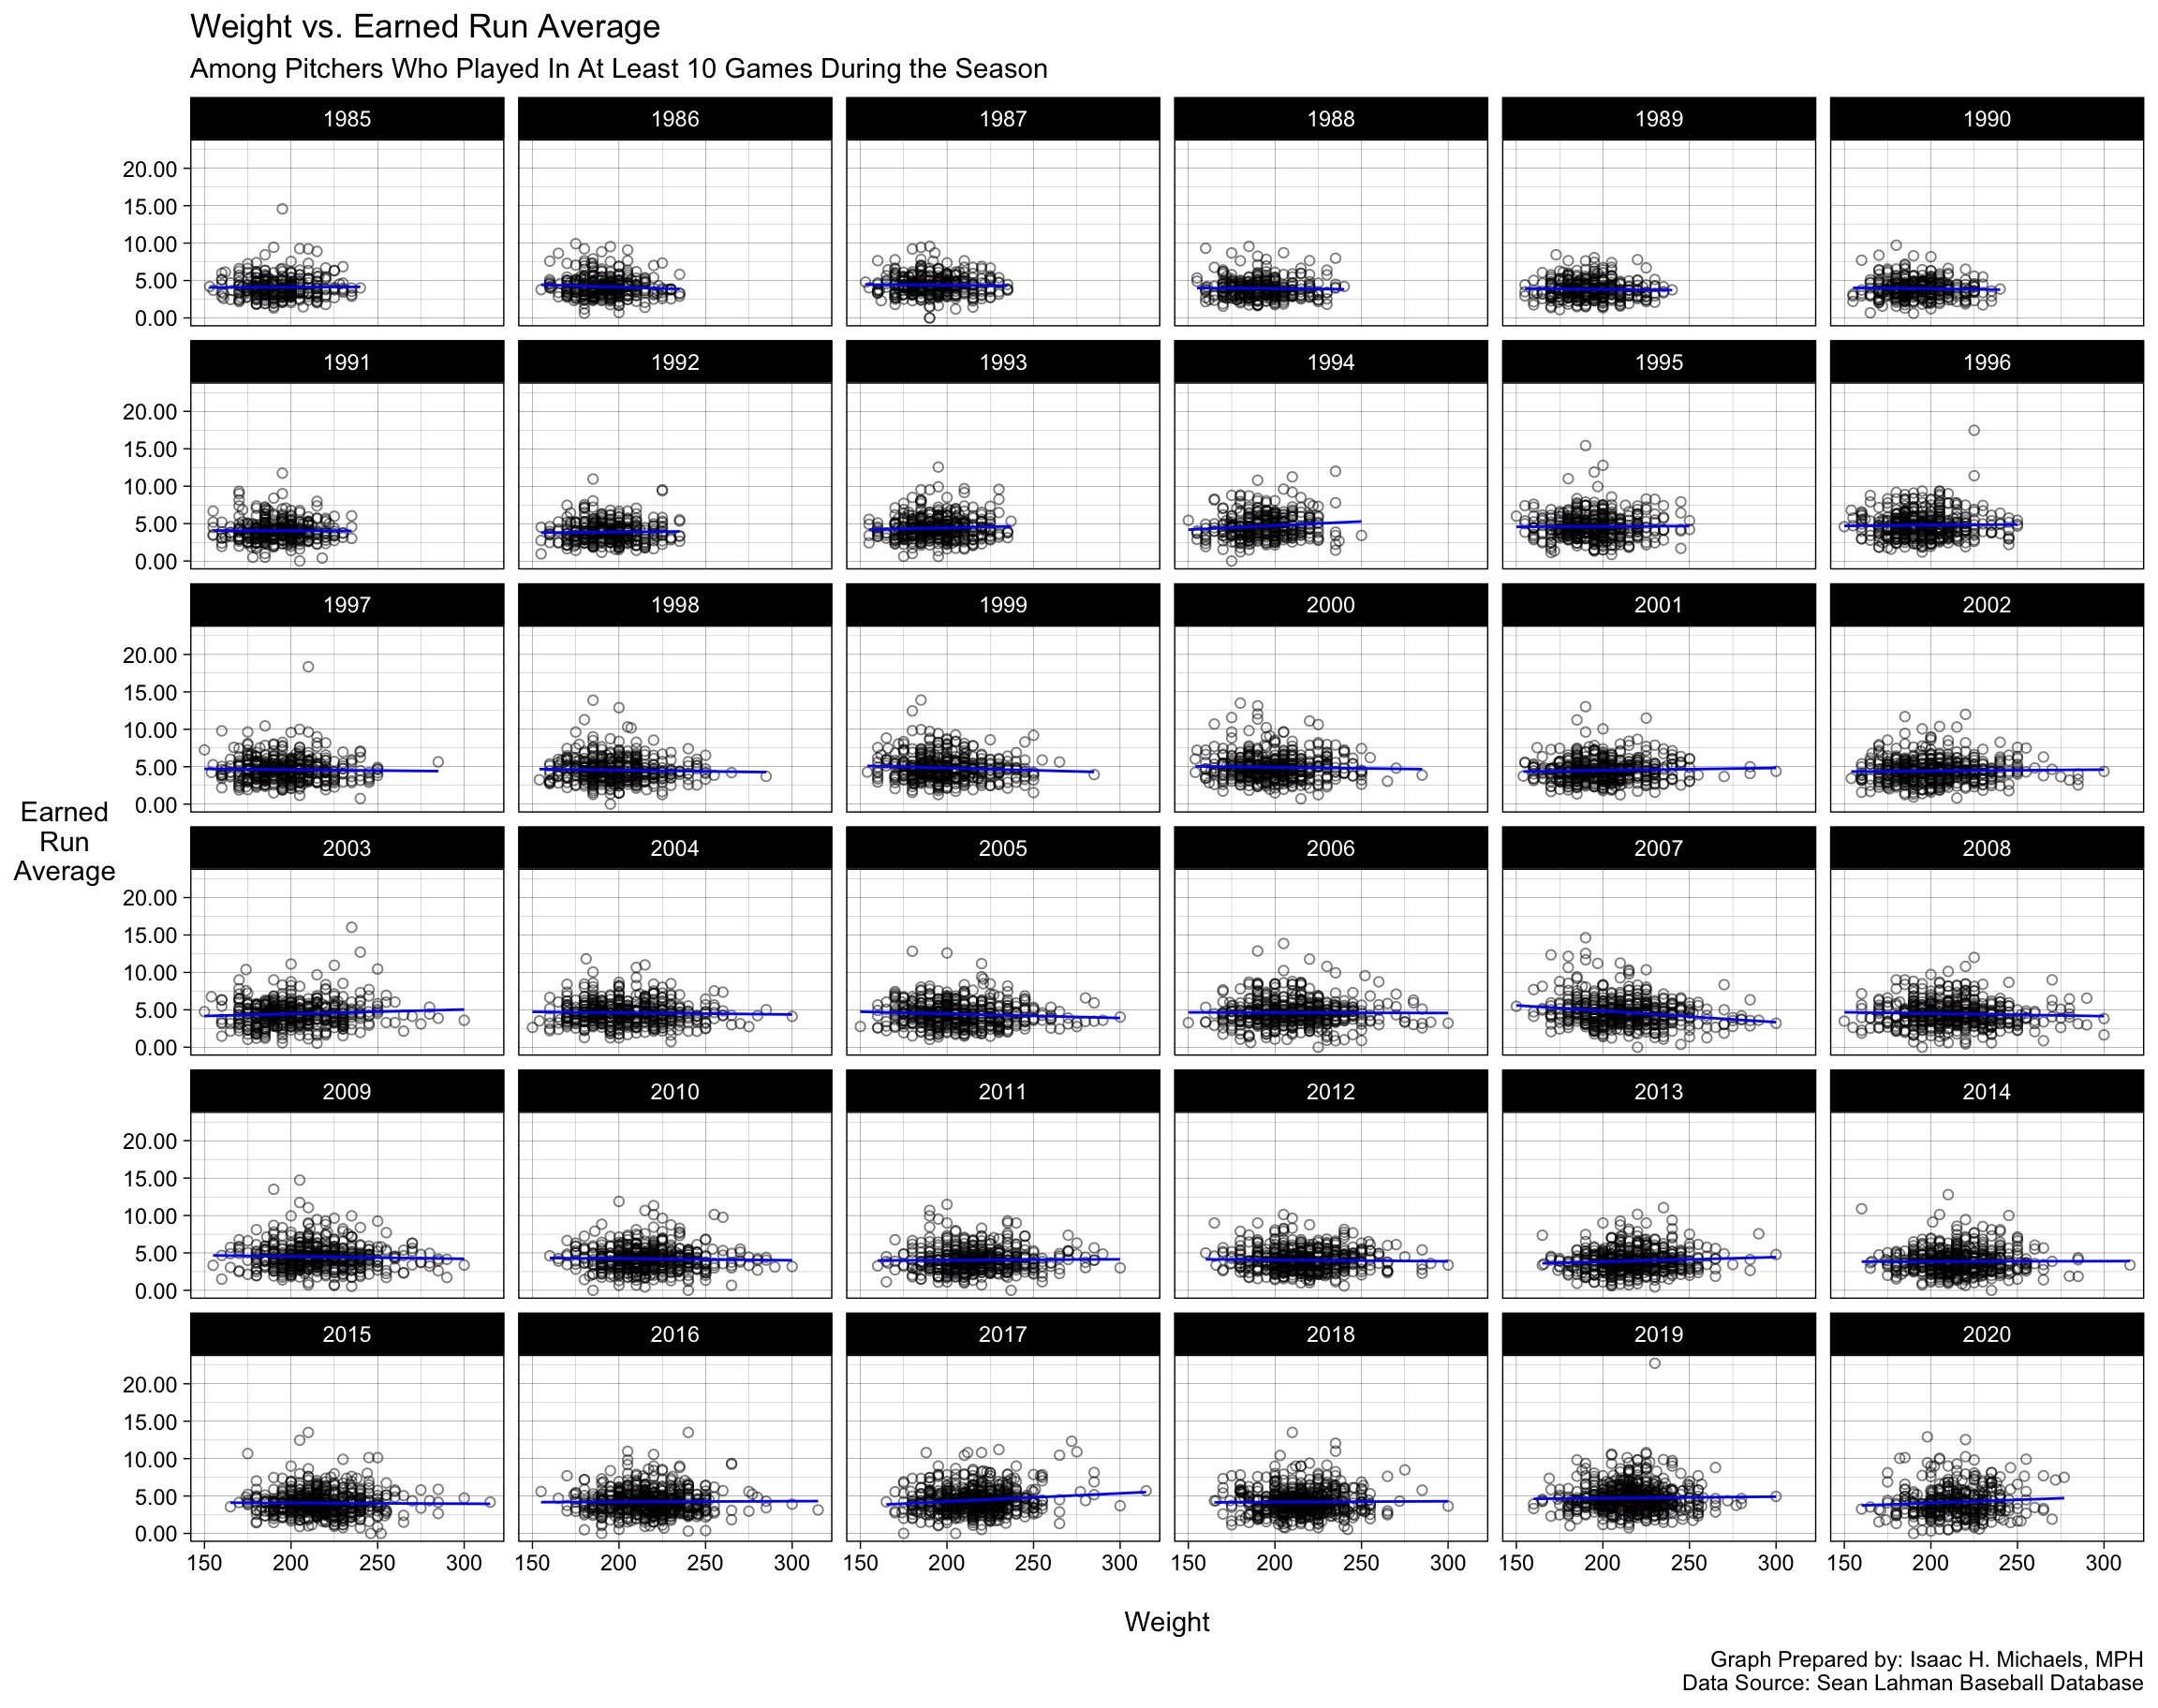
Weight vs. ERA


Graph Prepared By: Isaac H. Michaels, MPH
Data Source: Sean Lahman Baseball Database


Back to top


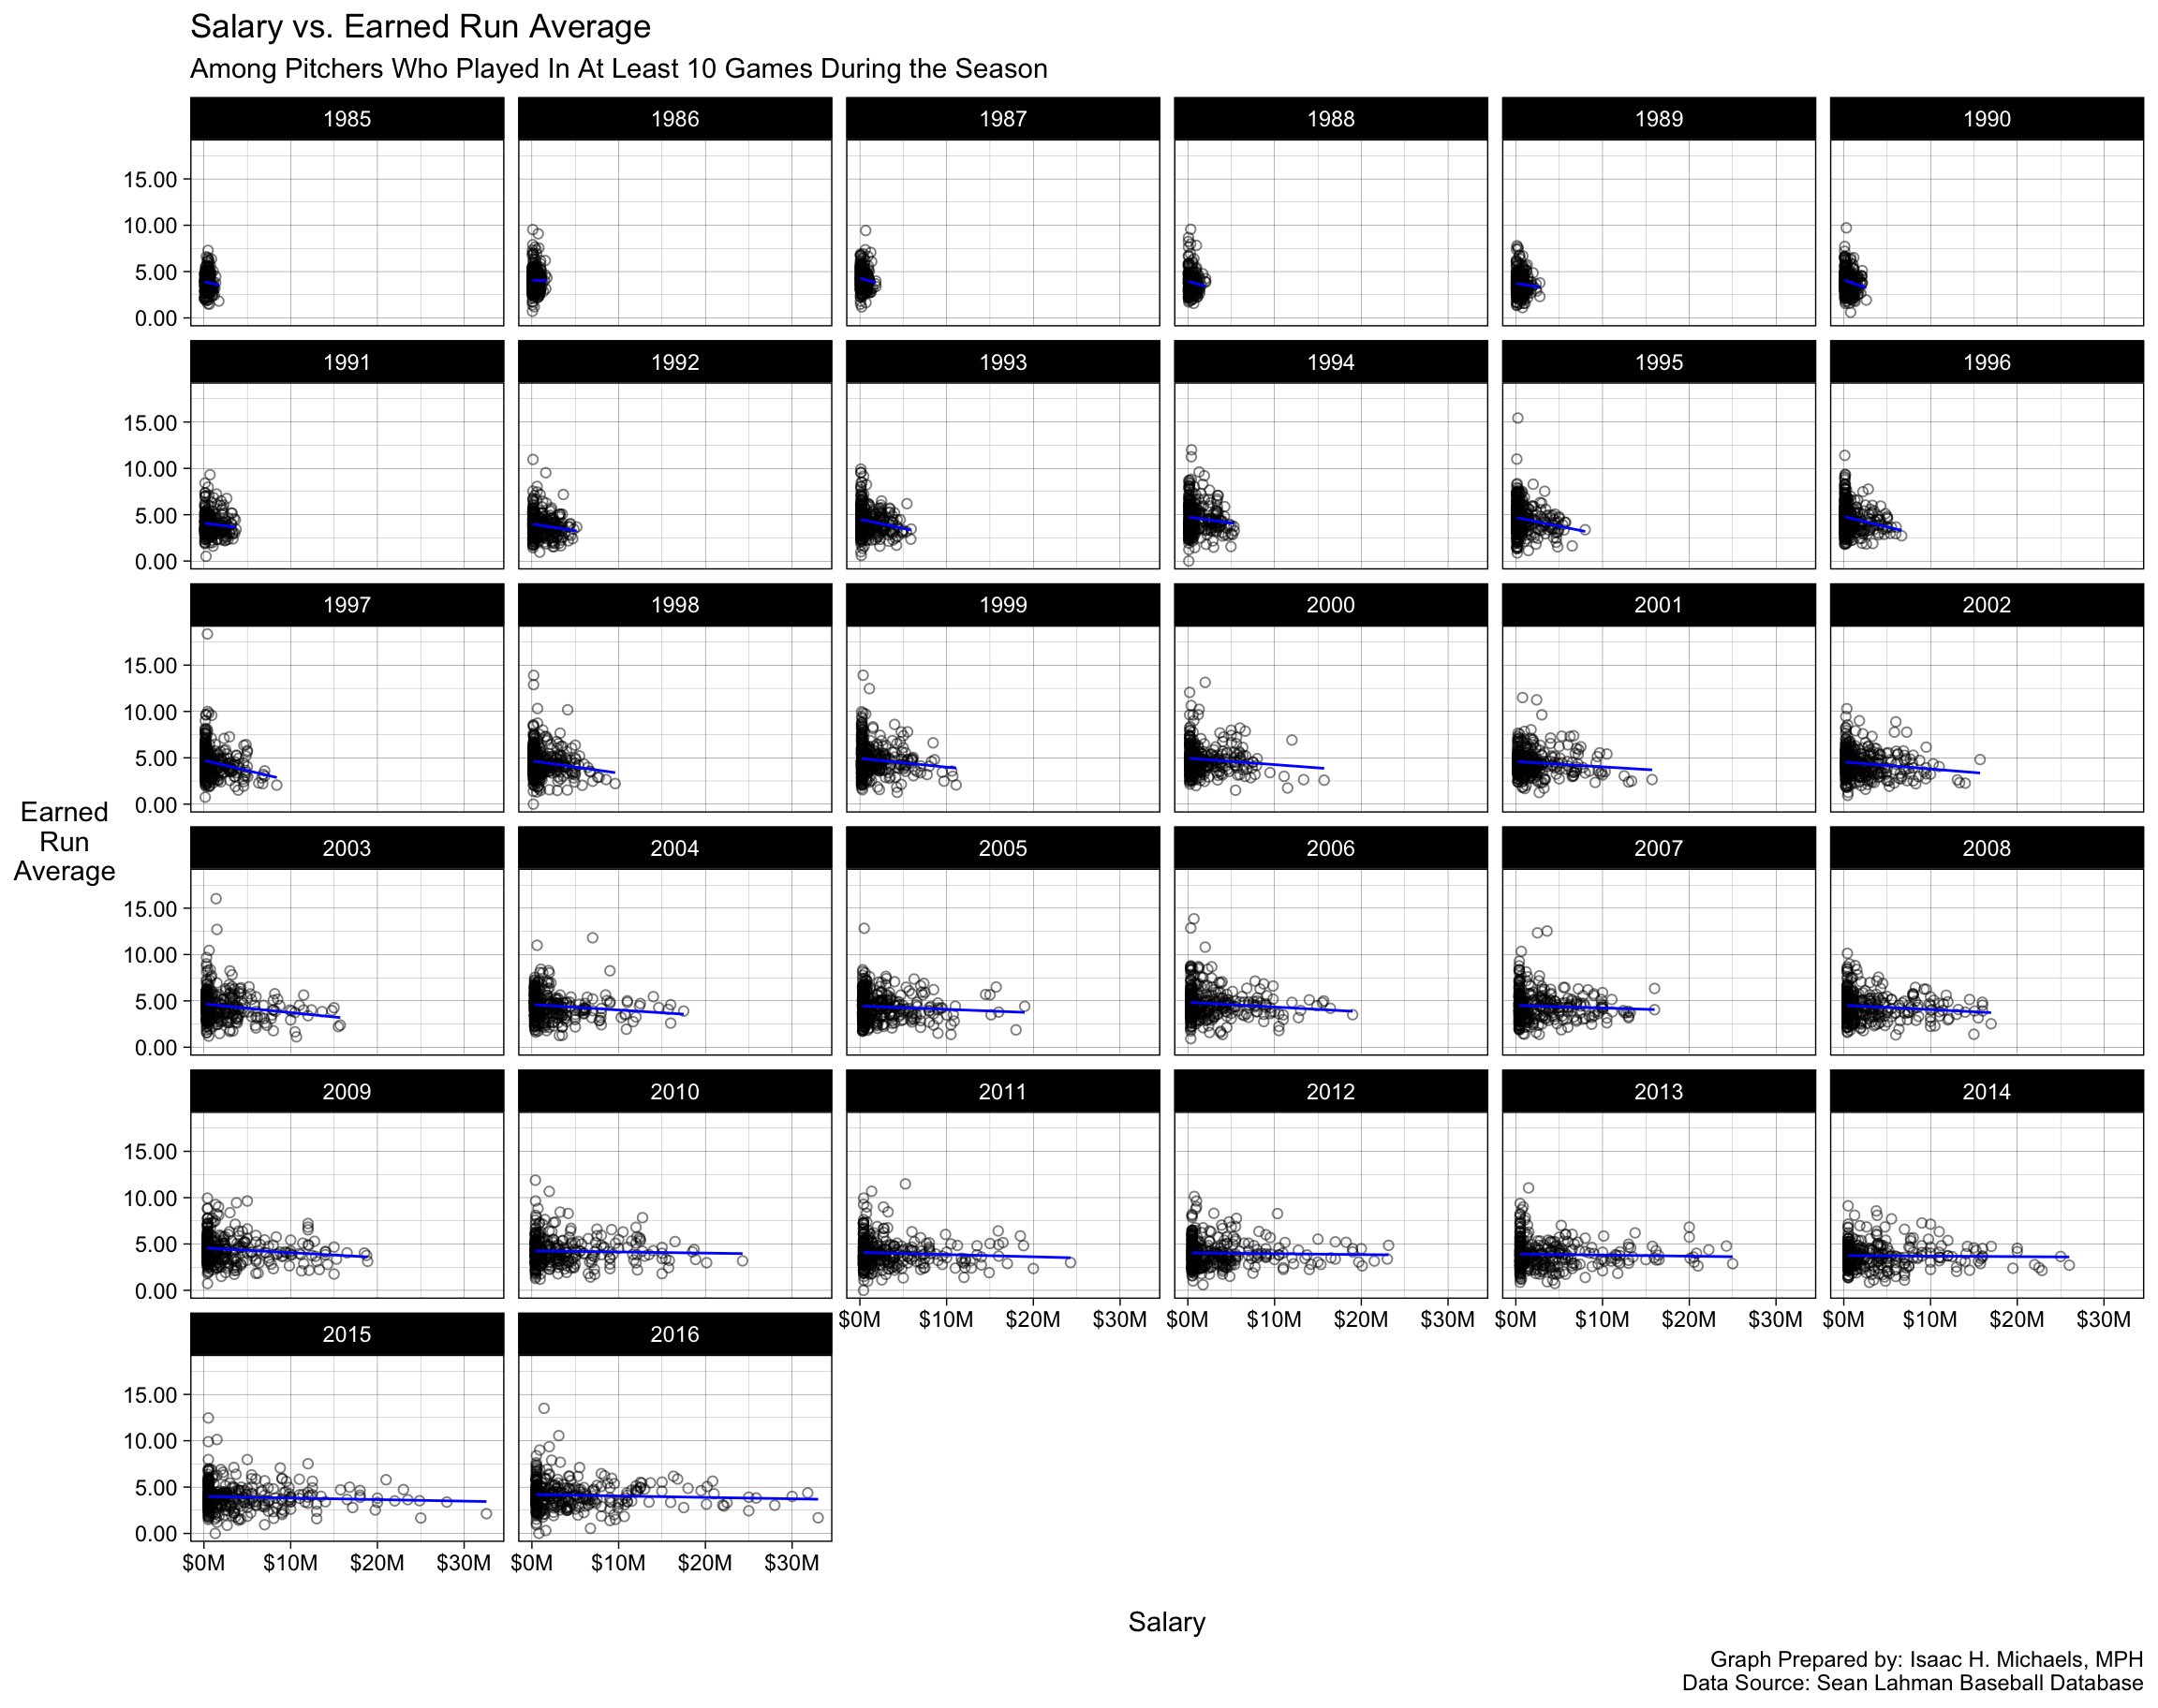
Salary vs. ERA


Graph Prepared By: Isaac H. Michaels, MPH
Data Source: Sean Lahman Baseball Database


Back to top


Team Winning Percentage, Homeruns, and ERA


Winning Percentage vs. Homeruns
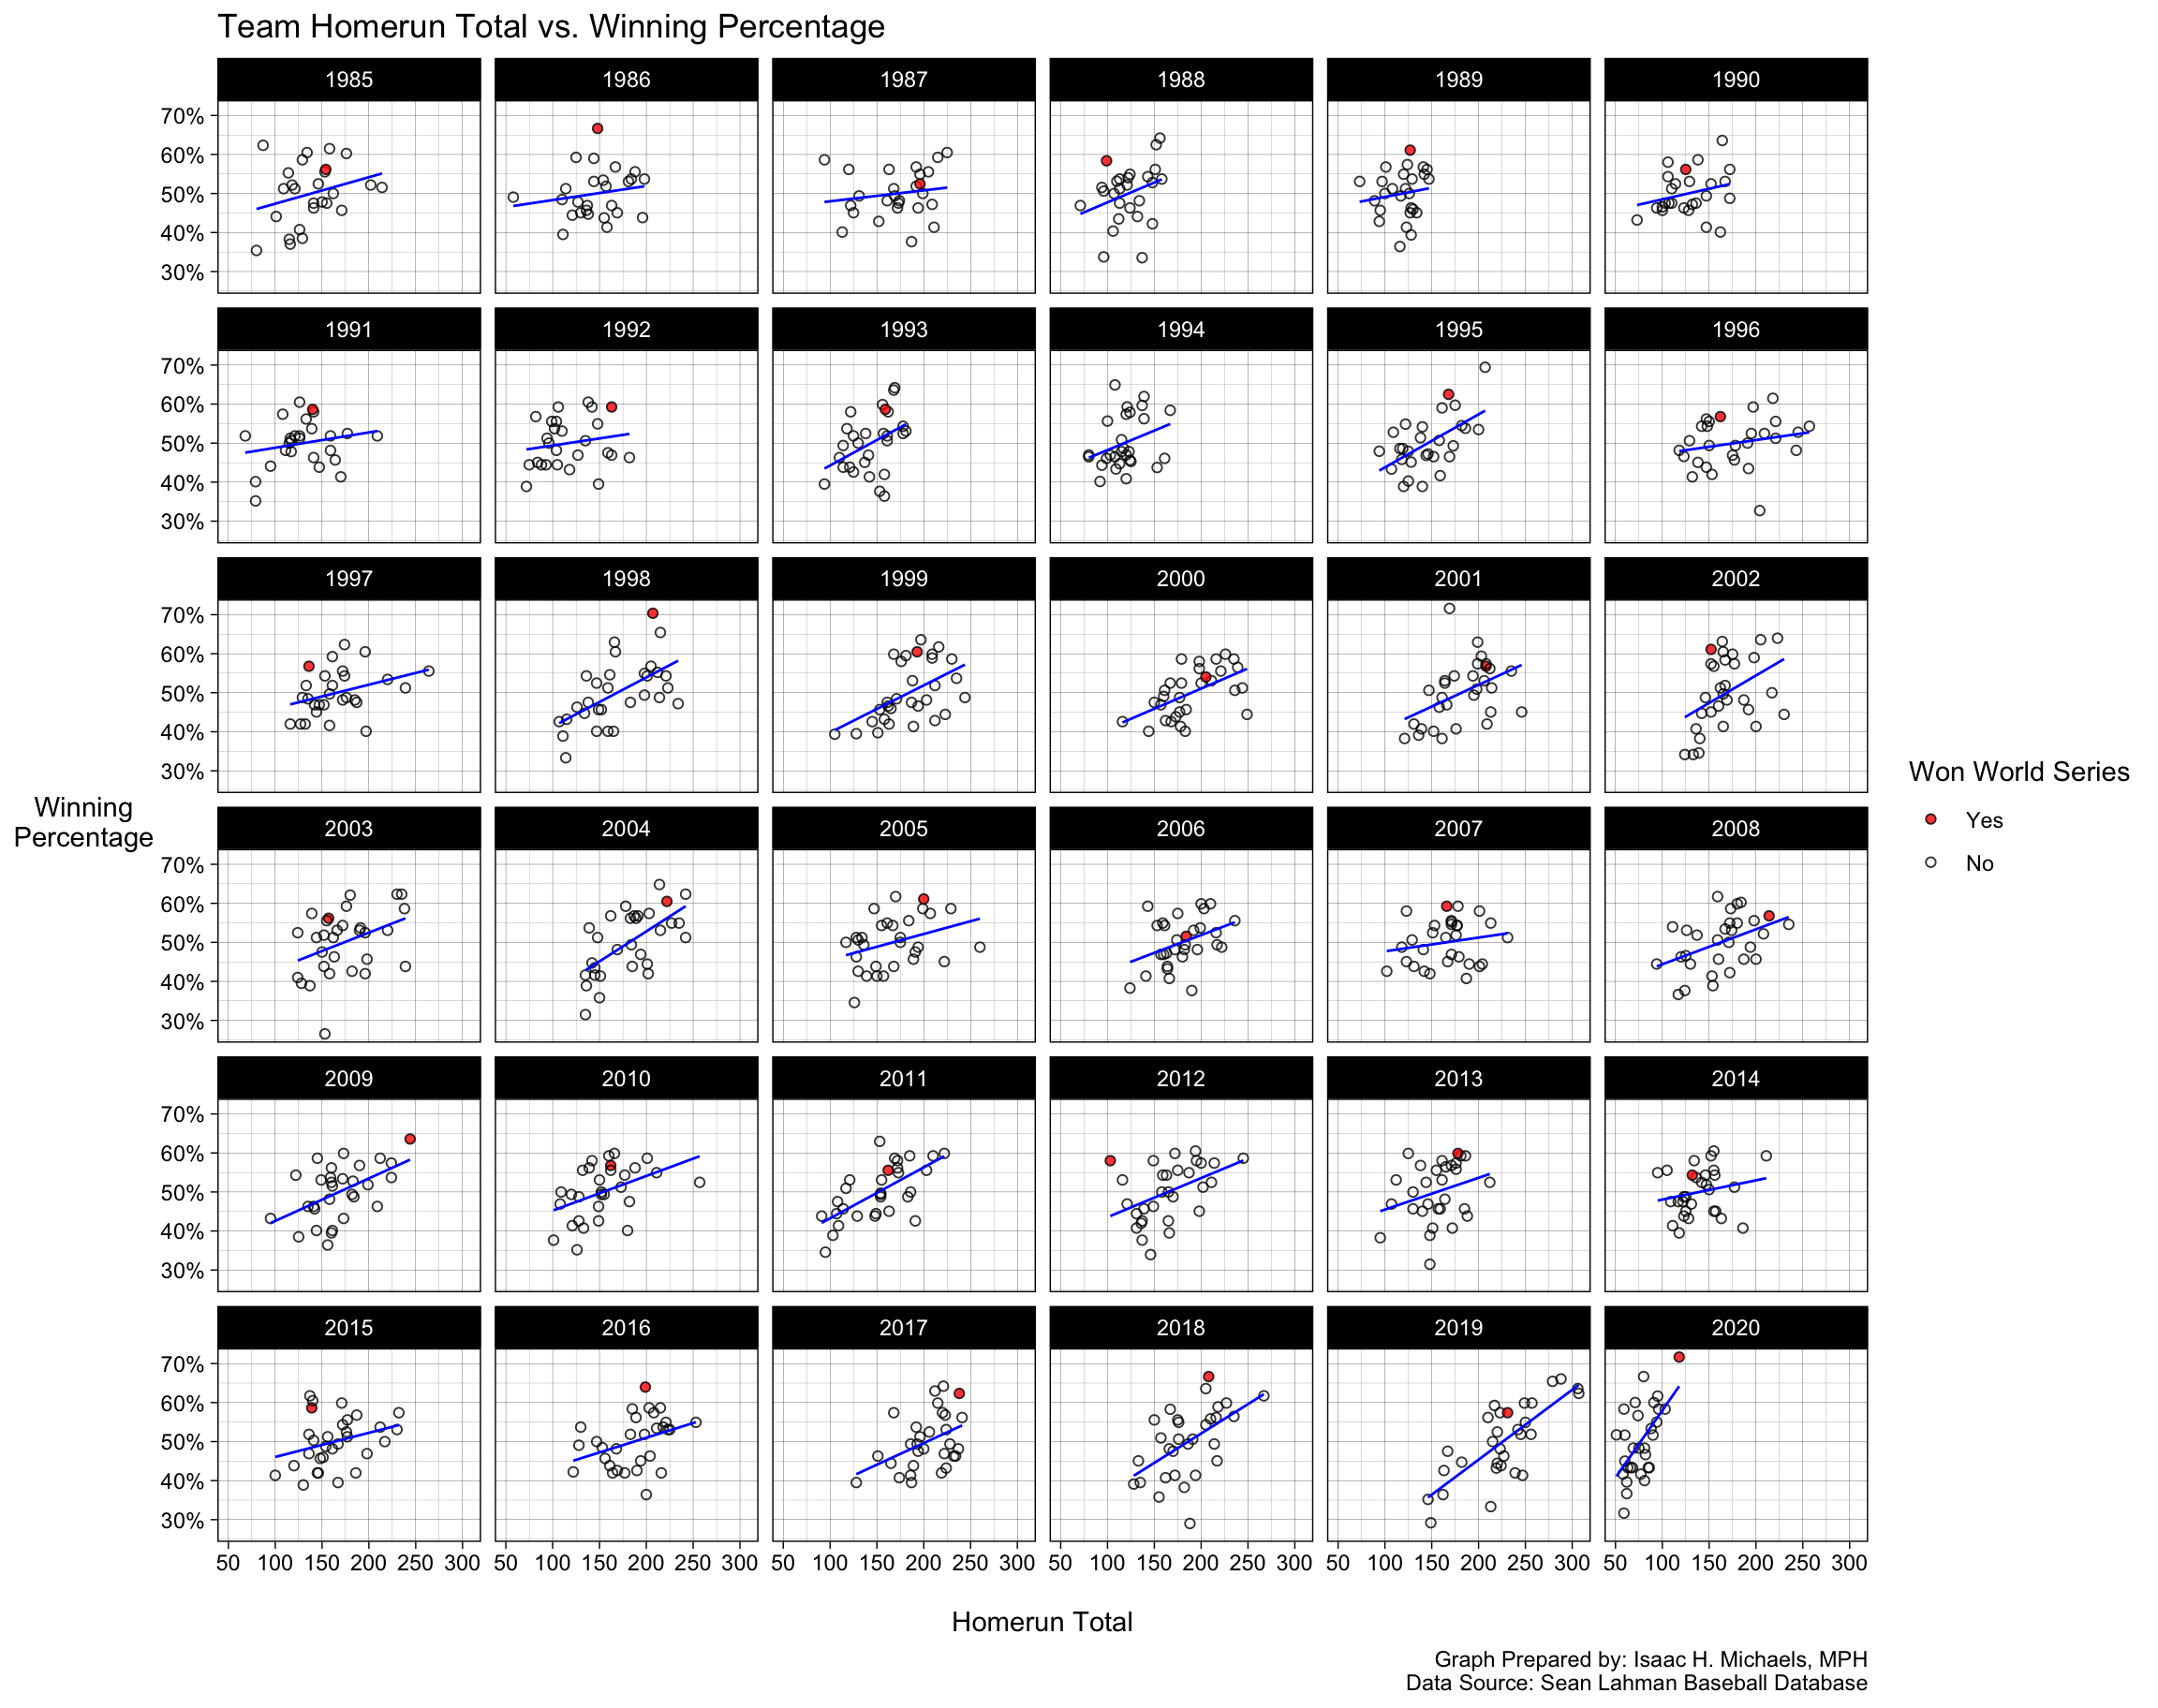

Graph Prepared By: Isaac H. Michaels, MPH
Data Source: Sean Lahman Baseball Database


Back to top


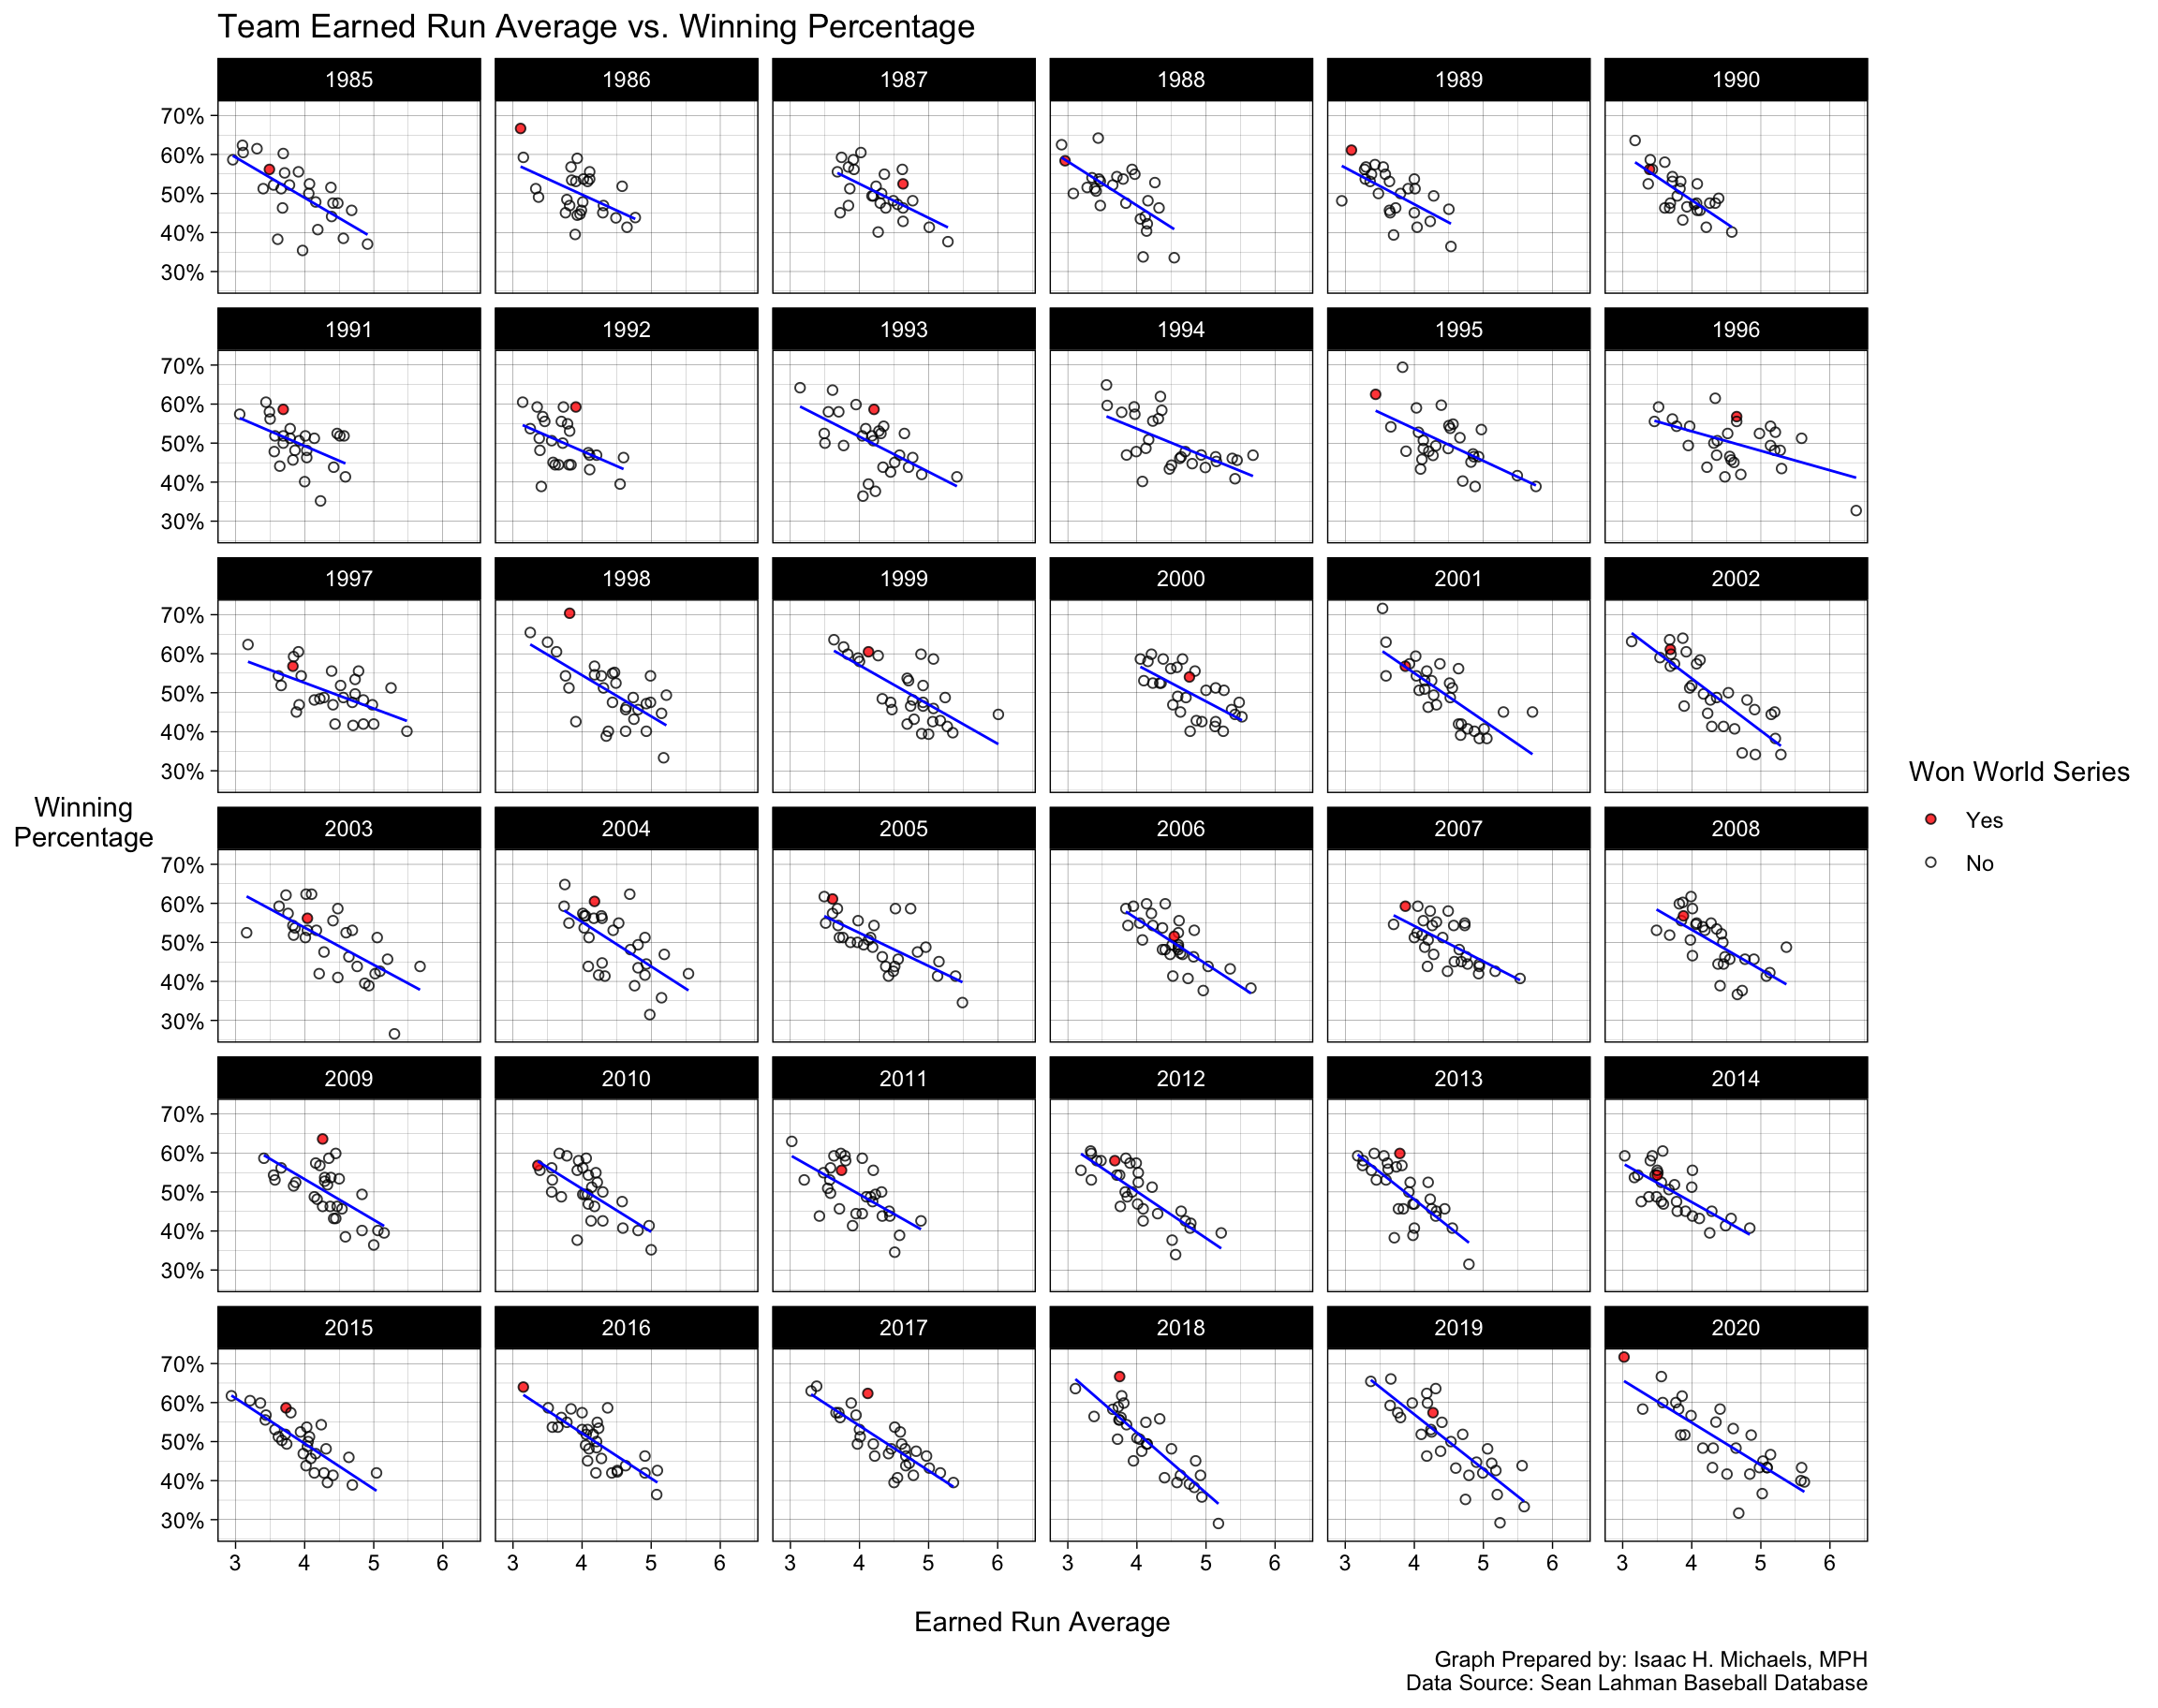
Winning Percentage vs. ERA


Graph Prepared By: Isaac H. Michaels, MPH
Data Source: Sean Lahman Baseball Database


Back to top


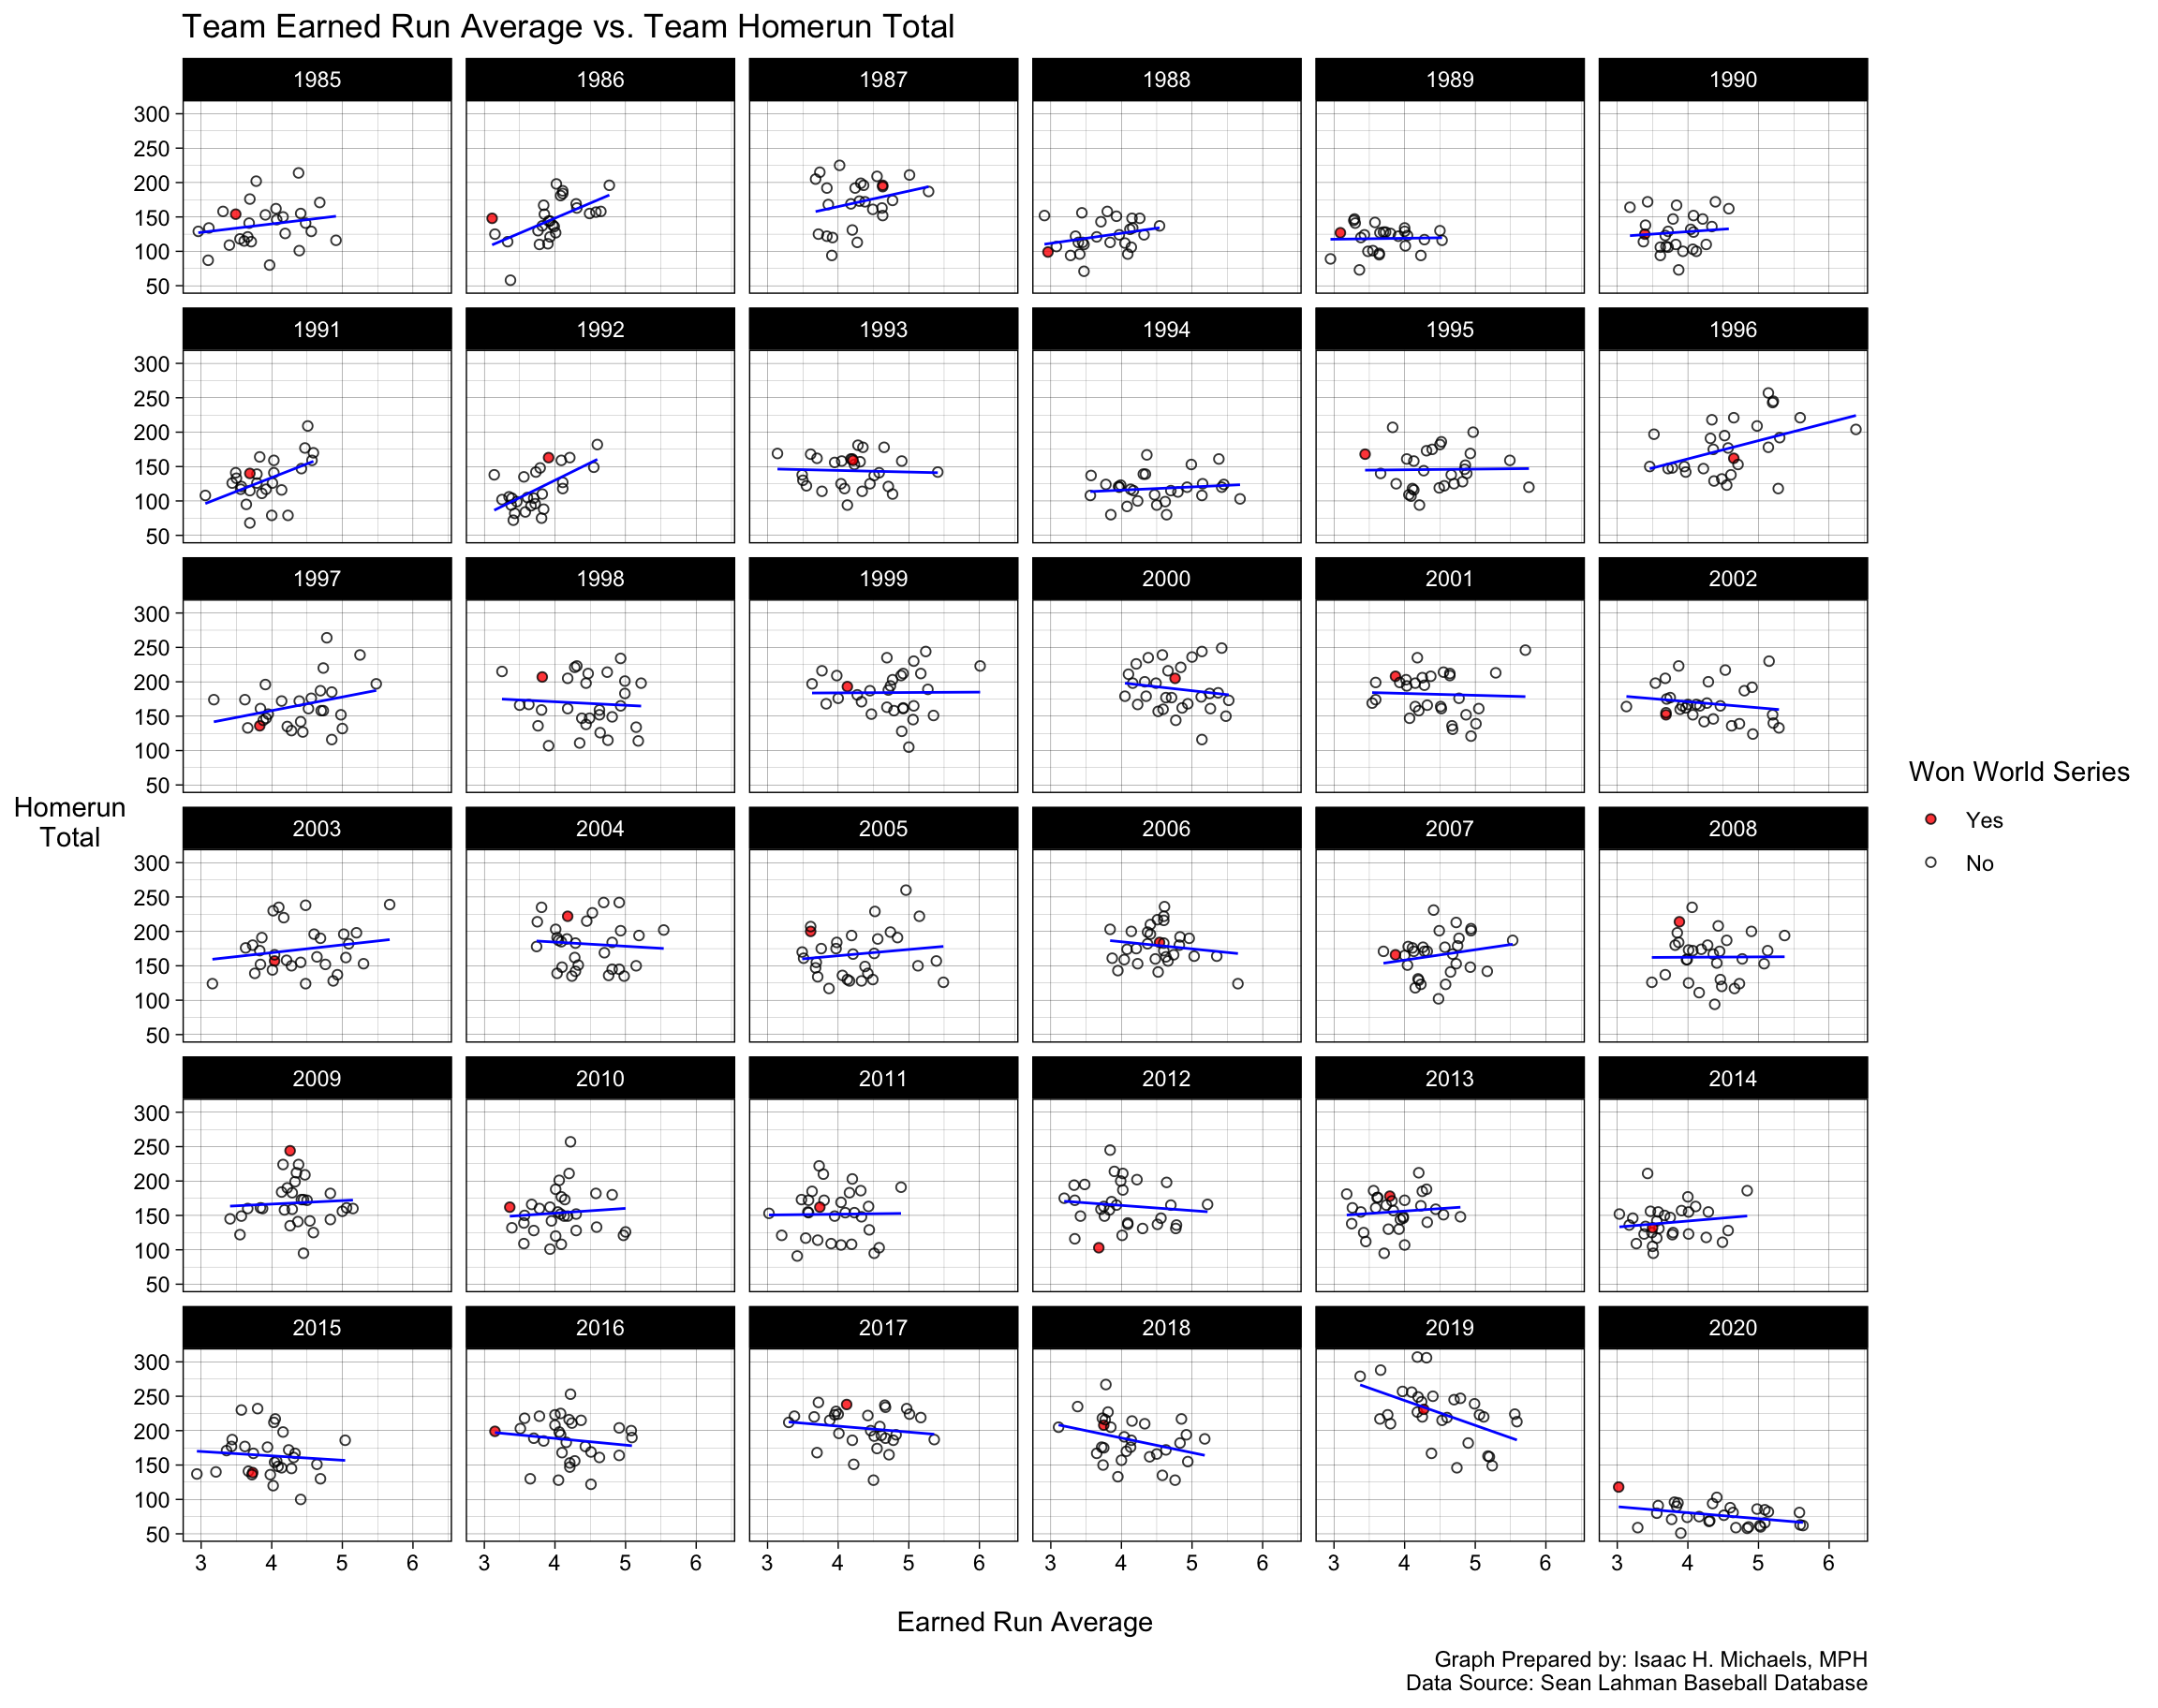
Homeruns vs. ERA


Graph Prepared By: Isaac H. Michaels, MPH
Data Source: Sean Lahman Baseball Database


Back to top


Team Winning Percentage, Payroll, and Attendance


Payroll vs. Winning Percentage
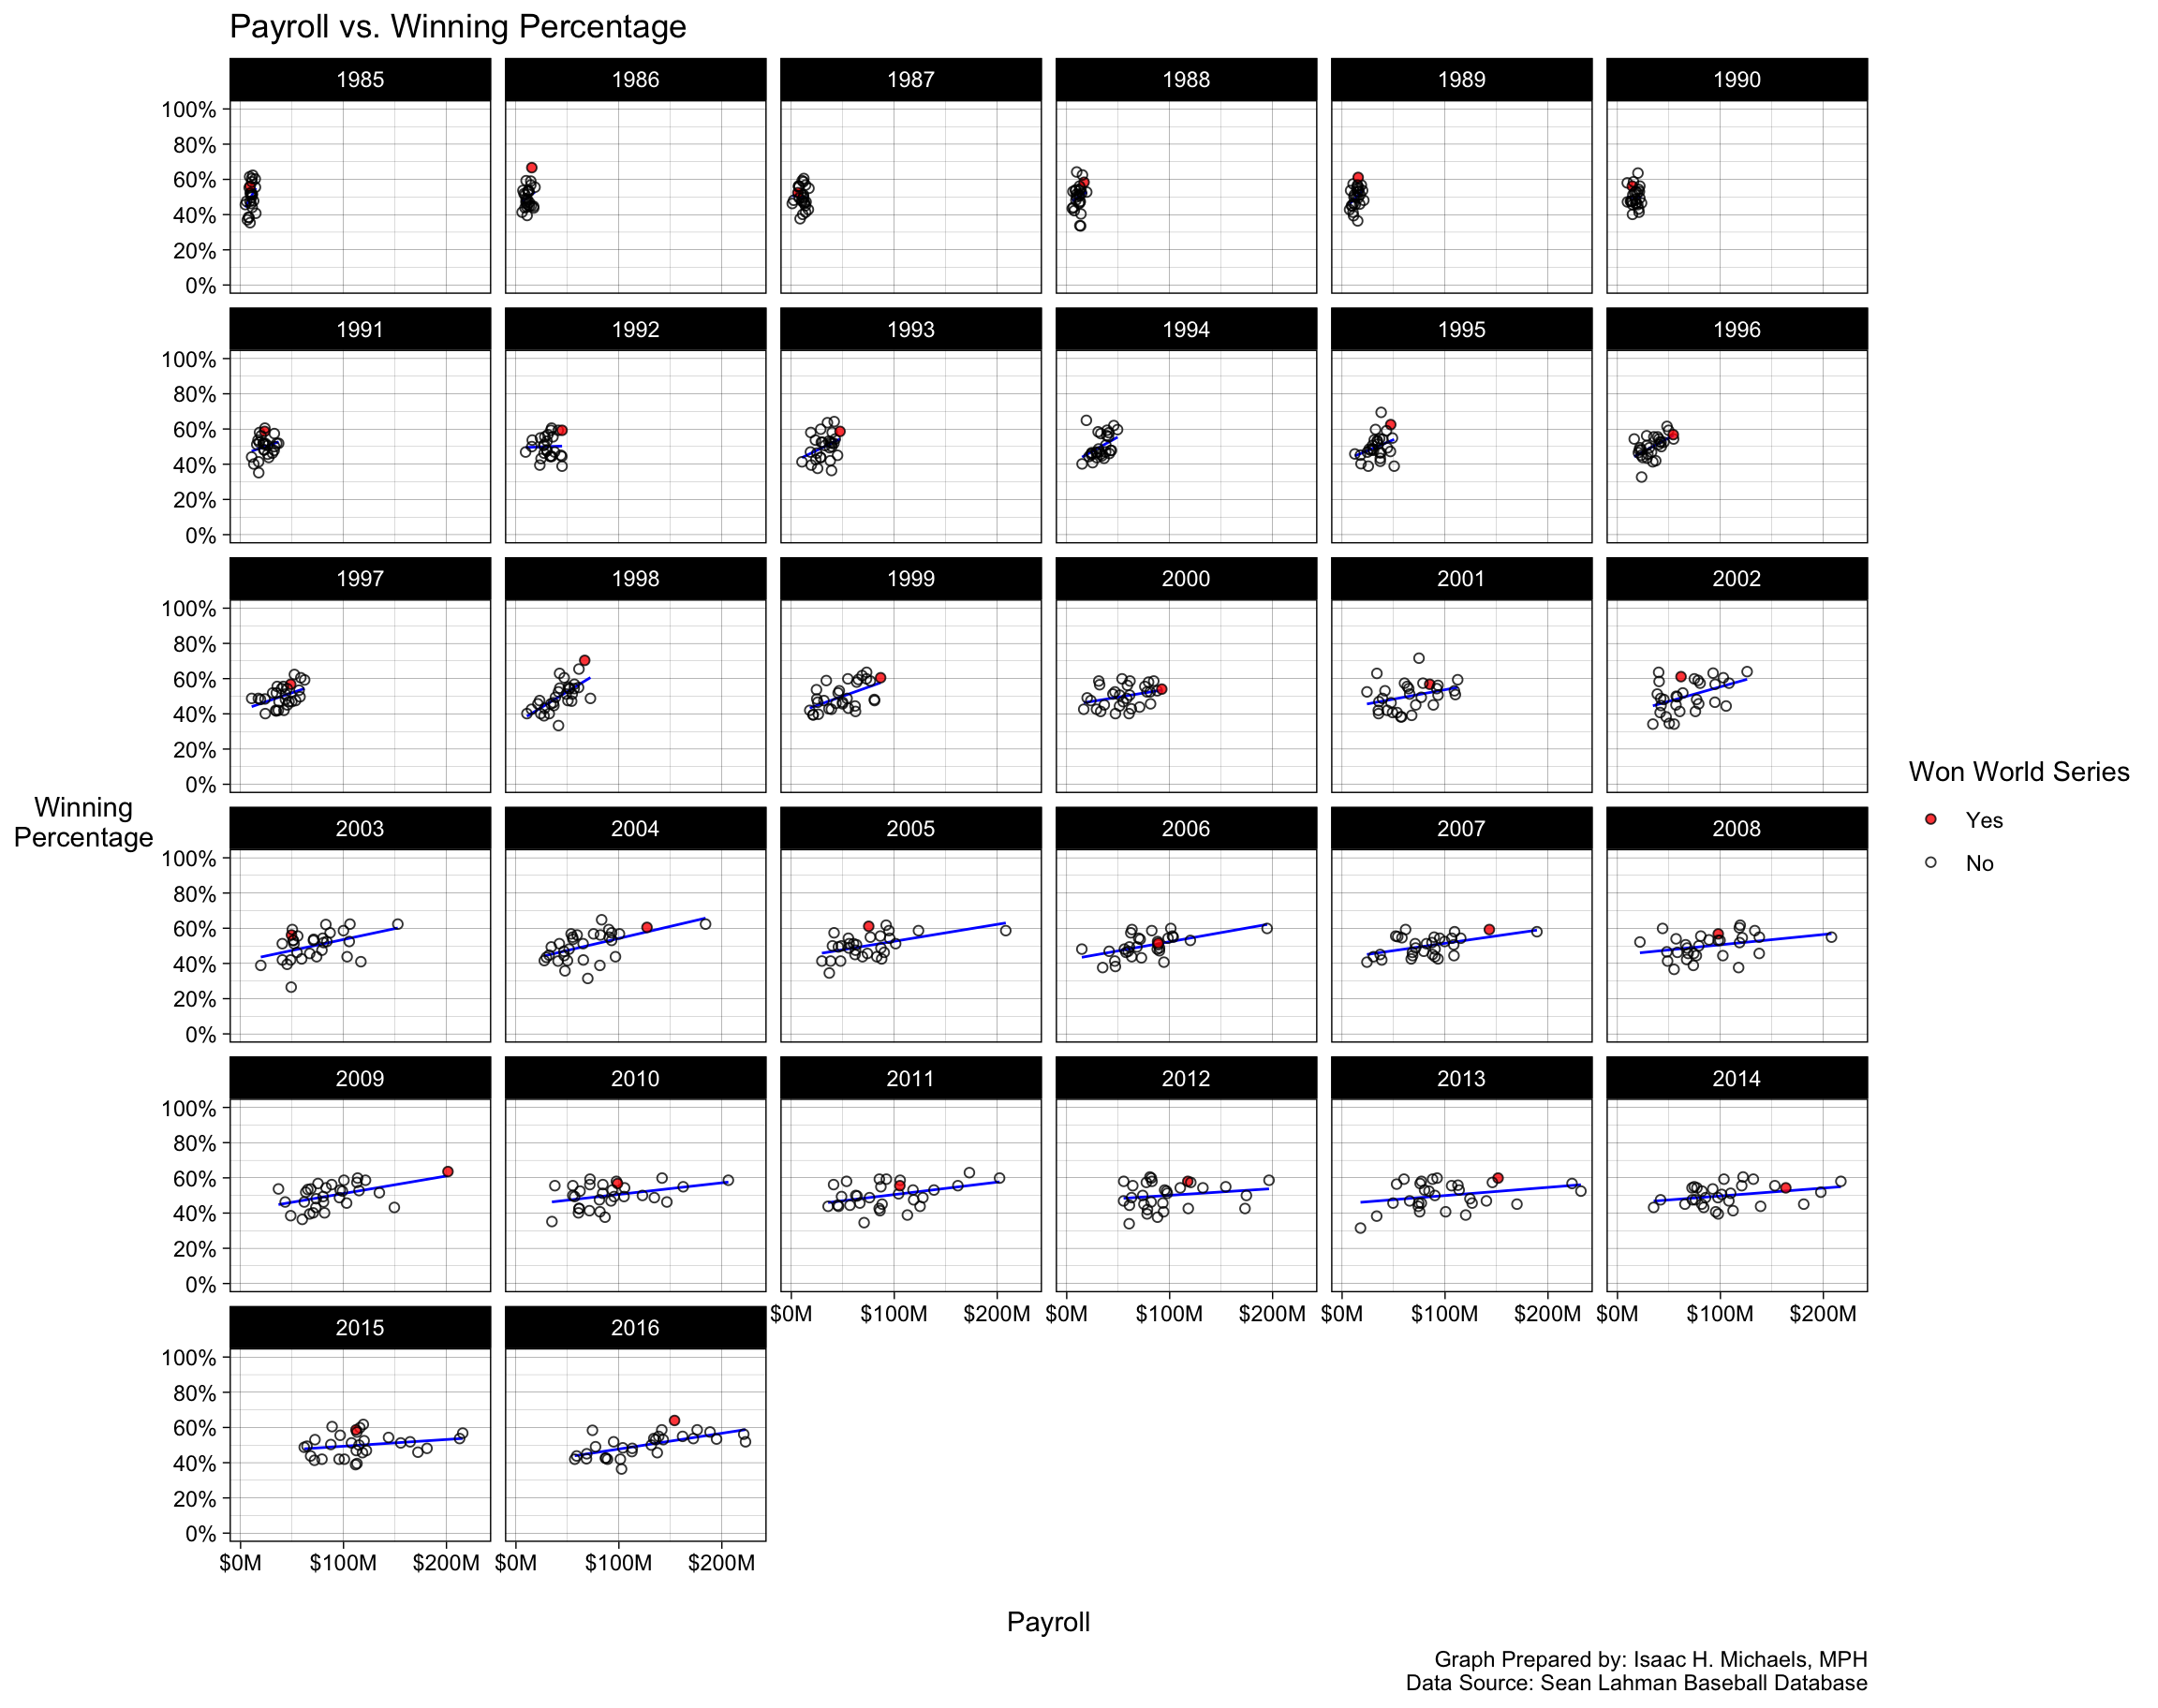

Graph Prepared By: Isaac H. Michaels, MPH
Data Source: Sean Lahman Baseball Database

Back to top


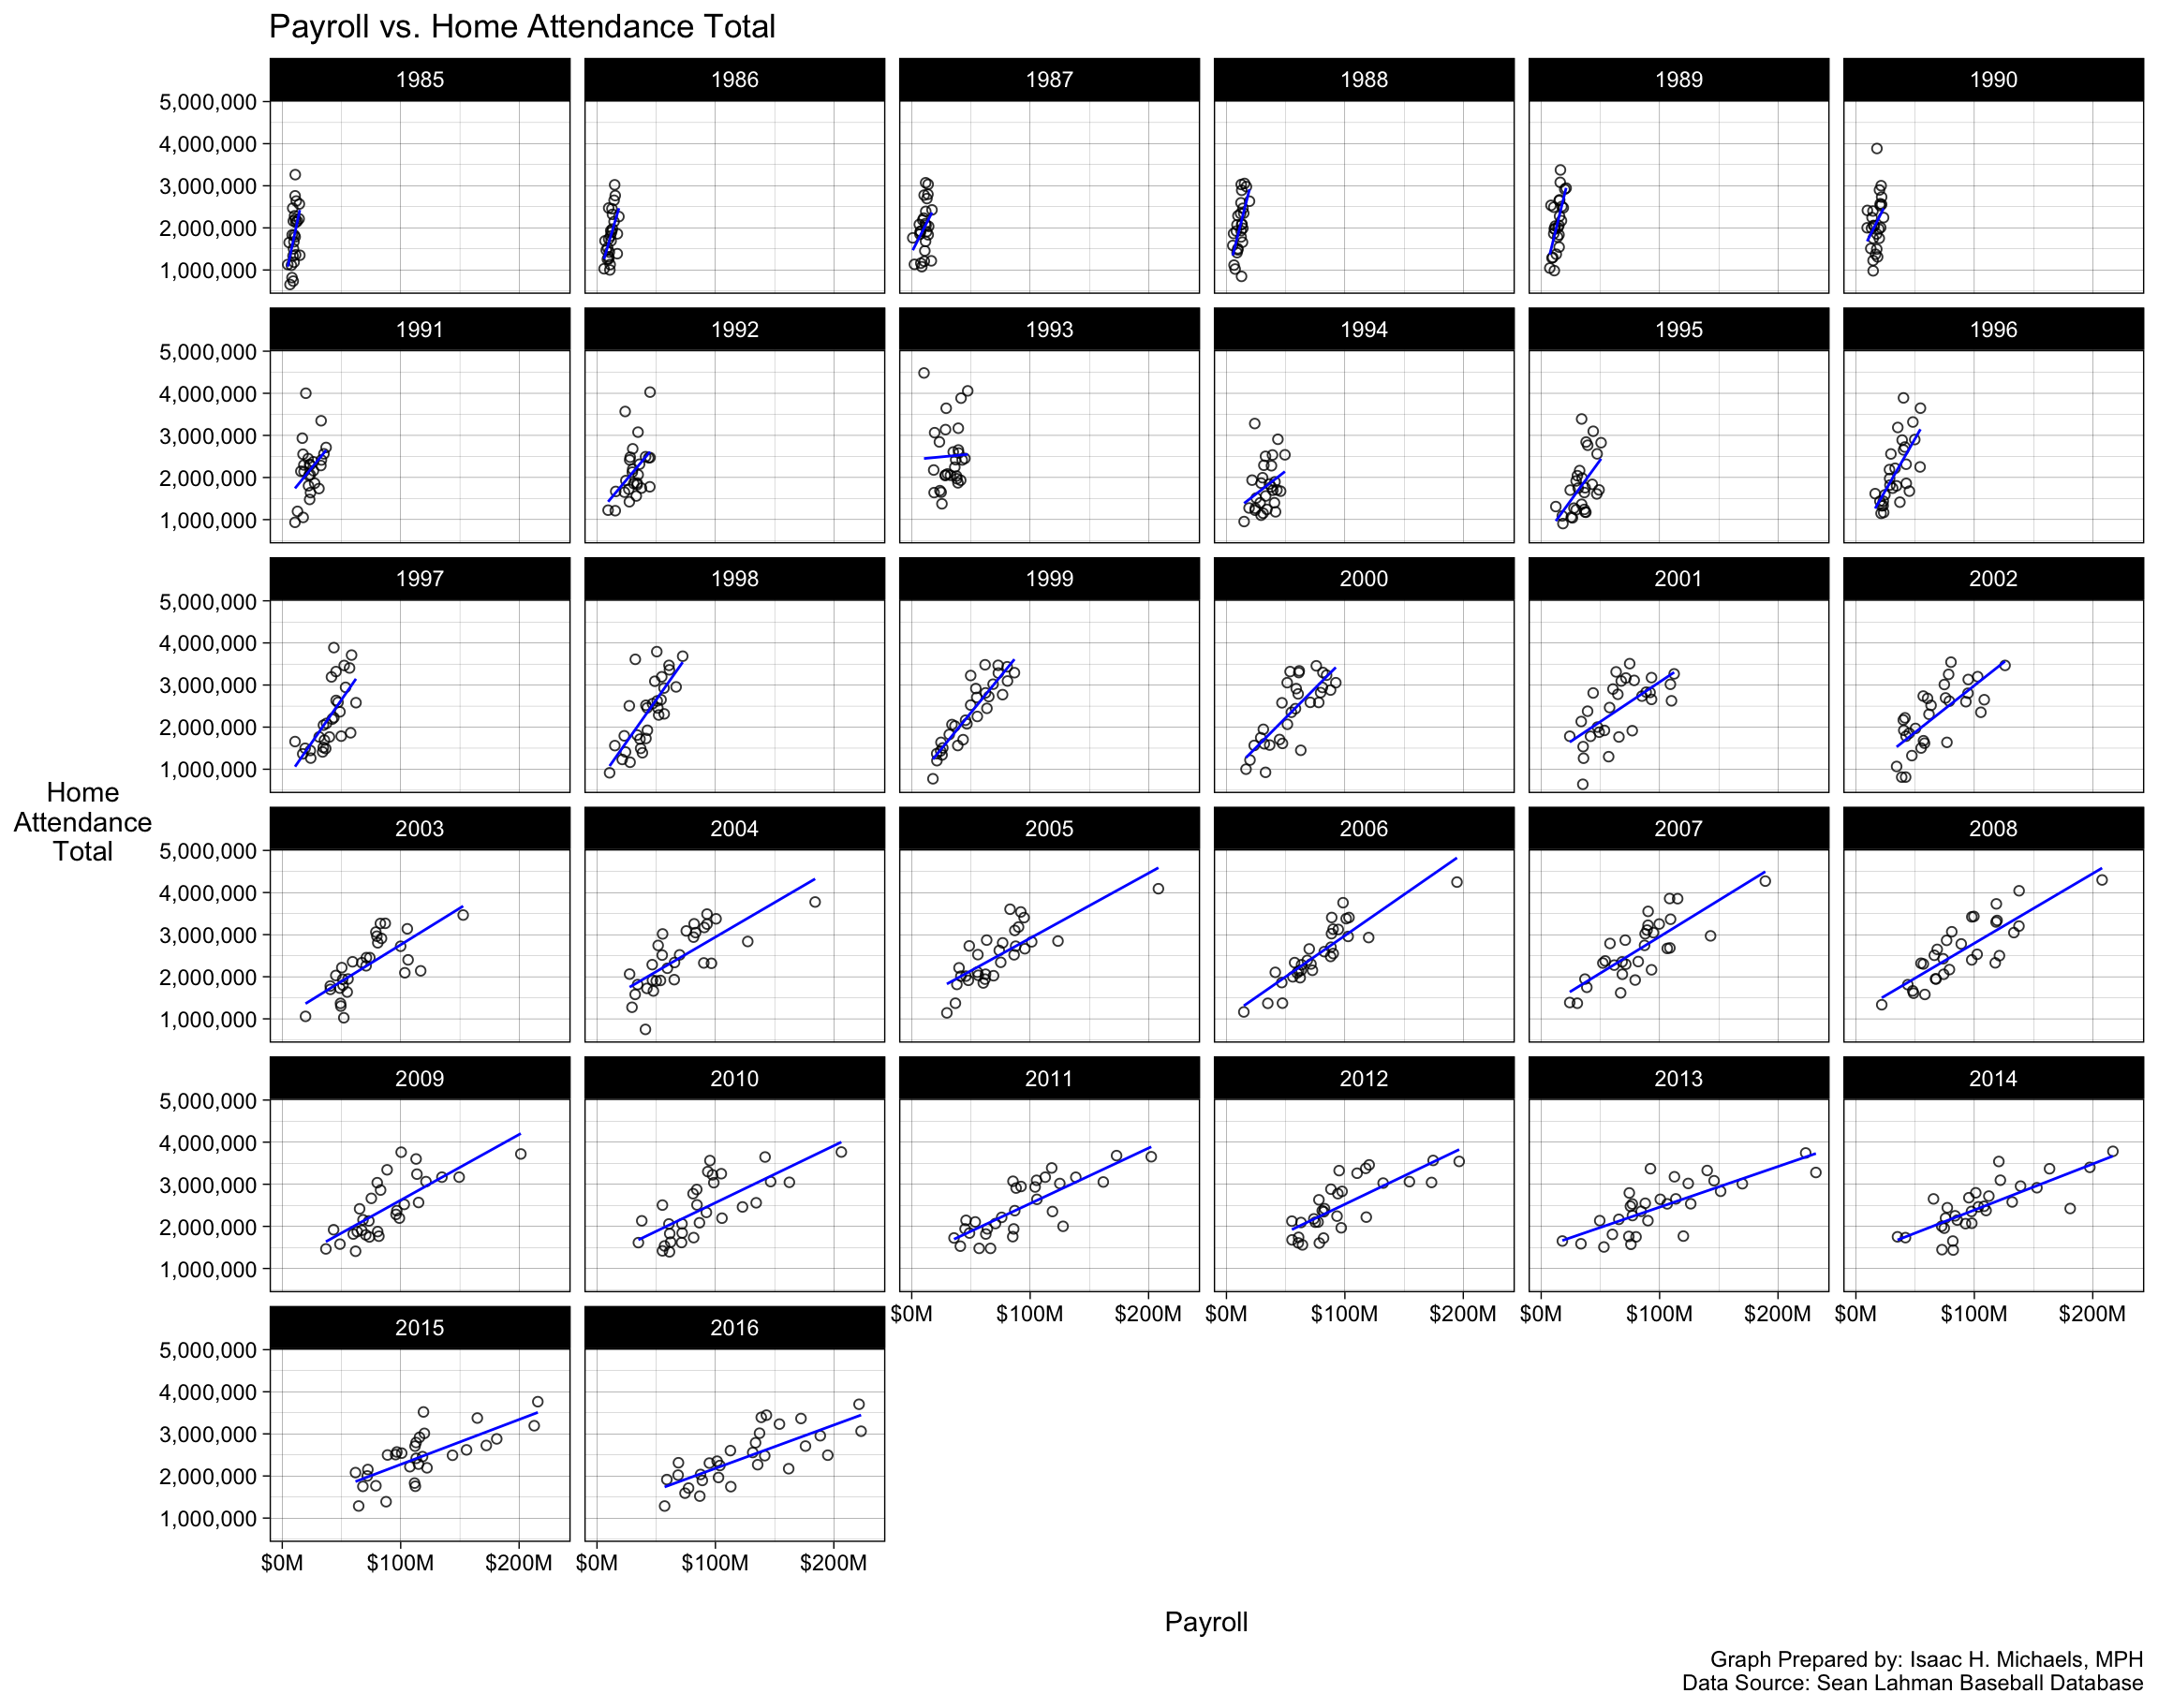
Payroll vs. Attendance


Graph Prepared By: Isaac H. Michaels, MPH
Data Source: Sean Lahman Baseball Database


Back to top


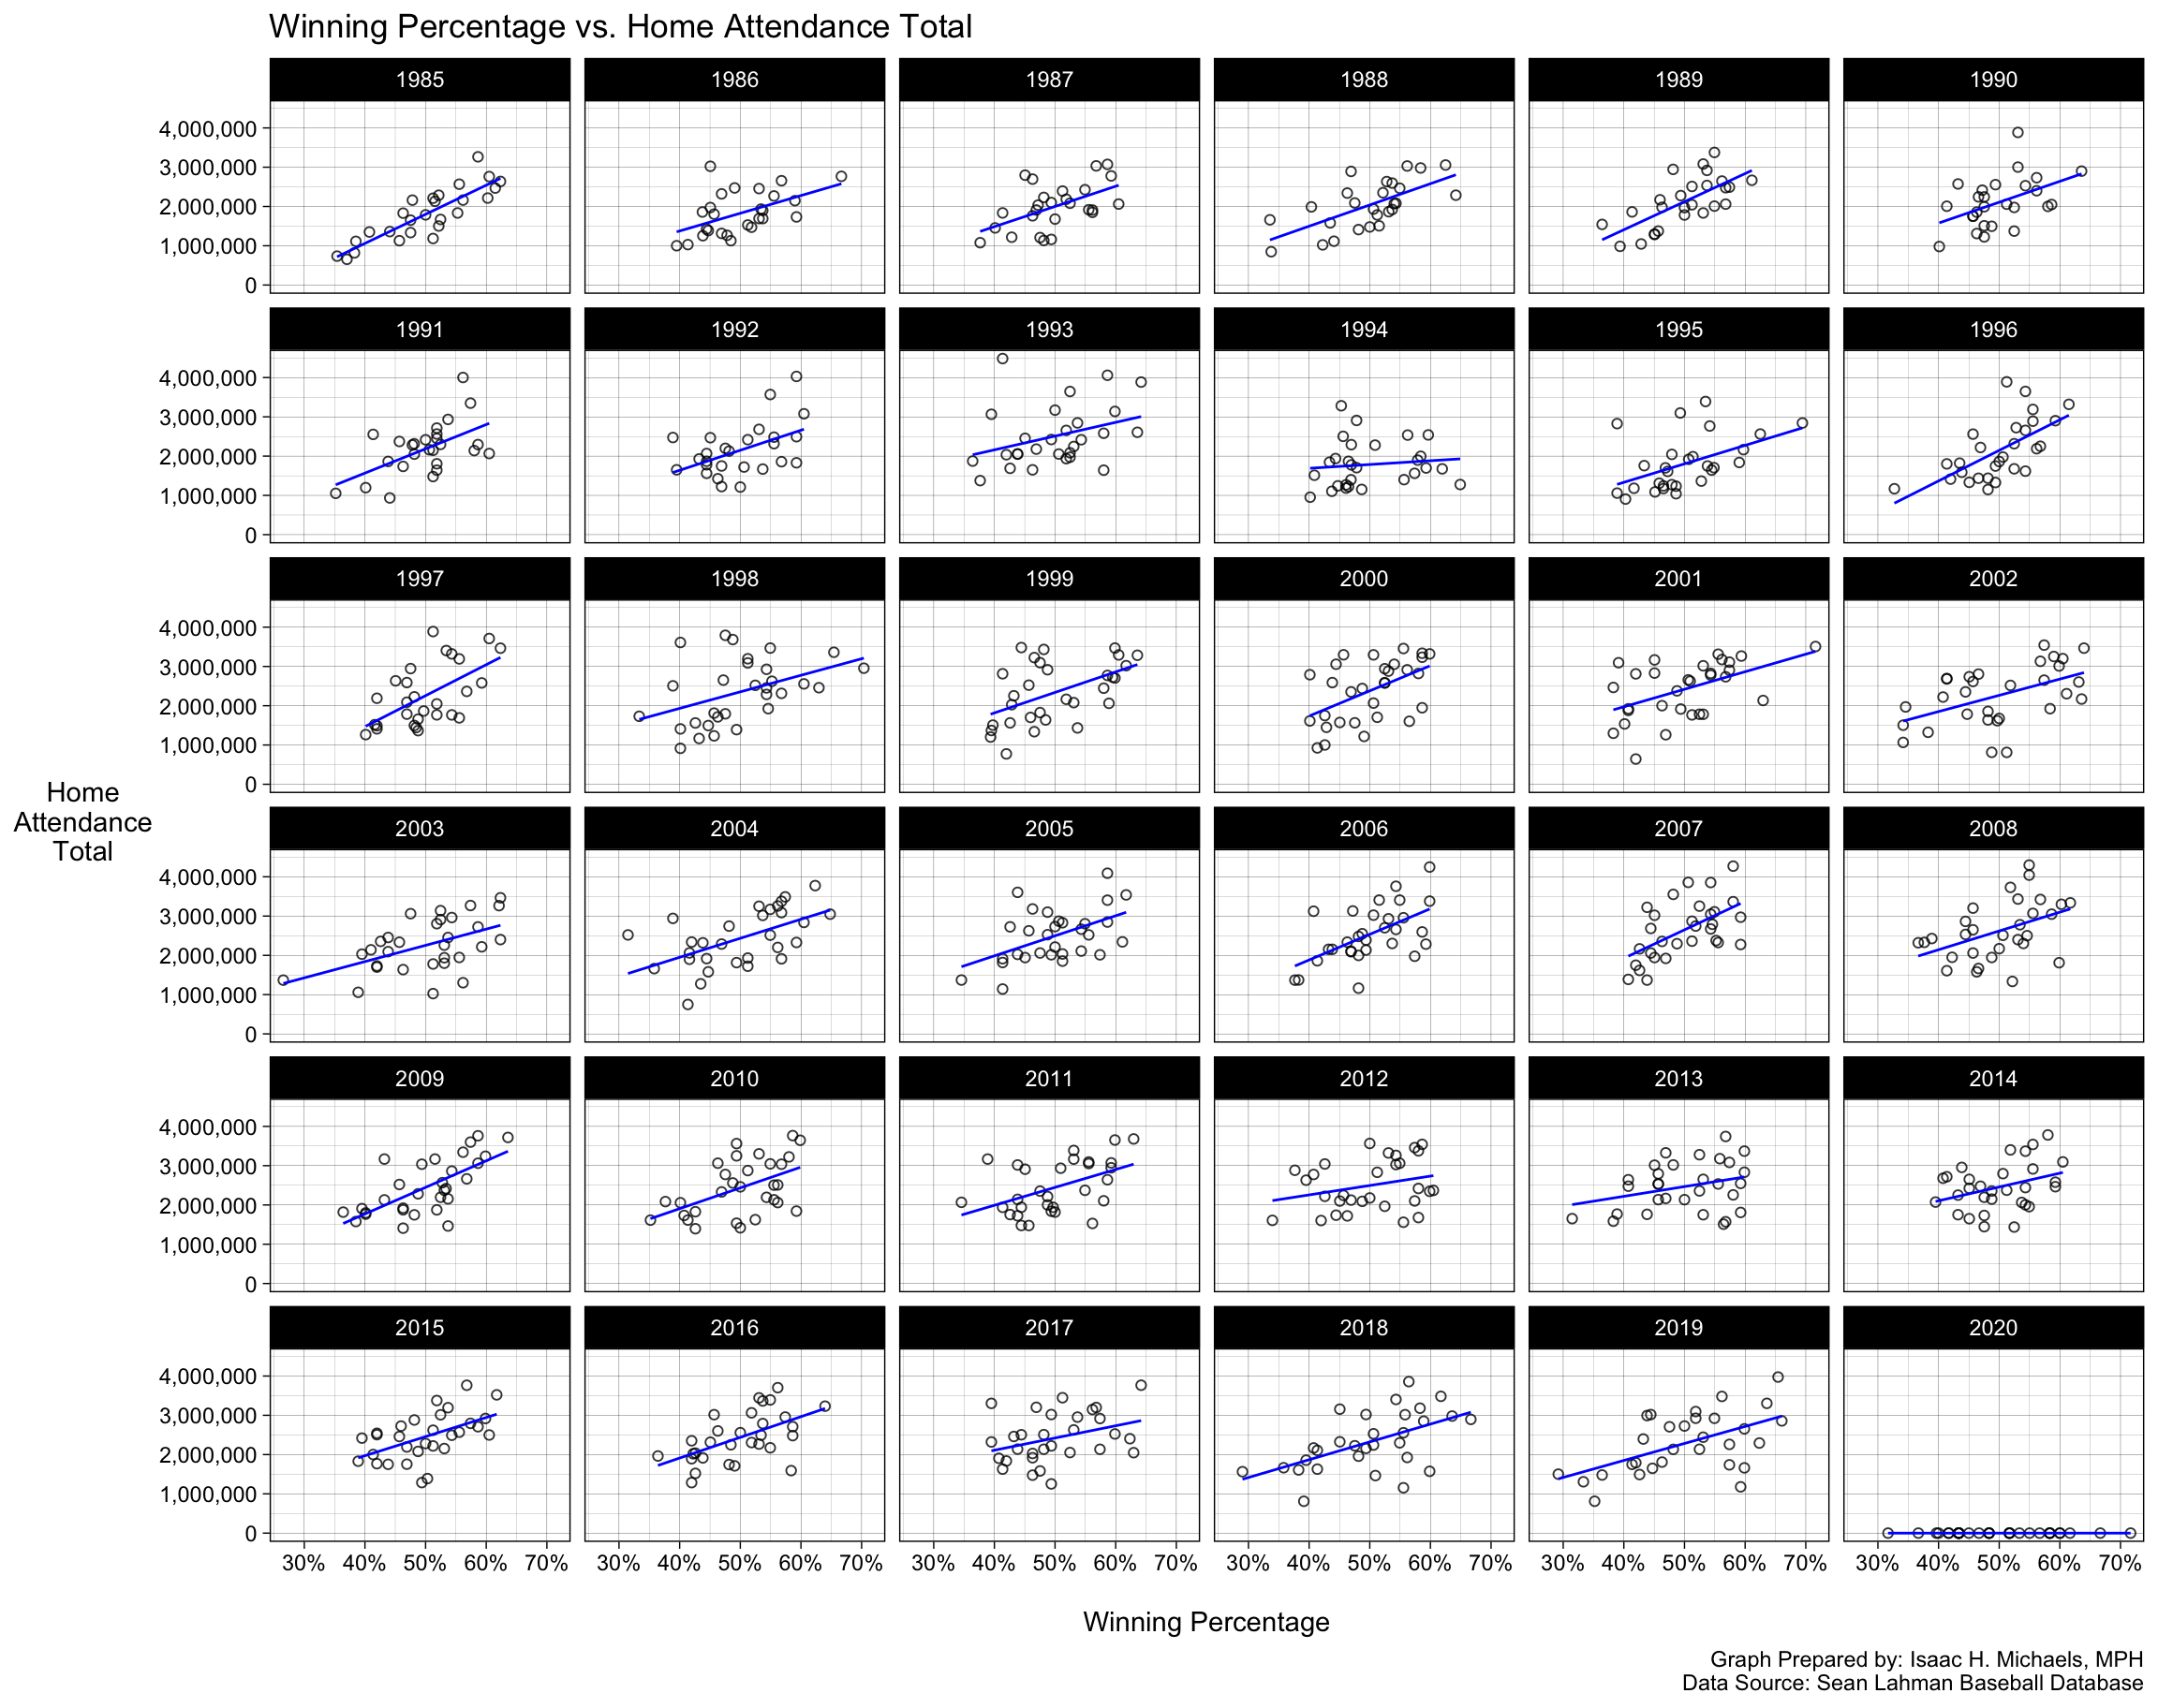
Winning Percentage vs. Attendance


Graph Prepared By: Isaac H. Michaels, MPH
Data Source: Sean Lahman Baseball Database


Back to top


Baseball Season Tracking Analysis

Explore my detailed MLB season insights through interactive visualizations and data tables. I’ve included animations of cumulative wins, trend graphs, scatter plots of runs scored vs. runs allowed, and bar graphs of run differentials. Updated daily during baseball season, this page provides a comprehensive view of team and player statistics, helping you understand performance trends and key metrics throughout the season.
sports baseball data visualization

Basketball Season Tracking Analysis

Discover my in-depth NBA season analysis with dynamic visualizations and data tables. This page features animations of cumulative wins, trend graphs, scatter plots of points scored vs. points allowed, and bar graphs of point differentials. Regularly updated during basketball season, it offers a thorough overview of team performance and individual player statistics, making it an essential resource for tracking the latest trends in the NBA.
sports basketball data visualization